eurasip journal on advances in signal processing clavinet tones for the whole keyboard range, with...
TRANSCRIPT

This Provisional PDF corresponds to the article as it appeared upon acceptance. Fully formattedPDF and full text (HTML) versions will be made available soon.
A digital waveguide-based approach for Clavinet modeling and synthesis
EURASIP Journal on Advances in Signal Processing 2013,2013:103 doi:10.1186/1687-6180-2013-103
Leonardo Gabrielli ([email protected])Vesa Välimäki ([email protected])
Henri Penttinen ([email protected])Stefano Squartini ([email protected])Stefan Bilbao ([email protected])
ISSN 1687-6180
Article type Research
Submission date 15 March 2012
Acceptance date 5 April 2013
Publication date 13 May 2013
Article URL http://asp.eurasipjournals.com/content/2013/1/103
This peer-reviewed article can be downloaded, printed and distributed freely for any purposes (seecopyright notice below).
For information about publishing your research in EURASIP Journal on Advances in SignalProcessing go to
http://asp.eurasipjournals.com/authors/instructions/
For information about other SpringerOpen publications go to
http://www.springeropen.com
EURASIP Journal on Advancesin Signal Processing
© 2013 Gabrielli et al.This is an open access article distributed under the terms of the Creative Commons Attribution License (http://creativecommons.org/licenses/by/2.0),
which permits unrestricted use, distribution, and reproduction in any medium, provided the original work is properly cited.
A digital waveguide-based approach for Clavinetmodeling and synthesis
Leonardo Gabrielli1∗∗Corresponding authorEmail: [email protected]
Vesa Välimäki2
Email: [email protected]
Henri Penttinen2
Email: [email protected]
Stefano Squartini1
Email: [email protected]
Stefan Bilbao3
Email: [email protected]
1Department of Information Engineering, Università Politecnica delle Marche,Via Brecce Bianche 12, Ancona 60131, Italy
2Department of Signal Processing and Acoustics, Aalto University, Otakaari 5,Espoo 02015, Finland3Department of Music, University of Edinburgh, King’s Buildings, Mayfield Rd.,
Edinburgh EH9 3JZ, UK
Abstract
The Clavinet is an electromechanical musical instrument produced in the mid-twentieth cen-tury. As is the case for other vintage instruments, it is subject to aging and requires great effortto be maintained or restored. This paper reports analyses conducted on a Hohner Clavinet D6and proposes a computational model to faithfully reproduce the Clavinet sound in real time,from tone generation to the emulation of the electronic components. The string excitationsignal model is physically inspired and represents a cheap solution in terms of both compu-tational resources and especially memory requirements (compared, e.g., to sample playbacksystems). Pickups and amplifier models have been implemented which enhance the naturalcharacter of the sound with respect to previous work. A model has been implemented on areal-time software platform, Pure Data, capable of a 10-voice polyphony with low latencyon an embedded device. Finally, subjective listening tests conducted using the current modelare compared to previous tests showing slightly improved results.

1 Introduction
In recent years, computational acoustics research has explored the emulation of vintage elec-tronic instruments [1-3], or national folkloric instruments, such as the kantele [4], the guqin [5],or the dan tranh [6]. Vintage electromechanical instruments such as the Clavinet [7] are cur-rently popular and sought-after by musicians. In most cases, however, these instruments are nolonger in production; they age and there is a scarcity of spare parts for replacement or repair.Studying the behavior of the Clavinet from an acoustic perspective enables the use of a physi-cal model [8] for the emulation of its sound, making possible low-cost use for musicians. Thename ‘Clavinet’ refers to a family of instruments produced by Hohner between the 1960s andthe 1980s, among which the most well-known model is the Clavinet D6. The minor differencesbetween this and other models are not addressed here.
Several methods for the emulation of musical instruments are now available [8-11]. Somestrictly adhere to an underlying physical model and require minimal assumptions, such asfinite-difference time-domain methods (FDTD) [10,12]. Modal synthesis techniques, whichenable accurate reproduction of inharmonicity and beating characteristics of each partial, haverecently become popular in the modeling of stringed instruments [11,13-15]. However, thecomputational model proposed in this paper is based on digital waveguide (DWG) techniques,which prove to be computationally more efficient than other methods while adequate for repro-ducing tones of slightly inharmonic stringed instruments [8,16,17] including keyboard instru-ments [18].
Previous works on the Clavinet include a first exploration of the FDTD modeling for theClavinet string in [19] and a first DWG model proposed in [20]. The model discussed herebyis based on the latter, provides more details, and introduces some improvements. The Clavinetpickups have been studied in more detail in [21]. Listening tests have been conducted in [22]based on the previously described model. The sound quality of the current model is comparedto previous listening tests showing a slight improvement, while the computational cost is stillkept low as in the previous work. Other related works include models for the clavichord, anancient stringed instrument which shows similarities to the Clavinet [23,24]. At the moment,there is a commercial software explicitly employing physical models for the Clavinet [25], butno specific information on their algorithms is available.
The paper is organized as follows: Section 2 deals with the analysis of Clavinet tones. Section 3describes a physical model for the reproduction of its sound, while Section 4 discusses the real-time implementation of the model, showing its low computational cost. Section 5 describes theprocedures for subjective listening tests aimed at the evaluation of the model faithfulness, andfinally, Section 6 concludes this paper.
2 The Clavinet and its acoustic characteristics
The Clavinet is an electromechanical instrument with 60 keys and one string per key; there aretwo pickups placed close to one end of the string. The keyboard ranges from F1 to E6, with thefirst 23 strings wound and the remaining ones unwound, so that there is a small discontinuityin timbre. The end of the string which is closest to the keyboard is connected to a tuning pinand is damped by a yarn winding which stops string vibration after key release. The stringtermination on the opposite side is connected to a tailpiece. The excitation mechanism is based

on a class 2 lever (i.e., a lever with the resistance located between the fulcrum and the effort),where the force is applied through a rubber tip, called the tangent. The rubber tip strikes thestring and traps it against a metal stud, or anvil, for the duration of the note, splitting the stringinto speaking and nonspeaking parts, with the motion of the former transduced by the pickups.Figure 1 shows the action mechanism of the Clavinet.
Figure 1 A schematic view of the Clavinet: (a) top and (b) side. Parts: A, tangent; B, string;C, center pickup; D, bridge pickup; E, tailpiece; F, key; G, tuning pin; H, yarn winding; I, mutebar slider and mechanism; and J, anvil.
The Clavinet also includes an amplifier stage, with tone control and pickup switches. The tonecontrol switches act as simple equalization filters. The pickup switches allow the independentselection of pickups or sums of pickup signals in phase or in anti-phase. Figure 2 shows theClavinet model used for analysis and sound recording.
Figure 2 The Hohner Clavinet D6 used in the present investigation. The tone switches andpickup selector switches are located on the panel on the bottom left, which is screwed out ofposition. On the opposite side is the mute bar slider. The tuning pins, one per key, are visible.
2.1 Electronics
The unamplified sound of the Clavinet strings is very feeble as the keybed does not acousticallyamplify the sound; it needs be transduced and amplified electronically for practical use. Thetransducers are magnetic single-coil pickups, coated in epoxy and similar to electric guitarpickups, although instead of having one coil per string, there are 10 metal bar coils intended totransduce six strings each.
The two pickups are electrically identical, but they have different shapes and positions. Thebridge pickup lies above the strings tilted at approximately 30 with respect to normal and isplaced close to the string termination, while the central pickup lies below the strings, closer tothe string center, and orthogonal to them as illustrated in Figure 1a.
The pickups introduce several effects on the resulting sound [26], including linear filtering,nonlinearities [27], and comb filtering [8,28]. Some of these effects have been studied in [21]and will be detailed in Subsection 2.3.5, while details regarding the emulation of these effectsare reported in Section 3.3.
The signal is subsequently fed to the amplifier, which is a two-stage bipolar junction transistoramplifier, with four second-order or first-order cells activated by switches, corresponding tothe four tone switches: soft, medium, treble, and brilliant. In this work, the frequency responseof the amplifier and its tone controls have been evaluated with a circuit simulator. The combi-nation of the unshielded single-coil pickups and the transistor amplifier produces a fair amountof noise, also depending on electromagnetic interference in the surrounding environment.
2.2 Tone recording and analysis
The tone analyses were conducted on a large database of recorded tones sampled from a HohnerD6 Clavinet (Hohner Musikinstrumente GmbH & Co. KG, Trossingen, Germany). Recordings

include Clavinet tones for the whole keyboard range, with different pickup and switch settings.The recording sessions were carried out in a semi-anechoic recording room. The recordingswere done with the Clavinet output and an AKG C-414 B-ULS condenser microphone (AKGAcoustics GmbH, Vienna, Austria) placed close to the strings, and both were connected to theacquisition sound card. The latter recordings were useful only in the analysis of the tail ofthe sound as the mechanical noise generated by the key, its rebound, and the tangent hittingthe anvil masked the striking portion of the tone nearly entirely. This was due to the fact thatthe Clavinet soundboard is not intended as an amplifying device, but rather as a mechanicalsupport to the instrument.
The tones collected from the amplifier output were analyzed, bearing in mind that the stringsound was modified by the pickups and the amplifier.
2.3 Characteristics of recorded tones
Clavinet tones are known for their sharp attacks and release times, which make the instrumentsuitable for rhythmic music genres. This is evident upon examination of the signal in thetime domain. The attack is sharp as in most struck chordophone instruments, and the releasetime, similarly, is short, at least with an instrument in mint condition, with an effective yarndamper. The sustain, on the other hand, is prolonged, at least for low and mid tones, as thereis minimal energy transfer to the rest of the instrument (in comparison with, say, the piano).During sustain, beyond minimal interaction with the magnetic transducer and radiation fromthe string itself, the only transfer of energy occurs at the string ends, which are connected toa metal bar at the far end and the tangent rubber tip at the near end. During sustain, the timerequired for the sound level to decay by 60 dB (T60) can be as long as 20 s or more. Mid to hightones have a shorter sustain as is typical of stringed instruments. Figure 3 illustrates the timeand frequency plot of a A♯2 tone.
Figure 3 Plot of (a) an A♯2 tone (116.5 Hz) and (b) its spectral content up to 8 kHz. Pleasenote that the spectrum in (b) is recorded from a pickup signal, hence exhibits the effects of thepickups (clearly visible as a comb pattern with notches at every 5th partial) and the amplifier.
2.3.1 Attack and release transient
Properties of the time-domain displacement wave and the excitation mechanism will be inferredby assuming the pickups to be time-differentiating devices [27].
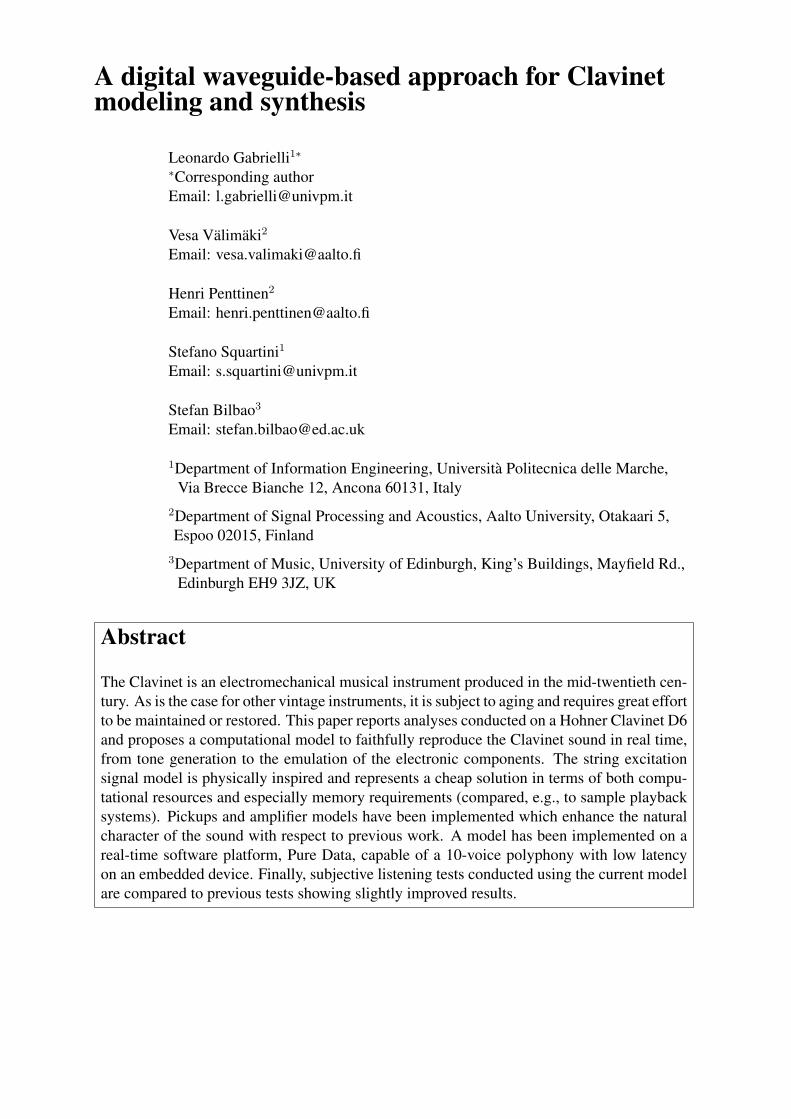
The attack signals show a major difference between low to mid tones and high tones, as shownin Figure 4. Figure 4b shows the first period of a D3 tone, illustrating a clear positive pulse,reflections, and higher frequency oscillations, while in Figure 4a, the first period of an A4 tonehas a clear periodicity and a smooth waveshape.
Figure 4 First period of (a) an A4 (440.0 Hz) tone and (b) a D3 (146.8 Hz) tone, bothsampled at 48 kHz.
When the key is released, the speaking and nonspeaking parts of the string are unified, givingrise to a change in pitch of short duration, caused by the yarn damper. Given the geometry of

the instrument, the pitch decrease after release is three semitones for the whole keyboard. Aspectrogram of the tone before and after release is shown in Figure 5.
Figure 5 Spectrogram of the tone before and after key release. The key release instant islocated at 0.5 s
2.3.2 Inharmonicity of the string
Another perceptually important feature of a string sound is the inharmonicity [29], due to thelightly dispersive character of wave propagation in strings. Several methods exist for inhar-monicity estimation [30]. In order to quantify the effect of string dispersion, the inharmonicitycoefficient B must be estimated for the whole instrument range. Although theoretically theexact pitch of the partials should be related only to the fundamental frequency and the B coef-ficient [31] by the following equation:
fn = nf0√(1 +Bn2), (1)
where fn is the frequency of the nth partial and f0 is the fundamental frequency, empiricalanalysis of real tones shows a slight deviation between the measured partial frequency and thetheoretical fn, and thus, a deviation value Bn can be calculated for each partial related to thefundamental frequency by the following:
Bn =f2n − n2f2
0
n4f 20
, (2)
obtained by reworking Equation 1 and replacing the overall B with a separate Bn for every nthpartial. For practical use, a number of Bn values measured from the same tone are combinedto obtain an estimate of the overall inharmonicity. A way to obtain this estimate is to use acriterion based on the loudness of the first N partials (excluding the fundamental frequency),as described below.
The partial frequencies are evaluated by the use of a high-resolution fast Fourier transform(FFT) on a small segment of the recorded tone. The FFT coefficients are interpolated to obtain amore precise location of partial peaks at low frequencies. The peaks are automatically retrievedby a maximum finding algorithm at the neighborhood of the expected partial locations for thefirst N partials and their magnitudes (in dB) are also measured. The fundamental frequencyand its magnitude are estimated as well. The Bn coefficients are estimated for each of the Npartials using the measured value for f0 to take a possible slight detuning into account. Fora perceptually motivated B estimate, the Bn estimated values are averaged with a weightingaccording to their relative amplitude.
The B coefficient has been estimated for eight Clavinet tones spanning the whole key rangeby evaluating the Bn coefficients for N = 6, i.e., using all the partials from the second tothe seventh. Linear interpolation has been used for the remaining keys. The estimate of theB coefficient for the whole keyboard is shown in Figure 6 and plotted against inharmonicityaudibility thresholds as reported in [29]. From this comparison, it is clear that inharmonicityin the low keyboard range exceeds the audibility threshold and its confidence curve, meaningthat its effect should be clearly audible by any average listener. For high notes, the inharmonic-

ity crosses this threshold, making it unnoticeable to the average listener, and hence may beexcluded from the computational model.
Figure 6 Estimated B coefficient for the whole keyboard. Estimated inharmonicity co-efficients (bold solid line with dots) for the whole Clavinet keyboard range against audibilitythresholds (solid line) and confidence bounds (dashed lines) evaluated in [29]. The discontinu-ity between the 23rd and 24th keys is noticeable at approximately 150 Hz.
2.3.3 Fundamental frequency
The fundamental frequency is very stable over time. A method based on windowed autocor-relation analysis [32] was used in order to obtain a good estimate of f0 histories for the attackand sustain phase of the tone. The analysis shows a slight change in time of the pitch, which,however, is perceptually insignificant, with a variation of at most 1 to 2 cents, while audibilitythresholds are usually much higher [33].
2.3.4 Higher partials
The spectrum in Figure 3b shows the first harmonics up to 8 kHz for an A♯2 tone and is quiterepresentative of the spectral profile for many of the Clavinet tones. The second partial al-ways has a magnitude more than 3 dB higher than the first, and often (as in the figure) thethird is higher than the second. The spectral envelope of Clavinet tones shows several peaksand notches due to the superposition of several effects including partial beating (which gen-erates time-varying peaks and notches), the pickup position (which applies a comb pattern,later discussed in Section 2.3.5), and amplifier and filter frequency responses (discussed inSection 2.3.6). Figure 3b reveals a comb-like pattern given by the pickup position at approxi-mately 544 Hz and multiple frequencies.
The temporal evolution of partials has been studied. The partials’ decay is usually linear on thedecibel scale but sometimes shows an oscillating behavior, i.e., a beating, as seen at the bottomof Figure 7.
Figure 7 Harmonic decay for two different recordings of an A2 Clavinet tone: (a) pianoand (b) mezzoforte.
The connection between the pitch or key velocity and this phenomenon is still not understood.Data show that the phenomenon stops occurring with keys higher than E4, while the magnitudeof the oscillations can be as high as 15 dB peak-to-peak, at frequencies between 0.5 and 2 Hz.The phenomenon does not always noticeably occur, and its amplitude and frequency changefrom time to time. There is a slight correlation with the key velocity, suggesting that thephenomenon may be correlated to acoustical nonlinearities (e.g., string termination yielding),similar to those appearing in other instruments such as the kantele [4]. Generally, when thebeating occurs, it is shown in both microphone and pickup recordings. In principle, however,electrical nonlinearities may as well imply some beating between the slightly inharmonic tonepartials and harmonics generated by the nonlinearity.
Besides occasional beating, most partials exhibit a monotone decay. For those tones that donot show partials beating, T60 have been measured separately for each partial. The lowest two

to four partials usually show remarkably longer T60 than the higher ones. T60 decreases withincreasing partial number. However, for most tones, the envelope for partials T60 is not regularbut shows an oscillating or ripply behavior, i.e., a fluctuation of the T60 with an approximateperiodicity between two and three times the fundamental frequency. Figure 8 shows partialsT60 extracted from an E4 tone (vertical lines), compared to the ones from the synthesis modellater described in Section 3.
Figure 8 Partials T60 extracted from an E4 tone compared to the ones from the synthesismodel. Partials T60 for a measured Clavinet E4 tone (vertical lines) plotted against the partialsT60 of an E4 tone synthesized by the computational model (the dotted line represents the lossfilter only, and the dashed line represents the loss filter together with the ripple filter). The T60
values for the first two partials have been matched with the ripple filter.
2.3.5 The pickups
Coil pickups, such as those used in guitars, have been studied thoroughly in [26]. The effect oftheir position is that of linear filtering. Comb-like patterns can be observed in guitar tones andin Clavinet tones due to the reflection of the signal at the string termination. Pickups also havetheir own frequency response given by their electric impedance and the input impedance theyare connected to [34]. Finally, the relation between the string displacement and the voltagegenerated by the pickup induction mechanism is nonlinear due to factors such as the nonlineardecay law of the magnetic dipole field. The frequency response of the displacement to volt-age ratio is that of a perfect derivative. All the effects listed hereby have been analyzed andmodeled.
Details on the comb parameter extraction will be given in Section 3.3 relative to its implemen-tation. The electrical impedance Z(ω) of a Clavinet pickup has been measured as describedin [34] and is shown in Figure 9. The frequency response of the pickup (proportional to the in-verse of Z(ω)) is almost flat, with differences between maximum and minimum values smallerthan 1 dB. The impedance can be, in general, greatly modified by the parasitic capacitancepresent in the connection to the amplifier (e.g., in guitar cables [34]). This parameter has notbeen evaluated and is considered hereby negligible as the Clavinet has a short connection to theamplifier made partly of shielded cables and partly of copper paths on a printed circuit board.
Figure 9 Impedance magnitude of the Clavinet pickup versus frequency.
Nonlinearities in the displacement to voltage ratio have been evaluated by means of a softwaresimulation in Vizimag, a commercial electromagnetic simulator. Simulations have been carriedout for different string gauges, string to pickup distance, and horizontal position of the stringwith respect to the pickup. The vibration in the horizontal and vertical polarizations has beenmeasured separately, resulting in a negligible voltage generated by the horizontal displacement(25 dB lower than the vertical displacement). The string oscillation was 1 mm peak-to-peakwide, which is the maximum measured oscillation amplitude. The simulations are detailedin [21].
Simulations show that the magnetic flux variation in response to vertical displacement has anegative exponential shape (Figure 10), in accord to previous works [26,27,35].

Figure 10 Simulation of the magnetic flux against vertical displacement. Magnetic fluxvariation against vertical displacement for a string passing over the pickup center (dashed line)and vertical displacement for a string passing over the edge of the pickup (solid line).
2.3.6 Amplifier and tone controls
Pickup signals are fed to the amplifier section, which also includes tone controls and a volumepotentiometer. The amplifier schematic is publicly available [36], and it has been used to gathera basic understanding of its functioning. Some of the components, such as the tone controlsand the transistors, have been isolated to conduct simulations and obtain an estimate of thefrequency response by means of an electric circuit simulator.
Figure 11 shows simulations for the magnitude frequency response of the tone switches, withall the tone switches active (open switches) and with one switch active at a time. Further circuitsimulations with the tone stack removed show the amplifier frequency response to be close toflat, with a mild low-shelf (−3 dB at 130 Hz) and high-shelf (+3 dB at 4,000 Hz) characteristic.The tone controls, consisting of first- or second-order discrete filters, have been emulated bydigital filters with the transfer function derived from the respective impedance in the analogdomain, as detailed in Section 3.4.
Figure 11 SPICE simulation of the tone switches. All switches active (solid line), soft-onlyactive (dotted line), medium-only active (dashed line), treble-only active (dash-dotted line),brilliant-only active (dash-dot-dot line).
3 Computational model
The basic Clavinet string model was presented first in [37] and described in [20]. It consists ofa digital waveguide loop structure [38] in which a fractional delay filter [39], a loss filter [40],a ripple filter [41], and a dispersion filter [42] are cascaded. This structure is fed by an attackexcitation signal, generated on-line by a signal model dependent on an estimate of the virtualtangent velocity. Furthermore, the note decay is modeled by increasing the length of the delayline and increasing losses, i.e., decreasing loop gain. The string model is completed by severalbeating equalizers [43] modulating the gain of the first partials.
More details of this model will now be described.
3.1 String model
The Clavinet pitch is very stable during the sustain phase of the tone, and thus, there is noneed for change in the overall DWG delay during sustain. Partial decay time analysis fromClavinet tones reveals ripply T60 also shown by microphone-recorded tones. This can be easilyreproduced by the use of a so-called ripple filter, which has been used for the emulation ofother instruments as well, such as the harpsichord [41] and the piano [44].
The ripple filter adds a feedforward path with unity gain (which can be incorporated into thedelay line) and adds a small amount of the direct signal to it with gain r. The analytic expression

is the following:y[n] = rx[n] + x[n−R], (3)
where r is a small coefficient and R is the length of the delayed path length introduced by thisfilter. The effect of the ripple filter is shown in Figure 8 compared to the T60 of a real tone. Thegain at different partials or, conversely, the T60 values are different from one another, enablingthe emulation of the real tone behavior seen in Figure 8. Although from a visual inspectionof the figures the fit between real and synthesized data may not seem close, from a perceptualstandpoint, it must be noted that differences of several seconds in the T60 times, i.e., of severaldecibels in the magnitude response for a given partial, do not result in a perceivable change, asthey fall beneath audibility thresholds, as shown in [45] for the magnitude response of a lossfilter in a DWG model.
By increasing or decreasing the r coefficient, the ripple effect is increased or decreased; bychanging R, the width of the ripples is changed. R is in turn calculated from the parameterRrate from the following:
R = round(RrateLS), (4)
and thus, the total delay line LS is now split into two sections of length R and L′ = LS − R.To maintain closed loop stability, the overall gain must be kept below unity, i.e., g + |r| < 1,with g being the loss filter gain.
The ripple filter coefficients can be adjusted in order to match those observed in recorded tones.The ripple parameters in Figure 8, for instance, are Rrate = 1/2 and r = −0.006. In the model,Rrate and r are randomly chosen at each keystroke respectively in the range between 1/2 to 1/3and −0.006 to −0.001, according to observations.
The design of the dispersion filter follows the algorithm described in [46]a. The algorithmachieves the desired B coefficient in a frequency band specified by the user. The authors sug-gest that this be at least 10 times the fundamental frequency. The B coefficients, the bandwidth(BW), and the β parameters used for every key are linearly interpolated from the values inTable 1.
Table 1 B coefficients used for the design of the dispersion filterKey F1 A♯1 D3 D♯3 F♯5 E6B 5E−4 2E−4 9E−5 1E−4 9E−5 8E−5BW (Hz) 436.5 582.7 1,468.3 1,555.6 7,399.9 13,185.1β 0.85 0.85 0.85 0.85 0.85 0.85
The Clavinet tones may contain beating partials as shown in Figure 7. An efficient and easilytunable method to emulate this is to cascade a so-called beating equalizer, proposed in [43]with the DWG loop.
The beating equalizer is based on the Regalia-Mitra tunable filters [47] but adds a modulatinggain at the output stage K[n], where n is the time index.
In brief, such a device is a band-pass filter with varying gain at the resonating frequency. Thegain can vary according to an arbitrary function of time, but for the emulation of Clavinet tones,it has been decided to use a | cos(2πfn)| law, which well approximates the behavior seen in

Figure 7 in Section 2.3.4. The modulated gain is the following:
K[n] = 10| cos(2πfn)|
20 . (5)
In order to modulate M partials, M beating equalizers are needed. It was shown, however,by informal listening tests that it is difficult to perceive the effect of more than three beatingequalizers working at the same time.
The computational cost of this device is low, consisting of a biquad filter plus the overhead offive operations per sample (three additions and two multiplications, as can be seen in [43] andFigure 2).
3.2 Excitation model
The string model described so far can be fed at attack time with an excitation signal of somekind. In the proposed model, the excitation signal consists of a smooth pulse similar to thoseseen in low- to mid-range tones. The pulse is made by joining an attack ramp with its re-verse. The ramp is obtained by fitting the following polynomial to some pulses extracted fromrecorded tones:
f(x) = aPxP + aP−1x
P−1 + ...+ a1x+ a0. (6)
The polynomial coefficients were calculated from several least square error fits to some portionsof signals extracted from the recordings. These signals have a smooth triangular shape andrepresent the pickup output from the tangent hitting the string. A polynomial has been obtainedwith order P = 6 and coefficients in descending order: −2.69E−8, 2.53E−6, −9.54E−5,1.74E−3, −1.44E−2, 4.50E−2, −3.50E−2. This signal is scaled by a gain and stretched byinterpolation according to the player dynamic, making it shorter or longer. To calculate thepulse length in samples N , the average key velocity v and the initial distance d between thetangent and stud are required; thus,
N =fs d
v, (7)
where fs is the sampling frequency. The average key velocity normally varies linearly in therange 1 to 4 m/s and is mapped to integers from 1 to 127, as per the Musical Instrument DigitalInterface (MIDI) standard. Figure 12 shows piano and forte excitation signals calculated withour method.
Figure 12 Excitation pulse signals for piano and forte tones.
The pulse signals seen in Clavinet tones have a smooth triangular shape and represent thepickup output from the tangent hitting the string. Most of the recorded tones exhibit a similarpulse at the beginning of the tone, hence making this a good approximation for the string ex-citation produced by the tangent in most cases. Because the signal extracted from the pickupsis the time derivative of the string displacement at the pickup position, when using its approxi-mation as an excitation, it must be ensured that the wave variables in the digital waveguide arealso time-differentiated approximations of the displacement of the Clavinet string. This allowsdifferentiation to be avoided when emulating the effect of pickups if these are linear devices.With nonlinear pickups (as it is the case), integration must be performed before the nonlinearstage.

3.3 Model for pickups
The proposed pickup model includes a comb effect dependent on the pickup position, the mag-netic field distance nonlinearity, and the emulation of the pickup selector switches. The trav-eling waves reflected at the string termination are transduced by the pickups, thus creating acomb characteristic in frequency. This effect can be emulated by a comb filter with negativegain (ideally −1 for a stiff string) and a delay equal to the time needed for the wave to propagatefrom the pickup position to the string termination and back [26]. As discussed in Section 2.3.5,string dispersion also affects the position of the comb notches. In [48], the amount of disper-sion is shown to be equal to the string inharmonicity itself. A duplicate of the dispersion filterused in the string model could be added to the comb feedforward path to obtain this secondaryeffect. However, to achieve a trade-off between computational efficiency and sound quality, theduplicate filter has not been implemented as it would increase the computational cost by 25%.
The comb filter needs two parameters to be calculated: the delay in samples and the gain.The latter has been set to −1 for both the pickups as the string termination is assumed to onlyinvert the incoming wave. The former can be calculated with a simple proportion after a directmeasure of the pickup’s distance from the string termination: the physical string length topickup distance ratio can be multiplied to the total delay line length Ltarg.
The overall frequency response has not been modeled being perceptually flat (as discussed inSection 2.3.5).
The pickup nonlinearity reported in Section 2.3.5 can be implemented as an exponential oran N th-order polynomial. The latter has a lower computational cost, and it can be computedon modern DSP architectures with N − 1 consecutive multiply-accumulate operations and Nproducts following Horner’s method [49]. The polynomial coefficients used are reported inTable 2.
Table 2 Pickup polynomial coefficientsCoefficient Valuep0 0.7951p1 −1.544p2 1.818× 10²
p3 −9.508× 10³
p4 1.817× 10⁵
Figure 13 compares the exponential fit to the simulated data and the polynomial fit. The expo-nential fit has a slightly lower root mean square error value, proving a better approximation tothe pickup nonlinearity. The polynomial fit, however, scales better to embedded devices for itslower computational cost and higher precision.
Figure 13 Comparison of the exponential fit to the simulated data and the polynomialfit. Magnetic flux variation against vertical string displacement for a string passing over thecenter of the pickup (marker), an exponential fit (dashed line), and a fourth-degree polynomialapproximation (solid line).

Since the excitation is a velocity wave and the nonlinearity applies to a displacement wave, thesignal must be integrated before the nonlinearity. For real-time scenarios, a leaky integratorcan be used as the one proposed in [50]. Afterwards the nonlinear block differentiation mustbe applied to emulate that performed by pickups [27]. A simple first-order digital differentiatoras in [51] is sufficient and suited for real-time operation.
3.4 Model for the amplifier
Analyses from Section 2.3.6 suggested that the amplifier and the tone switch frequency re-sponse can be modeled in the digital domain with simple infinite impulse response (IIR) digitalfilters, keeping the computational cost low. The tone stack consists of four first- or second-orderfilters which can be bypassed by a switch. Details about the filters are provided in Table 3. Foremulation in the digital domain, the impedance Zi(s) is calculated for each filter in the Laplacedomain and then transformed by bilinear transform in a digital transfer function Hi(z). Theparallel Zi(s) in the analog domain can hence be emulated by cascading the Hi(z) filters in thedigital domain.
Table 3 Filter transfer functionsFilter Components Zi(s) Hi(z)
SoftR = 30 kΩ R
1+sRC
R1+2RCfs
1+z−1
1+ 1−2RCfs1+2RCfs
z−1C = 0.1µF
MediumR = 10 kΩ R
1+sRC
R1+2RCfs
1+z−1
1+ 1−2RCfs1+2RCfs
z−1C = 15 nF
TrebleL = 2H sL
1+s2CL
2fsL1+a
1−z−2
1+2 1−k1+k
z−1+z−2C = 4.7 nF
where a = 4CLf 2s
BrilliantL = 0.6H
sL 2fsL1−z−1
1+0.99z−1
As an example, Figure 14 compares one of the tone switch combinations and its digital filterimplementation.
Figure 14 Comparison of one of the tone switch combinations and its digital filter imple-mentation. The frequency response obtained by circuit simulation of one of the tone switchcombinations (the parallel of medium, treble, and brilliant; dashed line) and the cascade oftheir IIR digital filter counterparts matching the simulation (solid line). The order of the digitalfilters matches that of the analog filter.
Finally, the frequency response of the amplifier excluding the tone stack is emulated with dig-ital shelf filters corresponding to the data provided in Section 2.3.6. A reliable estimate ofthe nonlinearity introduced by the transistors was not possible as a faithful transistor modelwas not available for the specific transistor models in the computer software used during toneswitch simulations. The transistor nonlinearities [52] have been measured on a real Clavinetby the use of a tone generator and a signal analyzer. The input signal was a sine wave at1 kHz of amplitude equal to the maximum one generated by pickups with normal polyphonicplaying (400 mV) showing a total harmonic distortion (THD) of 1% with normal polyphonicplaying, rising to 3.6% for the highest peaks during fortissimo chord playing, which, however,

is obtained only very rarely. Considering the 1% THD data as the upper bound for normal play-ing, the nonlinear character of the amplifier has been neglected, considering that the generatedharmonic content is likely to be masked by the Clavinet tones.
3.5 Tangent knock
A secondary feature of the Clavinet sound is the presence of a knock sound, due to the tangenthitting the stud and hence the soundboard. The presence of this knocking sound in the pickuprecordings may seem curious, but it can easily be explained by the fact that the impact of thetangent with the soundboard stud involves the string which is placed between the two bodiesand in contact with the soundboard and hence transmits part of the sound (including the modalresonances of the soundboard) through to the pickups.
This knocking sound is clearly audible in high tones, where its overlap with the tone harmonicsis lower. In order to partially model this knock, a sample of this sound has been extracted froman E6 tone, where the fundamental frequency lies over 1,300 Hz. The knocking sound, whichhas most of its energy concentrated below 1,200 Hz, can be isolated by filtering out everythingover the tone fundamental frequency.
In the proposed model, a triggered sample is used. The sample is the same for any key (thesecondary importance of this element does not give a strong motivation for precise modeling).Additionally, a mild low-pass filter can be added with a slightly random cutoff frequency foreach note triggering in order to reduce the sample repetitiveness.
3.6 Overview of the complete model and computational cost
The computational model described so far has been first implemented in Matlab R⃝. The targetof this work has been the development of a low-complexity model that could fit a real-timecomputing platform; thus, the porting of that model did not require any particular change instructure for the subsequent real-time implementation. The computational model described sofar, depicted in Figure 15, stands for both the Matlab and the real-time implementation.
Figure 15 Signal flow for the complete Clavinet model.
To summarize the work done to build this model, an overview of the basic blocks will be given.The DWG model consists of the delay line, which is split into two sections (z−(LS−R) andz−R) in order to add the ripple filter. The DWG loop includes the one-pole loss filter [53]Hloss(z) which adds frequency-dependent damping and the dispersion filter Hd(z) which addsthe inharmonicity characteristic to metal strings. The fractional delay filter F (z) accounts forthe fractional part of LS which cannot be reproduced by the delay line.
While the Clavinet pitch during sustain is very stable, and thus there is no need for changingthe delay length, a secondary delay line, representing the nonspeaking part of the string, isneeded to model the pitch drop at release. This delay line z−LNS is connected to the DWG loopat release time to model the key release mechanism.
To excite the DWG loop, there is the excitation generator block, named Excitation, whichmakes use of an algorithm described in [20] to generate the an excitation signal related to key

velocity and data on the tangent to string distance. This is triggered just once at attack time.
Several blocks are cascaded in the DWG loop. The beating equalizer (BEQ), composed of acascade of selective bandpass filters with modulated gain, emulates the beating of the partialharmonics and completes the string model. Then, the Pickup block emulates the effect ofpickups, while the Amplifier emulates the amplifier frequency response, including the effect ofthe tone switches.
Finally, the soundboard knock sample is triggered at a ‘note on’ event to reproduce that featureof the Clavinet tone. This is similar to what has been done for the emulation of the clavichord[23], an instrument that shows some similarities with the Clavinet.
The theoretical computational cost of the complete model can be estimated for the worst caseconditions and is reported in Table 4. The worst case conditions occur for the lowest tone(F1), which needs the longest delay line and the highest order for the dispersion filter. Thelatter depends on the estimate of the B coefficients made during the analysis phase and theparameters used to design the filter. With the current data, the maximum order of the dispersionfilter is eight.
Table 4 Computational cost of the Clavinet model per sample per stringBlock Multiplications AdditionsFractional delay filter 2 2Dispersion filter 4 × 5 4 × 4Loss filter 2 1Ripple filter 1 1Soundboard knock with LPF 3 2Beating equalizers 2 × 7 2 × 7Pickups 9 5Amplifier and tone switches 21 15Total per string 82 64Total FLOPS per string is 6.4 MFLOPS at 44,100 Hz.
The memory consumption is mostly due to the delay lines, which, at a 44,100-Hz samplingfrequency, require at most 923 samples (a longer delay line is not required as the dispersionfilter takes into account a part of the loop delay), which, together with the taps required bycomb filters, can amount to approximately 1,000 samples of memory per string.
4 Real-time implementation
The model discussed in Section 3 is well suited to a real-time implementation, given its lowcomputational cost. The implementation has been performed on the Pure Data (PD) open-source software platform, a graphical programming language [54].
Some technical details regarding the PD patch implementation will be now discussed.
The main panel includes real-time controllable parameters such as pickup selector, tone switches,yarn damping, ripple filter coefficients, soundboard knock volume, beating equalizers settings,and the master volume.

The delay line used for digital waveguide modeling is allocated and written by the [delwrite∼]object and is read by the [vd∼] object. The latter also implements the fractional delay filterwith a four-point interpolation algorithm.
The dispersion filter is made of cascaded second-order sections (SOSs). These are not easilydynamically allocated at runtime in the PD patching system; hence, a total of four SOSs hasbeen preallocated and coefficients have been prepared in Matlab. More than four SOSs wouldbe needed for the lowest tones if a more accurate emulation of the dispersion were desired(which can be achieved by increasing the frequency cutoff of the mask in the dispersion filterdesign algorithm), but a trade-off between computational cost and quality of sound has beenmade.
The PD patchb for the Clavinet has been created and tested on an embedded GNU/Linux plat-form running Jack as the real-time audio server at a sampling frequency of 44,100 Hz. Theplatform is the BeagleBoard, a Texas Instruments OMAP-based solution (Dallas, TX, USA),with an ARM-v8 core (equipped with a floating point instruction set), running a stripped-downversion of Ubuntu 10.10 with no desktop environment [55]. A test patch with 10 instances ofthe string model and the amplifier requires an average 97% CPU load, leaving the bare min-imum for the other processes to run (including pd-gui and system services) but causing noXruns (i.e., buffer over/underruns). The current PD implementation of the model only relies onthe PD-extended package externals: this means that, in the future, if using custom-written Ccode to implement parts of the algorithm (e.g., the whole feedback loop), the overhead for thecomputational cost can be highly reduced. This will gain headroom for additional complexityin the model. The audio server guarantees a 5.8-ms latency (128 samples at 44,100 Hz), thusunnoticeable when the patch is played with a USB MIDI keyboard.
5 Model validation
A preliminary model validation has been done by comparing real data with synthetic tones.Throughout the paper, some differences have been shown in the string frequency response(Figure 8) and in the frequency response of the amplifier tone control (Figure 16). Furthermore,the time and spectral plot of a tone synthesized by the model (to be compared to the sampledcounterpart in Figure 3) is shown in Figure 16.
Figure 16 Plot of (a) a synthesized A♯2 tone and (b) its spectral content up to 8 kHz.
A more detailed comparison between the former two tones is shown in Figure 17, where thepartial envelope has been extracted, smoothed, and compared. Although the two spectra do notexactly match, from a perceptual standpoint, the differences are of minor importance.
Figure 17 Comparison of the partial envelope of real (77.78 Hz) and synthesized D♯2 tonesup to 4 kHz. Thin solid line, real; thick dashed line, synthesized. The partial locations aregiven by the gray stem plot.

A more significant means of assessing the quality of the sound synthesis in terms of realism andfidelity to the real instrument are subjective listening tests. Several tests have been conductedaccording to a guideline proposed by the authors in [22]. The same reference also reportstests conducted with the earlier version of the Clavinet model described in [20]. Test resultsconducted on the present model show slight differences with the ones presented in [22], whichwill be briefly reported for the sake of completeness.
The metric used to evaluate the results is called accuracy or discrimination factor [56], d, whichis defined as follows:
d =PCS − PFP + 1
2, (8)
where PCS and PFP are the correctly detected synthetic percentage and falsely identified syn-thetic percentage (recorded samples misidentified as synthetic), respectively. A discrimina-tion factor of 100% represents perfect distinguishability for the recorded and synthetic tones,whereas 50% represents random guessing. In previous works, a threshold of 75% has been ac-cepted as the borderline, under which the sound can be considered not distinguishable [56-58];however, in this work, the 75% threshold will be called a likelihood threshold, under which thesound can be considered very close to the real one. Perfect indistinguishability coincides withrandom guessing.
The listening tests show a good level of realism as the threshold of 75% for the discriminationaveraged among the subjects is never reached. The d factor averaged among the various subjectcategories is 53%. Musicians with knowledge of the Clavinet sound obtained the highest dscore, 58%, 3% lower than that obtained with the previous model, showing an increase insound quality with the current model. Tests have been performed with both single tones andmelodies.
6 Conclusions and future work
This paper describes a complete digital waveguide model for the emulation of the Clavinet,including detailed acoustical analysis and parametrization and modeling of pickups and theamplifier. Important issues related to the analysis of the recordings, the peculiarity of the tan-gent mechanism, and the way to reproduce the amplifier stage are addressed. Specifically, theexcitation waveform is generated depending on the key strike velocity, and the release mech-anism is modeled from the speaking and nonspeaking string lengths. The frequency responseof the pickups based on impedance measurement on a Clavinet pickup is discussed, while theamplifier model is based on digital filters derived from circuit analysis and is compared tocomputer-aided electrical simulations.
A real-time Pure Data patch is described that can run several string instances on a commonPC, allowing for at least 10-voice polyphony. Subjective listening tests are briefly reportedto prove a good degree of faithfulness of the model to the real Clavinet sound. Future workon the model includes a mixed FDTD-DWG model [59] to introduce nonlinear interaction inthe tangent mechanism while keeping the computational cost low. The listening tests reportedin this paper stand as one of the first attempts in subjective evaluation for musical instrumentemulation, and, even revealing its usefulness on purpose, more advanced methods and metricswill be explored in the future.

Endnotes
aThe Matlab script performing the algorithm from [46] is available at http://www.acoustics.hut.fi/publications/papers/spl-adf/adf.m.bThe PD patch and sound samples of the computational model will be shared with the commu-nity and made available at http://a3lab.dii.univpm.it/projects/jasp-clavinet.
Competing interests
The authors declare that they have no competing interests.
Acknowledgments
Many thanks to Emanuele Principi, PhD, from the Università Politecnica delle Marche De-partment of Information Engineering, for the development of the software platform used forthe tests, called A3Lab Evaluation Tool. One of the authors (Bilbao) was supported by theEuropean Research Council, under grant StG-2011-279068-NESS.
References
1. G De Sanctis, A Sarti, Virtual analog modeling in the wave-digital domain. IEEE Trans.Audio Speech Lang. Process. 18(4), 715–727 (2010)
2. T Hélie, Volterra series and state transformation for real-time simulations of audio circuitsincluding saturations: application to the Moog ladder filter. IEEE Trans. Audio SpeechLang. Process. 18(4), 747–759 (2010)
3. F Fontana, M Civolani, Modeling of the EMS VCS3 voltage-controlled filter as a nonlinearfilter network. IEEE Trans. Audio Speech Lang. Process. 18(4), 760–772 (2010)
4. C Erkut, M Karjalainen, P Huang, V Välimäki, Acoustical analysis and model-based soundsynthesis of the kantele. J. Acoust. Soc. Am. 112(4), 1681–1691 (2002)
5. H Penttinen, J Pakarinen, V Välimäki, M Laurson, H Li, M Leman, Model-based soundsynthesis of the guqin. J. Acoust. Soc. Am. 120, 4052–4063 (2006)
6. SJ Cho, U Chong, SB Cho, Synthesis of the Dan Tranh based on a parameter extractionsystem. J. Audio Eng. Soc. 58(6), 498–507 (2010)
7. M Vail, Vintage Synthesizers, 2nd edn. (Miller Freeman Books, San Francisco, 2000)
8. JO Smith, Physical Audio Signal Processing for Virtual Musical Instruments and DigitalAudio Effects. http://www.w3k.org/books/. Accessed 19 Aug 2011
9. V Välimäki, J Pakarinen, C Erkut, M Karjalainen, Discrete-time modelling of musicalinstruments. Reports on Prog. Phys. 69, 1–78 (2006)
10. S Bilbao, Numerical Sound Synthesis: Finite Difference Schemes and Simulation in Musi-cal Acoustics (Wiley, Chichester, 2009)

11. L Trautmann, R Rabenstein, Digital Sound Synthesis by Physical Modeling Using theFunctional Transformation Method (Kluwer/Plenum, New York, 2003)
12. A Chaigne, A Askenfelt, Numerical simulations of piano strings. a physical model for astruck string using finite difference methods. J. Acoust. Soc. Am. 95(2), 1112–1118 (1994)
13. B Bank, L Sujbert, Generation of longitudinal vibrations in piano strings: from physics tosound synthesis. J. Acoust Soc. Am. 117(4), 2268–2278 (2005)
14. B Bank, S Zambon, F Fontana, A modal-based real-time piano synthesizer. IEEE Trans.Audio Speech Lang. Process. 18(4), 809–821 (2010)
15. N Lee, JO Smith, V Välimäki, Analysis and synthesis of coupled vibrating strings usinga hybrid modal-waveguide synthesis model. IEEE Trans. Audio Speech Lang. Process.18(4), 833–842 (2010)
16. V Välimäki, J Huopaniemi, M Karjalainen, Z Jánosy, Physical modeling of plucked stringinstruments with application to real-time sound synthesis. J. Audio Eng. Soc. 44, 331–353(1996)
17. J Bensa, S Bilbao, R Kronland-Martinet, J Smith III, The simulation of piano string vibra-tion: from physical models to finite difference schemes and digital waveguides. J. Acoust.Soc. Am. 114, 1095–1107 (2003)
18. J Rauhala, HM Lehtonen, V Välimäki, Toward next-generation digital keyboard instru-ments. IEEE Signal Process. Mag. 24(2), 12–20 (2007)
19. S Bilbao, M Rath, Time domain emulation of the Clavinet, in 128th AES Convention,London, 22–25 May 2010, p. 7
20. L Gabrielli, V Välimäki, S Bilbao, Real-time emulation of the Clavinet, in Proceedingsof the International Computer Music Conference, Huddersfield, 31 July–5 Aug 2011, pp.249–252
21. L Remaggi, L Gabrielli, R de Paiva, V Välimäki, S Squartini, A pickup model for theclavinet, in Digital Audio Effects Conference 2012 (DAFx-12), York, 17–21 Sept 2012
22. L Gabrielli, S Squartini, V Välimäki, A subjective validation method for musical instru-ment emulation, in 131st AES Convention, New York, 20–23 Oct 2011
23. V Välimäki, M Laurson, C Erkut, Commuted waveguide synthesis of the clavichord. Com-put. Music J. 27(1), 71–82 (2003)
24. C d’Alessandro, On the dynamics of the clavichord: from tangent motion to sound. J.Acoust. Soc. Am. 128, 2173–2181 (2010)
25. Pianoteq CL1, http://www.pianoteq.com/commercial%5Faddons. Accessed 19 Aug 2011
26. RC de Paiva, J Pakarinen, V Välimäki, Acoustics and modeling of pickups. J. Audio En-gineering Soc. 60(10), 768–782 (2012)
27. N Horton, T Moore, Modeling the magnetic pickup of an electric guitar. Am. J. Phys. 77,144–150 (2009)

28. A Nackaerts, B De Moor, R Lauwereins, Measurement of guitar string coupling, in Pro-ceedings of the International Computer Music Conference, Goteborg, 16–21 Sept 2002,pp. 321–324
29. H Järveläinen, V Välimäki, M Karjalainen, Audibility of the timbral effects of inharmonic-ity in stringed instrument tones. Acoust. Res. Lett. Online, ASA, 2(3), 79 – 84 (2001)
30. J Rauhala, H Lehtonen, V Välimäki, Fast automatic inharmonicity estimation algorithm.J. Acoust. Soc. Am. 121(5), 184–189 (2007)
31. H Fletcher, E Blackham, R Straton, Quality of piano tones. J. Acoust. Soc. Am. 34(6),749–761 (1962)
32. LR Rabiner, On the use of autocorrelation analysis for pitch detection. IEEE Trans. Acoust.Speech Signal Process. 25(1), 24–33 (1977)
33. H Järveläinen, V Välimäki, Audibility of initial pitch glides in string instrument sounds, inProceedings of the International Computer Music Conference, Havana, 17–23 Sept 2001,pp. 282–285
34. C De Paiva, H Penttinen, Cable matters: instrument cables affect the frequency responseof electric guitars, in 131st AES Convention, New York, 20–23 Oct 2011
35. G Lemarquand, V Lemarquand, Calculation method of permanent-magnet pickups forelectric guitars. IEEE Trans. Magnetics 43(9), 3573–3578 (2007)
36. www.clavinet.com. Clavinet D6 amplifier schematic. http://www.gti.net/junebug/clavinet/Clavinet%5FD6%5Fschematic.pdf. Accessed 19 Aug 2011
37. L Gabrielli, Modeling of the clavinet using digital waveguide synthesis techniques, M.Sc.thesis, Università Politecnica delle Marche, 2011
38. DA Jaffe, JO Smith, Extensions of the Karplus-Strong plucked-string algorithm. Comput.Music J. 7(2), 56–69 (1983)
39. T Laakso, V Välimäki, M Karjalainen, U Laine, Splitting the unit delay-tools for fractionaldelay filter design. IEEE Signal Process. Mag. 13(1), 30–60 (1996)
40. B Bank, V Välimäki, Robust loss filter design for digital waveguide synthesis of stringtones. IEEE Signal Process. Lett. 10(1), 18–20 (2003)
41. V Välimäki, H Penttinen, J Knif, M Laurson, C Erkut, Sound synthesis of the harpsichordusing a computationally efficient physical model, EURASIP J. Appl. Signal Process. 7,934–948 (2004)
42. S Van Duyne, J Smith, A simplified approach to modeling dispersion caused by stiffnessin strings and plates, in Proceedings of the International Computer Music Conference,Aarhus, 12–17 Sept 1994, pp. 335–343
43. J Rauhala, The beating equalizer and its application to the synthesis and modification ofpiano tones, in Digital Audio Effects Conference (DAFx-07), Bordeaux, 10–15 Sept 2007,pp. 181–187

44. J Rauhala, M Laurson, V Välimäki, H Lehtonen, V Norilo, A parametric piano synthesizer.Comput. Music J. 32(4), 17–30 (2008)
45. H Järveläinen, T Tolonen, Perceptual tolerances for the decaying parameters in string in-strument synthesis. J. Audio Engineering Soc. 49(11), 1049–1059 (2001)
46. JS Abel, V Välimäki, JO Smith, Robust, efficient design of allpass filters for dispersivestring sound synthesis. IEEE Signal Process. Lett. 17(4), 406–409 (2010)
47. P Regalia, S Mitra, Tunable digital frequency response equalization filters. IEEE Trans.Acoust. Speech Signal Process. 35(1), 118–120 (1987)
48. N Lindroos, H Penttinen, V Välimäki, Parametric electric guitar synthesis. Comput. MusicJ. 35(3), 18–27 (2011)
49. W Horner, A new method of solving numerical equations of all orders, by continuousapproximation. Philos. Trans. Royal Soc. London 109, 308–335 (1819)
50. E Brandt, Hard sync without aliasing, in Proceedings of the International Computer MusicConference, Havana, 9–14 Sept 2001, pp. 365–368
51. MA Al-Alaoui, Novel digital integrator and differentiator. IEEE Electron. Lett. 29(4), 376–378 (1993)
52. D Yeh, Digital implementation of musical distortion circuits by analysis and simulation,Ph.D. dissertation, Stanford University, 2009. https://ccrma.stanford.edu/~dtyeh/papers/DavidYehThesissinglesided.pdf. Accessed 8 May 2013
53. B Bank, Physics-based sound synthesis of the piano, Ph.D. dissertation, Helsinki Univer-sity of Technology, 2000. http://www.acoustics.hut.fi/~bbank/thesis.html. Accessed 8 May2013
54. M Puckette, Pure data: another integrated computer music environment, in Proceedings ofthe Second Intercollege Computer Music Concerts, Tachikawa, 7 May 1997, pp. 37–41
55. L Gabrielli, S Squartini, E Principi, F Piazza, Networked beagleboards for wireless mu-sic applications, in European DSP Education and Research Conference (EDERC 2012),Amsterdam, 13–14 Sept 2012
56. CW Wun, A Horner, Perceptual wavetable matching for synthesis of musical instrumenttones. J. Audio Engineering Soc. 49, 250–262 (2001)
57. S Wun, A Horner, Evaluation of weighted principal-component analysis matching forwavetable synthesis. J. Audio Engineering Soc. 55(9), 762–774 (2007)
58. H Lehtonen, H Penttinen, J Rauhala, V Välimäki, Analysis and modeling of piano sustain-pedal effects. J. Acoust. Soc. Am. 122, 1787–1797 (2007)
59. M Karjalainen, C Erkut, Digital waveguides versus finite difference structures: equivalenceand mixed modeling. EURASIP J. Adv. Signal Process. 7, 978–989 (2004)

Figure 1

Figure 2

Figure 3
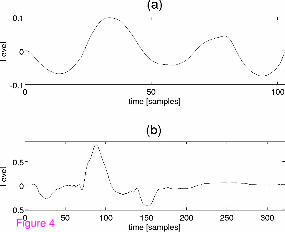
Figure 4

Figure 5

Figure 6
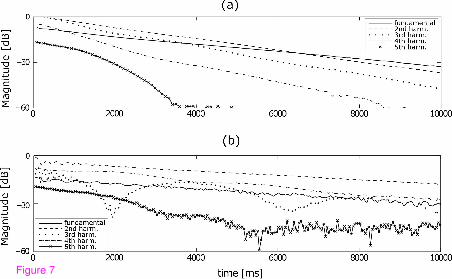
Figure 7

Figure 8

Figure 9

0 0.5 1 1.5 20.07
0.08
0.09
Displacement (cm)
Mag
net
ic f
lux (
Tes
la)
Central string
Near−edge string
Figure 10

Figure 11

Figure 12

0 0.5 1 1.50.074
0.075
0.076
0.077
0.078
0.079
0.08
Displacement (cm)
Mag
net
ic f
lux
(T
esla
)Simulation data
Exponential fit
Fourth−degree polynomial
Figure 13

Figure 14
Figure 15

Figure 16

Figure 17