euo eecomey suies o i ims a muiayee maeiasprzyrbwn.icm.edu.pl/app/pdf/96/a096z1p06.pdf · euo...
TRANSCRIPT

Vol. 96 (1999) ACTA PHYSICA POLONICA A No. 1
•
Proceedings of the •III Int. School and Symposium on Physics in Materials Science, Jaszowiec.'98
NEUTRON REFLECTOMETRY STUDIES OF THINFILMS AND MULTILAYERED MATERIALS
C.F. MAJKRZAK
Center for Neutron Research, National Institute of Standards & TechnologyGaithersburg, Maryland, 20899, USA
Neutron reflectometry is an important technique for studying thecom-position and structure of thin films and layered media on a nanometer scale.
Neutrons are particularly useful as probes of organic and magnetic materialssince the information that can be obtained is often unique. Furthermore, thefact that neutrons traverse relatively large distances in single crystalline ma-terials, such as silicon, permit investigations in diverse sample environments.The fundamental theoretical principles and experimental methodology ofneutron reflectometry are presented, in addition to several illustrative exam-ples of measurements relevant to polymer science, biology, electrochemistry,and magnetism.
PACS numbers: 61.12.—q
1. Introduction
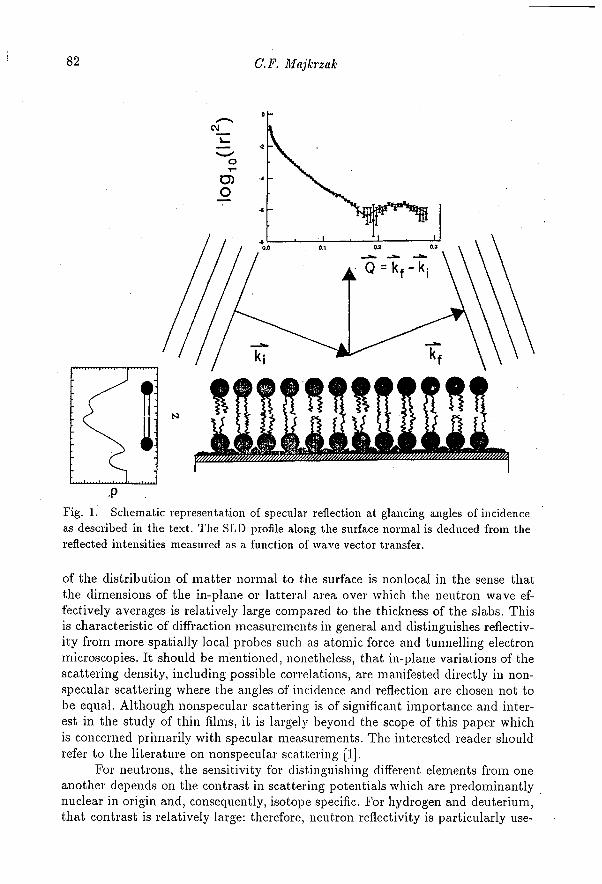
The intensity of a neutron beam reflected at a glancing angle from a flatmaterial surface depends upon the composition and structure of the underlyingmatter. More specifically, if the reflected intensity is measured at an angle ofreflection equal to that of incidence, known as the specular condition, then the re-flectivity, or ratio of reflected to incident intensity, as a function of glancing angle,can be analyzed to reconstruct an averaged compositional depth profile along thenormal to the surface. This is illustrated schematically in Fig. 1. At sufficiently lowangles, a given slab of thickness dz can be represented by a single uniform scat-tering potential or density that is proportional to the sum of the products of eachconstituent atom's scattering power (characterized by a scalar scattering length)and its number per unit volume. The depth profile depicted in Fig. 1 representsthe average values of the scattering density for the slabs along the direction of the .surface normal, as can be obtained from the measured reflectivity curve. The spa-tial resolution, or minimum slab thickness, is inversely proportional to the angularrange over .which the reflectivity is measured and is of the order of manometersin typical experiments. Knowing the scattering power associated with a particularatom or isotope, the chemical compositional profile can be deduced. This picture
(81)
82 C.F. Majkrzak
Fig. 1. Schematic representation of specular reflection at glancing angles of incidenceas described in the text. The SLD profile along the surface normal is deduced from thereflected intensities measured as a function of wave vector transfer.
of the distribution of matter normal to the surface is nonlocal in the sense thatthe dimensions of the in-plane or latteral area over which the neutron wave ef-fectively averages is relatively large compared to the thickness of the slabs. Thisis characteristic of diffraction measurements in general and distinguishes reflectiv-ity from more spatially local probes such as atomic force and tunnelling electronmicroscopies. It should be mentioned, nonetheless, that in-plane variations of thescattering density, including possible correlations, are manifested directly in non-specular scattering where the angles of incidence and reflection are chosen not tobe equal. Although nonspecular scattering is of significant importance and inter-est in the study of thin films, it is largely beyond the scope of this paper whichis concerned primarily with specular measurements. The interested reader shouldrefer to the literature on nonspecular scattering [1].
For neutrons, the sensitivity for distinguishing different elements from oneanother depends on the contrast in scattering potentials which are predominantlynuclear in origin and, consequently, isotope specific. For hydrogen and deuterium,that contrast is relatively large: therefore, neutron reflectivity is particularly use-

Neutron Reflectometry Studies of Thin Films ... 83
ful for studying soft condensed matter systems, including polymer and Langmuir-Blodgett films and also biological membranes. This isotopic specificity comple-ments the Z-dependent interaction of X-rays with atomic electrons which deter-mines the sensitivity for X-ray reflectometry — often both radiations are valuablein the study of certain systems. In addition, the interaction between the magneticmoment of the neutron and that of an atom depends upon the relative orientationof the moments, and can have a strength comparable to that of the nuclear inter-action. Using polarized neutron beams, it is in fact possible to obtain the vectorialmagnetization depth profile in films and layered structures. •
Another advantageous property is the neutron's high transmission throughsingle-crystalline materials, such as silicon, which allows the substrate supportingthe film of interest to also serve as incident medium: hence, for example, films incontact with nontransparent liquid reservoirs can be studied. Furthermore, the flatand smooth surface of a substrate can be employed, in some cases, as a coherentsupport structure on which molecules can be made to self-assemble with a commonaxis of orientation. Specular reflection measurements then effectively yield thechemical profile of the unit molecule along the surface normal direction.
Sections 2 and 3 discuss, in more detail, elements of the theory and practiceof neutron reflectometry, respectively. Section 4 presents a- number of illustrativeexamples of the use of neutron reflectivity measurements in materials science.Section 5 considers phase determination and inversion of reflectivity data to obtainthe scattering density profile directly.
2. Fundamental theory
2.1. Chemical structures
An important distinction between neutron or X-ray scattering and electronand atomic or molecular beam diffraction is the simplicity with which the former •fundamental interactions can be described. The neutron reflection amplitude, r,from a nonmagnetic layered structure with a surface of infinite lateral extent, andfor the specular condition depicted in Fig. 1, is given by
In Eq. (1) W represents the wave function within the scattering medium at a depth zbelow the bounding surface, Q is the magnitude of the wave vector transfer k f - ki,and p is the scattering length density (SLD) which is the sum of the productsof a scalar coherent scattering length and number of scattering centers per unitvolume for each isotope present. The validity of this expression depends uponthe assumptions that the incident neutron can be represented by a plane wave,the scattering is both specular and elastic, and the nuclear spins are randomlyoriented in space — requirements which are satisfied in most cases of interest.In addition, it is implicitly assumed that the reflection occurs at sufficiently lowglancing angles that the scattering medium can be treated as a continuum withoutany effects of crystalline order being manifested (at higher angles, the integral overthe continuum must be replaced by a summation on discrete atomic planes: see •Ref. [2] for a more complete discussion).

84 C.F. Majkrzak
At sufficiently high glancing angles, but still within the continuum limit,where the scattering is weak enough, Eq. (1) can be simplified even further byimposing the well-known Born approximation that the wave function withinthe medium can be replaced by a form equivalent to an undistorted plane wavein vacuum. This approximation is almost always used in neutron and X-ray scat- .tering from polycrystalline or powder samples. Then, the reflection amplitude isdirectly related to the SLD by a Fourier transform. Unfortunately, the approxima-tion breaks down at lower reflection angles for most film systems of interest, eitherbecause of the strength of the scattering from the film itself or from the substrateoil which the film has been deposited. This is illustrated in Fig. 2 which comparesthe prediction of Eq. (1) in the Born approximation with that obtained accord-ing to a more accurate solution to be discussed below. Although the apparentlysignificant discrepancies in the two curves occur over a limited range at the verylowest angles, where the reflectivity, |r| 2 , approaches unity, this is precisely wheresome of the most important information regarding the SLD profile is found.
Fig. 2. Reflectivity curves calculated according to the Born approximation (circles)and the more accurate theory (triangles) discussed in the text. 200 A Ni. ,n Si substrate.
It is of no small consequence, then, that the "exact" expression for the reflec-tion amplitude given by Eq. (1) can, in fact, be solved straightforwardly, withoutany need to make the Born approximation, via a simple differential wave equa-tion. One of the most basic problems in quantum mechanics is the description ofthe reflection and transmission of a plane wave by a rectangular potential barrier .in one dimension. It turns out that this is equivalent to the problem at hand foranalyzing neutron specular reflection. By imposing the boundary conditions thatthe wave function and its first derivative be continuous at each boundary, theconditions which ensure that particle number and momentum are conserved, thesolution of the wave equation (see, for example, Ref. [3])

Neutron Reflectometry Studies of Thin Films ... 85
leads to a set of simultaneous algebraic equations relating the reflected and trans-mitted amplitudes, r and t, respectively, to that of the incident wave of unit value.These equations are compactly represented in matrix form as
where
and the subscripts on n refer to the potential in front (f) or in back (b) of therectangular potential barrier of height p and thickness Az. The elements A, B, C,and D of the transfer matrix contain all of the information about the height andwidth of the barrier. Furthermore, any arbitrary SLD profile can be represented toany degree of accuracy by division into a sufficient number of adjacent rectangularslabs of constant SLD. The transfer matrix describing this more complicated com-posite structure can be written as the product of all the individual slab matrices.The details of this piecewise continuous treatment are discussed in Refs. [2] and [4].
The matrix formulation described above for relating the reflection amplitudeto the SLD profile has proven to be remarkably accurate in the analysis of actualneutron reflectivity measurements for samples which have relatively smooth in-terfaces and do not give rise to appreciable nonspecular or diffuse scattering. Atthis point it should be emphasized that it is the square of the complex reflectionamplitude r that is measured in experiment; i.e., the ratio of the reflected to inci-dent beam intensities. 1r1 2 can be calculated from a model structure using Eq. (3)for either predicting what reflectivity should be expected in an experimental mea- .surement, or for use in nonlinear least squares fitting routines [5] as well as modelindependent procedures [6] for interpreting reflectivity data. However, obtainingaccurate and unambiguous SLD profiles from measured reflectivity data is besetwith a number of fundamental difficulties. First of all, measuring 1r2 rather thanthe amplitude r results in a complete loss of the phase information that is essentialfor establishing uniqueness; i.e., more than one pot ential can give rise to the samereflectivity curve. The phase problem is discussed in Sec. 5 below. Secondly, fittingreflectivity data to extract a SLD profile is a highly nonlinear process. To add tothese complications is the reality that reflectivity data can be collected only overa finite range of scattering angle, thereby introducing, to some degree, truncationartifacts in the SLD profile. Fortunately, in many cases these potentially signif-icant problems can be effectively minimized with proper experimental techniqueand data analysis.
2.2. Magnetic materials and polarized neutrons
As already mentioned in the Introduction, the interaction between the mag-netic moments of a neutron and an atom depends upon their relative orientationand can be comparable in strength to that arising from the nuclear potential •

86 C.F. Majkrzak
Fig. 3. Diagram representing successive layers with noncollinear magnetizations. Po-larized neutron beams can be used to determine the in-plane vector magnetization depthprofile along the surface normal.
(see [7] for a more detailed account). Because of the spin-dependent nature of theinteraction; a vector magnetization depth profile along the surface normal can beobtained for a magnetic thin film structure using polarized neutron beams. Fourindependent reflectivities can be measured, two involving no reversal or "flip" ofthe neutron spin eigenstate and two resulting in a change of state from either "+"to "—" or vice versa. For the specific scattering geometry illustrated in Fig. 3, thecomponent of the net atomic magnetization in a given slab which is parallel tothe neutron polarization P can contribute only to non-spin-flip (NSF) scatteringwhile the perpendicular magnetization component gives rise solely to spin-flip (SF)processes. Further, the NSF reflectivities involve an interference between magneticand nuclear potentials whereas the SF reflectivities are purely magnetic in origin..Because of the possibility of spin-flip, the polarized beam version of Eq. (3) for thereflection amplitude requires 4-component vectors and a 4 x 4 transfer matrix. Amore complete discussion is given, for example, in Ref. [2].
•3. Experimental methods .
Figure 4 is a schematic representation of one of the two reflectometers atNIST. The pairs of masks preceding and following the sample define a ribbon-likebeam with relatively narrow angular divergence in the scattering plane definedby the incident and reflected wave vectors. The vertical divergence, on the otherhand, is relatively large, of the order of 2.5 degrees, but does not significantly affect

Neutron Reflectometry Studies of Thin Films ... 87
the instrumental resolution dQ/Q. For specular reflectometry, reflected intensitiesare measured as a function of the glancing angle, defined by the incident beamdirection and the surface of the sample. In this mode, the detector is positionedat twice the glancing angle. Because the incident beam is nearly monochromatic,each scattering angle corresponds to a single nominal value of the wave vectortransfer Q. At pulsed neutron sources, polychromatic beams are used at fixed.scattering angles: a given neutron wavelength, identified by its time of flight, thencorresponds to a particular value of Q. In the continuous source configuration,the footprint of the beam incident on the sample and the instrumental resolutioncan be kept approximately constant by increasing the slit apertures with angle •(a typical value of dQ/Q is 0.025).
Fig. 4. Polarized beam neutron reflectometer schematic.
The transmission polarizers depicted in Fig. 4 are described in Ref. [8] andhave polarizing efficiencies in excess of 95% and transmission losses for the desiredspin state of only about 20%. The polarizers can transmit beams up to approxi-mately 0.6 cm wide and are of sufficient height to accept the full vertical dimensionof the beam which is focussed down to about 3 cm at the sample position. Thefiat electromagnetic coil flippers allow highly efficient rotation of one neutron spinstate to the other in both incident and reflected beams.
The instrumental Q-resolution in neutron reflectometry can be often tight-ened sufficiently to resolve the oscillation fringes observed in the reflectivity Curvemeasured for a simple homogeneous thin film up to about 5000 A thick withoutprohibitive loss of intensity. (Fringes from a thinner, not quite uniform film are.evident in Fig. 5.) The overall thickness of a film with relatively abrupt interfacescan in many cases be determined with a fractional accuracy of the order of a fewper cent or better because of the sensitivity to the positions of sharp minima inthe reflectivity fringes. Clearly, if the substrate which supports a film of interest •

88 C. F. Majkrzak
Fig. 5. Neutron reflectivity curve obtained for an oxide film on the surface of a singlecrystalline Si substrate. The SLD profile corresponding to the fit (solid line) to the data(symbols) is shown in the inset.
is not perfectly flat but curved, particularly if the radius of curvature lies in thescattering plane defined by the incident and reflected wave vectors, then the effec-tive angular divergence of the incident beam will be increased, resulting in reducedQ-resolution.
In contrast, the spatial resolution associated with the more detailed fea-tures which may occur in a particular SLD profile is inversely proportional to themaximum value of Q up to which the reflectivity can be measured. As a roughapproximation, to distinguish variations m the scattering length density over alength L, the reflectivity must be measured up to a Q-value of about 2π/L.
Another related consideration is the coherence length of the incident neu-.tron, in particular the lateral extent over which its wave front is sufficiently flat.This lateral coherence length depends upon how a neutron incident on the samplewas prepared. Imagine the following simplified possibility: suppose that the lastinteraction a given neutron has, before impinging on and reflecting from a flat thin •film, is with a single hydrogen nucleus in some moderator material from which itscatters incoherently and isotropically as a. spherical wave with some wavelength,A. Subsequently, it reaches the sample along an unobstructed path a distance Saway from the hydrogen atom of origin. The radius of the spherical neutron waveis then S and the length L of a line parallel to a tangent to a circle of that radius— but at a distance S — a — is Given by
The points at either end of this line of length L are a distance a away from thesample surface when the sphere of radius S first makes contact. Thus, these endpomts define the lateral distance in the sample plane across which a given wave

Neutron Reflectometry Studies of Thin Films ... 89
front becomes out of phase by 2r. For a. perfectly flat plane wave, this lateraldistance is infinite. For a spherical wave of wavelength 5 A emanating from asource a distance 5 m away, for example, L is about 140 microns.
Now deviations of the surface from perfect flatness on length scales signif-icantly smaller than the lateral coherence of the incident radiation, as describedin the preceding paragraph, give rise to nonspecular scattering. If the nonspec-ular scattering is small enough compared to the specular component, then theone-dimensional analysis of the specular reflectivity described above is a goodapproximation: the in-plane roughness will be manifested in the SLD profile byscattering length densities (for slabs of thickness dz) which represent average val-ues over the area that the neutron wave is effectively coherent or in phase. Ifnonspecular scattering is significant, typically more than a few per cent of the spec-ular component, then the analysis of the specular reflectivity as a one-dimensionalproblem becomes less of a good approximation. If, on the other hand, the sampleis composed of in-plane areas with different SLD profiles which have dimensionsfar larger than the neutron's lateral coherence length, then the observed reflectiv-ity will be proportional to an incoherent sum of independent, weighted reflectedintensities for each different region (the weights representing the fractional area ofeach region). In this latter case, the analysis of the measured reflectivity requiresappropriate modelling to account for this effect.
As mentioned earlier, the fact that neutrons can traverse macroscopic dis-tances of single crystalline materials, e.g. silicon, with relatively little attenuation,makes it possible to study films in contact with far less transparent media such asan aqueous reservoir. In this case the single crystal serves not only as the support-ing substrate but also as incident medium.
Perhaps neutron scattering's greatest limitation is that the sources are rela-tively weak compared to what exists for X-rays, for example. It is, therefore, oftenof crucial importance to maximize sample size and minimize background, primar-ily by eliminating extraneous scattering material surrounding the sample. Figure 5illustrates the range of neutron reflectivities which can currently be measured atthe NIST Center . for Neutron Research for a typical film structure, in this ex-ample, SiO on a silicon substrate. Additional information regarding instrumentalresolution and techniques can be found in [2].
4. Illustrative examples
Space does not permit an exhaustive review of all of the many applicationsof neutron reflectometry. Included here are several representative examples andsome references to other work.
4.1. Soft condensed matter
Probably most of the researchers who have engaged in neutron reflectivityexperiments have been interested in studying some form or another of organicfilm system. Such systems include spin-coated polymers and biological membranesdeposited by the Langmuir—Blodgett technique or via self-assembled monolayers.The substrate of choice is most often single crystalline silicon.

90 C.F. Majkrzak
Fig. 6. Thin film morphologies for symmetric PEP/PEE diblock copolymers as dis-cussed in the text (after [9]).
Block copolymers display distinctive microstructures and ordering transi-tions which are affected by symmetry breaking interfaces. These macromoleculesare composed of two distinct monomeric sequences, where each sequence or seg-ment consists of N units of one or the other monomer, linked together at a sin-gle point. Neutron reflectometry is an ideal method for studying the thin filmstructures of such systems if one of the monomeric sequences is deuterated andthe other hydrogenated. A comprehensive investigation of this nature was carried .out by Foster et al. [9] on symmetric poly(ethylene-propylene)/poly(ethylethylene)(PEP/PEE) diblock copolymers. Figure 6 is a schematic representation of the thinfilm morphologies of symmetric PEP/PEE diblock copolymers. x represents thesegment–segment interaction parameter whereas ODT and GST signify order–dis-order and Gaussian-stretched coil transitions, respectively. From the reflectivitydata of Fig. 7 for various chain lengths, the SLD or concentration profiles nor-mal to the surface of the film shown in Fig. 8 can be deduced. The study clearlydemonstrated that the polymer/air and substrate/polymer interfaces can inducean ordered microstructure even when the center of the film is disordered (seeRef. [9] for further discussion and conclusions).
A large body of literature has been published on neutron reflectivity studiesof polymer films — two reviews on the subject have been given, by Penfold andThomas [10] and Russell [11], which are dated but still useful. For more recentwork in polymer science as well as in surfactant systems and Langmuir–Blodgettfilms, the Proceedings of the 4th and 5th International Conferences on SurfaceX-Ray and Neutron Scattering, [12] and [13], respectively, can be consulted.
Biological membranes can also be studied by neutron reflectivity, either inmultilayer or single bilayer form. Figure 9 shows how important information, in .this case the overall film thicknesses of the lipid bilayer in the gel and liquid crystalphases, can be obtained with great accuracy [14].

•Neutron Reflectometry Studies of Thin Films ... 91
Fig. 7. Neutron reflectivity data for six PEP/PEE chain lengths and the correspondingmodel curves used to infer the concentration profiles shown in Fig. 8. The results for Nless than 1890 have been shifted vertically. The data below the critical angle for totalexternal reflection has not been corrected for the beam footprint (after [9]).Fig. 8. Real space concentration profiles corresponding to the model reflectivity curvesshown in Fig. 7 (after [9]).
Fig. 9. Neutron reflectivity data and fits corresponding to the two SLD profiles shownin the inset: the sample is a biolayer of PPC/octadecanethiol HBM on Au in D 2 0(after [14]).

92 C.F. Majkrzak •
4.2. Hard condensed matter
•$.2.1. Nonmagnetic materials
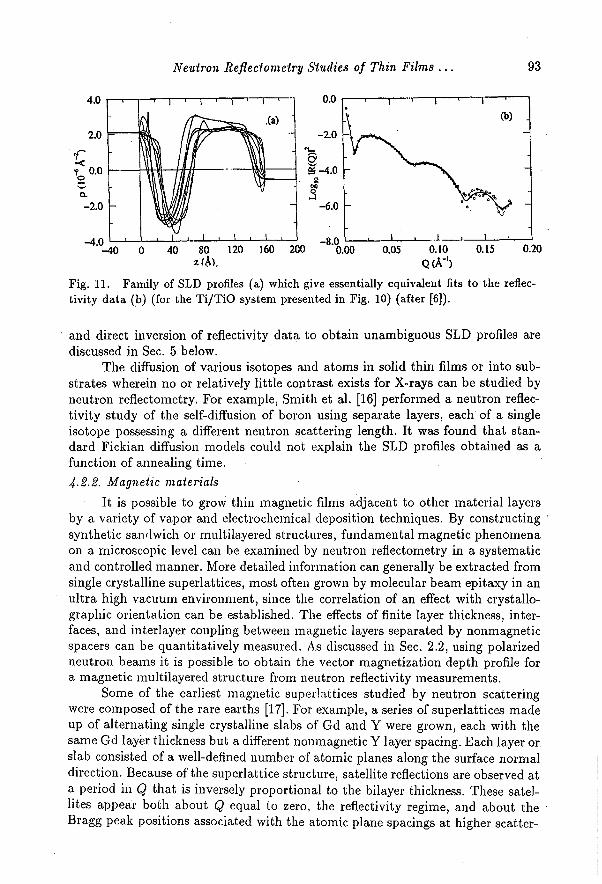
Figure 10 shows the neutron reflectivity curves and corresponding SLD pro-files obtained for a Ti/TiO film, deposited on a Si substrate, in contact with theaqueous reservoir of an active electrochemical cell [15]. The data show that, withtime, the TiO and then the Ti film are corroded away by the electrochemical reac-tion. Note that the corrosion process is effectively being monitored on a manometerscale. Figure 11 shows the family of fits which were obtained for one of the reflec-tivity curves of Fig. 10 using a model-independent procedure [6]. The variationsin the SLD profiles, which yield the same goodness-of-fit to the reflectivity curveplotted beneath, are due not only to statistical uncertainties in the measured in-tensities, but also to the fact that the reflectivity was collected over a finite rangeof Q and that phase information is missing. The subjects of phase determination
Fig. 10. Titanium/titanium oxide layer SLD profiles and corresponding neutron reflec-tivity curves as obtained for a specimen in contact with an aqueous solution reservoir ofan active electrochemical cell. The corrosion of the layers was studied in situ over thecourse of about two days (after [15]).
Neutron. Reflertometry .Studies of Thin Films ... 93
Fig. 11. Family of SLD profiles (a) which give essentially equivalent fits to the reflec-tivity data (b) (for the Ti/TiO system presented in Fig. 10) (after [6]).
• and direct inversion of reflectivity data to obtain unambiguous SLD profiles arediscussed in Sec. 5 below.
The diffusion of various isotopes and atoms in solid thin films or into sub-strates wherein no or relatively little contrast exists for X-rays can be studied byneutron reflectometry. For example, Smith et al. [16] performed a neutron reflec-tivity study of the self-diffusion of boron using separate layers, each of a singleisotope possessing a different neutron scattering length. It was found that stan-dard Fickian diffusion models could not explain the SLD profiles obtained as afunction of annealing time.
.4.2.2. Magnetic materials
It is possible to grow thin magnetic films adjacent to other material layersby a variety of vapor and electrochemical deposition techniques. By constructing •synthetic sandwich or multilayered structures, fundamental magnetic phenomenaon a microscopic level can he examined by neutron reflectometry in a systematicand controlled manner. More detailed information can generally be extracted fromsingle crystalline superlattices, most often grown by molecular beam epitaxy in anultra high vacuum environment, since the correlation of an effect with crystallo-graphic orientation can be established. The effects of finite layer thickness, inter-faces, and interlayer coupling between magnetic layers separated by nonmagneticspacers can be quantitatively measured. As discussed in Sec. 2.2, using polarizedneutron beams it is possible to obtain the vector magnetization depth profile fora magnetic multilayered structure from neutron reflectivity measurements.
Some of the earliest magnetic super] attices studied by neutron scatteringwere composed of the rare earths [17]. For example, a series of superlattices madeup of alternating single crystalline slabs of Gd and Y were grown, each with thesame Gd layer thickness but a different nonmagnetic Y layer spacing. Each layer or.slab consisted of a well-defined number of atomic planes along the surface normaldirection. Because of the superlattice structure, satellite reflections are observed ata period in Q that is inversely proportional to the bilayer thickness. These satel-lites appear both about Q equal to zero, the reflectivity regime, and about the •Bragg peak positions associated with the atomic plane spacings at higher scatter-
94 C.F. Majkrzak
ing angles, the crystal diffraction region. It was found that the ferromagnetic Gdslabs aligned either parallel or antiparallel to adjacent Gd slabs depending uponthe thickness of the intervening Y layer, in an oscillatory manner. A subsequenttheoretical explanation of this coupling between Gd layers invoked a long-range,indirect exchange interaction [18]. Similar studies have now been done on a widevariety of magnetic systems, investigating the coupling mechanisms between mag-netic layers across normal conducting, superconducting, semiconducting, and in-sulating layers.
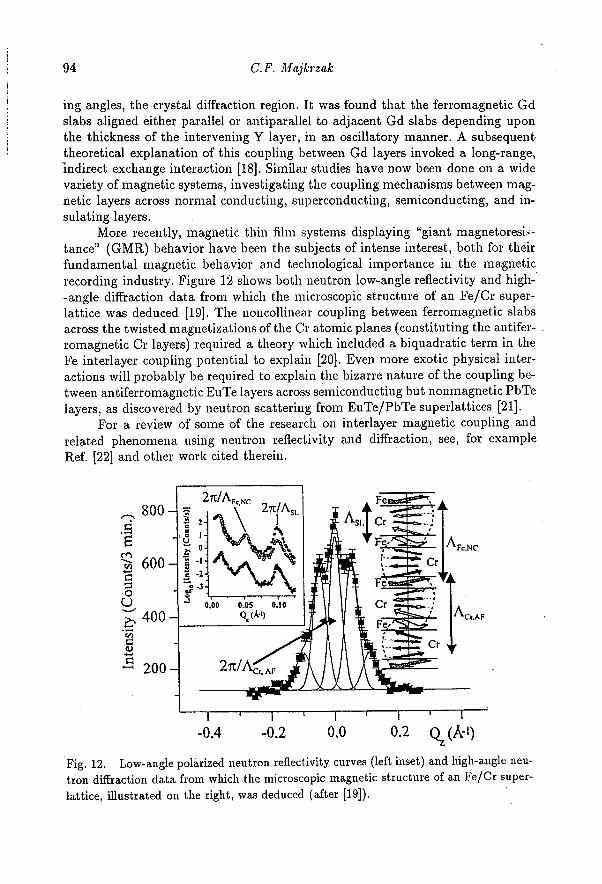
More recently, magnetic thin film systems displaying "giantmagnetoresitance" (GMR) behavior have been the subjects of intense interest, both for their
fundamental magnetic behavior and technological importance in the magneticrecording industry. Figure 12 shows both neutron low-angle reflectivity and high--angle diffraction data from which the microscopic structure of an Fe/Cr super-lattice was deduced [19]. The noncollinear coupling between ferromagnetic slabsacross the twisted magnetizations of the Cr atomic planes (constituting the antifer-romagnetic Cr layers) required a theory which included a biquadratic term in theFe interlayer coupling potential to explain [20]. Even more exotic physical inter-actions will probably be required to explain the bizarre nature of the coupling be-tween antiferromagnetic EuTe layers across semiconducting but nonmagnetic PbTelayers, as discovered by neutron scattering from EuTe/PbTe superlattices [21].
For a review of some of the research on interlayer magnetic coupling andrelated phenomena using neutron reflectivity and diffraction, see, for exampleRef. [221 and other work cited therein.
Fig. 12. Low-angle polarized neutron reflectivity curves (left inset) and high-angle neu-tron diffraction data from which the microscopic magnetic structure of an Fe/Cr super-lattice, illustrated on the right, was deduced (after [19]).

Neutron Reflectometry Studies of Thin Films ... 95
It should at least be mentioned here that just as it is possible to measure amagnetization profile normal to the surface of a thin film using polarized neutronreflectometry, the gradual expulsion of an applied magnetic field with depth into .a superconducting thin film can be determined. The first such measurement of themagnetic penetration depth was performed by Felcher et al. [23].
5. Phase determination and inversion•
As discussed in Sec. 2, it is possible to accurately predict the specular reflec-tivity curve to be expected for a given SLD model using a simple, but powerful,theory based on a one-dimensional wave equation. It is more problematical, how-ever, to extract a SLD profile from a measured set of reflectivity data. Givenreflected intensities alone, the only recourse is to use a fitting procedure, whichis basically a sophisticated form of trial and error. Even if a good fit to the re-flectivity is found, there is no guarantee that it represents the actual SLD profilesince a unique solution requires phase information, i.e., the complex reflection am-plitude (the SLD profile of a free-standing film, for example, gives rise to exactlythe same reflectivity curve as its mirror image). Figure 13 is an illustration of theambiguity that can occur in an actual case: the two obviously very different SLDprofiles shown were obtained from model-independent fits of the reflectivity withessentially identical goodness of fit (the two curves representing the fits are plot- .ted but are virtually indistinguishable from one another). Realistically, in manysituations a nonphysical solution can be ruled out on the basis of additional, in-dependent physical evidence or other constraints on the SLD values. For example,in the study of magnetic thin film systems, the chemical structure can be deter-mined from a combination of neutron and X-ray scattering measurements beforeperforming polarized neutron reflectivity experiments designed to deduce the mag-netic architecture. On the other hand, ab initio reflectivity studies of certain filmsystems, where prior structural and/or compositional information is sufficientlylacking, demand other means of ensuring that a unique SLD is obtained.
Fig. 13. Demonstration that two symmetry related SLD profiles (a), one physical, theother not, can give essentially identical fits to the measured reflectivity curve (b) (theTi/TiO data presented earlier) in the absence of phase information (after [6]).

96 C.F. Majkrzak
As it turns out, an exact and unique solution of the inverse scattering prob-lem [24], namely, to obtain the SLD profile directly from a scattering pattern,exists for real potentials of finite spatial extent; requirements almost always satis-fied for specular neutron reflection. However, the solution methods require that thecomplex reflection amplitude for the film system of interest be known as a functionof Q. Fortunately, it is possible to extract this reflection amplitude from measure-ments of the reflected intensity for two or three composite thin film structuresconsisting of the "unknown" film adjacent to a reference layer, the SLD profile ofwhich can be altered in a known way [25, 26]. A convenient choice of a referencelayer is a saturated ferromagnetic Fe film deposited on a substrate and buriedbeneath the sample film being studied. Using polarized neutrons, a beam in the"+" spin state sees one Fe SLD profile, whereas a "—" spin state beam senses analtogether differ, nt one due to the nature of the interference between the nuclearand magnetic scattering potentials of the Fe. A system of algebraic equations canbe written which relate measured reflected intensities for the composite layer sys-tems to combinations of the elements of the transfer matrix described in Sec. 2.In this case, however, the transfer matrix of the composite system can be writtenas a product of matrices corresponding to the unknown part and the referencein such a way that the two distinct pieces become mathematically separated aswell. The system of linear equations which result are exact and apply equally wellat all values of Q accessible to experiment, even where the Born approximation,
Fig. 14. Neutron reflectivity data and fits corresponding to the SLD profiles shown inthe inset for the Au/Si/Fe film sandwich structure discussed m the text.

Neutron Reflectometry Studies of Thin Films ... 97
as discussed in Sec. 2, is not valid. The solution of these equations then yieldsthe unambiguous value of the complex reflection amplitude for the film of interestalone [25].
Shown in Fig. 14 are the two sets of polarized reflectivity data obtained forthe Fe/Si/Au sandwich structure represented in the lower inset. Model indepen-dent fits to the data yield the composite SLD profile shown in the upper insetof Fig. 14. As a check of the self-consistency of the phase determination methodoutlined above, the gold and Si layers were then treated as though they were an"unknown" part of the structure whereas the Fe layer was employed as the ref-erence. Following the phase determination procedure, the imaginary part of thecomplex reflection amplitude corresponding to the Au and Si layers alone was ex-tracted from the same composite reflectivity data sets of Fig. 14 and is plottedin Fig. 15. A specific solution to the one-dimensional inverse scattering problem(based on the method developed by Gel'fand, Levitan, and Marchenko) [27] wassubsequently used to retrieve the SLD profile shown in the inset of Fig. 15: thiscan be seen to be in good agreement with that part of the composite SLD profileof Fig. 14 corresponding to the Si and Au layers.
Fig. 15. Imaginary part of the complex reflection amplitude obtained from the reflec-tivity data of Fig. 14 by taking the Fe film to be a known reference layer: this amplitudethen corresponds to the Si and Au layers only. The SLD profile shown in the insetwas obtained from a direct inversion of the reflection amplitude based on the integralequation solution of Gel'fand, Levitan, and Marchenko mentioned in the text. The SLDprofile for the Si and Au layers thus obtained is in good agreement with the appropriatepart of that shown in Fig. 14.
98 C.F. Majkrzak.
Besides eliminating some of the ambiguity in the SLD profiles extracted fromreflectivity data, the reference layer method also has several other advantages.Analysis of model systems indicates that an equivalent degree of spatial resolutionin the SLD profile can be obtained for reflection amplitude data collected outto a maximum wave vector transfer approximately only half of that required forreflected intensity data without any phase information. Secondly, a section of thereference structure can be arbitrarily included as part of the unknown. In this waythe inversion process itself can be used as a diagnostic: if the incorporated knownpiece of the potential is not recovered upon inversion, then it can be immediatelyconcluded that the film structure being studied was either inhomogeneous (i.e.,incomplete coverage, varying overall thickness, etc.) or sufficiently rough to giverise to a significant amount of nonspecular scattering. For example, in one of theformer possibilities, the sample could consist of two or more distinct regions ofin-plane dimensions that are large compared to the lateral coherence length of theneutron wave. Then the measured reflectivity will actually consist of a sum ofseparate, weighted reflected intensities, each corresponding independently to oneof the separate regions of the sample. However, this incoherent sum of reflectedintensities would not be necessarily evident in the data as collected. In fact, it .
might very well be possible to obtain a fit to the resultant reflectivity curve thatcorresponds to a single homogeneous, but completely fictitious, film structure!
Finally, it should be pointed out as well that the SLD profile obtained byinversion using this phase determination method is only as good as the accuracy towhich the reference layer structure is known. Furthermore, the reference should bechosen intelligently, in such a way as to optimize sensitivity to the part of the filmbeing studied (this includes "boosting" the signal of a weakly reflecting layer). Forinstance, it might prove useful to employ a reference with an effectively variablethickness or length rather than scattering length density magnitude only. That is,a reference structure with some element of "frequency" as opposed to "amplitude"modulation might be preferable in certain cases.
6. Conclusions
Neutron reflectometry has a wide range of applications in the investigationof the chemical and magnetic nanostructures of thin film materials, including bothhard and soft condensed matter. The method complements other scattering probes,including X-rays, electrons, and atomic beams, as well as more local ones such asatomic force and scanning tunneling microscopies.
Acknowledgments
It is both a responsibility and pleasure to acknowledge all my colleagues,past and present, both at the NCNB and elsewhere, without whose considerablecontributions much of the work presented here would not have been possible.
References
[1] R. Pynn, in: Neutron Scattering in Materials Science II, MRS Symp. Proc.,Vol. 376, Eds. D.A. Neumann, T.P. Russell, B.J. Wuensch, MRS, Pittsburgh 1995,p. 165; S.K. Sinha, p. 175.

Neutron Reflectometry Studies of Thin Films ... 99
[2] C.F. Majkrzak, J.F. Ankner, N.F. Berk, L.D. Gibbs, in: Magnetic Multilayers,Eds. L.H. Bennett, R.E. Watson, World Scientific, Singapore 1994, p. 299.
[3] E. Merzbacher, Quantum Mechanics, 2nd ed., Wiley, New York 1970.
[4] M. Born, E. Wolf, Principles of Optics, 6th ed., Pergamon Press, Oxford 1980,p. 51.
[5] J.F. Ankner, C.F. Majkrzak, in: Neutron Optical Devices and Applications, SPIEProc., Vol. 1738, Eds. C.F. Majkrzak, J. Wood, SPIE, Bellingham (WA) 1992,p. 260.
[6] N.F. Berk, C.F. Majkrzak, Flips. Rev. B 51, 11296 (1995).
[7] G.E. Bacon, Neutron Diffraction, 3rd ed., Oxford University Press, London 1975.
[8] C.F. Majkrzak, Physica B 213&214, 904 (1995).[9] M.D. Foster, M. Sikka, N. Singh, F.S. Bates, S.K. Satija, C.F. Majkrzak, J. Chem.
Phys. 96, 8605 (1992).[10] J. Penfold, R.K. Thomas, J. Phys., Condens. Matter 2, 1369 (1990).
[11] T.P. Russell, Mater. Sci. Rep. 5, 171 (1990).
[12] Proc. 4th Int. Conf. Surface X-Ray and Neutron Scattering, Eds. G.P. Felcher,H. You, Physica B 221 (1996).
[13] Proc. 5th Int. Conf. Surface X-Ray and Neutron Scattering, Eds. D. Norman,J.R.P. Webster, Physica B 248 (1998).
[14] C.W. Meuse, S. Krueger, C.F. Majkrzak, J.A. Dura, J. Fu, J.T. Connor, A. Plant,Biophys. J. 74, 1388 (1998).
[15] D.W. Wiesler, C.F. Majkrzak, Physica B 198, 181 (1994).[16] G.S. Smith, W. Hamilton, M. Fitzsimmons, S.M. Baker, K.M. Hibbard, M. Nas-
tasi, J-P. Hirvonen, T.G. Zocco, in: Neutron Optical Devices and Applications,SPIE Proc., Vol. 1738, Eds. C.F. Majkrzak, J. Wood, SPIE, Bellingham (WA)1992, p. 246.
[17] C.F. Majkrzak, J. Kwo, M. Hong, Y. Yafet, D. Gibbs, C.L. Chien, J. Bohr, Adv.Flips. 40, 99 (1991).
[18] Y. Yafet, J. Appl. Phys. 61, 4058 (1987).[19] A. Schreyer, C.F. Majkrzak, Th. Zeidler, T. Schmitte, P. Bodeker, K. Theis-Brohl,
A. Abromeit, J.A. Dura, T. Watanabe, Phys. Rev. Lett. 79, 4914 (1997).[20] J.C. Slonczewski, J. Appl. Phys. 73, 5957 (1993).[21] K.I. Goldman, G. Springholz, H. Kepa, T.M. Giebultowicz, C.F. Majkrzak,
G. Bauer, Physica B 241-243, 710 (1998).[22] C.F. Majkrzak, Physica B 221, 342 (1996).[23] G.P. Felcher, R.T. Kampwirth, K.E. Gray, R. Felici, Plays. Rev. Lett. 52, 1539
(1984).[24] K. Chadan, P.C. Sabatier, Inverse Problems in Quantum Scattering Theory, 2nd
ed., Springer, New York 1989.[25] C.F. Majkrzak, N.F. Berk, Phys. Rev. B 52, 10827 (1995).[26] V.O. deHaan, A.A. van Well, S. Adenwalla, G.P. Felcher, Phys. Rev. B 52, 10831
(1995).[27] N.F. Berk, C.F. Majkrzak, J. Phys. Soc. Jpn. 65, 107 (1996).