euclid avenue corridor master plan future multi … avenue corridor master plan – future...
TRANSCRIPT

Euclid Avenue Corridor Master Plan
Future Multi-Modal Conditions Report
Prepared for: MIG
Funded by:
Caltrans Transportation Planning Grant Program
February 28, 2014
SD12-0070
In association with Darnell Associates

Euclid Avenue Corridor Master Plan – Future Multi-Modal Conditions Report
February 28, 2014
Table of Contents
EXECUTIVE SUMMARY ................................................................................................................................... 5
Project Setting ....................................................................................................................................................................................... 5
Goals and Objectives .......................................................................................................................................................................... 6
Elements of the Master Plan ............................................................................................................................................................ 7
Mobility Assessment Findings ......................................................................................................................................................... 7
INTRODUCTION ............................................................................................................................................ 10
MULTI-MODAL CONTEXT AND CONDITIONS .......................................................................................... 11
Street Network ................................................................................................................................................................................... 11
Public Transit ....................................................................................................................................................................................... 12
Bicycle Facilities .................................................................................................................................................................................. 13
Pedestrian Facilities .......................................................................................................................................................................... 13
Parking ................................................................................................................................................................................................... 15
MULTI-MODAL STRATEGY AND IMPROVEMENTS .................................................................................. 16
Key Improvements ............................................................................................................................................................................ 17
Street Network ................................................................................................................................................................... 17
Multi-Modal Enhancements ......................................................................................................................................... 18
Public Transit ...................................................................................................................................................................... 18
Bicycle Facilities ................................................................................................................................................................. 19
Pedestrian Facilities .......................................................................................................................................................... 20
Parking .................................................................................................................................................................................. 21
Lighting ................................................................................................................................................................................. 22
Planning-Level Cost Estimate ....................................................................................................................................................... 22
FUTURE YEAR VOLUMES ............................................................................................................................. 23
1

Euclid Avenue Corridor Master Plan – Future Multi-Modal Conditions Report
February 28, 2014
Street Network ................................................................................................................................................................................... 23
Transit Ridership ................................................................................................................................................................................ 27
Pedestrian Volumes .......................................................................................................................................................................... 29
Bicycle Volumes ................................................................................................................................................................................. 31
LEVEL OF SERVICE ANALYSIS ...................................................................................................................... 33
Methodology ...................................................................................................................................................................................... 33
Automobile .......................................................................................................................................................................... 33
Multi-Modal Level of ServIce ....................................................................................................................................... 37
Level of Service Evaluation ............................................................................................................................................................ 41
Roadway Level of Service .............................................................................................................................................. 41
Intersection Level of Service ......................................................................................................................................... 42
Transit Level of Service……………………………………………………………………………………………………………...…45
Bicycle Level of Service ................................................................................................................................................... 49
Pedestrian Level of Service ........................................................................................................................................... 53
CONCLUSION ................................................................................................................................................ 57
Appendices
Appendix A: Proposed Mobility Concept Figures
Appendix B: Land Use Assumptions
Appendix C: Model Volumes
Appendix D: Post-Processor Spreadsheets
Appendix E: MXD Model Results
Appendix F: Intersection Level of Service Worksheets and Signal Warrants
Appendix G: Transit Level of Service Worksheets
Appendix H: Bicycle Level of Service Worksheets
Appendix I: Pedestrian Level of Service Worksheets
Appendix J: Planning-Level Cost Estimates
2

Euclid Avenue Corridor Master Plan – Future Multi-Modal Conditions Report
February 28, 2014
List of Figures
Figure 1: Projected Roadway Geometrics and Daily Traffic Volumes Under Buildout of the Preferred Plan 25
Figure 2: Projected Lane Configurations and Traffic Volumes Under Buildout of the Preferred Plan............. 26
Figure 3: Future Pedestrian Peak Hour Volumes .................................................................................................................. 30
Figure 4: Future Bicycle Peak Hour Volumes .......................................................................................................................... 32
Figure 5: Future Roadway and Intersection LOSTransit Level of Service..................................................................... 44
Figure 6: Future Transit LOS (AM Peak) .................................................................................................................................... 47
Figure 7: Future Transit LOS (PM Peak) .................................................................................................................................... 48
Figure 8: Future Bicycle LOS (AM Peak) .................................................................................................................................... 51
Figure 9: Future Bicycle LOS (PM Peak) .................................................................................................................................... 52
Figure 10: Future Pedestrian LOS (AM Peak) .......................................................................................................................... 55
Figure 11: Future Pedestrian LOS (PM Peak) .......................................................................................................................... 56
List of Tables
Table ES-1: Summary of Future Conditions Euclid Avenue Corridor LOS Analysis ………………………………….... 8
Table 1: Future Transit Daily Boardings and Alightings (Summary) .............................................................................. 28
Table 2: Level of Service Definitions .......................................................................................................................................... 34
Table 3: City of San Diego Circulation Element Roadway Classifications and LOS Standards ........................... 35
Table 4: Signalized Intersection Level of Service Criteria .................................................................................................. 36
Table 5: Unsignalized Intersection Level of Service Criteria ............................................................................................. 37
Table 6: Multi-modal LOS Letter Grade Numerical Equivalents ..................................................................................... 38
Table 7: Existing and Future Roadway Segment LOS Results .......................................................................................... 41
Table 8: Existing and Future Intersection LOS Results ........................................................................................................ 43
3

Euclid Avenue Corridor Master Plan – Future Multi-Modal Conditions Report
February 28, 2014
Table 9: Existing and Future Transit AM Peak Hour LOS Results ................................................................................... 45
Table 10: Existing and Future Transit PM Peak Hour LOS Results ................................................................................. 46
Table 11: Existing and Future Transit Bicycle AM Peak Hour LOS Results .................................................................. 49
Table 12: Existing and Future Bicycle PM Peak Hour LOS Results ................................................................................. 50
Table 13: Existing and Future Pedestrian AM Peak Hour LOS Results ......................................................................... 53
Table 14: Existing and Future Pedestrian PM Peak Hour LOS Results ......................................................................... 54
4

Euclid Avenue Corridor Master Plan – Future Multi-Modal Conditions
February 28, 2014
EXECUTIVE SUMMARY
The Euclid Avenue Corridor Master Plan seeks to improve the quality of life and support the economic
vitality of the Euclid Avenue project area by promoting a multi-modal transportation system that is
integrated with land use planning and urban design. This Corridor Master Plan is being developed in
coordination with the Encanto Community Plan update and is an integral feature of that process.
This report describes the recommended transportation-related improvements for enhancing the safety
and efficiency of moving pedestrians, bicyclists, transit, and vehicles. It also provides the technical analysis
of the recommended improvements to the circulation system and documents the potential effects on
circulation as a result of implementation of the Corridor Master Plan.
PROJECT SETTING
Euclid Avenue is a major corridor located within the Encanto Community Planning Area in the City of San
Diego. The Encanto Neighborhoods are located east of Downtown, and bounded by Mid-City to the
north, Southeastern San Diego Community Planning Area to the west, the City of Lemon Grove to the
east, Skyline-Paradise Hills to the southeast, and National City to the South. For the purposes of this
Master Plan development, the project area for this corridor is identified as Euclid Avenue between State
Route 94 and Guymon Street, and the study area extends from Federal Boulevard to Market Street.
The Euclid Avenue Corridor has excellent local and regional transportation access via the freeway and
public transportation. However, the current design and characteristics of Euclid Avenue favor vehicles. It is
a busy four-lane roadway that presently has segments that do not adequately accommodate pedestrians
and bicyclists. The travel conditions and deficiencies of these facilities are described below to provide
context for the proposed improvements recommended to complement the high degree of existing
regional transportation access.
The multi-modal Euclid Transit Station located on the southwest quadrant of the intersection of Euclid
Avenue and Market is within a ½-mile walk of the Hilltop Drive/Euclid Avenue intersection and includes
light rail access and serves as a hub for several MTS bus routes in the area. The Euclid Transit Station is
among the busiest stops of the Orange Line Trolley line which connects the Santa Fe Depot in downtown
San Diego to the City of El Cajon.
5

Euclid Avenue Corridor Master Plan – Future Multi-Modal Conditions
February 28, 2014
GOALS AND OBJECTIVES
As described by the goals and policies of the San Diego General Plan that apply to the study area, a major
aspect of the Master Plan is to create a comprehensive and interconnected multi-modal circulation system
that supports the convenient and efficient movement of all modes (pedestrians, bicyclists, transit and
vehicles) that travel along the corridor and to enhance safety and community mobility. Specifically, the
recommended transportation-related improvements were based on the following mobility objectives:
• Establish a comprehensive and interconnected mobility network that shifts the project area’s
predominately auto-oriented character to be more accommodating of pedestrians, bicyclists, and
transit riders.
• Maximize the utilization of the existing curb-to-curb geometry as an interim solution
• Expand the curb-to-curb geometry as a long-term solution and as underutilized and vacant
parcels on the west side of Euclid Avenue are developed
• Provide enhanced pedestrian crossing points along Euclid Avenue at every intersection with
treatments based on applicable warrants
• Provide additional safety measures (i.e. shorter crossing distances, reduction in conflict points,
signal installations, etc.) in areas projected to have a high level of pedestrian activity or across
high-volume and/or high-speed roadways
• Ensure adequate pedestrian access to the numerous transit stops/stations throughout the
corridor
• Ensure a safer and more comfortable environment for waiting transit patrons by providing
additional amenities at transit stops/stations throughout the corridor
• Implement facilities and amenities to encourage bicycle ridership along the corridor
These guiding principles and objectives were used during the Master Plan planning process where
numerous geometric alternatives were developed, analyzed on a preliminary basis and vetted by the
project team, City staff, and the community. Through this process, the Preferred Interim Mobility Option
and Preferred Long-term Mobility Option were developed for the Euclid Avenue Corridor Master Plan.
6

Euclid Avenue Corridor Master Plan – Future Multi-Modal Conditions
February 28, 2014
ELEMENTS OF THE MASTER PLAN
To improve walkability, bicycling, and transit integration into the street network and still accommodate
the future needs of vehicles, the Master Plan proposes the following main streetscape improvements:
• Re-size and widen the existing roadway to provide a balanced right-of-way with designated
facilities for each mode. This includes the construction of wider sidewalks, a landscaped parkway
and buffered bicycle lanes along the corridor.
• Provide a more complete and interconnected network by implementing the Hilltop Drive
connection. This connection will help overcome the existing local mobility barrier by formally
providing direct access to the western side of Hilltop Drive from Euclid Avenue.
• Direct traffic associated with future development along Euclid Avenue toward side-streets and
alley ways, whenever possible. Future improvements to parking on the side streets and site
design will influence the flow of traffic and should be considered with all future development
applications.
The final locations, design, and timing of all the proposed street network improvements will depend on
future development, community needs, further engineering study, and available funding.
MOBILITY ASSESSMENT FINDINGS
Various methodologies were used to evaluate the travel experience along the corridor with the proposed
land use and roadway network changes. A level of service (LOS) rating was determined for each mode of
travel based on specific evaluation criteria established for each of the modes along the study corridor. In
general, roadway and intersection LOS is based on the facility operations, while LOS evaluations for
pedestrian, bicycle, and transit facilities are based on user perception of the traveling experience on the
subject facilities. Table ES-1 summarizes the results of the multimodal level of service analysis conducted
for the future year conditions along the corridor.
7

Euclid Avenue Corridor Master Plan – Future Multi-Modal Conditions
February 28, 2014
Table ES-1: Summary of Future Conditions Euclid Avenue Corridor LOS Analysis
AM PM
Intersection3 Transit NB/SB
Pedestrian NB/SB
Bicycle NB/SB
Intersection Transit NB/SB
Pedestrian NB/SB
Bicycle NB/SB
Federal Avenue to SR-94 WB Ramps1
A/C C/D D/E2 A/C C/D D/E2
@SR-94 WB Ramps1
A A
SR-94 WB Ramps to SR-94 EB Ramps1
A/A C/C C/C A/A D/C C/C
@SR-94 EB Ramps1
C C
SR-94 EB Ramps to Hilltop Drive1
A/B C/B E2/C A/B C/C E2/C
@Hilltop Drive B B
Hilltop Drive to Lise Avenue
C/A B/B C/C C/A C/C C/C
@Lise Avenue4 A A
Lise Avenue to Guymon Street
A/C B/B D/C A/C B/C D/C
@Guymon Street
A A
Guymon Street to Market Street
B/A B/C D/C B/A C/C D/D
@Market Street E2 E2
1. Portions or the entire intersection or segment area is part of Caltrans right-of-way. Therefore, any proposed changes or enhancements at this location are subject for review and approval by Caltrans.
2. Bold letter indicates unacceptable LOS E or F. 3. All study intersections are assumed to be signalized in the future. 4. In the future, intersection meets peak hour traffic signal warrants and is therefore assumed to be signalized. Source: Fehr & Peers, February 2014
Overall, these recommended improvements will create a more desirable pedestrian and bicycle
environment while still balancing the needs of moving and parked vehicles. The intersection of Euclid
Avenue and Market Street is forecast to operate at deficient LOS during the peak hours, which is a result
of the trolley operations at the Euclid Avenue crossing. By 2030, trolley frequency will double with
headways reducing from 15 minutes between trains to 7.5 minutes between trains. Although the
8

Euclid Avenue Corridor Master Plan – Future Multi-Modal Conditions
February 28, 2014
increased frequency will benefit transit passengers on the Orange Line, the increased gate closures at
Euclid Avenue and Market Street will affect the level of service of the intersection.
LOS E conditions also occur for bicycle along the corridor approaching the SR-94 interchange in both the
northbound and southbound direction. The LOS E condition is primarily a result of high peak hour traffic
and speeds at these segments, as well as increased conflicts with other modes.
As future development occurs in the corridor, it is recommended that the City of San Diego continue to
monitor the pedestrian and vehicular volumes to determine the correct time to implement the proposed
enhanced crosswalk and traffic signal improvements. The City should also work with SANDAG and MTS to
monitor transit ridership throughout the Euclid Avenue corridor to determine the appropriate time to
increase bus frequencies and whether or not additional transit service is needed.
9

Euclid Avenue Corridor Master Plan – Future Multi-Modal Conditions
February 28, 2014
INTRODUCTION
The Euclid Avenue Corridor Master Plan seeks to improve the quality of life and support the economic
vitality of the Euclid Avenue project area by promoting a multi-modal transportation system that is
integrated with land use planning and urban design. This Corridor Master Plan is being developed in
coordination with the Encanto Community Plan update and is an integral feature of that process.
This report describes the recommended transportation-related improvements for enhancing the safety
and efficiency of moving pedestrians, bicyclists, transit, and vehicles. It also provides the technical analysis
of the recommended improvements to the circulation system and documents the potential effects on
circulation as a result of implementation of the Corridor Master Plan.
10

Euclid Avenue Corridor Master Plan – Future Multi-Modal Conditions
February 28, 2014
MULTI-MODAL CONTEXT AND CONDITIONS
Euclid Avenue is a major corridor located within the Encanto Community Planning Area in the City of San
Diego. The Encanto Neighborhoods are located east of Downtown, and bounded by Mid-City to the
north, Southeastern San Diego Community Planning Area to the west, the City of Lemon Grove to the
east, Skyline-Paradise Hills to the southeast, and National City to the South. For the purposes of this
Master Plan development, the project area for this corridor is identified as Euclid Avenue between State
Route 94 and Guymon Street (where changes to land uses and infrastructure are proposed), and the study
area extends from Federal Boulevard to Market Street, where the overall impacts of the project are
evaluated.
The Euclid Avenue Corridor has excellent local and regional transportation access via the freeway and
public transportation. However, the current design and characteristics of Euclid Avenue favor vehicles. It is
a busy four-lane roadway that presently has segments that do not adequately accommodate pedestrians
and bicyclists. The travel conditions and deficiencies of these facilities are described below to provide
context for the proposed improvements recommended to complement the high degree of existing
regional transportation access. (For a complete account of existing conditions, see the April 2013 Euclid
Avenue Corridor Master Plan Existing Conditions Report.)
STREET NETWORK
The corridor’s network of streets serves as the foundation for regional and local circulation. Euclid Avenue
is classified as a Major Roadway in the Southeastern San Diego Community Plan (City of San Diego, 1987,
amended 2009) with a posted speed limit of 35 mph. The right-of-way width is approximately 80 to 100
feet and the curb to curb width ranges from 65 to 70 feet. Within the project area, Euclid Avenue provides
direct access to adjacent land uses, freeway access to State Route 94, and local north-south connectivity
for inter-community trips. Additionally, the existing daily traffic volumes along Euclid Avenue range
between 25,500 and 33,800 vehicles per day (vpd).
East-west local inter-community connectivity is provided by Market Street, a Major roadway in the
Southeastern San Diego Community Plan (City of San Diego, 1987, am. 2009).
State Route 94 (SR-94) that traverses the project area provides regional and citywide access. The eight-
lane freeway generally extends east-west through the City of San Diego and connects to the City of
Lemon Grove and the community of Spring Valley in the County of San Diego. East of Spring Valley, SR-
11

Euclid Avenue Corridor Master Plan – Future Multi-Modal Conditions
February 28, 2014
94 becomes a two-lane rural highway extending southeast towards the US-Mexico border and
intersecting Interstate 8 near the community of Boulevard. In the vicinity of the project area, SR-94
includes a full-access interchange at Euclid Avenue and includes direct and loop ramps.
PUBLIC TRANSIT
The Euclid Avenue Corridor includes several public transit options for local and regional mobility. Public
transit for the project area is provided by the San Diego Metropolitan Transit System (MTS) and consists
of public bus, trolley, and paratransit.
The Master Plan project area is served by MTS Bus Routes 916/917 and 955. Route 916/917 provides
service in a circular pattern between the Euclid Trolley and College Grove, with stops in Oak Park, City
Heights, Lemon Grove, and North Encanto. Route 916 provides clockwise service on weekdays, while
Route 917 serves patrons in the opposite direction on weekdays. Route 916/917 operates at 30-minute
headways before 7:00 pm and at 60-minute headways thereafter. On Saturdays, Route 916/917 operates
at 60-minute headways all day, but no Sunday service is provided by these routes.
Route 955 extends between the 8th Street Trolley Station in National City and San Diego State University
with weekday headways of approximately 15 minutes before 7:30 pm and 30 minutes thereafter. On
Saturdays, Route 955 operates at 20- to 30-minute headways and Sunday service is provided at 30-minute
headways.
The multi-modal Euclid Transit Station located on the southwest quadrant of the intersection of Euclid
Avenue and Market is within a ½-mile walk of the Hilltop Drive/Euclid Avenue intersection and includes
light rail access and serves as a hub for several MTS bus routes in the area. The Euclid Transit Station is
among the busiest stops of the Orange Line Trolley line which connects the Santa Fe Depot in downtown
San Diego to the City of El Cajon. The Orange Line Trolley operates at headways of approximately 15
minutes before 8:30 pm and 30 minutes thereafter on weekdays. On Saturdays and Sundays, the Orange
Line operates at 30-minute headways.
Bus and trolley ridership is relatively high in the project area. According to 2010 transit passenger load
information obtained from SANDAG, 6,741 boardings and 6,630 alightings occurred daily at all transit
stops between the Euclid Trolley Station and Federal Boulevard. The Euclid Trolley Station stop at Euclid
Avenue and Market Street has the highest boarding and alighting activity with 12,705 total boardings and
alightings related to the Orange Line Trolley and local buses. The Euclid Avenue and Federal Boulevard
bus stop has the highest bus passenger load at 451 daily alighting/boardings.
12
Euclid Avenue Corridor Master Plan – Future Multi-Modal Conditions
February 28, 2014
BICYCLE FACILITIES
Bicycling is an environmentally-friendly mode of transportation that enhances both personal and social
well-being. Bicycling is recognized as an integral component of the Encanto Neighborhood Community’s
transportation system, today and in the future. It is an important travel mode and a key component of a
seamless multi-modal transportation system. In addition to mobility, this mode of travel provides many
public access, health, and economic benefits.
Based upon the City of San Diego’s Bicycle Master Plan Update (City of San Diego, 2011), no existing
bicycle facilities were identified on Euclid Avenue. However, field observations conducted in 2013 revealed
bike route signage and “Share the Road” signage along Euclid Avenue between Federal Avenue and
Market Street. Reflective of the lack of designated facilities, existing bicycle data collected at all of the
project area intersections during the AM and PM peak periods showed that existing bicycle usage along
Euclid Avenue is very low, with fewer than five bicyclists traveling along the corridor during each of the
peak hours.
PEDESTRIAN FACILITIES
As described in the City of San Diego’s Pedestrian Master Plan (City of San Diego, 2006), there is a broad
range of benefits for making more walkable communities that, when combined all together create a
compelling reason for improving the City’s walking environment through the implementation of new or
enhanced pedestrian projects. For instance, walking is another environmentally friendly mode of
transportation that enhances both personal and social well-being. In addition to mobility, this mode of
travel also provides many public access, health and economic benefits. Safe, convenient, attractive, and
well-designed pedestrian facilities are essential if this mode is to be properly accommodated and
encouraged. Additionally, the Pedestrian Master Plan also identified that 0.75% of residents living in the
Encanto Neighborhoods walk to work as their primary means of transportation (City of San Diego, 2006).
The existing land uses, neighborhood density and scale, as well as the street configuration along the
southern portion of Euclid Avenue near Market Street are conducive to pedestrian activity. Within or
adjacent to the Euclid Avenue Corridor are land uses, such as a transit hub, storefronts, and public uses
(i.e. a school and library), that all generate pedestrian traffic.
Frontage along both sides of the project area is primarily residential with sidewalk widths that range
between approximately five feet to eight feet. Under existing conditions, Euclid Avenue south of Guymon
13

Euclid Avenue Corridor Master Plan – Future Multi-Modal Conditions
February 28, 2014
Street includes sidewalks and several amenities for pedestrians and transit patrons. North of Guymon
Street, Euclid Avenue has contiguous sidewalks that are five feet wide on both sides of the street and on-
street parking, which provides a buffer between pedestrians and motorists. At the Hilltop Drive/Euclid
Avenue intersection, there is an informal path linking Euclid Avenue to the western section of Hilltop Drive
(at Hal Street) that students use as a shortcut to access Gompers Preparatory Academy, a charter high
school.
Existing pedestrian data were collected at all of the project area intersections during the AM/PM peak
periods. In the project area, pedestrian intersection counts are the highest at Euclid Avenue and Guymon
Street, which provides access to Horton Elementary School and is less than a ¼ -mile walk from the Euclid
Trolley Station, as well as the commercial and institutional uses located around the Euclid Avenue/Market
Street intersection. Lower pedestrian activity exists along Euclid Avenue segments north of Guymon,
where land uses are predominantly lower-density residential single-family dwelling units or vacant parcels.
All the intersections along Euclid Avenue are controlled by traffic signals or stop signs on the side-street.
There no marked crosswalks at the signalized intersection of Euclid Avenue and Federal Boulevard, while
all the other remaining signalized study intersections along Euclid Avenue have marked crosswalks
provided across all legs. These include:
• Market Street (with marked crosswalks at all approaches)
• Guymon Street (with marked crosswalks at all approaches)
• Hilltop Drive (with marked crosswalks at all approaches)
All of the remaining intersections on Euclid Avenue in the project area are side-street stop controlled, with
vehicular traffic on Euclid Avenue uncontrolled and marked crosswalks not provided across Euclid,
including:
• Lise Avenue
• SR-94 Eastbound Ramps
• SR-94 Westbound Ramps
14
Euclid Avenue Corridor Master Plan – Future Multi-Modal Conditions
February 28, 2014
PARKING
An inventory of all on-street parking spaces within the project area was conducted in April 2013. The area
consisted of Euclid Avenue between Market Street and Federal Boulevard. Free on-street parallel parking
with no time restrictions is provided on both sides of the roadway between Market Street and Hilltop
Drive and is permitted on the east side of the roadway between Hilltop and Geneva Avenue. Parking is
prohibited on the west side of the street on this segment because of the merging activity by vehicles
exiting eastbound SR-94 and traveling south on Euclid Avenue. Approximately 58 on-street parking
spaces are provided on Euclid Avenue in the project area.
On-street parking demand observations were conducted on April 3, 2013 during the AM and PM peak
commute periods. Observations showed that existing on-street parking is underutilized as parking
occupancy on segments between streets during both the AM and PM peak periods was relatively low (0%
to 15%) and most segments had no cars parked or at most two cars.
The City of San Diego’s Street Design Manual (City of San Diego, 2002) suggests that angled parking may
be implemented on one side of the road along residential local streets or commercial streets if the curb to
curb width is 44 feet or greater. Angled parking may be implemented on both sides of the street if the
curb to curb width is 52 feet or greater. The Master Plan for Euclid Avenue will remove the on-street
parking along the west side of the corridor. Although current parking demand is low, it is possible that
future demands for parking could increase. Therefore, as improvements along the corridor are
implemented, considerations should be made for restriping the intersecting streets to provide additional
parking where feasible or providing an appropriate supply with new development.
15

Euclid Avenue Corridor Master Plan – Future Multi-Modal Conditions
February 28, 2014
MULTI-MODAL STRATEGY AND IMPROVEMENTS
As described by the goals and policies of the San Diego General Plan that apply to the study area, a major
aspect of the Master Plan is to create a comprehensive and interconnected multi-modal circulation system
that supports the convenient and efficient movement of all modes (pedestrians, bicyclists, transit and
vehicles) that travel along the corridor and to enhance safety and community mobility. Specifically, the
recommended transportation-related improvements were based on the following mobility objectives:
• Establish a comprehensive and interconnected transportation network that shifts the pre-
dominantly auto-oriented character of the project area to other modes
• Maximize the utilization of the existing curb-to-curb geometry as an interim solution
• Expand the curb-to-curb geometry as a long-term solution and as underutilized and vacant
parcels on the west side of Euclid Avenue are developed
• Provide enhanced pedestrian crossing points along Euclid Avenue at every intersection with
treatments based on applicable warrants
• Provide additional safety measures (i.e. shorter crossing distances, reduction in conflict points,
signal installations, etc.) in areas projected to have a high level of pedestrian activity or across
high-volume and/or high-speed roadways
• Ensure adequate pedestrian access to the numerous transit stops/stations throughout the
corridor
• Ensure a safer and more comfortable environment for waiting transit patrons by providing
additional amenities at transit stops/stations throughout the corridor
• Implement facilities and amenities to encourage bicycle ridership along the corridor
These guiding principles and objectives were used during the Master Plan planning process where
numerous geometric alternatives were developed, analyzed on a preliminary basis and vetted by the
project team, City staff, and the community. Through this process, the Preferred Interim Mobility Option
and Preferred Long-term Mobility Option were developed for the Euclid Avenue Corridor Master Plan and
the details of their concepts, by mode, are described in this section. The corresponding graphics
illustrating these proposed mobility concepts and recommendations are provided in Appendix A.
It should be noted that the timing of all recommended improvements will be contingent on future
development within the corridor, and will be subject to further engineering study prior to implementation.
Additionally, as development occurs along Euclid Avenue, the movements of all modes (auto, pedestrian,
16

Euclid Avenue Corridor Master Plan – Future Multi-Modal Conditions
February 28, 2014
bicycle and transit) should be monitored to determine the appropriate time to implement each of the
recommended improvements.
KEY IMPROVEMENTS
STREET NETWORK
The Euclid Avenue Corridor was originally designed to favor automobiles given the current right-of-way
allocation, and one of the major issues along this busy major street is the limited accommodation for
other mobility choices. Under existing conditions, the wide curb-to-curb width makes it difficult for
pedestrian crossings in the project area, especially at uncontrolled intersections including the SR-94
ramps and Lise Avenue. It can be difficult for pedestrians to identify appropriate gaps in traffic to cross
the entire width of Euclid Avenue because of the relatively high traffic speeds and volumes. Additionally,
no separate right-of-way is reserved and designated for bicyclists, and so bicyclists traversing through the
corridor are forced to share the road with vehicles. This limits the number of cyclists, especially those
riders that are not as confident and are more risk averse than experienced commuter cyclists. Accordingly,
one of the main objectives of the Master Plan is to establish a comprehensive and interconnected mobility
network that shifts the project area’s predominately auto-oriented character to be more accommodating
of pedestrians, bicyclists, and transit riders.
To improve walkability, bicycling, and transit integration into the street network and still accommodate
the future needs of vehicles, the Master Plan proposes the following streetscape improvements:
• Re-size and widen the existing roadway to provide a balanced right-of-way with designated
facilities for each mode.
• Provide a more complete and interconnected network by implementing the Hilltop Drive
connection. This connection will help overcome the existing local mobility barrier by formally
providing direct access to the western side of Hilltop Drive from Euclid Avenue.
• Direct traffic associated with future development along Euclid Avenue to take access from side-
streets and alley ways, whenever possible.
The final locations, design, and timing of all the proposed street network improvements will depend on
future development, community needs, further engineering study, and available funding.
17

Euclid Avenue Corridor Master Plan – Future Multi-Modal Conditions
February 28, 2014
MULTI-MODAL ENHANCEMENTS
The focused mixed-use development anticipated within the project area, especially along the west side of
Euclid, is expected to increase bicycle and pedestrian activity along the corridor. This, in association with
the projected increase in vehicular traffic, would likely increase the potential for conflicts with various
modes of travel, resulting in a higher potential for conflicts and collisions.
Therefore, the Master Plan includes facility enhancements within the Euclid Avenue project area to provide
a safer environment and interaction amongst the transportation modes. As illustrated in the Euclid
Avenue Mobility Concept diagrams in Appendix A, these enhancements include:
• Curb bulb-outs at intersections to reduce the effective crossing distance and curb-to-curb width
• Enhanced crosswalks to improve their visibility
• Implementation of a traffic signal at Lise Avenue
• Reduced travel lane widths to moderate vehicle speeds and accommodate bicycle facilities
• Restriction of driveway access along Euclid Avenue to reduce curb cuts and turning movements
• Installation of buffers between pedestrian, bicycle, and vehicular rights-of-way to distinguish
between designated pedestrian, bicycle, and vehicular zones
Specific details of the safety enhancements listed above are described in respective sub-sections to follow.
Additionally, the City of San Diego and Caltrans are currently evaluating options to improve operations of
the SR-94 interchange, which will also include safety enhancements for motorists, bicyclists, and
pedestrians. These options include short-term restriping, signalization, ramp alignment modifications plus
long-term reconfiguration of the interchange that will further address safety and provide acceptable
vehicle LOS.
PUBLIC TRANSIT
Under existing conditions the project area is well served by transit. It is expected that as the area
continues to develop per the buildout of the Master Plan, the demand for transit use will continue to
increase.
The 2050 SANDAG Regional Transportation Plan (RTP) (SANDAG, 2011) does not mention any specific
planned improvements to the bus routes servicing the Corridor, but does mention general frequency
18

Euclid Avenue Corridor Master Plan – Future Multi-Modal Conditions
February 28, 2014
enhancements for key local bus routes of 15-minute headways all day by 2020 and 10-minute headways
all day by 2035. The RTP also listed as a planned project, the increased frequency and a reduction in peak
period headways along the Orange Line Trolley from 15 minutes to 7.5 minutes in 2030. There is the
potential for future bus service modifications that would complement the proposed 47th Street BRT
station; however, as part of this Master Plan, it is assumed that that no changes in the project area’s bus
operations between existing and future buildout of the Master Plan other than the frequency
enhancements previously mentioned. It is recommended that that a standard set of amenities (i.e.
benches, shelters, trash receptacles, and pedestrian-scale lighting) be provided at all bus stops along
Euclid Avenue project area. These recommended improvements accommodate the projected increase in
ridership and improve the safety and comfort for transit patrons at stops.
Additionally, as the resident and employee population within the corridor increases, it is recommended
that the City of San Diego work with MTS to determine if any additional improvements (i.e. increasing
headways and/or implementation of a new bus route) are necessary to provide better connectivity and
more efficient travel between the Planning Area and other neighborhoods.
BICYCLE FACILITIES
To ensure connectivity to both the local and regional area and to close gaps in the system, future bicycle
facilities are proposed along Euclid Avenue Master Plan Corridor, which is consistent with the City of San
Diego’s Bicycle Master Plan Update (City of San Diego, 2011). Thus, the Interim Mobility Option proposes
to remove on-street parking along the west side of Euclid Avenue and to slightly reduce the width of the
vehicle travel lanes and left-turn lane/median to accommodate the addition of Class II bicycle lanes along
both sides of the Euclid Avenue and within its existing curb-to-curb width. The Interim Mobility Option
specifically proposes the installation of northbound and southbound five-foot bicycle lanes along Euclid
Avenue between Market Street and Geneva Avenue. North of Geneva Avenue, the bicycle facilities will
transition to Class III bicycle facilities enhanced with clear signage and sharrows.
Safe, convenient, attractive and well-designed bicycle facilities are essential if this mode is to be properly
accommodated and encouraged along the Euclid Avenue Corridor with buildout of the Master Plan. The
Long-term Mobility Option proposes the expansion of the street cross-section which would provide an
extra five feet in the curb-to-curb width that can be used to buffer the Class II facilities from vehicular
traffic. Under the Long-term Mobility Option, all the bicycle facilities within the entire project area are
proposed to be designated as Class II with a two-foot buffer between the travel lane and the bicycle lane,
as an extra safety measure and to facilitate convenient bicycle travel.
19

Euclid Avenue Corridor Master Plan – Future Multi-Modal Conditions
February 28, 2014
Secure bicycle parking is essential to ensuring that bicycling is a convenient travel mode. This includes
both on-street bicycle parking to provide access to public facilities, stores, and services, as well as off-
street bicycle parking within housing developments and offices for residents and employees/visitors,
respectively. The Master Plan recommends that as part of the public right-of-way and streetscape
improvements, public bicycle racks be installed at key points along the Euclid Avenue Corridor (i.e. near
commercial uses, at transit stops, and other public gathering places) and adequate private bicycle parking
will be required within any non-residential developments based on the bicycle parking standards included
in the City of San Diego’s Municipal Code.
PEDESTRIAN FACILITIES
Presently the sidewalks along the Euclid Avenue Master Plan Corridor appear uninviting as they lack
enticing landscape and other pedestrian enhancements. To achieve a vibrant, walkable environment and a
multi-modal corridor in the future, a pleasant, uniform streetscape and public realm with safe and
convenient access to transit and uses needs to be established. Based on projected land uses, transit stop
locations, and projected volumes the Master Plan recommends the following pedestrian-related
improvements, which are illustrated in the Euclid Avenue Mobility Concept diagrams for the interim and
long-term conditions:
• Interim Enhancements
o Installation of a high visibility crosswalk and a Rectangular Rapid Flash Beacon (RRFB)
along the south leg of Euclid Avenue and Lise Avenue as an interim pedestrian
connectivity improvement provided applicable warrants are met; alternatively, install a
high visibility crosswalk across the north leg of the intersection and construct a
pedestrian refuge area using raised medians in the center of the roadway. With either
configuration, a curb extension could be constructed on the east side of Euclid Avenue as
long it does not conflict with an existing driveway.
o Enhance existing paved crosswalks by painting the borders of each crosswalk at the Euclid
Avenue/Hilltop Drive and Euclid Avenue/Guymon Street intersections to increase visibility
of the pedestrian facilities.
• Long Term Enhancements
o The expanded right-of-way under the buildout of the Master Plan allows for
opportunities for widened sidewalks and the inclusion of urban parkways, which provide
greater pedestrian comfort and an additional buffer.
o Curb bulb-outs at all study intersections where feasible (i.e. on the east side of Euclid and
side-streets only) to reduce the effective crossing distance for pedestrians, improve
20

Euclid Avenue Corridor Master Plan – Future Multi-Modal Conditions
February 28, 2014
in calming traffic and reducing cut through traffic on either side of the corridor. Streets with curb to curb
width of 44 feet or greater should be considered for angled parking modifications.
LIGHTING
Street lighting is an important part of mobility infrastructure by increasing the visibility of pedestrians,
bicyclists and automobiles along the corridor. Based on a preliminary review of existing lighting on Euclid
Avenue, improvements could be made to street lighting especially near intersections where numerous
conflicting movements occur among the various travel modes. The existing light locations and proposed
new light locations are indicated on the mobility concept diagrams (see Appendix A), and the future
enhancements are proposed to meet the following general requirements:
1. Fulfill the recommendations of the San Diego Street Design Manual, Street Lighting Chapter,
which includes specific requirements for intersection lights and mid-block lights.
2. In general, for Euclid Avenue, the current requirement per the Street Design Manual is for four
lights per intersection (two lights at 250-watt and two lights at 150-watt high pressure sodium).
3. Mid-block lighting for Euclid Avenue is intended to occur at intervals not to exceed 150 feet on
both sides of the street per the Street Design Manual.
4. Mid-block block lighting is currently prescribed to be Type III cutoff, 250-watt high pressure
sodium.
5. Proposed lighting is based on a review of the spacing of existing lights and where new light poles
are generally needed. Future lighting plans will need to assess overall wattage and condition of
existing lights and overall levels of illumination needed throughout the street corridor.
6. Future lighting plans will need to be verified with any subsequent Street Design Manual Updates.
PLANNING-LEVEL COST ESTIMATE
A planning-level cost estimate was prepared based on the improvements and enhancements described in
the Preferred Long-term Mobility Option for the Euclid Avenue Corridor Master Plan (see Appendix J).
The unit costs for improvements used in the cost estimate are comparable to the unit costs used in similar
projects in the San Diego area. It is estimated that intersection-level improvements would total
approximately $743,000 and segment-level improvements would total approximately $232,000 for a
subtotal of $975,000. After an application of a 30% contingency and additional budget for design-related
expenses (another 30% of subtotal) the grand total for the improvements and enhancements of the
Preferred Long-term Mobility Option is approximately $1.6 million dollars.
22
Euclid Avenue Corridor Master Plan – Future Multi-Modal Conditions
February 28, 2014
in calming traffic and reducing cut through traffic on either side of the corridor. Streets with curb to curb
width of 44 feet or greater should be considered for angled parking modifications.
LIGHTING
Street lighting is an important part of mobility infrastructure by increasing the visibility of pedestrians,
bicyclists and automobiles along the corridor. Based on a preliminary review of existing lighting on Euclid
Avenue, improvements could be made to street lighting especially near intersections where numerous
conflicting movements occur among the various travel modes. The existing light locations and proposed
new light locations are indicated on the mobility concept diagrams (see Appendix A), and the future
enhancements are proposed to meet the following general requirements:
1. Fulfill the recommendations of the San Diego Street Design Manual, Street Lighting Chapter,
which includes specific requirements for intersection lights and mid-block lights.
2. In general, for Euclid Avenue, the current requirement per the Street Design Manual is for four
lights per intersection (two lights at 250-watt and two lights at 150-watt high pressure sodium).
3. Mid-block lighting for Euclid Avenue is intended to occur at intervals not to exceed 150 feet on
both sides of the street per the Street Design Manual.
4. Mid-block block lighting is currently prescribed to be Type III cutoff, 250-watt high pressure
sodium.
5. Proposed lighting is based on a review of the spacing of existing lights and where new light poles
are generally needed. Future lighting plans will need to assess overall wattage and condition of
existing lights and overall levels of illumination needed throughout the street corridor.
6. Future lighting plans will need to be verified with any subsequent Street Design Manual Updates.
PLANNING-LEVEL COST ESTIMATE
A planning-level cost estimate was prepared based on the improvements and enhancements described in
the Preferred Long-term Mobility Option for the Euclid Avenue Corridor Master Plan (see Appendix J).
The unit costs for improvements used in the cost estimate are comparable to the unit costs used in similar
projects in the San Diego area. It is estimated that intersection-level improvements would total
approximately $690,000 and segment-level improvements would total approximately $197,000 for a
subtotal of $887,000. After an application of a 15% contingency and additional budget for design-related
expenses (another 15% of subtotal) the grand total for the improvements and enhancements of the
Preferred Long-term Mobility Option is approximately $1.2 million dollars.
22

Euclid Avenue Corridor Master Plan – Future Multi-Modal Conditions
February 28, 2014
FUTURE YEAR VOLUMES
A refined SANDAG Series 12 traffic model was prepared for the Encanto Community Plan update by
Chen-Ryan Associates and SANDAG. This model provided future daily traffic volumes which were used to
assess traffic and circulation outcomes for the Euclid Avenue study and reflect traffic conditions resulting
from the full implementation of the Master Plan under Future Year 2035 conditions. This section reviews
and documents the sources and methodologies utilized to develop the future year transportation
volumes, for all modes, under buildout of the proposed Corridor Master Plan.
STREET NETWORK
Future Year traffic volumes for roadway and intersection locations were derived from the SANDAG Series
12 Transportation Forecast per the City of San Diego’s Small Study Area Traffic Modeling Process (April
2012). The forecasting task was performed by another consultant (Chen-Ryan Associates) in conjunction
with SANDAG, and the adjusted forecast results were provided to Fehr & Peers for use in this study. As
part of the modeling process, a thorough review of model inputs was completed for the Base Year and
Future Year scenarios. This review included the following:
• Circulation network
• Number of lanes on roadways and approach lanes at signalized intersections
• Traffic controls
• Street classification
• Base year traffic volumes
• Roadway speed limits
• Zone connector locations and granularity
• Traffic Analysis Zones
• City approved model land use and trip generation inputs (land use description, unit type,
quantity, and City of San Diego trip generation rates)
Using the input data outlined above, SANDAG calibrated/validated the base year model to meet the
standards set forth by the City of San Diego.
23

Euclid Avenue Corridor Master Plan – Future Multi-Modal Conditions
February 28, 2014
The model assumed the 2035 Revenue Constrained RTP Highway Network, which includes network
changes associated with the SR-94 redesign along with other planned regional highway and transit
service improvements. The Future Year Model was developed based on the calibrated Base Year Model
with the following assumptions:
• Buildout of the proposed Master Plan land uses within the project study area (Master Plan land
use assumptions are provided in Appendix B).
• Reasonably expected roadway network with the SR-94 Alternative 1
• Year 2035 land uses outside of the study area that may affect circulation in the corridor
• Year 2035 roadway/transit network outside of the study area
The land use information contained within the model reflects the proposed future uses for the entire
Encanto Community Plan area. The model inputs described above were reviewed by Chen-Ryan
Associates and approved by City staff prior to running the model forecasts used to derive Future Year
volumes.
The Future Year forecast daily volumes were reviewed and adjusted by the project team based on existing
travel patterns, anticipated growth within the study area, projected access points, and overall regional
growth. In general, the daily volumes from the model were used directly for this analysis. Due to the
regional nature of the traffic model, many of the local streets that intersect the Euclid Avenue corridor are
not included in the model network. As such, future volumes for these facilities were forecasted by
applying a growth factor to existing volumes where the growth factor was determined from data on
adjacent roadway segments. The final adjusted forecast daily traffic volumes along Euclid Avenue are
illustrated in Figure 1, and the associated volumes and adjustments are included in Appendix C.
Using the Furness Method, the forecasted ADT volumes were then used to calculate peak hour
intersection turning movement volumes under buildout conditions of the Master Plan, which are
displayed in Figure 2. The Furness Method balances the inbound and outbound traffic flows on each
approach to the intersection based on existing conditions peak hour volumes, existing daily volumes and
future daily volumes. Intersection volumes were then reviewed and adjustments were made to ensure
reasonable growth on all legs of the intersection and that inbound and outbound volumes were balanced
within 10% of the total link volume. Peak hour volume calculations and adjustment process spreadsheets
for each intersection are included in Appendix D.
24

!(T
MARKET ST EUCLID
AV
HILLTOP DR
A ST
ROSWELL ST
GUYMON ST
GENEVA AV
GLEN RD
MARILOU RD
LENOX DR
WINSTON
DR
LISE AV
NARANJA ST
49TH S
T
48TH S
T
ELWOOD
AV
DATE ST
50TH S
T
SR-94 RA
SELMA PL
CRESTON DR
BEVERLY ST
MARY L
OU ST
HAL ST
DERBY
ST
LYON ST
HANOVE
R ST
UVAS ST
CAROLI
NA LN
DASSCO
ST
MELROSE PL
KENWOOD ST
HALLMARK WY
ZIRCON ST
DASSCO CT
LACE PL
49TH S
T
WB ON-RAMP
51ST ST
ALLEY
EB OFF-RAMP
SR-94 WB
ON RA
HILLTOP DR
48TH S
T
DATE ST
BEECH ST
EB ON-
RAMP
FEDERAL BL
54TH S
T
WB ON-RAMP
DUVAL ST
DUVAL
ST
ALTADE
NA AVLYON ST
BEECH ST
SR-94 RA
PRIVATE RD
34,20
031
,700
40,40
032
,000
32,60
036
,100
0 0.05 0.1Miles
Source:Fehr & Peers (2014)
February 2014
Figure 1: Projected Roadway Geometrics & Daily Traffic Volumes Under Buildout of the Preferred PlanEuclid Ave
´
94
!(T Trolley Station
Project Area
Trolley
4-Lane Roadway5-Lane RoadwayDaily Traffic VolumesX,XXX

g
ace
ace
g
aace
ace ace
ae acc
acc
acece
d ce
72 (3
7)1,
227
(1,0
81)
88 (3
9)1,
222
(1,1
30)
302
(199
)66
4 (6
33)
133
(173
)
116
(103
)99
8 (8
64)
46 (6
2)
61 (5
0)73
1 (1
,405
)
152
(184
)68
6 (1
,357
)
97 (1
87)
803
(1,5
14)
68 (1
68)
81 (6
5)70
3 (1
,038
)15
1 (2
59)
37 (48)25 (24)62 (48)
42 (101)87 (349)
127 (256)
62 (60)62 (60)
26 (40)61 (29)
311 (315)328 (139)151 (164)
29 (43)19 (22)49 (43)
cc1,162
(1,6
52)
af 206 (168)136 (186)
ccf
929
(1,2
27)
745
(431
)
acc583
(750
)12
0 (2
00)
aaf 388 (742)
495 (976)
ce
1,06
2 (7
33)
160
(160
)
³ê
³ê
!"$
!"$
³ê
³ê
³ê
³ê
4. Lise Ave & Euclid Ave3. Hilltop Dr & Euclid Ave
6. Market St & Euclid Ave5. Guymon St & Euclid Ave
2. Euclid Ave & SR-94 EB Ramps1. Euclid Ave & SR-94 WB Ramps
Guymon St
Eucl
id A
ve
Market St
Eucl
id A
veEu
clid
Ave
Hilltop Dr
Eucl
id A
ve
Lise Ave
Eucl
id A
ve
SR-94 WB On Ramp
Eucl
id A
ve
!(T
MARKET ST EUCLID
AV
HILLTOP DR
A ST
GUYMON ST
GENEVA AV
MARILOU RD
LENOX DR
WINSTON
DR
LISE AV
NARANJA ST
ELWOOD
AV
50TH S
T
MARY L
OU ST
HAL ST
LYON ST
CAROLIN
A LN
DASSCO
ST
MELROSE PL
HALLMARK WY
DASSCO CT
LACE PL
GROVELAND DR
WB ON-RAMP
51ST ST
EB OFF-RAMP
HILLTOP DR
BEECH ST
EB ON-
RAMP
FEDERAL BL
CASTANA ST
WB ON-RAMP
ALTADEN
A AV
GROVELAND DR
1
2
3
4
5
6
XX Study Intersection
Source:Fehr & Peers (2014)
February 2014
Figure 2: Projected Lane Configurations and Traffic Volumes Under Buildout of the Preferred PlanEuclid Ave
´!(T Trolley Station
Project Area
Trolley 0 0.05 0.1 Miles
a
AM(PM)
Turn LanePeak Hour Traffic Volume
Euclid Avenue Corridor Master Plan – Future Multi-Modal Conditions
February 28, 2014
TRANSIT RIDERSHIP
The projected future transit ridership at stops within the Project Area was developed by applying a growth
factor to existing boarding and alighting data provided in the Euclid Avenue Corridor Master Plan Existing
Conditions Report. While projecting increases in multi-modal trips requires some level of judgment and is
dependent on numerous factors, some quantitative methods are available to assist in this process. The
transit ridership growth factor was developed utilizing the mixed-use development (MXD) tool to estimate
the specific transit ridership associated with the Project Area under both existing and buildout conditions
of the Master Plan. MXD is an analysis tool, developed in partnership with the Environmental Protection
Agency (EPA), which quantifies relationships between characteristics of MXDs and the likelihood that trips
generated by those MXDs will stay internal to a site or area and use modes of transportation other than
the private vehicle. The tool provides estimates of external transit and pedestrian trips and all land uses
within approximately 1/3-mile of the study corridor including dwelling units, schools, retail uses, etc.
The ridership estimates for each model year were then compared to calculate the transit ridership growth
factor within the Study Area. Overall, the existing transit daily ridership is estimated to increase by 129%.
This projected increase in ridership is due to the planned increase in land use density throughout the
corridor, the proposed transit oriented nature and design of the proposed land uses, and the projected
increase in traffic activity.
Table 1 summarizes the results for forecasting the future transit daily boardings and alightings. The MXD
model results, as well as existing transit boarding data, are provided in Appendix E.
27

Euclid Avenue Corridor Master Plan – Future Multi-Modal Conditions
February 28, 2014
Table 1: Existing and Future Transit Daily Boardings and Alightings Summary
Existing1 Future2
Transit Stop Route Boardings Alightings Total Boardings Alightings Total
Euclid Avenue & Guymon Street
916/917 6 7 69
15 15 160
955 28 28 65 65
Euclid Avenue & Hilltop Drive
916/917 12 8 146
25 20 335
955 59 67 135 155
Euclid Avenue & Federal Boulevard
916/917 57 35 451
130 80 1035
955 179 180 410 410
Euclid Trolley Station
Orange Line Trolley
2,576 2,732
12,705
5,900 6,255
29,095
3 358 448 820 1,025
4 418 347 955 795
5 566 457 1,295 1,045
13 1,048 970 2,400 2,220
916 171 66 390 150
917 113 257 260 590
955 1,068 969 2,445 2,220
960 82 59 190 135
Total 6,741 6,630 13,371 15,435 15,180 30,625
1. Source: SANDAG Assistance to Transit Operations and Planning Program, 2010
2. Existing ridership information obtained from SANDAG Assistance Transit Assistance Transit Operations and planning program was increased by 129% to reflect future ridership under buildout conditions of the Master Plan.
28

Euclid Avenue Corridor Master Plan – Future Multi-Modal Conditions
February 28, 2014
PEDESTRIAN VOLUMES
Similar to the projection of transit ridership discussed above, the MXD tool was used to estimate the
change in pedestrian trips between existing and future conditions in 2035. MXD provides a specific
estimate of external pedestrian trips (vs. those that are captured within the study area) and estimates the
change in pedestrian activity between existing and future conditions. The results of the MXD analysis
show that the existing external pedestrian trips will increase by approximately 80% in the AM peak hour
and 117% in the PM peak hour simply based on land use changes and implementation of the Master Plan.
Since there are already continuous sidewalks through the project area, the changes to pedestrian
infrastructure are expected to include wider sidewalks where feasible and the recommended installation
of a traffic signal at Lise Avenue to enhance pedestrian access and walkability.
When considering both the pedestrian enhancements and the mixed-use nature of the future land use as
described above, it is anticipated that existing pedestrian volumes will effectively double under buildout
of the Master Plan. In addition to applying a 2.0 growth factor to existing pedestrian volumes, it is
assumed that the change in land use and corridor improvements would also generate additional
pedestrian traffic through and across the Euclid Avenue corridor. Therefore, all pedestrian crossings that
show minimal or no pedestrian activity under existing conditions will serve, at a minimum, 10 additional
pedestrians in the AM peak hour and 15 additional pedestrians in the PM peak hour using the facility,
which is reflective of the increased pedestrian activity under buildout conditions of the Master Plan.
Due to the level of accuracy this projection provides, pedestrian volumes were summarized for the total
intersection instead of by the individual movement.
Figure 3 displays the projected pedestrian volumes under buildout of the Master Plan.
29

44 (75)
28 (47)
30 (37)
10 (15)
10 (15)
56 (3
9)
160 (25)
60 (21)
60 (9
3)
3
4
5
4
5
3
# Study Intersection
XX (XX) AM (PM) Count TotalsIntersection Leg
Crosswalk
Figure 3: Future Pedestrian Peak Hour VolumesEuclid Ave
Total:112 (174)
Total:86 (84)
Total:290 (154)
10 (1
5)
10 (15)10 (15)

Euclid Avenue Corridor Master Plan – Future Multi-Modal Conditions
February 28, 2014
BICYCLE VOLUMES
Similar to the projection of transit ridership and pedestrian volumes previously discussed, the MXD tool
was used to estimate the increase in bicycle trips between existing and future conditions. MXD does not
provide a specific estimate of bicycle trips, but the amount of growth projected for pedestrian trips was
used as a proxy for increased bicycle usage. As noted in the previous section, the results of the MXD
analysis show that the existing external pedestrian trips will increase by approximately 80% in the AM
peak hour and 117% in the PM peak hour simply based on land use changes and implementation of the
Master Plan. Based on these results, the projection of future bicycle volumes along the corridor was
initially estimated by doubling the existing bicycle volumes or applying a growth factor of two (2).
In addition to applying a growth factor to existing bicycle volumes that would be generated by new uses
in the corridor, it is assumed that the installation of dedicated bicycle infrastructure in the form of Class II
bike lanes in this corridor will generate new bicycle trips through and across Euclid Avenue. Based on the
projected growth and enhanced facilities, an additional 20 bicyclists in the AM peak hour and 25 bicyclists
in the PM peak hour are anticipated in each direction of Euclid Avenue. Along each side of the streets
crossing Euclid Avenue in the project area, it is assumed that an additional 10 bicyclists and 15 bicyclists in
the AM and PM peak hour, respectively, will be generated beyond the growth factored volumes. Figure 4
displays the total projected bicycle volumes under buildout of the Master Plan.
This evaluation of future bicycle volumes displays the magnitude of bicycle ridership throughout the
corridor and indicates key locations in which ridership is projected to be prevalent. These key locations
should be the focus of any additional bicycle improvements such as the provision of bike racks. As the
corridor develops and bicycle ridership within the study area increases, bicycle racks should be placed in
areas with the highest demand. These areas may include transit stops and core commercial areas.
31

12 (23)
10 (17)
20 (29)20 (2
5)
10 (15)
10 (23)
20 (2
5)
20 (25)
10 (15)
12 (15)
22 (2
5)
20 (25)
XX (XX) AM (PM) Count TotalsIntersection Leg
Crosswalk
3
4
5
4
5
3
Figure 4: Future Bicycle Peak Hour Volumes Euclid Ave
# Study Intersection
Total:62 (94)
Total:60 (88)
Total:64 (80)
Euclid Avenue Corridor Master Plan – Future Multi-Modal Conditions
February 28, 2014
LEVEL OF SERVICE ANALYSIS
On September 30, 2008, the State of California approved Assembly Bill 1358 – The Complete Streets Act.
This act required, commencing January 1, 2011, that the legislative body of a city or county, plan for a
balanced, multimodal transportation network that meets the needs of all users of streets, roads, and
highways, defined to include motorists, pedestrians, bicyclists, children, persons with disabilities, seniors,
movers of commercial goods, and users of public transportation, in a manner that is suitable to the rural,
suburban, or urban context of the general plan.
METHODOLOGY
Various methodologies were used for the level of service (LOS) evaluation of the modes along the study
corridor under buildout of the Master Plan. The respective analysis methodologies for each mode of travel
are described in this section. In general, roadway and intersection LOS is based on the facility operations,
while LOS evaluations for pedestrian, bicycle, and transit facilities are based on user perception of the
traveling experience on the subject facilities.
AUTOMOBILE
Level of service (LOS) is a quantitative measure describing operational conditions within a traffic stream,
and the motorist’s and/or passenger’s perception of operations. LOS is based on these conditions in terms
of such factors as delay, speed, travel time, freedom to maneuver, interruptions in traffic flow, queuing,
comfort, and convenience. Table 2 describes generalized definitions of the various LOS categories (A,
best, through F, worst) as applied to roadway operations.
33

Euclid Avenue Corridor Master Plan – Future Multi-Modal Conditions
February 28, 2014
Table 2: Level of Service Definitions
LOS Category Definition of Operation
A This LOS represents a completely free-flow condition, where the operation of vehicles is virtually unaffected by the presence of other vehicles and only constrained by the geometric features of the highway and by driver preferences.
B This LOS represents a relatively free-flow condition, although the presence of other vehicles becomes noticeable. Average travel speeds are the same as in LOS A, but drivers have slightly less freedom to maneuver.
C At this LOS the influence of traffic density on operations becomes marked. The ability to maneuver within the traffic stream is clearly affected by other vehicles.
D At this LOS, the ability to maneuver is notably restricted due to traffic congestion, and only minor disruptions can be absorbed without extensive queues forming and the service deteriorating.
E This LOS represents operations at or near capacity. LOS E is an unstable level, with vehicles operating with minimum spacing for maintaining uniform flow. At LOS E, disruptions cannot be dissipated readily thus causing deterioration down to LOS F.
F
At this LOS, forced or breakdown of traffic flow occurs, although operations appear to be at capacity, queues form behind these breakdowns. Operations within queues are highly unstable, with vehicles experiencing brief periods of movement followed by stoppages.
Source: Highway Capacity Manual 2000.
Roadway Segment LOS Volume Thresholds
Roadway segment LOS volume thresholds provide the basis for evaluation of arterial roadway segment
performance. The analysis of roadway segment LOS is based on the functional classification of the
roadway, the maximum capacity, roadway geometrics, and existing or forecast Average Daily Traffic (ADT)
volumes. Table 3 presents the roadway segment capacity and LOS standards utilized to analyze arterial
roadways. This table was developed based on similar standards currently utilized by jurisdictions
throughout the San Diego region, and has been approved for use in the City of San Diego.
These standards are generally used as long-range planning guidelines to determine the functional
classification of roadways. The actual capacity of a roadway facility varies according to its physical and
operational attributes. Typically, the performance and LOS of a roadway segment is heavily influenced by
the ability of the arterial intersections to accommodate peak hour volumes. For the purposes of this traffic
analysis, LOS D is considered acceptable for Circulation Element roadway segments.
34

Euclid Avenue Corridor Master Plan – Future Multi-Modal Conditions
February 28, 2014
Table 3: City of San Diego Circulation Element Roadway Classifications and LOS Standards
Roadway Functional Classification LOS A LOS B LOS C LOS D LOS E
Expressway (6-lane) < 30,000 < 42,000 < 60,000 < 70,000 < 80,000
Prime Arterial (6-lane) < 25,000 < 35,000 < 50,000 < 55,000 < 60,000
Major Arterial (6-lane, divided) < 20,000 < 28,000 < 40,000 < 45,000 < 50,000
Major Arterial (4-lane, divided) < 15,000 < 21,000 < 30,000 < 35,000 < 40,000
Secondary Arterial/Collector (4-lane w/ center lane)
< 10,000 < 14,000 < 20,000 < 25,000 < 30,000
Collector (4-lane w/o center lane) < 5,000 < 7,000 < 10,000 < 13,000 < 15,000
Collector (2-lane w/continuous left-turn lane)
< 5,000 < 7,000 < 10,000 < 13,000 < 15,000
Collector (2-lane no fronting property)
< 4,000 < 5,500 < 7,500 < 9,000 < 10,000
Collector (2-lane w/commercial fronting)
< 2,500 < 3,500 < 5,000 < 6,500 < 8,000
Collector (2-lane multi-family) < 2,500 < 3,500 < 5,000 < 6,500 < 8,000
Sub-Collector (2-lane single-family) - - < 2,200 - -
Source: SANTEC/ITE Guidelines for Traffic Impact Studies in the San Diego Region, February 2004
Intersection Level of Service Standards and Thresholds
This section presents the methodologies used to perform peak hour intersection capacity analysis,
including both signalized and unsignalized intersections.
Signalized Intersection Analysis
The analysis of signalized intersections utilized the operational analysis procedure as outlined in the 2000
Highway Capacity Manual (HCM), Transportation Research Board Special Report 209. This method defines
LOS in terms of delay, or more specifically, average control delay per vehicle. Delay is a measure of driver
and/or passenger discomfort, frustration, fuel consumption and lost travel time. This technique uses 1,900
vehicles per hour per lane (VPHPL) as the maximum saturation volume of an intersection. This saturation
volume is adjusted to account for lane width, on-street parking, pedestrians, traffic composition (i.e.,
percentage trucks) and shared lane movements (i.e., through and right-turn movements originating from
the same lane). At the intersection of Euclid Avenue & Market Street, the maximum saturation volume was
reduced to 1,400 VPHPL on lanes affected by trolley operations to account for signal pre-emption delay
35

Euclid Avenue Corridor Master Plan – Future Multi-Modal Conditions
February 28, 2014
from the Orange Line trolley. The LOS criteria used for this technique are described in Table 4. The
computerized analysis of intersection operations was performed utilizing the SYNCHRO 8.0 traffic analysis
software.
Table 4: Signalized Intersection Level of Service Criteria
Average Control Delay Per Vehicle
(seconds) Level of Service (LOS) Characteristics
<10.0 LOS A describes operations with very low delay. This occurs when progression is extremely favorable, and most vehicles do not stop at all. Short cycle lengths may also contribute to low delay.
10.1 – 20.0 LOS B describes operations with generally good progression and/or short cycle lengths. More vehicles stop than for LOS A, causing higher levels of average delay.
20.1 – 35.0
LOS C describes operations with higher delays, which may result from fair progression and/or longer cycle lengths. Individual cycle failures may begin to appear at this level. The number of vehicles stopping is significant at this level, although many still pass through the intersection without stopping.
35.1 – 55.0
LOS D describes operations with high delay, resulting from some combination of unfavorable progression, long cycle lengths, or high volumes. The influence of congestion becomes more noticeable, and individual cycle failures are noticeable.
55.1 – 80.0 LOS E is considered the limit of acceptable delay. Individual cycle failures are frequent occurrences.
>80.0
LOS F describes a condition of excessively high delay, considered unacceptable to most drivers. This condition often occurs when arrival flow rates exceed the LOS D capacity of the intersection. Poor progression and long cycle lengths may also be major contributing causes to such delay.
Source: Highway Capacity Manual 2000, TRB Special Report 209.
Unsignalized Intersection Analysis
Unsignalized intersections, including two-way and all-way stop controlled intersections were analyzed
using the 2000 Highway Capacity Manual (Section 10) unsignalized intersection analysis methodology.
The SYNCHRO 8.0 Traffic Analysis software supports this methodology and was utilized to produce LOS
results. The LOS for a two-way stop controlled (TWSC) intersection is determined by the computed control
delay and is defined for each minor movement. Table 5 summarizes the LOS criteria for unsignalized
intersections.
36

Euclid Avenue Corridor Master Plan – Future Multi-Modal Conditions
February 28, 2014
The City of San Diego considers LOS D or better during the AM and PM peak hours to be acceptable for
intersection LOS.
Table 5: Unsignalized Intersection Level of Service Criteria
Average Control Delay (sec/veh)
Level of Service (LOS)
<10 A
>10 and <15 B
>15 and <25 C
>25 and <35 D
>35 and <50 E
>50 F
Source: Highway Capacity Manual 2000, TRB Special Report 209.
MULTI-MODAL LEVEL OF SERVICE
Multi-Modal Level of Service (MMLOS) is a method for assessing how well an urban street serves the
needs of all non-automobile users (pedestrians, transit passengers, motorists and bicyclists). The multi-
modal LOS analysis method used herein for transit, bicycle and pedestrian was required by the City of San
Diego and based on research sponsored by the Transportation Research Board (TRB), through the
National Cooperative Highway Research Program (NCHRP) Project 3-70, Multimodal Level of Service
Analysis for Urban Streets. The method that NCHRP 3-70 developed evaluates, by mode, the feel, comfort,
accessibility and safety of an urban street based upon the design, control and operations of the roadway.
MMLOS uses Quality of Service (QOS) as an indicator of the traveler’s perceived degree of satisfaction
with the traveling experience provided within the urban street.
The computerized analysis of MMLOS for all modes was performed utilizing the Complete Streets LOS, A
Multimodal Level of Service Toolkit, Version 3 analysis software developed by Dowling Associates, Inc. This
software outputs numerical ratings of the mode of travel, and these rating are then converted into the
traditional A-F letter grade system. Complete Streets LOS (CSLOS) uses methodologies outlined in the
2010 Highway Capacity Manual (HCM) to simultaneously determine the LOS for each of the four primary
modes along a street: auto, transit, pedestrian, and bicycle. Table 6 displays the LOS letter grade
numerical equivalents for pedestrian, bicycle and transit facilities.
37

Euclid Avenue Corridor Master Plan – Future Multi-Modal Conditions
February 28, 2014
Table 6: Multi-Modal LOS Letter Grade Numerical Equivalents
LOS Model Outputs LOS Letter Grade
Model < 2.00 A
2.00 < Model < 2.75 B
2.75 < Model < 3.50 C
3.50 < Model < 4.25 D
4.25 < Model < 5.00 E
Model > 5.00 F
Source: Transportation Research Board NCHRP Project 3-70.
Transit, bicycle, and pedestrian LOS analysis were performed for Euclid Avenue study area. The corridor
was divided into analysis segments, with each segment consisting of a length of street (link) plus the
downstream intersection at the end of the link. Cross section measurements of a segment (i.e. widths for
travel lanes, on-street parking, buffers, and medians) were taken at locations that predominately reflected
approximately 75% of a segment’s characteristics. In most cases, such segment characteristics were
represented and measured at the center of the segment length. An intersection is any point on the street
where through traffic is subject to signal control, stop-sign control, or yield-sign control.
38

Euclid Avenue Corridor Master Plan – Future Multi-Modal Conditions
February 28, 2014
The sub-sections below provide a more detailed description of the specific analysis methodologies and
data inputs for each mode.
Transit
The transit LOS is based on a combination of the access experience, the waiting experience, and the ride
experience. The access experience is represented by the pedestrian LOS score (to be discussed later in this
section) for pedestrian access to bus stops in the direction of travel along the street. The waiting and
riding experiences are combined into a transit wait/ride score. The transit wait/ride score is a function of
the average headway between transit vehicles and the perceived travel time.
The following six variables are used to determine the transit LOS:
• Frequency of service
• Mean speed
• Reliability of service
• Load factors
• Quality of pedestrian access to transit stops
• Transit stop amenities
Bicycle
The bicycle LOS is a weighted combination of the bicyclists’ experiences at intersections and on street
links in between the intersections. Bicycle LOS is a function of the following five variables:
• Lateral separation between bicycles and vehicular traffic
• Speed and makeup of the vehicular traffic
• Pavement conditions
• Directional vehicular traffic volumes
• Intersection crossing distance
39

Euclid Avenue Corridor Master Plan – Future Multi-Modal Conditions
February 28, 2014
Pedestrian
The pedestrian LOS is a measure of the pedestrians’ experiences walking along the roadway/sidewalk on
the street segment in between the intersections. Pedestrian LOS is a function of the following number of
variables:
• Lateral separation between pedestrians and vehicular traffic
• Width of sidewalk
• Speed and makeup of the vehicular traffic
• Difficulty of crossing arterial
• Directional vehicular traffic volumes
• Right-turn on red
• Left-turn during “Walk” phase
• Delay waiting to cross at signal
• Intersection crossing distance
• Cross-street vehicular traffic volume and speed
• Pedestrian density
40

Euclid Avenue Corridor Master Plan – Future Multi-Modal Conditions
February 28, 2014
LEVEL OF SERVICE EVALUATION
The projected MMLOS analysis results under buildout conditions of the Master Plan are documented
below.
ROADWAY LEVEL OF SERVICE
Table 7 displays the LOS analysis results for the key project area roadway segments under both existing
conditions and buildout of the Master Plan. As shown in the table, all of the roadway segments are
projected to operate at LOS D or better with the exception of the following:
• Euclid Avenue between Federal Avenue and the SR-94 WB Ramps (LOS E)
• Euclid Avenue between the SR-94 WB Ramps and the SR-94 EB Ramps (LOS E)
Table 7: Existing and Future Roadway Segment LOS Results
Existing Conditions Future Conditions
Euclid Ave Roadway Segment
Cross-Section
Average Daily Traffic (ADT)
LOS D Threshold
LOS Cross-Section
Average Daily Traffic (ADT)
LOS D Threshold
LOS
Federal Avenue to SR-94 WB Ramps1
4-Ln 33,760 35,000 D 5-Ln 40,400 40,0002 E3
SR-94 WB Ramps to SR-94 EB Ramps1
4-Ln w/ raised median
28,950 35,000 C 4-Ln, divided 36,100 35,000 E3
SR-94 EB Ramps to Hilltop Drive1
4-Ln 27,410 35,000 C 4-Ln, divided 34,200 35,000 D
Hilltop Drive to Lise Avenue
4-Ln w/ Center lane 25,485 25,000 E3 4-Ln,
divided 32,600 35,000 D
Lise Avenue to Guymon Street
4-Ln w/ Center lane 26,156 25,000 E3 4-Ln,
divided 32,000 35,000 D
Guymon Street to Market Street
4-Ln w/ Center lane 26,198 25,000 E3 4-Ln,
divided 31,700 35,000 D
1. Portions or the entire segment is part of Caltrans right-of-way. Therefore, any proposed changes or enhancements at this location are subject for review and approval by Caltrans.
2. Interpolated the LOS D threshold for a 5-lane major arterial using the LOS D threshold of a 4-lane major arterial and a 6 lane major arterial.
3. Bold letter indicates unacceptable LOS E or F. Source: Fehr & Peers, February 2014
41
Euclid Avenue Corridor Master Plan – Future Multi-Modal Conditions
February 28, 2014
From a planning perspective, this result would indicate that additional capacity is required on the Euclid
Avenue bridge over the freeway. While the roadway evaluation is one indication of possible operational
issues in a corridor, it is also important to review the results of the intersection analysis, where
intersections typically represent the constraints of the roadway system. The intersection analysis is
presented in the next section.
Under buildout conditions of the Master Plan, the cross-section along Euclid Avenue between Hilltop and
Market Street changes from a 4-lane major roadway with center lane to a 4-lane major roadway with
raised median (divided). The following change in cross-section of these segments and corresponding
change in facility type increases the LOS D volume threshold. Accordingly, operations on these segments
are projected to improve under future conditions despite the overall increase in average daily traffic (ADT)
volumes.
INTERSECTION LEVEL OF SERVICE
Table 8 displays intersection LOS and average vehicle delay results for the key intersections under the
buildout of the Master Plan. The existing intersection LOS is also displayed to show the projected change
between the buildout of the Master Plan and current operations. Intersection LOS calculation worksheets
are provided in Appendix F.
As shown in the table, all of the study intersections are projected to operate at LOS D or better under
buildout of the Master Plan with the exception of the following:
• Euclid Avenue & Market Street (LOS E in the AM and PM peak hours): It is important to note that
operations at this intersection are directly affected by the signal pre-emption delay caused by the
gates being down at the Euclid Trolley Station at-grade crossing located immediately south of
the intersection. Thus, the maximum saturation flow rate was reduced to 1,400 vehicles per hour
per lane (VPHPL) from 1,900 VPHPL on lanes affected by trolley operations to account for the
delay caused by the trolley gates.
Figure 5 displays the future LOS for both the Project Area roadway segments and intersections.
42

Euclid Avenue Corridor Master Plan – Future Multi-Modal Conditions
February 28, 2014
TABLE 8: EXISTING AND FUTURE INTERSECTION LOS RESULTS
Existing Future
Intersection
LOS AM Peak Hour PM Peak Hour
Control AM PM Control Average
Delay (sec)
LOS Average
Delay (sec)
LOS
1. Euclid Avenue & SR-94 WB Ramps 1,3
SSSC E2 F2 Signal 7.3 A 9.4 A
2. Euclid Avenue & SR-94 EB Ramps
1,3,4 SSSC B E2 Signal 22.9 C 30.5 C
3. Euclid Avenue & Hilltop Drive
Signal A A Signal 10.5 B 11.4 B
4. Euclid Avenue & Lise Avenue3
SSSC C D Signal 5.2 A 5.9 A
5. Euclid Avenue & Guymon Street
Signal A A Signal 7.2 A 8.1 A
6. Euclid Avenue & Market Street5
Signal C C Signal 58.7 E2 78.5 E2
1. Portions or the entire intersection area is part of Caltrans right-of-way. Therefore, any proposed changes or enhancements at this location are subject for review and approval by Caltrans.
2. Bold letter indicates unacceptable LOS E or F. 3. Intersections are one or two-way stop controlled under existing conditions and LOS is based on the worst delay
experienced by any of the approaches. Under future conditions, these intersections will be signalized. For the intersection at Euclid Avenue and Lise Avenue, intersection meets peak hour traffic signal warrants in the future. Appendix F includes the signal warrant analysis worksheet for this location.
4. When the pedestrian phase is actuated for the south leg pedestrian crossing, the intersection conditions could degrade to unacceptable levels. Appendix F includes the LOS calculation worksheets for the condition when the pedestrian phase is actuated.
5. The intersection is located immediately north of the Euclid Trolley Station at-grade crossing. Under existing conditions, field observations confirmed that with 15-minute headways the gate is down for about eight minutes over the course of an hour, while for future conditions with headways of 7.5 minutes the gate is assumed to be down for approximately 16 minutes over the course of an hour. Thus, to account for signal pre-emption delay experienced at this intersection, proportionality was used to calculate the saturation flow rate adjustment for movements affected by the gate being down. Based on the fieldwork and information regarding future Orange Line Trolley operations, it is estimated that the saturation flow rate for the affected movements should be reduced from 1,900 VPHPL to 1,400 VPHPL.
Source: Fehr & Peers, February 2014
43

!(T
!<
!<
!<
!<
!<
!<
=
=
=
=
=
=
MARKET ST EUCLID
AV
HILLTOP DR
A ST
ROSWELL ST
GUYMON ST
GENEVA AV
GLEN RD
MARILOU RD
56TH S
T
LENOX DR
WINSTON
DR
LISE AV
NARANJA ST
49TH S
T
48TH S
T
ELWOOD
AV
DATE ST
50TH S
T
SR-94 RA
ESCUEL
A ST
BROOKL
INE ST
SELMA PL
CRESTON DR
BEVERLY ST
MARY L
OU ST
HAL ST
DERBY
ST
LYON ST
HANOVE
R ST
UVAS ST
CAROLI
NA LN
DASSCO
ST
MELROSE PL
KENWOOD ST
HALLMARK WY
ZIRCON ST
DASSCO CT
LACE PL
AURORA
ST
GROVELAND DR
56TH PL
49TH S
T
WB ON-RAMP
51ST ST
ALLEY
EB OFF-RAMP
ALLEY
SR-94 WB
ON RA
HILLTOP DR
48TH S
T
DATE ST
BEECH ST
EB ON-
RAMP
FEDERAL BL
54TH S
T
WB ON-RAMP
DUVAL ST
DUVAL
ST
ALTADE
NA AVLYON STBEECH ST
GROVELAND DR
BEECH ST
SR-94 RA
PRIVATE RD 0 0.06 0.120.03Miles
Source:Fehr & Peers (2014)
February 2014
Figure 5: Future Roadway and Intersection LOSEuclid Ave
´
94
Project Area
Orange Line Trolley
Roadway Segment Level of Service
Intersection Level of Service
!(T Trolley Station
AM/PM=
A - CDEF

Euclid Avenue Corridor Master Plan – Future Multi-Modal Conditions
February 28, 2014
TRANSIT LEVEL OF SERVICE
Table 9 and Figure 6 display the projected transit AM peak hour LOS along the Euclid Avenue study
corridor under buildout of the Master Plan. The existing Transit LOS is also displayed in Table 9 to show
the change between current conditions and the Master Plan. MMLOS calculation worksheets are provided
in Appendix G.
Table 9: Existing and Future Transit AM Peak Hour LOS Results
Existing Future
Euclid Avenue Segment
LOS Northbound (NB) Southbound (SB)
NB SB LOS Score
Transit LOS
LOS Score
Transit LOS
Federal Avenue to SR-94 WB Ramps1
A C 1.25 A 3.01 C
SR-94 WB Ramps to SR-94 EB Ramps1
A A 1.61 A 1.46 A
SR-94 EB Ramps to Hilltop Drive1
A B 1.77 A 2.46 B
Hilltop Drive to Lise Avenue
C A 2.83 C 1.72 A
Lise Avenue to Guymon Street
A C 1.55 A 2.88 C
Guymon Street to Market Street
B A 2.43 B 1.53 A
1. Portions or the entire segment is part of Caltrans right-of-way. Therefore, any proposed changes or enhancements at this location are subject for review and approval by Caltrans.
2. Bold letter indicates unacceptable LOS E or F.
Source: Fehr & Peers, February 2014
45

Euclid Avenue Corridor Master Plan – Future Multi-Modal Conditions
February 28, 2014
Table 10 and Figure 7 each display the projected PM peak hour transit LOS in the project area under
buildout of the Master Plan. The existing Transit LOS is also displayed in the table to show the change
from current conditions and the Master Plan. MMLOS calculation worksheets are provided in Appendix G.
Table 10: Existing and Future Transit PM Peak Hour LOS Results
Existing Future
Euclid Avenue Segment
LOS Northbound (NB) Southbound (SB)
NB SB LOS
Score Transit
LOS LOS
Score Transit
LOS
Federal Avenue to SR-94 WB Ramps1
A C 1.25 A 3.14 C
SR-94 WB Ramps to SR-94 EB Ramps1
A A 1.67 A 1.53 A
SR-94 EB Ramps to Hilltop Drive1
A C 1.69 A 2.73 B
Hilltop Drive to Lise Avenue
C B 2.88 C 1.88 A
Lise Avenue to Guymon Street
A C 1.53 A 3.06 C
Guymon Street to Market Street
B B 2.46 B 1.64 A
1. Portions or the entire segment is part of Caltrans right-of-way. Therefore, any proposed changes or enhancements at this location are subject for review and approval by Caltrans.
2. Bold letter indicates unacceptable LOS E or F.
Source: Fehr & Peers, February 2014
The CSLOS program that was used to calculate the transit LOS incorporates bus stop information within a
segment to estimate the transit LOS. As shown, the Euclid Avenue Corridor provides good transit service
(LOS C or better) to transit patrons traveling both directions during both the AM and PM peak hour.
However, it should also be noted that the increased future vehicle delay reported at the Euclid Avenue
and Market Street intersection could potentially slow buses traversing through the area during peak
periods. Still, it is anticipated that any additional vehicle delay experienced would be temporary and the
overall transit service quality would be good, based on the notion that project area transit will continue to
provide frequent service and patrons will have good access to existing transit stops during both peak
hours.
46

!
!
!!
!
!
!
!
! !
!!
!
!
!!
!
!
!
!
!
!
!
!
!
!
!
!
!
!
!
!
!
!
!
!
!
!
!
!
!
!
!
!!
!
!
!
!!
!
!
!!
!
!
! !! !
!!
!
!
!
!
!!
!!
!
!
!
!
! !!
!
!
!! !
!
!
! !!
!
!
!!
!
!
!!!
!!
!
!!
!
!
! ! !
!!
!
!
!!
!
!!
!! !
!
! !
!!!
!
!!!
! ! !!!
! !
! !
!
!
!!!
!
!
! !
! !! !!
! !
! !
! !
!!
!
!
!
! !
!
!!
!
!!!!
!
!
!!
!! !!
!!!
!! !
!
!
!!
!
!!
!!
!!
!
! !! !
!
!
! !!! !
!
!!
!
!!
!
! ! !! ! !! !
!
!!
!! !!
!
!
! ! ! !!! !
!
!
!!
!
!!
!
!!
!!
!!
!
!!! !
!
!!
!!
!
!
!
!!!!
!
!!
!
!
! !
! !
!
!!!
! !!!!
!
!!
!!
!
!!
!
!!
! !!
!!
!
!
!
!!
!!
!
!
! !
!
!
!
!!
!
!
! !
!
!!
!! !
!
!!
!
!! !
!
!!
!
! !
!
!
!!
!
!!
!!
!!
!
!
!
!
!!
!
!
! ! !
!
!
!!! !
!
!
!
!
!
!
!!
!
!!!
!!
!
!
!
!
!
!! !
! !!
!
!
!
!
!!!
!!
!
!
!!
!!!
!
!
! !
!
!
!!
!!
!!
!
!
!
!!
!
!!
!
!
!
!!
!
!
!
!
!
!!
!
!
!!!
!
!
!
!
!
!
! ! !
!
!!
!!
! !!
!!
!!
!
!
!
!!
!
!!
! ! !
!!
!!
!! !
!
!!!
!
! !
!!!
!!
! ! !!
!!
!!
!!
!! !
!!
!!
!
!
!!
! !
!!
!!
!!
!!
!
!
!!
! !!!!
! !!! !
!!
! !!
!!
!! !!
!!
!!!! !!
! !!
! !!
! !!! !
!!!!
!
! !!
!
!!!
!!!
!! !!
! !
!
!
!! !!
!!
! !
!! ! !
!!
!! !
!!
! !!!
!
! !!!
!!
!!!
!
!!
!! !!!!
! !
!!
!!
!
!!
!!
!
! !!
!
!! !!
!
!
! !
!
!!
!!
!!!
!
! !
!!
!
!
!
!!
!
!
!
!!
!
!
!
!
!
!!
! !
!
!!
! !
!!
!
!
!!
!
! !
!!
!
!!
!!
!!!
!
!!
!
!
!!
!
! !
!
!
!
!
!
!
!!
!
!
!
!
!
!
!
!!!
!
!
!
!
!
!! !
!!
!
!
!!
!
!!
!
!!
!
!!
!
!
!
!!
!
!
!
!
!!
!
!
!
!
!
!
!
!
!!
!
!
!!! !!
!
!
!
!!
!
!
! !
!!!!
!!
!!! !
!!
!
! !
!
!
! !
!
!!
!!
!
! ! ! !
!! !
!!
! ! ! ! !!
!
!
!
!
!
!
!
!
!
!!
!
!
!
!
!
!
!
!
!
!! !! ! !!!
! !
!
!
!
!
!!
!
! !
!
!
!
!
!
!
!
!
!
!!
!
!
!
!
!
!!
!
!!
!
!
!
!
!
!!!
!
!
!
!
!
!
!
!
!
!
!
!!
!
!!
!
!
!
!!
!
!
!
!! !
!!
!
! !
!
! ! !
!
!!
!!
!
!
!
!!
!
!
!
! !
!
!!!
!!
!!
!
!
!
!! !! ! ! !!
! ! ! ! ! !! !
!!
!
!
!
!
!
!
!
!
!
!
!
!
!
!
!
!
!
!
!
!!!
!
!
!
! ! !!
!
!
!
!
!!
!
!
!
!
!
!
!
!!
!!
! ! !!! !
!
!
!
!!
!
!! !
!
!!
!!
!
!! !
!!
!!
!
!
!
!
!
!
!
!
!!
!
!
!
!
!
!!!!!
!
!
!!!
!
!
!!!!!
!
!
!
!
! !
!
!!
!
!
!!
!
! !
!!
!
!
!
!
!!
!
!
!
!
!
!
!
!!
!
!!
!
!!
!
!
!
!
!
!
!
!
!
!
!
!
!
!!
!
!
!!!
!
!
!!
!
!
!
!
!
! !! ! !!!
!
!
! ! !
!
!!
!
!
!!! !
!
!
!
! ! ! !
!
!!!
!
!
!!
!
!
! !
! ! !!
!
!
!
!
!
!
!!
!!!
!!
!
!
!!
!
!!
!!!
!
!
!
!
!
!
!
! !
!
!!
!
! !
!
!
!!
!
! !!
!
! !!
!
!
!
!
!
!
!
!!
!
! !! ! !!!!
!!
!
!! !
! !
!
!! ! ! !! ! !!
!
!! !
!!
!
!! !!
! !!
! !! ! !! !!!! !!! !! !!! !!
! !!! !
! !!!
!
!!
! ! !!!!!! !
!!
!
!!
!!
!
! ! !!!
!! !
! !! !
!
!
!
!! !
!
!
!!!
!
!!!
!!
!
!! ! !!
!
!
!!
!!
!
!! ! !
!!!
!!
!!
! !
!
!!
!!!
!!!
!! ! !
!
!!
!!
!
!!
!
!
!!
!
!
!
! !
!!
!!!
!!
!!!!
!! !!!
!
!!
!!
!!
!!
!
!
!
!! ! ! ! ! ! ! ! ! ! !! !
!!
!
!
! !
!!
!!
!
!!
! ! !!!
!!
! !!!
! ! !! !
!!!
! !!!! !! !!
!!
!!
! !! !!
!
!! !
!! !
!!
!!
! !! !! ! ! !
!!
!
!
! !!
!! !
!
! !!!
!
!
!!
! !
!
!!
!!
! !!!
! !
!!
!! !
! ! ! ! !! !! !!
!!!
!!
!!!
!!! ! ! ! !! !
! !
! !
! !!!
! ! !
!
! !!
!
!!
!
!!!
!!
!
!!
!
!!
!!
!
!
! !! ! ! ! ! ! ! ! ! ! ! ! !
! !
!
! !
!
!!!!
! !!!
!
!!!
! !
!!
!!
! !!! !!
!! !
!
!
! !
!! !! !
! ! !!
!!
!
! !!
!
! ! !!
!
!
!!
!!
!! !
!
! !!
!! !!
!
!! ! !
!!
!!
!
!
!!
! !!
!
!!!
! !!
!!! !
!!!
!
!
!! !
!
!
!
!! !
! !! !!
!! ! !!
!!
! !!!
!
!
!!
!
!!!
!!!!!!!!
! !!
!!!
!!
!!
!
!!
!!! !!
!!
!!!
!
! ! !
!
!!
!!!
!! ! ! ! ! !! ! !! ! ! !! !!
!! !
!!
! ! !! !! ! !
!!
! !!!
!! !!!
!!
! ! !
!
!
!!
!!! ! !!
!!
!!
! ! !!!
!
!!
! !
!!!!!! !! ! ! ! ! ! !!
! ! !! ! ! !! ! !! ! ! ! ! !!! !! !! !
!!!!
! ! !! !!
!!
!
!
!!! !!!
! !!!
! !! !
!! ! !! !!!! !
! !!
!
! !!
!
! !!
! ! !! !
! !! ! !! !!
!!! ! ! ! !! ! ! ! ! ! !!! ! ! ! !!
!
! !!! !!!!! ! ! ! !! ! !! ! !!! ! ! ! ! !
!!
!! !! !!
!! !! !
! ! !! ! !
!! !!
!
!! ! ! !! !
! ! !! !
! !!! !
! !
!!
! ! !!!!!! ! ! ! !
!! ! !
!!
!!
!!!
! !!! !
!!!!! !!! !!! !! !
!!!
!
!! ! !!
! !!
!!!
!!
! !!
!! !
!
!
!!!
!!!
!! !!
!! ! !
!!
!! ! !! !!
!
!
!
!
!!!!
! ! !!
!!
!!
!!
!! !
! ! !!!
!
!
!!
!!!
!
! ! !!
! !! ! !
!!
!!!
!! !
!
!!
!!!!
!! !! !! ! !
!! !!
!
!
!! !! !!
! !!
! !!
!! ! !
!!
!!
! !!!! !!
!
!!
!!! !! ! !
!
!!
!!!
!
!! ! !!
!
!! !
! !! !
!!
!!!
! ! ! ! !!!
!!
! !! !! ! ! ! !
!
! ! ! ! ! !
!!
!
!! ! ! ! ! ! !
!
!
! ! ! ! !!
!!
!
!
!! !! !! !! !! !! ! !
!! !
!! !!!
!! ! ! ! ! ! ! ! ! ! ! ! ! ! ! ! !
!!
! !
!!! ! !
! !!
!!
! !!!! ! ! !! !!
!!
!!
! !! ! ! !!
!!
!! !! !! ! ! ! ! ! !!! ! !! ! ! ! ! !
! !! !!! !! !! ! ! !! ! !! ! ! !
!! !
! !!
! !
!!
!!
! !! !! !
!!!!
! !
!! !! ! !
!!
!!
!
!!! !
!!! ! !!!
! !!!!
! ! !! !! !! ! !!!!!
! !
!! !
! !!!!
!
!!
! ! !!
!
! !
! !! !! ! !!
! !
! !! !!
! !! !
! ! ! !
!!!
!
! ! ! ! ! !! !! ! ! ! ! ! !!
!!!
! ! ! !! !! !
!!
!!
! !
!
!!!
!!
! !!!! !
!! !
! !
! !!
!! ! !! !! ! !!
! !
! ! ! ! ! ! ! ! ! !! ! !! ! !!
! !
!
! !!
!!
!
!
!!
!!
!!
!!
! ! ! ! !
!
!
!
!! !
!!
!
!! !
!
!
!
!!
!
!! !!
!
!
!!
! !
!!
!!
!!
! !
!
! !
!!
!!
!
! !
!!
! !!
!
!!
!
!! !
!
!
!
!!
!!
!!
!
!
!!
!! !
!!
!! !
! !!
!!
!!
! !
!!!
!!
!!
!
!
!!!
!
!!
!
!
!!
! !
!
! !!!
!!
!
!
!!
! !
!
!!!
!!
!
!
!
!
!
!!
!!
! !!
!!
!!
!
!!!
!!
!!
!!
!
!
!
!!
!
!
!
!
! !! !
!
!!
!
!
!
!
!! !!
!!
!
!
!
!
!!
!
!!
! !!
! !
!
!!
!
!!
!
!
! !!
!! !
!!!!
! !!
!!
!
!!
!
!
! !!!
!!!
!!
!
!
!!!
!
!!
!
!
!
!
!
!
!!
!
!!!!
!
!
!
!!
!
!
!
!
!
!
!!
!
!
!
!
!!
!
!!!
!
!
!
!
!
!!
!!
!
!!
!
! !
!
!
!!!
!
!
!
!
!
!!
!
!
!!
!!
!
!
!
!
!!
!
!
!! !!!
!!
!
!
!
! !!
!
!
!
!!
! !!
! ! ! ! !
!
!
!
!
! ! ! ! ! ! ! !! ! !!
!
!
!
! ! ! ! !! !! ! ! ! ! ! ! ! !!! ! ! !
! ! !! !! ! ! !!
!
!
!
!
!
!
!
!
! ! !! ! ! ! ! ! ! ! ! ! ! ! ! !
!
!
! !!
! !
! !! !
!!
!! !
! ! !!
!
! !
!!
! ! !! !! !
!
!
!
!
!!
!
!
!
!! !
!!
!
! !
!
! !!
!!
!!
!
!
!
!
!
!
!
!
!!
!
!!
!
!
!!!
!!
!
!
!
!!
!
!
! !
!
!!
!
!
!
!
!
!
!
!
!
!
!
!
!
!
!
!
!
!
!
!
!
!
!
!
!
!
!
!
!
!
!
!
!
!
!
!
!
!
!
!
!
!
!
!
!
!
!
!
!
!
!
!
!
!
!
!
!
!
!
!
!
!
!
!
!
!
!
!
!
!
!
!
!
!
!
!
!
!
!
!
!
!
!
!
!
!
!
! !
!
!
!
!
!
!
!
!
!
!
!
!
!
!
!
!
!
!
!
!
!
!
!
!
!
!
!
!
!
!
!
!
!! !
!
!
!
!
!
!
!
!
!
!
!
!
!
!
!
!
!
!
! !
!
!
!
!
!
!
!
!
!
!
!
!
!
!
!
!
!
!
!
!
!
!
!
!
!
!
!
!
!
!
!
!
!
!
!
!
!
!
!
!
!
!
!
!
!
!
!
!
!
!
!
!
!
!!
!
!
!
!
!
!
!
!
!
!
!
!
!
!
!
!
!
!
!
!
!
!
!
!
!
!
!
!
!
!
!
!
!
!
!
!
!!
!
!
!
!
!!
!
!!
!
!
!
!
!
!
!
!
!
!
!
!
!
!
!
!
!
!
!
! !
!
!
!
!
!
!
!
!
!
!
!
!
!
!
!
!
!
!
!
!
!
!
!
!
!
!
!
!
!
!
!
!
!
!
!
!
!
!(T
MARKET ST EUCLID
AV
HILLTOP DR
A ST
ROSWELL ST
GUYMON ST
GENEVA AV
GLEN RD
MARILOU RD
LENOX DR
WINSTON
DR
LISE AV
NARANJA ST
49TH S
T
48TH S
T
ELWOOD
AV
DATE ST
50TH S
T
SR-94 RA
SELMA PL
CRESTON DR
BEVERLY ST
MARY L
OU ST
HAL ST
DERBY
ST
LYON ST
HANOVE
R ST
UVAS ST
CAROLIN
A LN
DASSCO
ST
MELROSE PL
KENWOOD ST
HALLMARK WY
ZIRCON ST
DASSCO CT
LACE PL
49TH S
T
WB ON-RAMP
51ST ST
ALLEY
EB OFF-RAMP
SR-94 WB
ON RA
HILLTOP DR
48TH S
T
DATE ST
BEECH ST
EB ON-
RAMP
FEDERAL BL
54TH S
T
WB ON-RAMP
DUVAL ST
DUVAL
ST
ALTADE
NA AVLYON ST
BEECH ST
SR-94 RA
PRIVATE RD 0 0.06 0.120.03Miles
Source:Fehr & Peers (2014)
February 2014
Figure 6: Future Transit LOS (AM Peak)Euclid Ave
´
94
!(T Trolley StationProject AreaOrange Line Trolley
Bus StopA - CDEF
Transit Level of Service

!
!
!!
!
!
!
!
! !
!!
!
!
!!
!
!
!
!
!
!
!
!
!
!
!
!
!
!
!
!
!
!
!
!
!
!
!
!
!
!
!
!!
!
!
!
!!
!
!
!!
!
!
! !! !
!!
!
!
!
!
!!
!!
!
!
!
!
! !!
!
!
!! !
!
!
! !!
!
!
!!
!
!
!!!
!!
!
!!
!
!
! ! !
!!
!
!
!!
!
!!
!! !
!
! !
!!!
!
!!!
! ! !!!
! !
! !
!
!
!!!
!
!
! !
! !! !!
! !
! !
! !
!!
!
!
!
! !
!
!!
!
!!!!
!
!
!!
!! !!
!!!
!! !
!
!
!!
!
!!
!!
!!
!
! !! !
!
!
! !!! !
!
!!
!
!!
!
! ! !! ! !! !
!
!!
!! !!
!
!
! ! ! !!! !
!
!
!!
!
!!
!
!!
!!
!!
!
!!! !
!
!!
!!
!
!
!
!!!!
!
!!
!
!
! !
! !
!
!!!
! !!!!
!
!!
!!
!
!!
!
!!
! !!
!!
!
!
!
!!
!!
!
!
! !
!
!
!
!!
!
!
! !
!
!!
!! !
!
!!
!
!! !
!
!!
!
! !
!
!
!!
!
!!
!!
!!
!
!
!
!
!!
!
!
! ! !
!
!
!!! !
!
!
!
!
!
!
!!
!
!!!
!!
!
!
!
!
!
!! !
! !!
!
!
!
!
!!!
!!
!
!
!!
!!!
!
!
! !
!
!
!!
!!
!!
!
!
!
!!
!
!!
!
!
!
!!
!
!
!
!
!
!!
!
!
!!!
!
!
!
!
!
!
! ! !
!
!!
!!
! !!
!!
!!
!
!
!
!!
!
!!
! ! !
!!
!!
!! !
!
!!!
!
! !
!!!
!!
! ! !!
!!
!!
!!
!! !
!!
!!
!
!
!!
! !
!!
!!
!!
!!
!
!
!!
! !!!!
! !!! !
!!
! !!
!!
!! !!
!!
!!!! !!
! !!
! !!
! !!! !
!!!!
!
! !!
!
!!!
!!!
!! !!
! !
!
!
!! !!
!!
! !
!! ! !
!!
!! !
!!
! !!!
!
! !!!
!!
!!!
!
!!
!! !!!!
! !
!!
!!
!
!!
!!
!
! !!
!
!! !!
!
!
! !
!
!!
!!
!!!
!
! !
!!
!
!
!
!!
!
!
!
!!
!
!
!
!
!
!!
! !
!
!!
! !
!!
!
!
!!
!
! !
!!
!
!!
!!
!!!
!
!!
!
!
!!
!
! !
!
!
!
!
!
!
!!
!
!
!
!
!
!
!
!!!
!
!
!
!
!
!! !
!!
!
!
!!
!
!!
!
!!
!
!!
!
!
!
!!
!
!
!
!
!!
!
!
!
!
!
!
!
!
!!
!
!
!!! !!
!
!
!
!!
!
!
! !
!!!!
!!
!!! !
!!
!
! !
!
!
! !
!
!!
!!
!
! ! ! !
!! !
!!
! ! ! ! !!
!
!
!
!
!
!
!
!
!
!!
!
!
!
!
!
!
!
!
!
!! !! ! !!!
! !
!
!
!
!
!!
!
! !
!
!
!
!
!
!
!
!
!
!!
!
!
!
!
!
!!
!
!!
!
!
!
!
!
!!!
!
!
!
!
!
!
!
!
!
!
!
!!
!
!!
!
!
!
!!
!
!
!
!! !
!!
!
! !
!
! ! !
!
!!
!!
!
!
!
!!
!
!
!
! !
!
!!!
!!
!!
!
!
!
!! !! ! ! !!
! ! ! ! ! !! !
!!
!
!
!
!
!
!
!
!
!
!
!
!
!
!
!
!
!
!
!
!!!
!
!
!
! ! !!
!
!
!
!
!!
!
!
!
!
!
!
!
!!
!!
! ! !!! !
!
!
!
!!
!
!! !
!
!!
!!
!
!! !
!!
!!
!
!
!
!
!
!
!
!
!!
!
!
!
!
!
!!!!!
!
!
!!!
!
!
!!!!!
!
!
!
!
! !
!
!!
!
!
!!
!
! !
!!
!
!
!
!
!!
!
!
!
!
!
!
!
!!
!
!!
!
!!
!
!
!
!
!
!
!
!
!
!
!
!
!
!!
!
!
!!!
!
!
!!
!
!
!
!
!
! !! ! !!!
!
!
! ! !
!
!!
!
!
!!! !
!
!
!
! ! ! !
!
!!!
!
!
!!
!
!
! !
! ! !!
!
!
!
!
!
!
!!
!!!
!!
!
!
!!
!
!!
!!!
!
!
!
!
!
!
!
! !
!
!!
!
! !
!
!
!!
!
! !!
!
! !!
!
!
!
!
!
!
!
!!
!
! !! ! !!!!
!!
!
!! !
! !
!
!! ! ! !! ! !!
!
!! !
!!
!
!! !!
! !!
! !! ! !! !!!! !!! !! !!! !!
! !!! !
! !!!
!
!!
! ! !!!!!! !
!!
!
!!
!!
!
! ! !!!
!! !
! !! !
!
!
!
!! !
!
!
!!!
!
!!!
!!
!
!! ! !!
!
!
!!
!!
!
!! ! !
!!!
!!
!!
! !
!
!!
!!!
!!!
!! ! !
!
!!
!!
!
!!
!
!
!!
!
!
!
! !
!!
!!!
!!
!!!!
!! !!!
!
!!
!!
!!
!!
!
!
!
!! ! ! ! ! ! ! ! ! ! !! !
!!
!
!
! !
!!
!!
!
!!
! ! !!!
!!
! !!!
! ! !! !
!!!
! !!!! !! !!
!!
!!
! !! !!
!
!! !
!! !
!!
!!
! !! !! ! ! !
!!
!
!
! !!
!! !
!
! !!!
!
!
!!
! !
!
!!
!!
! !!!
! !
!!
!! !
! ! ! ! !! !! !!
!!!
!!
!!!
!!! ! ! ! !! !
! !
! !
! !!!
! ! !
!
! !!
!
!!
!
!!!
!!
!
!!
!
!!
!!
!
!
! !! ! ! ! ! ! ! ! ! ! ! ! !
! !
!
! !
!
!!!!
! !!!
!
!!!
! !
!!
!!
! !!! !!
!! !
!
!
! !
!! !! !
! ! !!
!!
!
! !!
!
! ! !!
!
!
!!
!!
!! !
!
! !!
!! !!
!
!! ! !
!!
!!
!
!
!!
! !!
!
!!!
! !!
!!! !
!!!
!
!
!! !
!
!
!
!! !
! !! !!
!! ! !!
!!
! !!!
!
!
!!
!
!!!
!!!!!!!!
! !!
!!!
!!
!!
!
!!
!!! !!
!!
!!!
!
! ! !
!
!!
!!!
!! ! ! ! ! !! ! !! ! ! !! !!
!! !
!!
! ! !! !! ! !
!!
! !!!
!! !!!
!!
! ! !
!
!
!!
!!! ! !!
!!
!!
! ! !!!
!
!!
! !
!!!!!! !! ! ! ! ! ! !!
! ! !! ! ! !! ! !! ! ! ! ! !!! !! !! !
!!!!
! ! !! !!
!!
!
!
!!! !!!
! !!!
! !! !
!! ! !! !!!! !
! !!
!
! !!
!
! !!
! ! !! !
! !! ! !! !!
!!! ! ! ! !! ! ! ! ! ! !!! ! ! ! !!
!
! !!! !!!!! ! ! ! !! ! !! ! !!! ! ! ! ! !
!!
!! !! !!
!! !! !
! ! !! ! !
!! !!
!
!! ! ! !! !
! ! !! !
! !!! !
! !
!!
! ! !!!!!! ! ! ! !
!! ! !
!!
!!
!!!
! !!! !
!!!!! !!! !!! !! !
!!!
!
!! ! !!
! !!
!!!
!!
! !!
!! !
!
!
!!!
!!!
!! !!
!! ! !
!!
!! ! !! !!
!
!
!
!
!!!!
! ! !!
!!
!!
!!
!! !
! ! !!!
!
!
!!
!!!
!
! ! !!
! !! ! !
!!
!!!
!! !
!
!!
!!!!
!! !! !! ! !
!! !!
!
!
!! !! !!
! !!
! !!
!! ! !
!!
!!
! !!!! !!
!
!!
!!! !! ! !
!
!!
!!!
!
!! ! !!
!
!! !
! !! !
!!
!!!
! ! ! ! !!!
!!
! !! !! ! ! ! !
!
! ! ! ! ! !
!!
!
!! ! ! ! ! ! !
!
!
! ! ! ! !!
!!
!
!
!! !! !! !! !! !! ! !
!! !
!! !!!
!! ! ! ! ! ! ! ! ! ! ! ! ! ! ! ! !
!!
! !
!!! ! !
! !!
!!
! !!!! ! ! !! !!
!!
!!
! !! ! ! !!
!!
!! !! !! ! ! ! ! ! !!! ! !! ! ! ! ! !
! !! !!! !! !! ! ! !! ! !! ! ! !
!! !
! !!
! !
!!
!!
! !! !! !
!!!!
! !
!! !! ! !
!!
!!
!
!!! !
!!! ! !!!
! !!!!
! ! !! !! !! ! !!!!!
! !
!! !
! !!!!
!
!!
! ! !!
!
! !
! !! !! ! !!
! !
! !! !!
! !! !
! ! ! !
!!!
!
! ! ! ! ! !! !! ! ! ! ! ! !!
!!!
! ! ! !! !! !
!!
!!
! !
!
!!!
!!
! !!!! !
!! !
! !
! !!
!! ! !! !! ! !!
! !
! ! ! ! ! ! ! ! ! !! ! !! ! !!
! !
!
! !!
!!
!
!
!!
!!
!!
!!
! ! ! ! !
!
!
!
!! !
!!
!
!! !
!
!
!
!!
!
!! !!
!
!
!!
! !
!!
!!
!!
! !
!
! !
!!
!!
!
! !
!!
! !!
!
!!
!
!! !
!
!
!
!!
!!
!!
!
!
!!
!! !
!!
!! !
! !!
!!
!!
! !
!!!
!!
!!
!
!
!!!
!
!!
!
!
!!
! !
!
! !!!
!!
!
!
!!
! !
!
!!!
!!
!
!
!
!
!
!!
!!
! !!
!!
!!
!
!!!
!!
!!
!!
!
!
!
!!
!
!
!
!
! !! !
!
!!
!
!
!
!
!! !!
!!
!
!
!
!
!!
!
!!
! !!
! !
!
!!
!
!!
!
!
! !!
!! !
!!!!
! !!
!!
!
!!
!
!
! !!!
!!!
!!
!
!
!!!
!
!!
!
!
!
!
!
!
!!
!
!!!!
!
!
!
!!
!
!
!
!
!
!
!!
!
!
!
!
!!
!
!!!
!
!
!
!
!
!!
!!
!
!!
!
! !
!
!
!!!
!
!
!
!
!
!!
!
!
!!
!!
!
!
!
!
!!
!
!
!! !!!
!!
!
!
!
! !!
!
!
!
!!
! !!
! ! ! ! !
!
!
!
!
! ! ! ! ! ! ! !! ! !!
!
!
!
! ! ! ! !! !! ! ! ! ! ! ! ! !!! ! ! !
! ! !! !! ! ! !!
!
!
!
!
!
!
!
!
! ! !! ! ! ! ! ! ! ! ! ! ! ! ! !
!
!
! !!
! !
! !! !
!!
!! !
! ! !!
!
! !
!!
! ! !! !! !
!
!
!
!
!!
!
!
!
!! !
!!
!
! !
!
! !!
!!
!!
!
!
!
!
!
!
!
!
!!
!
!!
!
!
!!!
!!
!
!
!
!!
!
!
! !
!
!!
!
!
!
!
!
!
!
!
!
!
!
!
!
!
!
!
!
!
!
!
!
!
!
!
!
!
!
!
!
!
!
!
!
!
!
!
!
!
!
!
!
!
!
!
!
!
!
!
!
!
!
!
!
!
!
!
!
!
!
!
!
!
!
!
!
!
!
!
!
!
!
!
!
!
!
!
!
!
!
!
!
!
!
!
!
!
!
! !
!
!
!
!
!
!
!
!
!
!
!
!
!
!
!
!
!
!
!
!
!
!
!
!
!
!
!
!
!
!
!
!
!! !
!
!
!
!
!
!
!
!
!
!
!
!
!
!
!
!
!
!
! !
!
!
!
!
!
!
!
!
!
!
!
!
!
!
!
!
!
!
!
!
!
!
!
!
!
!
!
!
!
!
!
!
!
!
!
!
!
!
!
!
!
!
!
!
!
!
!
!
!
!
!
!
!
!!
!
!
!
!
!
!
!
!
!
!
!
!
!
!
!
!
!
!
!
!
!
!
!
!
!
!
!
!
!
!
!
!
!
!
!
!
!!
!
!
!
!
!!
!
!!
!
!
!
!
!
!
!
!
!
!
!
!
!
!
!
!
!
!
!
! !
!
!
!
!
!
!
!
!
!
!
!
!
!
!
!
!
!
!
!
!
!
!
!
!
!
!
!
!
!
!
!
!
!
!
!
!
!
!(T
MARKET ST EUCLID
AV
HILLTOP DR
A ST
ROSWELL ST
GUYMON ST
GENEVA AV
GLEN RD
MARILOU RD
LENOX DR
WINSTON
DR
LISE AV
NARANJA ST
49TH S
T
48TH S
T
ELWOOD
AV
DATE ST
50TH S
T
SR-94 RA
SELMA PL
CRESTON DR
BEVERLY ST
MARY L
OU ST
HAL ST
DERBY
ST
LYON ST
HANOVE
R ST
UVAS ST
CAROLIN
A LN
DASSCO
ST
MELROSE PL
KENWOOD ST
HALLMARK WY
ZIRCON ST
DASSCO CT
LACE PL
49TH S
T
WB ON-RAMP
51ST ST
ALLEY
EB OFF-RAMP
SR-94 WB
ON RA
HILLTOP DR
48TH S
T
DATE ST
BEECH ST
EB ON-
RAMP
FEDERAL BL
54TH S
T
WB ON-RAMP
DUVAL ST
DUVAL
ST
ALTADE
NA AVLYON ST
BEECH ST
SR-94 RA
PRIVATE RD 0 0.06 0.120.03Miles
Source:Fehr & Peers (2014)
February 2014
Figure 7: Future Transit LOS (PM Peak)Euclid Ave
´
94
!(T Trolley StationProject AreaOrange Line Trolley
Bus StopA - CDEF
Transit Level of Service

Euclid Avenue Corridor Master Plan – Future Multi-Modal Conditions
February 28, 2014
BICYCLE LEVEL OF SERVICE
Table 11 and Table 12 display Bicycle LOS in the project area under buildout conditions of the Master
Plan for the AM and PM peak hours, respectively. Figure 8 and Figure 9 illustrate the corresponding
Future Bicycle LOS for each of peak hours along the Euclid Avenue corridor. The existing Bicycle LOS is
also displayed in each table to show the projected change between current conditions and the Master
Plan. MMLOS calculation worksheets are provided in Appendix H.
Table 11: Existing and Future Bicycle AM Peak Hour LOS Results
Existing Future
Euclid Avenue Segment
LOS Northbound (NB) Southbound (SB)
NB SB LOS Score
Bicycle LOS
LOS Score
Bicycle LOS
Federal Avenue to SR-94 WB Ramps1
D E2 3.82 D 4.61 E2
SR-94 WB Ramps to SR-94 EB Ramps1,3
C C 3.22 C 3.15 C
SR-94 EB Ramps to Hilltop Drive1,3
E2 C 4.75 E2 3.15 C
Hilltop Drive to Lise Avenue3
D C 3.48 C 3.08 C
Lise Avenue to Guymon Street3
C C 3.52 D 3.09 C
Guymon Street to Market Street3
C D 3.54 D 3.49 C
1. Portions or the entire segment is part of Caltrans right-of-way. Therefore, any proposed changes or enhancements at this location are subject for review and approval by Caltrans.
2. Bold letter indicates unacceptable LOS E or F. 3. Buffered bicycle lanes assumed on both sides of the segment. Source: Fehr & Peers, February 2014
49

Euclid Avenue Corridor Master Plan – Future Multi-Modal Conditions
February 28, 2014
Table 12: Existing and Future Bicycle PM Peak Hour LOS Results
Existing Future
Euclid Avenue Segment
LOS Northbound (NB) Southbound (SB)
NB SB LOS
Score Bicycle
LOS LOS
Score Bicycle
LOS
Federal Avenue to SR-94 WB Ramps1
D E2 3.82 D 4.62 E2
SR-94 WB Ramps to SR-94 EB Ramps1,3
C D 3.26 C 3.2 C
SR-94 EB Ramps to Hilltop Drive1,3
E2 C 4.79 E2 3.25 C
Hilltop Drive to Lise Avenue3
D C 3.47 C 3.17 C
Lise Avenue to Guymon Street3
C D 3.51 D 3.16 C
Guymon Street to Market Street3
C D 3.53 D 3.55 D
1. Portions or the entire segment is part of Caltrans right-of-way. Therefore, any proposed changes or enhancements at this location are subject for review and approval by Caltrans.
2. Bold letter indicates unacceptable LOS E or F. 3. Buffered bicycle lanes assumed on both sides of the segment. Source: Fehr & Peers, February 2014
According to the CSLOS results, bicyclists will generally experience good to fair LOS (LOS C or D) when
riding along the majority of the segments within the Euclid Avenue Master Plan corridor during both the
AM and PM peak hours. Bicyclists traveling northbound between Hilltop Drive and the SR-94 EB Ramps
and bicyclists traveling southbound along Euclid Avenue between Federal Avenue and the SR-94 Ramps
are projected to experience lower than desirable peak hour levels of service (LOS E). Factors that influence
the poor CLOS calculation at these select locations include the relatively high peak hour traffic and speeds
at these segments. In the case of the poor calculated operating level (LOS E) for northbound bicyclists
between the freeway and Hilltop Drive, the vehicle turns associated with the gas station driveways and the
unsignalized intersection of Euclid Avenue and Geneva Avenue along the east side of Euclid Avenue also
contribute to the poor LOS because of potential bicycle-vehicle conflicts. While the lack of buffered Class
II bicycle facilities along Euclid Avenue between Federal Avenue and the SR-94 Ramps contribute to the
segment’s poor calculated operating level (LOS E), in addition to the high segment volumes and speed.
50

!(T
MARKET ST EUCLID
AV
HILLTOP DR
A ST
ROSWELL ST
GUYMON ST
GENEVA AV
GLEN RD
MARILOU RD
LENOX DR
WINSTON
DR
LISE AV
NARANJA ST
49TH S
T
48TH S
T
ELWOOD
AV
50TH S
T
SR-94 RA
SELMA PL
CRESTON DR
BEVERLY ST
MARY L
OU ST
HAL ST
DERBY
ST
LYON ST
HANOVE
R ST
UVAS ST
CAROLIN
A LN
DASSCO
ST
MELROSE PL
KENWOOD ST
HALLMARK WYDASSCO CT
LACE PL
49TH S
T
WB ON-RAMP
51ST ST
ALLEY
EB OFF-RAMP
SR-94 WB
ON RA
HILLTOP DR
48TH S
T
BEECH ST
EB ON-
RAMP
FEDERAL BL
54TH S
T
WB ON-RAMP
DUVAL ST
DUVAL
ST
ALTADE
NA AVLYON ST
BEECH ST
SR-94 RA
PRIVATE RD 0 0.06 0.120.03Miles
Source:Fehr & Peers (2014)
February 2014
Figure 8: Future Bicycle LOS (AM Peak)Euclid Ave
´
94
!(T Trolley StationProject Area
Orange Line Trolley
A - CDEF
Bicycle Level of Service

!(T
MARKET ST EUCLID
AV
HILLTOP DR
A ST
ROSWELL ST
GUYMON ST
GENEVA AV
GLEN RD
MARILOU RD
LENOX DR
WINSTON
DR
LISE AV
NARANJA ST
49TH S
T
48TH S
T
ELWOOD
AV
50TH S
T
SR-94 RA
SELMA PL
CRESTON DR
BEVERLY ST
MARY L
OU ST
HAL ST
DERBY
ST
LYON ST
HANOVE
R ST
UVAS ST
CAROLIN
A LN
DASSCO
ST
MELROSE PL
KENWOOD ST
HALLMARK WYDASSCO CT
LACE PL
49TH S
T
WB ON-RAMP
51ST ST
ALLEY
EB OFF-RAMP
SR-94 WB
ON RA
HILLTOP DR
48TH S
T
BEECH ST
EB ON-
RAMP
FEDERAL BL
54TH S
T
WB ON-RAMP
DUVAL ST
DUVAL
ST
ALTADE
NA AVLYON ST
BEECH ST
SR-94 RA
PRIVATE RD 0 0.06 0.120.03Miles
Source:Fehr & Peers (2014)
February 2014
Figure 9: Future Bicycle LOS (PM Peak)Euclid Ave
´
94
!(T Trolley StationProject Area
Orange Line Trolley
A - CDEF
Bicycle Level of Service
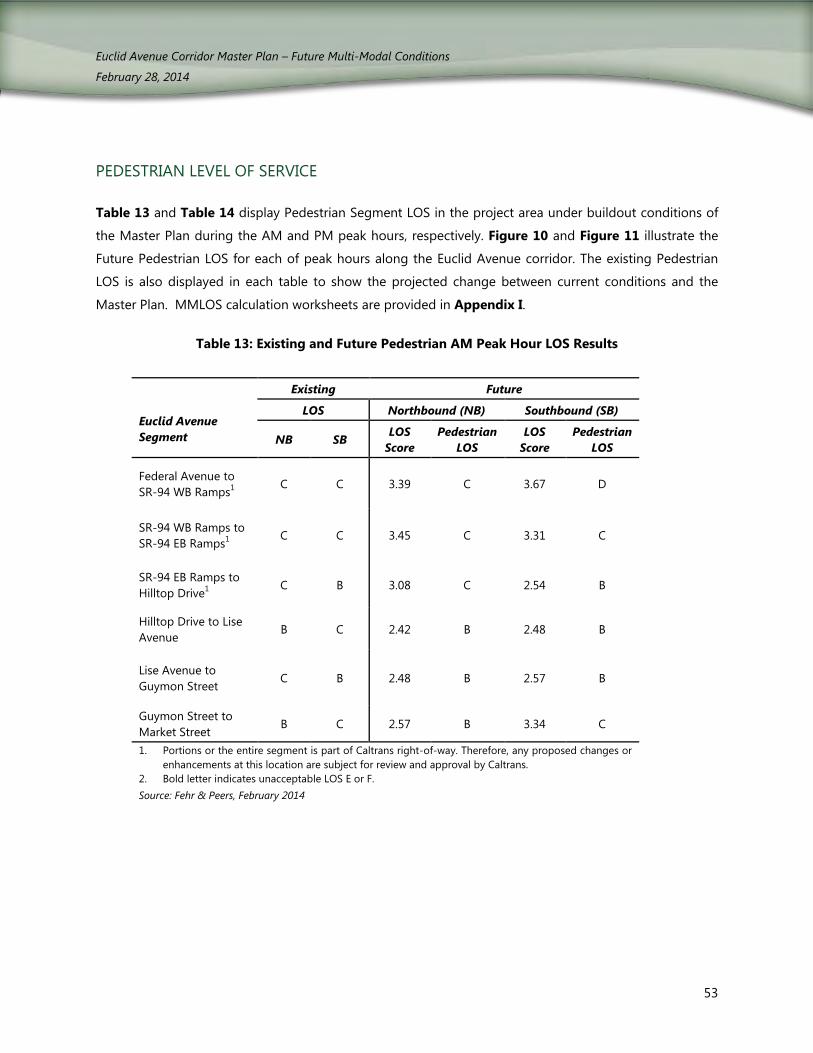
Euclid Avenue Corridor Master Plan – Future Multi-Modal Conditions
February 28, 2014
PEDESTRIAN LEVEL OF SERVICE
Table 13 and Table 14 display Pedestrian Segment LOS in the project area under buildout conditions of
the Master Plan during the AM and PM peak hours, respectively. Figure 10 and Figure 11 illustrate the
Future Pedestrian LOS for each of peak hours along the Euclid Avenue corridor. The existing Pedestrian
LOS is also displayed in each table to show the projected change between current conditions and the
Master Plan. MMLOS calculation worksheets are provided in Appendix I.
Table 13: Existing and Future Pedestrian AM Peak Hour LOS Results
Existing Future
Euclid Avenue Segment
LOS Northbound (NB) Southbound (SB)
NB SB LOS Score
Pedestrian LOS
LOS Score
Pedestrian LOS
Federal Avenue to SR-94 WB Ramps1
C C 3.39 C 3.67 D
SR-94 WB Ramps to SR-94 EB Ramps1
C C 3.45 C 3.31 C
SR-94 EB Ramps to Hilltop Drive1
C B 3.08 C 2.54 B
Hilltop Drive to Lise Avenue
B C 2.42 B 2.48 B
Lise Avenue to Guymon Street
C B 2.48 B 2.57 B
Guymon Street to Market Street
B C 2.57 B 3.34 C
1. Portions or the entire segment is part of Caltrans right-of-way. Therefore, any proposed changes or enhancements at this location are subject for review and approval by Caltrans.
2. Bold letter indicates unacceptable LOS E or F. Source: Fehr & Peers, February 2014
53

Euclid Avenue Corridor Master Plan – Future Multi-Modal Conditions
February 28, 2014
Table 14: Existing and Future Pedestrian PM Peak Hour LOS Results
Existing Future
Euclid Avenue Segment
Existing LOS Northbound (NB) Southbound (SB)
NB SB LOS
Score Pedestrian
LOS LOS
Score Pedestrian
LOS
Federal Avenue to SR-94 WB Ramps1
C C 3.39 C 3.79 D
SR-94 WB Ramps to SR-94 EB Ramps1
C C 3.57 D 3.46 C
SR-94 EB Ramps to Hilltop Drive1
C B 3.05 C 3.27 C
Hilltop Drive to Lise Avenue
B C 2.88 C 2.92 C
Lise Avenue to Guymon Street
C B 2.71 B 2.98 C
Guymon Street to Market Street
B C 2.8 C 3.50 C
1. Portions or the entire segment is part of Caltrans right-of-way. Therefore, any proposed changes or enhancements at this location are subject for review and approval by Caltrans.
2. Bold letter indicates unacceptable LOS E or F. Source: Fehr & Peers, February 2014
As shown in the tables, pedestrians are projected to experience good to fair LOS (D or better) when
walking on Euclid Avenue under the buildout of the Master Plan. The Pedestrian LOS degrades slightly
along Euclid Avenue segments from Federal Avenue and Hilltop Drive between existing conditions and
buildout conditions due to the increase in vehicular traffic throughout the corridor. However, the
Pedestrian LOS does improve at some locations because of the proposed new eight-foot sidewalks that
will include a landscaped parkway buffer along the corridor.
54

!(T
MARKET ST EUCLID
AV
HILLTOP DR
A ST
ROSWELL ST
GUYMON ST
GENEVA AV
GLEN RD
MARILOU RD
LENOX DR
WINSTON
DR
LISE AV
NARANJA ST
49TH S
T
48TH S
T
ELWOOD
AV
50TH S
T
SR-94 RA
SELMA PL
CRESTON DR
BEVERLY ST
MARY L
OU ST
HAL ST
DERBY
ST
LYON ST
HANOVE
R ST
UVAS ST
CAROLI
NA LN
DASSCO
ST
MELROSE PL
KENWOOD ST
HALLMARK WYDASSCO CT
LACE PL
49TH S
T
WB ON-RAMP
51ST ST
ALLEY
EB OFF-RAMP
SR-94 WB
ON RA
HILLTOP DR
48TH S
T
BEECH ST
EB ON-
RAMP
FEDERAL BL
54TH S
T
WB ON-RAMP
DUVAL ST
DUVAL
ST
ALTADE
NA AVLYON ST
BEECH ST
SR-94 RA
PRIVATE RD 0 0.06 0.120.03Miles
Source:Fehr & Peers (2014)
February 2014
Figure 10: Future Pedestrian LOS (AM Peak)Euclid Ave
´
94
!(T Trolley StationProject Area
Orange Line Trolley
A - CDEF
Pedestrian Level of Service

!(T
MARKET ST EUCLID
AV
HILLTOP DR
A ST
ROSWELL ST
GUYMON ST
GENEVA AV
GLEN RD
MARILOU RD
LENOX DR
WINSTON
DR
LISE AV
NARANJA ST
49TH S
T
48TH S
T
ELWOOD
AV
50TH S
T
SR-94 RA
SELMA PL
CRESTON DR
BEVERLY ST
MARY L
OU ST
HAL ST
DERBY
ST
LYON ST
HANOVE
R ST
UVAS ST
CAROLI
NA LN
DASSCO
ST
MELROSE PL
KENWOOD ST
HALLMARK WYDASSCO CT
LACE PL
49TH S
T
WB ON-RAMP
51ST ST
ALLEY
EB OFF-RAMP
SR-94 WB
ON RA
HILLTOP DR
48TH S
T
BEECH ST
EB ON-
RAMP
FEDERAL BL
54TH S
T
WB ON-RAMP
DUVAL ST
DUVAL
ST
ALTADE
NA AVLYON ST
BEECH ST
SR-94 RA
PRIVATE RD 0 0.06 0.120.03Miles
Source:Fehr & Peers (2014)
February 2014
Figure 11: Future Pedestrian LOS (PM Peak)Euclid Ave
´
94
!(T Trolley StationProject Area
Orange Line Trolley
A - CDEF
Pedestrian Level of Service

Euclid Avenue Corridor Master Plan – Future Multi-Modal Conditions
February 28, 2014
CONCLUSION
The proposed land uses within the Master Plan are expected to increase vehicle traffic within the Euclid
Avenue corridor. However, due to the mixed-use nature and village-style land uses that are proposed
within key parts of the study area, it is anticipated that there will be a better balance between various
modes of travel and the project design, coupled with enhancements to pedestrian, bicycle and transit
infrastructure, will minimize the number of vehicle trips. While it is anticipated that vehicular travel within
the corridor will increase, it is projected that the volumes of active mode travel (pedestrian and bike) will
more than double, and transit demand is expected to increase by 129% by 2035.
To help accommodate the projected increase in travel demand throughout the study area, the Master
Plan includes a series of multi-modal improvements within the Euclid Avenue corridor, as displayed in
Appendix A. The mobility option figures illustrate locations for curb bulb-outs, signalization, and high
visibility crosswalks under the interim condition and the long-term conditions of the Master Plan. Bicycle
lanes can be installed as part of the interim plan. Widening Euclid Avenue in the long term would permit
the installation of buffered bike lanes and improved pedestrian facilities. Overall, these recommended
improvements will create a more desirable pedestrian and bicycle environment and while still balancing
the needs of moving and parked vehicles.
As future development occurs in the corridor, it is recommended that the City of San Diego continue to
monitor the pedestrian and vehicular volumes to determine the correct time to implement the proposed
enhanced crosswalk and traffic signal improvements. The City should also work with SANDAG and MTS to
monitor transit ridership throughout the Euclid Avenue corridor to determine the appropriate time to
increase bus frequencies and whether or not additional transit service is needed.
57

APPENDIX A: PROPOSED MOBILITY CONCEPT FIGURES

LISE
HILLTOP
GUYMON
CAROLINA
LACE
HILLTOP
WIN
ST
ON
ROSWELL
GENEVAE
LWO
OD
LENOX
HA
L
51
st
EU
CL
ID
Brighton Place San Diego
Horton Elementary
School
Chollas C
reek
SR-94
Chol
las C
reek
5’ 10’ 10’ 10’ 10’ 10’ 6’ 7’
Bike facilities transition from Class II (south of
Geneva) to Class III (north of Geneva)
Accommodate bike lanes by removing existing on-street
parking from west side of Euclid and narrowing
vehicle travel / turn lanes
EUCLID AVENUE MOBILITY CONCEPT: INTERIM (remove west side parking, add bike lanes)Feb. 28, 2014
LEGEND*
Existing Bus Stop
Existing Traffic Signal
* This plan is conceptual: right-of-way / lane widths are under evaluation (including warrant studies), and final design and dimensions are to be determined and subject to change
Class II Bike Lane (new)
Class III Bike Route (new)
Vehicle Travel LaneCenter Turn Lane / Median
On-Street Parallel Parking (existing)
RRFB Installation (new)Paint Borders of Existing Crosswalks to Increase VisibilityExisting Street LightProposed Street LightSide Street Stop Controlled
High-Visibility Crosswalk (School)
Standard Crosswalk
Existing intersection conditions:Euclid at Hilltop
Existing intersection conditions:Euclid at Lise
Existing intersection conditions:Euclid at Guymon
Existing intersection conditions: Euclid at EB SR-94 offramp
B i h Pl
Existing intersection conditions: Euclid at WB SR-94 offramp

LISE
HILLTOP
GUYMON
CAROLINA
LACE
HILLTOP
WIN
ST
ON
ROSWELL
GENEVAE
LWO
OD
LENOX
HA
L
51
st
EU
CL
ID
Brighton Place San Diego
Horton Elementary
School
Chollas C
reek
SR-94
Chol
las C
reek
7’ 11’ 10’ 10’ 10’ 11’ 7’ 7’
Begin transition from alignment south of
Geneva to alignment on SR-94 overpass
SR-94 EB on-ramp and off-ramp to be consolidated on east side of overpass; traffic control at signalized intersection with Euclid
EUCLID AVENUE MOBILITY CONCEPT: LONG TERM (with redevelopment of all corridor parcels: expand ROW to west,
improve intersections, install parkway strip between street and sidewalk both sides, connect Hilltop Drive) Feb. 28, 2014
LEGEND*
Existing Bus Stop
Existing Street LightProposed Street Light
Side Street Stop Controlled
Existing Traffic SignalProposed Traffic Signal
Hilltop Drive Connection
Class II Bike Lane - buffered (5’ + 2’)Landscaped Parkway Strip
Vehicle Travel Lane
New Intersection Improvements: ADA ramps, countdown signals, and bulb-outs where possible (east side of Euclid Avenue and side streets only)
Center Turn Lane / Median
On-Street Parallel Parking
New Sidewalk
High-Visibility Crosswalk (School)Standard Crosswalk
High-Visibility Crosswalk
* This plan is conceptual: right-of-way / lane widths are under evaluation (including warrant studies), and final design and dimensions are to be determined and subject to change
Existing intersection conditions:Euclid at Hilltop
Existing intersection conditions:Euclid at Lise
Existing intersection conditions:Euclid at Guymon
Existing intersection conditions: Euclid at EB SR-94 offramp
B i h Pl
Existing intersection conditions: Euclid at WB SR-94 offramp

APPENDIX B: LAND USE ASSUMPTIONS

Existing Land Use Summary.txt� SESD and Encanto\Base Year 2008 Cal 5 PAGE 1
Land Use Summary
Person ---------- Activity ---------- -------- Trip Rate --------- Code Name Trips DUs Acres Employment du acre employee 111 SINGLE FAMILY 26. 2. 0. 0. 12.9 0.0 0.0 112 SINGLE FAMILY 192004. 14884. 0. 0. 12.9 0.0 0.0 121 MULTI-FAMILY 61229. 5371. 0. 0. 11.4 0.0 0.0 122 MULTI-FAMILY 63176. 7346. 0. 0. 8.6 0.0 0.0 131 MOBILE HOME PARK 4575. 610. 0. 0. 7.5 0.0 0.0 1411 CONGREGATE CARE FACILITY 77. 0. 18. 0. 0.0 4.3 0.0 1421 CORRECTIONAL FACILITY 840. 0. 300. 0. 0.0 2.8 0.0 1511 MOTEL 1329. 0. 91. 0. 0.0 14.6 0.0 2111 INDUSTRIAL PARK 476. 0. 26. 0. 0.0 18.3 0.0 2113 LIGHT INDUSTRY GENERAL 41422. 0. 2227. 0. 0.0 18.6 0.0 2114 WAREHOUSING 639. 0. 105. 0. 0.0 6.1 0.0 2311 SCRAP YARD/LANDFILL 48. 0. 6. 0. 0.0 7.4 0.0 4112 RIGHT-OF-WAY 0. 0. 1907. 0. 0.0 0.0 0.0 4113 COMMUNICATION OR UTILITY 199. 0. 62. 0. 0.0 3.2 0.0 4114 PARKING 0. 0. 11. 0. 0.0 0.0 0.0 4121 RAIL/TRANSIT CENTER 2089. 0. 5. 0. 0.0 392.8 0.0 4129 OTHER TRANSPORTATION 18. 0. 2. 0. 0.0 7.9 0.0 5010 VACANT COMMERCIAL 0. 0. 13. 0. 0.0 0.0 0.0 5011 HIGH TURNOVER RESTAURANT 2228. 0. 12. 0. 0.0 178.8 0.0 5013 SUPERMARKET 908. 0. 4. 0. 0.0 206.3 0.0 5014 CONVENIENCE MARKET CHAIN 29904. 0. 43. 0. 0.0 687.8 0.0 5024 CAR WASH 550. 0. 4. 0. 0.0 137.6 0.0 5025 SERVICE STATION FOOD MART 7839. 0. 38. 0. 0.0 206.3 0.0 5027 SERVICE STATION CAR WASH 4264. 0. 20. 0. 0.0 213.2 0.0 5028 AUTO PARTS 490. 0. 6. 0. 0.0 85.3 0.0 5029 AUTO REPAIR 1418. 0. 52. 0. 0.0 27.5 0.0 5030 AUTO TIRES 317. 0. 9. 0. 0.0 34.4 0.0
Page 1

Existing Land Use Summary.txt 5131 WHOLESALE TRADE 1986. 0. 20. 0. 0.0 98.9 0.0 5133 COMMUNITY SHOP CENTER 84075. 0. 779. 0. 0.0 107.9 0.0 5134 NEIGHBORHOOD SHOP CENTER 18656. 0. 110. 0. 0.0 169.5 0.0 5136 AUTO DEALERSHIP 89. 0. 0. 0. 0.0 423.8 0.0 5137 ARTERIAL COMMERCIAL 59701. 0. 1085. 0. 0.0 55.0 0.0 5138 SERVICE STATION 2971. 0. 16. 0. 0.0 185.7 0.0 5139 OTHER RETAIL TRADE 1453. 0. 26. 0. 0.0 55.1 0.0 6012 LOW RISE OFFICE A 16755. 0. 314. 0. 0.0 53.4 0.0 6013 GOV'T /CIVIC CENTER 2832. 0. 71. 0. 0.0 39.9 0.0 6014 GOV'T OFFICE 881. 0. 22. 0. 0.0 39.9 0.0 6111 CEMETERY 1026. 0. 168. 0. 0.0 6.1 0.0 6112 RELIGIOUS FACILITY 6082. 0. 936. 0. 0.0 6.5 0.0 6113 LIBRARY 2273. 0. 31. 0. 0.0 73.6 0.0 6115 FIRE OR POLICE STATION 1715. 0. 42. 0. 0.0 40.7 0.0 6114 POST OFFICE 1680. 0. 6. 0. 0.0 287.3 0.0 6119 OTHER PUBLIC SERVICE 393. 0. 28. 0. 0.0 13.8 0.0 6129 MEETING ROOM FACILITY 1981. 0. 48. 0. 0.0 41.5 0.0 6511 CLINIC 12686. 0. 188. 0. 0.0 67.3 0.0 6519 OTHER HEALTH CARE 3527. 0. 52. 0. 0.0 67.3 0.0 6810 DAY CARE CENTER 1549. 0. 254. 0. 0.0 6.1 0.0 6812 UNIVERSITY OR COLLEGE 15334. 0. 7667. 0. 0.0 2.0 0.0 6814 SENIOR HIGH SCHOOL 13132. 0. 3283. 0. 0.0 4.0 0.0 6815 JUNIOR HIGH OR MIDDLE SCHOOL 6902. 0. 3001. 0. 0.0 2.3 0.0 6816 ELEMENTARY SCHOOL 39331. 0. 11568. 0. 0.0 3.4 0.0 6819 OTHER SCHOOL 1317. 0. 60. 0. 0.0 21.8 0.0 7200 COMMERCIAL RECREATION 395. 0. 9. 0. 0.0 44.0 0.0 7220 OTHER RECREATION-HIGH 643. 0. 9. 0. 0.0 73.4 0.0 7611 OPEN SPACE PARK 1828. 0. 237. 0. 0.0 7.7 0.0 7613 ACTIVE PARK 10249. 0. 133. 0. 0.0 77.0 0.0 9101 INACTIVE USE 0. 0. 3. 0. 0.0 0.0 0.0 total 727508. 28213. 35132. 0.
Page 2

Existing Land Use Summary.txt
9aug13/08:28:04/tgm.sum
Page 3

Existing Land Use TG by Land Use by zone.txt SESD and Encanto\Base Year 2008 Cal 5 trip generation and land use by zone page 1
---------------------- Land Use ---------------------- -----Trips----- Zone Code Name Type Amount Person Vehicle
3554 111 SINGLE FAMILY du 1.0 13. 9. 3554 112 SINGLE FAMILY du 550.0 7095. 4952. 3554 121 MULTI-FAMILY du 3.0 34. 24. 3554 1411 CONGREGATE CARE FACILITY other 6.0 26. 18. 3554 4112 RIGHT-OF-WAY acre 32.3 0. 0. 3554 7611 OPEN SPACE PARK acre 2.3 18. 12. 3554 TOTAL 7186. 5015.
3574 2113 LIGHT INDUSTRY GENERAL ksf 152.7 2840. 2349. 3574 4112 RIGHT-OF-WAY acre 9.1 0. 0. 3574 TOTAL 2840. 2349.
3594 4112 RIGHT-OF-WAY acre 21.2 0. 0. 3594 TOTAL 0. 0.
3602 112 SINGLE FAMILY du 226.0 2915. 2035. 3602 4112 RIGHT-OF-WAY acre 28.8 0. 0. 3602 4113 COMMUNICATION OR UTILITY acre 31.3 100. 78. 3602 6112 RELIGIOUS FACILITY ksf 14.0 91. 70. 3602 6816 ELEMENTARY SCHOOL other 357.0 1214. 678. 3602 7611 OPEN SPACE PARK acre 70.6 543. 358. 3602 7613 ACTIVE PARK acre 9.4 725. 477. 3602 TOTAL 5589. 3696.
3627 112 SINGLE FAMILY du 295.0 3805. 2656. 3627 121 MULTI-FAMILY du 25.0 285. 200. 3627 4112 RIGHT-OF-WAY acre 23.0 0. 0. 3627 TOTAL 4090. 2856.
3696 112 SINGLE FAMILY du 170.0 2193. 1531. 3696 121 MULTI-FAMILY du 23.0 262. 184. 3696 122 MULTI-FAMILY du 13.0 112. 78. 3696 4112 RIGHT-OF-WAY acre 8.4 0. 0. 3696 6112 RELIGIOUS FACILITY ksf 5.7 37. 28. 3696 6816 ELEMENTARY SCHOOL other 713.0 2424. 1355. 3696 7611 OPEN SPACE PARK acre 0.7 5. 4. 3696 TOTAL 5033. 3180.
3720 112 SINGLE FAMILY du 337.0 4347. 3034. 3720 121 MULTI-FAMILY du 3.0 34. 24. 3720 4112 RIGHT-OF-WAY acre 13.3 0. 0. 3720 6112 RELIGIOUS FACILITY ksf 16.6 108. 83. 3720 7611 OPEN SPACE PARK acre 7.2 56. 37. 3720 TOTAL 4545. 3178.
3744 112 SINGLE FAMILY du 278.0 3586. 2503. 3744 121 MULTI-FAMILY du 91.0 1037. 728. 3744 122 MULTI-FAMILY du 13.0 112. 78. 3744 2114 WAREHOUSING ksf 1.7 10. 9. 3744 4112 RIGHT-OF-WAY acre 29.7 0. 0. 3744 6111 CEMETERY acre 44.7 273. 223. 3744 6112 RELIGIOUS FACILITY ksf 22.0 143. 110. 3744 TOTAL 5161. 3652.
9aug13/08:28:04/tgm.pr� SESD and Encanto\Base Year 2008 Cal 5
Page 1

Existing Land Use TG by Land Use by zone.txt trip generation and land use by zone page 2
---------------------- Land Use ---------------------- -----Trips----- Zone Code Name Type Amount Person Vehicle
3745 112 SINGLE FAMILY du 284.0 3664. 2557. 3745 121 MULTI-FAMILY du 224.0 2554. 1793. 3745 122 MULTI-FAMILY du 65.0 559. 392. 3745 4112 RIGHT-OF-WAY acre 67.8 0. 0. 3745 6112 RELIGIOUS FACILITY ksf 4.3 28. 21. 3745 TOTAL 6804. 4764.
3764 112 SINGLE FAMILY du 346.0 4463. 3115. 3764 4112 RIGHT-OF-WAY acre 18.2 0. 0. 3764 6814 SENIOR HIGH SCHOOL other 950.0 3800. 1710. 3764 6815 JUNIOR HIGH OR MIDDLE SCHOOL other 420.0 966. 593. 3764 7613 ACTIVE PARK acre 4.7 365. 240. 3764 TOTAL 9594. 5658.
3766 112 SINGLE FAMILY du 13.0 168. 117. 3766 121 MULTI-FAMILY du 9.0 103. 72. 3766 122 MULTI-FAMILY du 3.0 26. 18. 3766 2113 LIGHT INDUSTRY GENERAL ksf 410.3 7631. 6310. 3766 2114 WAREHOUSING ksf 30.3 185. 155. 3766 4112 RIGHT-OF-WAY acre 39.4 0. 0. 3766 4113 COMMUNICATION OR UTILITY acre 15.6 50. 39. 3766 7611 OPEN SPACE PARK acre 0.7 6. 4. 3766 TOTAL 8168. 6715.
3767 2113 LIGHT INDUSTRY GENERAL ksf 596.5 11095. 9174. 3767 4112 RIGHT-OF-WAY acre 8.0 0. 0. 3767 5133 COMMUNITY SHOP CENTER ksf 127.6 13768. 9743. 3767 6511 CLINIC ksf 31.9 2148. 1595. 3767 7611 OPEN SPACE PARK acre 0.1 1. 1. 3767 7613 ACTIVE PARK acre 5.6 434. 285. 3767 TOTAL 27446. 20798.
3817 112 SINGLE FAMILY du 270.0 3483. 2431. 3817 121 MULTI-FAMILY du 45.0 513. 360. 3817 122 MULTI-FAMILY du 83.0 714. 501. 3817 4112 RIGHT-OF-WAY acre 29.2 0. 0. 3817 4113 COMMUNICATION OR UTILITY acre 0.3 1. 1. 3817 6112 RELIGIOUS FACILITY ksf 15.0 98. 75. 3817 7611 OPEN SPACE PARK acre 0.1 1. 0. 3817 7613 ACTIVE PARK acre 5.0 387. 255. 3817 TOTAL 5196. 3623.
3831 112 SINGLE FAMILY du 9.0 116. 81. 3831 121 MULTI-FAMILY du 7.0 80. 56. 3831 122 MULTI-FAMILY du 69.0 593. 417. 3831 2113 LIGHT INDUSTRY GENERAL ksf 29.2 543. 449. 3831 4112 RIGHT-OF-WAY acre 17.0 0. 0. 3831 4113 COMMUNICATION OR UTILITY acre 2.9 9. 7. 3831 5137 ARTERIAL COMMERCIAL ksf 24.4 1342. 975. 3831 6012 LOW RISE OFFICE A ksf 51.7 2760. 2125. 3831 6112 RELIGIOUS FACILITY ksf 13.8 90. 69. 3831 6119 OTHER PUBLIC SERVICE ksf 8.1 111. 80.
9aug13/08:28:04/tgm.pr� SESD and Encanto\Base Year 2008 Cal 5 trip generation and land use by zone page 3
---------------------- Land Use ---------------------- -----Trips-----Page 2
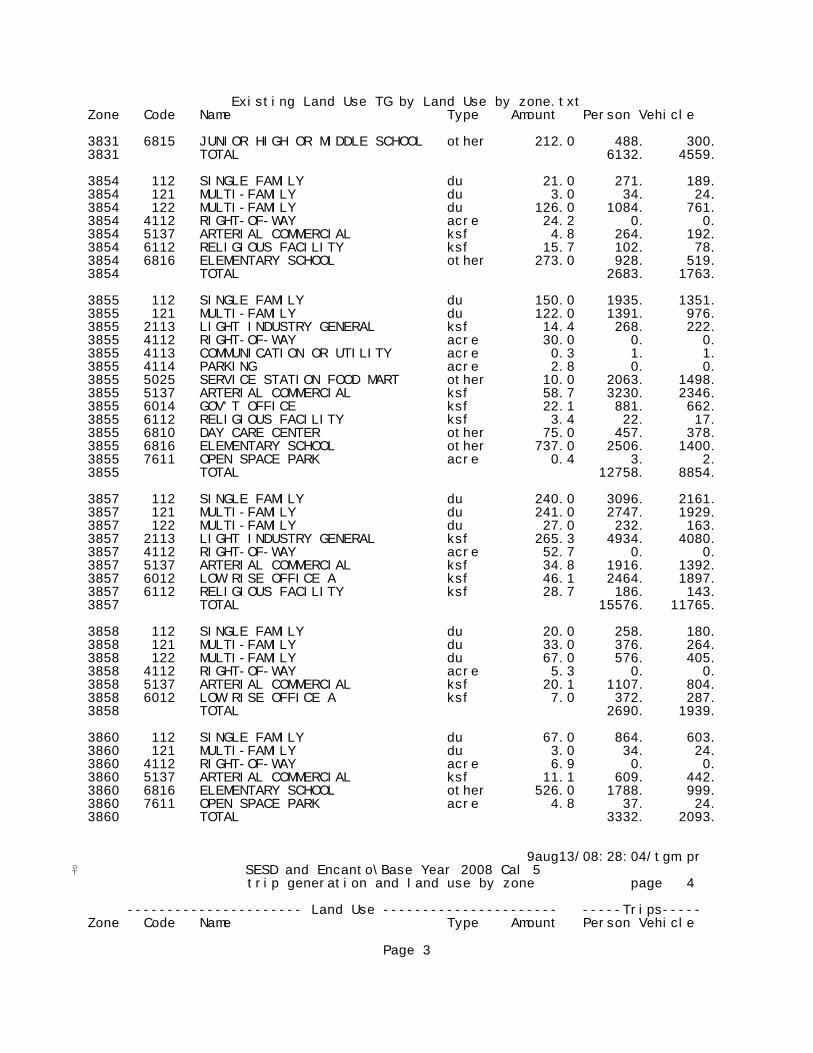
Existing Land Use TG by Land Use by zone.txt Zone Code Name Type Amount Person Vehicle
3831 6815 JUNIOR HIGH OR MIDDLE SCHOOL other 212.0 488. 300. 3831 TOTAL 6132. 4559.
3854 112 SINGLE FAMILY du 21.0 271. 189. 3854 121 MULTI-FAMILY du 3.0 34. 24. 3854 122 MULTI-FAMILY du 126.0 1084. 761. 3854 4112 RIGHT-OF-WAY acre 24.2 0. 0. 3854 5137 ARTERIAL COMMERCIAL ksf 4.8 264. 192. 3854 6112 RELIGIOUS FACILITY ksf 15.7 102. 78. 3854 6816 ELEMENTARY SCHOOL other 273.0 928. 519. 3854 TOTAL 2683. 1763.
3855 112 SINGLE FAMILY du 150.0 1935. 1351. 3855 121 MULTI-FAMILY du 122.0 1391. 976. 3855 2113 LIGHT INDUSTRY GENERAL ksf 14.4 268. 222. 3855 4112 RIGHT-OF-WAY acre 30.0 0. 0. 3855 4113 COMMUNICATION OR UTILITY acre 0.3 1. 1. 3855 4114 PARKING acre 2.8 0. 0. 3855 5025 SERVICE STATION FOOD MART other 10.0 2063. 1498. 3855 5137 ARTERIAL COMMERCIAL ksf 58.7 3230. 2346. 3855 6014 GOV'T OFFICE ksf 22.1 881. 662. 3855 6112 RELIGIOUS FACILITY ksf 3.4 22. 17. 3855 6810 DAY CARE CENTER other 75.0 457. 378. 3855 6816 ELEMENTARY SCHOOL other 737.0 2506. 1400. 3855 7611 OPEN SPACE PARK acre 0.4 3. 2. 3855 TOTAL 12758. 8854.
3857 112 SINGLE FAMILY du 240.0 3096. 2161. 3857 121 MULTI-FAMILY du 241.0 2747. 1929. 3857 122 MULTI-FAMILY du 27.0 232. 163. 3857 2113 LIGHT INDUSTRY GENERAL ksf 265.3 4934. 4080. 3857 4112 RIGHT-OF-WAY acre 52.7 0. 0. 3857 5137 ARTERIAL COMMERCIAL ksf 34.8 1916. 1392. 3857 6012 LOW RISE OFFICE A ksf 46.1 2464. 1897. 3857 6112 RELIGIOUS FACILITY ksf 28.7 186. 143. 3857 TOTAL 15576. 11765.
3858 112 SINGLE FAMILY du 20.0 258. 180. 3858 121 MULTI-FAMILY du 33.0 376. 264. 3858 122 MULTI-FAMILY du 67.0 576. 405. 3858 4112 RIGHT-OF-WAY acre 5.3 0. 0. 3858 5137 ARTERIAL COMMERCIAL ksf 20.1 1107. 804. 3858 6012 LOW RISE OFFICE A ksf 7.0 372. 287. 3858 TOTAL 2690. 1939.
3860 112 SINGLE FAMILY du 67.0 864. 603. 3860 121 MULTI-FAMILY du 3.0 34. 24. 3860 4112 RIGHT-OF-WAY acre 6.9 0. 0. 3860 5137 ARTERIAL COMMERCIAL ksf 11.1 609. 442. 3860 6816 ELEMENTARY SCHOOL other 526.0 1788. 999. 3860 7611 OPEN SPACE PARK acre 4.8 37. 24. 3860 TOTAL 3332. 2093.
9aug13/08:28:04/tgm.pr� SESD and Encanto\Base Year 2008 Cal 5 trip generation and land use by zone page 4
---------------------- Land Use ---------------------- -----Trips----- Zone Code Name Type Amount Person Vehicle
Page 3

Existing Land Use TG by Land Use by zone.txt 3861 112 SINGLE FAMILY du 195.0 2515. 1756. 3861 121 MULTI-FAMILY du 86.0 980. 688. 3861 122 MULTI-FAMILY du 350.0 3010. 2113. 3861 4112 RIGHT-OF-WAY acre 19.0 0. 0. 3861 4121 RAIL/TRANSIT CENTER acre 1.7 669. 511. 3861 5139 OTHER RETAIL TRADE ksf 11.4 627. 457. 3861 6012 LOW RISE OFFICE A ksf 3.3 174. 134. 3861 6112 RELIGIOUS FACILITY ksf 7.0 45. 35. 3861 TOTAL 8022. 5694.
3902 112 SINGLE FAMILY du 71.0 916. 639. 3902 121 MULTI-FAMILY du 38.0 433. 304. 3902 122 MULTI-FAMILY du 200.0 1720. 1208. 3902 2113 LIGHT INDUSTRY GENERAL ksf 5.7 106. 88. 3902 4112 RIGHT-OF-WAY acre 51.0 0. 0. 3902 4129 OTHER TRANSPORTATION acre 1.3 10. 8. 3902 5137 ARTERIAL COMMERCIAL ksf 7.4 408. 296. 3902 6112 RELIGIOUS FACILITY ksf 8.9 58. 44. 3902 TOTAL 3651. 2588.
3904 112 SINGLE FAMILY du 1.0 13. 9. 3904 121 MULTI-FAMILY du 14.0 160. 112. 3904 4112 RIGHT-OF-WAY acre 18.8 0. 0. 3904 5137 ARTERIAL COMMERCIAL ksf 3.2 174. 126. 3904 6111 CEMETERY acre 116.4 710. 582. 3904 6112 RELIGIOUS FACILITY ksf 1.5 9. 7. 3904 7220 OTHER RECREATION-HIGH acre 6.0 438. 299. 3904 TOTAL 1504. 1135.
3905 112 SINGLE FAMILY du 25.0 322. 225. 3905 121 MULTI-FAMILY du 11.0 125. 88. 3905 122 MULTI-FAMILY du 42.0 361. 254. 3905 4112 RIGHT-OF-WAY acre 4.5 0. 0. 3905 5137 ARTERIAL COMMERCIAL ksf 3.6 198. 144. 3905 6112 RELIGIOUS FACILITY ksf 4.8 31. 24. 3905 6511 CLINIC ksf 153.6 10337. 7676. 3905 TOTAL 11375. 8410.
3920 112 SINGLE FAMILY du 31.0 400. 279. 3920 121 MULTI-FAMILY du 26.0 296. 208. 3920 122 MULTI-FAMILY du 29.0 249. 175. 3920 4112 RIGHT-OF-WAY acre 6.6 0. 0. 3920 6112 RELIGIOUS FACILITY ksf 5.3 35. 27. 3920 6816 ELEMENTARY SCHOOL other 808.0 2747. 1535. 3920 TOTAL 3727. 2224.
3921 112 SINGLE FAMILY du 22.0 284. 198. 3921 121 MULTI-FAMILY du 18.0 205. 144. 3921 122 MULTI-FAMILY du 101.0 869. 610. 3921 4112 RIGHT-OF-WAY acre 6.1 0. 0. 3921 6816 ELEMENTARY SCHOOL other 458.0 1557. 870. 3921 TOTAL 2915. 1822.
9aug13/08:28:04/tgm.pr� SESD and Encanto\Base Year 2008 Cal 5 trip generation and land use by zone page 5
---------------------- Land Use ---------------------- -----Trips----- Zone Code Name Type Amount Person Vehicle
3922 112 SINGLE FAMILY du 290.0 3741. 2611. 3922 121 MULTI-FAMILY du 75.0 855. 600.
Page 4

Existing Land Use TG by Land Use by zone.txt 3922 122 MULTI-FAMILY du 45.0 387. 272. 3922 131 MOBILE HOME PARK du 250.0 1875. 1243. 3922 4112 RIGHT-OF-WAY acre 25.6 0. 0. 3922 5137 ARTERIAL COMMERCIAL ksf 13.2 728. 528. 3922 6012 LOW RISE OFFICE A ksf 11.1 595. 458. 3922 6112 RELIGIOUS FACILITY ksf 40.0 260. 200. 3922 7611 OPEN SPACE PARK acre 0.3 2. 1. 3922 TOTAL 8443. 5914.
3924 112 SINGLE FAMILY du 7.0 90. 63. 3924 4112 RIGHT-OF-WAY acre 4.1 0. 0. 3924 4113 COMMUNICATION OR UTILITY acre 0.2 1. 0. 3924 4114 PARKING acre 0.4 0. 0. 3924 5025 SERVICE STATION FOOD MART other 8.0 1650. 1199. 3924 5137 ARTERIAL COMMERCIAL ksf 30.6 1683. 1223. 3924 6112 RELIGIOUS FACILITY ksf 5.9 38. 30. 3924 TOTAL 3463. 2514.
3926 112 SINGLE FAMILY du 4.0 52. 36. 3926 121 MULTI-FAMILY du 9.0 103. 72. 3926 122 MULTI-FAMILY du 35.0 301. 211. 3926 2113 LIGHT INDUSTRY GENERAL ksf 116.4 2165. 1790. 3926 4112 RIGHT-OF-WAY acre 4.2 0. 0. 3926 6112 RELIGIOUS FACILITY ksf 2.4 16. 12. 3926 6129 MEETING ROOM FACILITY ksf 8.0 331. 239. 3926 TOTAL 2967. 2361.
3927 112 SINGLE FAMILY du 18.0 232. 162. 3927 121 MULTI-FAMILY du 9.0 103. 72. 3927 122 MULTI-FAMILY du 100.0 860. 604. 3927 2111 INDUSTRIAL PARK ksf 26.0 476. 395. 3927 2113 LIGHT INDUSTRY GENERAL ksf 96.3 1791. 1481. 3927 4112 RIGHT-OF-WAY acre 10.0 0. 0. 3927 4114 PARKING acre 0.4 0. 0. 3927 5137 ARTERIAL COMMERCIAL ksf 13.6 748. 544. 3927 7611 OPEN SPACE PARK acre 5.9 46. 30. 3927 TOTAL 4256. 3288.
3929 4112 RIGHT-OF-WAY acre 2.7 0. 0. 3929 5137 ARTERIAL COMMERCIAL ksf 20.0 1100. 799. 3929 6013 GOV'T /CIVIC CENTER ksf 18.5 740. 556. 3929 6819 OTHER SCHOOL ksf 9.8 213. 176. 3929 TOTAL 2053. 1531.
3944 112 SINGLE FAMILY du 1.0 13. 9. 3944 121 MULTI-FAMILY du 141.0 1607. 1128. 3944 131 MOBILE HOME PARK du 265.0 1988. 1318. 3944 4112 RIGHT-OF-WAY acre 12.4 0. 0. 3944 4121 RAIL/TRANSIT CENTER acre 1.1 422. 322. 3944 6112 RELIGIOUS FACILITY ksf 5.1 33. 25.
9aug13/08:28:04/tgm.pr� SESD and Encanto\Base Year 2008 Cal 5 trip generation and land use by zone page 6
---------------------- Land Use ---------------------- -----Trips----- Zone Code Name Type Amount Person Vehicle
3944 7611 OPEN SPACE PARK acre 3.5 27. 17. 3944 TOTAL 4089. 2821.
3945 4112 RIGHT-OF-WAY acre 0.6 0. 0. 3945 6012 LOW RISE OFFICE A ksf 64.0 3418. 2632.
Page 5

Existing Land Use TG by Land Use by zone.txt 3945 6129 MEETING ROOM FACILITY ksf 16.0 664. 480. 3945 TOTAL 4082. 3112.
3946 112 SINGLE FAMILY du 299.0 3857. 2692. 3946 4112 RIGHT-OF-WAY acre 23.4 0. 0. 3946 6112 RELIGIOUS FACILITY ksf 14.0 91. 70. 3946 6816 ELEMENTARY SCHOOL other 614.0 2088. 1167. 3946 7611 OPEN SPACE PARK acre 14.6 112. 74. 3946 TOTAL 6148. 4002.
3947 112 SINGLE FAMILY du 112.0 1445. 1008. 3947 121 MULTI-FAMILY du 13.0 148. 104. 3947 122 MULTI-FAMILY du 44.0 378. 266. 3947 2113 LIGHT INDUSTRY GENERAL ksf 7.2 133. 110. 3947 2311 SCRAP YARD/LANDFILL acre 0.4 3. 2. 3947 4112 RIGHT-OF-WAY acre 13.4 0. 0. 3947 4114 PARKING acre 0.3 0. 0. 3947 5131 WHOLESALE TRADE ksf 4.4 433. 307. 3947 5137 ARTERIAL COMMERCIAL ksf 4.0 220. 160. 3947 6112 RELIGIOUS FACILITY ksf 11.5 75. 58. 3947 7611 OPEN SPACE PARK acre 1.9 15. 10. 3947 TOTAL 2849. 2024.
3949 112 SINGLE FAMILY du 346.0 4463. 3115. 3949 121 MULTI-FAMILY du 240.0 2736. 1921. 3949 122 MULTI-FAMILY du 374.0 3216. 2258. 3949 131 MOBILE HOME PARK du 95.0 712. 472. 3949 4112 RIGHT-OF-WAY acre 27.2 0. 0. 3949 5137 ARTERIAL COMMERCIAL ksf 5.0 273. 198. 3949 5138 SERVICE STATION other 8.0 1486. 1082. 3949 6112 RELIGIOUS FACILITY ksf 25.6 166. 128. 3949 6816 ELEMENTARY SCHOOL other 270.0 918. 513. 3949 7611 OPEN SPACE PARK acre 1.0 8. 5. 3949 TOTAL 13979. 9693.
3958 112 SINGLE FAMILY du 58.0 748. 522. 3958 121 MULTI-FAMILY du 21.0 239. 168. 3958 122 MULTI-FAMILY du 41.0 353. 248. 3958 2114 WAREHOUSING ksf 1.5 9. 8. 3958 4112 RIGHT-OF-WAY acre 4.5 0. 0. 3958 4114 PARKING acre 0.1 0. 0. 3958 5011 HIGH TURNOVER RESTAURANT ksf 5.6 1002. 728. 3958 5137 ARTERIAL COMMERCIAL ksf 5.7 312. 227. 3958 TOTAL 2663. 1900.
3959 112 SINGLE FAMILY du 128.0 1651. 1153. 3959 121 MULTI-FAMILY du 8.0 91. 64.
9aug13/08:28:04/tgm.pr� SESD and Encanto\Base Year 2008 Cal 5 trip generation and land use by zone page 7
---------------------- Land Use ---------------------- -----Trips----- Zone Code Name Type Amount Person Vehicle
3959 122 MULTI-FAMILY du 53.0 456. 320. 3959 2113 LIGHT INDUSTRY GENERAL ksf 4.0 75. 62. 3959 4112 RIGHT-OF-WAY acre 6.5 0. 0. 3959 4114 PARKING acre 0.2 0. 0. 3959 5011 HIGH TURNOVER RESTAURANT ksf 1.5 268. 195. 3959 5014 CONVENIENCE MARKET CHAIN ksf 3.0 2063. 1499. 3959 5137 ARTERIAL COMMERCIAL ksf 50.4 2774. 2015. 3959 7613 ACTIVE PARK acre 0.2 12. 8.
Page 6

Existing Land Use TG by Land Use by zone.txt 3959 TOTAL 7390. 5314.
3960 112 SINGLE FAMILY du 53.0 684. 477. 3960 121 MULTI-FAMILY du 6.0 68. 48. 3960 122 MULTI-FAMILY du 110.0 946. 664. 3960 4112 RIGHT-OF-WAY acre 7.2 0. 0. 3960 5029 AUTO REPAIR ksf 2.0 55. 40. 3960 5137 ARTERIAL COMMERCIAL ksf 8.0 440. 320. 3960 TOTAL 2193. 1549.
3961 112 SINGLE FAMILY du 43.0 555. 387. 3961 121 MULTI-FAMILY du 16.0 182. 128. 3961 122 MULTI-FAMILY du 59.0 507. 356. 3961 4112 RIGHT-OF-WAY acre 4.0 0. 0. 3961 4114 PARKING acre 0.0 0. 0. 3961 6112 RELIGIOUS FACILITY ksf 20.0 130. 100. 3961 TOTAL 1374. 971.
3962 4112 RIGHT-OF-WAY acre 1.1 0. 0. 3962 TOTAL 0. 0.
3969 112 SINGLE FAMILY du 28.0 361. 252. 3969 121 MULTI-FAMILY du 44.0 502. 352. 3969 122 MULTI-FAMILY du 406.0 3492. 2451. 3969 4112 RIGHT-OF-WAY acre 8.4 0. 0. 3969 5010 VACANT COMMERCIAL ksf 8.7 0. 0. 3969 5014 CONVENIENCE MARKET CHAIN ksf 3.2 2186. 1588. 3969 5024 CAR WASH other 4.0 550. 400. 3969 5029 AUTO REPAIR ksf 6.1 167. 121. 3969 5134 NEIGHBORHOOD SHOP CENTER ksf 28.8 4874. 3450. 3969 6012 LOW RISE OFFICE A ksf 71.8 3833. 2951. 3969 6112 RELIGIOUS FACILITY ksf 3.5 23. 17. 3969 6115 FIRE OR POLICE STATION ksf 14.5 590. 435. 3969 7200 COMMERCIAL RECREATION ksf 9.0 395. 269. 3969 TOTAL 16972. 12287.
3974 112 SINGLE FAMILY du 123.0 1587. 1108. 3974 121 MULTI-FAMILY du 33.0 376. 264. 3974 122 MULTI-FAMILY du 25.0 215. 151. 3974 4112 RIGHT-OF-WAY acre 10.4 0. 0. 3974 4129 OTHER TRANSPORTATION acre 0.9 7. 6. 3974 5013 SUPERMARKET ksf 4.4 908. 659. 3974 5027 SERVICE STATION CAR WASH other 12.0 2558. 1858. 3974 TOTAL 5651. 4046.
9aug13/08:28:04/tgm.pr� SESD and Encanto\Base Year 2008 Cal 5 trip generation and land use by zone page 8
---------------------- Land Use ---------------------- -----Trips----- Zone Code Name Type Amount Person Vehicle
3977 112 SINGLE FAMILY du 99.0 1277. 891. 3977 121 MULTI-FAMILY du 13.0 148. 104. 3977 122 MULTI-FAMILY du 30.0 258. 181. 3977 2113 LIGHT INDUSTRY GENERAL ksf 24.4 454. 376. 3977 2311 SCRAP YARD/LANDFILL acre 1.5 11. 9. 3977 4112 RIGHT-OF-WAY acre 9.5 0. 0. 3977 4114 PARKING acre 0.1 0. 0. 3977 5029 AUTO REPAIR ksf 11.9 327. 237. 3977 6119 OTHER PUBLIC SERVICE ksf 2.0 28. 20. 3977 TOTAL 2503. 1819.
Page 7

Existing Land Use TG by Land Use by zone.txt
3979 112 SINGLE FAMILY du 79.0 1019. 711. 3979 121 MULTI-FAMILY du 64.0 730. 512. 3979 122 MULTI-FAMILY du 23.0 198. 139. 3979 4112 RIGHT-OF-WAY acre 21.2 0. 0. 3979 6112 RELIGIOUS FACILITY ksf 4.9 32. 24. 3979 7611 OPEN SPACE PARK acre 1.9 15. 10. 3979 TOTAL 1993. 1396.
3980 112 SINGLE FAMILY du 105.0 1354. 945. 3980 121 MULTI-FAMILY du 75.0 855. 600. 3980 122 MULTI-FAMILY du 84.0 722. 507. 3980 4112 RIGHT-OF-WAY acre 20.9 0. 0. 3980 6112 RELIGIOUS FACILITY ksf 14.5 94. 72. 3980 6115 FIRE OR POLICE STATION ksf 9.6 391. 288. 3980 TOTAL 3417. 2413.
3984 112 SINGLE FAMILY du 114.0 1471. 1026. 3984 121 MULTI-FAMILY du 18.0 205. 144. 3984 122 MULTI-FAMILY du 24.0 206. 145. 3984 2113 LIGHT INDUSTRY GENERAL ksf 22.1 412. 340. 3984 2311 SCRAP YARD/LANDFILL acre 0.4 3. 2. 3984 4112 RIGHT-OF-WAY acre 9.6 0. 0. 3984 5029 AUTO REPAIR ksf 2.8 77. 56. 3984 5030 AUTO TIRES ksf 1.0 34. 25. 3984 5137 ARTERIAL COMMERCIAL ksf 10.8 596. 433. 3984 6012 LOW RISE OFFICE A ksf 2.2 118. 91. 3984 6112 RELIGIOUS FACILITY ksf 4.5 29. 22. 3984 9101 INACTIVE USE acre 0.1 0. 0. 3984 TOTAL 3151. 2285.
3985 112 SINGLE FAMILY du 69.0 890. 621. 3985 121 MULTI-FAMILY du 9.0 103. 72. 3985 122 MULTI-FAMILY du 21.0 181. 127. 3985 2113 LIGHT INDUSTRY GENERAL ksf 23.5 438. 362. 3985 2114 WAREHOUSING ksf 21.0 128. 107. 3985 4112 RIGHT-OF-WAY acre 12.2 0. 0. 3985 4114 PARKING acre 0.6 0. 0. 3985 5029 AUTO REPAIR ksf 1.2 33. 24. 3985 6112 RELIGIOUS FACILITY ksf 11.0 72. 55. 3985 6816 ELEMENTARY SCHOOL other 78.0 265. 148. 3985 TOTAL 2109. 1517.
9aug13/08:28:04/tgm.pr� SESD and Encanto\Base Year 2008 Cal 5 trip generation and land use by zone page 9
---------------------- Land Use ---------------------- -----Trips----- Zone Code Name Type Amount Person Vehicle
3988 112 SINGLE FAMILY du 275.0 3547. 2476. 3988 4112 RIGHT-OF-WAY acre 19.3 0. 0. 3988 6815 JUNIOR HIGH OR MIDDLE SCHOOL other 1127.0 2592. 1592. 3988 TOTAL 6140. 4069.
3989 112 SINGLE FAMILY du 36.0 464. 324. 3989 121 MULTI-FAMILY du 31.0 353. 248. 3989 122 MULTI-FAMILY du 36.0 310. 217. 3989 2113 LIGHT INDUSTRY GENERAL ksf 41.0 762. 630. 3989 4112 RIGHT-OF-WAY acre 14.4 0. 0. 3989 6112 RELIGIOUS FACILITY ksf 74.2 483. 371. 3989 TOTAL 2372. 1791.
Page 8

Existing Land Use TG by Land Use by zone.txt
3990 112 SINGLE FAMILY du 108.0 1393. 972. 3990 121 MULTI-FAMILY du 78.0 889. 624. 3990 122 MULTI-FAMILY du 47.0 404. 284. 3990 2113 LIGHT INDUSTRY GENERAL ksf 5.8 108. 90. 3990 4112 RIGHT-OF-WAY acre 11.4 0. 0. 3990 5137 ARTERIAL COMMERCIAL ksf 6.8 377. 274. 3990 6111 CEMETERY acre 7.0 42. 35. 3990 6112 RELIGIOUS FACILITY ksf 5.2 34. 26. 3990 TOTAL 3248. 2304.
3991 112 SINGLE FAMILY du 172.0 2219. 1549. 3991 121 MULTI-FAMILY du 49.0 559. 392. 3991 122 MULTI-FAMILY du 44.0 378. 266. 3991 4112 RIGHT-OF-WAY acre 9.2 0. 0. 3991 5137 ARTERIAL COMMERCIAL ksf 27.8 1529. 1111. 3991 6012 LOW RISE OFFICE A ksf 3.2 171. 131. 3991 6112 RELIGIOUS FACILITY ksf 3.2 21. 16. 3991 6129 MEETING ROOM FACILITY ksf 3.2 134. 97. 3991 TOTAL 5011. 3562.
3992 112 SINGLE FAMILY du 177.0 2283. 1594. 3992 121 MULTI-FAMILY du 99.0 1129. 792. 3992 122 MULTI-FAMILY du 214.0 1840. 1292. 3992 4112 RIGHT-OF-WAY acre 19.3 0. 0. 3992 6012 LOW RISE OFFICE A ksf 3.8 206. 158. 3992 6013 GOV'T /CIVIC CENTER ksf 50.7 2024. 1521. 3992 6112 RELIGIOUS FACILITY ksf 14.6 95. 73. 3992 7611 OPEN SPACE PARK acre 5.6 43. 29. 3992 7613 ACTIVE PARK acre 3.7 284. 187. 3992 TOTAL 7905. 5646.
3993 4112 RIGHT-OF-WAY acre 4.2 0. 0. 3993 5133 COMMUNITY SHOP CENTER ksf 360.9 38937. 27553. 3993 TOTAL 38937. 27553.
3994 112 SINGLE FAMILY du 81.0 1045. 729. 3994 121 MULTI-FAMILY du 74.0 844. 592. 3994 122 MULTI-FAMILY du 8.0 69. 48. 3994 4112 RIGHT-OF-WAY acre 20.3 0. 0.
9aug13/08:28:04/tgm.pr� SESD and Encanto\Base Year 2008 Cal 5 trip generation and land use by zone page 10
---------------------- Land Use ---------------------- -----Trips----- Zone Code Name Type Amount Person Vehicle
3994 5137 ARTERIAL COMMERCIAL ksf 7.9 434. 315. 3994 7611 OPEN SPACE PARK acre 7.9 61. 40. 3994 TOTAL 2452. 1725.
3995 112 SINGLE FAMILY du 274.0 3535. 2467. 3995 121 MULTI-FAMILY du 17.0 194. 136. 3995 122 MULTI-FAMILY du 104.0 894. 628. 3995 4112 RIGHT-OF-WAY acre 42.9 0. 0. 3995 5137 ARTERIAL COMMERCIAL ksf 45.4 2496. 1813. 3995 6112 RELIGIOUS FACILITY ksf 52.2 340. 261. 3995 6519 OTHER HEALTH CARE ksf 22.6 1523. 1131. 3995 6814 SENIOR HIGH SCHOOL other 2333.0 9332. 4199. 3995 6816 ELEMENTARY SCHOOL other 759.0 2581. 1442. 3995 7611 OPEN SPACE PARK acre 0.8 6. 4. 3995 7613 ACTIVE PARK acre 4.1 319. 210.
Page 9
Existing Land Use TG by Land Use by zone.txt 3995 TOTAL 21220. 12291.
3996 112 SINGLE FAMILY du 684.0 8824. 6159. 3996 4112 RIGHT-OF-WAY acre 38.7 0. 0. 3996 5029 AUTO REPAIR ksf 1.0 26. 19. 3996 5136 AUTO DEALERSHIP acre 0.1 39. 28. 3996 6112 RELIGIOUS FACILITY ksf 18.9 123. 94. 3996 TOTAL 9012. 6300.
3998 112 SINGLE FAMILY du 144.0 1858. 1297. 3998 121 MULTI-FAMILY du 122.0 1391. 976. 3998 122 MULTI-FAMILY du 148.0 1273. 894. 3998 4112 RIGHT-OF-WAY acre 27.2 0. 0. 3998 5139 OTHER RETAIL TRADE ksf 2.4 132. 96. 3998 6112 RELIGIOUS FACILITY ksf 19.3 125. 96. 3998 6114 POST OFFICE ksf 5.8 1680. 1168. 3998 TOTAL 6459. 4527.
3999 112 SINGLE FAMILY du 151.0 1948. 1360. 3999 121 MULTI-FAMILY du 166.0 1892. 1329. 3999 122 MULTI-FAMILY du 240.0 2064. 1449. 3999 4112 RIGHT-OF-WAY acre 24.7 0. 0. 3999 5137 ARTERIAL COMMERCIAL ksf 6.3 349. 253. 3999 6112 RELIGIOUS FACILITY ksf 33.6 219. 168. 3999 6519 OTHER HEALTH CARE ksf 26.0 1750. 1300. 3999 6816 ELEMENTARY SCHOOL other 384.0 1306. 730. 3999 7613 ACTIVE PARK acre 0.2 13. 8. 3999 TOTAL 9540. 6596.
4002 112 SINGLE FAMILY du 143.0 1845. 1288. 4002 121 MULTI-FAMILY du 157.0 1790. 1257. 4002 122 MULTI-FAMILY du 160.0 1376. 966. 4002 4112 RIGHT-OF-WAY acre 23.0 0. 0. 4002 4114 PARKING acre 0.3 0. 0. 4002 5137 ARTERIAL COMMERCIAL ksf 17.6 967. 702. 4002 6112 RELIGIOUS FACILITY ksf 50.6 329. 253. 4002 6113 LIBRARY ksf 3.3 244. 166.
9aug13/08:28:04/tgm.pr� SESD and Encanto\Base Year 2008 Cal 5 trip generation and land use by zone page 11
---------------------- Land Use ---------------------- -----Trips----- Zone Code Name Type Amount Person Vehicle
4002 6119 OTHER PUBLIC SERVICE ksf 3.5 49. 35. 4002 6815 JUNIOR HIGH OR MIDDLE SCHOOL other 1242.0 2857. 1755. 4002 6816 ELEMENTARY SCHOOL other 619.0 2105. 1176. 4002 7613 ACTIVE PARK acre 18.0 1384. 911. 4002 TOTAL 12945. 8508.
4007 112 SINGLE FAMILY du 488.0 6295. 4394. 4007 4112 RIGHT-OF-WAY acre 32.7 0. 0. 4007 6112 RELIGIOUS FACILITY ksf 29.3 191. 147. 4007 6816 ELEMENTARY SCHOOL other 589.0 2003. 1119. 4007 TOTAL 8488. 5660.
4008 112 SINGLE FAMILY du 57.0 735. 513. 4008 121 MULTI-FAMILY du 75.0 855. 600. 4008 122 MULTI-FAMILY du 117.0 1006. 706. 4008 1421 CORRECTIONAL FACILITY other 300.0 840. 609. 4008 4112 RIGHT-OF-WAY acre 12.2 0. 0. 4008 5133 COMMUNITY SHOP CENTER ksf 134.3 14495. 10257.
Page 10

Existing Land Use TG by Land Use by zone.txt 4008 5138 SERVICE STATION other 8.0 1486. 1082. 4008 6112 RELIGIOUS FACILITY ksf 24.1 156. 120. 4008 6119 OTHER PUBLIC SERVICE ksf 3.6 49. 36. 4008 6816 ELEMENTARY SCHOOL other 481.0 1635. 914. 4008 7613 ACTIVE PARK acre 0.2 12. 8. 4008 TOTAL 21270. 14845.
4009 112 SINGLE FAMILY du 219.0 2825. 1972. 4009 121 MULTI-FAMILY du 112.0 1277. 896. 4009 122 MULTI-FAMILY du 124.0 1066. 749. 4009 4112 RIGHT-OF-WAY acre 17.8 0. 0. 4009 5137 ARTERIAL COMMERCIAL ksf 13.7 755. 549. 4009 5139 OTHER RETAIL TRADE ksf 0.9 51. 37. 4009 6112 RELIGIOUS FACILITY ksf 18.4 120. 92. 4009 6115 FIRE OR POLICE STATION ksf 3.4 139. 103. 4009 TOTAL 6234. 4398.
4010 112 SINGLE FAMILY du 328.0 4231. 2953. 4010 4112 RIGHT-OF-WAY acre 28.2 0. 0. 4010 6112 RELIGIOUS FACILITY ksf 8.5 55. 42. 4010 7613 ACTIVE PARK acre 34.6 2662. 1752. 4010 9101 INACTIVE USE acre 0.1 0. 0. 4010 TOTAL 6948. 4747.
4013 112 SINGLE FAMILY du 178.0 2296. 1603. 4013 121 MULTI-FAMILY du 63.0 718. 504. 4013 122 MULTI-FAMILY du 40.0 344. 242. 4013 4112 RIGHT-OF-WAY acre 16.6 0. 0. 4013 5137 ARTERIAL COMMERCIAL ksf 4.0 222. 161. 4013 6112 RELIGIOUS FACILITY ksf 2.3 15. 11. 4013 TOTAL 3595. 2521.
4018 112 SINGLE FAMILY du 589.0 7598. 5303. 4018 4112 RIGHT-OF-WAY acre 33.2 0. 0.
9aug13/08:28:04/tgm.pr� SESD and Encanto\Base Year 2008 Cal 5 trip generation and land use by zone page 12
---------------------- Land Use ---------------------- -----Trips----- Zone Code Name Type Amount Person Vehicle
4018 6112 RELIGIOUS FACILITY ksf 5.0 32. 25. 4018 7611 OPEN SPACE PARK acre 8.6 66. 44. 4018 TOTAL 7697. 5372.
4024 112 SINGLE FAMILY du 404.0 5212. 3638. 4024 121 MULTI-FAMILY du 389.0 4435. 3113. 4024 122 MULTI-FAMILY du 322.0 2769. 1944. 4024 4112 RIGHT-OF-WAY acre 50.2 0. 0. 4024 5029 AUTO REPAIR ksf 1.8 49. 36. 4024 5134 NEIGHBORHOOD SHOP CENTER ksf 33.2 5629. 3984. 4024 5137 ARTERIAL COMMERCIAL ksf 37.5 2065. 1500. 4024 5139 OTHER RETAIL TRADE ksf 1.2 64. 47. 4024 6112 RELIGIOUS FACILITY ksf 6.0 39. 30. 4024 6810 DAY CARE CENTER other 70.0 427. 352. 4024 6816 ELEMENTARY SCHOOL other 549.0 1867. 1043. 4024 7220 OTHER RECREATION-HIGH acre 2.8 205. 140. 4024 TOTAL 22760. 15826.
4027 112 SINGLE FAMILY du 43.0 555. 387. 4027 121 MULTI-FAMILY du 52.0 593. 416. 4027 122 MULTI-FAMILY du 88.0 757. 531.
Page 11

Existing Land Use TG by Land Use by zone.txt 4027 2113 LIGHT INDUSTRY GENERAL ksf 66.2 1230. 1017. 4027 2114 WAREHOUSING ksf 25.3 154. 129. 4027 4112 RIGHT-OF-WAY acre 22.0 0. 0. 4027 4113 COMMUNICATION OR UTILITY acre 2.8 9. 7. 4027 5137 ARTERIAL COMMERCIAL ksf 45.4 2496. 1813. 4027 6112 RELIGIOUS FACILITY ksf 7.1 46. 35. 4027 7611 OPEN SPACE PARK acre 2.8 22. 14. 4027 TOTAL 5862. 4351.
4028 112 SINGLE FAMILY du 73.0 942. 657. 4028 121 MULTI-FAMILY du 51.0 581. 408. 4028 122 MULTI-FAMILY du 86.0 740. 519. 4028 2114 WAREHOUSING ksf 4.6 28. 23. 4028 4112 RIGHT-OF-WAY acre 22.1 0. 0. 4028 5137 ARTERIAL COMMERCIAL ksf 103.0 5664. 4114. 4028 6012 LOW RISE OFFICE A ksf 4.2 226. 174. 4028 6112 RELIGIOUS FACILITY ksf 11.5 75. 57. 4028 6129 MEETING ROOM FACILITY ksf 2.7 111. 80. 4028 TOTAL 8367. 6034.
4035 112 SINGLE FAMILY du 182.0 2348. 1639. 4035 121 MULTI-FAMILY du 223.0 2542. 1785. 4035 122 MULTI-FAMILY du 360.0 3096. 2174. 4035 4112 RIGHT-OF-WAY acre 75.9 0. 0. 4035 4113 COMMUNICATION OR UTILITY acre 0.1 0. 0. 4035 5137 ARTERIAL COMMERCIAL ksf 13.2 724. 526. 4035 6112 RELIGIOUS FACILITY ksf 24.5 159. 122. 4035 7613 ACTIVE PARK acre 16.9 1302. 857. 4035 TOTAL 10171. 7102.
4038 112 SINGLE FAMILY du 148.0 1909. 1333.
9aug13/08:28:04/tgm.pr� SESD and Encanto\Base Year 2008 Cal 5 trip generation and land use by zone page 13
---------------------- Land Use ---------------------- -----Trips----- Zone Code Name Type Amount Person Vehicle
4038 121 MULTI-FAMILY du 87.0 992. 696. 4038 122 MULTI-FAMILY du 89.0 765. 537. 4038 4112 RIGHT-OF-WAY acre 39.3 0. 0. 4038 5137 ARTERIAL COMMERCIAL ksf 22.1 1213. 881. 4038 6112 RELIGIOUS FACILITY ksf 3.6 23. 18. 4038 6816 ELEMENTARY SCHOOL other 760.0 2584. 1444. 4038 7611 OPEN SPACE PARK acre 2.9 23. 15. 4038 9101 INACTIVE USE acre 0.1 0. 0. 4038 TOTAL 7509. 4924.
4039 112 SINGLE FAMILY du 162.0 2090. 1459. 4039 121 MULTI-FAMILY du 96.0 1094. 768. 4039 122 MULTI-FAMILY du 107.0 920. 646. 4039 4112 RIGHT-OF-WAY acre 18.2 0. 0. 4039 5137 ARTERIAL COMMERCIAL ksf 8.4 465. 338. 4039 5139 OTHER RETAIL TRADE ksf 10.5 578. 421. 4039 6012 LOW RISE OFFICE A ksf 2.9 154. 119. 4039 6112 RELIGIOUS FACILITY ksf 27.4 178. 137. 4039 6816 ELEMENTARY SCHOOL other 173.0 588. 329. 4039 7611 OPEN SPACE PARK acre 1.1 9. 6. 4039 TOTAL 6076. 4221.
4040 112 SINGLE FAMILY du 83.0 1071. 747. 4040 121 MULTI-FAMILY du 103.0 1174. 824.
Page 12

Existing Land Use TG by Land Use by zone.txt 4040 122 MULTI-FAMILY du 14.0 120. 85. 4040 4112 RIGHT-OF-WAY acre 12.4 0. 0. 4040 5137 ARTERIAL COMMERCIAL ksf 30.8 1694. 1231. 4040 6012 LOW RISE OFFICE A ksf 13.5 723. 557. 4040 6112 RELIGIOUS FACILITY ksf 50.6 329. 253. 4040 7613 ACTIVE PARK acre 17.5 1348. 887. 4040 9101 INACTIVE USE acre 0.0 0. 0. 4040 TOTAL 6459. 4583.
4044 4112 RIGHT-OF-WAY acre 0.1 0. 0. 4044 TOTAL 0. 0.
4047 112 SINGLE FAMILY du 456.0 5882. 4106. 4047 4112 RIGHT-OF-WAY acre 23.2 0. 0. 4047 4113 COMMUNICATION OR UTILITY acre 3.8 12. 9. 4047 7611 OPEN SPACE PARK acre 0.8 6. 4. 4047 TOTAL 5901. 4120.
4050 4112 RIGHT-OF-WAY acre 0.4 0. 0. 4050 5133 COMMUNITY SHOP CENTER ksf 75.3 8130. 5753. 4050 5134 NEIGHBORHOOD SHOP CENTER ksf 48.1 8153. 5770. 4050 TOTAL 16284. 11524.
4057 112 SINGLE FAMILY du 140.0 1806. 1261. 4057 121 MULTI-FAMILY du 140.0 1596. 1120. 4057 122 MULTI-FAMILY du 119.0 1023. 718. 4057 4112 RIGHT-OF-WAY acre 21.6 0. 0. 4057 5137 ARTERIAL COMMERCIAL ksf 2.8 151. 110.
9aug13/08:28:04/tgm.pr� SESD and Encanto\Base Year 2008 Cal 5 trip generation and land use by zone page 14
---------------------- Land Use ---------------------- -----Trips----- Zone Code Name Type Amount Person Vehicle
4057 6112 RELIGIOUS FACILITY ksf 5.3 35. 27. 4057 7611 OPEN SPACE PARK acre 7.2 56. 37. 4057 9101 INACTIVE USE acre 0.0 0. 0. 4057 TOTAL 4667. 3273.
4058 112 SINGLE FAMILY du 132.0 1703. 1189. 4058 121 MULTI-FAMILY du 152.0 1733. 1217. 4058 122 MULTI-FAMILY du 44.0 378. 266. 4058 4112 RIGHT-OF-WAY acre 19.4 0. 0. 4058 5137 ARTERIAL COMMERCIAL ksf 3.6 197. 143. 4058 6112 RELIGIOUS FACILITY ksf 9.1 59. 45. 4058 6119 OTHER PUBLIC SERVICE ksf 2.7 37. 26. 4058 6816 ELEMENTARY SCHOOL other 543.0 1846. 1032. 4058 7611 OPEN SPACE PARK acre 0.5 4. 3. 4058 7613 ACTIVE PARK acre 0.2 12. 8. 4058 TOTAL 5969. 3928.
4061 112 SINGLE FAMILY du 19.0 245. 171. 4061 121 MULTI-FAMILY du 54.0 616. 432. 4061 122 MULTI-FAMILY du 347.0 2984. 2095. 4061 4112 RIGHT-OF-WAY acre 16.0 0. 0. 4061 5137 ARTERIAL COMMERCIAL ksf 1.8 98. 71. 4061 TOTAL 3943. 2769.
4079 112 SINGLE FAMILY du 147.0 1896. 1324. 4079 121 MULTI-FAMILY du 147.0 1676. 1177. 4079 122 MULTI-FAMILY du 110.0 946. 664.
Page 13

Existing Land Use TG by Land Use by zone.txt 4079 1511 MOTEL room 64.0 934. 575. 4079 4112 RIGHT-OF-WAY acre 28.9 0. 0. 4079 5027 SERVICE STATION CAR WASH other 8.0 1706. 1239. 4079 5137 ARTERIAL COMMERCIAL ksf 8.2 452. 328. 4079 6112 RELIGIOUS FACILITY ksf 4.2 27. 21. 4079 6816 ELEMENTARY SCHOOL other 707.0 2404. 1343. 4079 9101 INACTIVE USE acre 0.6 0. 0. 4079 TOTAL 10041. 6671.
4080 112 SINGLE FAMILY du 161.0 2077. 1450. 4080 121 MULTI-FAMILY du 174.0 1984. 1393. 4080 122 MULTI-FAMILY du 137.0 1178. 827. 4080 4112 RIGHT-OF-WAY acre 22.5 0. 0. 4080 5137 ARTERIAL COMMERCIAL ksf 3.7 205. 149. 4080 6112 RELIGIOUS FACILITY ksf 15.3 100. 77. 4080 7611 OPEN SPACE PARK acre 0.8 6. 4. 4080 9101 INACTIVE USE acre 2.1 0. 0. 4080 TOTAL 5549. 3899.
4683 112 SINGLE FAMILY du 22.0 284. 198. 4683 121 MULTI-FAMILY du 10.0 114. 80. 4683 122 MULTI-FAMILY du 34.0 292. 205. 4683 2113 LIGHT INDUSTRY GENERAL ksf 38.9 724. 599. 4683 4112 RIGHT-OF-WAY acre 13.4 0. 0. 4683 4113 COMMUNICATION OR UTILITY acre 3.9 12. 10.
9aug13/08:28:04/tgm.pr� SESD and Encanto\Base Year 2008 Cal 5 trip generation and land use by zone page 15
---------------------- Land Use ---------------------- -----Trips----- Zone Code Name Type Amount Person Vehicle
4683 4114 PARKING acre 3.0 0. 0. 4683 4121 RAIL/TRANSIT CENTER acre 2.5 998. 763. 4683 5010 VACANT COMMERCIAL ksf 4.2 0. 0. 4683 6129 MEETING ROOM FACILITY ksf 13.9 576. 416. 4683 TOTAL 3001. 2271.
4684 4112 RIGHT-OF-WAY acre 1.4 0. 0. 4684 5133 COMMUNITY SHOP CENTER ksf 81.0 8745. 6188. 4684 TOTAL 8745. 6188.
4685 112 SINGLE FAMILY du 97.0 1251. 873. 4685 121 MULTI-FAMILY du 17.0 194. 136. 4685 122 MULTI-FAMILY du 59.0 507. 356. 4685 2113 LIGHT INDUSTRY GENERAL ksf 41.6 774. 640. 4685 2311 SCRAP YARD/LANDFILL acre 1.8 13. 11. 4685 4112 RIGHT-OF-WAY acre 8.8 0. 0. 4685 6112 RELIGIOUS FACILITY ksf 5.2 34. 26. 4685 TOTAL 2773. 2042.
4686 112 SINGLE FAMILY du 71.0 916. 639. 4686 121 MULTI-FAMILY du 12.0 137. 96. 4686 122 MULTI-FAMILY du 23.0 198. 139. 4686 2113 LIGHT INDUSTRY GENERAL ksf 0.5 9. 8. 4686 4112 RIGHT-OF-WAY acre 5.2 0. 0. 4686 TOTAL 1260. 882.
4687 112 SINGLE FAMILY du 4.0 52. 36. 4687 121 MULTI-FAMILY du 6.0 68. 48. 4687 122 MULTI-FAMILY du 12.0 103. 72. 4687 2113 LIGHT INDUSTRY GENERAL ksf 34.8 648. 536.
Page 14

Existing Land Use TG by Land Use by zone.txt 4687 2311 SCRAP YARD/LANDFILL acre 0.2 2. 1. 4687 4112 RIGHT-OF-WAY acre 2.7 0. 0. 4687 5137 ARTERIAL COMMERCIAL ksf 5.3 289. 210. 4687 TOTAL 1162. 904.
4688 112 SINGLE FAMILY du 3.0 39. 27. 4688 121 MULTI-FAMILY du 5.0 57. 40. 4688 122 MULTI-FAMILY du 6.0 52. 36. 4688 2113 LIGHT INDUSTRY GENERAL ksf 55.5 1032. 854. 4688 4112 RIGHT-OF-WAY acre 0.3 0. 0. 4688 4114 PARKING acre 0.5 0. 0. 4688 5137 ARTERIAL COMMERCIAL ksf 7.5 412. 299. 4688 TOTAL 1591. 1256.
4689 112 SINGLE FAMILY du 32.0 413. 288. 4689 121 MULTI-FAMILY du 22.0 251. 176. 4689 122 MULTI-FAMILY du 24.0 206. 145. 4689 4112 RIGHT-OF-WAY acre 3.6 0. 0. 4689 6012 LOW RISE OFFICE A ksf 12.6 675. 520. 4689 6112 RELIGIOUS FACILITY ksf 28.2 183. 141. 4689 6810 DAY CARE CENTER other 109.0 665. 549. 4689 TOTAL 2393. 1819.
9aug13/08:28:04/tgm.pr� SESD and Encanto\Base Year 2008 Cal 5 trip generation and land use by zone page 16
---------------------- Land Use ---------------------- -----Trips----- Zone Code Name Type Amount Person Vehicle
4690 112 SINGLE FAMILY du 16.0 206. 144. 4690 121 MULTI-FAMILY du 9.0 103. 72. 4690 122 MULTI-FAMILY du 6.0 52. 36. 4690 2113 LIGHT INDUSTRY GENERAL ksf 2.3 43. 35. 4690 2311 SCRAP YARD/LANDFILL acre 0.9 7. 6. 4690 4112 RIGHT-OF-WAY acre 1.2 0. 0. 4690 4114 PARKING acre 0.1 0. 0. 4690 5029 AUTO REPAIR ksf 9.0 248. 180. 4690 5030 AUTO TIRES ksf 3.5 120. 87. 4690 5137 ARTERIAL COMMERCIAL ksf 4.0 220. 160. 4690 6012 LOW RISE OFFICE A ksf 2.3 124. 95. 4690 TOTAL 1122. 816.
4691 112 SINGLE FAMILY du 8.0 103. 72. 4691 2113 LIGHT INDUSTRY GENERAL ksf 13.9 259. 214. 4691 2114 WAREHOUSING ksf 1.0 6. 5. 4691 2311 SCRAP YARD/LANDFILL acre 0.9 7. 6. 4691 4112 RIGHT-OF-WAY acre 2.6 0. 0. 4691 5011 HIGH TURNOVER RESTAURANT ksf 2.2 399. 290. 4691 5136 AUTO DEALERSHIP acre 0.1 50. 36. 4691 5137 ARTERIAL COMMERCIAL ksf 4.0 219. 159. 4691 TOTAL 1044. 782.
4692 112 SINGLE FAMILY du 27.0 348. 243. 4692 122 MULTI-FAMILY du 68.0 585. 411. 4692 2113 LIGHT INDUSTRY GENERAL ksf 29.5 548. 453. 4692 4112 RIGHT-OF-WAY acre 7.9 0. 0. 4692 5137 ARTERIAL COMMERCIAL ksf 1.0 55. 40. 4692 TOTAL 1536. 1147.
4693 112 SINGLE FAMILY du 3.0 39. 27. 4693 121 MULTI-FAMILY du 2.0 23. 16.
Page 15

Existing Land Use TG by Land Use by zone.txt 4693 122 MULTI-FAMILY du 12.0 103. 72. 4693 2113 LIGHT INDUSTRY GENERAL ksf 4.9 91. 75. 4693 2114 WAREHOUSING ksf 19.5 119. 100. 4693 2311 SCRAP YARD/LANDFILL acre 0.1 1. 1. 4693 4112 RIGHT-OF-WAY acre 1.2 0. 0. 4693 5029 AUTO REPAIR ksf 1.6 45. 33. 4693 5137 ARTERIAL COMMERCIAL ksf 8.0 441. 320. 4693 6012 LOW RISE OFFICE A ksf 8.5 454. 350. 4693 TOTAL 1316. 994.
4694 112 SINGLE FAMILY du 8.0 103. 72. 4694 121 MULTI-FAMILY du 6.0 68. 48. 4694 2113 LIGHT INDUSTRY GENERAL ksf 50.2 933. 771. 4694 4112 RIGHT-OF-WAY acre 1.5 0. 0. 4694 4114 PARKING acre 0.8 0. 0. 4694 5011 HIGH TURNOVER RESTAURANT ksf 1.8 315. 229. 4694 5028 AUTO PARTS ksf 5.7 490. 356. 4694 5137 ARTERIAL COMMERCIAL ksf 70.5 3878. 2816. 4694 TOTAL 5787. 4292.
9aug13/08:28:04/tgm.pr� SESD and Encanto\Base Year 2008 Cal 5 trip generation and land use by zone page 17
---------------------- Land Use ---------------------- -----Trips----- Zone Code Name Type Amount Person Vehicle
4695 112 SINGLE FAMILY du 25.0 322. 225. 4695 122 MULTI-FAMILY du 12.0 103. 72. 4695 2113 LIGHT INDUSTRY GENERAL ksf 0.8 15. 12. 4695 4112 RIGHT-OF-WAY acre 4.9 0. 0. 4695 TOTAL 441. 310.
4696 112 SINGLE FAMILY du 116.0 1496. 1044. 4696 121 MULTI-FAMILY du 15.0 171. 120. 4696 122 MULTI-FAMILY du 111.0 955. 670. 4696 4112 RIGHT-OF-WAY acre 8.7 0. 0. 4696 5029 AUTO REPAIR ksf 1.8 48. 35. 4696 5030 AUTO TIRES ksf 2.5 86. 62. 4696 5137 ARTERIAL COMMERCIAL ksf 1.4 79. 58. 4696 TOTAL 2836. 1990.
4697 112 SINGLE FAMILY du 38.0 490. 342. 4697 121 MULTI-FAMILY du 12.0 137. 96. 4697 122 MULTI-FAMILY du 65.0 559. 392. 4697 4112 RIGHT-OF-WAY acre 3.1 0. 0. 4697 5025 SERVICE STATION FOOD MART other 12.0 2476. 1798. 4697 5137 ARTERIAL COMMERCIAL ksf 8.2 453. 329. 4697 6112 RELIGIOUS FACILITY ksf 5.5 36. 28. 4697 TOTAL 4150. 2985.
4698 112 SINGLE FAMILY du 56.0 722. 504. 4698 121 MULTI-FAMILY du 11.0 125. 88. 4698 122 MULTI-FAMILY du 25.0 215. 151. 4698 4112 RIGHT-OF-WAY acre 4.3 0. 0. 4698 4114 PARKING acre 0.2 0. 0. 4698 5014 CONVENIENCE MARKET CHAIN ksf 17.5 12036. 8742. 4698 5137 ARTERIAL COMMERCIAL ksf 18.7 1028. 747. 4698 6112 RELIGIOUS FACILITY ksf 0.6 4. 3. 4698 TOTAL 14132. 10236.
4699 112 SINGLE FAMILY du 54.0 697. 486.Page 16

Existing Land Use TG by Land Use by zone.txt 4699 121 MULTI-FAMILY du 8.0 91. 64. 4699 122 MULTI-FAMILY du 30.0 258. 181. 4699 4112 RIGHT-OF-WAY acre 4.7 0. 0. 4699 5137 ARTERIAL COMMERCIAL ksf 17.5 960. 697. 4699 6112 RELIGIOUS FACILITY ksf 11.8 77. 59. 4699 TOTAL 2083. 1488.
4700 112 SINGLE FAMILY du 17.0 219. 153. 4700 121 MULTI-FAMILY du 18.0 205. 144. 4700 122 MULTI-FAMILY du 19.0 163. 115. 4700 2113 LIGHT INDUSTRY GENERAL ksf 11.8 219. 181. 4700 4112 RIGHT-OF-WAY acre 1.8 0. 0. 4700 4114 PARKING acre 0.9 0. 0. 4700 5011 HIGH TURNOVER RESTAURANT ksf 1.4 244. 177. 4700 5014 CONVENIENCE MARKET CHAIN ksf 14.0 9629. 6994. 4700 5029 AUTO REPAIR ksf 4.5 123. 89. 4700 5030 AUTO TIRES ksf 1.6 54. 39.
9aug13/08:28:04/tgm.pr� SESD and Encanto\Base Year 2008 Cal 5 trip generation and land use by zone page 18
---------------------- Land Use ---------------------- -----Trips----- Zone Code Name Type Amount Person Vehicle
4700 5137 ARTERIAL COMMERCIAL ksf 21.8 1199. 871. 4700 6013 GOV'T /CIVIC CENTER ksf 1.7 68. 51. 4700 6112 RELIGIOUS FACILITY ksf 4.5 29. 22. 4700 6115 FIRE OR POLICE STATION ksf 14.6 596. 439. 4700 TOTAL 12748. 9276.
4701 112 SINGLE FAMILY du 5.0 64. 45. 4701 121 MULTI-FAMILY du 14.0 160. 112. 4701 122 MULTI-FAMILY du 4.0 34. 24. 4701 2113 LIGHT INDUSTRY GENERAL ksf 15.7 292. 242. 4701 4112 RIGHT-OF-WAY acre 1.1 0. 0. 4701 5029 AUTO REPAIR ksf 8.0 219. 159. 4701 5137 ARTERIAL COMMERCIAL ksf 21.8 1201. 872. 4701 6112 RELIGIOUS FACILITY ksf 1.8 12. 9. 4701 TOTAL 1983. 1463.
4702 112 SINGLE FAMILY du 22.0 284. 198. 4702 122 MULTI-FAMILY du 4.0 34. 24. 4702 2113 LIGHT INDUSTRY GENERAL ksf 13.8 256. 212. 4702 2311 SCRAP YARD/LANDFILL acre 0.2 2. 2. 4702 4112 RIGHT-OF-WAY acre 2.0 0. 0. 4702 5014 CONVENIENCE MARKET CHAIN ksf 5.8 3989. 2897. 4702 5030 AUTO TIRES ksf 0.6 22. 16. 4702 5137 ARTERIAL COMMERCIAL ksf 0.6 31. 22. 4702 6129 MEETING ROOM FACILITY ksf 4.0 166. 120. 4702 TOTAL 4785. 3492.
4703 111 SINGLE FAMILY du 1.0 13. 9. 4703 112 SINGLE FAMILY du 182.0 2348. 1639. 4703 4112 RIGHT-OF-WAY acre 19.0 0. 0. 4703 6113 LIBRARY ksf 27.6 2029. 1375. 4703 6819 OTHER SCHOOL ksf 14.5 316. 261. 4703 7611 OPEN SPACE PARK acre 32.6 251. 165. 4703 TOTAL 4956. 3449.
4704 4112 RIGHT-OF-WAY acre 1.4 0. 0. 4704 6812 UNIVERSITY OR COLLEGE other 7667.0 15334. 12465. 4704 TOTAL 15334. 12465.
Page 17

Existing Land Use TG by Land Use by zone.txt
4705 112 SINGLE FAMILY du 256.0 3302. 2305. 4705 4112 RIGHT-OF-WAY acre 17.6 0. 0. 4705 7611 OPEN SPACE PARK acre 25.4 195. 128. 4705 TOTAL 3498. 2433.
4706 112 SINGLE FAMILY du 326.0 4205. 2935. 4706 1411 CONGREGATE CARE FACILITY other 12.0 52. 36. 4706 4112 RIGHT-OF-WAY acre 18.6 0. 0. 4706 TOTAL 4257. 2972.
4707 112 SINGLE FAMILY du 153.0 1974. 1378. 4707 4112 RIGHT-OF-WAY acre 9.0 0. 0. 4707 4113 COMMUNICATION OR UTILITY acre 0.6 2. 1.
9aug13/08:28:04/tgm.pr� SESD and Encanto\Base Year 2008 Cal 5 trip generation and land use by zone page 19
---------------------- Land Use ---------------------- -----Trips----- Zone Code Name Type Amount Person Vehicle
4707 7611 OPEN SPACE PARK acre 0.8 6. 4. 4707 7613 ACTIVE PARK acre 3.0 234. 154. 4707 TOTAL 2215. 1537.
4708 112 SINGLE FAMILY du 351.0 4528. 3160. 4708 121 MULTI-FAMILY du 17.0 194. 136. 4708 4112 RIGHT-OF-WAY acre 31.6 0. 0. 4708 7611 OPEN SPACE PARK acre 0.2 2. 1. 4708 TOTAL 4723. 3298.
4709 112 SINGLE FAMILY du 209.0 2696. 1882. 4709 121 MULTI-FAMILY du 188.0 2143. 1505. 4709 122 MULTI-FAMILY du 119.0 1023. 718. 4709 4112 RIGHT-OF-WAY acre 20.2 0. 0. 4709 5137 ARTERIAL COMMERCIAL ksf 2.2 119. 86. 4709 6112 RELIGIOUS FACILITY ksf 17.0 110. 85. 4709 6519 OTHER HEALTH CARE ksf 3.8 253. 188. 4709 6816 ELEMENTARY SCHOOL other 483.0 1642. 918. 4709 7613 ACTIVE PARK acre 6.6 510. 335. 4709 TOTAL 8497. 5717.
4710 112 SINGLE FAMILY du 25.0 322. 225. 4710 121 MULTI-FAMILY du 23.0 262. 184. 4710 122 MULTI-FAMILY du 171.0 1471. 1032. 4710 4112 RIGHT-OF-WAY acre 5.9 0. 0. 4710 5137 ARTERIAL COMMERCIAL ksf 10.1 557. 404. 4710 6119 OTHER PUBLIC SERVICE ksf 8.7 120. 87. 4710 7613 ACTIVE PARK acre 0.1 9. 6. 4710 TOTAL 2741. 1939.
4711 112 SINGLE FAMILY du 12.0 155. 108. 4711 121 MULTI-FAMILY du 10.0 114. 80. 4711 122 MULTI-FAMILY du 80.0 688. 483. 4711 2113 LIGHT INDUSTRY GENERAL ksf 8.0 149. 123. 4711 4112 RIGHT-OF-WAY acre 2.9 0. 0. 4711 6012 LOW RISE OFFICE A ksf 5.4 288. 222. 4711 TOTAL 1394. 1016.
4712 112 SINGLE FAMILY du 24.0 310. 216. 4712 121 MULTI-FAMILY du 15.0 171. 120. 4712 122 MULTI-FAMILY du 134.0 1152. 809.
Page 18
Existing Land Use TG by Land Use by zone.txt 4712 4112 RIGHT-OF-WAY acre 3.8 0. 0. 4712 6511 CLINIC ksf 3.0 201. 149. 4712 TOTAL 1834. 1294.
4713 112 SINGLE FAMILY du 11.0 142. 99. 4713 121 MULTI-FAMILY du 6.0 68. 48. 4713 122 MULTI-FAMILY du 25.0 215. 151. 4713 4112 RIGHT-OF-WAY acre 1.3 0. 0. 4713 5137 ARTERIAL COMMERCIAL ksf 6.5 359. 261. 4713 TOTAL 784. 559.
9aug13/08:28:04/tgm.pr� SESD and Encanto\Base Year 2008 Cal 5 trip generation and land use by zone page 20
---------------------- Land Use ---------------------- -----Trips----- Zone Code Name Type Amount Person Vehicle
4714 112 SINGLE FAMILY du 5.0 64. 45. 4714 121 MULTI-FAMILY du 13.0 148. 104. 4714 122 MULTI-FAMILY du 9.0 77. 54. 4714 4112 RIGHT-OF-WAY acre 3.6 0. 0. 4714 5137 ARTERIAL COMMERCIAL ksf 30.4 1672. 1214. 4714 TOTAL 1962. 1417.
4715 112 SINGLE FAMILY du 25.0 322. 225. 4715 121 MULTI-FAMILY du 17.0 194. 136. 4715 122 MULTI-FAMILY du 54.0 464. 326. 4715 4112 RIGHT-OF-WAY acre 4.1 0. 0. 4715 7611 OPEN SPACE PARK acre 0.0 0. 0. 4715 7613 ACTIVE PARK acre 2.7 204. 134. 4715 TOTAL 1185. 822.
4716 112 SINGLE FAMILY du 29.0 374. 261. 4716 121 MULTI-FAMILY du 4.0 46. 32. 4716 122 MULTI-FAMILY du 20.0 172. 121. 4716 4112 RIGHT-OF-WAY acre 2.0 0. 0. 4716 4114 PARKING acre 0.2 0. 0. 4716 5137 ARTERIAL COMMERCIAL ksf 9.4 518. 376. 4716 TOTAL 1109. 790.
4717 112 SINGLE FAMILY du 39.0 503. 351. 4717 121 MULTI-FAMILY du 34.0 388. 272. 4717 122 MULTI-FAMILY du 37.0 318. 223. 4717 4112 RIGHT-OF-WAY acre 2.5 0. 0. 4717 5137 ARTERIAL COMMERCIAL ksf 1.6 90. 65. 4717 TOTAL 1298. 912.
4718 112 SINGLE FAMILY du 36.0 464. 324. 4718 121 MULTI-FAMILY du 21.0 239. 168. 4718 122 MULTI-FAMILY du 10.0 86. 60. 4718 4112 RIGHT-OF-WAY acre 8.1 0. 0. 4718 4113 COMMUNICATION OR UTILITY acre 0.5 1. 1. 4718 5131 WHOLESALE TRADE ksf 15.7 1553. 1101. 4718 5137 ARTERIAL COMMERCIAL ksf 15.9 876. 637. 4718 6819 OTHER SCHOOL ksf 36.1 787. 650. 4718 7613 ACTIVE PARK acre 0.2 18. 12. 4718 TOTAL 4025. 2953.
4719 112 SINGLE FAMILY du 48.0 619. 432. 4719 121 MULTI-FAMILY du 45.0 513. 360. 4719 122 MULTI-FAMILY du 31.0 267. 187.
Page 19

Existing Land Use TG by Land Use by zone.txt 4719 4112 RIGHT-OF-WAY acre 3.8 0. 0. 4719 5137 ARTERIAL COMMERCIAL ksf 1.5 84. 61. 4719 TOTAL 1483. 1041.
4720 112 SINGLE FAMILY du 20.0 258. 180. 4720 121 MULTI-FAMILY du 22.0 251. 176. 4720 122 MULTI-FAMILY du 8.0 69. 48. 4720 1511 MOTEL room 27.0 394. 243.
9aug13/08:28:04/tgm.pr� SESD and Encanto\Base Year 2008 Cal 5 trip generation and land use by zone page 21
---------------------- Land Use ---------------------- -----Trips----- Zone Code Name Type Amount Person Vehicle
4720 4112 RIGHT-OF-WAY acre 5.5 0. 0. 4720 5137 ARTERIAL COMMERCIAL ksf 27.0 1485. 1079. 4720 TOTAL 2457. 1726.
4721 112 SINGLE FAMILY du 24.0 310. 216. 4721 121 MULTI-FAMILY du 24.0 274. 192. 4721 122 MULTI-FAMILY du 13.0 112. 78. 4721 4112 RIGHT-OF-WAY acre 6.4 0. 0. 4721 5137 ARTERIAL COMMERCIAL ksf 14.5 796. 578. 4721 6816 ELEMENTARY SCHOOL other 333.0 1132. 633. 4721 TOTAL 2624. 1698.
4722 112 SINGLE FAMILY du 101.0 1303. 909. 4722 121 MULTI-FAMILY du 81.0 923. 648. 4722 122 MULTI-FAMILY du 52.0 447. 314. 4722 2113 LIGHT INDUSTRY GENERAL ksf 23.7 441. 365. 4722 4112 RIGHT-OF-WAY acre 14.4 0. 0. 4722 5137 ARTERIAL COMMERCIAL ksf 2.3 127. 92. 4722 7611 OPEN SPACE PARK acre 2.6 20. 13. 4722 7613 ACTIVE PARK acre 0.2 17. 11. 4722 TOTAL 3279. 2354.
4723 112 SINGLE FAMILY du 15.0 193. 135. 4723 121 MULTI-FAMILY du 19.0 217. 152. 4723 122 MULTI-FAMILY du 150.0 1290. 906. 4723 4112 RIGHT-OF-WAY acre 14.2 0. 0. 4723 5137 ARTERIAL COMMERCIAL ksf 30.7 1689. 1227. 4723 TOTAL 3389. 2419.
4724 112 SINGLE FAMILY du 38.0 490. 342. 4724 121 MULTI-FAMILY du 59.0 673. 472. 4724 122 MULTI-FAMILY du 120.0 1032. 725. 4724 4112 RIGHT-OF-WAY acre 4.1 0. 0. 4724 TOTAL 2195. 1539.
4725 112 SINGLE FAMILY du 32.0 413. 288. 4725 121 MULTI-FAMILY du 44.0 502. 352. 4725 122 MULTI-FAMILY du 20.0 172. 121. 4725 4112 RIGHT-OF-WAY acre 5.7 0. 0. 4725 5137 ARTERIAL COMMERCIAL ksf 2.1 113. 82. 4725 6816 ELEMENTARY SCHOOL other 354.0 1204. 673. 4725 TOTAL 2403. 1516.
4726 112 SINGLE FAMILY du 120.0 1548. 1081. 4726 121 MULTI-FAMILY du 10.0 114. 80. 4726 4112 RIGHT-OF-WAY acre 16.7 0. 0. 4726 5025 SERVICE STATION FOOD MART other 8.0 1650. 1199.
Page 20

Existing Land Use TG by Land Use by zone.txt 4726 5137 ARTERIAL COMMERCIAL ksf 1.4 76. 55. 4726 7611 OPEN SPACE PARK acre 6.3 49. 32. 4726 TOTAL 3437. 2446.
4727 112 SINGLE FAMILY du 108.0 1393. 972.
9aug13/08:28:04/tgm.pr� SESD and Encanto\Base Year 2008 Cal 5 trip generation and land use by zone page 22
---------------------- Land Use ---------------------- -----Trips----- Zone Code Name Type Amount Person Vehicle
4727 4112 RIGHT-OF-WAY acre 13.3 0. 0. 4727 7611 OPEN SPACE PARK acre 8.6 67. 44. 4727 TOTAL 1460. 1016.
4728 112 SINGLE FAMILY du 220.0 2838. 1981. 4728 121 MULTI-FAMILY du 22.0 251. 176. 4728 122 MULTI-FAMILY du 12.0 103. 72. 4728 4112 RIGHT-OF-WAY acre 13.2 0. 0. 4728 6112 RELIGIOUS FACILITY ksf 7.7 50. 38. 4728 7611 OPEN SPACE PARK acre 5.8 45. 29. 4728 TOTAL 3286. 2297.
9aug13/08:28:04/tgm.pr
Page 21

Proposed Land Use Summary.txt� 203RC11C - Proposed Land Use\Reasonably Expected Network with SR-94 Alt 1\with C PAGE 1
Land Use Summary
Person ---------- Activity ---------- -------- Trip Rate --------- Code Name Trips DUs Acres Employment du acre employee 111 SINGLE FAMILY 26. 2. 0. 0. 12.9 0.0 0.0 112 SINGLE FAMILY 202814. 15722. 0. 0. 12.9 0.0 0.0 121 MULTI-FAMILY 60944. 5346. 0. 0. 11.4 0.0 0.0 122 MULTI-FAMILY 157638. 18330. 0. 0. 8.6 0.0 0.0 131 MOBILE HOME PARK 1875. 250. 0. 0. 7.5 0.0 0.0 1411 CONGREGATE CARE FACILITY 77. 0. 18. 0. 0.0 4.3 0.0 1421 CORRECTIONAL FACILITY 840. 0. 300. 0. 0.0 2.8 0.0 1511 MOTEL 1329. 0. 91. 0. 0.0 14.6 0.0 2111 INDUSTRIAL PARK 4858. 0. 265. 0. 0.0 18.3 0.0 2113 LIGHT INDUSTRY GENERAL 49196. 0. 2645. 0. 0.0 18.6 0.0 2114 WAREHOUSING 466. 0. 76. 0. 0.0 6.1 0.0 4112 RIGHT-OF-WAY 0. 0. 1903. 0. 0.0 0.0 0.0 4113 COMMUNICATION OR UTILITY 180. 0. 56. 0. 0.0 3.2 0.0 4114 PARKING 0. 0. 4. 0. 0.0 0.0 0.0 4121 RAIL/TRANSIT CENTER 1090. 0. 3. 0. 0.0 392.8 0.0 5011 HIGH TURNOVER RESTAURANT 4802. 0. 27. 0. 0.0 178.8 0.0 5013 SUPERMARKET 908. 0. 4. 0. 0.0 206.3 0.0 5014 CONVENIENCE MARKET CHAIN 27718. 0. 40. 0. 0.0 687.8 0.0 5025 SERVICE STATION FOOD MART 7839. 0. 38. 0. 0.0 206.3 0.0 5027 SERVICE STATION CAR WASH 4264. 0. 20. 0. 0.0 213.2 0.0 5028 AUTO PARTS 490. 0. 6. 0. 0.0 85.3 0.0 5029 AUTO REPAIR 1173. 0. 43. 0. 0.0 27.5 0.0 5030 AUTO TIRES 260. 0. 8. 0. 0.0 34.4 0.0 5131 WHOLESALE TRADE 1553. 0. 16. 0. 0.0 98.9 0.0 5133 COMMUNITY SHOP CENTER 117740. 0. 1091. 0. 0.0 107.9 0.0 5134 NEIGHBORHOOD SHOP CENTER 17061. 0. 101. 0. 0.0 169.5 0.0 5136 AUTO DEALERSHIP 89. 0. 0. 0. 0.0 423.8 0.0
Page 1

Proposed Land Use Summary.txt 5137 ARTERIAL COMMERCIAL 124385. 0. 2262. 0. 0.0 55.0 0.0 5138 SERVICE STATION 2971. 0. 16. 0. 0.0 185.7 0.0 5139 OTHER RETAIL TRADE 1323. 0. 24. 0. 0.0 55.1 0.0 6012 LOW RISE OFFICE A 5946. 0. 111. 0. 0.0 53.4 0.0 6022 LOW RISE OFFICE B 526. 0. 12. 0. 0.0 44.3 0.0 6042 LOW RISE OFFICE D 1504. 0. 46. 0. 0.0 32.6 0.0 6052 LOW RISE OFFICE E 1349. 0. 52. 0. 0.0 26.1 0.0 6072 LOW RISE OFFICE E 1640. 0. 66. 0. 0.0 24.8 0.0 6082 LOW RISE OFFICE H 3103. 0. 125. 0. 0.0 24.8 0.0 6013 GOV'T /CIVIC CENTER 2092. 0. 52. 0. 0.0 39.9 0.0 6014 GOV'T OFFICE 881. 0. 22. 0. 0.0 39.9 0.0 6111 CEMETERY 1000. 0. 164. 0. 0.0 6.1 0.0 6112 RELIGIOUS FACILITY 6034. 0. 928. 0. 0.0 6.5 0.0 6113 LIBRARY 3745. 0. 51. 0. 0.0 73.6 0.0 6115 FIRE OR POLICE STATION 1715. 0. 42. 0. 0.0 40.7 0.0 6114 POST OFFICE 1680. 0. 6. 0. 0.0 287.3 0.0 6119 OTHER PUBLIC SERVICE 317. 0. 23. 0. 0.0 13.8 0.0 6129 MEETING ROOM FACILITY 1301. 0. 31. 0. 0.0 41.5 0.0 6511 CLINIC 14546. 0. 216. 0. 0.0 67.3 0.0 6519 OTHER HEALTH CARE 2004. 0. 30. 0. 0.0 67.3 0.0 6810 DAY CARE CENTER 1549. 0. 254. 0. 0.0 6.1 0.0 6812 UNIVERSITY OR COLLEGE 15334. 0. 7667. 0. 0.0 2.0 0.0 6814 SENIOR HIGH SCHOOL 13132. 0. 3283. 0. 0.0 4.0 0.0 6815 JUNIOR HIGH OR MIDDLE SCHOOL 6902. 0. 3001. 0. 0.0 2.3 0.0 6816 ELEMENTARY SCHOOL 39331. 0. 11568. 0. 0.0 3.4 0.0 6819 OTHER SCHOOL 1103. 0. 51. 0. 0.0 21.8 0.0 7220 OTHER RECREATION-HIGH 438. 0. 6. 0. 0.0 73.4 0.0 7611 OPEN SPACE PARK 1870. 0. 243. 0. 0.0 7.7 0.0 7613 ACTIVE PARK 10961. 0. 142. 0. 0.0 77.0 0.0 9101 INACTIVE USE 0. 0. 15. 0. 0.0 0.0 0.0 total 933916. 39650. 37264. 0.
Page 2
Proposed Land Use Summary.txt
30jan14/13:36:48/tgm.sum
Page 3

Proposed Project Land Use TG by Land Use by zone.txt 203RC11C - Proposed Land Use\Reasonably Expected Network with SR-94 Alt 1\with C trip generation and land use by zone page 1
---------------------- Land Use ---------------------- -----Trips----- Zone Code Name Type Amount Person Vehicle
3554 111 SINGLE FAMILY du 1.0 13. 9. 3554 112 SINGLE FAMILY du 564.0 7276. 5078. 3554 121 MULTI-FAMILY du 3.0 34. 24. 3554 1411 CONGREGATE CARE FACILITY other 6.0 26. 18. 3554 4112 RIGHT-OF-WAY acre 32.3 0. 0. 3554 7611 OPEN SPACE PARK acre 2.3 18. 12. 3554 TOTAL 7367. 5141.
3574 2113 LIGHT INDUSTRY GENERAL ksf 143.4 2668. 2206. 3574 4112 RIGHT-OF-WAY acre 9.1 0. 0. 3574 5137 ARTERIAL COMMERCIAL ksf 43.9 2415. 1754. 3574 TOTAL 5083. 3960.
3594 4112 RIGHT-OF-WAY acre 21.2 0. 0. 3594 TOTAL 0. 0.
3602 112 SINGLE FAMILY du 227.0 2928. 2044. 3602 4112 RIGHT-OF-WAY acre 28.8 0. 0. 3602 4113 COMMUNICATION OR UTILITY acre 31.3 100. 78. 3602 6112 RELIGIOUS FACILITY ksf 14.0 91. 70. 3602 6816 ELEMENTARY SCHOOL other 357.0 1214. 678. 3602 7611 OPEN SPACE PARK acre 70.6 543. 358. 3602 7613 ACTIVE PARK acre 9.4 725. 477. 3602 TOTAL 5602. 3705.
3627 112 SINGLE FAMILY du 315.0 4063. 2836. 3627 121 MULTI-FAMILY du 25.0 285. 200. 3627 4112 RIGHT-OF-WAY acre 23.0 0. 0. 3627 TOTAL 4348. 3036.
3696 112 SINGLE FAMILY du 175.0 2257. 1576. 3696 121 MULTI-FAMILY du 23.0 262. 184. 3696 122 MULTI-FAMILY du 13.0 112. 78. 3696 4112 RIGHT-OF-WAY acre 8.4 0. 0. 3696 6112 RELIGIOUS FACILITY ksf 5.7 37. 28. 3696 6816 ELEMENTARY SCHOOL other 713.0 2424. 1355. 3696 7611 OPEN SPACE PARK acre 0.7 5. 4. 3696 TOTAL 5098. 3225.
3720 112 SINGLE FAMILY du 343.0 4425. 3088. 3720 121 MULTI-FAMILY du 3.0 34. 24. 3720 4112 RIGHT-OF-WAY acre 13.3 0. 0. 3720 6112 RELIGIOUS FACILITY ksf 16.6 108. 83. 3720 7611 OPEN SPACE PARK acre 7.2 56. 37. 3720 TOTAL 4622. 3232.
3744 112 SINGLE FAMILY du 518.0 6682. 4664. 3744 121 MULTI-FAMILY du 66.0 752. 528. 3744 122 MULTI-FAMILY du 13.0 112. 78. 3744 4112 RIGHT-OF-WAY acre 29.7 0. 0. 3744 6111 CEMETERY acre 40.5 247. 202. 3744 6112 RELIGIOUS FACILITY ksf 22.0 143. 110. 3744 TOTAL 7936. 5583.
30jan14/13:36:48/tgm.pr�203RC11C - Proposed Land Use\Reasonably Expected Network with SR-94 Alt 1\with C
Page 1

Proposed Project Land Use TG by Land Use by zone.txt trip generation and land use by zone page 2
---------------------- Land Use ---------------------- -----Trips----- Zone Code Name Type Amount Person Vehicle
3745 112 SINGLE FAMILY du 315.0 4063. 2836. 3745 121 MULTI-FAMILY du 228.0 2599. 1825. 3745 122 MULTI-FAMILY du 65.0 559. 392. 3745 4112 RIGHT-OF-WAY acre 67.8 0. 0. 3745 6112 RELIGIOUS FACILITY ksf 4.3 28. 21. 3745 TOTAL 7250. 5075.
3764 112 SINGLE FAMILY du 349.0 4502. 3142. 3764 121 MULTI-FAMILY du 142.0 1619. 1136. 3764 122 MULTI-FAMILY du 302.0 2597. 1823. 3764 4112 RIGHT-OF-WAY acre 18.2 0. 0. 3764 5137 ARTERIAL COMMERCIAL ksf 60.8 3346. 2430. 3764 6814 SENIOR HIGH SCHOOL other 950.0 3800. 1710. 3764 6815 JUNIOR HIGH OR MIDDLE SCHOOL other 420.0 966. 593. 3764 7613 ACTIVE PARK acre 4.7 365. 240. 3764 TOTAL 17194. 11075.
3766 112 SINGLE FAMILY du 13.0 168. 117. 3766 121 MULTI-FAMILY du 6.0 68. 48. 3766 2113 LIGHT INDUSTRY GENERAL ksf 511.6 9516. 7869. 3766 2114 WAREHOUSING ksf 30.3 185. 155. 3766 4112 RIGHT-OF-WAY acre 39.4 0. 0. 3766 4113 COMMUNICATION OR UTILITY acre 15.6 50. 39. 3766 6082 LOW RISE OFFICE H ksf 125.1 3103. 2390. 3766 7611 OPEN SPACE PARK acre 0.7 6. 4. 3766 TOTAL 13096. 10621.
3767 2113 LIGHT INDUSTRY GENERAL ksf 596.5 11095. 9174. 3767 4112 RIGHT-OF-WAY acre 8.0 0. 0. 3767 5133 COMMUNITY SHOP CENTER ksf 127.6 13768. 9743. 3767 6511 CLINIC ksf 31.9 2148. 1595. 3767 7611 OPEN SPACE PARK acre 0.1 1. 1. 3767 7613 ACTIVE PARK acre 5.6 434. 285. 3767 TOTAL 27446. 20798.
3817 112 SINGLE FAMILY du 283.0 3651. 2548. 3817 121 MULTI-FAMILY du 45.0 513. 360. 3817 122 MULTI-FAMILY du 88.0 757. 531. 3817 4112 RIGHT-OF-WAY acre 29.2 0. 0. 3817 4113 COMMUNICATION OR UTILITY acre 0.3 1. 1. 3817 6112 RELIGIOUS FACILITY ksf 15.0 98. 75. 3817 7611 OPEN SPACE PARK acre 0.1 1. 0. 3817 7613 ACTIVE PARK acre 5.8 449. 296. 3817 TOTAL 5469. 3812.
3831 112 SINGLE FAMILY du 10.0 129. 90. 3831 121 MULTI-FAMILY du 4.0 46. 32. 3831 122 MULTI-FAMILY du 46.0 396. 278. 3831 2113 LIGHT INDUSTRY GENERAL ksf 29.2 543. 449. 3831 4112 RIGHT-OF-WAY acre 17.0 0. 0. 3831 4113 COMMUNICATION OR UTILITY acre 2.9 9. 7. 3831 5137 ARTERIAL COMMERCIAL ksf 63.2 3477. 2525.
30jan14/13:36:48/tgm.pr�203RC11C - Proposed Land Use\Reasonably Expected Network with SR-94 Alt 1\with C trip generation and land use by zone page 3
---------------------- Land Use ---------------------- -----Trips-----Page 2
Proposed Project Land Use TG by Land Use by zone.txt Zone Code Name Type Amount Person Vehicle
3831 6052 LOW RISE OFFICE E ksf 51.7 1349. 1039. 3831 6112 RELIGIOUS FACILITY ksf 27.7 180. 138. 3831 6119 OTHER PUBLIC SERVICE ksf 8.1 111. 80. 3831 6815 JUNIOR HIGH OR MIDDLE SCHOOL other 212.0 488. 300. 3831 TOTAL 6727. 4939.
3854 112 SINGLE FAMILY du 21.0 271. 189. 3854 121 MULTI-FAMILY du 3.0 34. 24. 3854 122 MULTI-FAMILY du 126.0 1084. 761. 3854 4112 RIGHT-OF-WAY acre 24.2 0. 0. 3854 5137 ARTERIAL COMMERCIAL ksf 4.8 264. 192. 3854 6112 RELIGIOUS FACILITY ksf 15.7 102. 78. 3854 6816 ELEMENTARY SCHOOL other 273.0 928. 519. 3854 TOTAL 2683. 1763.
3855 112 SINGLE FAMILY du 297.0 3831. 2674. 3855 121 MULTI-FAMILY du 86.0 980. 688. 3855 122 MULTI-FAMILY du 107.0 920. 646. 3855 2113 LIGHT INDUSTRY GENERAL ksf 12.1 225. 186. 3855 4112 RIGHT-OF-WAY acre 30.0 0. 0. 3855 4113 COMMUNICATION OR UTILITY acre 0.3 1. 1. 3855 4114 PARKING acre 0.3 0. 0. 3855 5025 SERVICE STATION FOOD MART other 10.0 2063. 1498. 3855 5134 NEIGHBORHOOD SHOP CENTER ksf 8.7 1473. 1042. 3855 5137 ARTERIAL COMMERCIAL ksf 92.1 5066. 3680. 3855 6014 GOV'T OFFICE ksf 22.1 881. 662. 3855 6112 RELIGIOUS FACILITY ksf 3.4 22. 17. 3855 6810 DAY CARE CENTER other 75.0 457. 378. 3855 6816 ELEMENTARY SCHOOL other 737.0 2506. 1400. 3855 7611 OPEN SPACE PARK acre 0.4 3. 2. 3855 TOTAL 18430. 12875.
3857 112 SINGLE FAMILY du 252.0 3251. 2269. 3857 121 MULTI-FAMILY du 276.0 3146. 2209. 3857 122 MULTI-FAMILY du 124.0 1066. 749. 3857 2113 LIGHT INDUSTRY GENERAL ksf 364.0 6770. 5598. 3857 4112 RIGHT-OF-WAY acre 51.0 0. 0. 3857 5137 ARTERIAL COMMERCIAL ksf 59.3 3262. 2369. 3857 6042 LOW RISE OFFICE D ksf 46.1 1504. 1158. 3857 6112 RELIGIOUS FACILITY ksf 28.7 186. 143. 3857 TOTAL 19186. 14495.
3858 112 SINGLE FAMILY du 20.0 258. 180. 3858 121 MULTI-FAMILY du 33.0 376. 264. 3858 122 MULTI-FAMILY du 67.0 576. 405. 3858 4112 RIGHT-OF-WAY acre 5.3 0. 0. 3858 5137 ARTERIAL COMMERCIAL ksf 20.1 1107. 804. 3858 6012 LOW RISE OFFICE A ksf 7.0 372. 287. 3858 9101 INACTIVE USE acre 0.3 0. 0. 3858 TOTAL 2690. 1939.
3860 112 SINGLE FAMILY du 83.0 1071. 747.
30jan14/13:36:48/tgm.pr�203RC11C - Proposed Land Use\Reasonably Expected Network with SR-94 Alt 1\with C trip generation and land use by zone page 4
---------------------- Land Use ---------------------- -----Trips----- Zone Code Name Type Amount Person Vehicle
3860 122 MULTI-FAMILY du 68.0 585. 411.Page 3
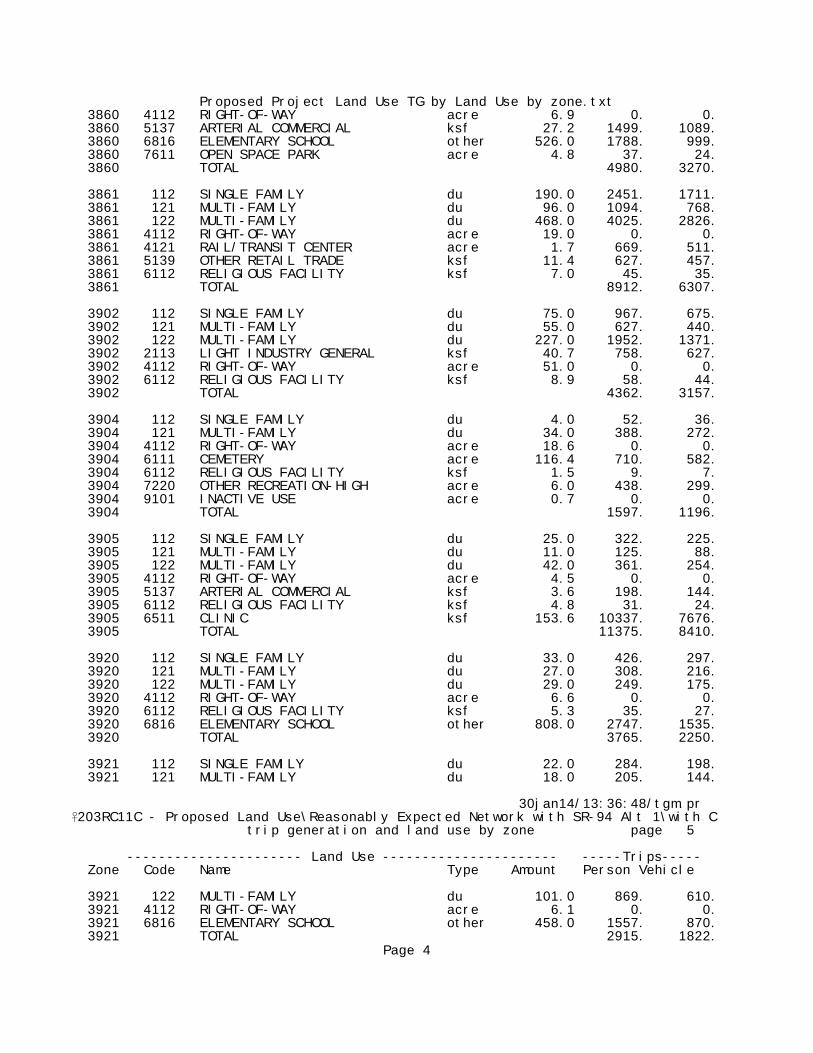
Proposed Project Land Use TG by Land Use by zone.txt 3860 4112 RIGHT-OF-WAY acre 6.9 0. 0. 3860 5137 ARTERIAL COMMERCIAL ksf 27.2 1499. 1089. 3860 6816 ELEMENTARY SCHOOL other 526.0 1788. 999. 3860 7611 OPEN SPACE PARK acre 4.8 37. 24. 3860 TOTAL 4980. 3270.
3861 112 SINGLE FAMILY du 190.0 2451. 1711. 3861 121 MULTI-FAMILY du 96.0 1094. 768. 3861 122 MULTI-FAMILY du 468.0 4025. 2826. 3861 4112 RIGHT-OF-WAY acre 19.0 0. 0. 3861 4121 RAIL/TRANSIT CENTER acre 1.7 669. 511. 3861 5139 OTHER RETAIL TRADE ksf 11.4 627. 457. 3861 6112 RELIGIOUS FACILITY ksf 7.0 45. 35. 3861 TOTAL 8912. 6307.
3902 112 SINGLE FAMILY du 75.0 967. 675. 3902 121 MULTI-FAMILY du 55.0 627. 440. 3902 122 MULTI-FAMILY du 227.0 1952. 1371. 3902 2113 LIGHT INDUSTRY GENERAL ksf 40.7 758. 627. 3902 4112 RIGHT-OF-WAY acre 51.0 0. 0. 3902 6112 RELIGIOUS FACILITY ksf 8.9 58. 44. 3902 TOTAL 4362. 3157.
3904 112 SINGLE FAMILY du 4.0 52. 36. 3904 121 MULTI-FAMILY du 34.0 388. 272. 3904 4112 RIGHT-OF-WAY acre 18.6 0. 0. 3904 6111 CEMETERY acre 116.4 710. 582. 3904 6112 RELIGIOUS FACILITY ksf 1.5 9. 7. 3904 7220 OTHER RECREATION-HIGH acre 6.0 438. 299. 3904 9101 INACTIVE USE acre 0.7 0. 0. 3904 TOTAL 1597. 1196.
3905 112 SINGLE FAMILY du 25.0 322. 225. 3905 121 MULTI-FAMILY du 11.0 125. 88. 3905 122 MULTI-FAMILY du 42.0 361. 254. 3905 4112 RIGHT-OF-WAY acre 4.5 0. 0. 3905 5137 ARTERIAL COMMERCIAL ksf 3.6 198. 144. 3905 6112 RELIGIOUS FACILITY ksf 4.8 31. 24. 3905 6511 CLINIC ksf 153.6 10337. 7676. 3905 TOTAL 11375. 8410.
3920 112 SINGLE FAMILY du 33.0 426. 297. 3920 121 MULTI-FAMILY du 27.0 308. 216. 3920 122 MULTI-FAMILY du 29.0 249. 175. 3920 4112 RIGHT-OF-WAY acre 6.6 0. 0. 3920 6112 RELIGIOUS FACILITY ksf 5.3 35. 27. 3920 6816 ELEMENTARY SCHOOL other 808.0 2747. 1535. 3920 TOTAL 3765. 2250.
3921 112 SINGLE FAMILY du 22.0 284. 198. 3921 121 MULTI-FAMILY du 18.0 205. 144.
30jan14/13:36:48/tgm.pr�203RC11C - Proposed Land Use\Reasonably Expected Network with SR-94 Alt 1\with C trip generation and land use by zone page 5
---------------------- Land Use ---------------------- -----Trips----- Zone Code Name Type Amount Person Vehicle
3921 122 MULTI-FAMILY du 101.0 869. 610. 3921 4112 RIGHT-OF-WAY acre 6.1 0. 0. 3921 6816 ELEMENTARY SCHOOL other 458.0 1557. 870. 3921 TOTAL 2915. 1822.
Page 4

Proposed Project Land Use TG by Land Use by zone.txt
3922 112 SINGLE FAMILY du 285.0 3676. 2566. 3922 121 MULTI-FAMILY du 80.0 912. 640. 3922 122 MULTI-FAMILY du 306.0 2632. 1848. 3922 131 MOBILE HOME PARK du 250.0 1875. 1243. 3922 4112 RIGHT-OF-WAY acre 25.6 0. 0. 3922 6112 RELIGIOUS FACILITY ksf 40.0 260. 200. 3922 7611 OPEN SPACE PARK acre 0.3 2. 1. 3922 9101 INACTIVE USE du 0.5 0. 0. 3922 TOTAL 9357. 6499.
3924 122 MULTI-FAMILY du 163.0 1402. 984. 3924 4112 RIGHT-OF-WAY acre 4.1 0. 0. 3924 4113 COMMUNICATION OR UTILITY acre 0.2 1. 0. 3924 5025 SERVICE STATION FOOD MART other 8.0 1650. 1199. 3924 5137 ARTERIAL COMMERCIAL ksf 43.3 2383. 1731. 3924 6112 RELIGIOUS FACILITY ksf 4.0 26. 20. 3924 TOTAL 5462. 3934.
3926 121 MULTI-FAMILY du 74.0 844. 592. 3926 122 MULTI-FAMILY du 324.0 2786. 1956. 3926 2113 LIGHT INDUSTRY GENERAL ksf 179.4 3337. 2760. 3926 4112 RIGHT-OF-WAY acre 4.2 0. 0. 3926 5137 ARTERIAL COMMERCIAL ksf 35.5 1955. 1420. 3926 TOTAL 8922. 6728.
3927 112 SINGLE FAMILY du 18.0 232. 162. 3927 121 MULTI-FAMILY du 118.0 1345. 944. 3927 122 MULTI-FAMILY du 305.0 2623. 1841. 3927 2111 INDUSTRIAL PARK ksf 152.0 2781. 2310. 3927 2113 LIGHT INDUSTRY GENERAL ksf 153.4 2854. 2360. 3927 4112 RIGHT-OF-WAY acre 10.0 0. 0. 3927 5137 ARTERIAL COMMERCIAL ksf 24.2 1332. 968. 3927 7611 OPEN SPACE PARK acre 6.4 49. 32. 3927 TOTAL 11217. 8618.
3929 122 MULTI-FAMILY du 244.0 2098. 1473. 3929 4112 RIGHT-OF-WAY acre 2.7 0. 0. 3929 5137 ARTERIAL COMMERCIAL ksf 60.9 3349. 2433. 3929 TOTAL 5448. 3906.
3944 112 SINGLE FAMILY du 1.0 13. 9. 3944 122 MULTI-FAMILY du 1294.0 11128. 7813. 3944 4112 RIGHT-OF-WAY acre 12.4 0. 0. 3944 4121 RAIL/TRANSIT CENTER acre 1.1 422. 322. 3944 5137 ARTERIAL COMMERCIAL ksf 30.4 1670. 1213. 3944 6112 RELIGIOUS FACILITY ksf 5.1 33. 25. 3944 7611 OPEN SPACE PARK acre 3.5 27. 17. 3944 TOTAL 13292. 9400.
30jan14/13:36:48/tgm.pr�203RC11C - Proposed Land Use\Reasonably Expected Network with SR-94 Alt 1\with C trip generation and land use by zone page 6
---------------------- Land Use ---------------------- -----Trips----- Zone Code Name Type Amount Person Vehicle
3945 122 MULTI-FAMILY du 147.0 1264. 888. 3945 4112 RIGHT-OF-WAY acre 0.6 0. 0. 3945 5137 ARTERIAL COMMERCIAL ksf 29.4 1615. 1173. 3945 6012 LOW RISE OFFICE A ksf 64.0 3418. 2632. 3945 6129 MEETING ROOM FACILITY ksf 16.0 664. 480.
Page 5

Proposed Project Land Use TG by Land Use by zone.txt 3945 7611 OPEN SPACE PARK acre 3.8 30. 19. 3945 TOTAL 6991. 5192.
3946 112 SINGLE FAMILY du 309.0 3986. 2782. 3946 121 MULTI-FAMILY du 61.0 695. 488. 3946 122 MULTI-FAMILY du 218.0 1875. 1316. 3946 4112 RIGHT-OF-WAY acre 23.4 0. 0. 3946 5137 ARTERIAL COMMERCIAL ksf 48.9 2691. 1954. 3946 6112 RELIGIOUS FACILITY ksf 2.7 17. 13. 3946 6816 ELEMENTARY SCHOOL other 614.0 2088. 1167. 3946 7611 OPEN SPACE PARK acre 14.6 112. 74. 3946 TOTAL 11464. 7795.
3947 112 SINGLE FAMILY du 116.0 1496. 1044. 3947 121 MULTI-FAMILY du 13.0 148. 104. 3947 122 MULTI-FAMILY du 191.0 1643. 1153. 3947 4112 RIGHT-OF-WAY acre 13.4 0. 0. 3947 4114 PARKING acre 0.3 0. 0. 3947 5137 ARTERIAL COMMERCIAL ksf 25.6 1410. 1024. 3947 6112 RELIGIOUS FACILITY ksf 11.5 75. 58. 3947 7611 OPEN SPACE PARK acre 1.9 15. 10. 3947 9101 INACTIVE USE du 0.0 0. 0. 3947 TOTAL 4786. 3393.
3949 112 SINGLE FAMILY du 572.0 7379. 5150. 3949 121 MULTI-FAMILY du 58.0 661. 464. 3949 122 MULTI-FAMILY du 1098.0 9443. 6629. 3949 4112 RIGHT-OF-WAY acre 27.2 0. 0. 3949 5137 ARTERIAL COMMERCIAL ksf 19.7 1085. 788. 3949 5138 SERVICE STATION other 8.0 1486. 1082. 3949 6112 RELIGIOUS FACILITY ksf 25.6 166. 128. 3949 6816 ELEMENTARY SCHOOL other 270.0 918. 513. 3949 7611 OPEN SPACE PARK acre 1.0 8. 5. 3949 TOTAL 21145. 14760.
3958 112 SINGLE FAMILY du 58.0 748. 522. 3958 121 MULTI-FAMILY du 21.0 239. 168. 3958 122 MULTI-FAMILY du 41.0 353. 248. 3958 2114 WAREHOUSING ksf 1.5 9. 8. 3958 4112 RIGHT-OF-WAY acre 4.5 0. 0. 3958 4114 PARKING acre 0.1 0. 0. 3958 5011 HIGH TURNOVER RESTAURANT ksf 5.6 1002. 728. 3958 5137 ARTERIAL COMMERCIAL ksf 5.7 312. 227. 3958 TOTAL 2663. 1900.
3959 112 SINGLE FAMILY du 125.0 1612. 1126. 3959 121 MULTI-FAMILY du 19.0 217. 152.
30jan14/13:36:48/tgm.pr�203RC11C - Proposed Land Use\Reasonably Expected Network with SR-94 Alt 1\with C trip generation and land use by zone page 7
---------------------- Land Use ---------------------- -----Trips----- Zone Code Name Type Amount Person Vehicle
3959 122 MULTI-FAMILY du 50.0 430. 302. 3959 2113 LIGHT INDUSTRY GENERAL ksf 3.1 57. 47. 3959 4112 RIGHT-OF-WAY acre 6.5 0. 0. 3959 4114 PARKING acre 0.2 0. 0. 3959 5011 HIGH TURNOVER RESTAURANT ksf 1.5 268. 195. 3959 5014 CONVENIENCE MARKET CHAIN ksf 3.0 2063. 1499. 3959 5137 ARTERIAL COMMERCIAL ksf 58.2 3200. 2324. 3959 7613 ACTIVE PARK acre 0.2 12. 8.
Page 6
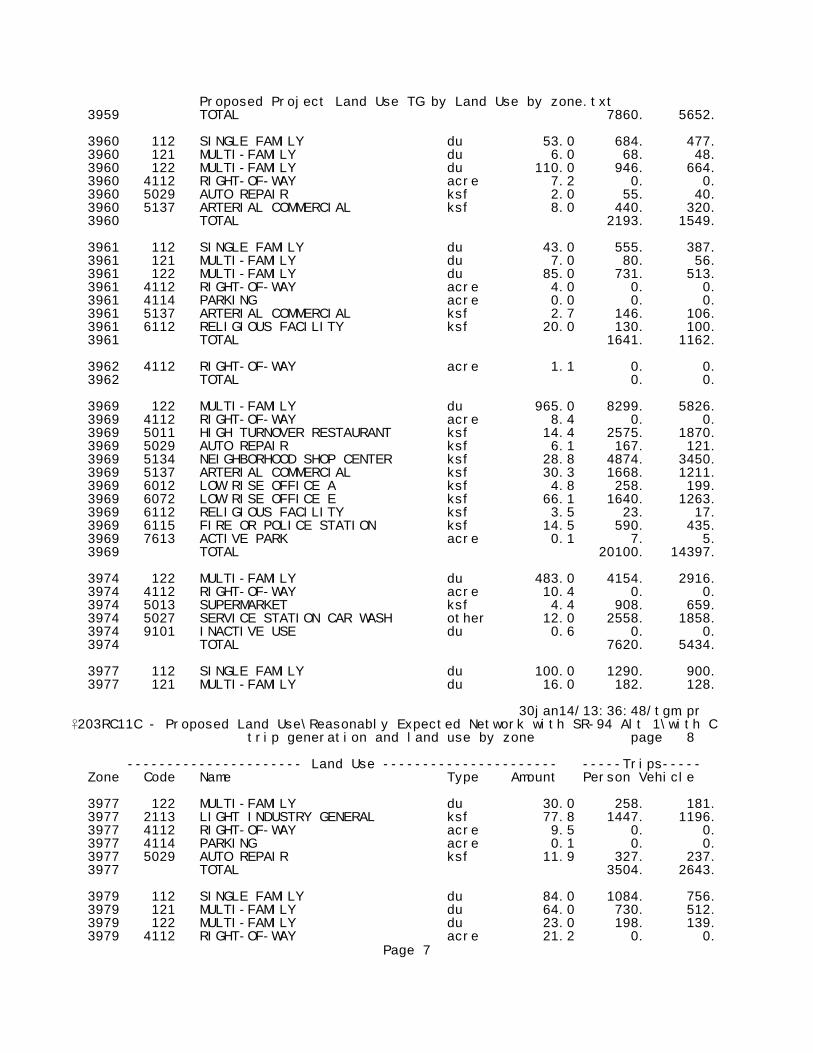
Proposed Project Land Use TG by Land Use by zone.txt 3959 TOTAL 7860. 5652.
3960 112 SINGLE FAMILY du 53.0 684. 477. 3960 121 MULTI-FAMILY du 6.0 68. 48. 3960 122 MULTI-FAMILY du 110.0 946. 664. 3960 4112 RIGHT-OF-WAY acre 7.2 0. 0. 3960 5029 AUTO REPAIR ksf 2.0 55. 40. 3960 5137 ARTERIAL COMMERCIAL ksf 8.0 440. 320. 3960 TOTAL 2193. 1549.
3961 112 SINGLE FAMILY du 43.0 555. 387. 3961 121 MULTI-FAMILY du 7.0 80. 56. 3961 122 MULTI-FAMILY du 85.0 731. 513. 3961 4112 RIGHT-OF-WAY acre 4.0 0. 0. 3961 4114 PARKING acre 0.0 0. 0. 3961 5137 ARTERIAL COMMERCIAL ksf 2.7 146. 106. 3961 6112 RELIGIOUS FACILITY ksf 20.0 130. 100. 3961 TOTAL 1641. 1162.
3962 4112 RIGHT-OF-WAY acre 1.1 0. 0. 3962 TOTAL 0. 0.
3969 122 MULTI-FAMILY du 965.0 8299. 5826. 3969 4112 RIGHT-OF-WAY acre 8.4 0. 0. 3969 5011 HIGH TURNOVER RESTAURANT ksf 14.4 2575. 1870. 3969 5029 AUTO REPAIR ksf 6.1 167. 121. 3969 5134 NEIGHBORHOOD SHOP CENTER ksf 28.8 4874. 3450. 3969 5137 ARTERIAL COMMERCIAL ksf 30.3 1668. 1211. 3969 6012 LOW RISE OFFICE A ksf 4.8 258. 199. 3969 6072 LOW RISE OFFICE E ksf 66.1 1640. 1263. 3969 6112 RELIGIOUS FACILITY ksf 3.5 23. 17. 3969 6115 FIRE OR POLICE STATION ksf 14.5 590. 435. 3969 7613 ACTIVE PARK acre 0.1 7. 5. 3969 TOTAL 20100. 14397.
3974 122 MULTI-FAMILY du 483.0 4154. 2916. 3974 4112 RIGHT-OF-WAY acre 10.4 0. 0. 3974 5013 SUPERMARKET ksf 4.4 908. 659. 3974 5027 SERVICE STATION CAR WASH other 12.0 2558. 1858. 3974 9101 INACTIVE USE du 0.6 0. 0. 3974 TOTAL 7620. 5434.
3977 112 SINGLE FAMILY du 100.0 1290. 900. 3977 121 MULTI-FAMILY du 16.0 182. 128.
30jan14/13:36:48/tgm.pr�203RC11C - Proposed Land Use\Reasonably Expected Network with SR-94 Alt 1\with C trip generation and land use by zone page 8
---------------------- Land Use ---------------------- -----Trips----- Zone Code Name Type Amount Person Vehicle
3977 122 MULTI-FAMILY du 30.0 258. 181. 3977 2113 LIGHT INDUSTRY GENERAL ksf 77.8 1447. 1196. 3977 4112 RIGHT-OF-WAY acre 9.5 0. 0. 3977 4114 PARKING acre 0.1 0. 0. 3977 5029 AUTO REPAIR ksf 11.9 327. 237. 3977 TOTAL 3504. 2643.
3979 112 SINGLE FAMILY du 84.0 1084. 756. 3979 121 MULTI-FAMILY du 64.0 730. 512. 3979 122 MULTI-FAMILY du 23.0 198. 139. 3979 4112 RIGHT-OF-WAY acre 21.2 0. 0.
Page 7

Proposed Project Land Use TG by Land Use by zone.txt 3979 6112 RELIGIOUS FACILITY ksf 4.9 32. 24. 3979 7611 OPEN SPACE PARK acre 1.9 15. 10. 3979 9101 INACTIVE USE du 0.2 0. 0. 3979 TOTAL 2057. 1441.
3980 112 SINGLE FAMILY du 108.0 1393. 972. 3980 121 MULTI-FAMILY du 76.0 866. 608. 3980 122 MULTI-FAMILY du 84.0 722. 507. 3980 4112 RIGHT-OF-WAY acre 20.9 0. 0. 3980 6112 RELIGIOUS FACILITY ksf 14.5 94. 72. 3980 6115 FIRE OR POLICE STATION ksf 9.6 391. 288. 3980 TOTAL 3467. 2448.
3984 112 SINGLE FAMILY du 92.0 1187. 828. 3984 121 MULTI-FAMILY du 10.0 114. 80. 3984 122 MULTI-FAMILY du 136.0 1170. 821. 3984 2113 LIGHT INDUSTRY GENERAL ksf 22.1 412. 340. 3984 4112 RIGHT-OF-WAY acre 9.6 0. 0. 3984 5029 AUTO REPAIR ksf 2.0 55. 40. 3984 5137 ARTERIAL COMMERCIAL ksf 26.8 1471. 1069. 3984 6012 LOW RISE OFFICE A ksf 2.2 118. 91. 3984 6112 RELIGIOUS FACILITY ksf 4.5 29. 22. 3984 9101 INACTIVE USE du 0.1 0. 0. 3984 TOTAL 4556. 3292.
3985 112 SINGLE FAMILY du 64.0 826. 576. 3985 122 MULTI-FAMILY du 86.0 740. 519. 3985 2113 LIGHT INDUSTRY GENERAL ksf 23.5 438. 362. 3985 2114 WAREHOUSING ksf 21.0 128. 107. 3985 4112 RIGHT-OF-WAY acre 12.2 0. 0. 3985 4114 PARKING acre 0.6 0. 0. 3985 5137 ARTERIAL COMMERCIAL ksf 20.0 1101. 800. 3985 6112 RELIGIOUS FACILITY ksf 11.0 72. 55. 3985 6816 ELEMENTARY SCHOOL other 78.0 265. 148. 3985 TOTAL 3570. 2568.
3988 112 SINGLE FAMILY du 303.0 3909. 2728. 3988 121 MULTI-FAMILY du 7.0 80. 56. 3988 4112 RIGHT-OF-WAY acre 19.3 0. 0. 3988 6815 JUNIOR HIGH OR MIDDLE SCHOOL other 1127.0 2592. 1592. 3988 TOTAL 6581. 4377.
30jan14/13:36:48/tgm.pr�203RC11C - Proposed Land Use\Reasonably Expected Network with SR-94 Alt 1\with C trip generation and land use by zone page 9
---------------------- Land Use ---------------------- -----Trips----- Zone Code Name Type Amount Person Vehicle
3989 112 SINGLE FAMILY du 36.0 464. 324. 3989 121 MULTI-FAMILY du 22.0 251. 176. 3989 122 MULTI-FAMILY du 114.0 980. 688. 3989 2113 LIGHT INDUSTRY GENERAL ksf 41.0 762. 630. 3989 4112 RIGHT-OF-WAY acre 14.4 0. 0. 3989 5137 ARTERIAL COMMERCIAL ksf 31.0 1706. 1239. 3989 6112 RELIGIOUS FACILITY ksf 68.8 447. 344. 3989 TOTAL 4611. 3401.
3990 112 SINGLE FAMILY du 109.0 1406. 981. 3990 121 MULTI-FAMILY du 78.0 889. 624. 3990 122 MULTI-FAMILY du 47.0 404. 284. 3990 4112 RIGHT-OF-WAY acre 11.4 0. 0.
Page 8
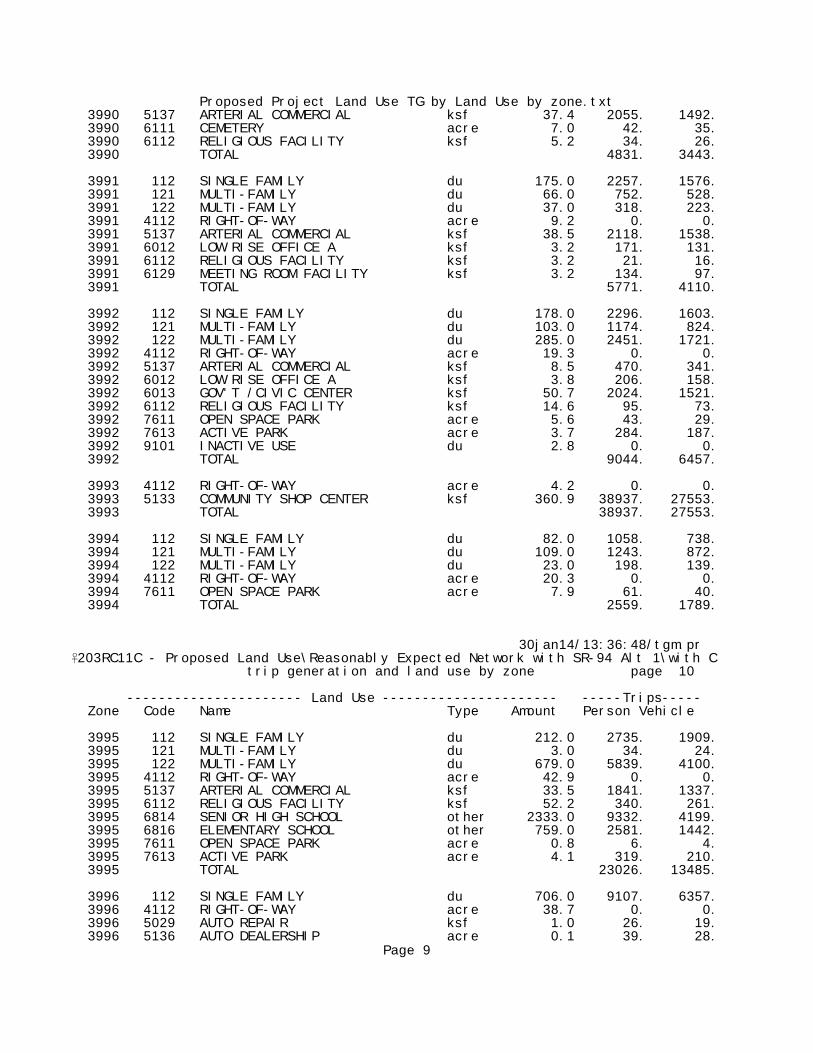
Proposed Project Land Use TG by Land Use by zone.txt 3990 5137 ARTERIAL COMMERCIAL ksf 37.4 2055. 1492. 3990 6111 CEMETERY acre 7.0 42. 35. 3990 6112 RELIGIOUS FACILITY ksf 5.2 34. 26. 3990 TOTAL 4831. 3443.
3991 112 SINGLE FAMILY du 175.0 2257. 1576. 3991 121 MULTI-FAMILY du 66.0 752. 528. 3991 122 MULTI-FAMILY du 37.0 318. 223. 3991 4112 RIGHT-OF-WAY acre 9.2 0. 0. 3991 5137 ARTERIAL COMMERCIAL ksf 38.5 2118. 1538. 3991 6012 LOW RISE OFFICE A ksf 3.2 171. 131. 3991 6112 RELIGIOUS FACILITY ksf 3.2 21. 16. 3991 6129 MEETING ROOM FACILITY ksf 3.2 134. 97. 3991 TOTAL 5771. 4110.
3992 112 SINGLE FAMILY du 178.0 2296. 1603. 3992 121 MULTI-FAMILY du 103.0 1174. 824. 3992 122 MULTI-FAMILY du 285.0 2451. 1721. 3992 4112 RIGHT-OF-WAY acre 19.3 0. 0. 3992 5137 ARTERIAL COMMERCIAL ksf 8.5 470. 341. 3992 6012 LOW RISE OFFICE A ksf 3.8 206. 158. 3992 6013 GOV'T /CIVIC CENTER ksf 50.7 2024. 1521. 3992 6112 RELIGIOUS FACILITY ksf 14.6 95. 73. 3992 7611 OPEN SPACE PARK acre 5.6 43. 29. 3992 7613 ACTIVE PARK acre 3.7 284. 187. 3992 9101 INACTIVE USE du 2.8 0. 0. 3992 TOTAL 9044. 6457.
3993 4112 RIGHT-OF-WAY acre 4.2 0. 0. 3993 5133 COMMUNITY SHOP CENTER ksf 360.9 38937. 27553. 3993 TOTAL 38937. 27553.
3994 112 SINGLE FAMILY du 82.0 1058. 738. 3994 121 MULTI-FAMILY du 109.0 1243. 872. 3994 122 MULTI-FAMILY du 23.0 198. 139. 3994 4112 RIGHT-OF-WAY acre 20.3 0. 0. 3994 7611 OPEN SPACE PARK acre 7.9 61. 40. 3994 TOTAL 2559. 1789.
30jan14/13:36:48/tgm.pr�203RC11C - Proposed Land Use\Reasonably Expected Network with SR-94 Alt 1\with C trip generation and land use by zone page 10
---------------------- Land Use ---------------------- -----Trips----- Zone Code Name Type Amount Person Vehicle
3995 112 SINGLE FAMILY du 212.0 2735. 1909. 3995 121 MULTI-FAMILY du 3.0 34. 24. 3995 122 MULTI-FAMILY du 679.0 5839. 4100. 3995 4112 RIGHT-OF-WAY acre 42.9 0. 0. 3995 5137 ARTERIAL COMMERCIAL ksf 33.5 1841. 1337. 3995 6112 RELIGIOUS FACILITY ksf 52.2 340. 261. 3995 6814 SENIOR HIGH SCHOOL other 2333.0 9332. 4199. 3995 6816 ELEMENTARY SCHOOL other 759.0 2581. 1442. 3995 7611 OPEN SPACE PARK acre 0.8 6. 4. 3995 7613 ACTIVE PARK acre 4.1 319. 210. 3995 TOTAL 23026. 13485.
3996 112 SINGLE FAMILY du 706.0 9107. 6357. 3996 4112 RIGHT-OF-WAY acre 38.7 0. 0. 3996 5029 AUTO REPAIR ksf 1.0 26. 19. 3996 5136 AUTO DEALERSHIP acre 0.1 39. 28.
Page 9

Proposed Project Land Use TG by Land Use by zone.txt 3996 6112 RELIGIOUS FACILITY ksf 18.9 123. 94. 3996 7613 ACTIVE PARK acre 0.5 38. 25. 3996 TOTAL 9334. 6523.
3998 112 SINGLE FAMILY du 144.0 1858. 1297. 3998 121 MULTI-FAMILY du 111.0 1265. 888. 3998 122 MULTI-FAMILY du 168.0 1445. 1014. 3998 4112 RIGHT-OF-WAY acre 27.2 0. 0. 3998 5137 ARTERIAL COMMERCIAL ksf 6.7 370. 269. 3998 5139 OTHER RETAIL TRADE ksf 1.2 66. 48. 3998 6112 RELIGIOUS FACILITY ksf 19.3 125. 96. 3998 6114 POST OFFICE ksf 5.8 1680. 1168. 3998 TOTAL 6810. 4781.
3999 112 SINGLE FAMILY du 189.0 2438. 1702. 3999 121 MULTI-FAMILY du 160.0 1824. 1281. 3999 122 MULTI-FAMILY du 326.0 2804. 1968. 3999 4112 RIGHT-OF-WAY acre 24.7 0. 0. 3999 5137 ARTERIAL COMMERCIAL ksf 30.0 1650. 1199. 3999 6112 RELIGIOUS FACILITY ksf 33.6 219. 168. 3999 6519 OTHER HEALTH CARE ksf 26.0 1750. 1300. 3999 6816 ELEMENTARY SCHOOL other 384.0 1306. 730. 3999 7613 ACTIVE PARK acre 0.2 13. 8. 3999 9101 INACTIVE USE du 0.1 0. 0. 3999 TOTAL 12003. 8355.
4002 112 SINGLE FAMILY du 151.0 1948. 1360. 4002 121 MULTI-FAMILY du 150.0 1710. 1201. 4002 122 MULTI-FAMILY du 189.0 1625. 1141. 4002 4112 RIGHT-OF-WAY acre 23.0 0. 0. 4002 4114 PARKING acre 0.3 0. 0. 4002 5137 ARTERIAL COMMERCIAL ksf 20.0 1100. 799. 4002 6112 RELIGIOUS FACILITY ksf 50.6 329. 253. 4002 6113 LIBRARY ksf 3.3 244. 166. 4002 6815 JUNIOR HIGH OR MIDDLE SCHOOL other 1242.0 2857. 1755. 4002 6816 ELEMENTARY SCHOOL other 619.0 2105. 1176.
30jan14/13:36:48/tgm.pr�203RC11C - Proposed Land Use\Reasonably Expected Network with SR-94 Alt 1\with C trip generation and land use by zone page 11
---------------------- Land Use ---------------------- -----Trips----- Zone Code Name Type Amount Person Vehicle
4002 7613 ACTIVE PARK acre 18.0 1384. 911. 4002 9101 INACTIVE USE du 0.1 0. 0. 4002 TOTAL 13302. 8760.
4007 112 SINGLE FAMILY du 489.0 6308. 4403. 4007 121 MULTI-FAMILY du 10.0 114. 80. 4007 4112 RIGHT-OF-WAY acre 32.7 0. 0. 4007 6112 RELIGIOUS FACILITY ksf 29.3 191. 147. 4007 6816 ELEMENTARY SCHOOL other 589.0 2003. 1119. 4007 TOTAL 8615. 5749.
4008 112 SINGLE FAMILY du 57.0 735. 513. 4008 121 MULTI-FAMILY du 103.0 1174. 824. 4008 122 MULTI-FAMILY du 187.0 1608. 1129. 4008 1421 CORRECTIONAL FACILITY other 300.0 840. 609. 4008 4112 RIGHT-OF-WAY acre 12.2 0. 0. 4008 5133 COMMUNITY SHOP CENTER ksf 134.3 14495. 10257. 4008 5137 ARTERIAL COMMERCIAL ksf 32.1 1767. 1283. 4008 5138 SERVICE STATION other 8.0 1486. 1082.
Page 10

Proposed Project Land Use TG by Land Use by zone.txt 4008 6112 RELIGIOUS FACILITY ksf 24.1 156. 120. 4008 6119 OTHER PUBLIC SERVICE ksf 3.6 49. 36. 4008 6816 ELEMENTARY SCHOOL other 481.0 1635. 914. 4008 7613 ACTIVE PARK acre 0.2 12. 8. 4008 TOTAL 23958. 16775.
4009 112 SINGLE FAMILY du 226.0 2915. 2035. 4009 121 MULTI-FAMILY du 100.0 1140. 800. 4009 122 MULTI-FAMILY du 141.0 1213. 851. 4009 4112 RIGHT-OF-WAY acre 17.8 0. 0. 4009 5137 ARTERIAL COMMERCIAL ksf 13.7 755. 549. 4009 5139 OTHER RETAIL TRADE ksf 0.9 51. 37. 4009 6112 RELIGIOUS FACILITY ksf 18.4 120. 92. 4009 6115 FIRE OR POLICE STATION ksf 3.4 139. 103. 4009 9101 INACTIVE USE du 0.1 0. 0. 4009 TOTAL 6334. 4467.
4010 112 SINGLE FAMILY du 360.0 4644. 3242. 4010 121 MULTI-FAMILY du 23.0 262. 184. 4010 4112 RIGHT-OF-WAY acre 28.2 0. 0. 4010 6112 RELIGIOUS FACILITY ksf 8.5 55. 42. 4010 7613 ACTIVE PARK acre 34.6 2662. 1752. 4010 9101 INACTIVE USE du 0.1 0. 0. 4010 TOTAL 7623. 5220.
4013 112 SINGLE FAMILY du 178.0 2296. 1603. 4013 121 MULTI-FAMILY du 63.0 718. 504. 4013 122 MULTI-FAMILY du 40.0 344. 242. 4013 4112 RIGHT-OF-WAY acre 16.6 0. 0. 4013 5137 ARTERIAL COMMERCIAL ksf 4.0 222. 161. 4013 6112 RELIGIOUS FACILITY ksf 2.3 15. 11. 4013 TOTAL 3595. 2521.
30jan14/13:36:48/tgm.pr�203RC11C - Proposed Land Use\Reasonably Expected Network with SR-94 Alt 1\with C trip generation and land use by zone page 12
---------------------- Land Use ---------------------- -----Trips----- Zone Code Name Type Amount Person Vehicle
4018 112 SINGLE FAMILY du 613.0 7908. 5520. 4018 4112 RIGHT-OF-WAY acre 33.2 0. 0. 4018 6112 RELIGIOUS FACILITY ksf 5.0 32. 25. 4018 7611 OPEN SPACE PARK acre 8.6 66. 44. 4018 7613 ACTIVE PARK acre 0.2 11. 7. 4018 TOTAL 8018. 5596.
4024 112 SINGLE FAMILY du 368.0 4747. 3314. 4024 121 MULTI-FAMILY du 58.0 661. 464. 4024 122 MULTI-FAMILY du 1319.0 11343. 7964. 4024 4112 RIGHT-OF-WAY acre 50.2 0. 0. 4024 5134 NEIGHBORHOOD SHOP CENTER ksf 33.2 5629. 3984. 4024 5137 ARTERIAL COMMERCIAL ksf 75.2 4136. 3004. 4024 6112 RELIGIOUS FACILITY ksf 6.0 39. 30. 4024 6810 DAY CARE CENTER other 70.0 427. 352. 4024 6816 ELEMENTARY SCHOOL other 549.0 1867. 1043. 4024 TOTAL 28849. 20155.
4027 112 SINGLE FAMILY du 54.0 697. 486. 4027 121 MULTI-FAMILY du 127.0 1448. 1016. 4027 122 MULTI-FAMILY du 29.0 249. 175. 4027 2111 INDUSTRIAL PARK ksf 113.5 2077. 1726.
Page 11
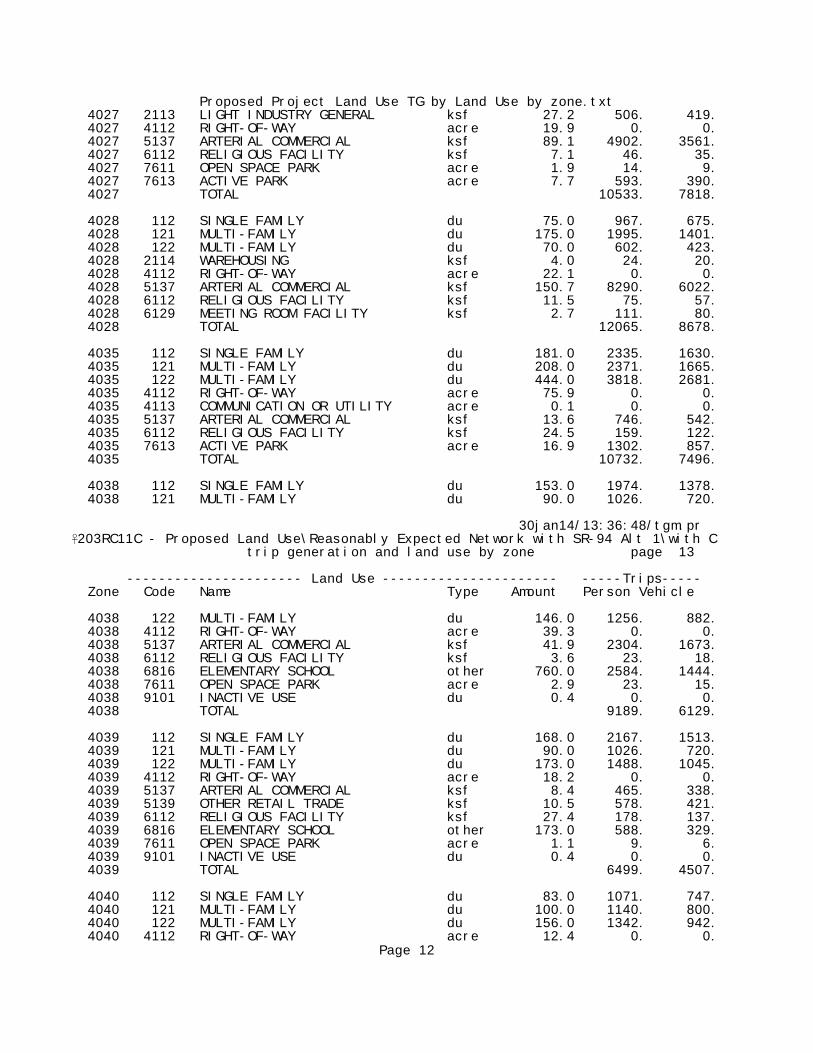
Proposed Project Land Use TG by Land Use by zone.txt 4027 2113 LIGHT INDUSTRY GENERAL ksf 27.2 506. 419. 4027 4112 RIGHT-OF-WAY acre 19.9 0. 0. 4027 5137 ARTERIAL COMMERCIAL ksf 89.1 4902. 3561. 4027 6112 RELIGIOUS FACILITY ksf 7.1 46. 35. 4027 7611 OPEN SPACE PARK acre 1.9 14. 9. 4027 7613 ACTIVE PARK acre 7.7 593. 390. 4027 TOTAL 10533. 7818.
4028 112 SINGLE FAMILY du 75.0 967. 675. 4028 121 MULTI-FAMILY du 175.0 1995. 1401. 4028 122 MULTI-FAMILY du 70.0 602. 423. 4028 2114 WAREHOUSING ksf 4.0 24. 20. 4028 4112 RIGHT-OF-WAY acre 22.1 0. 0. 4028 5137 ARTERIAL COMMERCIAL ksf 150.7 8290. 6022. 4028 6112 RELIGIOUS FACILITY ksf 11.5 75. 57. 4028 6129 MEETING ROOM FACILITY ksf 2.7 111. 80. 4028 TOTAL 12065. 8678.
4035 112 SINGLE FAMILY du 181.0 2335. 1630. 4035 121 MULTI-FAMILY du 208.0 2371. 1665. 4035 122 MULTI-FAMILY du 444.0 3818. 2681. 4035 4112 RIGHT-OF-WAY acre 75.9 0. 0. 4035 4113 COMMUNICATION OR UTILITY acre 0.1 0. 0. 4035 5137 ARTERIAL COMMERCIAL ksf 13.6 746. 542. 4035 6112 RELIGIOUS FACILITY ksf 24.5 159. 122. 4035 7613 ACTIVE PARK acre 16.9 1302. 857. 4035 TOTAL 10732. 7496.
4038 112 SINGLE FAMILY du 153.0 1974. 1378. 4038 121 MULTI-FAMILY du 90.0 1026. 720.
30jan14/13:36:48/tgm.pr�203RC11C - Proposed Land Use\Reasonably Expected Network with SR-94 Alt 1\with C trip generation and land use by zone page 13
---------------------- Land Use ---------------------- -----Trips----- Zone Code Name Type Amount Person Vehicle
4038 122 MULTI-FAMILY du 146.0 1256. 882. 4038 4112 RIGHT-OF-WAY acre 39.3 0. 0. 4038 5137 ARTERIAL COMMERCIAL ksf 41.9 2304. 1673. 4038 6112 RELIGIOUS FACILITY ksf 3.6 23. 18. 4038 6816 ELEMENTARY SCHOOL other 760.0 2584. 1444. 4038 7611 OPEN SPACE PARK acre 2.9 23. 15. 4038 9101 INACTIVE USE du 0.4 0. 0. 4038 TOTAL 9189. 6129.
4039 112 SINGLE FAMILY du 168.0 2167. 1513. 4039 121 MULTI-FAMILY du 90.0 1026. 720. 4039 122 MULTI-FAMILY du 173.0 1488. 1045. 4039 4112 RIGHT-OF-WAY acre 18.2 0. 0. 4039 5137 ARTERIAL COMMERCIAL ksf 8.4 465. 338. 4039 5139 OTHER RETAIL TRADE ksf 10.5 578. 421. 4039 6112 RELIGIOUS FACILITY ksf 27.4 178. 137. 4039 6816 ELEMENTARY SCHOOL other 173.0 588. 329. 4039 7611 OPEN SPACE PARK acre 1.1 9. 6. 4039 9101 INACTIVE USE du 0.4 0. 0. 4039 TOTAL 6499. 4507.
4040 112 SINGLE FAMILY du 83.0 1071. 747. 4040 121 MULTI-FAMILY du 100.0 1140. 800. 4040 122 MULTI-FAMILY du 156.0 1342. 942. 4040 4112 RIGHT-OF-WAY acre 12.4 0. 0.
Page 12

Proposed Project Land Use TG by Land Use by zone.txt 4040 5137 ARTERIAL COMMERCIAL ksf 69.1 3801. 2760. 4040 6012 LOW RISE OFFICE A ksf 3.9 210. 161. 4040 6022 LOW RISE OFFICE B ksf 5.4 239. 184. 4040 6112 RELIGIOUS FACILITY ksf 50.6 329. 253. 4040 7613 ACTIVE PARK acre 17.5 1348. 887. 4040 9101 INACTIVE USE acre 0.0 0. 0. 4040 TOTAL 9478. 6735.
4044 4112 RIGHT-OF-WAY acre 0.1 0. 0. 4044 TOTAL 0. 0.
4047 112 SINGLE FAMILY du 458.0 5908. 4124. 4047 4112 RIGHT-OF-WAY acre 23.2 0. 0. 4047 4113 COMMUNICATION OR UTILITY acre 3.8 12. 9. 4047 7611 OPEN SPACE PARK acre 0.8 6. 4. 4047 TOTAL 5927. 4138.
4050 121 MULTI-FAMILY du 187.0 2132. 1497. 4050 4112 RIGHT-OF-WAY acre 0.4 0. 0. 4050 5133 COMMUNITY SHOP CENTER ksf 176.7 19062. 13489. 4050 TOTAL 21194. 14986.
4057 112 SINGLE FAMILY du 147.0 1896. 1324. 4057 121 MULTI-FAMILY du 131.0 1493. 1048. 4057 122 MULTI-FAMILY du 133.0 1144. 803. 4057 4112 RIGHT-OF-WAY acre 21.6 0. 0. 4057 5137 ARTERIAL COMMERCIAL ksf 2.8 151. 110.
30jan14/13:36:48/tgm.pr�203RC11C - Proposed Land Use\Reasonably Expected Network with SR-94 Alt 1\with C trip generation and land use by zone page 14
---------------------- Land Use ---------------------- -----Trips----- Zone Code Name Type Amount Person Vehicle
4057 6112 RELIGIOUS FACILITY ksf 5.3 35. 27. 4057 7611 OPEN SPACE PARK acre 7.2 56. 37. 4057 9101 INACTIVE USE du 2.9 0. 0. 4057 TOTAL 4775. 3348.
4058 112 SINGLE FAMILY du 135.0 1741. 1216. 4058 121 MULTI-FAMILY du 120.0 1368. 960. 4058 122 MULTI-FAMILY du 174.0 1496. 1051. 4058 4112 RIGHT-OF-WAY acre 19.4 0. 0. 4058 5137 ARTERIAL COMMERCIAL ksf 16.6 913. 663. 4058 6112 RELIGIOUS FACILITY ksf 9.1 59. 45. 4058 6119 OTHER PUBLIC SERVICE ksf 2.7 37. 26. 4058 6816 ELEMENTARY SCHOOL other 543.0 1846. 1032. 4058 7611 OPEN SPACE PARK acre 0.5 4. 3. 4058 7613 ACTIVE PARK acre 0.2 12. 8. 4058 TOTAL 7477. 5004.
4061 112 SINGLE FAMILY du 19.0 245. 171. 4061 121 MULTI-FAMILY du 12.0 137. 96. 4061 122 MULTI-FAMILY du 422.0 3629. 2548. 4061 4112 RIGHT-OF-WAY acre 16.0 0. 0. 4061 5137 ARTERIAL COMMERCIAL ksf 1.8 98. 71. 4061 TOTAL 4109. 2886.
4079 112 SINGLE FAMILY du 150.0 1935. 1351. 4079 121 MULTI-FAMILY du 147.0 1676. 1177. 4079 122 MULTI-FAMILY du 110.0 946. 664. 4079 1511 MOTEL room 64.0 934. 575.
Page 13

Proposed Project Land Use TG by Land Use by zone.txt 4079 4112 RIGHT-OF-WAY acre 28.9 0. 0. 4079 5027 SERVICE STATION CAR WASH other 8.0 1706. 1239. 4079 5137 ARTERIAL COMMERCIAL ksf 13.3 732. 532. 4079 6112 RELIGIOUS FACILITY ksf 4.2 27. 21. 4079 6816 ELEMENTARY SCHOOL other 707.0 2404. 1343. 4079 9101 INACTIVE USE du 0.7 0. 0. 4079 TOTAL 10360. 6901.
4080 112 SINGLE FAMILY du 168.0 2167. 1513. 4080 121 MULTI-FAMILY du 178.0 2029. 1425. 4080 122 MULTI-FAMILY du 137.0 1178. 827. 4080 4112 RIGHT-OF-WAY acre 22.5 0. 0. 4080 5137 ARTERIAL COMMERCIAL ksf 3.7 205. 149. 4080 6112 RELIGIOUS FACILITY ksf 15.3 100. 77. 4080 7611 OPEN SPACE PARK acre 0.8 6. 4. 4080 9101 INACTIVE USE du 2.2 0. 0. 4080 TOTAL 5685. 3994.
4683 121 MULTI-FAMILY du 4.0 46. 32. 4683 122 MULTI-FAMILY du 1444.0 12418. 8718. 4683 4112 RIGHT-OF-WAY acre 13.4 0. 0. 4683 4113 COMMUNICATION OR UTILITY acre 0.8 3. 2. 4683 5133 COMMUNITY SHOP CENTER ksf 145.4 15693. 11105. 4683 5137 ARTERIAL COMMERCIAL ksf 103.2 5676. 4123.
30jan14/13:36:48/tgm.pr�203RC11C - Proposed Land Use\Reasonably Expected Network with SR-94 Alt 1\with C trip generation and land use by zone page 15
---------------------- Land Use ---------------------- -----Trips----- Zone Code Name Type Amount Person Vehicle
4683 6129 MEETING ROOM FACILITY ksf 5.4 226. 163. 4683 6511 CLINIC ksf 27.6 1861. 1382. 4683 7611 OPEN SPACE PARK acre 2.0 15. 10. 4683 TOTAL 35938. 25535.
4684 122 MULTI-FAMILY du 368.0 3165. 2222. 4684 4112 RIGHT-OF-WAY acre 1.4 0. 0. 4684 5133 COMMUNITY SHOP CENTER ksf 145.8 15735. 11135. 4684 TOTAL 18900. 13357.
4685 112 SINGLE FAMILY du 99.0 1277. 891. 4685 121 MULTI-FAMILY du 17.0 194. 136. 4685 122 MULTI-FAMILY du 59.0 507. 356. 4685 2113 LIGHT INDUSTRY GENERAL ksf 87.3 1623. 1342. 4685 4112 RIGHT-OF-WAY acre 8.8 0. 0. 4685 6112 RELIGIOUS FACILITY ksf 5.2 34. 26. 4685 TOTAL 3635. 2752.
4686 112 SINGLE FAMILY du 74.0 955. 666. 4686 122 MULTI-FAMILY du 83.0 714. 501. 4686 2113 LIGHT INDUSTRY GENERAL ksf 0.5 9. 8. 4686 4112 RIGHT-OF-WAY acre 5.2 0. 0. 4686 5137 ARTERIAL COMMERCIAL ksf 12.7 696. 506. 4686 TOTAL 2374. 1681.
4687 112 SINGLE FAMILY du 4.0 52. 36. 4687 121 MULTI-FAMILY du 21.0 239. 168. 4687 122 MULTI-FAMILY du 4.0 34. 24. 4687 2113 LIGHT INDUSTRY GENERAL ksf 61.2 1139. 941. 4687 4112 RIGHT-OF-WAY acre 2.7 0. 0. 4687 5137 ARTERIAL COMMERCIAL ksf 6.2 343. 249.
Page 14
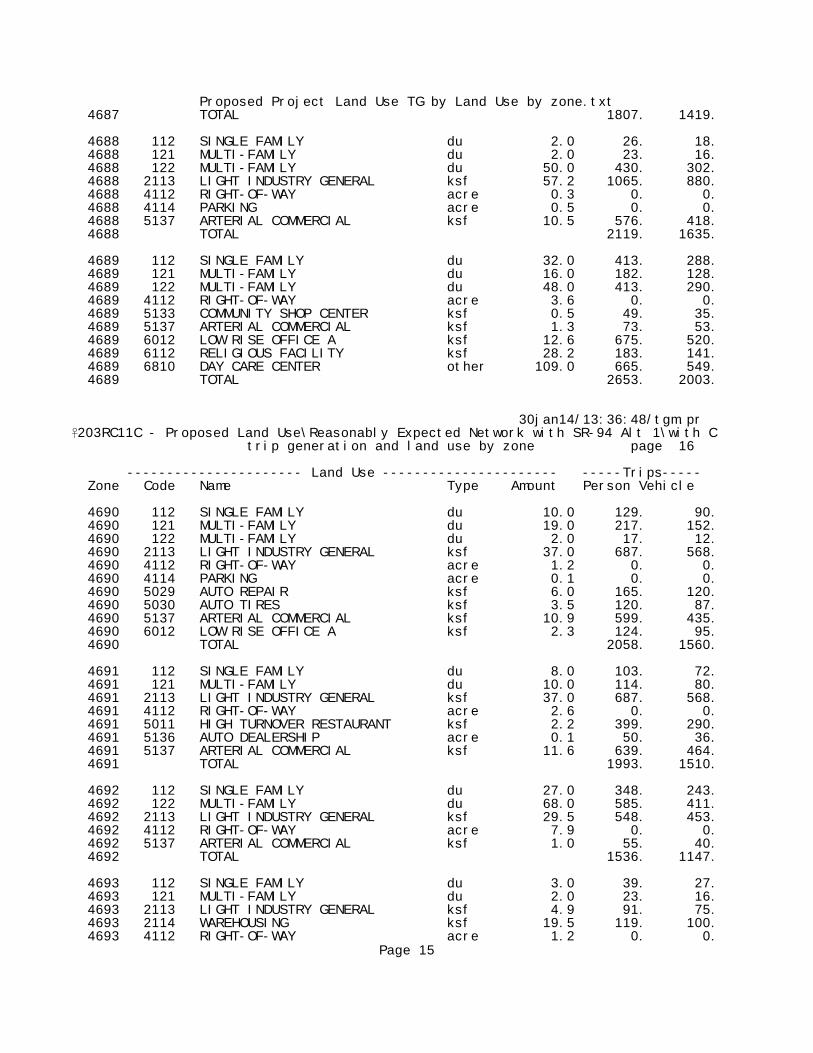
Proposed Project Land Use TG by Land Use by zone.txt 4687 TOTAL 1807. 1419.
4688 112 SINGLE FAMILY du 2.0 26. 18. 4688 121 MULTI-FAMILY du 2.0 23. 16. 4688 122 MULTI-FAMILY du 50.0 430. 302. 4688 2113 LIGHT INDUSTRY GENERAL ksf 57.2 1065. 880. 4688 4112 RIGHT-OF-WAY acre 0.3 0. 0. 4688 4114 PARKING acre 0.5 0. 0. 4688 5137 ARTERIAL COMMERCIAL ksf 10.5 576. 418. 4688 TOTAL 2119. 1635.
4689 112 SINGLE FAMILY du 32.0 413. 288. 4689 121 MULTI-FAMILY du 16.0 182. 128. 4689 122 MULTI-FAMILY du 48.0 413. 290. 4689 4112 RIGHT-OF-WAY acre 3.6 0. 0. 4689 5133 COMMUNITY SHOP CENTER ksf 0.5 49. 35. 4689 5137 ARTERIAL COMMERCIAL ksf 1.3 73. 53. 4689 6012 LOW RISE OFFICE A ksf 12.6 675. 520. 4689 6112 RELIGIOUS FACILITY ksf 28.2 183. 141. 4689 6810 DAY CARE CENTER other 109.0 665. 549. 4689 TOTAL 2653. 2003.
30jan14/13:36:48/tgm.pr�203RC11C - Proposed Land Use\Reasonably Expected Network with SR-94 Alt 1\with C trip generation and land use by zone page 16
---------------------- Land Use ---------------------- -----Trips----- Zone Code Name Type Amount Person Vehicle
4690 112 SINGLE FAMILY du 10.0 129. 90. 4690 121 MULTI-FAMILY du 19.0 217. 152. 4690 122 MULTI-FAMILY du 2.0 17. 12. 4690 2113 LIGHT INDUSTRY GENERAL ksf 37.0 687. 568. 4690 4112 RIGHT-OF-WAY acre 1.2 0. 0. 4690 4114 PARKING acre 0.1 0. 0. 4690 5029 AUTO REPAIR ksf 6.0 165. 120. 4690 5030 AUTO TIRES ksf 3.5 120. 87. 4690 5137 ARTERIAL COMMERCIAL ksf 10.9 599. 435. 4690 6012 LOW RISE OFFICE A ksf 2.3 124. 95. 4690 TOTAL 2058. 1560.
4691 112 SINGLE FAMILY du 8.0 103. 72. 4691 121 MULTI-FAMILY du 10.0 114. 80. 4691 2113 LIGHT INDUSTRY GENERAL ksf 37.0 687. 568. 4691 4112 RIGHT-OF-WAY acre 2.6 0. 0. 4691 5011 HIGH TURNOVER RESTAURANT ksf 2.2 399. 290. 4691 5136 AUTO DEALERSHIP acre 0.1 50. 36. 4691 5137 ARTERIAL COMMERCIAL ksf 11.6 639. 464. 4691 TOTAL 1993. 1510.
4692 112 SINGLE FAMILY du 27.0 348. 243. 4692 122 MULTI-FAMILY du 68.0 585. 411. 4692 2113 LIGHT INDUSTRY GENERAL ksf 29.5 548. 453. 4692 4112 RIGHT-OF-WAY acre 7.9 0. 0. 4692 5137 ARTERIAL COMMERCIAL ksf 1.0 55. 40. 4692 TOTAL 1536. 1147.
4693 112 SINGLE FAMILY du 3.0 39. 27. 4693 121 MULTI-FAMILY du 2.0 23. 16. 4693 2113 LIGHT INDUSTRY GENERAL ksf 4.9 91. 75. 4693 2114 WAREHOUSING ksf 19.5 119. 100. 4693 4112 RIGHT-OF-WAY acre 1.2 0. 0.
Page 15

Proposed Project Land Use TG by Land Use by zone.txt 4693 5029 AUTO REPAIR ksf 1.6 45. 33. 4693 5137 ARTERIAL COMMERCIAL ksf 28.7 1576. 1145. 4693 6012 LOW RISE OFFICE A ksf 2.0 107. 82. 4693 6022 LOW RISE OFFICE B ksf 6.5 288. 222. 4693 TOTAL 2288. 1700.
4694 112 SINGLE FAMILY du 8.0 103. 72. 4694 121 MULTI-FAMILY du 2.0 23. 16. 4694 122 MULTI-FAMILY du 21.0 181. 127. 4694 2113 LIGHT INDUSTRY GENERAL ksf 48.9 909. 751. 4694 4112 RIGHT-OF-WAY acre 1.5 0. 0. 4694 4114 PARKING acre 0.8 0. 0. 4694 5011 HIGH TURNOVER RESTAURANT ksf 1.8 315. 229. 4694 5028 AUTO PARTS ksf 5.7 490. 356. 4694 5134 NEIGHBORHOOD SHOP CENTER ksf 30.0 5085. 3599. 4694 5137 ARTERIAL COMMERCIAL ksf 7.6 419. 305. 4694 TOTAL 7524. 5454.
4695 112 SINGLE FAMILY du 27.0 348. 243.
30jan14/13:36:48/tgm.pr�203RC11C - Proposed Land Use\Reasonably Expected Network with SR-94 Alt 1\with C trip generation and land use by zone page 17
---------------------- Land Use ---------------------- -----Trips----- Zone Code Name Type Amount Person Vehicle
4695 121 MULTI-FAMILY du 17.0 194. 136. 4695 122 MULTI-FAMILY du 165.0 1419. 996. 4695 4112 RIGHT-OF-WAY acre 4.9 0. 0. 4695 5137 ARTERIAL COMMERCIAL ksf 19.4 1067. 775. 4695 TOTAL 3028. 2150.
4696 112 SINGLE FAMILY du 113.0 1458. 1017. 4696 121 MULTI-FAMILY du 6.0 68. 48. 4696 122 MULTI-FAMILY du 131.0 1127. 791. 4696 4112 RIGHT-OF-WAY acre 8.7 0. 0. 4696 5029 AUTO REPAIR ksf 1.8 48. 35. 4696 5030 AUTO TIRES ksf 2.5 86. 62. 4696 5137 ARTERIAL COMMERCIAL ksf 7.6 415. 301. 4696 TOTAL 3202. 2256.
4697 112 SINGLE FAMILY du 38.0 490. 342. 4697 121 MULTI-FAMILY du 21.0 239. 168. 4697 122 MULTI-FAMILY du 61.0 525. 368. 4697 4112 RIGHT-OF-WAY acre 3.1 0. 0. 4697 5025 SERVICE STATION FOOD MART other 12.0 2476. 1798. 4697 5137 ARTERIAL COMMERCIAL ksf 10.9 597. 434. 4697 6112 RELIGIOUS FACILITY ksf 5.5 36. 28. 4697 TOTAL 4363. 3138.
4698 112 SINGLE FAMILY du 50.0 645. 450. 4698 121 MULTI-FAMILY du 9.0 103. 72. 4698 122 MULTI-FAMILY du 55.0 473. 332. 4698 4112 RIGHT-OF-WAY acre 4.3 0. 0. 4698 4114 PARKING acre 0.2 0. 0. 4698 5014 CONVENIENCE MARKET CHAIN ksf 17.5 12036. 8742. 4698 5137 ARTERIAL COMMERCIAL ksf 21.7 1195. 868. 4698 6112 RELIGIOUS FACILITY ksf 0.6 4. 3. 4698 TOTAL 14456. 10468.
4699 112 SINGLE FAMILY du 55.0 709. 495. 4699 121 MULTI-FAMILY du 11.0 125. 88.
Page 16

Proposed Project Land Use TG by Land Use by zone.txt 4699 122 MULTI-FAMILY du 28.0 241. 169. 4699 4112 RIGHT-OF-WAY acre 4.7 0. 0. 4699 5137 ARTERIAL COMMERCIAL ksf 18.1 995. 723. 4699 6112 RELIGIOUS FACILITY ksf 11.8 77. 59. 4699 TOTAL 2148. 1535.
4700 112 SINGLE FAMILY du 17.0 219. 153. 4700 121 MULTI-FAMILY du 4.0 46. 32. 4700 122 MULTI-FAMILY du 94.0 808. 568. 4700 2113 LIGHT INDUSTRY GENERAL ksf 11.8 219. 181. 4700 4112 RIGHT-OF-WAY acre 1.8 0. 0. 4700 4114 PARKING acre 0.1 0. 0. 4700 5011 HIGH TURNOVER RESTAURANT ksf 1.4 244. 177. 4700 5014 CONVENIENCE MARKET CHAIN ksf 14.0 9629. 6994. 4700 5029 AUTO REPAIR ksf 4.5 123. 89. 4700 5030 AUTO TIRES ksf 1.6 54. 39.
30jan14/13:36:48/tgm.pr�203RC11C - Proposed Land Use\Reasonably Expected Network with SR-94 Alt 1\with C trip generation and land use by zone page 18
---------------------- Land Use ---------------------- -----Trips----- Zone Code Name Type Amount Person Vehicle
4700 5137 ARTERIAL COMMERCIAL ksf 42.5 2340. 1699. 4700 6013 GOV'T /CIVIC CENTER ksf 1.7 68. 51. 4700 6112 RELIGIOUS FACILITY ksf 4.5 29. 22. 4700 6115 FIRE OR POLICE STATION ksf 14.6 596. 439. 4700 TOTAL 14375. 10446.
4701 112 SINGLE FAMILY du 5.0 64. 45. 4701 121 MULTI-FAMILY du 6.0 68. 48. 4701 122 MULTI-FAMILY du 55.0 473. 332. 4701 2113 LIGHT INDUSTRY GENERAL ksf 14.5 270. 223. 4701 4112 RIGHT-OF-WAY acre 1.1 0. 0. 4701 5029 AUTO REPAIR ksf 5.9 161. 117. 4701 5137 ARTERIAL COMMERCIAL ksf 34.2 1883. 1368. 4701 6112 RELIGIOUS FACILITY ksf 1.8 12. 9. 4701 TOTAL 2932. 2142.
4702 112 SINGLE FAMILY du 21.0 271. 189. 4702 122 MULTI-FAMILY du 18.0 155. 109. 4702 2113 LIGHT INDUSTRY GENERAL ksf 13.8 256. 212. 4702 4112 RIGHT-OF-WAY acre 2.0 0. 0. 4702 5014 CONVENIENCE MARKET CHAIN ksf 5.8 3989. 2897. 4702 5137 ARTERIAL COMMERCIAL ksf 8.2 452. 329. 4702 6129 MEETING ROOM FACILITY ksf 4.0 166. 120. 4702 TOTAL 5290. 3856.
4703 111 SINGLE FAMILY du 1.0 13. 9. 4703 112 SINGLE FAMILY du 220.0 2838. 1981. 4703 4112 RIGHT-OF-WAY acre 19.0 0. 0. 4703 6113 LIBRARY ksf 27.6 2029. 1375. 4703 6819 OTHER SCHOOL ksf 14.5 316. 261. 4703 7611 OPEN SPACE PARK acre 32.6 251. 165. 4703 TOTAL 5447. 3791.
4704 4112 RIGHT-OF-WAY acre 1.4 0. 0. 4704 6113 LIBRARY ksf 20.0 1472. 998. 4704 6812 UNIVERSITY OR COLLEGE other 7667.0 15334. 12465. 4704 TOTAL 16806. 13463.
4705 112 SINGLE FAMILY du 257.0 3315. 2314.Page 17

Proposed Project Land Use TG by Land Use by zone.txt 4705 4112 RIGHT-OF-WAY acre 17.6 0. 0. 4705 7611 OPEN SPACE PARK acre 25.4 195. 128. 4705 TOTAL 3510. 2442.
4706 112 SINGLE FAMILY du 327.0 4218. 2944. 4706 1411 CONGREGATE CARE FACILITY other 12.0 52. 36. 4706 4112 RIGHT-OF-WAY acre 18.6 0. 0. 4706 TOTAL 4270. 2981.
4707 112 SINGLE FAMILY du 170.0 2193. 1531. 4707 4112 RIGHT-OF-WAY acre 9.0 0. 0. 4707 4113 COMMUNICATION OR UTILITY acre 0.6 2. 1. 4707 7611 OPEN SPACE PARK acre 0.8 6. 4.
30jan14/13:36:48/tgm.pr�203RC11C - Proposed Land Use\Reasonably Expected Network with SR-94 Alt 1\with C trip generation and land use by zone page 19
---------------------- Land Use ---------------------- -----Trips----- Zone Code Name Type Amount Person Vehicle
4707 7613 ACTIVE PARK acre 3.0 234. 154. 4707 TOTAL 2434. 1690.
4708 112 SINGLE FAMILY du 394.0 5083. 3548. 4708 121 MULTI-FAMILY du 17.0 194. 136. 4708 4112 RIGHT-OF-WAY acre 31.6 0. 0. 4708 7611 OPEN SPACE PARK acre 0.2 2. 1. 4708 TOTAL 5278. 3685.
4709 112 SINGLE FAMILY du 213.0 2748. 1918. 4709 121 MULTI-FAMILY du 186.0 2120. 1489. 4709 122 MULTI-FAMILY du 136.0 1170. 821. 4709 4112 RIGHT-OF-WAY acre 20.2 0. 0. 4709 5137 ARTERIAL COMMERCIAL ksf 2.2 119. 86. 4709 6112 RELIGIOUS FACILITY ksf 17.0 110. 85. 4709 6519 OTHER HEALTH CARE ksf 3.8 253. 188. 4709 6816 ELEMENTARY SCHOOL other 483.0 1642. 918. 4709 7613 ACTIVE PARK acre 6.6 510. 335. 4709 TOTAL 8672. 5840.
4710 112 SINGLE FAMILY du 25.0 322. 225. 4710 121 MULTI-FAMILY du 23.0 262. 184. 4710 122 MULTI-FAMILY du 171.0 1471. 1032. 4710 4112 RIGHT-OF-WAY acre 5.9 0. 0. 4710 5137 ARTERIAL COMMERCIAL ksf 10.1 557. 404. 4710 6119 OTHER PUBLIC SERVICE ksf 8.7 120. 87. 4710 7613 ACTIVE PARK acre 0.1 9. 6. 4710 TOTAL 2741. 1939.
4711 112 SINGLE FAMILY du 12.0 155. 108. 4711 121 MULTI-FAMILY du 10.0 114. 80. 4711 122 MULTI-FAMILY du 80.0 688. 483. 4711 2113 LIGHT INDUSTRY GENERAL ksf 8.0 149. 123. 4711 4112 RIGHT-OF-WAY acre 2.9 0. 0. 4711 6012 LOW RISE OFFICE A ksf 5.4 288. 222. 4711 TOTAL 1394. 1016.
4712 112 SINGLE FAMILY du 24.0 310. 216. 4712 121 MULTI-FAMILY du 15.0 171. 120. 4712 122 MULTI-FAMILY du 134.0 1152. 809. 4712 4112 RIGHT-OF-WAY acre 3.8 0. 0. 4712 6511 CLINIC ksf 3.0 201. 149.
Page 18

Proposed Project Land Use TG by Land Use by zone.txt 4712 TOTAL 1834. 1294.
4713 112 SINGLE FAMILY du 14.0 181. 126. 4713 121 MULTI-FAMILY du 2.0 23. 16. 4713 122 MULTI-FAMILY du 74.0 636. 447. 4713 4112 RIGHT-OF-WAY acre 1.3 0. 0. 4713 5137 ARTERIAL COMMERCIAL ksf 18.3 1006. 730. 4713 9101 INACTIVE USE acre 0.1 0. 0. 4713 TOTAL 1845. 1319.
30jan14/13:36:48/tgm.pr�203RC11C - Proposed Land Use\Reasonably Expected Network with SR-94 Alt 1\with C trip generation and land use by zone page 20
---------------------- Land Use ---------------------- -----Trips----- Zone Code Name Type Amount Person Vehicle
4714 112 SINGLE FAMILY du 3.0 39. 27. 4714 121 MULTI-FAMILY du 13.0 148. 104. 4714 122 MULTI-FAMILY du 88.0 757. 531. 4714 4112 RIGHT-OF-WAY acre 3.6 0. 0. 4714 5137 ARTERIAL COMMERCIAL ksf 32.1 1767. 1283. 4714 9101 INACTIVE USE acre 0.2 0. 0. 4714 TOTAL 2710. 1945.
4715 112 SINGLE FAMILY du 25.0 322. 225. 4715 121 MULTI-FAMILY du 17.0 194. 136. 4715 122 MULTI-FAMILY du 54.0 464. 326. 4715 4112 RIGHT-OF-WAY acre 4.1 0. 0. 4715 7611 OPEN SPACE PARK acre 0.0 0. 0. 4715 7613 ACTIVE PARK acre 2.7 204. 134. 4715 9101 INACTIVE USE du 0.1 0. 0. 4715 TOTAL 1185. 822.
4716 112 SINGLE FAMILY du 24.0 310. 216. 4716 122 MULTI-FAMILY du 88.0 757. 531. 4716 4112 RIGHT-OF-WAY acre 2.0 0. 0. 4716 5137 ARTERIAL COMMERCIAL ksf 20.5 1129. 820. 4716 TOTAL 2196. 1568.
4717 112 SINGLE FAMILY du 42.0 542. 378. 4717 121 MULTI-FAMILY du 34.0 388. 272. 4717 122 MULTI-FAMILY du 37.0 318. 223. 4717 4112 RIGHT-OF-WAY acre 2.5 0. 0. 4717 5137 ARTERIAL COMMERCIAL ksf 1.6 90. 65. 4717 TOTAL 1337. 939.
4718 112 SINGLE FAMILY du 49.0 632. 441. 4718 121 MULTI-FAMILY du 21.0 239. 168. 4718 122 MULTI-FAMILY du 134.0 1152. 809. 4718 4112 RIGHT-OF-WAY acre 8.1 0. 0. 4718 4113 COMMUNICATION OR UTILITY acre 0.5 1. 1. 4718 5131 WHOLESALE TRADE ksf 15.7 1553. 1101. 4718 5137 ARTERIAL COMMERCIAL ksf 61.5 3381. 2455. 4718 6819 OTHER SCHOOL ksf 36.1 787. 650. 4718 7613 ACTIVE PARK acre 0.2 18. 12. 4718 TOTAL 7764. 5637.
4719 112 SINGLE FAMILY du 49.0 632. 441. 4719 121 MULTI-FAMILY du 45.0 513. 360. 4719 122 MULTI-FAMILY du 31.0 267. 187. 4719 4112 RIGHT-OF-WAY acre 3.8 0. 0.
Page 19

Proposed Project Land Use TG by Land Use by zone.txt 4719 5137 ARTERIAL COMMERCIAL ksf 1.5 84. 61. 4719 9101 INACTIVE USE acre 0.1 0. 0. 4719 TOTAL 1496. 1050.
4720 112 SINGLE FAMILY du 22.0 284. 198. 4720 121 MULTI-FAMILY du 46.0 524. 368. 4720 122 MULTI-FAMILY du 4.0 34. 24.
30jan14/13:36:48/tgm.pr�203RC11C - Proposed Land Use\Reasonably Expected Network with SR-94 Alt 1\with C trip generation and land use by zone page 21
---------------------- Land Use ---------------------- -----Trips----- Zone Code Name Type Amount Person Vehicle
4720 1511 MOTEL room 27.0 394. 243. 4720 4112 RIGHT-OF-WAY acre 5.5 0. 0. 4720 5137 ARTERIAL COMMERCIAL ksf 37.2 2048. 1488. 4720 TOTAL 3285. 2321.
4721 112 SINGLE FAMILY du 23.0 297. 207. 4721 121 MULTI-FAMILY du 28.0 319. 224. 4721 122 MULTI-FAMILY du 13.0 112. 78. 4721 4112 RIGHT-OF-WAY acre 6.4 0. 0. 4721 5137 ARTERIAL COMMERCIAL ksf 20.8 1144. 831. 4721 6816 ELEMENTARY SCHOOL other 333.0 1132. 633. 4721 TOTAL 3004. 1973.
4722 112 SINGLE FAMILY du 89.0 1148. 801. 4722 121 MULTI-FAMILY du 73.0 832. 584. 4722 122 MULTI-FAMILY du 169.0 1453. 1020. 4722 2113 LIGHT INDUSTRY GENERAL ksf 8.4 156. 129. 4722 4112 RIGHT-OF-WAY acre 14.4 0. 0. 4722 5137 ARTERIAL COMMERCIAL ksf 42.9 2360. 1714. 4722 7611 OPEN SPACE PARK acre 2.6 20. 13. 4722 7613 ACTIVE PARK acre 0.2 17. 11. 4722 9101 INACTIVE USE du 1.8 0. 0. 4722 TOTAL 5987. 4274.
4723 112 SINGLE FAMILY du 11.0 142. 99. 4723 121 MULTI-FAMILY du 12.0 137. 96. 4723 122 MULTI-FAMILY du 308.0 2649. 1860. 4723 4112 RIGHT-OF-WAY acre 14.2 0. 0. 4723 5137 ARTERIAL COMMERCIAL ksf 43.6 2398. 1741. 4723 TOTAL 5325. 3796.
4724 112 SINGLE FAMILY du 38.0 490. 342. 4724 121 MULTI-FAMILY du 41.0 467. 328. 4724 122 MULTI-FAMILY du 156.0 1342. 942. 4724 4112 RIGHT-OF-WAY acre 4.1 0. 0. 4724 5137 ARTERIAL COMMERCIAL ksf 1.7 93. 68. 4724 TOTAL 2392. 1680.
4725 112 SINGLE FAMILY du 34.0 439. 306. 4725 121 MULTI-FAMILY du 26.0 296. 208. 4725 122 MULTI-FAMILY du 43.0 370. 260. 4725 4112 RIGHT-OF-WAY acre 5.7 0. 0. 4725 5137 ARTERIAL COMMERCIAL ksf 2.1 113. 82. 4725 6816 ELEMENTARY SCHOOL other 354.0 1204. 673. 4725 TOTAL 2422. 1529.
4726 112 SINGLE FAMILY du 190.0 2451. 1711. 4726 121 MULTI-FAMILY du 10.0 114. 80.
Page 20

Proposed Project Land Use TG by Land Use by zone.txt 4726 122 MULTI-FAMILY du 26.0 224. 157. 4726 4112 RIGHT-OF-WAY acre 16.7 0. 0. 4726 5025 SERVICE STATION FOOD MART other 8.0 1650. 1199. 4726 5137 ARTERIAL COMMERCIAL ksf 22.5 1239. 900.
30jan14/13:36:48/tgm.pr�203RC11C - Proposed Land Use\Reasonably Expected Network with SR-94 Alt 1\with C trip generation and land use by zone page 22
---------------------- Land Use ---------------------- -----Trips----- Zone Code Name Type Amount Person Vehicle
4726 7611 OPEN SPACE PARK acre 6.3 49. 32. 4726 TOTAL 5727. 4079.
4727 112 SINGLE FAMILY du 123.0 1587. 1108. 4727 4112 RIGHT-OF-WAY acre 13.3 0. 0. 4727 7611 OPEN SPACE PARK acre 8.6 67. 44. 4727 TOTAL 1653. 1151.
4728 112 SINGLE FAMILY du 222.0 2864. 1999. 4728 121 MULTI-FAMILY du 22.0 251. 176. 4728 122 MULTI-FAMILY du 12.0 103. 72. 4728 4112 RIGHT-OF-WAY acre 13.2 0. 0. 4728 6112 RELIGIOUS FACILITY ksf 7.7 50. 38. 4728 7611 OPEN SPACE PARK acre 5.8 45. 29. 4728 9101 INACTIVE USE du 0.4 0. 0. 4728 TOTAL 3312. 2315.
30jan14/13:36:48/tgm.pr
Page 21

APPENDIX C: MODEL VOLUMES


APPENDIX D: POST-PROCESSOR SPREADSHEETS

Fehr Peers Associates
Future Turning Movement Calculation SheetN/S Street Euclid Time Period AM
E/W Street SR-94 WB Date 2/13/2014Project Euclid Corridor Study
0 990 931 0Existing 52% 33760 48%
19210 435 555 0 0
435 100% 0 149 34% 2377930 435 0 2471 0 699 8940
0 0% 0 88 66% 4620 0 782 462 0
188734% 28950 66% Approach Departure
0 643 1244 0 0 00 0
Future 1162 990 99.9% 931 113551% 40400 49%
521 2299 3410 521 641 0 0
435 100% 0 206 31% 2379500 521 0 3178 0 1087 13900
0 0% 0 136 69% 4620 100.0% 0 929 745 100.0% 00 2451 745
32% 37600 68%777 643 100.0% 1244 1674 Approach Departure
0 0 0 0

Fehr Peers Associates
Future Turning Movement Calculation SheetN/S Street Euclid Time Period PM
E/W Street SR-94 WB Date 2/13/2014Project Euclid Corridor Study
0 1335 1210 0Existing 52% 33760 48%
25450 522 813 0 0
522 100% 0 155 51% 2587930 522 0 2895 0 505 8940
0 0% 0 103 49% 2470 0 1055 247 0
221841% 28950 59% Approach Departure
0 916 1302 0 0 00 0
Future 1651 1335 100.0% 1210 139454% 40400 46%
624 3046 3540 624 1028 0 0
522 100% 0 168 45% 2589500 625 0 3663 0 785 13900
0 0% 0 186 55% 2470 99.8% 0 1227 431 100.0% 00 2881 431
42% 37600 58%1214 916 99.7% 1302 1658 Approach Departure
0 0 0 0

Fehr Peers Associates
Future Turning Movement Calculation SheetN/S Street Euclid Time Period AM
E/W Street SR-94 EB Date 2/13/2014Project Euclid Corridor Study
0 643 1244 0Existing 34% 28950 66%
18870 0 535 108 00 0% 0 332 57% 332
6130 224 0 2253 0 582 14000224 100% 224 0 43% 250
0 0 912 142 01813
42% 27410 58% Approach Departure0 759 1054 0 0 0
0 0Future 703 643 91.5% 1244 1450
38% 36100 62%0 2353 3880 0 583 120 00 0% 0 388 54% 332
15300 559 0 2809 0 615 14800224 100% 495 0 46% 250
0 88.6% 0 1062 160 108.6% 0495 2262 280
48% 34200 52%1078 759 101.7% 1054 1222 Approach Departure
0 0 0 0
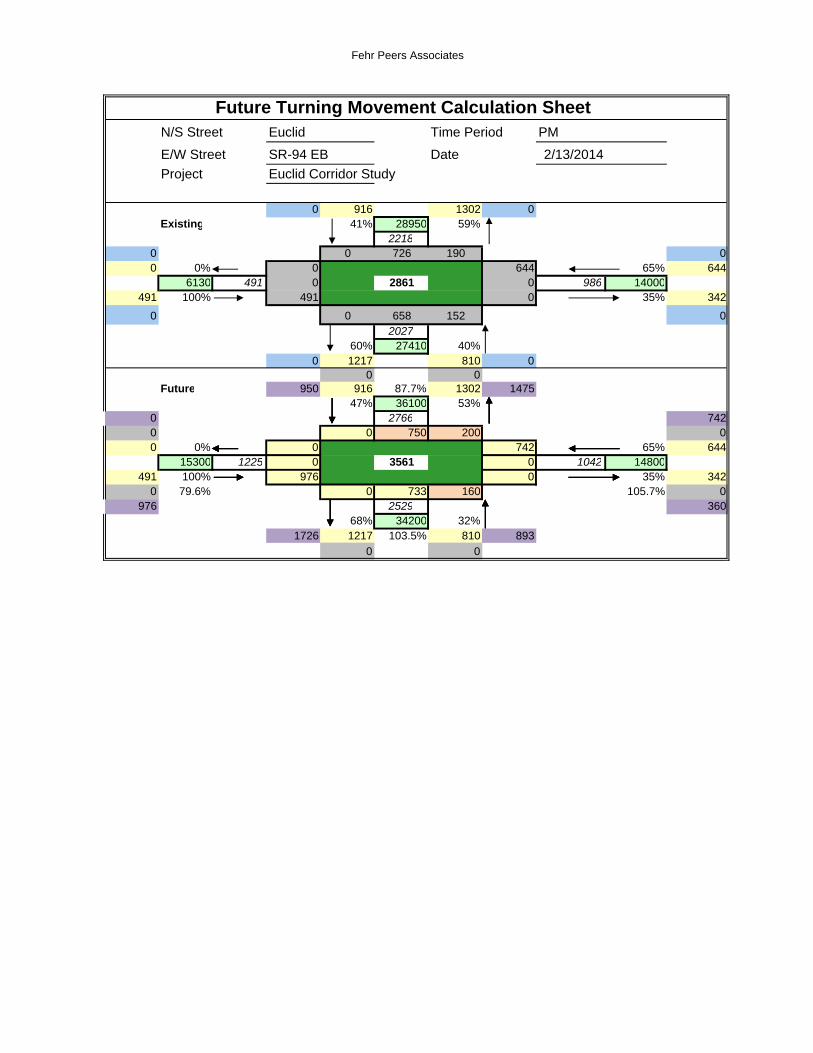
Fehr Peers Associates
Future Turning Movement Calculation SheetN/S Street Euclid Time Period PM
E/W Street SR-94 EB Date 2/13/2014Project Euclid Corridor Study
0 916 1302 0Existing 41% 28950 59%
22180 0 726 190 00 0% 0 644 65% 644
6130 491 0 2861 0 986 14000491 100% 491 0 35% 342
0 0 658 152 02027
60% 27410 40% Approach Departure0 1217 810 0 0 0
0 0Future 950 916 87.7% 1302 1475
47% 36100 53%0 2766 7420 0 750 200 00 0% 0 742 65% 644
15300 1225 0 3561 0 1042 14800491 100% 976 0 35% 342
0 79.6% 0 733 160 105.7% 0976 2529 360
68% 34200 32%1726 1217 103.5% 810 893 Approach Departure
0 0 0 0

Euclid & Hilltop (AM) Euclid & Hilltop (PM)
10% 83% 7% 968 10% 81% 9% 1869
97 803 68 187 1514 168
30% 37 29 30% 40% 48 43 40%
20% 25
19 20% 20% 24
22 20%
50% 62 49 50% 40% 48 43 40%
124116 998 46
97 120103 864 62
108
10% 86% 4% 1161 10% 84% 6% 1029
Future Turning Movement Calculation Sheet
Note: Approach percentage distribution for Euclid and Market were used to inform the percentage distribution of the new movements on Euclid and Hilltop in the future.

Fehr Peers Associates
Future Turning Movement Calculation SheetN/S Street Euclid Time Period AM
E/W Street Lise Date 2/13/2014Project Euclid Corridor Study
1 702 970 1Existing 42% 25485 58%
16721 88 614 0 1
166 64% 35 1 100% 33600 258 0 1808 1 3 1
92 36% 57 1 0% 01 77 934 0 1
168340% 26156 60% Approach Departure
1 672 1011 1 4 41 1
Future 838 702 99.3% 970 128540% 32600 60%
241 2139 31 152 686 0 1
166 66% 62 1 100% 35100 366 0 2275 1 3 1
92 34% 62 1 0% 01 100.0% 88 1222 0 100.0% 1
125 2059 036% 32000 64%
749 672 100.0% 1011 1310 Approach Departure1 1 4 4

Fehr Peers Associates
Future Turning Movement Calculation SheetN/S Street Euclid Time Period PME/W Street Lise Date 2/13/2014Project Euclid Corridor Study
1 1301 868 1Existing 60% 25485 40%
21691 114 1187 0 1
151 62% 34 1 100% 33600 243 0 2265 1 3 1
92 38% 58 1 0% 01 36 833 0 1
211559% 26156 41% Approach Departure
1 1246 869 1 4 41 1
Future 1542 1301 98.5% 868 119157% 32600 43%
224 2775 31 184 1357 0 1
151 65% 60 1 100% 35100 344 0 2834 1 3 1
92 35% 60 1 0% 01 100.0% 39 1130 0 98.0% 1
120 2588 055% 32000 45%
1419 1246 100.0% 869 1169 Approach Departure1 1 4 4

Fehr Peers Associates
Future Turning Movement Calculation SheetN/S Street Euclid Time Period AME/W Street Guymon Date 2/13/2014Project Euclid Corridor Study
1 674 1004 1Existing 40% 26156 60%
16781 47 627 0 1
111 60% 20 1 100% 31600 186 0 1798 1 3 1
75 40% 55 1 0% 01 63 983 0 1
172940% 26198 60% Approach Departure
1 683 1046 1 4 41 1
Future 792 674 99.7% 1004 125439% 32000 61%
133 2053 31 61 731 0 1
111 60% 26 1 100% 31900 221 0 2181 1 3 1
75 40% 61 1 0% 01 100.0% 72 1227 0 100.0% 1
87 2092 038% 31700 62%
794 683 100.0% 1046 1298 Approach Departure1 1 4 4

Fehr Peers Associates
Future Turning Movement Calculation SheetN/S Street Euclid Time Period PME/W Street Guymon Date 2/13/2014Project Euclid Corridor Study
1 1238 882 1Existing 58% 26156 42%
21201 40 1198 0 1
75 56% 31 1 100% 31600 133 0 2183 1 3 1
58 44% 27 1 0% 01 34 850 0 1
211058% 26198 42% Approach Departure
1 1226 884 1 4 41 1
Future 1455 1238 99.4% 882 112257% 32000 43%
88 2594 31 50 1405 0 1
75 56% 40 1 100% 31900 158 0 2646 1 3 1
58 44% 29 1 0% 01 100.0% 37 1081 0 100.0% 1
70 2553 056% 31700 44%
1435 1226 100.0% 884 1118 Approach Departure1 1 4 4

Fehr Peers Associates
Future Turning Movement Calculation SheetN/S Street Euclid Time Period AME/W Street Market Date 2/13/2014Project Euclid Corridor Study
1 655 958 1Existing 41% 26198 59%
16131 75 431 149 1
573 76% 39 307 70% 70212500 756 90 2375 338 1004 12100
183 24% 54 57 30% 3021 160 612 63 1
137739% 20000 61% Approach Departure
1 542 835 1 4 41 1
Future 935 655 100.0% 958 101748% 31700 52%
711 1952 7901 81 703 151 1
573 74% 42 311 68% 70216000 968 87 3080 328 1162 14000
183 26% 127 151 32% 3021 100.0% 302 664 133 99.9% 1
256 2162 37145% 31400 55%
981 542 96.2% 835 1099 Approach Departure1 1 4 4

Fehr Peers Associates
Future Turning Movement Calculation SheetN/S Street Euclid Time Period PM
E/W Street Market Date 2/13/2014Project Euclid Corridor Study
1 1012 981 1Existing 51% 26198 49%
19931 59 659 294 1
317 37% 92 302 42% 50312500 866 331 2852 139 1210 12100
549 63% 126 62 58% 7071 119 587 82 1
16350% 20000 100% Approach Departure
1 847 788 1 4 41 1
Future 1362 1012 100.0% 981 104956% 31700 44%
403 2412 6171 65 1038 259 1
317 36% 101 315 44% 50316000 1108 349 3691 139 1400 14000
549 64% 256 164 56% 7071 100.0% 199 633 173 99.9% 1
706 2567 78157% 31400 43%
1458 847 96.0% 788 1006 Approach Departure1 1 4 4

APPENDIX E: MXD MODEL RESULTS

Euclid Avenue Corridor Master PlanExisting Conditions
MIXED USE TRIP GENERATION MODEL - BASIC INPUTAll shaded cells are inputsRegular inputs (project-specific)Inputs that may depend on regional values from census data, travel demand model, etc…Treat like other inputs, but please send values and source to Mackenzie Watten so that a library ofvalues can be compiled in future versions!
Section 1 - General Site InformationSite Name Euclid Avenue Corrido int/sq mi 99
Existing ConditionsGeographic Notes / InstructionsDeveloped Area (in acres) 25.96 Include streets, ROW, parking lots, pocket parks. Do not include open space, vacant lots.Number of Intersections 4 Count intersections either within or on the perimeter of the MXD. Check resulting intersections per square mile in blue aboveIs Transit (bus or rail) present within the site or across the street? Yes Note: This is only used as a way to zero out the probability of external trips if no transit is present.Proportion of households within 1/4 mile of a transit sto 100% Enter as a percentage
Land Use - Surrounding Area
Is the site in a Central Business District and/or TOD? NoEmployment within one mile of the MXD 5,000 Do not include employment within the MXD itselfEmployment within a 30 minute Transit Trip (Door-to-door) 100,000 Include employment within the MXD itself This can be a difficult number to get - some suggestions are in the instructions tab in "disclaimers anTotal Regional Employment 1,752,630 Employment at MPO or similar level If in the 9 county Bay Area, can use the MTCJobsWithin30MinutesByTransit.xls sheet on the wiki!
Site DemographicsEnter Population Directly? No If "No", will apply average HH size factors (immediately below) to dwelling unit totals in section 2
Population You do not need to enter population here. It will be calculated based on dwelling units below and average HH sizes.Average HH Size by type within MXD
Single Family 3.2Multi-Family 2.5Townhouse 2.5
High Rise Condo 2.5Average Vehicles Owned per Dwelling Unit within sit 2.70
Use Surrounding Area (Block Group) Demographics for On-Site Average HH Size YesUse Surrounding Area (Block Group) Demographics for On-Site Average Veh Own Yes
Surrounding Area (Block Group) Demographics
Average HH size near Site3.42
See http://factfinder2.census gov/
Average Vehicles Owned per Dwelling Unit near Site1.72
See http://factfinder2.census gov/
Section 2 - Trip GenerationTrips NHB Trips Outside of Project
Quantity Units Daily AM Peak Hour PM Peak Hour Daily AM Peak HourPM Peak Hour Daily
AM Peak Hour
PM Peak Hour
Number of Dwelling UnitsSingle Family 250 DU Log Equation Linear Equation Log Equation 2,440 185 240 503 8 46Multi-Family 0 DU Linear Equation Linear Equation Linear Equation 0 0 0 0 0 0Townhouse DU Log Equation Log Equation Log Equation 0 0 0 0 0 0
High Rise Condo DU Linear Equation Linear Equation Linear Equation 0 0 0 0 0 0
Retail (note: if you use job units for retail, the spreadsheet will convert before applying trip rates, using the rate in section 2 which you can change)
General Retail other than those listed below 25 ksf Log Equation Log Equation Log Equation 2,758 67 237Supermarket ksf Average Rate Average Rate Average Rate 0 0 0
Bank ksf Average Rate Average Rate Average Rate 0 0 0Health Club ksf Average Rate Average Rate Average Rate 0 0 0
Restaurant (non-fast food) 0 ksf Average Rate Average Rate Average Rate 0 0 0Fast-Food Restaurant ksf Average Rate Average Rate Average Rate 0 0 0
Gas Station ksf Average Rate Average Rate Average Rate 0 0 0Auto Repair ksf Average Rate Average Rate Average Rate 0 0 0
Home Improvement Superstore ksf Average Rate Average Rate Average Rate 0 0 0Free-Standing Discount ksf Average Rate Average Rate Average Rate 0 0 0
OfficeNon-Medical ksf Log Equation Log Equation Linear Equation 0 0 0
Medical ksf Average Rate Average Rate Average Rate 0 0 0Industrial
Light Industrial 0 ksf Average Rate Average Rate Average Rate 0 0 0Manufacturing 0 ksf Average Rate Average Rate Average Rate 0 0 0
Warehousing / Self-Storage 0 ksf Average Rate Average Rate Average Rate 0 0 0
Hotel (including restaurant, facilities, etc…) Rooms Average Rate Average Rate Average Rate 0 0 0Motel Rooms Average Rate Average Rate Average Rate 0 0 0Movie Theater (Theater with Matinee) Average Rate Average Rate Average Rate 0 0 0Movie Theater (Multiplex) Screens Average Rate Average Rate Average Rate 0 0 0School
University Students Linear Equation Average Rate Average Rate 0 0 0High School 835 Students Average Rate Average Rate Average Rate 1,428 359 109
Middle School Students Average Rate Average Rate Average Rate 0 0 0Elementary 500 Students Average Rate Average Rate Average Rate 645 225 75
Trips from Land uses not covered above ==>Daily
AM Peak HourPM Peak Hour
Jobs in those Land Uses 0
DailyAM Peak Hour
PM Peak Hour
Total "Raw" ITE Trips 7,271 836 660
These HH size inputs by dwelling type are used to calculate population if it is not entered above, and are also used for average HH size if block group average HH size option is "No" below
If no project-specific information exists, can use block group average HH size (see below
Answering "Yes" will reduce the HBO and NHB purpose splits for retail use to those found in smaller stores. The nature of the stores (large vs. small) should be the primary factor in the selection here.
Trip Equation Method
If no project-specific information exists, can use block group average veh owned (see below
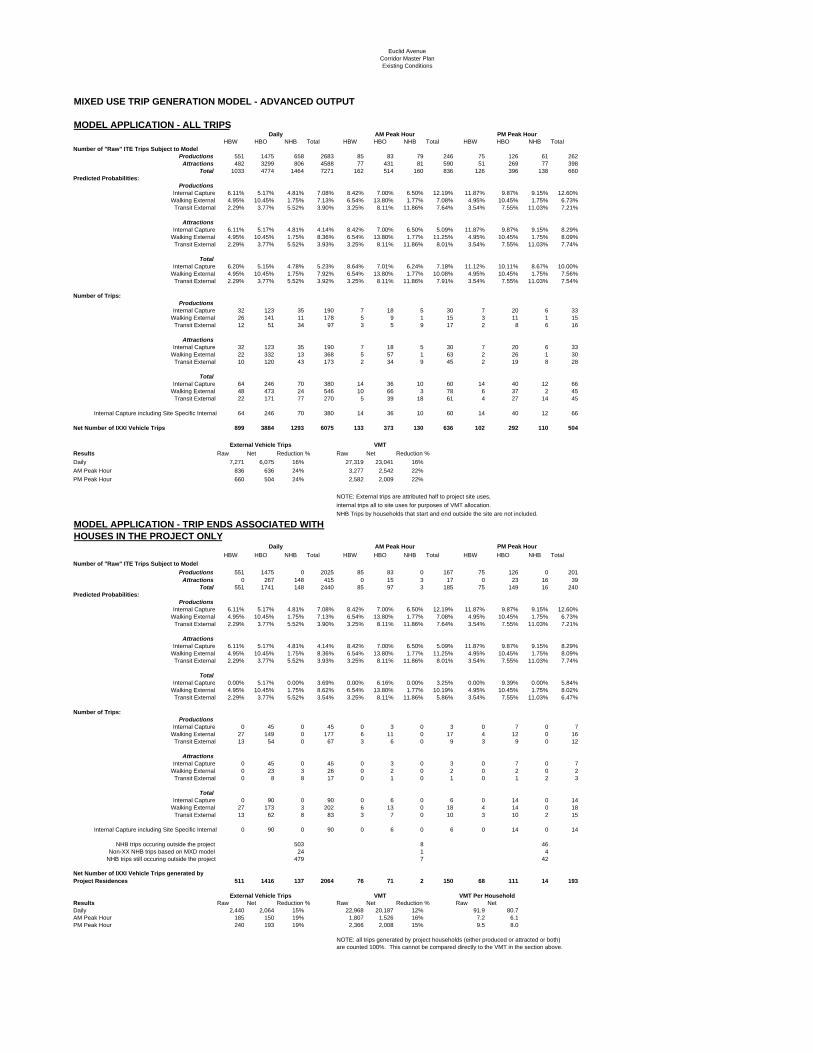
Euclid Avenue Corridor Master PlanExisting Conditions
MIXED USE TRIP GENERATION MODEL - ADVANCED OUTPUT
HBW HBO NHB Total HBW HBO NHB Total HBW HBO NHB TotalNumber of "Raw" ITE Trips Subject to Model
Productions 551 1475 658 2683 85 83 79 246 75 126 61 262Attractions 482 3299 806 4588 77 431 81 590 51 269 77 398
Total 1033 4774 1464 7271 162 514 160 836 126 396 138 660Predicted Probabilities:
ProductionsInternal Capture 6.11% 5.17% 4.81% 7.08% 8.42% 7.00% 6.50% 12.19% 11.87% 9.87% 9.15% 12.60%
Walking External 4.95% 10.45% 1.75% 7.13% 6.54% 13.80% 1.77% 7.08% 4.95% 10.45% 1.75% 6.73%Transit External 2.29% 3.77% 5.52% 3.90% 3.25% 8.11% 11.86% 7.64% 3.54% 7.55% 11.03% 7.21%
AttractionsInternal Capture 6.11% 5.17% 4.81% 4.14% 8.42% 7.00% 6.50% 5.09% 11.87% 9.87% 9.15% 8.29%
Walking External 4.95% 10.45% 1.75% 8.36% 6.54% 13.80% 1.77% 11.25% 4.95% 10.45% 1.75% 8.09%Transit External 2.29% 3.77% 5.52% 3.93% 3.25% 8.11% 11.86% 8.01% 3.54% 7.55% 11.03% 7.74%
TotalInternal Capture 6.20% 5.15% 4.78% 5.23% 8.64% 7.01% 6.24% 7.18% 11.12% 10.11% 8.67% 10.00%
Walking External 4.95% 10.45% 1.75% 7.92% 6.54% 13.80% 1.77% 10.08% 4.95% 10.45% 1.75% 7.56%Transit External 2.29% 3.77% 5.52% 3.92% 3.25% 8.11% 11.86% 7.91% 3.54% 7.55% 11.03% 7.54%
Number of Trips:Productions
Internal Capture 32 123 35 190 7 18 5 30 7 20 6 33Walking External 26 141 11 178 5 9 1 15 3 11 1 15
Transit External 12 51 34 97 3 5 9 17 2 8 6 16
AttractionsInternal Capture 32 123 35 190 7 18 5 30 7 20 6 33
Walking External 22 332 13 368 5 57 1 63 2 26 1 30Transit External 10 120 43 173 2 34 9 45 2 19 8 28
TotalInternal Capture 64 246 70 380 14 36 10 60 14 40 12 66
Walking External 48 473 24 546 10 66 3 78 6 37 2 45Transit External 22 171 77 270 5 39 18 61 4 27 14 45
Internal Capture including Site Specific Internal 64 246 70 380 14 36 10 60 14 40 12 66
Net Number of IXXI Vehicle Trips 899 3884 1293 6075 133 373 130 636 102 292 110 504
Results Raw Net Reduction % Raw Net Reduction %Daily 7,271 6,075 16% 27,319 23,041 16%AM Peak Hour 836 636 24% 3,277 2,542 22%PM Peak Hour 660 504 24% 2,582 2,009 22%
NOTE: External trips are attributed half to project site uses,internal trips all to site uses for purposes of VMT allocation.NHB Trips by households that start and end outside the site are not included.
HBW HBO NHB Total HBW HBO NHB Total HBW HBO NHB TotalNumber of "Raw" ITE Trips Subject to Model
Productions 551 1475 0 2025 85 83 0 167 75 126 0 201Attractions 0 267 148 415 0 15 3 17 0 23 16 39
Total 551 1741 148 2440 85 97 3 185 75 149 16 240Predicted Probabilities:
ProductionsInternal Capture 6.11% 5.17% 4.81% 7.08% 8.42% 7.00% 6.50% 12.19% 11.87% 9.87% 9.15% 12.60%
Walking External 4.95% 10.45% 1.75% 7.13% 6.54% 13.80% 1.77% 7.08% 4.95% 10.45% 1.75% 6.73%Transit External 2.29% 3.77% 5.52% 3.90% 3.25% 8.11% 11.86% 7.64% 3.54% 7.55% 11.03% 7.21%
AttractionsInternal Capture 6.11% 5.17% 4.81% 4.14% 8.42% 7.00% 6.50% 5.09% 11.87% 9.87% 9.15% 8.29%
Walking External 4.95% 10.45% 1.75% 8.36% 6.54% 13.80% 1.77% 11.25% 4.95% 10.45% 1.75% 8.09%Transit External 2.29% 3.77% 5.52% 3.93% 3.25% 8.11% 11.86% 8.01% 3.54% 7.55% 11.03% 7.74%
TotalInternal Capture 0.00% 5.17% 0.00% 3.69% 0.00% 6.16% 0.00% 3.25% 0.00% 9.39% 0.00% 5.84%
Walking External 4.95% 10.45% 1.75% 8.62% 6.54% 13.80% 1.77% 10.19% 4.95% 10.45% 1.75% 8.02%Transit External 2.29% 3.77% 5.52% 3.54% 3.25% 8.11% 11.86% 5.86% 3.54% 7.55% 11.03% 6.47%
Number of Trips:Productions
Internal Capture 0 45 0 45 0 3 0 3 0 7 0 7Walking External 27 149 0 177 6 11 0 17 4 12 0 16
Transit External 13 54 0 67 3 6 0 9 3 9 0 12
AttractionsInternal Capture 0 45 0 45 0 3 0 3 0 7 0 7
Walking External 0 23 3 26 0 2 0 2 0 2 0 2Transit External 0 8 8 17 0 1 0 1 0 1 2 3
TotalInternal Capture 0 90 0 90 0 6 0 6 0 14 0 14
Walking External 27 173 3 202 6 13 0 18 4 14 0 18Transit External 13 62 8 83 3 7 0 10 3 10 2 15
Internal Capture including Site Specific Internal 0 90 0 90 0 6 0 6 0 14 0 14
NHB trips occuring outside the project 503 8 46Non-XX NHB trips based on MXD model 24 1 4
NHB trips still occuring outside the project 479 7 42
Net Number of IXXI Vehicle Trips generated by Project Residences 511 1416 137 2064 76 71 2 150 68 111 14 193
Results Raw Net Reduction % Raw Net Reduction % Raw NetDaily 2,440 2,064 15% 22,968 20,187 12% 91.9 80.7AM Peak Hour 185 150 19% 1,807 1,526 16% 7.2 6.1PM Peak Hour 240 193 19% 2,366 2,008 15% 9.5 8.0
NOTE: all trips generated by project households (either produced or attracted or both)are counted 100%. This cannot be compared directly to the VMT in the section above.
PM Peak Hour
MODEL APPLICATION - TRIP ENDS ASSOCIATED WITH HOUSES IN THE PROJECT ONLY
AM Peak Hour
MODEL APPLICATION - ALL TRIPS
VMT Per Household
Daily AM Peak Hour PM Peak Hour
External Vehicle Trips VMT
External Vehicle Trips VMT
Daily

Euclid Avenue Corridor Master Plan
Future Conditions
MIXED USE TRIP GENERATION MODEL - BASIC INPUTAll shaded cells are inputsRegular inputs (project-specific)Inputs that may depend on regional values from census data, travel demand model, etc…Treat like other inputs, but please send values and source to Mackenzie Watten so that a library ofvalues can be compiled in future versions!
Section 1 - General Site InformationSite Name Euclid Avenue Corrido int/sq mi 99
Future Conditions with LU UpdatesGeographic Notes / InstructionsDeveloped Area (in acres) 25.96 Include streets, ROW, parking lots, pocket parks. Do not include open space, vacant lots.Number of Intersections 4 Count intersections either within or on the perimeter of the MXD. Check resulting intersections per square mile in blue aboveIs Transit (bus or rail) present within the site or across the street? Yes Note: This is only used as a way to zero out the probability of external trips if no transit is present.Proportion of households within 1/4 mile of a transit sto 100% Enter as a percentage
Land Use - Surrounding Area
Is the site in a Central Business District and/or TOD? NoEmployment within one mile of the MXD 5,000 Do not include employment within the MXD itselfEmployment within a 30 minute Transit Trip (Door-to-door) 100,000 Include employment within the MXD itself This can be a difficult number to get - some suggestions are in the instructions tab in "disclaimers anTotal Regional Employment 1,752,630 Employment at MPO or similar level If in the 9 county Bay Area, can use the MTCJobsWithin30MinutesByTransit.xls sheet on the wiki!
Site DemographicsEnter Population Directly? No If "No", will apply average HH size factors (immediately below) to dwelling unit totals in section 2
Population You do not need to enter population here. It will be calculated based on dwelling units below and average HH sizes.Average HH Size by type within MXD
Single Family 3.2Multi-Family 2.5Townhouse 2.5
High Rise Condo 2.5Average Vehicles Owned per Dwelling Unit within sit 2.70
Use Surrounding Area (Block Group) Demographics for On-Site Average HH Size YesUse Surrounding Area (Block Group) Demographics for On-Site Average Veh Own Yes
Surrounding Area (Block Group) Demographics
Average HH size near Site3.42
Average Vehicles Owned per Dwelling Unit near Site1.72
Section 2 - Trip GenerationTrips NHB Trips Outside of Project
Quantity Units Daily AM Peak Hour PM Peak Hour Daily AM Peak HourPM Peak Hour Daily
AM Peak Hour
PM Peak Hour
Number of Dwelling UnitsSingle Family 300 DU Log Equation Linear Equation Log Equation 2,886 220 282 604 9 56Multi-Family 200 DU Linear Equation Linear Equation Linear Equation 1,336 102 128 403 6 37Townhouse DU Log Equation Log Equation Log Equation 0 0 0 0 0 0
High Rise Condo DU Linear Equation Linear Equation Linear Equation 0 0 0 0 0 0
Retail (note: if you use job units for retail, the spreadsheet will convert before applying trip rates, using the rate in section 2 which you can change)
General Retail other than those listed below 80 ksf Log Equation Log Equation Log Equation 5,874 136 516Supermarket ksf Average Rate Average Rate Average Rate 0 0 0
Bank ksf Average Rate Average Rate Average Rate 0 0 0Health Club ksf Average Rate Average Rate Average Rate 0 0 0
Restaurant (non-fast food) 20 ksf Average Rate Average Rate Average Rate 2,543 216 197Fast-Food Restaurant ksf Average Rate Average Rate Average Rate 0 0 0
Gas Station ksf Average Rate Average Rate Average Rate 0 0 0Auto Repair ksf Average Rate Average Rate Average Rate 0 0 0
Home Improvement Superstore ksf Average Rate Average Rate Average Rate 0 0 0Free-Standing Discount ksf Average Rate Average Rate Average Rate 0 0 0
OfficeNon-Medical ksf Log Equation Log Equation Linear Equation 0 0 0
Medical ksf Average Rate Average Rate Average Rate 0 0 0Industrial
Light Industrial 0 ksf Average Rate Average Rate Average Rate 0 0 0Manufacturing 0 ksf Average Rate Average Rate Average Rate 0 0 0
Warehousing / Self-Storage 0 ksf Average Rate Average Rate Average Rate 0 0 0
Hotel (including restaurant, facilities, etc…) Rooms Average Rate Average Rate Average Rate 0 0 0Motel Rooms Average Rate Average Rate Average Rate 0 0 0Movie Theater (Theater with Matinee) Average Rate Average Rate Average Rate 0 0 0Movie Theater (Multiplex) Screens Average Rate Average Rate Average Rate 0 0 0School
University Students Linear Equation Average Rate Average Rate 0 0 0High School 835 Students Average Rate Average Rate Average Rate 1,428 359 109
Middle School Students Average Rate Average Rate Average Rate 0 0 0Elementary 500 Students Average Rate Average Rate Average Rate 645 225 75
Trips from Land uses not covered above ==>Daily
AM Peak HourPM Peak Hour
Jobs in those Land Uses 0
DailyAM Peak Hour
PM Peak Hour
Total "Raw" ITE Trips 14,711 1,258 1,307
These HH size inputs by dwelling type are used to calculate population if it is not entered above, and are also used for average HH size if block group average HH size option is "No" below
If no project-specific information exists, can use block group average HH size (see below
Answering "Yes" will reduce the HBO and NHB purpose splits for retail use to those found in smaller stores. The nature of the stores (large vs. small) should be the primary factor in the selection here.
Trip Equation Method
See http://factfinder2.census.gov/
See http://factfinder2.census.gov/
If no project-specific information exists, can use block group average veh owned (see below

Euclid Avenue Corridor Master Plan
Future Conditions
MIXED USE TRIP GENERATION MODEL - ADVANCED OUTPUT
HBW HBO NHB Total HBW HBO NHB Total HBW HBO NHB TotalNumber of "Raw" ITE Trips Subject to Model
Productions 952 2551 1455 4959 148 144 91 382 128 216 136 480Attractions 1046 6994 1712 9752 157 623 96 875 118 546 164 827
Total 1999 9546 3167 14711 305 766 187 1258 245 761 300 1307Predicted Probabilities:
ProductionsInternal Capture 6.11% 5.18% 5.41% 7.95% 9.03% 7.66% 8.04% 13.34% 17.95% 15.22% 15.97% 21.68%
Walking External 4.96% 12.73% 2.18% 8.05% 6.54% 16.80% 2.21% 9.00% 4.96% 12.73% 2.18% 7.40%Transit External 2.29% 4.55% 5.52% 4.40% 3.25% 9.78% 11.86% 7.67% 3.54% 9.10% 11.03% 8.11%
AttractionsInternal Capture 6.11% 5.18% 5.41% 4.04% 9.03% 7.66% 8.04% 5.83% 17.95% 15.22% 15.97% 12.58%
Walking External 4.96% 12.73% 2.18% 10.08% 6.54% 16.80% 2.21% 13.47% 4.96% 12.73% 2.18% 9.66%Transit External 2.29% 4.55% 5.52% 4.48% 3.25% 9.78% 11.86% 8.86% 3.54% 9.10% 11.03% 8.74%
TotalInternal Capture 6.10% 5.18% 5.43% 5.36% 9.19% 7.57% 8.56% 8.11% 17.95% 15.23% 16.00% 15.92%
Walking External 4.96% 12.73% 2.18% 9.41% 6.54% 16.80% 2.21% 12.19% 4.96% 12.73% 2.18% 8.89%Transit External 2.29% 4.55% 5.52% 4.45% 3.25% 9.78% 11.86% 8.52% 3.54% 9.10% 11.03% 8.52%
Number of Trips:Productions
Internal Capture 61 247 86 394 14 29 8 51 22 58 24 104Walking External 44 293 30 367 9 19 2 30 5 20 2 28
Transit External 20 105 76 201 4 11 10 25 4 14 12 30
AttractionsInternal Capture 61 247 86 394 14 29 8 51 22 58 24 104
Walking External 49 859 35 943 9 100 2 111 5 62 3 70Transit External 23 307 90 419 5 58 10 73 3 44 15 63
TotalInternal Capture 122 494 172 788 28 58 16 102 44 116 48 208
Walking External 93 1152 65 1311 18 119 4 141 10 82 6 98Transit External 43 412 165 620 9 69 20 98 7 59 28 94
Internal Capture including Site Specific Internal 122 494 172 788 28 58 16 102 44 116 48 208
Net Number of IXXI Vehicle Trips 1741 7488 2764 11993 250 520 147 916 184 505 219 907
Results Raw Net Reduction % Raw Net Reduction %Daily 14,711 11,993 18% 55,004 45,406 17%AM Peak Hour 1,258 916 27% 5,120 3,844 25%PM Peak Hour 1,307 907 31% 5,101 3,639 29%
NOTE: External trips are attributed half to project site uses,internal trips all to site uses for purposes of VMT allocation.NHB Trips by households that start and end outside the site are not included.
HBW HBO NHB Total HBW HBO NHB Total HBW HBO NHB TotalNumber of "Raw" ITE Trips Subject to Model
Productions 952 2551 0 3504 148 144 0 291 128 216 0 344Attractions 0 461 256 717 0 26 4 30 0 39 28 67
Total 952 3012 256 4221 148 170 4 321 128 255 28 410Predicted Probabilities:
ProductionsInternal Capture 6.11% 5.18% 5.41% 7.95% 9.03% 7.66% 8.04% 13.34% 17.95% 15.22% 15.97% 21.68%
Walking External 4.96% 12.73% 2.18% 8.05% 6.54% 16.80% 2.21% 9.00% 4.96% 12.73% 2.18% 7.40%Transit External 2.29% 4.55% 5.52% 4.40% 3.25% 9.78% 11.86% 7.67% 3.54% 9.10% 11.03% 8.11%
AttractionsInternal Capture 6.11% 5.18% 5.41% 4.04% 9.03% 7.66% 8.04% 5.83% 17.95% 15.22% 15.97% 12.58%
Walking External 4.96% 12.73% 2.18% 10.08% 6.54% 16.80% 2.21% 13.47% 4.96% 12.73% 2.18% 9.66%Transit External 2.29% 4.55% 5.52% 4.48% 3.25% 9.78% 11.86% 8.86% 3.54% 9.10% 11.03% 8.74%
TotalInternal Capture 0.00% 5.18% 0.00% 3.70% 0.00% 7.08% 0.00% 3.73% 0.00% 14.90% 0.00% 9.27%
Walking External 4.96% 12.73% 2.18% 10.24% 6.54% 16.80% 2.21% 11.71% 4.96% 12.73% 2.18% 9.28%Transit External 2.29% 4.55% 5.52% 4.08% 3.25% 9.78% 11.86% 6.69% 3.54% 9.10% 11.03% 7.33%
Number of Trips:Productions
Internal Capture 0 78 0 78 0 6 0 6 0 19 0 19Walking External 47 315 0 362 10 23 0 33 6 25 0 31
Transit External 22 112 0 134 5 13 0 18 5 18 0 22
AttractionsInternal Capture 0 78 0 78 0 6 0 6 0 19 0 19
Walking External 0 49 6 54 0 3 0 3 0 3 1 3Transit External 0 17 14 32 0 2 1 2 0 2 3 5
TotalInternal Capture 0 156 0 156 0 12 0 12 0 38 0 38
Walking External 47 364 6 416 10 26 0 36 6 28 1 35Transit External 22 130 14 166 5 15 1 21 5 20 3 27
Internal Capture including Site Specific Internal 0 156 0 156 0 12 0 12 0 38 0 38
NHB trips occuring outside the project 1007 16 93Non-XX NHB trips based on MXD model 54 1 15
NHB trips still occuring outside the project 952 15 78
Net Number of IXXI Vehicle Trips generated by Project Residences 883 2363 237 3483 133 116 4 253 117 170 24 310
Results Raw Net Reduction % Raw Net Reduction % Raw NetDaily 4,221 3,483 17% 40,652 35,216 13% 81.3 70.4AM Peak Hour 321 253 21% 3,158 2,612 17% 6.3 5.2PM Peak Hour 410 310 24% 4,139 3,374 18% 8.3 6.7
NOTE: all trips generated by project households (either produced or attracted or both)are counted 100%. This cannot be compared directly to the VMT in the section above.
MODEL APPLICATION - ALL TRIPS
VMT Per Household
Daily AM Peak Hour PM Peak Hour
External Vehicle Trips VMT
External Vehicle Trips VMT
Daily PM Peak Hour
MODEL APPLICATION - TRIP ENDS ASSOCIATED WITH HOUSES IN THE PROJECT ONLY
AM Peak Hour

Transit Stop Route Boardings Alightings Total
916/917 6 7
955 28 28
916/917 12 8
955 59 67
916/917 57 35
955 179 180Orange Line
Trolley2,576 2,732
3 358 4484 418 3475 566 45713 1,048 970916 171 66917 113 257955 1,068 969
960 82 59
Total 6,741 6,630 13,371Source: SANDAG Assistance to Transit Operations and Planning Program, 2010
Existing Transit Daily Boardings and Alightings Summary
Euclid Avenue & Guymon Street
69
Euclid Avenue & Hilltop Drive
146
Euclid Avenue & Federal Boulevard
451
Euclid Trolley Station 12,705

APPENDIX F: INTERSECTION LEVEL OF SERVICE WORKSHEETS &
SIGNAL WARRANTS

HCM Signalized Intersection Capacity Analysis1: Euclid Ave & SR-94 WB Ramps 2/28/14
Future AM Synchro 8 ReportJAM Page 1
Movement WBL WBR NBT NBR SBL SBTLane ConfigurationsVolume (vph) 136 206 929 745 0 1162Ideal Flow (vphpl) 1900 1900 1900 1900 1900 1900Total Lost time (s) 4.0 4.0 4.0 4.0 4.0Lane Util. Factor 1.00 1.00 0.95 1.00 0.95Frt 1.00 0.85 1.00 0.85 1.00Flt Protected 0.95 1.00 1.00 1.00 1.00Satd. Flow (prot) 1770 1583 3539 1583 3539Flt Permitted 0.95 1.00 1.00 1.00 1.00Satd. Flow (perm) 1770 1583 3539 1583 3539Peak-hour factor, PHF 0.92 0.92 0.92 0.92 0.92 0.92Adj. Flow (vph) 148 224 1010 810 0 1263RTOR Reduction (vph) 0 137 0 175 0 0Lane Group Flow (vph) 148 87 1010 635 0 1263Turn Type NA Perm NA Perm NAProtected Phases 8 2 6Permitted Phases 8 2Actuated Green, G (s) 13.6 13.6 78.4 78.4 78.4Effective Green, g (s) 13.6 13.6 78.4 78.4 78.4Actuated g/C Ratio 0.14 0.14 0.78 0.78 0.78Clearance Time (s) 4.0 4.0 4.0 4.0 4.0Vehicle Extension (s) 3.0 3.0 3.0 3.0 3.0Lane Grp Cap (vph) 240 215 2774 1241 2774v/s Ratio Prot c0.08 0.29 0.36v/s Ratio Perm 0.05 c0.40v/c Ratio 0.62 0.40 0.36 0.51 0.46Uniform Delay, d1 40.7 39.5 3.3 3.9 3.6Progression Factor 1.00 1.00 0.69 0.14 1.00Incremental Delay, d2 4.7 1.2 0.3 1.2 0.5Delay (s) 45.4 40.7 2.5 1.8 4.2Level of Service D D A A AApproach Delay (s) 42.6 2.2 4.2Approach LOS D A A
Intersection SummaryHCM 2000 Control Delay 7.3 HCM 2000 Level of Service AHCM 2000 Volume to Capacity ratio 0.53Actuated Cycle Length (s) 100.0 Sum of lost time (s) 8.0Intersection Capacity Utilization 49.5% ICU Level of Service AAnalysis Period (min) 15c Critical Lane Group

HCM Signalized Intersection Capacity Analysis2: Euclid Ave & SR-94 EB Ramps 2/28/14
Future AM Synchro 8 ReportJAM Page 2
Movement WBL WBR NBT NBR SBL SBTLane ConfigurationsVolume (vph) 495 388 1062 160 120 583Ideal Flow (vphpl) 1900 1900 1900 1900 1900 1900Total Lost time (s) 4.0 4.0 4.0 4.0 4.0Lane Util. Factor 0.97 1.00 0.95 1.00 0.95Frt 1.00 0.85 0.98 1.00 1.00Flt Protected 0.95 1.00 1.00 0.95 1.00Satd. Flow (prot) 3433 1583 3475 1770 3539Flt Permitted 0.95 1.00 1.00 0.95 1.00Satd. Flow (perm) 3433 1583 3475 1770 3539Peak-hour factor, PHF 0.92 0.92 0.92 1.00 0.92 0.92Adj. Flow (vph) 538 422 1154 160 130 634RTOR Reduction (vph) 0 25 9 0 0 0Lane Group Flow (vph) 538 397 1305 0 130 634Turn Type NA pm+ov NA Prot NAProtected Phases 8 1 2 1 6Permitted Phases 8Actuated Green, G (s) 20.4 33.1 54.9 12.7 71.6Effective Green, g (s) 20.4 33.1 54.9 12.7 71.6Actuated g/C Ratio 0.20 0.33 0.55 0.13 0.72Clearance Time (s) 4.0 4.0 4.0 4.0 4.0Vehicle Extension (s) 3.0 3.0 3.0 3.0 3.0Lane Grp Cap (vph) 700 587 1907 224 2533v/s Ratio Prot c0.16 c0.09 c0.38 0.07 0.18v/s Ratio Perm 0.17v/c Ratio 0.77 0.68 0.68 0.58 0.25Uniform Delay, d1 37.6 28.8 16.3 41.1 4.9Progression Factor 1.00 1.00 1.00 1.09 0.82Incremental Delay, d2 5.1 3.1 2.0 3.5 0.2Delay (s) 42.7 31.9 18.3 48.2 4.3Level of Service D C B D AApproach Delay (s) 37.9 18.3 11.7Approach LOS D B B
Intersection SummaryHCM 2000 Control Delay 22.9 HCM 2000 Level of Service CHCM 2000 Volume to Capacity ratio 0.72Actuated Cycle Length (s) 100.0 Sum of lost time (s) 12.0Intersection Capacity Utilization 65.2% ICU Level of Service CAnalysis Period (min) 15c Critical Lane Group

HCM Signalized Intersection Capacity Analysis2: Euclid Ave & SR-94 EB Ramps 2/28/14
Future AM Synchro 8 ReportJAM Page 2
Movement WBL WBR NBT NBR SBL SBTLane ConfigurationsVolume (vph) 495 388 1062 160 120 583Ideal Flow (vphpl) 1900 1900 1900 1900 1900 1900Total Lost time (s) 4.0 4.0 4.0 4.0 4.0Lane Util. Factor 0.97 1.00 0.95 1.00 0.95Frt 1.00 0.85 0.98 1.00 1.00Flt Protected 0.95 1.00 1.00 0.95 1.00Satd. Flow (prot) 3433 1583 3475 1770 3539Flt Permitted 0.95 1.00 1.00 0.95 1.00Satd. Flow (perm) 3433 1583 3475 1770 3539Peak-hour factor, PHF 0.92 0.92 0.92 1.00 0.92 0.92Adj. Flow (vph) 538 422 1154 160 130 634RTOR Reduction (vph) 0 300 11 0 0 0Lane Group Flow (vph) 538 122 1303 0 130 634Turn Type NA pm+ov NA Prot NAProtected Phases 8 1 2 1 6Permitted Phases 8Actuated Green, G (s) 20.4 29.0 31.0 8.6 43.6Effective Green, g (s) 20.4 29.0 31.0 8.6 43.6Actuated g/C Ratio 0.20 0.29 0.31 0.09 0.44Clearance Time (s) 4.0 4.0 4.0 4.0 4.0Vehicle Extension (s) 3.0 3.0 3.0 3.0 3.0Lane Grp Cap (vph) 700 522 1077 152 1543v/s Ratio Prot c0.16 0.02 c0.37 c0.07 0.18v/s Ratio Perm 0.06v/c Ratio 0.77 0.23 1.21 0.86 0.41Uniform Delay, d1 37.6 27.0 34.5 45.1 19.4Progression Factor 1.00 1.00 1.00 0.99 0.91Incremental Delay, d2 5.1 0.2 103.2 32.9 0.8Delay (s) 42.7 27.3 137.7 77.3 18.3Level of Service D C F E BApproach Delay (s) 35.9 137.7 28.3Approach LOS D F C
Intersection SummaryHCM 2000 Control Delay 78.0 HCM 2000 Level of Service EHCM 2000 Volume to Capacity ratio 0.72Actuated Cycle Length (s) 100.0 Sum of lost time (s) 16.0Intersection Capacity Utilization 65.2% ICU Level of Service CAnalysis Period (min) 15c Critical Lane Group
Pedestrian Phase Actuated on Euclid Ave & SR-94 EB Ramps

HCM Signalized Intersection Capacity Analysis3: Euclid Ave & Hilltop Dr 2/28/14
Future AM Synchro 8 ReportJAM Page 3
Movement EBL EBT EBR WBL WBT WBR NBL NBT NBR SBL SBT SBRLane ConfigurationsVolume (vph) 37 25 62 49 19 29 116 998 46 68 803 97Ideal Flow (vphpl) 1900 1900 1900 1900 1900 1900 1900 1900 1900 1900 1900 1900Total Lost time (s) 4.0 4.0 4.9 4.0 4.0 4.0 4.0Lane Util. Factor 1.00 1.00 1.00 1.00 0.95 1.00 0.95Frpb, ped/bikes 1.00 1.00 0.99 1.00 1.00 1.00 1.00Flpb, ped/bikes 1.00 1.00 1.00 1.00 1.00 1.00 1.00Frt 1.00 0.89 0.96 1.00 0.99 1.00 0.98Flt Protected 0.95 1.00 0.98 0.95 1.00 0.95 1.00Satd. Flow (prot) 1770 1664 1729 1770 3511 1769 3480Flt Permitted 0.69 1.00 0.79 0.21 1.00 0.21 1.00Satd. Flow (perm) 1287 1664 1407 393 3511 394 3480Peak-hour factor, PHF 0.92 0.92 0.92 0.96 0.92 0.96 0.92 0.96 0.96 0.96 0.96 0.92Adj. Flow (vph) 40 27 67 51 21 30 126 1040 48 71 836 105RTOR Reduction (vph) 0 53 0 0 24 0 0 4 0 0 13 0Lane Group Flow (vph) 40 41 0 0 78 0 126 1084 0 71 928 0Confl. Peds. (#/hr) 9 17 10 10Confl. Bikes (#/hr) 1Turn Type Perm NA Perm NA pm+pt NA pm+pt NAProtected Phases 4 8 5 2 1 6Permitted Phases 4 8 2 6Actuated Green, G (s) 9.5 9.5 8.6 22.0 19.0 20.6 18.5Effective Green, g (s) 9.5 9.5 8.6 22.0 20.4 21.4 19.9Actuated g/C Ratio 0.21 0.21 0.19 0.50 0.46 0.48 0.45Clearance Time (s) 4.0 4.0 4.9 4.0 5.4 4.4 5.4Vehicle Extension (s) 3.0 3.0 2.0 3.0 4.1 2.0 4.0Lane Grp Cap (vph) 275 356 272 287 1613 267 1559v/s Ratio Prot 0.02 c0.03 c0.31 0.01 0.27v/s Ratio Perm 0.03 c0.06 0.19 0.11v/c Ratio 0.15 0.12 0.29 0.44 0.67 0.27 0.60Uniform Delay, d1 14.2 14.1 15.3 6.6 9.4 6.8 9.2Progression Factor 1.00 1.00 1.00 1.00 1.00 1.00 1.00Incremental Delay, d2 0.2 0.1 0.2 1.1 1.2 0.2 0.7Delay (s) 14.4 14.2 15.5 7.6 10.6 7.0 9.9Level of Service B B B A B A AApproach Delay (s) 14.3 15.5 10.3 9.7Approach LOS B B B A
Intersection SummaryHCM 2000 Control Delay 10.5 HCM 2000 Level of Service BHCM 2000 Volume to Capacity ratio 0.55Actuated Cycle Length (s) 44.4 Sum of lost time (s) 12.9Intersection Capacity Utilization 58.7% ICU Level of Service BAnalysis Period (min) 15c Critical Lane Group

HCM Signalized Intersection Capacity Analysis4: Euclid Ave & Lise Ave 2/28/14
Future AM Synchro 8 ReportJAM Page 4
Movement EBL EBR NBL NBT SBT SBRLane ConfigurationsVolume (vph) 62 62 88 1222 686 152Ideal Flow (vphpl) 1900 1900 1900 1900 1900 1900Total Lost time (s) 4.0 4.0 4.0 4.0Lane Util. Factor 1.00 1.00 0.95 0.95Frpb, ped/bikes 1.00 1.00 1.00 0.99Flpb, ped/bikes 1.00 0.99 1.00 1.00Frt 0.93 1.00 1.00 0.97Flt Protected 0.98 0.95 1.00 1.00Satd. Flow (prot) 1695 1758 3539 3416Flt Permitted 0.98 0.30 1.00 1.00Satd. Flow (perm) 1695 549 3539 3416Peak-hour factor, PHF 0.93 0.93 0.93 0.93 0.93 0.93Adj. Flow (vph) 67 67 95 1314 738 163RTOR Reduction (vph) 55 0 0 0 18 0Lane Group Flow (vph) 79 0 95 1314 883 0Confl. Peds. (#/hr) 23 23Turn Type NA Perm NA NAProtected Phases 4 2 6Permitted Phases 2Actuated Green, G (s) 8.8 32.5 32.5 32.5Effective Green, g (s) 8.8 32.5 32.5 32.5Actuated g/C Ratio 0.18 0.66 0.66 0.66Clearance Time (s) 4.0 4.0 4.0 4.0Vehicle Extension (s) 3.0 3.0 3.0 3.0Lane Grp Cap (vph) 302 361 2333 2251v/s Ratio Prot c0.05 c0.37 0.26v/s Ratio Perm 0.17v/c Ratio 0.26 0.26 0.56 0.39Uniform Delay, d1 17.4 3.5 4.6 3.9Progression Factor 1.00 1.00 1.00 1.00Incremental Delay, d2 0.5 0.4 0.3 0.1Delay (s) 17.9 3.9 4.9 4.0Level of Service B A A AApproach Delay (s) 17.9 4.8 4.0Approach LOS B A A
Intersection SummaryHCM 2000 Control Delay 5.2 HCM 2000 Level of Service AHCM 2000 Volume to Capacity ratio 0.50Actuated Cycle Length (s) 49.3 Sum of lost time (s) 8.0Intersection Capacity Utilization 47.7% ICU Level of Service AAnalysis Period (min) 15c Critical Lane Group

HCM Signalized Intersection Capacity Analysis5: Euclid Ave & Guymon St 2/28/14
Future AM Synchro 8 ReportJAM Page 5
Movement EBL EBR NBL NBT SBT SBRLane ConfigurationsVolume (vph) 26 61 72 1227 731 61Ideal Flow (vphpl) 1900 1900 1900 1900 1900 1900Total Lost time (s) 4.0 4.0 4.0 4.0Lane Util. Factor 1.00 1.00 0.95 0.95Frpb, ped/bikes 0.98 1.00 1.00 1.00Flpb, ped/bikes 1.00 1.00 1.00 1.00Frt 0.91 1.00 1.00 0.99Flt Protected 0.99 0.95 1.00 1.00Satd. Flow (prot) 1631 1770 3539 3485Flt Permitted 0.99 0.95 1.00 1.00Satd. Flow (perm) 1631 1770 3539 3485Peak-hour factor, PHF 0.92 0.92 0.92 0.92 0.92 0.92Adj. Flow (vph) 28 66 78 1334 795 66RTOR Reduction (vph) 56 0 0 0 8 0Lane Group Flow (vph) 38 0 78 1334 853 0Confl. Peds. (#/hr) 75 25 25 25Confl. Bikes (#/hr) 1 1Turn Type NA Prot NA NAProtected Phases 4 5 2 6Permitted PhasesActuated Green, G (s) 5.1 5.9 26.1 15.8Effective Green, g (s) 6.0 6.3 27.6 17.3Actuated g/C Ratio 0.14 0.15 0.66 0.42Clearance Time (s) 4.9 4.4 5.5 5.5Vehicle Extension (s) 2.0 2.0 4.1 3.6Lane Grp Cap (vph) 235 268 2347 1449v/s Ratio Prot c0.02 0.04 c0.38 0.24v/s Ratio Permv/c Ratio 0.16 0.29 0.57 0.59Uniform Delay, d1 15.6 15.7 3.8 9.4Progression Factor 1.00 1.00 1.00 1.00Incremental Delay, d2 0.1 0.2 0.4 0.7Delay (s) 15.7 15.9 4.2 10.1Level of Service B B A BApproach Delay (s) 15.7 4.8 10.1Approach LOS B A B
Intersection SummaryHCM 2000 Control Delay 7.2 HCM 2000 Level of Service AHCM 2000 Volume to Capacity ratio 0.56Actuated Cycle Length (s) 41.6 Sum of lost time (s) 12.0Intersection Capacity Utilization 54.9% ICU Level of Service AAnalysis Period (min) 15c Critical Lane Group

HCM Signalized Intersection Capacity Analysis6: Euclid Ave & Market St 2/28/14
Future AM Synchro 8 ReportJAM Page 6
Movement EBL EBT EBR WBL WBT WBR NBL NBT NBR SBL SBT SBRLane ConfigurationsVolume (vph) 42 87 127 151 328 311 302 664 133 151 703 81Ideal Flow (vphpl) 1900 1900 1400 1400 1900 1900 1400 1400 1400 1900 1400 1900Total Lost time (s) 4.0 4.0 4.0 4.0 4.0 4.0 4.0 4.0Lane Util. Factor 1.00 0.95 1.00 0.95 1.00 0.95 0.97 0.95Frt 1.00 0.91 1.00 0.93 1.00 0.97 1.00 0.98Flt Protected 0.95 1.00 0.95 1.00 0.95 1.00 0.95 1.00Satd. Flow (prot) 1770 3225 1304 3281 1304 2542 3433 2567Flt Permitted 0.95 1.00 0.95 1.00 0.95 1.00 0.95 1.00Satd. Flow (perm) 1770 3225 1304 3281 1304 2542 3433 2567Peak-hour factor, PHF 0.92 0.92 0.92 0.92 0.92 0.92 0.92 0.92 0.92 0.92 0.92 0.92Adj. Flow (vph) 46 95 138 164 357 338 328 722 145 164 764 88RTOR Reduction (vph) 0 120 0 0 170 0 0 14 0 0 8 0Lane Group Flow (vph) 46 113 0 164 525 0 328 853 0 164 844 0Turn Type Prot NA Prot NA Prot NA Prot NAProtected Phases 7 4 3 8 5 2 1 6Permitted PhasesActuated Green, G (s) 4.0 12.1 16.9 24.4 21.5 41.2 8.6 27.5Effective Green, g (s) 4.4 13.0 17.3 25.9 21.9 42.1 9.0 29.2Actuated g/C Ratio 0.05 0.13 0.18 0.27 0.22 0.43 0.09 0.30Clearance Time (s) 4.4 4.9 4.4 5.5 4.4 4.9 4.4 5.7Vehicle Extension (s) 2.0 3.2 2.0 4.5 2.0 5.3 2.0 5.0Lane Grp Cap (vph) 79 430 231 872 293 1098 317 769v/s Ratio Prot c0.03 0.04 c0.13 c0.16 c0.25 0.34 0.05 c0.33v/s Ratio Permv/c Ratio 0.58 0.26 0.71 0.60 1.12 0.78 0.52 1.10Uniform Delay, d1 45.6 37.9 37.7 31.3 37.8 23.6 42.1 34.1Progression Factor 1.00 1.00 1.00 1.00 1.00 1.00 1.00 1.00Incremental Delay, d2 6.9 0.4 7.9 1.6 88.7 4.2 0.6 62.6Delay (s) 52.5 38.3 45.6 32.8 126.4 27.9 42.7 96.7Level of Service D D D C F C D FApproach Delay (s) 40.6 35.2 54.9 87.9Approach LOS D D D F
Intersection SummaryHCM 2000 Control Delay 58.7 HCM 2000 Level of Service EHCM 2000 Volume to Capacity ratio 0.92Actuated Cycle Length (s) 97.4 Sum of lost time (s) 16.0Intersection Capacity Utilization 88.3% ICU Level of Service EAnalysis Period (min) 15c Critical Lane Group

HCM Signalized Intersection Capacity Analysis1: Euclid Ave & SR-94 WB Ramps 2/28/14
Future PM Synchro 8 ReportJAM Page 1
Movement WBL WBR NBT NBR SBL SBTLane ConfigurationsVolume (vph) 186 168 1227 431 0 1652Ideal Flow (vphpl) 1900 1900 1900 1900 1900 1900Total Lost time (s) 4.0 4.0 4.0 4.0 4.0Lane Util. Factor 1.00 1.00 0.95 1.00 0.95Frt 1.00 0.85 1.00 0.85 1.00Flt Protected 0.95 1.00 1.00 1.00 1.00Satd. Flow (prot) 1770 1583 3539 1583 3539Flt Permitted 0.95 1.00 1.00 1.00 1.00Satd. Flow (perm) 1770 1583 3539 1583 3539Peak-hour factor, PHF 0.92 0.92 0.92 0.92 0.92 0.92Adj. Flow (vph) 202 183 1334 468 0 1796RTOR Reduction (vph) 0 73 0 115 0 0Lane Group Flow (vph) 202 110 1334 353 0 1796Turn Type NA Perm NA Perm NAProtected Phases 8 2 6Permitted Phases 8 2Actuated Green, G (s) 16.5 16.5 75.5 75.5 75.5Effective Green, g (s) 16.5 16.5 75.5 75.5 75.5Actuated g/C Ratio 0.16 0.16 0.76 0.76 0.76Clearance Time (s) 4.0 4.0 4.0 4.0 4.0Vehicle Extension (s) 3.0 3.0 3.0 3.0 3.0Lane Grp Cap (vph) 292 261 2671 1195 2671v/s Ratio Prot c0.11 0.38 c0.51v/s Ratio Perm 0.07 0.22v/c Ratio 0.69 0.42 0.50 0.30 0.67Uniform Delay, d1 39.4 37.5 4.8 3.9 6.1Progression Factor 1.00 1.00 0.85 0.57 1.00Incremental Delay, d2 6.9 1.1 0.5 0.5 1.4Delay (s) 46.3 38.6 4.6 2.7 7.5Level of Service D D A A AApproach Delay (s) 42.6 4.1 7.5Approach LOS D A A
Intersection SummaryHCM 2000 Control Delay 9.4 HCM 2000 Level of Service AHCM 2000 Volume to Capacity ratio 0.68Actuated Cycle Length (s) 100.0 Sum of lost time (s) 8.0Intersection Capacity Utilization 62.6% ICU Level of Service BAnalysis Period (min) 15c Critical Lane Group

HCM Signalized Intersection Capacity Analysis2: Euclid Ave & SR-94 EB Ramps 2/28/14
Future PM Synchro 8 ReportJAM Page 2
Movement WBL WBR NBT NBR SBL SBTLane ConfigurationsVolume (vph) 976 742 733 160 200 750Ideal Flow (vphpl) 1900 1900 1900 1900 1900 1900Total Lost time (s) 4.0 4.0 4.0 4.0 4.0Lane Util. Factor 0.97 1.00 0.95 1.00 0.95Frt 1.00 0.85 0.97 1.00 1.00Flt Protected 0.95 1.00 1.00 0.95 1.00Satd. Flow (prot) 3433 1583 3444 1770 3539Flt Permitted 0.95 1.00 1.00 0.95 1.00Satd. Flow (perm) 3433 1583 3444 1770 3539Peak-hour factor, PHF 0.98 0.98 0.98 0.98 0.98 0.98Adj. Flow (vph) 996 757 748 163 204 765RTOR Reduction (vph) 0 19 17 0 0 0Lane Group Flow (vph) 996 738 894 0 204 765Turn Type NA pm+ov NA Prot NAProtected Phases 8 1 2 1 6Permitted Phases 8Actuated Green, G (s) 32.0 51.1 36.9 19.1 60.0Effective Green, g (s) 32.0 51.1 36.9 19.1 60.0Actuated g/C Ratio 0.32 0.51 0.37 0.19 0.60Clearance Time (s) 4.0 4.0 4.0 4.0 4.0Vehicle Extension (s) 3.0 3.0 3.0 3.0 3.0Lane Grp Cap (vph) 1098 872 1270 338 2123v/s Ratio Prot c0.29 c0.16 c0.26 0.12 0.22v/s Ratio Perm 0.30v/c Ratio 0.91 0.85 0.70 0.60 0.36Uniform Delay, d1 32.6 21.1 26.9 37.0 10.2Progression Factor 1.00 1.00 1.00 1.13 1.16Incremental Delay, d2 10.7 7.6 3.3 2.3 0.4Delay (s) 43.3 28.7 30.2 44.2 12.2Level of Service D C C D BApproach Delay (s) 37.0 30.2 18.9Approach LOS D C B
Intersection SummaryHCM 2000 Control Delay 30.5 HCM 2000 Level of Service CHCM 2000 Volume to Capacity ratio 0.83Actuated Cycle Length (s) 100.0 Sum of lost time (s) 12.0Intersection Capacity Utilization 78.0% ICU Level of Service DAnalysis Period (min) 15c Critical Lane Group

HCM Signalized Intersection Capacity Analysis2: Euclid Ave & SR-94 EB Ramps 2/28/14
Future PM Synchro 8 ReportJAM Page 2
Movement WBL WBR NBT NBR SBL SBTLane ConfigurationsVolume (vph) 976 742 733 160 200 750Ideal Flow (vphpl) 1900 1900 1900 1900 1900 1900Total Lost time (s) 4.0 4.0 4.0 4.0 4.0Lane Util. Factor 0.97 1.00 0.95 1.00 0.95Frt 1.00 0.85 0.97 1.00 1.00Flt Protected 0.95 1.00 1.00 0.95 1.00Satd. Flow (prot) 3433 1583 3444 1770 3539Flt Permitted 0.95 1.00 1.00 0.95 1.00Satd. Flow (perm) 3433 1583 3444 1770 3539Peak-hour factor, PHF 0.98 0.98 0.98 0.98 0.98 0.98Adj. Flow (vph) 996 757 748 163 204 765RTOR Reduction (vph) 0 355 18 0 0 0Lane Group Flow (vph) 996 402 893 0 204 765Turn Type NA pm+ov NA Prot NAProtected Phases 8 1 2 1 6Permitted Phases 8Actuated Green, G (s) 28.0 37.0 23.0 9.0 36.0Effective Green, g (s) 28.0 37.0 23.0 9.0 36.0Actuated g/C Ratio 0.28 0.37 0.23 0.09 0.36Clearance Time (s) 4.0 4.0 4.0 4.0 4.0Vehicle Extension (s) 3.0 3.0 3.0 3.0 3.0Lane Grp Cap (vph) 961 649 792 159 1274v/s Ratio Prot c0.29 0.06 c0.26 c0.12 0.22v/s Ratio Perm 0.20v/c Ratio 1.04 0.62 1.13 1.28 0.60Uniform Delay, d1 36.0 25.8 38.5 45.5 26.1Progression Factor 1.00 1.00 1.00 1.06 1.09Incremental Delay, d2 38.9 1.8 72.9 158.3 1.6Delay (s) 74.9 27.5 111.4 206.7 30.1Level of Service E C F F CApproach Delay (s) 54.4 111.4 67.3Approach LOS D F E
Intersection SummaryHCM 2000 Control Delay 72.1 HCM 2000 Level of Service EHCM 2000 Volume to Capacity ratio 0.79Actuated Cycle Length (s) 100.0 Sum of lost time (s) 16.0Intersection Capacity Utilization 78.0% ICU Level of Service DAnalysis Period (min) 15c Critical Lane Group
Pedestrian Phase Actuated on Euclid Ave & SR-94 EB Ramps

HCM Signalized Intersection Capacity Analysis3: Euclid Ave & Hilltop Dr 2/28/14
Future PM Synchro 8 ReportJAM Page 3
Movement EBL EBT EBR WBL WBT WBR NBL NBT NBR SBL SBT SBRLane ConfigurationsVolume (vph) 48 24 48 43 22 43 103 864 62 168 1514 187Ideal Flow (vphpl) 1900 1900 1900 1900 1900 1900 1900 1900 1900 1900 1900 1900Total Lost time (s) 4.5 4.5 4.5 4.5 4.0 4.0 4.0Lane Util. Factor 1.00 1.00 1.00 1.00 0.95 1.00 0.95Frpb, ped/bikes 1.00 1.00 0.98 1.00 1.00 1.00 1.00Flpb, ped/bikes 1.00 1.00 0.99 1.00 1.00 1.00 1.00Frt 1.00 0.90 0.95 1.00 0.99 1.00 0.98Flt Protected 0.95 1.00 0.98 0.95 1.00 0.95 1.00Satd. Flow (prot) 1770 1675 1686 1770 3493 1768 3482Flt Permitted 0.70 1.00 0.84 0.11 1.00 0.22 1.00Satd. Flow (perm) 1310 1675 1439 197 3493 408 3482Peak-hour factor, PHF 0.98 0.98 0.98 0.96 0.98 0.96 0.98 0.96 0.96 0.96 0.96 0.98Adj. Flow (vph) 49 24 49 45 22 45 105 900 65 175 1577 191RTOR Reduction (vph) 0 43 0 0 31 0 0 5 0 0 8 0Lane Group Flow (vph) 49 30 0 0 81 0 105 960 0 175 1760 0Confl. Peds. (#/hr) 16 30 11 11Confl. Bikes (#/hr) 4 2Turn Type Perm NA Perm NA pm+pt NA pm+pt NAProtected Phases 4 8 5 2 1 6Permitted Phases 4 8 2 6Actuated Green, G (s) 8.5 8.5 8.5 41.2 37.8 48.7 41.5Effective Green, g (s) 8.5 8.5 8.5 41.2 39.2 49.5 42.9Actuated g/C Ratio 0.13 0.13 0.13 0.61 0.58 0.73 0.63Clearance Time (s) 4.5 4.5 4.5 4.5 5.4 4.4 5.4Vehicle Extension (s) 3.0 3.0 3.0 3.0 4.1 2.0 4.0Lane Grp Cap (vph) 164 209 180 198 2019 450 2203v/s Ratio Prot 0.02 0.03 0.27 c0.04 c0.51v/s Ratio Perm 0.04 c0.06 0.29 0.24v/c Ratio 0.30 0.14 0.45 0.53 0.48 0.39 0.80Uniform Delay, d1 26.9 26.4 27.5 9.2 8.3 4.0 9.2Progression Factor 1.00 1.00 1.00 1.00 1.00 1.00 1.00Incremental Delay, d2 1.0 0.3 1.8 2.7 0.3 0.2 2.2Delay (s) 28.0 26.7 29.2 11.9 8.6 4.2 11.5Level of Service C C C B A A BApproach Delay (s) 27.2 29.2 8.9 10.8Approach LOS C C A B
Intersection SummaryHCM 2000 Control Delay 11.4 HCM 2000 Level of Service BHCM 2000 Volume to Capacity ratio 0.73Actuated Cycle Length (s) 67.8 Sum of lost time (s) 13.0Intersection Capacity Utilization 81.1% ICU Level of Service DAnalysis Period (min) 15c Critical Lane Group

HCM Signalized Intersection Capacity Analysis4: Euclid Ave & Lise Ave 2/28/14
Future PM Synchro 8 ReportJAM Page 4
Movement EBL EBR NBL NBT SBT SBRLane ConfigurationsVolume (vph) 60 60 39 1130 1357 184Ideal Flow (vphpl) 1900 1900 1900 1900 1900 1900Total Lost time (s) 4.0 4.0 4.0 4.0Lane Util. Factor 1.00 1.00 0.95 0.95Frpb, ped/bikes 1.00 1.00 1.00 1.00Flpb, ped/bikes 1.00 1.00 1.00 1.00Frt 0.93 1.00 1.00 0.98Flt Protected 0.98 0.95 1.00 1.00Satd. Flow (prot) 1695 1768 3539 3460Flt Permitted 0.98 0.10 1.00 1.00Satd. Flow (perm) 1695 185 3539 3460Peak-hour factor, PHF 0.91 0.91 0.91 0.91 0.91 0.91Adj. Flow (vph) 66 66 43 1242 1491 202RTOR Reduction (vph) 18 0 0 0 8 0Lane Group Flow (vph) 114 0 43 1242 1685 0Confl. Peds. (#/hr) 12 12Confl. Bikes (#/hr) 4Turn Type NA Perm NA NAProtected Phases 4 2 6Permitted Phases 2Actuated Green, G (s) 10.2 46.0 46.0 46.0Effective Green, g (s) 10.2 46.0 46.0 46.0Actuated g/C Ratio 0.16 0.72 0.72 0.72Clearance Time (s) 4.0 4.0 4.0 4.0Vehicle Extension (s) 3.0 3.0 3.0 3.0Lane Grp Cap (vph) 269 132 2535 2479v/s Ratio Prot c0.07 0.35 c0.49v/s Ratio Perm 0.23v/c Ratio 0.43 0.33 0.49 0.68Uniform Delay, d1 24.4 3.4 4.0 5.0Progression Factor 1.00 1.00 1.00 1.00Incremental Delay, d2 1.1 1.4 0.1 0.8Delay (s) 25.4 4.8 4.1 5.8Level of Service C A A AApproach Delay (s) 25.4 4.1 5.8Approach LOS C A A
Intersection SummaryHCM 2000 Control Delay 5.9 HCM 2000 Level of Service AHCM 2000 Volume to Capacity ratio 0.63Actuated Cycle Length (s) 64.2 Sum of lost time (s) 8.0Intersection Capacity Utilization 57.2% ICU Level of Service BAnalysis Period (min) 15c Critical Lane Group

HCM Signalized Intersection Capacity Analysis5: Euclid Ave & Guymon St 2/28/14
Future PM Synchro 8 ReportJAM Page 5
Movement EBL EBR NBL NBT SBT SBRLane ConfigurationsVolume (vph) 40 29 37 1081 1405 50Ideal Flow (vphpl) 1900 1900 1900 1900 1900 1900Total Lost time (s) 4.0 4.0 4.0 4.0Lane Util. Factor 1.00 1.00 0.95 0.95Frpb, ped/bikes 0.99 1.00 1.00 1.00Flpb, ped/bikes 1.00 1.00 1.00 1.00Frt 0.94 1.00 1.00 0.99Flt Protected 0.97 0.95 1.00 1.00Satd. Flow (prot) 1698 1770 3539 3511Flt Permitted 0.97 0.95 1.00 1.00Satd. Flow (perm) 1698 1770 3539 3511Peak-hour factor, PHF 0.96 0.96 0.96 0.96 0.96 0.96Adj. Flow (vph) 42 30 39 1126 1464 52RTOR Reduction (vph) 26 0 0 0 3 0Lane Group Flow (vph) 46 0 39 1126 1513 0Confl. Peds. (#/hr) 5 3 39 39Turn Type NA Prot NA NAProtected Phases 4 5 2 6Permitted PhasesActuated Green, G (s) 5.5 4.8 38.1 28.9Effective Green, g (s) 6.4 5.2 39.6 30.4Actuated g/C Ratio 0.12 0.10 0.73 0.56Clearance Time (s) 4.9 4.4 5.5 5.5Vehicle Extension (s) 2.0 2.0 4.1 3.6Lane Grp Cap (vph) 201 170 2595 1976v/s Ratio Prot c0.03 0.02 c0.32 c0.43v/s Ratio Permv/c Ratio 0.23 0.23 0.43 0.77Uniform Delay, d1 21.6 22.5 2.8 9.1Progression Factor 1.00 1.00 1.00 1.00Incremental Delay, d2 0.2 0.3 0.2 1.9Delay (s) 21.8 22.8 3.0 11.0Level of Service C C A BApproach Delay (s) 21.8 3.6 11.0Approach LOS C A B
Intersection SummaryHCM 2000 Control Delay 8.1 HCM 2000 Level of Service AHCM 2000 Volume to Capacity ratio 0.66Actuated Cycle Length (s) 54.0 Sum of lost time (s) 12.0Intersection Capacity Utilization 52.8% ICU Level of Service AAnalysis Period (min) 15c Critical Lane Group

HCM Signalized Intersection Capacity Analysis6: Euclid Ave & Market St 2/28/14
Future PM Synchro 8 ReportJAM Page 6
Movement EBL EBT EBR WBL WBT WBR NBL NBT NBR SBL SBT SBRLane ConfigurationsVolume (vph) 101 349 256 164 139 315 199 633 173 259 1038 65Ideal Flow (vphpl) 1900 1900 1400 1400 1900 1900 1400 1400 1400 1900 1400 1900Total Lost time (s) 4.0 4.0 4.0 4.0 4.0 4.0 4.0 4.0Lane Util. Factor 1.00 0.95 1.00 0.95 1.00 0.95 0.97 0.95Frt 1.00 0.94 1.00 0.90 1.00 0.97 1.00 0.99Flt Protected 0.95 1.00 0.95 1.00 0.95 1.00 0.95 1.00Satd. Flow (prot) 1770 3315 1304 3171 1304 2524 3433 2585Flt Permitted 0.95 1.00 0.95 1.00 0.95 1.00 0.95 1.00Satd. Flow (perm) 1770 3315 1304 3171 1304 2524 3433 2585Peak-hour factor, PHF 0.92 0.92 0.92 0.92 0.92 0.92 0.92 0.92 0.92 0.92 0.92 0.92Adj. Flow (vph) 110 379 278 178 151 342 216 688 188 282 1128 71RTOR Reduction (vph) 0 90 0 0 257 0 0 16 0 0 3 0Lane Group Flow (vph) 110 567 0 178 236 0 216 860 0 282 1196 0Turn Type Prot NA Prot NA Prot NA Prot NAProtected Phases 7 4 3 8 5 2 1 6Permitted PhasesActuated Green, G (s) 13.1 28.5 17.6 32.4 21.6 68.3 14.6 60.5Effective Green, g (s) 13.5 29.4 18.0 33.9 22.0 69.2 15.0 62.2Actuated g/C Ratio 0.09 0.20 0.12 0.23 0.15 0.47 0.10 0.42Clearance Time (s) 4.4 4.9 4.4 5.5 4.4 4.9 4.4 5.7Vehicle Extension (s) 2.0 3.2 2.0 4.5 2.0 5.3 2.0 5.0Lane Grp Cap (vph) 161 660 159 728 194 1183 348 1089v/s Ratio Prot 0.06 c0.17 c0.14 0.07 c0.17 0.34 0.08 c0.46v/s Ratio Permv/c Ratio 0.68 0.86 1.12 0.32 1.11 0.73 0.81 1.10Uniform Delay, d1 65.0 57.1 64.8 47.3 62.8 31.6 64.9 42.7Progression Factor 1.00 1.00 1.00 1.00 1.00 1.00 1.00 1.00Incremental Delay, d2 9.2 10.8 107.0 0.5 98.3 2.9 12.7 58.3Delay (s) 74.1 67.9 171.8 47.8 161.1 34.5 77.6 101.0Level of Service E E F D F C E FApproach Delay (s) 68.8 80.7 59.5 96.5Approach LOS E F E F
Intersection SummaryHCM 2000 Control Delay 78.5 HCM 2000 Level of Service EHCM 2000 Volume to Capacity ratio 1.05Actuated Cycle Length (s) 147.6 Sum of lost time (s) 16.0Intersection Capacity Utilization 100.2% ICU Level of Service GAnalysis Period (min) 15c Critical Lane Group

Sheet No 1 of 2
Project Euclid Ave Corridor Master Plan
Major Street Euclid Avenue ScenarioMinor Street Lise Avenue Peak Hour AM
Turn Movement Volumes Major Street DirectionNB SB EB WB
Left 88 0 62 0 X North/SouthThrough 1,222 686 0 0 East/WestRight 0 152 62 0Total 1,310 838 124 0
* Note: Traffic Volume for Major Street is Total Volume of Both Approches. Traffic Volume for Minor Street is the Volume of High Volume Approach.
Traffic Volume (VPH) * 2,148 124
2 1YES
Number of Approach Lanes
FutureVolumes Under Buildout of Preferred Plan
Major Street Minor Street Warrant MetEuclid Avenue Lise Avenue
0
100
200
300
400
500
300 400 500 600 700 800 900 1000 1100 1200 1300Min
or S
tree
t Hig
her V
olum
e A
ppro
ach
-VPH
Major Street - Total of Both Approaches - Vehicle Per Hour (VPH)
Figure 4C-4Warrant 3, Peak Hour (70% Factor)
(Rural Areas)
*100*75
* Note: 100 VPH APPLIES AS THE LOWER THRESHOLD VOLUME FOR A MINOR STREET APPROACH WITH TWO OR MORE LANES AND 75 VPH APPLIES AS THE LOWER THRESHOLD VOLUME FOR A MINOR STREET APPROACHING WITH ONE LANE.
Source: California Manual on Uniform Traffic Control Devices, Caltrans, 2006
2 or More Lanes & 2 or More Lanes
1 Lane & 1 Lane
2 or More Lanes & 1 Lane

Sheet No 2 of 2
Project Euclid Ave Corridor Master Plan
Major Street Euclid Avenue ScenarioMinor Street Lise Avenue Peak Hour PM
Turn Movement Volumes Major Street DirectionNB SB EB WB
Left 39 0 60 0 X North/SouthThrough 1,130 1,357 0 0 East/WestRight 0 184 60 0Total 1,169 1,541 120 0
FutureVolumes Under Buildout of Preferred Plan
Major Street Minor Street Warrant MetEuclid Avenue Lise Avenue
* Note: Traffic Volume for Major Street is Total Volume of Both Approches. Traffic Volume for Minor Street is the Volume of High Volume Approach.
Traffic Volume (VPH) * 2,710 120
2 1YES
Number of Approach Lanes
0
100
200
300
400
500
300 400 500 600 700 800 900 1000 1100 1200 1300Min
or S
tree
t Hig
her V
olum
e A
ppro
ach
-VPH
Major Street - Total of Both Approaches - Vehicle Per Hour (VPH)
Figure 4C-4Warrant 3, Peak Hour (70% Factor)
(Rural Areas)
*100*75
* Note: 100 VPH APPLIES AS THE LOWER THRESHOLD VOLUME FOR A MINOR STREET APPROACH WITH TWO OR MORE LANES AND 75 VPH APPLIES AS THE LOWER THRESHOLD VOLUME FOR A MINOR STREET APPROACHING WITH ONE LANE.
Source: California Manual on Uniform Traffic Control Devices, Caltrans, 2006
2 or More Lanes & 2 or More Lanes
1 Lane & 1 Lane
2 or More Lanes & 1 Lane

APPENDIX G: TRANSIT LEVEL OF SERVICE WORKSHEETS

_____________________________________________________________________________________________________________________________
C. Compute Transit LOS
Street: Euclid Ave
1. Input Data Central Bus Transit On-Time Stops with Stops with Pk Load Business Stops Frequency Performance Shelter Bench Factor District Segment (#) (bus/hr) (%) (%) (%) (p/seat) 1 1 6 82% 100% 100% 0.71 No 2 0 6 82% 0% 0% 0.71 No 3 1 6 82% 100% 100% 0.78 No 4 0 6 82% 0% 0% 0.78 No 5 0 6 82% 0% 0% 0.78 No 6 0 6 82% 0% 0% 0.78 No
Population 5 million or more: No
2. Compute Average Transit Travel Speed Transit Accel Passenger Total Transit Transit Segment Running Decel Service Re-entry Stop Running Delay at Travel Length Speed Delay Delay Delay Delay Time Intrsctn Speed Segment (ft) (mph) (sec) (sec) (sec) (sec) (sec) (sec) (mph) 1 719 20.9 5.1 13.2 5.0 23.3 46.7 8.2 8.9 2 502 24.5 9.0 0.0 0.0 9.0 13.9 5.7 17.4 3 469 10.9 1.8 9.2 5.0 16.0 45.4 5.3 6.3 4 704 21.1 7.7 0.0 0.0 7.7 22.8 8.0 15.6 5 617 27.4 10.1 0.0 0.0 10.1 15.3 7.0 18.8 6 948 33.6 12.3 0.0 0.0 12.3 19.3 10.8 21.5 Total/Avg 3959 13.0
3. Compute Transit Level of Service Perceived Transit Pedestrian Transit Headway Trvl Time Wait-Ride Link LOS LOS Transit Segment Factor Factor Score Score Score LOS 1 3.1498 0.8151 2.5675 1.84 2.43 B 2 3.1498 0.9979 3.1433 1.79 1.55 A 3 3.1498 0.7187 2.2638 1.50 2.83 C 4 3.1498 0.9605 3.0252 2.03 1.77 A 5 3.1498 1.0248 3.2280 3.01 1.61 A 6 3.1498 1.0716 3.3752 2.12 1.25 A Average 1.84 A
Euclid Avenue (NB) 2035 AM Peak

_____________________________________________________________________________________________________________________________
C. Compute Transit LOS
Street: Euclid Ave
1. Input Data Central Bus Transit On-Time Stops with Stops with Pk Load Business Stops Frequency Performance Shelter Bench Factor District Segment (#) (bus/hr) (%) (%) (%) (p/seat) 1 1 5 86% 100% 100% 0.66 No 2 0 5 86% 0% 0% 0.66 No 3 1 5 86% 100% 100% 0.76 No 4 0 5 86% 0% 0% 0.76 No 5 1 5 86% 100% 100% 0.77 No 6 0 5 86% 0% 0% 0.77 No
Population 5 million or more: No
2. Compute Average Transit Travel Speed Transit Accel Passenger Total Transit Transit Segment Running Decel Service Re-entry Stop Running Delay at Travel Length Speed Delay Delay Delay Delay Time Intrsctn Speed Segment (ft) (mph) (sec) (sec) (sec) (sec) (sec) (sec) (mph) 1 742 21.7 7.9 20.0 5.0 32.9 56.3 8.4 7.8 2 888 32.8 12.0 0.0 0.0 12.0 18.5 10.1 21.2 3 700 20.3 3.4 9.0 5.0 17.4 40.8 8.0 9.8 4 466 23.5 8.6 0.0 0.0 8.6 13.5 5.3 16.9 5 500 12.4 1.9 8.4 5.0 15.3 42.9 5.7 7.0 6 671 28.7 3.2 0.0 0.0 3.2 15.9 7.6 19.4 Total/Avg 3967 11.6
3. Compute Transit Level of Service Perceived Transit Pedestrian Transit Headway Trvl Time Wait-Ride Link LOS LOS Transit Segment Factor Factor Score Score Score LOS 1 3.0028 0.7840 2.3543 3.58 3.01 C 2 3.0028 1.0956 3.2898 2.63 1.46 A 3 3.0028 0.8559 2.5701 2.09 2.46 B 4 3.0028 1.0102 3.0335 1.79 1.72 A 5 3.0028 0.7532 2.2619 1.80 2.88 C 6 3.0028 1.0620 3.1890 2.09 1.53 A Average 2.15 B
Euclid Avenue (SB) 2035 AM Peak

_____________________________________________________________________________________________________________________________
C. Compute Transit LOS
Street: Euclid Ave
1. Input Data Central Bus Transit On-Time Stops with Stops with Pk Load Business Stops Frequency Performance Shelter Bench Factor District Segment (#) (bus/hr) (%) (%) (%) (p/seat) 1 1 6 82% 100% 100% 0.71 No 2 0 6 82% 0% 0% 0.71 No 3 1 6 82% 100% 100% 0.78 No 4 0 6 82% 0% 0% 0.78 No 5 0 6 82% 0% 0% 0.78 No 6 0 6 82% 0% 0% 0.78 No
Population 5 million or more: No
2. Compute Average Transit Travel Speed Transit Accel Passenger Total Transit Transit Segment Running Decel Service Re-entry Stop Running Delay at Travel Length Speed Delay Delay Delay Delay Time Intrsctn Speed Segment (ft) (mph) (sec) (sec) (sec) (sec) (sec) (sec) (mph) 1 719 20.9 5.6 14.6 5.0 25.2 48.6 8.2 8.6 2 502 24.6 9.0 0.0 0.0 9.0 13.9 5.7 17.5 3 469 10.9 2.3 11.6 5.0 18.9 48.3 5.3 6.0 4 704 22.3 8.2 0.0 0.0 8.2 21.5 8.0 16.3 5 617 27.2 10.0 0.0 0.0 10.0 15.5 7.0 18.7 6 948 33.6 12.3 0.0 0.0 12.3 19.3 10.8 21.5 Total/Avg 3959 12.7
3. Compute Transit Level of Service Perceived Transit Pedestrian Transit Headway Trvl Time Wait-Ride Link LOS LOS Transit Segment Factor Factor Score Score Score LOS 1 3.1498 0.8046 2.5343 1.72 2.46 B 2 3.1498 0.9987 3.1457 1.69 1.53 A 3 3.1498 0.7054 2.2219 1.40 2.88 C 4 3.1498 0.9747 3.0702 1.96 1.69 A 5 3.1498 1.0225 3.2207 3.32 1.67 A 6 3.1498 1.0716 3.3752 2.12 1.25 A Average 1.84 A
Euclid Avenue (NB) 2035 PM Peak
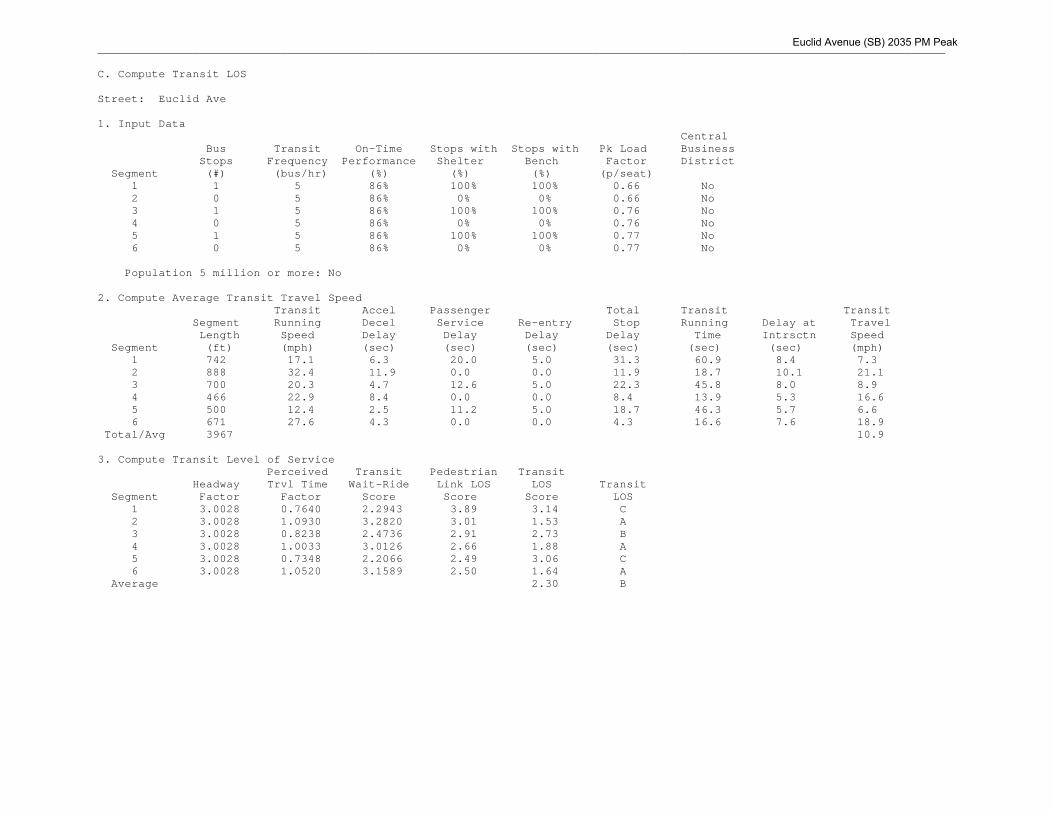
_____________________________________________________________________________________________________________________________
C. Compute Transit LOS
Street: Euclid Ave
1. Input Data Central Bus Transit On-Time Stops with Stops with Pk Load Business Stops Frequency Performance Shelter Bench Factor District Segment (#) (bus/hr) (%) (%) (%) (p/seat) 1 1 5 86% 100% 100% 0.66 No 2 0 5 86% 0% 0% 0.66 No 3 1 5 86% 100% 100% 0.76 No 4 0 5 86% 0% 0% 0.76 No 5 1 5 86% 100% 100% 0.77 No 6 0 5 86% 0% 0% 0.77 No
Population 5 million or more: No
2. Compute Average Transit Travel Speed Transit Accel Passenger Total Transit Transit Segment Running Decel Service Re-entry Stop Running Delay at Travel Length Speed Delay Delay Delay Delay Time Intrsctn Speed Segment (ft) (mph) (sec) (sec) (sec) (sec) (sec) (sec) (mph) 1 742 17.1 6.3 20.0 5.0 31.3 60.9 8.4 7.3 2 888 32.4 11.9 0.0 0.0 11.9 18.7 10.1 21.1 3 700 20.3 4.7 12.6 5.0 22.3 45.8 8.0 8.9 4 466 22.9 8.4 0.0 0.0 8.4 13.9 5.3 16.6 5 500 12.4 2.5 11.2 5.0 18.7 46.3 5.7 6.6 6 671 27.6 4.3 0.0 0.0 4.3 16.6 7.6 18.9 Total/Avg 3967 10.9
3. Compute Transit Level of Service Perceived Transit Pedestrian Transit Headway Trvl Time Wait-Ride Link LOS LOS Transit Segment Factor Factor Score Score Score LOS 1 3.0028 0.7640 2.2943 3.89 3.14 C 2 3.0028 1.0930 3.2820 3.01 1.53 A 3 3.0028 0.8238 2.4736 2.91 2.73 B 4 3.0028 1.0033 3.0126 2.66 1.88 A 5 3.0028 0.7348 2.2066 2.49 3.06 C 6 3.0028 1.0520 3.1589 2.50 1.64 A Average 2.30 B
Euclid Avenue (SB) 2035 PM Peak

APPENDIX H: BICYCLE LEVEL OF SERVICE WORKSHEETS

_____________________________________________________________________________________________________________________________
D. Compute Bicycle LOS
Street: Euclid Ave
1. Geometric Input Data Segment Intrsctn Segment & Outside Bike/Shldr Through Through Divided/ Signal I/S Unsig Conf Shldr Bike Downstream Lane Width Lane Width Lanes Lanes Undivided Cross Dist Per Mile Width Lane Width Signal (ft) (ft) (One-Dir) (One-Dir) (D / UD) (ft) (conf/mi) (ft) (ft) 1 11.0 14.5 2 2 D 39.0 0.0 7.5 7.0 2 11.0 14.5 2 2 D 44.0 0.0 7.5 7.0 3 11.0 14.5 2 2 D 49.0 0.0 7.5 7.0 4 11.0 14.5 2 2 D 14.0 0.0 7.5 7.0 5 10.0 7.0 2 2 D 46.0 0.0 0.0 7.0 6 13.0 0.0 3 2 D 84.0 0.0 0.0 0.0
2. Performance and Other Input Data Segment & Traffic Heavy Percent Pavement Downstream Volume Vehicle On-street Rating Signal (vph pk 15) (%) Parking (#) 1 1247 2% 90% 4.0 2 1294 2% 90% 4.0 3 1057 2% 90% 4.0 4 1559 2% 90% 4.0 5 1126 2% 0% 4.0 6 0 0% 0% 3.0 Pavement Rating: 1=Poor, 5=ExcellentMid-segment traffic speed = average of auto free-flow speed, and mean auto speed with intersection delay.
3. HCM 2010 Bicycle LOS Bicycle Bicycle Bicycle Bicycle Bicycle Segment & Running Delay at Running Travel Intrsctn Bicycle Downstream Speed Intrsctn Time Speed LOS Intrsctn Intrsctn (mph) (sec) (sec) (mph) Score LOS 1 15.0 3.8 32.7 13.5 1.8990 A 2 15.0 3.5 22.8 13.0 2.0143 B 3 15.0 8.7 21.3 10.6 1.8946 A 4 15.0 10.1 32.0 11.4 1.7739 A 5 15.0 2.4 28.0 13.8 2.1200 B 6 15.0 50.0 43.1 6.9 2.6304 B Average 10.4
Segment & Outside Paved Outside Tot Width Eff Width Adjstd Thru Cntrl Link Segment Downstream Lane Width Shoulder Th+BL+Shldr Th+BL+Shldr OS Thru HV % Delay LOS Link LOS Segment Intrsctn (ft) Wos (ft) Wt (ft) Wv (ft) We (ft) (%) (sec) Score LOS Score LOS 1 11.0 6.0 18.0 18.0 13.0 2.0% 6.3 3.8778 D 3.5439 D 2 11.0 6.0 18.0 18.0 13.0 2.0% 6.0 3.6624 D 3.5184 D 3 11.0 6.0 18.0 18.0 13.0 2.0% 13.0 3.4815 C 3.4802 C 4 11.0 6.0 18.0 18.0 13.0 2.0% 13.0 3.2838 C 4.7527 E 5 10.0 0.0 17.0 17.0 24.0 2.0% 0.2 1.7171 A 3.2164 C 6 13.0 0.0 13.0 13.0 13.0 0.0% NaN 1.4422 A 3.8182 D Average 3.7627 D
Euclid Avenue (NB) 2035 AM Peak

_____________________________________________________________________________________________________________________________
D. Compute Bicycle LOS
Street: Euclid Ave
1. Geometric Input Data Segment Intrsctn Segment & Outside Bike/Shldr Through Through Divided/ Signal I/S Unsig Conf Shldr Bike Downstream Lane Width Lane Width Lanes Lanes Undivided Cross Dist Per Mile Width Lane Width Signal (ft) (ft) (One-Dir) (One-Dir) (D / UD) (ft) (conf/mi) (ft) (ft) 1 14.0 0.0 2 2 D 14.0 0.0 0.0 0.0 2 10.0 7.0 2 2 D 14.0 0.0 0.0 7.0 3 11.0 7.0 2 2 D 49.0 0.0 0.0 7.0 4 11.0 7.0 2 2 D 44.0 0.0 0.0 7.0 5 11.0 7.0 2 2 D 39.0 0.0 0.0 7.0 6 11.0 7.0 2 2 D 89.0 0.0 0.0 7.0
2. Performance and Other Input Data Segment & Traffic Heavy Percent Pavement Downstream Volume Vehicle On-street Rating Signal (vph pk 15) (%) Parking (#) 1 1516 2% 0% 3.0 2 680 2% 0% 4.0 3 996 2% 0% 4.0 4 828 2% 0% 4.0 5 815 2% 0% 4.0 6 998 2% 0% 4.0 Pavement Rating: 1=Poor, 5=ExcellentMid-segment traffic speed = average of auto free-flow speed, and mean auto speed with intersection delay.
3. HCM 2010 Bicycle LOS Bicycle Bicycle Bicycle Bicycle Bicycle Segment & Running Delay at Running Travel Intrsctn Bicycle Downstream Speed Intrsctn Time Speed LOS Intrsctn Intrsctn (mph) (sec) (sec) (mph) Score LOS 1 15.0 2.4 33.7 14.0 2.5955 B 2 15.0 3.9 40.4 13.7 1.2627 A 3 15.0 9.1 31.8 11.7 1.8442 A 4 15.0 3.5 21.2 12.9 1.6292 A 5 15.0 10.9 22.7 10.1 1.5427 A 6 15.0 27.0 30.5 8.0 2.4586 B Average 11.4
Segment & Outside Paved Outside Tot Width Eff Width Adjstd Thru Cntrl Link Segment Downstream Lane Width Shoulder Th+BL+Shldr Th+BL+Shldr OS Thru HV % Delay LOS Link LOS Segment Intrsctn (ft) Wos (ft) Wt (ft) Wv (ft) We (ft) (%) (sec) Score LOS Score LOS 1 14.0 0.0 14.0 14.0 14.0 2.0% 0.8 3.8716 D 4.6131 E 2 10.0 0.0 17.0 17.0 24.0 2.0% 1.0 1.6370 A 3.1508 C 3 11.0 0.0 18.0 18.0 25.0 2.0% 12.9 1.4521 A 3.1519 C 4 11.0 0.0 18.0 18.0 25.0 2.0% 4.6 1.0745 A 3.0780 C 5 11.0 0.0 18.0 18.0 25.0 2.0% 15.0 1.1696 A 3.0886 C 6 11.0 0.0 18.0 18.0 25.0 2.0% 37.7 1.4623 A 3.4879 C Average 3.4651 C
Euclid Avenue (SB) 2035 AM Peak

_____________________________________________________________________________________________________________________________
D. Compute Bicycle LOS
Street: Euclid Ave
1. Geometric Input Data Segment Intrsctn Segment & Outside Bike/Shldr Through Through Divided/ Signal I/S Unsig Conf Shldr Bike Downstream Lane Width Lane Width Lanes Lanes Undivided Cross Dist Per Mile Width Lane Width Signal (ft) (ft) (One-Dir) (One-Dir) (D / UD) (ft) (conf/mi) (ft) (ft) 1 11.0 14.5 2 2 D 39.0 0.0 7.5 7.0 2 11.0 14.5 2 2 D 44.0 0.0 7.5 7.0 3 11.0 14.5 2 2 D 49.0 0.0 7.5 7.0 4 11.0 14.5 2 2 D 14.0 0.0 7.5 7.0 5 10.0 7.0 2 2 D 46.0 0.0 0.0 7.0 6 13.0 0.0 3 2 D 84.0 0.0 0.0 0.0
2. Performance and Other Input Data Segment & Traffic Heavy Percent Pavement Downstream Volume Vehicle On-street Rating Signal (vph pk 15) (%) Parking (#) 1 1133 2% 90% 4.0 2 1202 2% 90% 4.0 3 960 2% 90% 4.0 4 1479 2% 90% 4.0 5 1402 2% 0% 4.0 6 0 0% 0% 3.0 Pavement Rating: 1=Poor, 5=ExcellentMid-segment traffic speed = average of auto free-flow speed, and mean auto speed with intersection delay.
3. HCM 2010 Bicycle LOS Bicycle Bicycle Bicycle Bicycle Bicycle Segment & Running Delay at Running Travel Intrsctn Bicycle Downstream Speed Intrsctn Time Speed LOS Intrsctn Intrsctn (mph) (sec) (sec) (mph) Score LOS 1 15.0 2.9 32.7 13.8 1.8050 A 2 15.0 2.9 22.8 13.3 1.9378 A 3 15.0 7.9 21.3 10.9 1.8150 A 4 15.0 19.8 32.0 9.3 1.7078 A 5 15.0 2.9 28.0 13.6 2.3477 B 6 15.0 50.0 43.1 6.9 2.6304 B Average 10.1
Segment & Outside Paved Outside Tot Width Eff Width Adjstd Thru Cntrl Link Segment Downstream Lane Width Shoulder Th+BL+Shldr Th+BL+Shldr OS Thru HV % Delay LOS Link LOS Segment Intrsctn (ft) Wos (ft) Wt (ft) Wv (ft) We (ft) (%) (sec) Score LOS Score LOS 1 11.0 6.0 18.0 18.0 13.0 2.0% 4.7 3.8332 D 3.5302 D 2 11.0 6.0 18.0 18.0 13.0 2.0% 4.9 3.6302 D 3.5072 D 3 11.0 6.0 18.0 18.0 13.0 2.0% 10.8 3.4393 C 3.4678 C 4 11.0 6.0 18.0 18.0 13.0 2.0% 40.3 3.5115 D 4.7850 E 5 10.0 0.0 17.0 17.0 24.0 2.0% 0.4 1.8165 A 3.2557 C 6 13.0 0.0 13.0 13.0 13.0 0.0% NaN 1.4422 A 3.8182 D Average 3.7692 D
Euclid Avenue (NB) 2035 PM Peak
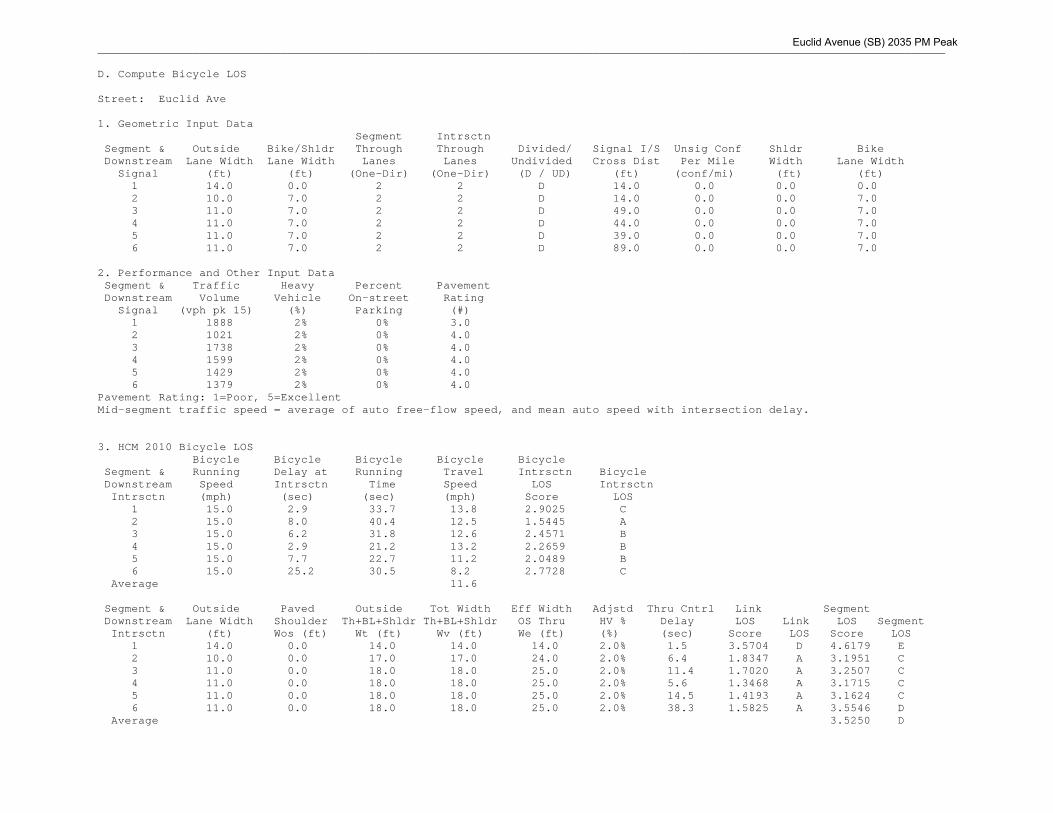
_____________________________________________________________________________________________________________________________
D. Compute Bicycle LOS
Street: Euclid Ave
1. Geometric Input Data Segment Intrsctn Segment & Outside Bike/Shldr Through Through Divided/ Signal I/S Unsig Conf Shldr Bike Downstream Lane Width Lane Width Lanes Lanes Undivided Cross Dist Per Mile Width Lane Width Signal (ft) (ft) (One-Dir) (One-Dir) (D / UD) (ft) (conf/mi) (ft) (ft) 1 14.0 0.0 2 2 D 14.0 0.0 0.0 0.0 2 10.0 7.0 2 2 D 14.0 0.0 0.0 7.0 3 11.0 7.0 2 2 D 49.0 0.0 0.0 7.0 4 11.0 7.0 2 2 D 44.0 0.0 0.0 7.0 5 11.0 7.0 2 2 D 39.0 0.0 0.0 7.0 6 11.0 7.0 2 2 D 89.0 0.0 0.0 7.0
2. Performance and Other Input Data Segment & Traffic Heavy Percent Pavement Downstream Volume Vehicle On-street Rating Signal (vph pk 15) (%) Parking (#) 1 1888 2% 0% 3.0 2 1021 2% 0% 4.0 3 1738 2% 0% 4.0 4 1599 2% 0% 4.0 5 1429 2% 0% 4.0 6 1379 2% 0% 4.0 Pavement Rating: 1=Poor, 5=ExcellentMid-segment traffic speed = average of auto free-flow speed, and mean auto speed with intersection delay.
3. HCM 2010 Bicycle LOS Bicycle Bicycle Bicycle Bicycle Bicycle Segment & Running Delay at Running Travel Intrsctn Bicycle Downstream Speed Intrsctn Time Speed LOS Intrsctn Intrsctn (mph) (sec) (sec) (mph) Score LOS 1 15.0 2.9 33.7 13.8 2.9025 C 2 15.0 8.0 40.4 12.5 1.5445 A 3 15.0 6.2 31.8 12.6 2.4571 B 4 15.0 2.9 21.2 13.2 2.2659 B 5 15.0 7.7 22.7 11.2 2.0489 B 6 15.0 25.2 30.5 8.2 2.7728 C Average 11.6
Segment & Outside Paved Outside Tot Width Eff Width Adjstd Thru Cntrl Link Segment Downstream Lane Width Shoulder Th+BL+Shldr Th+BL+Shldr OS Thru HV % Delay LOS Link LOS Segment Intrsctn (ft) Wos (ft) Wt (ft) Wv (ft) We (ft) (%) (sec) Score LOS Score LOS 1 14.0 0.0 14.0 14.0 14.0 2.0% 1.5 3.5704 D 4.6179 E 2 10.0 0.0 17.0 17.0 24.0 2.0% 6.4 1.8347 A 3.1951 C 3 11.0 0.0 18.0 18.0 25.0 2.0% 11.4 1.7020 A 3.2507 C 4 11.0 0.0 18.0 18.0 25.0 2.0% 5.6 1.3468 A 3.1715 C 5 11.0 0.0 18.0 18.0 25.0 2.0% 14.5 1.4193 A 3.1624 C 6 11.0 0.0 18.0 18.0 25.0 2.0% 38.3 1.5825 A 3.5546 D Average 3.5250 D
Euclid Avenue (SB) 2035 PM Peak

APPENDIX I: PEDESTRIAN LEVEL OF SERVICE WORKSHEETS

_____________________________________________________________________________________________________________________________
B. Pedestrian LOS
Street: Euclid Ave
1. Pedestrian Flow and Density Sidewalk Ped Glogal Segment Adj'd Space Per Segment Width Flow Growth Growth Ped Flow Ped (ft) (pph) Factor Factor (pph) (sqft/ped) 1 8 0 1.000 1.000 0 Infinity 2 8 0 1.000 1.000 0 Infinity 3 8 0 1.000 1.000 0 Infinity 4 8 0 1.000 1.000 0 Infinity 5 5 0 1.000 1.000 0 Infinity 6 5 0 1.000 1.000 0 Infinity
2. Compute Pedestrian Intersection LOS Ped Pedestrian Delay at Intersection Free-Flow Effective Walk Parallel Nearest Mid-Seg Ped Travel Ped Intrsctn Ped Intrsctn Segment Walk Speed SW Width Speed Path Sig-Cntrl Crossing Speed Cross Street Xing Segment Xing (ft/sec) (ft) (ft/s) (sec) (sec) (sec) (ft/s) Score LOS Score LOS 1 4.40 8.00 4.40 25.9 25.9 141.7 3.80 1.70 A 2.29 B 2 4.40 8.00 4.40 23.4 23.4 158.7 3.65 1.70 A 2.28 B 3 4.40 8.00 4.40 23.4 23.4 106.9 3.61 1.70 A 2.28 B 4 4.40 8.00 4.40 43.2 43.2 282.8 3.46 1.43 A 2.31 B 5 4.40 3.50 4.40 43.2 50.0 47755.9 3.36 1.43 A 2.15 B 6 4.40 3.50 4.40 50.0 50.0 0.0 3.57 2.47 B 2.47 B
3. Compute Pedestrian Link LOS Outside Wos Wv W1 Ped Ped Segment lane BL+Shldr Barrier Fw Fs Fv Link Link (ft) (ft) (ft) (ft) (ft/tree) LOS Score LOS 1 11.0 6.0 18.0 10.0 0.0 -5.9661 0.3442 1.4190 1.84 A 2 11.0 6.0 18.0 10.0 0.0 -5.9661 0.2409 1.4724 1.79 A 3 11.0 6.0 18.0 10.0 0.0 -5.9661 0.2223 1.2019 1.50 A 4 11.0 6.0 18.0 10.0 0.0 -5.9661 0.1774 1.7738 2.03 B 5 10.0 0.0 17.0 7.0 0.0 -4.6172 0.3013 1.2803 3.01 C 6 13.0 0.0 13.0 0.0 0.0 -4.3820 0.4503 0.0000 2.12 B
4. Compute Pedestrian Segment LOS Segment & Ped Ped Downstream Segment Segment Intrsctn RCDF LOS Score LOS 1 1.00 2.57 B 2 0.97 2.48 B 3 0.98 2.42 B 4 1.20 3.08 C 5 1.20 3.45 C 6 1.20 3.39 C Average 2.97 C
5. Non-signalized Pedestrian Crossing Calculations ------------------------------------------- Stage 1 ------------------------------------------- Crossing Through Critical Veh Flow Prob of Avg Ped Non-zero Veh Yield Segment Two-stage Length Lanes Headway Rate Delayed Gap Delay Gap Delay Reduction Crossing (ft) (#) (sec) (veh/sec) Crossing (sec) (sec) (sec)
Euclid Avenue (NB) 2035 AM Peak

1 Yes 35.5 2 11.07 0.347 0.9784 119.7 122.3 119.7 2 Yes 35.5 2 11.07 0.360 0.9813 134.9 137.5 134.9 3 Yes 35.5 2 11.07 0.294 0.9612 73.3 76.2 73.3 4 Yes 35.5 2 11.07 0.433 0.9917 265.6 267.8 265.6 5 No 58 4 16.18 0.638 1.0000 47755.9 47757.4 47757.4 6 Yes 38 3 11.64 0.000 0.0000 NaN 0.0 0.0
Motorist ------------------------------------------- Stage 2 ------------------------------------------- Yield Crossing Through Critical Veh Flow Prob of Avg Ped Non-zero Veh Yield Segment Rate Length Lanes Headway Rate Delayed Gap Delay Gap Delay Reduction (ft) (#) (sec) (veh/sec) Crossing (sec) (sec) (sec) 1 0.000 28 2 9.36 0.222 0.8744 22.0 25.2 22.0 2 0.000 28 2 9.36 0.230 0.8838 23.7 26.8 23.7 3 0.000 28 2 9.36 0.271 0.9209 33.6 36.5 33.6 4 0.000 28 2 9.36 0.195 0.8383 17.3 20.6 17.3 5 0.000 0 0 0.00 0.000 0.0000 0.0 0.0 0.0 6 0.000 26 2 8.91 0.000 0.0000 0.0 0.0 0.0
6. Non-signalized Pedestrian Crossing LOS Average Pedestrian Downstream Ped Delay Intrsectn Intrsctn (sec) LOS 1 141.7 F 2 158.7 F 3 106.9 F 4 282.8 F 5 47755.9 F 6 0.0 A
Euclid Avenue (NB) 2035 AM Peak
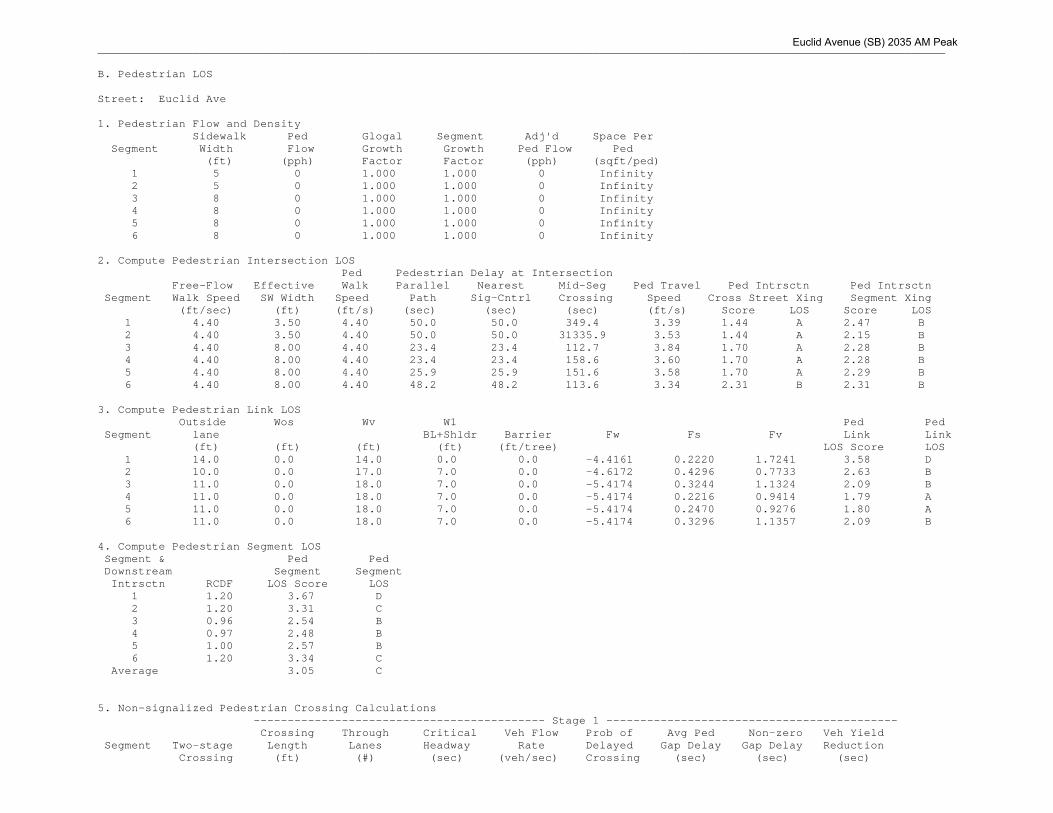
_____________________________________________________________________________________________________________________________
B. Pedestrian LOS
Street: Euclid Ave
1. Pedestrian Flow and Density Sidewalk Ped Glogal Segment Adj'd Space Per Segment Width Flow Growth Growth Ped Flow Ped (ft) (pph) Factor Factor (pph) (sqft/ped) 1 5 0 1.000 1.000 0 Infinity 2 5 0 1.000 1.000 0 Infinity 3 8 0 1.000 1.000 0 Infinity 4 8 0 1.000 1.000 0 Infinity 5 8 0 1.000 1.000 0 Infinity 6 8 0 1.000 1.000 0 Infinity
2. Compute Pedestrian Intersection LOS Ped Pedestrian Delay at Intersection Free-Flow Effective Walk Parallel Nearest Mid-Seg Ped Travel Ped Intrsctn Ped Intrsctn Segment Walk Speed SW Width Speed Path Sig-Cntrl Crossing Speed Cross Street Xing Segment Xing (ft/sec) (ft) (ft/s) (sec) (sec) (sec) (ft/s) Score LOS Score LOS 1 4.40 3.50 4.40 50.0 50.0 349.4 3.39 1.44 A 2.47 B 2 4.40 3.50 4.40 50.0 50.0 31335.9 3.53 1.44 A 2.15 B 3 4.40 8.00 4.40 23.4 23.4 112.7 3.84 1.70 A 2.28 B 4 4.40 8.00 4.40 23.4 23.4 158.6 3.60 1.70 A 2.28 B 5 4.40 8.00 4.40 25.9 25.9 151.6 3.58 1.70 A 2.29 B 6 4.40 8.00 4.40 48.2 48.2 113.6 3.34 2.31 B 2.31 B
3. Compute Pedestrian Link LOS Outside Wos Wv W1 Ped Ped Segment lane BL+Shldr Barrier Fw Fs Fv Link Link (ft) (ft) (ft) (ft) (ft/tree) LOS Score LOS 1 14.0 0.0 14.0 0.0 0.0 -4.4161 0.2220 1.7241 3.58 D 2 10.0 0.0 17.0 7.0 0.0 -4.6172 0.4296 0.7733 2.63 B 3 11.0 0.0 18.0 7.0 0.0 -5.4174 0.3244 1.1324 2.09 B 4 11.0 0.0 18.0 7.0 0.0 -5.4174 0.2216 0.9414 1.79 A 5 11.0 0.0 18.0 7.0 0.0 -5.4174 0.2470 0.9276 1.80 A 6 11.0 0.0 18.0 7.0 0.0 -5.4174 0.3296 1.1357 2.09 B
4. Compute Pedestrian Segment LOS Segment & Ped Ped Downstream Segment Segment Intrsctn RCDF LOS Score LOS 1 1.20 3.67 D 2 1.20 3.31 C 3 0.96 2.54 B 4 0.97 2.48 B 5 1.00 2.57 B 6 1.20 3.34 C Average 3.05 C
5. Non-signalized Pedestrian Crossing Calculations ------------------------------------------- Stage 1 ------------------------------------------- Crossing Through Critical Veh Flow Prob of Avg Ped Non-zero Veh Yield Segment Two-stage Length Lanes Headway Rate Delayed Gap Delay Gap Delay Reduction Crossing (ft) (#) (sec) (veh/sec) Crossing (sec) (sec) (sec)
Euclid Avenue (SB) 2035 AM Peak
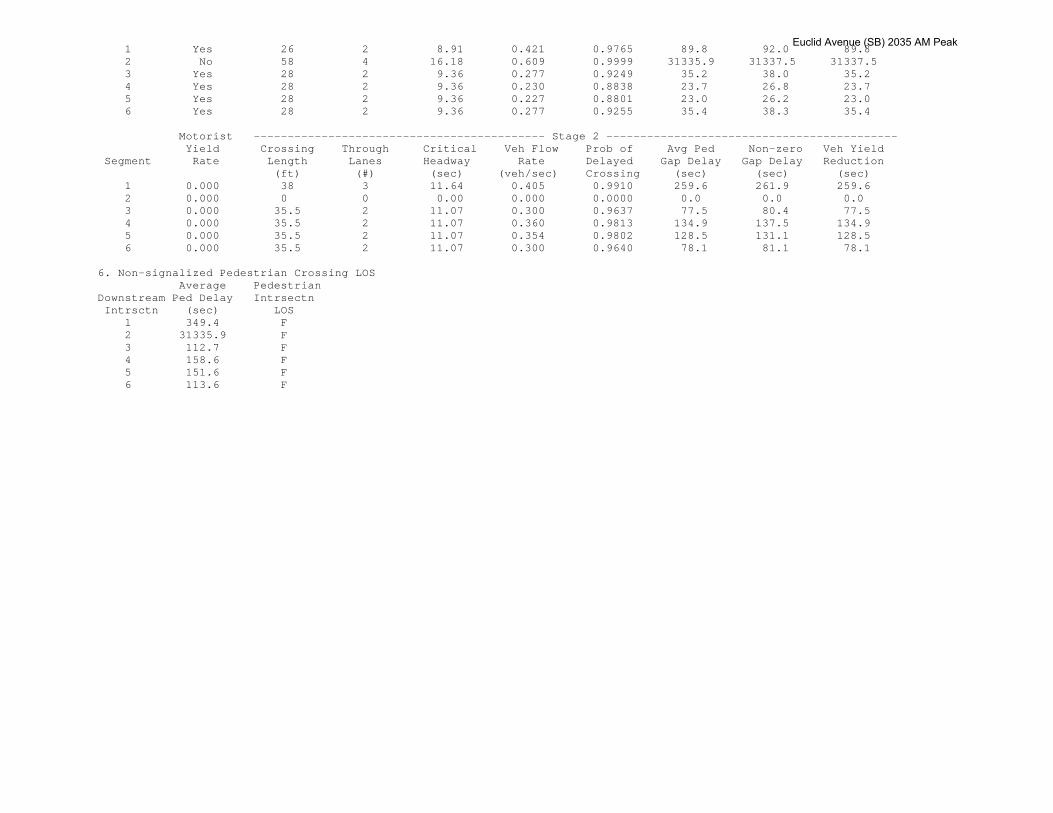
1 Yes 26 2 8.91 0.421 0.9765 89.8 92.0 89.8 2 No 58 4 16.18 0.609 0.9999 31335.9 31337.5 31337.5 3 Yes 28 2 9.36 0.277 0.9249 35.2 38.0 35.2 4 Yes 28 2 9.36 0.230 0.8838 23.7 26.8 23.7 5 Yes 28 2 9.36 0.227 0.8801 23.0 26.2 23.0 6 Yes 28 2 9.36 0.277 0.9255 35.4 38.3 35.4
Motorist ------------------------------------------- Stage 2 ------------------------------------------- Yield Crossing Through Critical Veh Flow Prob of Avg Ped Non-zero Veh Yield Segment Rate Length Lanes Headway Rate Delayed Gap Delay Gap Delay Reduction (ft) (#) (sec) (veh/sec) Crossing (sec) (sec) (sec) 1 0.000 38 3 11.64 0.405 0.9910 259.6 261.9 259.6 2 0.000 0 0 0.00 0.000 0.0000 0.0 0.0 0.0 3 0.000 35.5 2 11.07 0.300 0.9637 77.5 80.4 77.5 4 0.000 35.5 2 11.07 0.360 0.9813 134.9 137.5 134.9 5 0.000 35.5 2 11.07 0.354 0.9802 128.5 131.1 128.5 6 0.000 35.5 2 11.07 0.300 0.9640 78.1 81.1 78.1
6. Non-signalized Pedestrian Crossing LOS Average Pedestrian Downstream Ped Delay Intrsectn Intrsctn (sec) LOS 1 349.4 F 2 31335.9 F 3 112.7 F 4 158.6 F 5 151.6 F 6 113.6 F
Euclid Avenue (SB) 2035 AM Peak
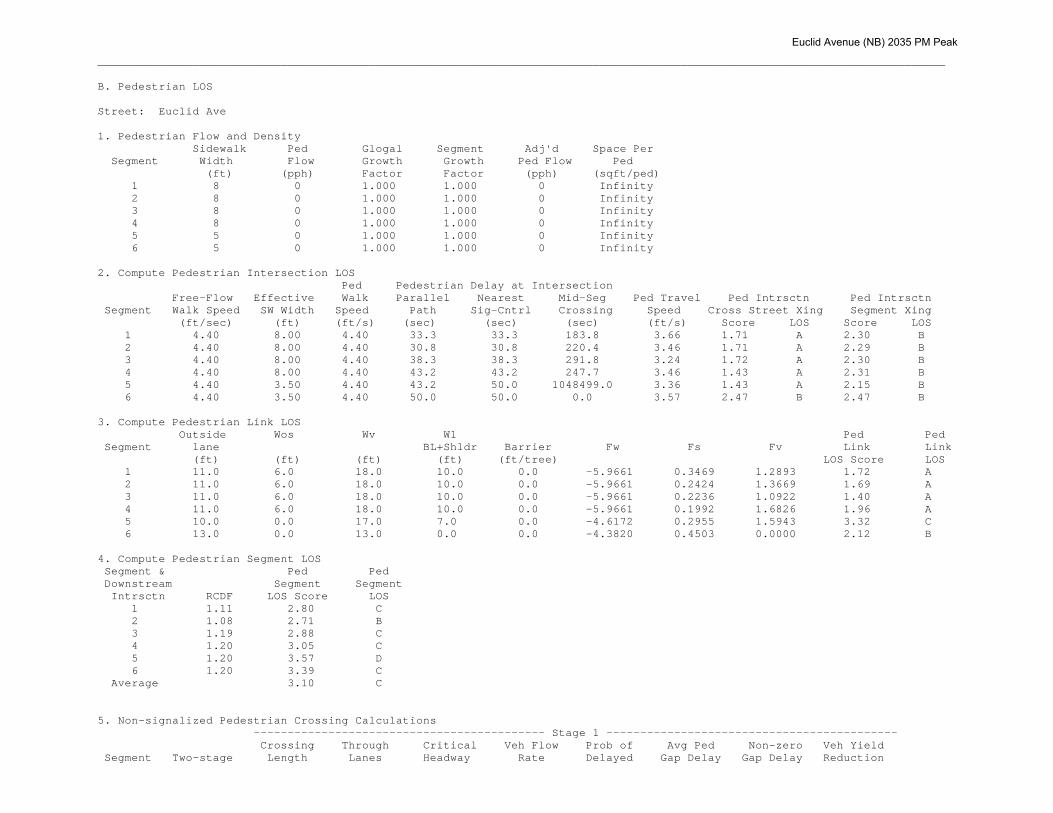
_____________________________________________________________________________________________________________________________
B. Pedestrian LOS
Street: Euclid Ave
1. Pedestrian Flow and Density Sidewalk Ped Glogal Segment Adj'd Space Per Segment Width Flow Growth Growth Ped Flow Ped (ft) (pph) Factor Factor (pph) (sqft/ped) 1 8 0 1.000 1.000 0 Infinity 2 8 0 1.000 1.000 0 Infinity 3 8 0 1.000 1.000 0 Infinity 4 8 0 1.000 1.000 0 Infinity 5 5 0 1.000 1.000 0 Infinity 6 5 0 1.000 1.000 0 Infinity
2. Compute Pedestrian Intersection LOS Ped Pedestrian Delay at Intersection Free-Flow Effective Walk Parallel Nearest Mid-Seg Ped Travel Ped Intrsctn Ped Intrsctn Segment Walk Speed SW Width Speed Path Sig-Cntrl Crossing Speed Cross Street Xing Segment Xing (ft/sec) (ft) (ft/s) (sec) (sec) (sec) (ft/s) Score LOS Score LOS 1 4.40 8.00 4.40 33.3 33.3 183.8 3.66 1.71 A 2.30 B 2 4.40 8.00 4.40 30.8 30.8 220.4 3.46 1.71 A 2.29 B 3 4.40 8.00 4.40 38.3 38.3 291.8 3.24 1.72 A 2.30 B 4 4.40 8.00 4.40 43.2 43.2 247.7 3.46 1.43 A 2.31 B 5 4.40 3.50 4.40 43.2 50.0 1048499.0 3.36 1.43 A 2.15 B 6 4.40 3.50 4.40 50.0 50.0 0.0 3.57 2.47 B 2.47 B
3. Compute Pedestrian Link LOS Outside Wos Wv W1 Ped Ped Segment lane BL+Shldr Barrier Fw Fs Fv Link Link (ft) (ft) (ft) (ft) (ft/tree) LOS Score LOS 1 11.0 6.0 18.0 10.0 0.0 -5.9661 0.3469 1.2893 1.72 A 2 11.0 6.0 18.0 10.0 0.0 -5.9661 0.2424 1.3669 1.69 A 3 11.0 6.0 18.0 10.0 0.0 -5.9661 0.2236 1.0922 1.40 A 4 11.0 6.0 18.0 10.0 0.0 -5.9661 0.1992 1.6826 1.96 A 5 10.0 0.0 17.0 7.0 0.0 -4.6172 0.2955 1.5943 3.32 C 6 13.0 0.0 13.0 0.0 0.0 -4.3820 0.4503 0.0000 2.12 B
4. Compute Pedestrian Segment LOS Segment & Ped Ped Downstream Segment Segment Intrsctn RCDF LOS Score LOS 1 1.11 2.80 C 2 1.08 2.71 B 3 1.19 2.88 C 4 1.20 3.05 C 5 1.20 3.57 D 6 1.20 3.39 C Average 3.10 C
5. Non-signalized Pedestrian Crossing Calculations ------------------------------------------- Stage 1 ------------------------------------------- Crossing Through Critical Veh Flow Prob of Avg Ped Non-zero Veh Yield Segment Two-stage Length Lanes Headway Rate Delayed Gap Delay Gap Delay Reduction
Euclid Avenue (NB) 2035 PM Peak

Crossing (ft) (#) (sec) (veh/sec) Crossing (sec) (sec) (sec) 1 Yes 35.5 2 11.07 0.315 0.9693 89.3 92.2 89.3 2 Yes 35.5 2 11.07 0.334 0.9751 106.4 109.2 106.4 3 Yes 35.5 2 11.07 0.267 0.9478 57.0 60.1 57.0 4 Yes 35.5 2 11.07 0.411 0.9894 216.3 218.6 216.3 5 No 58 4 16.18 0.846 1.0000 1048499.0 1048501.0 1048501.0 6 Yes 38 3 11.64 0.000 0.0000 NaN 0.0 0.0
Motorist ------------------------------------------- Stage 2 ------------------------------------------- Yield Crossing Through Critical Veh Flow Prob of Avg Ped Non-zero Veh Yield Segment Rate Length Lanes Headway Rate Delayed Gap Delay Gap Delay Reduction (ft) (#) (sec) (veh/sec) Crossing (sec) (sec) (sec) 1 0.000 28 2 9.36 0.401 0.9765 94.5 96.7 94.5 2 0.000 28 2 9.36 0.425 0.9813 114.0 116.1 114.0 3 0.000 28 2 9.36 0.518 0.9922 234.9 236.7 234.9 4 0.000 28 2 9.36 0.263 0.9145 31.4 34.3 31.4 5 0.000 0 0 0.00 0.000 0.0000 0.0 0.0 0.0 6 0.000 26 2 8.91 0.000 0.0000 0.0 0.0 0.0
6. Non-signalized Pedestrian Crossing LOS Average Pedestrian Downstream Ped Delay Intrsectn Intrsctn (sec) LOS 1 183.8 F 2 220.4 F 3 291.8 F 4 247.7 F 5 1048499.0 F 6 0.0 A
Euclid Avenue (NB) 2035 PM Peak

_____________________________________________________________________________________________________________________________
B. Pedestrian LOS
Street: Euclid Ave
1. Pedestrian Flow and Density Sidewalk Ped Glogal Segment Adj'd Space Per Segment Width Flow Growth Growth Ped Flow Ped (ft) (pph) Factor Factor (pph) (sqft/ped) 1 5 0 1.000 1.000 0 Infinity 2 5 0 1.000 1.000 0 Infinity 3 8 0 1.000 1.000 0 Infinity 4 8 0 1.000 1.000 0 Infinity 5 8 0 1.000 1.000 0 Infinity 6 8 0 1.000 1.000 0 Infinity
2. Compute Pedestrian Intersection LOS Ped Pedestrian Delay at Intersection Free-Flow Effective Walk Parallel Nearest Mid-Seg Ped Travel Ped Intrsctn Ped Intrsctn Segment Walk Speed SW Width Speed Path Sig-Cntrl Crossing Speed Cross Street Xing Segment Xing (ft/sec) (ft) (ft/s) (sec) (sec) (sec) (ft/s) Score LOS Score LOS 1 4.40 3.50 4.40 50.0 50.0 584.1 3.39 1.44 A 2.47 B 2 4.40 3.50 4.40 50.0 50.0 178138.2 3.53 1.44 A 2.15 B 3 4.40 8.00 4.40 38.3 38.3 227.1 3.55 1.72 A 2.30 B 4 4.40 8.00 4.40 30.8 30.8 255.1 3.41 1.71 A 2.29 B 5 4.40 8.00 4.40 33.3 33.3 178.7 3.40 1.71 A 2.30 B 6 4.40 8.00 4.40 68.2 68.2 160.9 3.04 2.33 B 2.33 B
3. Compute Pedestrian Link LOS Outside Wos Wv W1 Ped Ped Segment lane BL+Shldr Barrier Fw Fs Fv Link Link (ft) (ft) (ft) (ft) (ft/tree) LOS Score LOS 1 14.0 0.0 14.0 0.0 0.0 -4.4161 0.1164 2.1474 3.89 D 2 10.0 0.0 17.0 7.0 0.0 -4.6172 0.4209 1.1619 3.01 C 3 11.0 0.0 18.0 7.0 0.0 -5.4174 0.3062 1.9775 2.91 C 4 11.0 0.0 18.0 7.0 0.0 -5.4174 0.2103 1.8193 2.66 B 5 11.0 0.0 18.0 7.0 0.0 -5.4174 0.2374 1.6256 2.49 B 6 11.0 0.0 18.0 7.0 0.0 -5.4174 0.3050 1.5689 2.50 B
4. Compute Pedestrian Segment LOS Segment & Ped Ped Downstream Segment Segment Intrsctn RCDF LOS Score LOS 1 1.20 3.79 D 2 1.20 3.46 C 3 1.12 3.27 C 4 1.03 2.92 C 5 1.07 2.98 C 6 1.20 3.50 C Average 3.37 C
5. Non-signalized Pedestrian Crossing Calculations ------------------------------------------- Stage 1 ------------------------------------------- Crossing Through Critical Veh Flow Prob of Avg Ped Non-zero Veh Yield Segment Two-stage Length Lanes Headway Rate Delayed Gap Delay Gap Delay Reduction Crossing (ft) (#) (sec) (veh/sec) Crossing (sec) (sec) (sec)
Euclid Avenue (SB) 2035 PM Peak

1 Yes 26 2 8.91 0.524 0.9906 193.0 194.9 193.0 2 No 58 4 16.18 0.728 1.0000 178138.2 178139.5 178139.5 3 Yes 28 2 9.36 0.483 0.9891 179.1 181.0 179.1 4 Yes 28 2 9.36 0.444 0.9844 132.6 134.7 132.6 5 Yes 28 2 9.36 0.397 0.9757 91.8 94.1 91.8 6 Yes 28 2 9.36 0.383 0.9723 82.4 84.7 82.4
Motorist ------------------------------------------- Stage 2 ------------------------------------------- Yield Crossing Through Critical Veh Flow Prob of Avg Ped Non-zero Veh Yield Segment Rate Length Lanes Headway Rate Delayed Gap Delay Gap Delay Reduction (ft) (#) (sec) (veh/sec) Crossing (sec) (sec) (sec) 1 0.000 38 3 11.64 0.447 0.9945 391.1 393.2 391.1 2 0.000 0 0 0.00 0.000 0.0000 0.0 0.0 0.0 3 0.000 35.5 2 11.07 0.249 0.9363 48.0 51.3 48.0 4 0.000 35.5 2 11.07 0.349 0.9790 122.5 125.1 122.5 5 0.000 35.5 2 11.07 0.312 0.9683 86.9 89.8 86.9 6 0.000 35.5 2 11.07 0.301 0.9643 78.6 81.5 78.6
6. Non-signalized Pedestrian Crossing LOS Average Pedestrian Downstream Ped Delay Intrsectn Intrsctn (sec) LOS 1 584.1 F 2 178138.2 F 3 227.1 F 4 255.1 F 5 178.7 F 6 160.9 F
Euclid Avenue (SB) 2035 PM Peak

APPENDIX J: PLANNING-LEVEL COST ESTIMATES

Planning-Level Estimate of Improvement CostsProject: Euclid Avenue Corridor Master Plan (Long-Term Mobility Concept)Location: San Diego, CADate: 2/28/2014 SUBTOTAL $974,460Project #: SD12-0070 30% CONTINGENCY $292,338
30% DESIGN BUDGET $292,338TOTAL COST ESTIMATE $1,559,136
Intersection Unit Unit Cost Quantity TotalEuclid Avenue & Guymon Street Stripe/Restripe Marked Crosswalk EA $750 3 $2,250
Install ADA Compliant Curb Ramps EA $5,000 2 $10,000Construct Curb Extensions CORNER $15,000 1 $15,000
$27,250Euclid Avenue & Lise Street Stripe/Restripe Marked Crosswalk EA $750 3 $2,250
Install ADA Compliant Curb Ramps EA $5,000 4 $20,000Construct Curb Extensions CORNER $15,000 2 $30,000New Traffic Signal SIGNAL $275,000 1 $275,000
$327,250Euclid Avenue & Hilltop Drive Stripe/Restripe Marked Crosswalk EA $750 4 $3,000
Install ADA Compliant Curb Ramps EA $5,000 8 $40,000Construct Curb Extensions CORNER $15,000 4 $60,000Modify Traffic Signal Equipment (Major) CORNER $100,000 1 $100,000Cost for Hilltop Drive Connection1 N/A N/A N/A $185,000
$388,000Total Intersection Improvement Cost: $742,500
Segments Unit Unit Cost Quantity TotalEuclid Avenue from Guymon Street to south leg of SR-94 EB Ramps Installation of Class II Bike Lanes with 2' Buffer LF $5 6,072 $30,360
Type B-2 Median Curb & Gutter for Raised Median LF $30 1,120 $33,600Planting and Irrigation for Landscaped Raised Median SF $9 3,000 $27,000Type B-2 Median Curb & Gutter for Raised Median LF $30 1,120 $33,600Planting and Irrigation for Landscaped Raised Median SF $9 2,700 $24,300Type B-2 Median Curb & Gutter for Raised Median LF $30 1,120 $33,600Planting and Irrigation for Landscaped Raised Median SF $9 5,500 $49,500
Total Segment Improvement Cost: $231,960Source: Fehr & Peers, 2014.
Notes:
1. The cost estimate for this roadway connection only reflects construction costs and does not account for the costs such as drainage and any major structure conditions.
Euclid Avenue from Guymon Street to Lise Avenue
Euclid Avenue from Lise Avenue to Hilltop Drive
Euclid Avenue from Hilltop Drive to SR-94 EB Ramps
Improvement
Subtotal:
Subtotal:
Subtotal:
Improvement