eu technical assistance facility for the “sustainable
TRANSCRIPT

EC Regional Water and Energy Workshop
Bridgetown, 18-22 May 2015
EU Technical Assistance Facility for the
“Sustainable Energy for All” Initiative
Rural Electrification and the Different Business Models
Presented by: Emmanuel Bergasse, Key Expert, EU TAF for SE4All
A SOFRECO led Consortium
EU Technical Assistance Facility for the
“Sustainable Energy for All” Initiative

Outline
1. General introduction to Electricity Access/Rural Electrification
2. Off-grid Stand-alone PV Systems
3. Mini-grid for Rural Electrification

Main Objectives
Participants to be Aware of the fundamentals of electricity access and rural
electrification Familiar with rural electrification schemes (off-grid) and
existing business models

1. Electricity Access & Rural Electrification

Which indicators for electricity access?
• Electrification rate: the population with effective access to electricity, compared to the total population (or the total number of households)
• Electricity access rate: proportion of population living in electrified localities relative to the total population
• Electricity coverage ratio: Number of electrified localities relative to the total number of localities
• Electricity Service rate or penetration rate: Population actually having access to electricity compared to the total population of electrified localities.

How to get access to electricity?
4 lights, phone, radio, TV, sewing
machine
4 lights, phone, radio, TV
4 lights, phone, radio
2 lights, phone
Disconnected
Energized
Light
Home
Media
Work 80 W
40 W
10 W
3 W
Tier 1
Tier 2
Tier 3
Tier 4 & 5
Tier 0
Access is not a binary state but a process that starts with the basic energy services adapted to the range of affordability

Energy Efficiency unlocks the energy ladder
• Replacing incandescent light bulbs with LED light bulbs delivers the same energy service for 50-85% less energy
• The most energy efficient fans move four to eight times as much air per watt as less efficient fans
• Similar gains possible for refrigeration, possibly shared amongst several households
• Energy efficient appliances (A+) cost more up front, but cost far less than generating excess power in the long run: Leverage of Energy Efficiency Standards (MEPS) and Labeling (S&L)

What is Rural Electrification?
Isolated
Off Grid
On Grid In filling
Extension
City centre
Peri urban
Rural town
Community w. public facilities
Isolated public facilities
Community w/o public facilities
Dispersed private loads
Regional
Local/mini
Urban Rural

Which options for Rural Electrification?
Justified by high
population
100 kV
Transmission
> X pop
Stand-alone
Systems
MG
MG
33 kV
Distribution
MG
Off-Grid
Perimeter
Grid
Perimeter
Off-Grid
Perimeter
Solar/wind
Hydro
Biomass

Least cost decision making process for Rural Electrification
Distance
from grid
Size of
demand
Decision: grid extension Decision: mini grid
or off grid? or individual system?
Dispersed: mainly
Minigrid Individual household lighting
system
Community
organisation
Diesel
Renewable
Energy Solar home
Tech. - RET* system - SHS
Diesel - RET Wind home
hybrid system - WHS
Pico hydro
Battery
* RET = windpower, solar PV, hydro, biomass gasifier, biomass direct combustion
off grid
Resource availability
Income level
Equipment availability
Concentrated:
Some productive loads

Electricity access solutions up the energy ladder
Attributes Tier 0 Tier 1 Tier 1 Tier 1.5 Tier 2 Tier 2.5 Tier 3 Tier 3 Tier 4 Tier 5
Service Description
Kerosene
lighting
Task lighting
and phone
charging (or
radio)
Task lighting
and phone
charging (or
radio)
4 lights,
phone
charging
and radio
General
lighting and
TV or fan (if
needed)
General
lighting and
TV and fan
(if needed)
Tier 2 and
any low
power
applicances
Tier 2 and
any low
power
applicances
Tier 3 and
any
medium
power
applicance
Tier 3 and
any high
power
applicances
Peak available
capacity (W)- 1 5 10 20 50 200 500 2000 2000
Duration
(hours/day)- 4 4 4 4 4 8 8 16 22
Evening supply
(hours/day)- 2 2 2 2 2 2 2 4 4
Load factor 17% 17% 17% 17% 17% 18% 20% 20% 25%
annual consumption
(kWh/year)1,5 7,3 14,6 29,2 73 315 876 3504 4380
Price of electricity
(US$/kWh)5,0 4,8 4,0 4,0 3,0 1,0 0,50 0,30 0,25
annual cost
(US$/year)7,3 35 58 117 219 315 438 1051 1095
Least cost 70 110 166 288 500 1800 3200 1600 1600
Likely electricity
supply technology
Average costs (US$/household)
Average annual consumption per household
Continuous Spectrum of improving Electricity supply Attributes
None Solar lanterns
Stand-alone home systems
Mini grid on grid

2. Off-grid Stand-alone PV systems
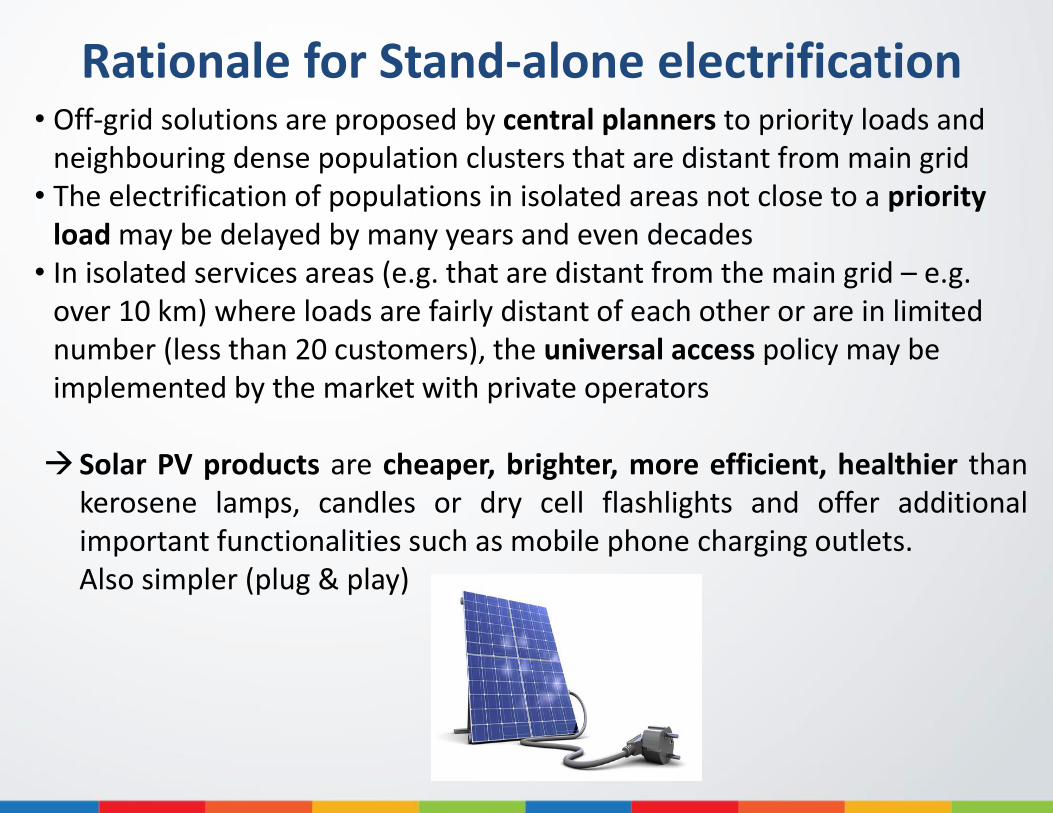
Rationale for Stand-alone electrification • Off-grid solutions are proposed by central planners to priority loads and
neighbouring dense population clusters that are distant from main grid • The electrification of populations in isolated areas not close to a priority
load may be delayed by many years and even decades • In isolated services areas (e.g. that are distant from the main grid – e.g.
over 10 km) where loads are fairly distant of each other or are in limited number (less than 20 customers), the universal access policy may be implemented by the market with private operators
Solar PV products are cheaper, brighter, more efficient, healthier than
kerosene lamps, candles or dry cell flashlights and offer additional important functionalities such as mobile phone charging outlets.
Also simpler (plug & play)

Solar Portable Lights (SPL)
• Single light source with/without mobile phone charging outlet • Entry level products with solar (PV) panels of 0.2-2 W • Price range: $20-$60
Little Sun littlesun.com d.light S20
dlight.com

Pico PV Systems (PPS)
• Multi-lights source applications with mobile phone charging outlet made of a kit of components
• Power range: 2-10 W
• Price range: $150-$200

Solar Home Systems (SHS)
• Multi lights source applications with mobile phone charging outlet
• Sources can power devices such as radio and TV • Power range: 10 W-250 W • Price range: $150-$400
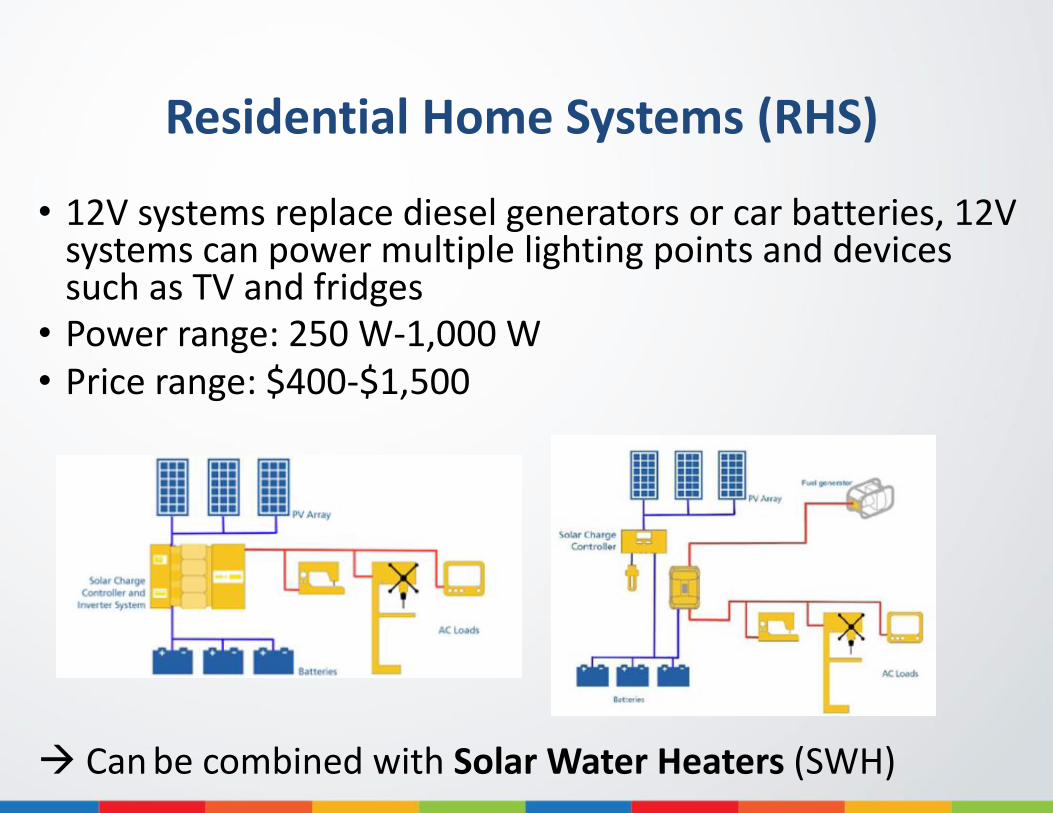
Residential Home Systems (RHS)
• 12V systems replace diesel generators or car batteries, 12V systems can power multiple lighting points and devices such as TV and fridges
• Power range: 250 W-1,000 W • Price range: $400-$1,500
Can be combined with Solar Water Heaters (SWH)

3 main trends drive the Solar PV market
1. Decreasing Solar PV products cost • By 6% per annum over 2012-2020 • Performance and production cost will continue to improve • Key costs improvement from PV, batteries, LED and chips
2. Increasing kerosene cost • By 4% per annum over 2012-2020 • Kerosene price grows in line with the oil price • Price premium for rural customer must be considered
3. Increasing mobile penetration • By 8% per year in Caribbean region (2012) • Mobile communication is key facilitator for rural development • Mobile charging functionality of accelerates development

Solar PV products market is becoming more established with proven business models
• Up-front payment to installments: Pay-to-own • System activation through a code on scratch card • Unit remotely turned off upon late payment • Once fully paid, unit is permanently turned on and owned by customer
• Products sales to services supply: Pay-as-you-go • Customer takes home Solar PV product after initial deposit • Embedded SIM card enable further payment through mobile
platform
• Modularized systems that can be extended

Coverage of value chain by key players

Business models for off-grid 1) Traditional public business model
Ministry of Energy
Donor
Planning – Rural Electrification Master Plan
Bilateral agreement
Rural Electrification Agency
Funding Co-funding
Supplyer
Consumer
Donation
Funding
Installation
2 year maintenance

2) Private market driven business models
One hand business model Two hand business model
Fee for service or pay as you go business model
Lease /hire purchase business model

The top market barrier is access to finance
1. Access to finance for solar firms • Access to working capital • Long-term growth financing
2. Policy issues • Regulatory uncertainties • Tax and duty on quality off grid lighting products • Subsidy on kerosene or LPG • Phase out of fuel based lighting
3. Poor product quality • Low quality players • Technical specifications and standards & labelling • Installer certification
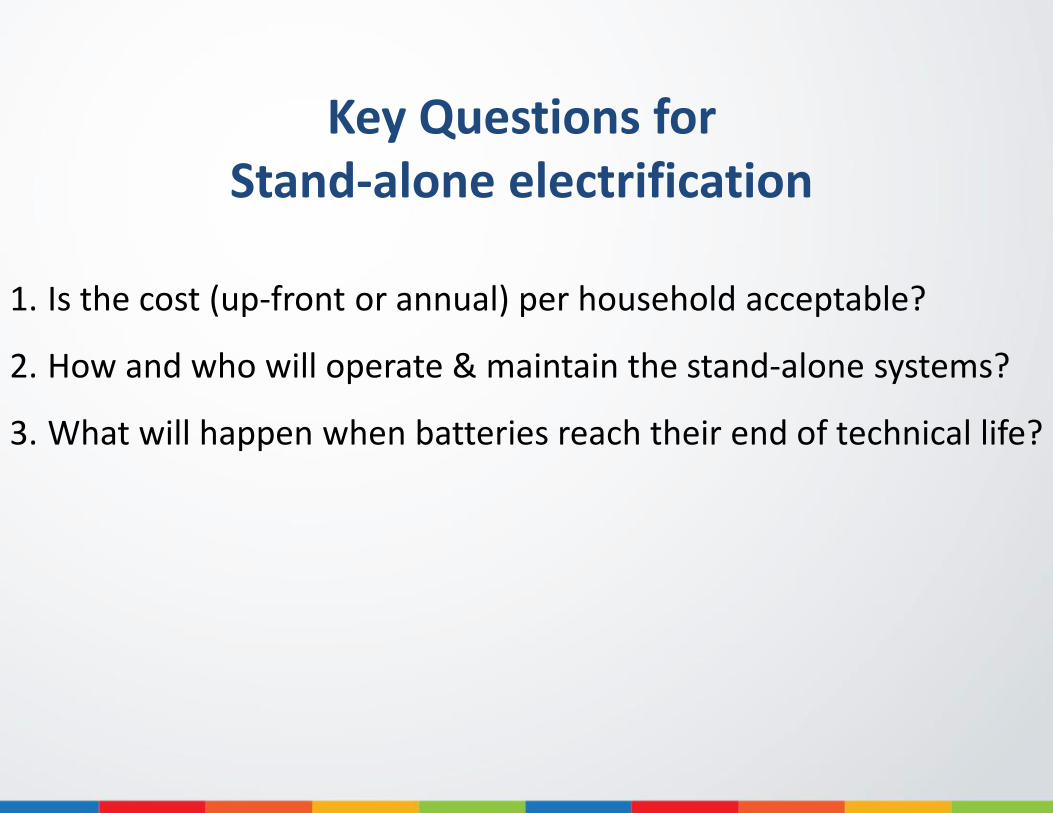
Key Questions for Stand-alone electrification
1. Is the cost (up-front or annual) per household acceptable?
2. How and who will operate & maintain the stand-alone systems?
3. What will happen when batteries reach their end of technical life?

3. Mini-grid for Rural Electrification

Main components of a mini-grid
• Small scale generators (diesel, RE) • Medium voltage distribution line • MV/LV distribution lines and LV
distribution lines to supply load at a limited distance of distribution substation
• Service drop line that links the distribution LV line and the meter of the consumer
• Service entrance system including the distribution board with protection and in-house wiring that connect the appliances.

Rationale for mini-grid electrification
• When a mini-grid is built in a village, all rural households-even those who do not have the financial resources to afford electricity in their own homes can enjoy its benefits: drinking or irrigation water, street lighting, improved educational and health services, agroprocessing
• Residual cost of a mini-grid, after deduction of subsidies, is shared between all connected customers
• Its quality of electricity supply is constrained by the original design and affordability criteria
• A mini-grid implies a generation license and a distribution license (managed to some extent at local level)

Reference costs of a mini-grid
Technology -based
MG
Size range
(kW)
Power plant investment
($/kW)
LCOE
($/kWh)
Operating time
(h/yr)
Diesel genset 5 – 300 500 – 1500 0.3 – 0.6 On demand
Hydro 10 – 1000 2000 – 5000 0.1 – 0.3 3000 – 8000
Biomass-gasifier 50 – 300 2000 – 3000 0.1 – 0.3 3000 – 6000
Wind hybrid 1 – 100 2000 – 6000 0.2 – 0.4 2000 – 2500
Solar hybrid 1 – 150 5000 – 10000 0.4 – 0.6 1000 – 2000
MV distribution 33kV 13,000 - 15,000 $/km (site specific)
LV distribution 380V 5,000 – 8,000
$/km
A rough estimate of the required length is 30 customers per km.
Connection costs Ideally $350 per customer (but Capex/customer varies $350-3500)
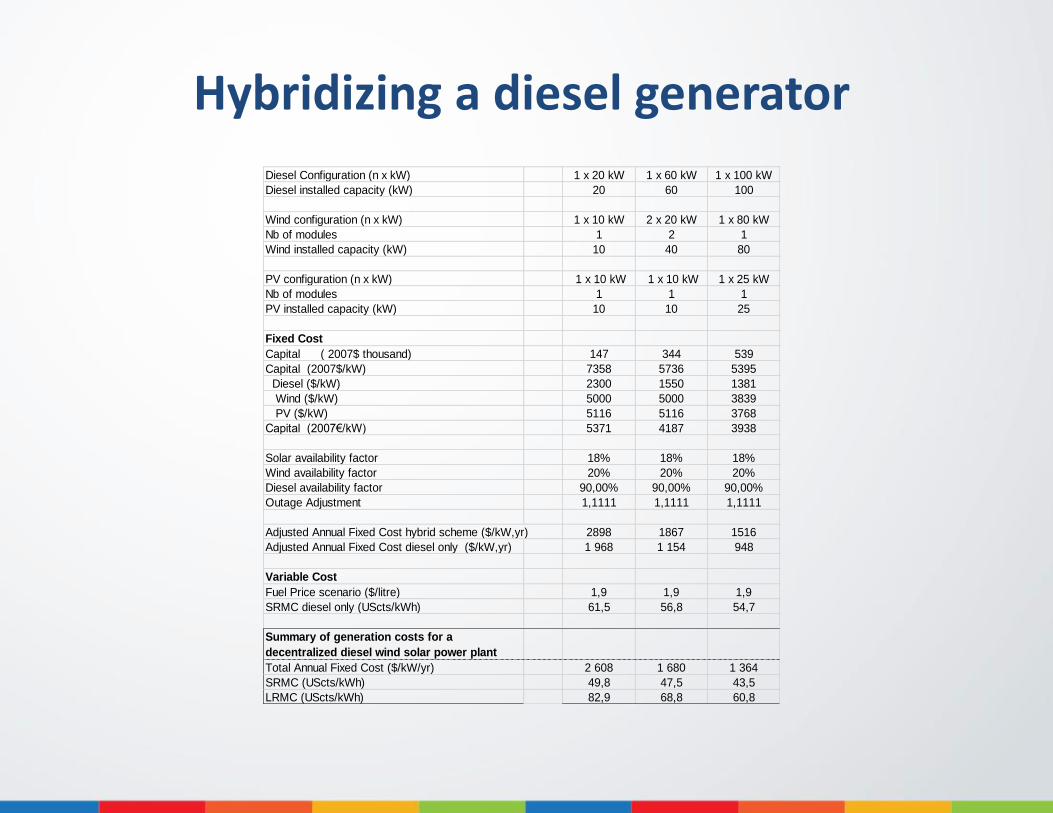
Hybridizing a diesel generator
Diesel Configuration (n x kW) 1 x 20 kW 1 x 60 kW 1 x 100 kW
Diesel installed capacity (kW) 20 60 100
Wind configuration (n x kW) 1 x 10 kW 2 x 20 kW 1 x 80 kW
Nb of modules 1 2 1
Wind installed capacity (kW) 10 40 80
PV configuration (n x kW) 1 x 10 kW 1 x 10 kW 1 x 25 kW
Nb of modules 1 1 1
PV installed capacity (kW) 10 10 25
Fixed Cost
Capital ( 2007$ thousand) 147 344 539
Capital (2007$/kW) 7358 5736 5395
Diesel ($/kW) 2300 1550 1381
Wind ($/kW) 5000 5000 3839
PV ($/kW) 5116 5116 3768
Capital (2007€/kW) 5371 4187 3938
Solar availability factor 18% 18% 18%
Wind availability factor 20% 20% 20%
Diesel availability factor 90,00% 90,00% 90,00%
Outage Adjustment 1,1111 1,1111 1,1111
Adjusted Annual Fixed Cost hybrid scheme ($/kW,yr) 2898 1867 1516
Adjusted Annual Fixed Cost diesel only ($/kW,yr) 1 968 1 154 948
Variable Cost
Fuel Price scenario ($/litre) 1,9 1,9 1,9
SRMC diesel only (UScts/kWh) 61,5 56,8 54,7
Summary of generation costs for a
decentralized diesel wind solar power plant
Total Annual Fixed Cost ($/kW/yr) 2 608 1 680 1 364
SRMC (UScts/kWh) 49,8 47,5 43,5
LRMC (UScts/kWh) 82,9 68,8 60,8

Business models for Mini-grids
Business Models Borrower Owner Asset Remark
Utility based 1 Existing Utility Utility Known by most FIs
Franchise 1 Franchisee
possibly backed by
Franchiser
Franchisee Management performance
enforced by Franchiser
A-B-C Business
Model with Anchor
Loads
1 New Private
Utility
A-B-C
Company
Anchor-load based
Clustering Model 1 New Energy
Service Company
Energy Service
Company
Existing client based;
economies of scale
Local Entrepreneur
Model
1 Existing
entrepreneur
Entrepreneur Well established social
network
Private ESCO
Contractor
1 New Energy
Service Company
N civilians Weak creditor base -
unproven
Private
Concessionaire
1 New IPP Concessionaire Contract-based. Ongoing
investment obligations
Generator – IPP
Model
1 New Generator IPP Contract-based
Private Distributor 1 New Distributor Distributor Weak creditor base –
unproven
Community based 1 New Community N civilians Weak creditor base -
unproven
Questions for mini-grid electrification
1. Is the project developer reliable and creditworthy?
2. Does the Mini-Grid Business Model comply with legal framework?
3. Is the proposed Mini-Grid project technically & financially viable?
4. Is the tariff affordable to most customers? How do electricity bills are recovered? By whom?
5. What happens if the mini-grid scheme is connected to main grid?

Examples of Mini-grid hybrid diesel/RE projects in the LAC region
3 steps approach:
Source: “Renewable energy in hybrid mini-grids and isolated grids: Economic benefits and business cases” Frankfurt School- UNEP Collaborating Centre for Climate and Sustainable Energy Finance (December 2014).

Las Terrenas, Dominican Republic

Mini hybrid grid/LAC (3)
Bequia, St. Vincent & the Grenadine

Mini hybrid grid/LAC (4)
Puerto Leguizamo (Putumayo), Colombia

Mini hybrid grid/LAC (4)
Site Population
/Power
Customers
(in th.) -% of
low income)
Main
Economic
Activity
Power
Demand
(Average/pe
ak in MW)
Current
Electricity
Supply
Situation
(generating
costs,
reliability)
Utility
Ownership
(Generation &
Distribution)
PV Option
(MW and %
of Load)
Diesel
Consumptio
n Savings
(%)
Cost
Savings of
Hybrid
Solution/IRR
(%)
Las Terrenas,
Dominican
Republic
19/9-62% Services,
mostly
tourism
3.2/5.8 0.38/frequ
ent power
cuts
Two private
utilities (G
& D)
6.7/31% 30% 12%/13%
Bequia, St.
Vincent &
Grenadine
4.3/2.3-
NA
Services,
mostly
tourism
0.9/1.5 0.34 One public
utility (G &
D)
1.5/34% 32% 13%/13%
Puerto
Leguizamo
(Putumayo),
Colombia
31/3-NA Services 1.4/2.2
0.40/frequ
ent power
cuts
Two public
utilities (G
& D)
2.7/31% 29% 13%/13%
Frankfurt School- UNEP Collaborating Centre for Climate and Sustainable Energy Finance
References
1. Initiatives
• Caribbean Renewable Energy Development Programme (CREDP)- www.credp.org
• REGSA - Promoting Renewable Electricity Generation in South America (EuropeAid): http://regsa-project.eu
• Alliance for Rural Electrification (ARE): www.ruralelec.org
2. Trainings
• Clean Energy Solutions Center: Clean Energy in Island Settings
(Training Webinar) -https://cleanenergysolutions.org/training/renewable-energy

2. Publications ARE (2012-2014)
• Rural Electrification with Renewable Energy
• Green light for renewable energy in developing countries
• Potential of Small Hydro for Rural Electrification-Focus: Latin America
• Hybrid Mini-grids for Rural Electrification: Lessons Learned
• Best Practices of the ARE: What renewable energies can achieve in developing and emerging markets
• The potential of small and medium wind energy in developing countries-A guide for energy sector decision-makers
Renewable energy in hybrid mini-grids and isolated grids: Economic benefits and business cases (Frankfurt School-UNEP Collaborating Centre for Climate and Sustainable Energy Finance, Dec. 2014, 85 pages)
Mini-Grid Policy Toolkit (European Union Energy Initiative Partnership Dialogue Facility, EUEI PDF/GIZ/ARE, 2014)

Thank you for your kind attention
EU Technical Assistance
Facility for the “Sustainable
Energy for All” Initiative
Brussels Project Office
4 Rue de la Presse Bureau No 14 (1st floor)
1000 Brussels
Tel.: +32 (0)2 22 71 161 (direct) Fax: +32 (0)2 22 72 780
E-mail: [email protected]
This report has been prepared by SOFRECO – gasNatural fenosa – ECN – EiR Global – CEERD –SEVEn Consortium. The findings, conclusions and interpretations expressed in this document are those of the
Consortium alone and should in no way be taken to reflect the policies or opinions of the European Commission