eu sugar policy: a sweet transition after 2015...
TRANSCRIPT

Report EUR 26530 EN
Alison Burrell
Mihaly Himics
Benjamin Van Doorslaer
Pavel Ciaian
Shailesh Shrestha
2 0 1 4
EU sugar policy: A sweet transition after 2015 ?

European Commission
Joint Research Centre
Institute for Prospective Technological Studies
Contact information
Benjamin Van Doorslaer
Address: Joint Research Centre, Edificio Expo, c/ Inca Garcilaso 3, E-41092 Sevilla, Spain
E-mail: [email protected]
Tel.: +34 954 488 350
Fax: +34 954 488 434
http://ipts.jrc.ec.europa.eu/
http://www.jrc.ec.europa.eu
Legal Notice
Neither the European Commission nor any person acting on behalf of the Commission
is responsible for the use which might be made of this publication
Cover image based on original work of Reiner Kühnl Fotografie (stock.xchng)
Europe Direct is a service to help you find answers to your questions about the European Union
Freephone number (*): 00 800 6 7 8 9 10 11
(*) Certain mobile telephone operators do not allow access to 00 800 numbers or these calls may be billed.
A great deal of additional information on the European Union is available on the Internet.
It can be accessed through the Europa server http://europa.eu/.
JRC76619
EUR 26530 EN
ISBN 978-92-79-35567-7 (pdf)
ISSN 1831-9424 (online)
doi:10.2791/68116
Luxembourg: Publications Office of the European Union, 2014
© European Union, 2014
Reproduction is authorised provided the source is acknowledged.
Printed in Spain

Disclaimer:
The views expressed are those given and presented by the authors and may not in any circumstances be regarded as stating an official position of the European Commission
EU sugar policy: A sweet transition after 2015 ?


Acknowledgement
The authors would like to thank Marcel Adenäuer, Peter Witzke and Wolfgang Britz for their
tireless technical help in the implementation of model changes and the explanation of
model behaviour.
The authors would also like to thank the policy officers and market experts of DG AGRI
involved in this process for scrutinising the results and for their valuable comments.


TABLE OF CONTENTS 1 Introduction .................................................................................................1
2 The Context: Production, Policies and Markets ...................................................2
2.1 Sugar Production in the EU.......................................................................2 2.2 Sugar policy in the CAP............................................................................4 2.3 The sugar market ...................................................................................7
3 Theoretical Background................................................................................10
3.1 Situation with quotas in force .................................................................10 3.2 Production and consumption effects of quota abolition................................15 3.3 Income effects .....................................................................................18
4 Previous Studies of EU Sugar Quota Abolition ..................................................20
5 The CAPRI model ........................................................................................23
5.1 Main features of CAPRI ..........................................................................23 5.2 Modelling the EU sugar market and sugar policies in CAPRI.........................24 5.3 Scenarios examined in this study ............................................................26
6 Results ......................................................................................................27
6.1 Production, imports and exports..............................................................27 6.2 EU production balances and welfare changes. ...........................................31 6.3 Changes at Member State level...............................................................33 6.4 Changes at NUTS2 level.........................................................................38
7 Conclusions ................................................................................................42

Executive Summary
This report compares the production, market and trade outcomes of two alternative EU agricultural policy scenarios, namely expiry of EU sugar quotas in 2015/16 and extension of the current sugar quota scheme. All other EU policy measures pertaining to the sugar sector, and to agriculture more generally, are assumed to be the same in both scenarios. The year of comparison is 2020. The CAPRI model was used for the simulations. Information available to the authors up to the end of 2012 was included in this study, as this was the end date of the scenario analyses and editing of the report.
The report begins with a description of beet and sugar production within the EU, and outlines the policies applied in the sugar sector within the EU’s Common Agricultural policy. This is followed by a description of the workings of the EU market for sugar.
A theoretical model is used to summarise the main functional relationships in the EU sugar market and related markets, and the EU’s trade in sugar. From this model, a number of theory-based predictions about the impacts of quota expiry are derived. There is then a brief overview of the CAPRI model and the way it has been used in this study.
In the presentation of the simulation results, the outcomes that occur when quotas expire are presented in the form of differences from the hypothetical scenario according to which the quota scheme is extended until at least 2020. The main findings concerning these differential outcomes at EU level are given in the second column of the following table, headed ‘impacts of quota expiry (standard scenario)’. These impacts are all in line with those predicted and explained by the theoretical model.
Summary of the simulation results.
Impact on
Impacts of quota expiry (standard scenario)
Modification of the standard result when isoglucose takes an increasing share in the EU sweetener market1
EU production of sugar beet & sugar Increase (ca. 4%) ↓
EU production of cereals Marginal increase (< 0.1%) ↓
EU ethanol production Marginal increase (< 0.1%), lower share of sugar as feedstock (-3 percentage points)
↑
EU sugar imports from high-cost countries Strong decrease (-43%) ↑
EU sugar imports from low-cost countries Marginal decrease (-4%) ↑
EU sugar exports Decrease (-15%) ↓ → reversal
EU consumption of sugar Marginal increase (< 1%) ↓ → reversal
EU sugar price (relative to the in-quota price) Significant decline (-15-16%) ↑
EU welfare Marginal increase (< 0.1%) ↑
EU beet sector income2 Strong decline (-17%) ↑
1. For the interpretation of the symbols in this column, see the text below. 2. Impact on individual beet growers’ total income is smaller as even the most specialised enterprises grow sugar beet no more than 30% of their agricultural areas.

Isoglucose quotas will expire along with sugar quotas, and there is much speculation about the extent of potential competitive substitution between the two sweeteners, which has until now been constrained by the quota arrangements. Sensitivity analysis was performed to obtain greater insight into this issue. Two additional quota-expiry scenarios were run, in which isoglucose was assumed to take a 10% and a 20% share of the sweetener market at the expense of sugar, compared to less than 5% in the standard scenario.
The third column of the above table describes how an increasing share of isoglucose in the sweetener market modifies the result of the standard no-quota scenario. A downward arrow means that the impact in the standard scenario is reduced while keeping its sign, whereas an upward arrow signifies that the impact is enhanced while its sign is maintained. A downward arrow followed by ‘→ reversal’ means that the impact is reduced in magnitude to such an extent that, by the time a 20% market share for isoglucose is reached – or before – the sign of the impact is reversed.
In addition, the report presents simulated impacts at Member State, and sub-Member State, levels. The main findings in the standard no-quota scenario are:
• impacts at Member State level are not uniform; all Member States except Greece and the Netherlands increase sugar beet production, although beet revenue per hectare falls in all Member States except Romania, where it is unchanged,
• the size of the revenue fall (in absolute magnitude) is inversely related to the extent to which total sugar production (including sugar for industrial use) exceeds the sugar quota in the with-quota scenario,
• the average fall in revenue per hectare across EU27 is -5.8%,
• at NUTS2 level, impacts on production and income vary considerably across the EU and within some of the larger Member States. Moreover some regions with strong production increases nevertheless experience substantial income declines.
The consequences at Member State and sub-Member State level become more negative as an increasing market share for isoglucose is assumed.
Plausibility of the results, in particular regarding the regional distribution of isoglucose production and demand, would be enhanced if CAPRI were extended by adding an empirically supported depiction of the isoglucose sector and its interactions with the EU sugar market.
The study does not quantify the impacts on third countries in terms of welfare changes or changes in export revenues. When interpreting the very small welfare increases calculated for the EU, it should be borne in mind that other non-reported negative welfare changes are triggered outside the EU, and that these changes might fall quite heavily on particular third countries or economic groups (producers and refiners) whereas consumers are likely to gain.

1
1 INTRODUCTION
This report presents the results of a study comparing the outcomes of two alternative policy regimes in the European Union composed of 27 Member States (EU27) in the year 2020. The policy change examined involves the presence or absence of quota limits on the domestic market supply of sugar for human consumption. Information available to the authors up to the end of 2012 was included in this study, as this was the end date of the scenario analyses and editing of the report.
Quota limits on sugar production, defined at Member State level and further allocated over processing factories and individual sugar beet growers, have been in place for decades. In 2006, a reform of the CAP sugar regime brought a simplification of the quota structure, and incentives were offered to Member States that opted to reduce – or renounce altogether – their national quota limits. Quotas were prolonged until 2014/15, with no commitment to further renewal. In line with the dairy sector, where the renewal of milk quotas up to 2014/15 was subsequently formally converted to a decision terminating the milk quota regime in that year, the understanding is that 2014/15 will also mark the end of sugar quotas in the EU. This means, among other things, that market segmentation (between the markets for quota sugar, non-quota sugar and other products derived from sugar beet) will end, and a single set of prices for sugar beet and processed sugar will operate, regardless of their end use. Furthermore, it is expected that Member States with comparative advantage in sugar production will be able to expand their production levels when this looks profitable according to market signals, whereas in other Member States, where less efficient sugar production has been shielded from market forces by the quota system or where there is competition for land from other high-value crops, the sugar sector will be streamlined.
Alongside these likely impacts on beet production at Member State level, there are also concerns about implications for regions within Member States, for EU external trade and specific third-country imports, and for other related markets. It is this broader set of implications that justify a study such as the one presented here. The present study simulates the two policy regimes (quota expiry and extension of quotas for an unspecified period) in the year 2020 using a model that represents all agricultural activities and the biofuel sector, and with worldwide coverage. These results permit the differences in outcomes for the various stakeholders of the sugar supply chain, other primary producers and the size of the resulting welfare transfers to be quantified.
The model used for the study (CAPRI) is capable of following these changes through to sub-Member State (NUTS2) level. Although most of the results reported here do not go beyond the level of the Member States, some selected results (impacts on beet production and agricultural income) are presented at NUTS2 level.

2
2 THE CONTEXT: PRODUCTION, POLICIES AND MARKETS
2.1 Sugar Production in the EU
Sugar is produced in the majority of Member States. The raw materials are sugar beet, plus a small quantity of sugar cane grown in three of the French overseas departments. Sugar beet yields vary considerably, as shown in Figure 1.
Figure 1. Sugar beet yields1 by Member State, tons/hectare, average 2009-11.
Source: Eurostat. 1. Data for sugar beet production divided by sugar beet area. The figure for EU27 is for 2011 only.
Member States can be grouped into three broad categories: France, Belgium, Spain, the Netherlands and Austria had average yields in 2009-11 in excess of the EU27 mean of 71 tons per hectare. In 2011, these five Member States produced 47.5% of EU sugar beet output, on 38.0% of EU sugar beet area. A second group, consisting of Germany, UK, Greece, Czech Republic, Denmark, Sweden, Slovakia, Italy and Hungary registered average yields for 2009-11 between 55 and 65 tons per hectare, whereas the remaining Member States —Poland, Lithuania, Finland, Romania and Portugal (the Azores)— had yields below 52 tons per hectare. Overall, yields vary by a factor of more than 2 between the lowest- and highest-performing Member States. There is also considerable variation between Member States in the average sugar content of the beet grown1.
Average production costs also vary considerably across Member States. Agrosynergie (2011, p.83) provides 2006-2008 figures on intermediate consumption (derived from FADN for selected Member States) that range from 44 €/ha in Poland to 310 €/ha in Germany. For the same period, the range in average net farm income for sugar beet farming systems was even wider, from €158/ha (Italy)
1 For example, for 2007-9, sugar yield (t/ha) was 12.4 and 12.0 t/ha in the Netherlands and Spain, respectively, and 8.2 and 5.7 t/ha in Poland and Finland, respectively (Agrosynergie, 2011, Table 19).

3
to €659/ha (Germany) when decoupled direct farm payments are included, and between -€81/ha (Italy) and €448/ha (Poland) when decoupled payments are not included.
In 2012, the total area of beet production was 1,619,674 ha in EU272. About 80% of the EU27 area is in EU15. Beet was grown and beet sugar is produced in 12 Member States of EU15 (plus the Azores), but in only 6 of the 12 new Member States. The volume of sugar beet produced was 113,956,501 tons.
In 2011, the number of holdings growing sugar beet in EU27 was 155,381, with nearly three-quarters of them in EU153. Total sugar production (including white sugar as such and sugar processed into other food and non-food products, as well as sugar extracted from molasses) was 14,968,186 tons in EU27.
Table 1 shows the distribution of beet production, isoglucose production, cane sugar refining and beet ethanol production activities across Member States. Since raw sugar beet is bulky and difficult to transport, beet processing factories are located in beet growing areas. Absence of beet production in a Member State therefore implies zero production of beet sugar.
Seven Member States (five of them in EU12) have no national sweetener production at all. Bulgaria and mainland Portugal no longer produce beet sugar, but have some isoglucose production, as well as several cane sugar refineries (5 in Bulgaria, 3 in Portugal) (CEFS, 2011). The only other cane sugar refineries in the EU in 2010 were in Romania (5), and one each in southern Italy, southern France, the UK, Sweden and Finland. In addition, combined beet and cane sugar refineries are found in Romania (3), the UK (2) and Spain (1) (CEFS, 2011). The EU sugar industry is currently dominated by five EU multinationals.
Table 1. Production of beet and beet sugar, cane sugar, isoglucose and beet ethanol in Member States.
Member States having NO sugar beet or beet sugar production
Member States producing isoglucose
Member States with cane sugar refining
Member States with beet ethanol production
Bulgaria, Cyprus, Estonia, Ireland, Latvia, Luxembourg, Malta, Portugal (continental), Slovenia
Belgium, Bulgaria, Germany, Hungary, Italy, Poland, Portugal, Slovakia, Spain
Cane sugar refinery/ refineries: Bulgaria, Finland, France, Italy, Portugal, Romania, Sweden, UK
Combined beet and cane sugar refinery/refineries: Romania, Spain, UK
Austria, Belgium, Czech Republic, France, Germany, Netherlands, Poland, UK
Source: CEFS (2011).
There has been very substantial restructuring in the sugar beet processing sector since 2005, due both to the pursuit of economies of scale and to the 24% decline in the volume of production quota. The number of sugar factories fell from 179 to 106 between 2005/6 and 2009/10, with 22 of these closures occurring in Poland alone and another 15 in Italy. Countries exiting from production (Bulgaria, Ireland, Latvia, Slovenia and mainland Portugal) were responsible for a further 7 factory closures. In 2009/10, 42% of the factories remaining in production were in metropolitan France and Germany (Agrosynergie, 2011).
2 Figures in this paragraph relate to 2012, and are provided by Eurostat. 3 Figures in this paragraph are taken from CEFS (2011).

4
Over the same period the isoglucose sector has also been substantially restructured. Before the reform, there were seven isoglucose companies operating factories at 20 sites in 15 Member States. By 2010, the number of companies had been reduced to six, with the number of factories and Member States involved having fallen to 11 and 9, respectively (Agrosynergie, 2011).
2.2 Sugar policy in the CAP
The EU’s common market organisation for sugar, set up in 1968, remained largely unchanged until 2006. It was characterised by a system of supply quotas, which were defined by EU legislation for each Member State. Member States could then allocate quota to factories, as well as ‘delivery rights’ to individual growers specifying the amount of ‘quota beet’ (i.e. beet to be processed into ‘quota sugar’ attracting a high support price) they could deliver. The arrangements for transferring quota (owned by factories) and delivery rights (issued to growers) within national boundaries were a matter of national competence.
Total quota was subdivided into A- and B-quota (roughly four-fifths and one-fifth of total quota, respectively), with beet grown for B-sugar qualifying for a lower support price. Out-of-quota (‘C’) sugar could be exported but without an export refund, or carried over to the following year. When carried over, C-sugar was treated as A-sugar the following year, and the amount carried over could not be more than 20% of a Member State’s total A quota allocation. Sugar produced for certain industrial uses was outside the sugar regime; it attracted no support and could be produced in unlimited quantities.
Since 1977, the production of isoglucose (in the EU, exclusively HFS-424) for supply onto the EU market has also been subject to quota under CAP sugar sector regulations. From 1994 onwards, inulin syrup was also included within the sugar regime and subject to supply quotas5.
In 2006, the common market organisation for sugar underwent significant reform in order to align it more closely with the principles of the 2003 CAP reform. The 2003 reform involved the main arable and livestock products, for which some market price support was replaced by a non-commodity-specific decoupled direct producer payment accompanied by a reduced level of market intervention. Although the 2006 reform of the sugar regime was part of the longer-term agenda of sector-by-sector reform of the CAP, it became urgent following the WTO panel’s judgement in 2005 that the EU’s C-sugar exports could not qualify as unsubsidised. According to the ruling, these exports were ‘cross-subsidised’ by the high prices for sugar for internal use, which fully covered the factories’ fixed costs, meaning that C-sugar could be sold profitably on the world market as long as the world market price met the relatively low marginal production cost.
Table 2 summarises the changes introduced by the 2006 reform, which were fully in place by 2010 after a 4-year transition period. The main changes are the merging of A- and B-quota, the winding-up of public intervention storage (replaced by several much lighter, discretionary safety-net measures) and the (WTO-imposed) limits on out-of-quota sugar exports.
4 ‘HFS’=High Fructose Syrup. In the US, where the raw energy ingredient is corn (maize), it is known as High Fructose Corn Syrup (HFCS). In Europe, the raw materials are wheat, maize or potato starch. Of the three common formulations of isoglucose (HFS42, HFS55 and HFS90, where the number refers to the percentage of fructose and the remainder consists largely of glucose), only HFS42 is produced in the EU (Dillen et al., 2006). 5 In Europe, inulin syrup is processed from the root vegetable chicory.

5
Table 2. Policy developments and definition of policy context for the simulations. Before 2006 [Reg (EC) 1260/2001] 2006 reform [Reg (EC) 318/2006] Situation in 2010 NO QUOTA EXTENSION transition measures complete +
amending regulations1 market shares of sugar & isoglucose (1) unchanged (2) changed
Quotas A and B quotas defined and allocated to MS for sugar, isoglucose and inulin syrup
•A and B quotas merged •Incentives for Member States to renounce quota in exchange for temporary restructuring aid2
EU27 sugar quota : 13,336,741 t EU27 isoglucose quota : 690,441 t Inulin quotas renounced as from 2007
No quantitative supply restrictions on beet growing, sugar production and isoglucose production
Intervention In place, but rarely used Continues until end-2009/10 (at 80% of reference price) No intervention No intervention
Institutional prices Intervention prices:
White sugar: €631.9/t Raw sugar: €523.7/t
Reference price change over the transition period:
White sugar: -36% Raw sugar: -32.5%
Reference prices: Quota white sugar : €404.4/t Quota raw sugar: €335.2/t
Reference price for optional PSA: White sugar: €404.4/t Prices are determined by the model, according to supply and demand
Minimum beet prices
A beet: €46.72/t B beet: €32.42/t Change during transition period:
Quota beet: -20% Target price: Quota beet: €26.29/t
Abolished, beet price is determined by the model, according to supply and demand
Exports Refunds paid on quota sugar up to WTO bindings Out-of-quota ( C) sugar exported without refund
(WTO ruling) Subsidised sugar exports ≤ 1.374 million t; out-of-quota sugar exports in excess of this only if the EU can prove that they are not cross-subsidised.
•Out-of-quota export limit of 1.35 million t white sugar, 50 K t of isoglucose. •Export refunds on unprocessed sugar and sugar syrups suspended in 20084
Export limit of 1.35 million t white sugar no longer in place, no export refunds
Imports MFN tariffs Preferential agreements
White sugar: €419/t Raw sugar:€339/t EBA and ACP Bilateral agreements
•Tariff rates maintained •EBA, EPA and bilateral agreements extended •Duty-free imports of sugar and isoglucose for industrial use up to quota ceiling •New multilateral quota of 528.38K t (in-quota tariff of €98/t).
•Tariff rates maintained •Preferential agreements maintained5
•Quota for industrial imports in 2010 was 400K t (not modelled here, since it changes from year to year) •Multilateral quota of 253.98 K t.
Tariff rates maintained No change
Other arrangements
Transitional Community aid to processors and beet growers, plus possible State Aid for the latter. Private storage aid to manufacturers triggered by very low prices . Market withdrawals at the discretion of the Commission, no storage aid on withdrawn sugar.
Measures maintained
No change
1. Including Reg (EC) 1234/2007, Reg (EC) 828/2009, Reg (EC) 513/2010. 2. Reg (EC) 320/2006. 3. Net change in quota since 2006: sugar: EU25: -24.2%, EU27 : -24.1%; isoglucose : EU25: +18.2%, EU27: +15.5%. 4. Regs (EC) 947/2008 and 948/2008. 5. Unlimited duty-free access for EPA countries from 2015 onwards.

6
Sugar quota totalling 17,549,701 t was allocated for 2006/7 to the 21 sugar-producing Member States (four of the 25 Member States - Cyprus, Estonia, Luxembourg and Malta - did not produce sugar). Bulgaria and Romania also received quota when they entered the EU in 2007. As part of the 2006 reform (Regs (EC) 318/2006 and EC 320/2006), Member States of EU25 had to achieve a reduction of 6 million tons of sugar quota by the end of the transition period, preferably by voluntary renunciation of part or all of the quota allocated to them for 2006/7. Temporary restructuring aid was available to assist this process (Reg (EC) 320/2006). By 2010/11, only 19 out of 27 Member States were still producing sugar. Bulgaria, Ireland, Latvia, and Slovenia had ceased production, as had continental (mainland) Portugal. All other Member States made partial reductions to their quota holdings. After allowing for these quota renunciations and some additional quota to specific Member States, the total quota allocation for EU27 for 2010/11 and subsequent years was 13,336,741 t.
All the policy measures in place in 2010/11 (third column of Table 2) are represented when simulating the impacts of extending quotas to 2020 in our study, whereas in the different versions of the quota-expiry scenario, the only policy changes are the cessation of quota and the freeing of the price mechanism (fourth column of Table 2). All other policies (trade policies, safety net, etc) remain unchanged. In particular, once quotas are dismantled, there is just one category of sugar available to the market, and only one producer price for beet. Prices are fully market determined, but still within the constraints imposed by the border measures in force.
Table 3 shows that following the 2006 reform all Member States reduced their quota holdings, although the net rate of reduction varied greatly, with a few Member States renouncing their entire quota allocation. As a result, production became more concentrated geographically than it had been prior to the reform. In particular, in 2010/11, 47.5% of EU27 sugar quota was held by France (including its overseas departments) and Germany, as opposed to 41% in 2006. These two Member States produced about 73% of the EU’s out-of-quota sugar equivalent in 2010/11 (which, as before the reform, had to be used for export up to a binding limit, domestic industrial use or carry-over stocking).
Thirteen Member States were allocated isoglucose production quotas for 2006/7, as were Bulgaria and Romania one year later. In 2010/11,only 9 of the 27 MS still had isoglucose quota. In fact, the trend towards concentration in isoglucose production between 2006/7 and 2010/2011 was more marked than for sugar production. In 2010/11, Hungary alone was holding about one-third of total isoglucose quota, and Belgium about one-sixth. Only four Member States produced out-of-quota isoglucose in 2010/11, and about 88% of the total out-of-quota isoglucose was produced in Hungary, which supplied 19% more than its national quota.
The increase in the total amount of isoglucose quota allocated to Member States that occurred between 2006/7 and 2010/11, despite significant isoglucose quota renunciation, is explained by the fact that extra quota totalling 300 thousand tons was released to some Member States during the transition period. This was intended as compensation for potential loss of competitiveness against sugar since the (policy-induced) fall in beet prices was not accompanied by a fall in starch prices in these countries.
Regulation (EC) 318/2006 also allocates 320,718 tonnes of production quota for inulin syrup to three Member States (Belgium: 215,247 t, France: 24,521 t, Netherlands: 80,950 t). This quota was given up by the Member States concerned, and from 2007/8 onwards, the amounts allocated under these quotas have been zero.

7
Table 3. Production quotas, sugar and isoglucose, 2006/7 and 2011/12.
SUGAR ISOGLUCOSE
Production quota Net change% % of total
% over national
quota
% of EU's over-quota sugar
Production within quota Net
change %
% over national quota Member
State
2006/7 2010/11 2006/7-2010/11 2010/11 2006/7 2010/11 2006/7-
2010/11 2010/11
AUT 387,326 351,027 -9.4 2.6 26.5 3.4
BE 819,812 676,235 -17.5 5.1 11.7 2.9 71,592 114,580 60.0 0.0
BLG 0 -100.0† 89,198 0.0† 0.0
CZE 454,862 372,459 -18.1 2.8 24.3 3.3
DK 420,746 372,383 -11.5 2.8 23.2 3.2
FI 146,087 80,999 -44.6 0.6 1.5 0.0 11,872 0 -100.0
FR (met.) 3,288,747 3,004,811 -8.6 22.5 41.0 45.2 19,846 0 -100.0
FR (o’seas) 480,245 432,220 -10.0 3.2 0.0 0.0
DE 3,416,896 2,898,256 -15.2 21.7 26.1 27.7 35,389 56,638 60.0 6.4
GR 317,502 158,702 -50.0 1.2 0.0 0.0 12,893 0 -100.0
HU 401,684 105,420 -73.8 0.8 14.3 0.6 137,627 220,266 60.0 19.3
IRE 199,260 0 -100.0
IT 1,557,443 508,379 -67.4 3.8 2.6 0.5 20,302 32,493 -76.4 0.0
LAT 66,505 0 -100.0
LIT 103,010 90,252 -12.4 0.7 2.4 0.1
NL 864,560 804,888 -6.9 6.0 11.0 3.2 9,099 0 -100.0
PL 1,671,926 1,405,608 -15.9 10.5 4.3 2.2 26,781 42,861 60.0 0.0
PT(cont.) 69,718 0 -100.0 9,917 11,261 13.6 0.0
PT(Azores) 9,953 9,953 0.0 0.1 0.0 0.0
RO 104,689 -4.1† 0.8 24.1 0.9 -100.0†
SLK 207,432 112,320 -45.9 0.8 25.2 1.0 42,547 68,095 60.0 1.2
SLN 52,973 0 -100.0
SP 996,961 498,480 -50.0 3.7 6.5 1.2 82,579 53,810 -34.8 2.1
SWE 368,262 293,186 -20.4 2.2 13.2 1.4
UK 1,138,627 1,056,474 -7.2 7.9 8.0 3.1 27,237 0 -100.0
EU-27 17,549,701 13,336,741 -24.0 100.0 20.4 100.0 507,681 689,202 35.8 35.8
Source: Reg 318/2006 (Annex III), DG AGRI.
† Bulgaria and Romania received 4,752 t and 109,164 t of sugar quota, respectively, and 89,158 t and 13,193 t of isoglucose quota, respectively, on entering in 2007. Changes for these MS are shown with respect to these initial values.
2.3 The sugar market
Beet sugar counts for less than one-quarter (22% in 2009/10) of total world sugar production, having declined from over one-third in the mid-1990s. In 2010, the EU produced 66% of the world’s sugar beet crop, but just 5.6 thousand tons of the world’s 1.69 billion tons of sugar cane output (FAOSTAT). Much of the world market sugar trade is in raw sugar, whereas EU exports consist for the most part of refined sugar.
World sugar exports have increased sharply in recent years. In 2009, 51 million tons of sugar (measured in raw sugar equivalent) were exported, compared with 38 million tons in 2000. Over the same period, the percentage of world production traded on the world market rose from 29% to 33%, while the share of global exports originating in Brazil – the world’s lowest-cost producer - rose from 18% to 49% (FAOSTAT). By contrast, EU exports have fallen sharply: the share of EU15

8
in world sugar exports was 25% in 2000, but by 2009 that of EU27 was only 14% (FAOSTAT). As a consequence of the 2006 reform and the subsequent reductions in sugar production, the EU went from being a net exporter (with net exports of around 3 million tons in 2005 and 2006) to being a net importer (1.1 million tons in 2007, 1.6 million tons in 2009) (FAOSTAT).
The EU is traditionally a significant importer of sugar under various preferential trade agreements, notably from ACP countries under the long-standing EU-ACP Sugar Protocol. Starting in 2001, 50 of the world’s poorest countries (LDCs) have had duty-free access to the EU sugar market up to a quota limit under the EBA agreement6, which was removed in 2009 giving them unlimited duty-free access. The Sugar Protocol was ended by the EU in 2007. In its stead, ACP countries that were not in the EBA category were included in the EPA7 regime, which grants more general duty-free access to the EU market together with reciprocal liberalisation of market access for EU exports. Within the EPA regime, there is a transition period for sugar, which is scheduled to end in 2015. Bilateral TRQs with four sugar-exporting countries, and one multilateral TRQ open to all countries, were awarded at the time of the 1995 enlargement and increased when Bulgaria and Romania joined in 2007, to compensate sugar exporters for potential market loss8. In addition, bilateral TRQs are allocated to five Balkan countries9.
The value of the EU’s preferential trade agreements to exporting countries depends crucially on the difference between the internal EU price and the world market price (the ‘preference margin’). As a result of the 2006 reform and the 36% fall in the reference price of sugar, this margin has been eroded, although the EU market still remains very attractive for third-country exporters with preferential access. Given these trading arrangements, the effects of quota removal in 2015 on EU domestic production and prices could impact on import flows and possibly on the world sugar market as a whole, as well as on the welfare of exporting countries that depend heavily on the current 'preference margin' for sugar export revenue.
EU sugar production may also face additional competition on the domestic market from isoglucose if quotas on both products are removed. Currently, the market share of isoglucose is thought to be about 5% of the total EU sweetener market. This market share largely reflects the relative size of the production quotas for the two products and various trade restrictions, rather than technical constraints and consumer preferences. There is much speculation about how market shares might change when quotas for both products are removed.
In the US, which is the world’s largest producer and consumer of HFCS (isoglucose from maize), HFCS consumption more than trebled between 1980 and 2002, attaining a market share of about 43% of the total US (caloric) sweetener market (USDA, 2012). However, between 2002 and 2011, HFCS consumption fell by 22%, and its market share (in a shrinking total sweetener market) fell by nearly 19% to 36%10.
6 Everything But Arms. 7 European Partnership Agreements. 8 The in-quota tariff for these TRQs is €98/t, except for the small TRQ for India, which has a zero rate. 9 For more details, see Reg (EC) 891/2009. 10 The category ‘corn sweeteners’ in the US market also includes glucose syrup and dextrose, which were already consumed to some extent before the upsurge of HFCS in manufactured foods, which started in the late 1960s. The share of this total category in the US sweetener market peaked in 2003 at 56% and in 2012 had fallen to 47.6%. The decline in maize-based sweeteners reflects their deteriorating image, which is thought to be due in large part to increasing public awareness about food quality, a growing preference for more ‘natural’ ingredients, and stimulated by alleged links between HFCS and obesity (see Mercer, 2010).

9
The potential EU market share for isoglucose after quota abolition is probably much smaller than the current US share. At the start of the decade, total sugar consumption in the EU was divided in the ratio 70:30 between processed food and drinks and direct final consumption in the form of sugar (Blume, 2002), and we assume that these proportions are more or less unchanged. Isoglucose is not a substitute for pure sugar in direct consumption, but can substitute for sugar to varying degrees in the manufacturing of baked goods, confectionary, icecream and so on. In the soft drinks industry, its substitutability for sugar is high. However, per capita soft drink consumption in the EU is far lower than that in the US.
On the cost side, it was widely believed that production costs of isoglucose in the EU are considerably lower than those of sugar, although much higher than those of US HFCS (because of smaller plant sizes in the EU, more costly raw materials and the effect of being under quota). NEI (2000, Table 6.10) quotes prices for the period 1994-98 showing that average production costs for EU sugar were about 60% higher than those of EU isoglucose, whilst isoglucose production cost was about 33% higher in the EU than in the US. In the EU, isoglucose prices are set in relation to those of sugar.
According to Dillen et al. (2006), the price of isoglucose has to be 10% lower than that of sugar for it to be competitive with sugar (due to higher transport and storage costs, and lower sweetening power). These authors argue that the expected steep decrease in the sugar price as a consequence of the 2006 sugar reform, which isoglucose producers have to match, would lead to a 42-44% decline in the gross margin for isoglucose (including the value of by-products, and depending on the crop source of the starch) by the end of the transition period. This is because the cost of the raw material will not decline in line with the beet price and the extra isoglucose quota granted as compensation is too small to deliver economies of scale.
These authors conclude that a consequence of the 2006 reform will be to make the EU sweetener market less competitive. The potential worsening of the competitive position of isoglucose after the reform helps to explain the sharp concentration in isoglucose production in recent years, as producers have chosen between undertaking large increases in scale or abandoning production. It also suggests that the movement in market shares of sugar and isoglucose after quota abolition will depend quite strongly on its impact, if any, on EU sugar prices and the potential to benefit from further economies of scale for isoglucose production.
Finally, a survey of UK food manufacturers conducted in 2004 (Leatherhead Food International, 2004) found that consumer preferences and loyalties (with respect to the ‘product recipe’, which determines the taste and consistency of the product as perceived by consumers) were very important for determining the scope for food processors to substitute between sugar and other sweeteners in response to policy and market changes. In addition, technical reasons (more so for low-volume sugar users) and relative prices (more so for high-volume sugar users) were considered important for determining substitution rates. This heterogeneity increases caution about using a rule-of-thumb assumption about the impact of abolition on market shares for sugar and isoglucose.
Because of this uncertainty and in the absence of an in-depth analysis of the isoglucose market in this study, a sensitivity analysis is performed to gauge the consequences for the sugar sector of different assumptions about the relative market shares of these two sweeteners after quota abolition. In particular, two versions of the no-quota scenario assume that the isoglucose share of the EU sweetener market increases to 10% and 20%, respectively.

10
3 THEORETICAL BACKGROUND
This section provides a conceptual analysis of the impact of sugar quotas and their abolition on EU production and markets. A simple theoretical static, partial equilibrium model is used and the results are shown graphically. It predicts the main expected impacts of sugar quota expiry on regional production, EU aggregate production, prices and trade.
Our approach assumes complete market adjustment of prices and quantities. In addition, it makes several assumptions that are customarily made in economic analysis but which, in this case, have some bearing on the results. First, uncertainty and risk faced by producers are not taken into account in the framework used. The implications of this simplification for the analysis of reactions at regional level are discussed below. Second, it assumes that ‘sugar’ is a homogeneous good. As explained several paragraphs below, all quantities are expressed in ‘white sugar equivalents’, even when representing the market for sugar beet. When a good is homogeneous, basic economic theory would predict that, in the absence of relevant policy-induced constraints, a country will either import it or export it, depending on import and export prices relative to the domestic price at the margin, but not do both. Therefore, trade flows in both directions are not envisaged by basic economic theory as used in our analysis. The implications of this for our analysis of the sugar market are also discussed later in this section.
Furthermore, it should be noted that the sugar processing industry is not depicted in this representation, but this omission should not invalidate the general results.
The formal model is presented in Figure 2 (page 14). It consists of four segments. It should be noted that in each of the four panels, ‘sugar’ is defined and measured in ‘white sugar equivalents’, with the axes scaled accordingly, although in reality the commodity actually traded is sugar beet in panel 1 and raw sugar in panel 4.
To allow for regional heterogeneity, the EU is treated as consisting of two regions, region 1 and region 2. For simplicity, the two regions are assumed to have the same quota allocations but different levels of productivity. Region 1 is assumed to have lower productivity potential. Its sugar beet supply is represented by the upward-sloping curve S1 in the first panel of Figure 2. In contrast, region 2 is assumed to have greater sugar productivity potential and its sugar beet supply is given by curve S2. When quotas are in force, beet produced in region 1 is profitable only at the in-quota price whereas in region 2 some out-of-quota beet is profitable at the margin. Although it is an extreme simplification to assume just two regions, they represent the two typical cases that must be distinguished in order to understand the impact of quota removal. Starting from this simple model, a multi-regional model could be generated such that the main conclusions from the two-region model still hold.
3.1 Situation with quotas in force
Beginning with Scenario 1 (quotas in force), the regional quotas (Q1 and Q2 for region 1 and region 2, respectively) are represented by the thick vertical line in the first panel of Figure 2. It can be seen in panel 1 that region 1 does not fill its quota (production is YQ1 < Q1) whereas region 2 produces out-of-quota sugar (in the amount YQ2-Q2). It is important to bear in mind, when interpreting the figure, that the units in the first panel refer to price per unit of beet and quantity of beet, respectively. They have been scaled such that they correspond to the quantity of beet required to produce one ton of white sugar, and the price for that quantity of beet. The other three panels represent markets where sugar is traded, and refer to white sugar or white sugar equivalent (when in fact the commodity might be raw sugar).

11
The second panel in Figure 2 shows the EU sugar market. Aggregate EU sugar supply is given by curve S1, which is the horizontal summation of regional supplies YQ1 and S2. Given the price PEU
1, the supply from region 1 is unresponsive to changes in the world market prices, and hence the slope of this supply curve depends only on the price responsiveness of out-of-quota sugar supplied by region 2.
The aggregate EU sugar demand is shown as DT, which is the sum of food sugar demand, DF, and industrial (including bioethanol) sugar demand, DI (= DT - DF) as shown in the third panel. However, as explained below, this aggregate demand is not expressed in any single market as long as quotas are in force, since the quota regime effectively creates two separate markets for these two components of aggregate demand. Only in the post-quota scenario is the total demand given by DT expressed in a single consolidated market. The amount of sugar sold for food is given by YF
1. This is composed of YQ, which is the total amount of quota sugar produced in the two regions (YQ1 + YQ2), and imported sugar (YF
1 - YQ), which is shown as YM
1 in the fourth panel. Total imports can be broken down into the imports under (bilateral and multilateral) TRQs, which for the most part come from low-cost producers and with an in-quota tariff rate of €9811, and imports from EPA and EBA countries, which – by 2020 – will all be duty free and quota free (see Section 2.3). The quantity of this duty-free sugar is shown as YEPA
1 in the fourth panel.
The third panel in Figure 2 illustrates the EU out-of-quota sugar market (including industrial sugar and exports), where DI represents industrial sugar demand. The out-of-quota supply is given by an upward-sloping curve and is calculated as the horizontal difference between the aggregate sugar supply, S1, and the production of quota sugar, YQ.
This panel shows how out-of-quota sugar, whose sale within the EU does not benefit from the supported price of in-quota sugar, is allocated between the internal industrial sugar market (IQC) and the world market (IQP - IQC). The graph presented here assumes that all the out-of-quota sugar produced can either be sold for industrial use in the EU, or exported, at the world market price (the thick horizontal lines representing out-of-quota sugar in the first three panels are equal). In practice, as long as sugar quotas are in force, there is a limit on exports of 1,375 tons. It is assumed that a uniform price is received for beet whether it goes for industrial use or export. Should out-of-quota production in any given year be such that, once industrial demand is satisfied, the remainder exceeds this export limit, it is likely to be held as carry-over stock rather than being allowed to depress the price for industrial sugar below the world market price. Hence, it is assumed that both sugar for industrial use and for export receive the world market price, PW.
Figure 2 and the above discussion assume that the world market price for sugar is higher than both the minimum price for beet in sugar equivalents and the reference price for sugar12 on the respective internal markets. These prices are denoted heuristically as PQ in Figure 2. Below this price, withdrawal measures as foreseen in Regulation (EC) 1234/2007 may be used. This latter possibility is not described in the figure and is not considered in the analysis.
11 India, which has a TRQ of 10 thousand tons, is the exception. 12 Reg 1234/2007, Article 49, fixes the minimum price that processors must pay producers for beet to be processed into quota sugar at €26.29/t, and the reference price for white sugar at €404.4/t. When the average white sugar price approaches the reference price, a percentage, common to all Member States, of quota sugar, quota isoglucose and quota inulin syrup may be withdrawn from the market, to be stored by processors at their own expense until the beginning of the following marketing year, so as to prevent the EU price falling below this level.

12
The fourth panel shows the market from which the EU imports sugar. Given the very high MFN tariffs on sugar imports (see Table 2, first column), the market for sugar imports available to the EU is restricted to sugar that can be supplied under some kind of preferential arrangement (bilateral and multilateral TRQs, and the duty-free quota-free concession to EPA and EBA countries that will be fully in operation from 2015 onwards). For the suppliers of this sugar, the EU is the preferred buyer due to the high preference margin. In fact, many of these exporting countries are high-cost producers that are not competitive at world market prices. It follows that, from the EU perspective, this market is segmented from the ‘open’ world sugar market.
The EU’s demand function is the excess demand at each price, given the EU policy regime and internal price. The EU faces an upward-sloping supply curve for imported sugar, which is composed of sugar supplied by EPA/EBA countries and sugar supplied under bilateral and multilateral TRQs. When EU prices are high, the slope of this supply curve is determined by the slopes of the supply schedules of EPA/EBA countries, since much of the sugar supplied under both bilateral and multilateral TRQs comes from low-cost producers (most notably Brazil) who can be expected to fill their TRQs when EU prices are high. However, should the EU price fall below the world market price plus the in-quota tariff, the EU market becomes unattractive to these exporters, their TRQs will not be filled and the aggregate import supply function becomes more elastic.
Among the countries that supply imports under a TRQ, it is useful to distinguish between countries whose production and marketing costs are less than the world market prices (‘competitive at world market price’), and those for which the cost of producing and delivering to the world market are greater than the world market price ('not competitive at world market price’). The behaviour of these two categories of country with respect to TRQ rates is differentiated in Table 4.
Table 4. Conditions determining TRQ fill rates13.
EU price relative to the world market price
PEU > PW + in-quota tariff PEU < PW + in-quota tariff Countries whose export supply is:
Competitive at the world market price
TRQ with the EU is filled Exports switch from the EU market to the world market
Not competitive at the world market price
TRQ with the EU is filled if PEU - in-quota tariff > costs of production and transport
Not exported
Countries that are able to take advantage of a TRQ and that are competitive at the world market price will fill their TRQ allocation as long as the EU price less the in-quota tariff is higher than the world market price. When the price gap between the EU price and the world market price becomes smaller than the in-quota tariff (currently €98/t), the world market is more attractive than the EU market and these countries’ TRQ will not be filled. For this group of countries, it is the level of the EU price relative to the world market price that matters.
13 This table can also be adapted to apply countries with unlimited duty-free access. Setting the in-quota tariff equal to zero, and replacing the outcome ‘TRQ filled’ with an alternative supply limit, namely the quantity at which - for each level of price – the marginal production + delivery cost equals the EU price. For the highest-cost countries, the volume exported to the EU (or elsewhere) will become zero before the EU price falls as low as the world market price; for lower-cost countries, when the EU price falls to the world market price, they are indifferent between supplying to the EU or the world markets.

13
Countries with TRQ access that are not competitive at the world market price (and assuming they have no trade preferences in other markets) will find the EU an attractive market as long as the EU price minus the in-quota tariff exceeds their costs of producing and delivering these exports to the EU. However, once the EU price falls below costs + in-quota tariff, then there is effectively no profitable export outlet for this production, which will either not be produced at all or will be marketed nationally.
Thus, the level of the world market price matters for the EU trade flows, even though – given the high MFN tariff - EU market access occurs only under some kind of preferential agreement. The reasoning in this section explains the findings reported in Nolte et al. (2012) (see section 4 of this report) showing that (a) total imports decline as the assumed level of world market price moves from low to high (in the latter case, they are zero), and (b) Brazil continues to fill its TRQ when world market price is low or ‘standard’ but drops out of the EU market when world market price is high, whereas EPA/EBA countries supply less when world market price is standard than when it is low (as they move down their supply curves – some dropping out altogether even for the standard level assumption), and supply no imports when world market price is assumed to be high. This study is discussed further in Section 3.
The market depicted in panel 4 of Figure 2 is not the open world market; rather, it is a restricted market, created by EU trade policies, from which exporting countries that do not have a preferential agreement or participate in a multilateral TRQ with the EU for sugar are effectively excluded. This market is preferred to the open world market —by those exporting countries that can access it— because of the preference margin. Once the EU price reaches the world market price + the MFN tariff, the market depicted in panel 4 becomes the open world market, and the import supply function facing the EU becomes a horizontal line at the this price. This is not shown in the figure because, to draw it to scale would mean extending the figure considerably, and because for the analysis in this study it is assumed that EU around the level of world market price + MFN tariff not relevant14.
Although the EU is arguably oligopsonistic15 in this market, competitive behaviour is assumed. Throughout this theoretical analysis, it is assumed that the price gap between the world market sugar price and the EU price remains such that the MFN tariff rates are quite sufficient to deter any non-preferential sugar imports. Under these assumptions, the EU’s marginal ton of imported sugar is sourced from this preferential market, and hence it is the marginal supply price of this sugar to EU users (inclusive of transport and marketing costs) that determines the internal EU market price for sugar.
14 This would occur if either the world market price fell substantially, or the EU price rose substantially, relative to current and recent past levels. Given rising world demand for food, and for sugar as an ethanol feedstock, a sharp fall in the world market price is considered very unlikely. Moreover, as the ending of EU sugar quotas is expected to lower the internal price for sugar for human consumption, a steep rise in the EU price is also considered very unlikely. 15 If we envisage EU import activities being performed by a limited number of large trading or sugar-using companies.

14
For simplicity, it is assumed in the figure that the price on the open world market is not affected by the policies examined here. In reality, the world market price could be affected by changes in trade flows resulting from the cessation of sugar quotas. On the import side, this could occur because (a) some of the imports from EPA/EBA countries are competitive at world market prices and as the EU preference margin shrinks, and once transport and other transaction costs are taken into account, they are diverted to the world market or (b) some of the countries with TRQs cease to fill them since, with the €98 in-quota tariff unchanged, quota

15
Figure 2. The impact of quota abolition on EU sugar market.
YM2
Total supply of imported sugar
t
EU import market for sugar
PQ
PEU1
Price
0
S1
PQ
YQ1 YQ2
Regional quota, Q1=Q2
PW
Y22
S2
PEU1
Y
EU Regional sugar beet supply
Aggregate EU sugar market
EU out-of-quota sugar market
Price
0
DI
EU out-of-quota supply
PW
IQP Y IQC
Price
0 Y
D
YPYQ
Aggregate quota, QT
PW
YQ
S1 = YQ1 + S2
YF1 YF
2YQ1
D
IC
PEU2
Supply of EPA/EBA sugar
EU demand for imported sugar
with quota
without quota
Price
YCT2
Y21
YEPA2 YEPA
1
S2 = S1 + S2
TRQs
YM1

16
rent may disappear making the world market more profitable. Regarding (a), LMC-ODI (2012) suggests that there are few countries in the EPA/EBA group for which such a displacement would occur. To the extent that this trade diversion occurs, both (a) and (b) would increase world market supply and exert downward pressure on the world market price. Any accompanying decrease in EU exports could help to offset this pressure. In practice, the net effect is likely to be small and is not taken into account here. Thus, although the EU has been a ‘large’ country in the past in world sugar markets due to it exports, since the 2006 reform of the sugar regime and given that market access occurs only on preferential terms and subject to one or another kind of constraint, the assumption of a constant world market price built into Figure 2 is not too unrealistic.
Given this description of the sugar market conditions in which the EU operates, the price for quota sugar is PEU
1, which reflects the cost of the marginal imported ton of sugar, and the price for out-of-quota sugar is PW. In equilibrium, region 1 and region 2 produce sugar quantities YQ1 and YQ2, respectively. Region 1 does not fully use its quota (YQ1 < Q1), whereas region 2 produces out-of quota sugar, YQ2 – Q2, which cannot enter the EU market for human consumption.
In summary, in the circumstances depicted in Figure 2, the main consequence of the quota scheme is to separate EU sugar production between two markets with very different prices. Quota sugar is traded on the internal market for human consumption and out-of-quota sugar is traded only on industrial and/or international markets. Total internal sugar use is the sum of YF
1 and IQC, which in the graph are determined in two separate markets (panels 2 and 3). The two markets are loosely linked by the open-market world sugar price PW but only to the extent that the position of the supply curve for EPA/EBA sugar is conditional on the level of the open-market world sugar price.
3.2. Production and consumption effects of quota abolition
In the absence of quotas, there is no longer separation of EU sugar output between two markets with different prices. EU sugar can be sold for human consumption, industrial use and/or exported without any constraints, and all beet and sugar within the EU is sold at the same price. In Figure 2, the production and market outcomes in the no-quota situation are denoted by dotted lines and hollow bullet points, and by the superscript ‘2’ where necessary. Total internal use is given by the consolidated demand curve DT, and denoted by YCT
2. In these circumstances, with the EU domestic price free to vary according to internal market conditions and no quota constraints, the appropriate aggregate supply curve is S2 = S1 + S2.
Without any quota limits on supply, region 2 will expand its production, moving rightwards along its supply curve to Y2
2. At the same time, the industrial use of sugar, which now faces the same price as sugar for human consumption, will decline to IC (third panel). Both these behavioural reactions result in additional sugar being available on the EU market for food consumption. Furthermore, as long as there is a price gap between the EU and world markets, exports of EU-produced sugar should decline, since selling into the domestic market will be more profitable than exporting. Given the increased availability of EU-produced sugar on the home market for human consumption from these three sources (higher production in productive regions, decline in industrial sugar use and supplies diverted from the export market to the home market), the EU’s demand for imported sugar declines. Given the assumptions laid out above, the EU’s net demand for imported sugar shifts to the left, and the market clears when the internal price in the EU for the marginal ton of sugar produced and consumed equals that of the marginal ton imported, triggering a move leftwards down the
17
import supply curve to the import level YM2 in panel 4. Given our assumptions, most of the
reduction in imports is at the expense of high-cost EPA/EBA suppliers.
These adjustments cause the EU internal price, PEU1, to fall to PEU
2. The extent of this price fall depends jointly on the elasticities of the internal sugar supply and the export supply function. In theory, the elasticity of domestic demand (human consumption and industrial use) are also relevant, although in practice the elasticity of human demand is very low, and it is this elasticity that dominates the combined domestic demand price sensitivity. Figure 2 suggests a very small increase only in EU human consumption of sugar.
Finally, the lower internal price for sugar causes region 1 to reduce supply to 21Y below its
‘with-quota’ level. Hence, the net change in EU supply on the consolidated home market depends on the balance between the additional supply from regions that expand production, and the decline in supply from less EU productive regions, EBA/EPA countries and possibly also countries exporting to the EU under a TRQ. Clearly, the less elastic the supply of imported sugar, the greater the fall in the EU market price and the more likely it is that the net impact on the total quantity supplied to the home market is small. However, as already mentioned, the supply elasticity of imports is expected to increase with the narrowing of the price gap between EU and world triggered by the fall in the EU price.
The regional supply response depends on productivity. In each case, a new position is reached on the regional supply curve corresponding to the single EU price. In the environment without producer risk that is depicted here, it is expected that less productive regions that formerly produced only quota sugar will reduce supply, whereas more productive regions that produced out-of quota sugar under the old regime will increase production.
However, once producer risk is allowed for, this conclusion has to be qualified. We consider a case where, under the quota regime, the last ton of beet produced within the quota still earns considerable ‘quota rent’ (that is, the price for quota beet minus the marginal cost of production is significantly positive) while the first ton of out-of-quota sugar would incur a small loss (that is, the price for out-of-quota beet minus the marginal production cost is negative). Basic economic theory suggests that if yield were known with certainty, the producer or the region would produce each year exactly on quota. However, when yield is variable and therefore uncertain, and when the average loss on over-quota units (averaged over high-yield years) is less than the average loss of quota rent (averaged over low-yield years), the producer or region would aim to produce slightly over quota although strictly speaking over-quota production is not profitable. This behaviour can be viewed as a kind of insurance against expected loss in the face of uncertain yields16. In such cases, observed over-quota production is not a fully reliable predictor of output expansion when quotas are no longer in force.
Returning to the risk-free environment assumed in Figure 2, where all sugar —regardless of origin— is considered to be a homogeneous good, the aggregate EU sugar supply expands from YQP to YP, thereby replacing imports, which fall from YF
1 – YQ (=YM1) to YCT
2 - YP (=YM2).
The share of non-TRQ imports (i.e. imports from EPA/EBA countries) in this smaller total falls.
Now that all sugar produced in the EU may be sold without constraints on both the EU market and the world market, the simple theory underlying Figure 2 predicts that home production will replace imported production as long as EU prices are lower than world market prices + the
16 It should be noted that the model used for the analysis (CAPRI) allows for this type of behaviour.

18
MFN tariff, taking into account the quantities imported under TRQs and from EPA/EBA countries that are competitive at EU prices. It follows that no EU sugar would be exported unless the domestic price is driven down by increased supply to the world market level. At the same time, our theory suggest that imports would cease once the preference margin (allowing for any in-quota tariff) is eliminated for all potential import sources, since at that point the EU market would have no price advantage for any other exporting country. Thus, at higher EU prices, the EU imports, then over a small range of prices it may be autarkic, and below that range it exports. This reasoning assumes that imported and domestic sugar are homogeneous goods, and predicts that the EU will not import and export simultaneously.
In reality, however, many basic products that, at least superficially, could be thought of as homogeneous, are both imported and exported by developed countries. This is also the case for the EU and sugar. To adapt the figure in order to give a full and rigorous account of why this occurs would make it very complicated. Instead, we give a qualitative explanation of why it is likely to happen (in both scenarios).
The presence of both imports and exports in Scenario 1 (quotas in force) is easily explained by the strong market segregation caused by EU sugar policy. Imports are either from low-cost sugar-producing countries that also trade on the world market but whose quantity allowed into the EU is limited by tight TRQs, or from higher-cost ACPs and LDCs for whom the EU is the preferred - or perhaps the only - export market. On the other hand, EU exports consist of out-of-quota sugar that cannot be sold on the domestic market, and whose exports are subject to a quantity limit. Thus, there is no effective competition between imports and exports on the domestic market for food use.
In Scenario 2, all sugar produced in the EU may be either used internally or exported, depending on relative prices. Moreover, the limit on EU exports is removed although the other trade measures described in Table 2 remain in place. Basic economic theory suggests that it would be irrational to export EU sugar at a world price that is lower than the internal price and the marginal price of imports. However, this ignores the fact that imports and exports of ‘sugar’ are not fully substitutable. Imported sugar is largely raw cane sugar, which is refined in the EU, whereas exported sugar is mainly refined white sugar. Thus, each product faces its own demand conditions. Imported sugar is demanded by the refineries that process it further for the EU market or possibly by non-food processors that use it as a direct input into an industrial process17, whereas exported white sugar is demanded by importing countries with insufficient refining capacity of their own to serve their human consumption market. These two forms of sugar are, in fact, differentiated goods, around which market preferences – based on technology, commercial practices and established supply chains – have developed.
When the EU price of sugar falls in Scenario 2, Figure 2 shows that imports are expected to fall because some suppliers find the lower EU price unattractive or unprofitable. It is not possible to explain, in this simplified theoretical model, why EU producers would accept to sell their refined sugar at a world market price below the one inside the EU, as may have happened in some recent years. To do so would require adapting the model to include further differentiation of sugar and of preferences, and/or market imperfections18. What is not shown
17 Note that raw sugar production is not an intermediate stage in producing ethanol from sugar beet or cane. 18 The CAPRI model uses the Armington assumption to recognise that domestic production and imports are not perfect substitutes, and that trade flows in both directions can exist simultaneously. This allows preferences based solely on relative prices to be modified by past empirical trade patterns, which are taken to reflect ‘market preferences’ for different types of sugar according to their origin. The Armington elasticity for sugar in

19
in our simple figure is that, in the differentiated world market for refined white sugar, there may be some demand for EU sugar at prices above the world market price. Moreover, in the quota-extension scenario, there is a WTO binding on EU sugar exports which is lifted in the quota-expiry scenario. Thus, the niche demand for higher-priced EU white sugar on the world market may not have been fully met in the quota-extension scenario, and hence EU exports could even (theoretically) increase in Scenario 2 due to the removal of this constraint and the resulting decrease in the gap between the EU and world market prices.
Summarising this analysis, the main expected impacts of quota expiry can be listed as follows:
• beet (and hence, sugar) production tends to increase in regions formerly supplying out-of-quota sugar, although this may not occur in reality in cases where a very small quota over-shoot was observed in most years, whereas it declines in regions that previously produced only quota sugar;
• total EU sugar supplied onto the consolidated EU market increases;
• domestic human consumption increases;
• industrial use of EU sugar declines due to the price increase facing these users;
• total EU domestic use of sugar increases, but this impact is likely to be small;
• imports fall, whereas the reaction of exports depends on the degree of differentiation between EU and non-EU sugar, both on the EU market and on the world market;
• the share of imports from high-cost EPA/EBA countries falls.
The above effects are conditional upon there being a significant fall in the price of the marginal ton of imported sugar. It is worth describing the two limiting cases in this process. (1) imported sugar supply is perfectly elastic at the EU with-quota price, and there is no change in the internal EU price after quota removal. In this case, more productive regions expand supply but less productive regions would not reduce their supply, and hence the aggregate EU production response would be greater. This means that the adjustment through trade flows would be more extreme. Imports from EPA/EBA countries could be drastically reduced. (2) imported sugar supply is very inelastic, and there is a large fall in the internal EU price. In this case, aggregate EU sugar production could actually fall (due to much larger reductions in less productive areas and smaller increases in more productive regions), internal demand would increase by more, and import flows would be less affected. However, quota rents for countries exporting to the EU under preferential agreements would be squeezed to a greater extent.
3.2 Income effects
Here, for simplicity, the absence of producer risk is assumed. The regional income change experienced by beet producers will vary depending on whether the region previously had out-of-quota sugar (due to greater comparative advantage in sugar production).
The impact is illustrated in Figure 3 at regional level. Following previous analysis, it is assumed that quota removal reduces the EU sugar price from PEU
1 to PEU2. In region 1, which
had no out-of quota sugar, income (producer surplus) falls by area A due to the price and quantity fall. In region 2, producer surplus on (previous) quota sugar declines (loss of the area A + B) but increases on amounts above that (area C). The overall effect depends on how much
CAPRI is 10, which is one of the highest in the model, but still sufficiently low that imports and exports do not eclipse each other as the relative magnitude of their prices switches.

20
is produced beyond the old quota limit. If out-of-quota sugar was substantial and the production response when quotas are removed is strong, then region 2 is more likely to gain (i.e., area C > area A + B). However, it is also possible that area C < area A + B, in which case there would be an income loss although producers are still maximising their profit and producing at optimal levels given each policy regime. Thus, for regions formerly producing out-of-quota sugar, the income effect cannot be unambiguously determined.
In summary, it is expected that income decreases in regions with no out-of-quota sugar, whereas in regions with out-of-quota sugar the effect is indeterminate. Aggregate income may increase or decrease depending on the balance between regions that gain relative to those regions benefiting from the quota abolition.
Figure 3. Effect of quota removal on regional production and income.
A
0
S1
PQ
YQ1 YQ2
Regional quota, Q1=Q2
PW
S2
PEU1
Y
C PEU
2 B
Y22
Y12
Price
21
4 PREVIOUS STUDIES OF EU SUGAR QUOTA ABOLITION
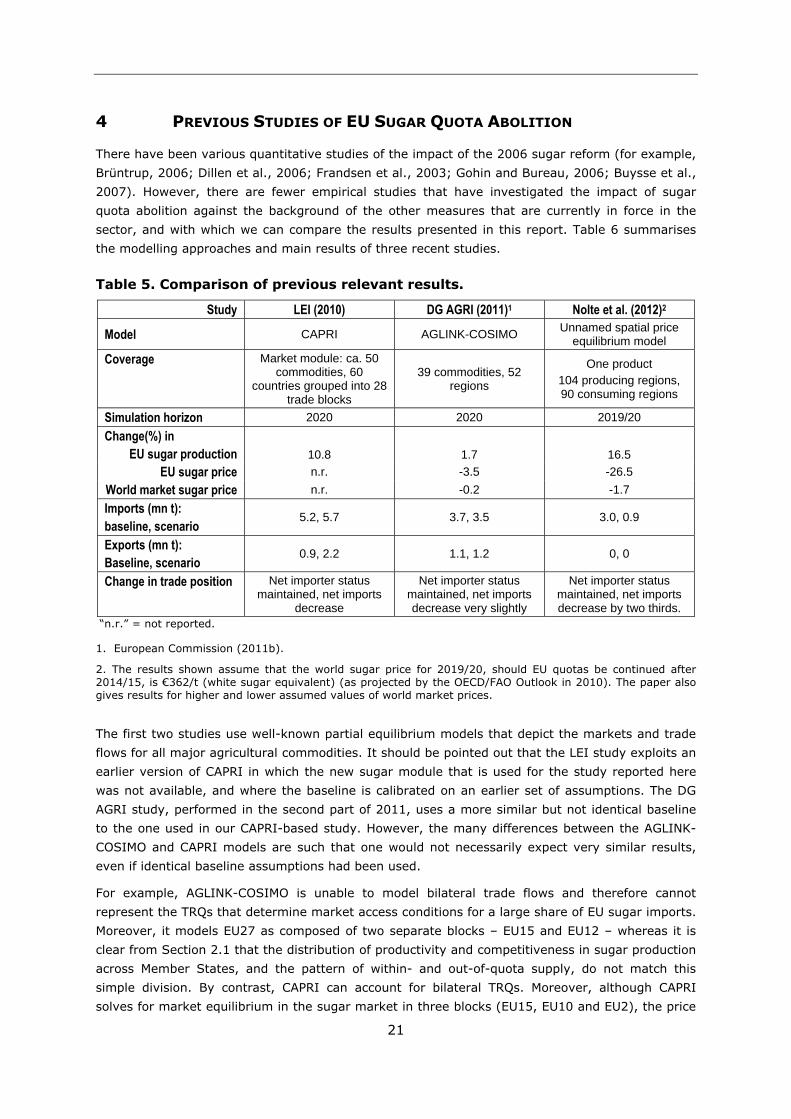
There have been various quantitative studies of the impact of the 2006 sugar reform (for example, Brüntrup, 2006; Dillen et al., 2006; Frandsen et al., 2003; Gohin and Bureau, 2006; Buysse et al., 2007). However, there are fewer empirical studies that have investigated the impact of sugar quota abolition against the background of the other measures that are currently in force in the sector, and with which we can compare the results presented in this report. Table 6 summarises the modelling approaches and main results of three recent studies.
Table 5. Comparison of previous relevant results.
Study LEI (2010) DG AGRI (2011)1 Nolte et al. (2012)2
Model CAPRI AGLINK-COSIMO Unnamed spatial price equilibrium model
Coverage Market module: ca. 50 commodities, 60
countries grouped into 28 trade blocks
39 commodities, 52 regions
One product 104 producing regions, 90 consuming regions
Simulation horizon 2020 2020 2019/20 Change(%) in
EU sugar production 10.8 1.7 16.5 EU sugar price n.r. -3.5 -26.5
World market sugar price n.r. -0.2 -1.7 Imports (mn t): baseline, scenario
5.2, 5.7 3.7, 3.5 3.0, 0.9
Exports (mn t): Baseline, scenario
0.9, 2.2 1.1, 1.2 0, 0
Change in trade position Net importer status maintained, net imports
decrease
Net importer status maintained, net imports decrease very slightly
Net importer status maintained, net imports decrease by two thirds.
“n.r.” = not reported.
1. European Commission (2011b).
2. The results shown assume that the world sugar price for 2019/20, should EU quotas be continued after 2014/15, is €362/t (white sugar equivalent) (as projected by the OECD/FAO Outlook in 2010). The paper also gives results for higher and lower assumed values of world market prices.
The first two studies use well-known partial equilibrium models that depict the markets and trade flows for all major agricultural commodities. It should be pointed out that the LEI study exploits an earlier version of CAPRI in which the new sugar module that is used for the study reported here was not available, and where the baseline is calibrated on an earlier set of assumptions. The DG AGRI study, performed in the second part of 2011, uses a more similar but not identical baseline to the one used in our CAPRI-based study. However, the many differences between the AGLINK-COSIMO and CAPRI models are such that one would not necessarily expect very similar results, even if identical baseline assumptions had been used.
For example, AGLINK-COSIMO is unable to model bilateral trade flows and therefore cannot represent the TRQs that determine market access conditions for a large share of EU sugar imports. Moreover, it models EU27 as composed of two separate blocks – EU15 and EU12 – whereas it is clear from Section 2.1 that the distribution of productivity and competitiveness in sugar production across Member States, and the pattern of within- and out-of-quota supply, do not match this simple division. By contrast, CAPRI can account for bilateral TRQs. Moreover, although CAPRI solves for market equilibrium in the sugar market in three blocks (EU15, EU10 and EU2), the price

22
for sugar beet is determined at Member State level, and production impacts can be disaggregated to NUTS 2 level. On the other hand, unlike CAPRI, AGLINK-COSIMO can simulate trade in biofuels19 as well as the workings of the EU isoglucose sector (production, use and net trade in isoglucose, and the links between the isoglucose and sugar markets).
Comparing the first two studies, it turns out that the impacts reported from the LEI study are somewhat larger than those obtained by DG AGRI with AGLINK-COSIMO. Indeed, the impacts obtained from the AGLINK-COSIMO simulation are modest, and well within the margin of error to be expected with this type of model. Likewise, the impacts on EU isoglucose production and use obtained with AGLINK-COSIMO (not shown in the table) are small: with the expiry of quota, isoglucose production is 2.3% higher, use is 1.5% higher, and the EU’s net exporting position is very marginally increased compared with the increase that would have occurred if quotas had been extended. In conjunction with a 0.3% increase in domestic food use of sugar, this implies a slight decrease in sugar’s share of the EU sweetener market.
AGLINK-COSIMO and CAPRI, being partial equilibrium models that focus on agricultural markets and trade, do not endogenise all forces acting on world and domestic sugar prices. This can be considered a limitation now that agricultural commodity markets are more closely linked to those of other sectors because of their greater sensitivity to developments in energy markets. Sugar, as a major feedstock for ethanol in world terms, is one of the specific commodities through which these links operate. Therefore, the DG AGRI study included a sensitivity analysis on the (exogenous) level of world sugar prices.
The DG AGRI study results given in Table 5 correspond to a scenario in which the world market price for white sugar is not fixed. It is simulated by the model as €313/t in the baseline, and €312/t in the quota abolition scenario. A second scenario was run in order to perform a sensitivity analysis on the level of world market price, assuming it to be fixed at €250/t in both the with-quota scenario and the quota expiry scenario.
When the world market price is held fixed at €250/t in both the scenarios, the EU is a net importer on a greater scale (4.43 million tons in the quota-extended scenario, falling to 3.96 million tons in the quota-expiry scenario), and the imports from the EPA/EBA countries fall by 9.4%. The most striking difference compared with the results based on the higher (endogenous) world market price is that beet and sugar production fall in the EU (both by 3.9%) and the fall in the producer price of white sugar is larger. Moreover, the share of isoglucose in domestic sweetener demand is somewhat smaller.
The model used by Nolte et al. (2012) contains just one product – sugar – and assumes the expiry of sugar quotas in 2014/15. The impacts on EU production and on prices, and on the EU’s trade position, are shown to be highly dependent on the world market price for sugar, which is exogenous in the model. We note that the level of this price is set exogenously in the no-expiry scenario for 2019/20 at €362/t (as projected by OECD and FAO (2010)), which is somewhat higher than the value calculated endogenously by AGLINK-COSIMO (2011). When Nolte et al. assume the world market price to be €292/t (1 standard deviation lower than the central projected value), EU sugar production is still 9% higher without quotas than if quotas were continued, which contrasts strongly with the AGLINK-COSIMO result based on a low (€250/t) world market price. When the world sugar price is assumed to be €431/t (1 standard deviation higher than the central projection), the EU price without quotas is 54.4% lower than its value if quotas are continued
19 Shortly to become available in CAPRI.

23
(€630/t), EU production is higher by 32% than with quotas and the high world market price, and EU imports go to zero.
With the central price assumption, ten Member States have higher production in the no-quota situation than if quotas were extended, whereas nine Member States (ES, FIN, GR, HU, IT, LT, PT, RO, SLK) have lower production levels. Output in France and Germany is much higher without quotas (taken together, an increase of 25%). Clearly, this model assumes a much more robust reaction to quota expiry than AGLINK-COSIMO, and implies that the constraints imposed by the quota regime (and the corresponding quota rents earned on quota sugar) are much higher – for some Member States – than those implicit in AGLINK-COSIMO.
The first two studies summarised in Table 5 do not report the impacts on import flows by country of origin20 whereas the study by Nolte et al. gives considerable detail on this issue. According to Nolte et al., EU quota expiry will put an end to sugar imports into the EU from all (non-ACP) LDCs, regardless of the level of the world market price that is assumed21. By contrast, the EU would still import sugar from ex-ACP countries (but at much lower levels) when world market prices are assumed to be at the central level projected by OECD-FAO or below. Of the 12 ex-ACP countries or blocs of countries that would provide EU imports in 2019/20 should quotas remain in place, seven would still export to the EU without quotas in the low-world-market-price scenario, but only three (Mauritius, Swaziland and Fiji) would remain as import sources when the central price projection is used. As already stated, when the high level of world market prices used in the study is assumed, all imports are zero.
A simulation study by LMC-ODI (2012), performed with an unnamed model whose characteristics are not described, also finds that the impact of EU quota removal on EPA (ex-ACP) countries and LDCs depends on world market price levels. When world market prices are high, EU imports fall with quota removal, squeezing out some EPA and LDC imported sugar, but when world market prices are low, impacts on import flows are far smaller. This study classifies the main EPA and LDC sugar-exporting countries according to whether they are high- or low-cost producers, and whether or not they have access to alternative markets when import demand from the EU falls22. The results are a reminder that sugar-exporting EPA countries and LDCs cannot be considered as homogeneous blocks when analysing the impacts of EU sugar quota abolition.
20 In the main quota abolition scenario presented by DG AGRI (2011), aggregate imports from the EPA and EBA countries fall by 6.5%. 21 In the with-quota scenario and based on the central projection for the world market sugar price, the EU would source 18% of it sugar imports from these countries. 22 Five countries - Barbados, Belize, Mauritius, Guyana and Fiji – are in the worst situation (high cost + limited access to alternative markets). Seven countries – Cambodia, Ethiopia, Malawi, Sudan, Tanzania, Zambia and Zimbabwe – are in the best-case position (low cost + access to alternative markets).

24
5 THE CAPRI MODEL
5.1 Main features of CAPRI
CAPRI is a spatial, partial equilibrium (PE) model specifically designed to analyse CAP measures and trade policies for agricultural products (Britz and Witzke, 2008). It consists of two interlinked modules, the supply module and the market module, which allow production, demand, trade and prices to be calculated simultaneously and interactively.
The databases used by CAPRI come from well-documented, official and harmonised data sources, for the most part EUROSTAT, FAOSTAT, OECD and extractions from the Farm Accounting Data Network (FADN). The organising principle of the CAPRI supply module database is an ‘Activity Based Table of Accounts’, where activity levels (measured in hectares, livestock numbers etc) are linked to inputs and outputs via technical coefficients, and to values via prices. The connection between the individual activities and markets are the activity levels.
The supply module consists of regional agricultural supply models for EU27, the Western Balkans, Norway and Turkey, which depict farming decisions in detail at the NUTS 2 level (cropping and livestock activities, yields, farm income, nutrient balances, GHG emissions, etc.). Its mathematical programming approach allows a high degree of flexibility in modelling CAP measures as well as in capturing important interactions between production activities, and with the environment.
The market module is a deterministic, partial, spatial model with global coverage, where about 50 commodities (primary and secondary agricultural products) and 60 countries grouped into 28 trade blocks are modelled. It is spatial as it includes bi-lateral trade flows and policies between trade blocks in the model. The supply and market modules are linked iteratively.
The CAPRI model uses a two-stage Armington system in order to model substitution between imports, and between imports and domestic sales. In this system, a Constant Elasticity of Substitution (CES) function allows the model to capture the pure economic behaviour of agents (through the relative changes in import price and substitution elasticities), but also to take account of a 'preference' given to imports from a specific origin (through shares of historical import flows). This means that trade flows are not driven solely by the difference between domestic market prices and import prices.
Within the EU, perfect markets are assumed for all products such that prices for all Member States move together within a market block23. The parameters of the behavioural equations for supply, feed demand, processing industry and final demand are taken from other studies and modelling systems, and calibrated to projected quantities and prices in the simulation year. Major outputs of the market module include bilateral trade flows, market balances and producer and consumer prices for the agricultural commodities and world country aggregates.
Final demand functions are derived from indirect utility functions of consumer prices and per capita income, specified as Generalised Leontief functions, which observe all required theoretical properties of demand systems. For traded products, the model uses a two-stage Armington system described above. The higher level determines the composition of total demand from imports and domestic sales as a function of the relation between the internal market price and the average import price. The lower stage determines the import shares from different origins. The substitution elasticity on the higher level is smaller than for the lower one, i.e. consumers are less
17 CAPRI models the internal market as consisting of 3 blocks: EU15, EU12 and EU2 (Bulgaria and Romania).

25
flexible in substituting between domestic and imported goods than between imported goods of different origins. For most products, the substitution elasticities are 8 for the upper level and 10 for the lower level24. This latter elasticity is rather high compared to other models.
CAPRI models both erga omnes and bilateral TRQs25. To deal with the discontinuity in import price caused by the TRQ, a sigmoid function is used, which effectively smooths the ‘kinks’ that occur at the two points of discontinuity. CAPRI can handle both ad valorem and specific tariffs, both for MFN tariffs and in-quota tariff for TRQs.
Welfare analysis is conducted in CAPRI based on the classical elements of consumer and producer surplus. Changes in consumer surplus measure the changes in consumers’ purchasing power resulting from a (policy-induced) price change. On the producer side, CAPRI uses changes in gross value added (defined as the difference between revenues and intermediate input costs including direct payments) as the main indicator. Taxpayer costs refer to the CAP policy instruments explicitly covered in CAPRI, i.e. direct payments, market intervention, export subsidies, etc., financed by EU or national budgets, minus revenues from import tariffs.
Among CAPRI’s strengths are the rich detail on the supply side of the model and its ability to provide results for the EU at sub-Member State (NUTS 2) level26, whilst at the same time being able to model global world agricultural trade, with the EU’s most important trade partners separately identified and bilateral trade flows between them and the EU accounted for. This makes it well suited for the questions posed here in this study. Nevertheless, certain caveats apply regarding the sensitivity of results at NUTS 2 level with respect to the modelling of isoglucse (explained in Chapter 5.2).
5.2 Modelling the EU sugar market and sugar policies in CAPRI
Since the base year of the current version of CAPRI is 2004, the model has to incorporate the policies in force before the 2006 reform and also allow these policies to change according to the 2006 reform27. Sugar beet quotas are defined in the legislation at Member State level. Each Member State allocates its quotas to sugar factories that distribute them in the form of 'delivery rights' to growers. Quotas are fixed in the legislation for white sugar and therefore need to be converted to their sugar beet equivalent using a processing coefficient, which is specific to each Member State. Quota (A and B) available at regional level has to be calculated within the model, taking account of over-quota production.
The price transmission from EU sugar prices to beet prices is also modelled. A- and B-beet prices are linked to EU sugar prices, whereas C-beet prices are linked to world market prices. The value of the by-product molasses is taken into account in this price conversion. Some Member States28 did not apply the classic scheme of A- and B-quotas but rather a 'pooled' price system averaging A- and B-sugar prices. This is recognised in CAPRI for the pre-2006 period. Those new Member States that joined before 2006 are assumed to apply the classic A-B quota system.
24 This upper-level elasticity for sugar in CAPRI is 10, which indicates that whilst imported sugar can substitute for domestically produced sugar, the EU market treats them as far-from-perfect substitutes. 25 CAPRI assumes that countries fill bilateral TRQs first, then attempt to profit from erga omnes TRQs, which are filled by countries in declining order of price-competitiveness. 26 CAPRI calculates agricultural producer prices at Member State level, so a particular ‘EU producer price’ is an average of these prices. Prices at NUTS2 level within a Member State, are identical to the corresponding Member State prices. 27 For more details, see Adenäuer (2005).

26
There is also a price link to the ethanol industry. This link recognises the policy constraint whereby out-of-quota beet can be sold within the EU only for industrial use and only at an unsupported price.
In order to account for the production of C-sugar or, from 2006 onwards, out-of-quota sugar (whose marginal production cost is generally higher than that of competing crops), an expected-profit maximisation formulation is used for sugar supply, where the motivation for planned out-of-quota production is insurance against yield uncertainty. Country-specific estimates of risk aversion are derived. However, even the expected profit maximisation framework is unable to fully explain over-quota production in some Member States (Austria, Denmark, France, Germany and the UK). Therefore, the marginal cost function was calibrated to historically observed beet production.
In order to adapt the CAPRI model for this study, careful attention was paid to the depiction of the various TRQs involving sugar (for details of these TRQs, see section 2.3).
In the quota-extension scenario, sugar beet areas in Member States were calibrated in CAPRI so as to be consistent with the 2011 AGLINK baseline including sugar quotas. These projections indicate an increasing trend in total acreage of beet (for sugar and industrial use combined) up to 2020 if quotas are extended to that year. This increase is driven by a strong response from sugar growers to increasing demand for sugar as a feedstock for ethanol, which in turn is stimulated by the low beet price to industrial users as long as quotas remain. Of course, this price advantage disappears when quotas expire29.
In addition, for the sensitivity analysis concerning the share of isoglucose in the EU sweetener market, it was necessary to translate the different assumptions about this share into assumptions about the corresponding impact on sugar demand. This adaptation has two aspects. First, the total size of the sweetener market in the baseline 2020 has to be calculated. This was done on the basis of the AGLINK-COSIMO baseline figures, adjusted to conform with assumed shares of isoglucose of 10% and 20%. A linear approximation scaled these figures to meet the corresponding total sweetener and sugar use in CAPRI30.
In theory, a further adjustment should be made to account for the fact that additional wheat and maize will be demanded as isoglucose feedstocks. This requires converting the increase in isoglucose production into extra demand for wheat and maize (by assumption, in proportion to the existing use of these feedstocks for isoglucose)31. These demand changes (sugar, wheat and maize) are not allocated to any particular Member State, although it can be expected that isoglucose production would react according to available production capacities, which at present are limited to certain Member States (see Table 1). As the isoglucose sector is not modelled in CAPRI, a simplified approach was taken that assumes a proportionate general decrease or increase in all Member States, i.e. without considering actual or expected potential. This assumption leads to a less distortive distribution of results at NUTS 2 level, compared to an alternative approach that would assume an allocation of demand changes to particular Member States or geographical
28 Spain, Portugal, Italy, Belgium, Ireland, Greece and the United Kingdom. 29 When CAPRI is calibrated to lower estimates of 2020 acreages, extrapolated from current trends, most of the impacts of quota expiry are broadly the same. It turns out that the differences that do occur affect the more sensitive issues (imports from third countries – especially poorer countries benefiting from unlimited duty-free access – and impacts for a few Member States). 30 Note that, when the quota-extension scenario is run AGLINK-COSIMO, the (endogenous) share of isoglucose in the total EU sweetener market is 3.4%. 31 For the conversion rates between wheat and maize, and isoglucose, see Appendix 1.

27
regions based on production capacities. While the aggregate impact would be similar, the latter approach would depict a more diverse distribution of impact at Member State and NUTS 2 levels.
A trial run indicated that the effects of allowing for additional demand for wheat and maize when isoglucose production is assumed to increase are extremely small. Therefore, this adjustment is not incorporated in the results presented below.
5.3 Scenarios examined in this study
The purpose of this study is to compare the situation after the expiry of sugar quotas with a situation in which sugar quotas are extended and still in place in 2020. Thus, as far as the policy settings are concerned, there are only two alternatives – with and without sugar quotas. Since isoglucose quotas are in place only as a countervailing measure to sugar quotas, they too will be removed in the scenario depicting the expiry of sugar quotas. Since isoglucose demand is not modelled in CAPRI, the impact of the expiry of isoglucose quotas on isoglucose demand, and the inroads that isoglucose might make into the sugar market, cannot be simulated simultaneously with that of sugar quota expiry, and hence it is impossible to calculate endogenously – based on the estimated impact of sugar quota removal on sugar demand – what the resulting shares in the total sweetener market for sugar and isoglucose would be.
Therefore, because of uncertainty regarding the impacts of quota expiry in the isoglucose sector and its interactions with sugar markets, a total of three no-quota scenarios were examined. Specifically, the uncertainty regarding isoglucose concerns the extent of substitution of sugar by isoglucose in the sweetener market when quotas for both products no longer exist. Our expiry scenarios represent three different possibilities. The first corresponds to the assumption that there is no substitution between sugar and isoglucose. In this case, sugar demand in the no-quota situation is calculated within CAPRI using a demand function that does not contain a cross-price elasticity for isoglucose. Effectively, developments in the isoglucose market are ignored. It should be borne in mind that this scenario implies no assumption about the share of sugar in the total sweetener market, and that current market shares would be maintained in the expiry situation only if the demand for each product reacts in the same proportion. In other words, by assuming that there is no substitution between the two sweeteners, CAPRI’s demand function for sugar gives the corresponding domestic sugar consumption independent of isoglucose. The share of isoglucose here remains indeterminate.
The other two no-quota scenarios assume that there is substitution between sugar and isoglucose. Specifically, it is assumed that the market share of isoglucose in the total sweetener market increases to 10% and 20%, respectively32. To model these scenarios, the demand functions for sugar are shifted downwards by the relevant amounts. These are exogenous, manual adjustments and do not work inside the model via price responses and cross-price elasticities, or substitution elasticities. The various scenarios are summarised in Table 6.
32 The share of isoglucose in the total sweetener market is thought to be currently about 5%. CAPRI has been calibrated to the baseline of the AGLINK-COSIMO model, which simulates the share of isoglucose in the sweetener market with quota extension at 3.4% in 2020. However, since CAPRI does not model isoglucose, it is not possible to say with precision what the implicit share is in the with-quota scenario simulated with CAPRI, or in the first no-quota scenario in which no share has been explicitly assumed and imposed when simulating with CAPRI.

28
Table 6. Scenarios simulated in this study.
Sugar quotas are extended to 2020
Sugar quotas expire in 2015/16 and are no longer in force in 2020
Scenario 1 Scenarios 2.*
Scenario 2.00 No substitution between sugar and isoglucose Scenario 1 Scenario 2.10(20): Isoglucose share of sweetener market
increases to 10(20)%
CAPRI is a comparative static model, and its policy comparisons relate to a particular year. In this study, year of the comparison is 2020, and all exogenous variables are calibrated to their projected values for this year (which have been obtained from other sources, in particular the DG AGRI outlook projections, see European Commission, 2011a). Table 7 presents the most important of these exogenous assumptions, which are crucial for driving the model in both scenarios.
Table 7. Exogenous assumptions for 2020, both scenarios.
Macroeconomic variable Value/growth rate Source
Population (country-specific) For EU27, +0.25% p.a. (2009-2020), reaching 513, 974.98 million in 2020
UN Population Statistics 2020
Exchange rate USD/EUR 1.5 DG ECFIN Crude Oil (USD/barrel) 118 DG ECFIN GDP index (2005=1) EU15
EU12 1.22 1.70
Eurostat
EU biofuel targets (as specified in the Renewable Energy Directive1)
Filled
1. Directive 2009/28/EC.

29
6 RESULTS
6.1 Production, imports and exports
As Table 8 reports, the simulations show that sugar beet production in 2020, with quotas in force, would be as nearly as high as its 2004 level, despite both the 2006 reform of the sugar regime, which resulted in the net removal of more than 5 million tons of sugar quota, and the cessation of export refunds for sugar in 2008. This implies that other counterbalancing factors, like the increased demand for biofuels to fulfil the renewable energy target for 2020 in the transport sector, are assumed to exert a strong countervailing pressure, replacing virtually all of the renounced quotas for human consumption, much of which had to be exported.
Table 8 compares the production of beet, sugar produced from beet and other related commodities and products, in the different scenarios, assuming the AGLINK-based reference scenario. Production of beet and sugar from beet is higher in the without-quota scenarios. However, as the assumed share of isoglucose in the sweetener market increases, the differences in production relative to the with-quota situation become smaller.
It has to be recalled throughout this report that CAPRI aggregates the production of all uses of sugar beet, measured in white sugar equivalent, under the heading of ‘sugar production’. Therefore, the figure given in Table 8 of 20.096 million tons of sugar produced in the with-quota scenario (Scenario 1) includes not only quota sugar and out-of-quota sugar, but also the sugar equivalent of ethanol and other non-food commodities, produced either directly from sugar beet or using sugar as an ingredient.
Table 8. Production.
Scenario 2.00
Scenario 2.10
Scenario 2.20
Scenario 2.00
Scenario 2.10
Scenario 2.20
Variable Base year
2004 Scenario 1
2020 Increased market share
of isoglucose Increased market share
of isoglucose
No IG substit-
ution IG=10% IG=20%
No IG substit-
ution IG=10% IG=20% Change with respect to Scenario 1 Change with respect to Scenario 1
1000 tons 1000 tons Per cent
Sugar beet1 128,904.7 126,442.3 4,902.6 2,976.4 194.8 3.88 2.35 0.15
‘Sugar’ 20,325.7 20,096.7 851.5 539.7 67.5 4.24 2.69 0.34
Total cereals1 254,400.0 318,555.3 279.0 190.2 46.9 0.09 0.06 0.01
Soft wheat1 133,232.3 143,981.1 159.5 105.1 17.9 0.11 0.07 0.01
Barley1 57,609.9 58,290.6 17.2 13.4 5.9 0.03 0.02 0.01 Grain Maize1 62,058.8 66,688.0 60.2 39.4 9.3 0.09 0.06 0.01
Oilseeds1 17,116.9 32,643.1 -9.1 0.2 11.7 -0.03 0.00 0.04
1000 tons oil equivalent2 1000 tons oil equivalent Per cent
Ethanol 1,187.5 9,756.8 7.5 7.9 13.8 0.08 0.08 0.14 Biodiesel 1,863.2 13,265.1 -0.3 -0.3 -0.2 0.00 0.00 0.00
1. Gross production (including losses and on-farm use) (i.e. area × yield). Gross production is reported rather than net production for all the crops in the table, because CAPRI reports only the former for sugar beet.
2. The rates of conversion between weights and volumes in this table can be found in Appendix 1.
Table 8 shows that the production of sugar beet is nearly 4% higher without the restriction of quotas, but this difference is almost eliminated when it is assumed that, due to quota expiry, the

30
isoglucose share of the total sweetener market expands to 20%. Since the isoglucose market and the interactions between sugar and isoglucose in a free market are not modelled in this study, the 20% market share in Scenario 2.20 is not part of the model solution; rather, it is an assumption only, representing a somewhat extreme position (as discussed in section 2.3).
The production figures for ethanol and biodiesel given in Table 8 are totals produced from all feedstocks. Hence, the differences in ethanol production between the no-quota scenarios reflect differences in total ethanol produced, and not exclusively in ethanol produced from sugar beet (although this component will account for most of the change between the no-quota scenarios). Sugar is not the main arable crop feedstock for ethanol in the EU (see Table 8), which explains why the percentage differences in total production are quite small between the no-quota scenarios.
As mentioned above, the higher level of beet production without quotas is accompanied by slightly higher production of wheat, barley and maize. At first sight, this result is counterintuitive, since these latter three crops compete with sugar beet for arable area. However, they are also alternative feedstocks for ethanol. In the no-quota situation, the sugar beet price is now the same whether the beet is used for processing into sugar for human consumption or for transformation into industrial products. The beet price facing ethanol producers, which used to be well below the price of beet for food use, is considerably higher than in the quota extension scenario, thereby making sugar beet less attractive as a feedstock and improving the attractiveness of the alternatives, especially wheat and maize.
Table 9 shows that, in Scenario 1, when biofuel producers can buy beet at the low out-of-quota price, it provides 24% of the feedstock for ethanol. This share falls to 20.8% in Scenario 2.00 when sugar is replaced by alternative feedstocks, each more or less in proportion to its share in Scenario 1. However, as sugar loses ground to isoglucose (Scenarios 2.10 and 2.20), beet reverts to its original importance as an ethanol feedstock.
The CAPRI results indicate that, in Scenario 2.00, the extra demand for cereals as a biofuel feedstock just cancels out the negative impact on the production of these crops due to competition with beet for arable land. This does not mean that in the quota-expiry scenarios there are no negative impacts of higher beet acreage on other land uses. In particular, sugar beet substitutes (albeit to a modest extent) for fodder (except maize fodder) on arable land, for grass land and set aside (not shown in Table 8).
Table 9. Share (%) of feedstock in (first generation) bio-ethanol production.
Feedstock Scenario 1 Scenario 2.00 Scenario 2.10 Scenario 2.20 Wheat 33.6 35.3 34.6 33.5 Barley 14.5 14.8 14.7 14.5 Rye 6.0 6.2 6.1 6.0 Oats 3.7 3.9 3.8 3.7 Maize 15.0 15.5 15.3 14.9 Other cereals 2.7 2.9 2.8 2.7 Sugar 24.0 20.8 22.1 24.2
Tables 10 and 11 report the differences in trade flows between the quota-extension scenario, on the one hand, and the three versions of the quota-expiry situation. It should be taken into account that in these tables, ‘sugar’ refers specifically to the commodity sugar —largely raw sugar, in the case of imports, and largely refined white sugar, in the case of exports— both types of sugar measured in white sugar equivalents.

31
Table 10. Imports.
Scenario 2.00
Scenario 2.10
Scenario 2.20
Scenario 2.00
Scenario 2.10
Scenario 2.20
Commodity Base year
2004 Scenario 1
2020 Increased market share
of isoglucose Increased market share
of isoglucose
No IG substit-ution IG=10% IG=20%
No IG substit-
ution IG=10% IG=20%
Change with respect to Scenario 1 Change with respect to Scenario 1 1000 tons
1000 tons Per cent Sugar, total 2,941.7 4,030.8 -1,716.8 -2,108.3 -2,534.1 -42.6 -52.3 -62.9
Brazil 653.8 555.2 -20.9 -28.0 -38.5 -3.8 -5.0 -6.9 EPA/EBA 1,722.6 3,075.3 -1,622.3 -2,001.2 -2,410.0 -52.8 -65.1 -78.4
Total cereals 14,343.9 10,608.3 169.6 98.7 7.1 1.6 0.9 0.1 Oilseeds 17,405.8 18,367.3 37.0 41.4 50.4 0.2 0.2 0.3
Table 10 shows that the increased EU beet and sugar output after quota expiry has a strong import-substitution effect. Moreover, this effect is much stronger in the case of the higher-cost import sources. By contrast, the impact on lower-cost imports from Brazil (under its bilateral TRQ and also the EU’s erga omnes TRQ) is quite small. The very high EU demand for Brazilian sugar is reflected as well in a corresponding high quota rent, which allows the Brazilian sugar to keep its market share on the EU sugar market. The level of the quota rent in the baseline influences the distribution of the EU import reduction of sugar between import sources, as explained in section 3.1. With higher levels of the assumed share of the sweetener market captured by isoglucose, the negative impact on third-country imports is exacerbated.
Table 11. Exports.
Scenario 2.00
Scenario 2.10
Scenario 2.20
Scenario 2.00
Scenario 2.10
Scenario 2.20
Commodity Base year
2004 Scenario 1
2020 Increased market share
of isoglucose Increased market share
of isoglucose
No IG substit-ution IG=10% IG=20%
No IG substit-
ution IG=10% IG=20%
Change with respect to Scenario 1 Change with respect to Scenario 1 1000 tons
1000 tons Per cent Sugar, total 5,174.8 1,392.2 -220.4 -114.5 59.6 -15.8 -8.2 4.3 Total cereals 14,266.8 28,217.6 -209.8 -123.5 -11.3 -0.7 -0.4 0.0 Oilseeds 663.2 1,205.0 -0.5 -0.5 -0.5 0.0 0.0 0.0
Table 11 shows the differences in exports between the with-quota and no-quota situations. When there are no sugar quotas and no substitution with isoglucose, exports are lower than in the quota-extension scenario. This is the direction of change predicted for EU exports by the theoretical model in Section 3. This negative impact is reduced in magnitude when a 10% isoglucose share in the sweetener market is assumed, and reversed in sign when the share is set at 20%.
Impacts on exports of cereals are slightly negative, and these negative effects are smaller when the IG share of the sweetener market is higher. When interpreting these results, it should be borne in mind that no adjustment has been made for the fact that higher production of isoglucose in the EU will increase demand for maize and wheat as ingredients for EU-produced isoglucose. If this adjustment were made, then the shrinking of the negative impacts on exports as isoglucose share increases would probably be a little more marked.

32
Combining these results for trade flows with those for EU production in Table 8, we see that, in the case of a 20% isoglucose share, not only are EU beet and ‘sugar’ production almost the same as in the quota-extension scenario, but also that the main adjustment burden due to removing sugar and isoglucose quotas, plus the assumed aggressive expansion of the isoglucose sweetener share, is borne by imports, and in particular by imports from high-cost exporting countries with duty-free access to the EU market.
In terms of Figure 2, increasing the isoglucose share of the EU sweetener market corresponds to a shift to the left of the demand curve in panel 3 of the figure, and a corresponding leftwards shift of the EU’s demand for duty-free imports in panel 4. We would expect this to be accompanied by lower beet and sugar prices within the EU (which is confirmed by the results for prices given below in Table 14), and a fall in duty-free imports. The fact that imports from Brazil react relatively little only to the lower EU prices is consistent with the discussion in the theoretical section (p.15) regarding the elasticity of Brazilian import supply over the range of prices relevant to this scenario comparison.
Finally, as already pointed out, EU exports fall as predicted by the theory, but do not disappear as would be expected if trade flows depended only on relative prices. After quota expiry, when unlimited quantities of sugar can be sold on the EU market, basic theory suggests that the EU market would always be preferred to the world market as long as the EU price is above the world market price. However, as discussed in Section 3 (p.22), in the real world this may not be the case. Furthermore, as explained in footnote 18, CAPRI uses information on past trade flows and preferences as well as current relative prices to determine trade flows, and to allow for simultaneous flows of imports and exports even when, on the basis of relative prices alone, one would expect trade to flow in one direction only.
6.2 EU production balances and welfare changes.
Table 12 summarises the production, domestic use and trade figures of the different scenarios. The new information provided by this table relates to human consumption of sugar in the different scenarios, and a more detailed breakdown of sugar beet use.
In the first quota-expiry scenario (with no substitution between sugar and IG), there is almost no increase in sugar consumption, in line with the very low price elasticity of demand for this product. However, when it is assumed that isoglucose takes an increasing share of the sweetener market, EU sugar consumption is markedly lower in line with the assumptions about isoglucose share in the total sweetener market. The balance sheet in Table 12 reveals where the sugar displaced by isoglucose goes. First, the lower demand for sugar for human consumption gets signalled back to beet producers (via price) and they produce less beet (although still a little more than in the quota-extension scenario, even with a 20% IG share). Second, the fall in the use of beet for ethanol production is less marked (again, as a result of lower market price for beet), and third, the impact on sugar imports, especially from high-cost sources, is greater (as already shown in Table 10). Thus, the impact of the higher IG share in the sweetener market on beet producers is dampened by these adjustments in related markets.

33
Table 12. Sugar and derived product balances.
Scenario 2.00
Scenario 2.10
Scenario 2.20
Scenario2.00
Scenario 2.10
Scenario 2.20
Scenario 1
2020 Increased market
share of IG Increased market
share of IG
No IG substit-
ution IG=10% IG=20%
No IG substit-
ution IG=10% IG=20% Change relative to Scenario 1 Change relative to Scenario 1
1000 tons 1000 tons Per cent
Production 1000 Tons of Sugar Beet Sugar beet
Total 126,442.3 4,902.5 2,976.4 194.8 3.9 2.4 0.2 EU15 101,798.1 4,235.1 2,618.7 261.4 4.2 2.6 0.3 EU12 24,644.2 667.5 357.7 -66.5 2.7 1.5 -0.3
For processing2 125,618.2 4,878.5 2,961.7 193.3 3.9 2.4 0.2 For animal feed 575.8 16.0 9.0 -0.9 2.8 1.6 -0.2
Other uses + losses 447.4 9.7 7.0 3.2 2.2 1.6 0.7 1000 Tons of Sugar Equivalent1
Total sugar 20,096.7 851.5 539.7 67.5 4.2 2.7 0.3 EU15 16,257.1 757.2 493.4 90.0 4.7 3.0 0.6 EU12 3,839.6 94.3 46.3 -22.5 2.5 1.2 -0.6
Of which: Ethanol 6,088.8 -799.2 -475.1 67.2 -13.1 -7.8 1.1 Other uses + losses 251.1 27.2 30.3 35.7 10.8 12.1 14.2
Human Consumption Sugar 16,380.3 127.1 -1,008.3 -2,626.5 0.8 -6.2 -16.0 Imports
Sugar 4,031.1 -1,716.8 -2,108.3 -2,534.1 -42.6 -52.3 -62.9 Exports
Sugar 1,392.2 -220.4 -114.5 59.6 -15.8 -8.2 4.3
1. Note that, in this segment of the table, ‘total sugar’ refers to all products derived from sugar beet (including industrial products), measured in white sugar equivalents. 2. Here processing includes transformation into sugar for human consumption.
Three further points are worth making. First, production impacts are relatively greater in EU15 than in EU12. This is partly due to the very large impact in Germany, which dominates the EU15 response. Germany, where the fall in revenue per hectare of beet is the smallest after quota expiry (see Table 17), is alone responsible for about one half of the EU27 net increase (see Table 15). Moreover, the largest positive differentials between the out-of-quota price (in Scenario 1) and the uniform sugar price (Scenario 2) are found in Member States of EU1533. The dominant impact of Germany persists in all three no-quota scenarios: in Scenario 2.20, the increase in Germany is about two and a half times the net increase for EU27 as a whole, whereas production in EU12 is actually lower than in Scenario 1 (quotas extended).
Second, it is not only the EU12 production impact that has a sign change in Scenario 2.20. Other variables whose impacts are different in direction in Scenario 2.20 are ethanol production and EU exports (which are higher relative to the quota-extension scenario, although they are lower in Scenarios 2.00 and 2.10); this phenomenon is explained by the lower beet and sugar prices in Scenario 2.20. Clearly, there is a tipping point somewhere between isoglucose shares of 10% and
33 Member States in which this differential exceeds 10%, when comparing Scenario 1 and Scenario 2.00, are ES (25.6), DK (21.3), RO (20.1), DE(20.0), FI (15.3), UK (15.3), and IT (14.3).

34
20%, beyond which some of the impacts of quota expiry go in a different direction. A more in-depth analysis of the interactions between the sugar and isoglucose markets, using empirically based estimates of substitution elasticities, would shed further light on this issue.
Three, the sign reversal for human sugar consumption that occurs when passing from scenario 2.00 to scenario 2.10 and the explanation for this change are more complex. The change in human consumption is the net result of the lower sugar price (which gives a small stimulus to internal sugar consumption) and the substitution away from sugar towards isoglucose implied by the assumption of a larger isoglucose share in the total sweetener market. By the time the expanding isoglucose reaches 10%, the second (negative) effect already outweighs the first (positive) effect.
Table 13. Impact of quota expiry on welfare in the EU. Scenario 2.00 Scenario 2.10 Scenario 2.20 No isoglucose substitution Isoglucose share=10% Isoglucose share=20%
Scenario 1
Change with respect to Scenario 1 EUR mn EUR mn % EUR mn % EUR mn %
Total welfare 7,533,485.0 1,110.9 0.02 1,002.8 0.01 778.5 0.01 Consumer surplus 7,519,115.0 1,043.5 0.01 1,171.8 0.02 1,304.5 0.02 Total agricultural income 182,680.7 98.7 0.05 -137.1 -0.08 -488.7 -0.27
TRQ rents1 493.4 -32.8 -6.66 -40.8 -8.26 -52.4 -10.62 Tax payers cost 51,206.6 -0.3 -0.00 -10.3 -0.02 -25.8 -0.05
Tariff revenues 5,405.8 1.8 0.03 0.1 0.00 -3.1 -0.06 Sugar beet income 1,308.5 -225.8 -17.25 -391.2 -29.90 -622.8 -47.59
1. The quota rents are assumed to be shared in equal parts between importers and exporters. TRQ rent accruing to EU importers is included in the total EU welfare change.
Table 13 compares the welfare effects of the two scenarios. It should be borne in mind that, due to the partial equilibrium specification of the CAPRI model, these are partial effects and summarise changes in welfare in the EU agriculture and food sectors only. If the policy change examined here has knock-on welfare effects for agents in other sectors of the economy, they are ignored in these totals. However, when comparing the situation with and without sugar quotas, it can be safely assumed that welfare differences in other sectors are extremely small. At the same time, it should also be borne in mind that there are non-trivial welfare differences in other, non-EU countries and specifically in ACP countries and LDCs that export sugar to the EU. These impacts are not shown in Table 13.
The welfare changes are very small, and consist almost entirely of a small gain to EU sugar consumers as a result of lower sugar prices. The impact on sugar beet income at EU27 level is negative and substantial, and the magnitude of this negative impact increases with isoglucose substitution. When no substitution between sugar and isoglucose is assumed, the net effect on agricultural income is positive although small, indicating that gains to commodities other than sugar beet offset the fall of the beet income. However, when isoglucose substitution with sugar is assumed, which leads to lower beet prices and less beet production, gains to other commodities in the sector are insufficient to offset the fall in beet income. The incidence of these agricultural income changes on Member States and regions is examined in Section 6.3.

35
6.3 Changes at Member State level
This sub-section reports changes in prices, production, acreage and revenue at the level of Member States. It begins by presenting the impacts on prices received by beet growers, since this price, in conjunction with the comparative and competitive advantage enjoyed by each Member State, is crucial for explaining the impacts on the other variables.
Table 14. Changes in sugar beet prices in Member States.
Scenario 11 Scenario 2.00 Scenario 2.10 Scenario 2.20 Euro/ton Euro/ton Euro/ton Euro/ton
Austria 33.2 28.2 27.1 25.4
Belgium 33.4 28.4 27.2 25.5
Czech Republic 33.0 27.7 26.8 25.6
Denmark 37.0 31.4 30.1 28.2
Finland 35.1 29.9 28.6 26.8
France 32.6 27.7 26.6 24.9
Germany 36.6 31.1 29.8 27.9
Greece 32.7 27.8 26.6 25.0
Hungary 33.0 27.7 26.8 25.6
Italy 34.8 29.6 28.4 26.6
Lithuania 33.4 28.1 27.2 25.9
Netherlands 32.6 27.7 26.5 24.8
Poland 32.9 27.7 26.8 25.5
Romania 33.0 31.1 30.4 29.3
Slovakia 33.4 28.1 27.2 25.9
Spain 38.3 32.5 31.2 29.2
Sweden 32.8 27.9 26.7 25.0
United Kingdom 35.2 29.9 28.6 26.8
EU272, average 34.2 29.1 27.9 26.2
1. The sugar beet price in Scenario 1 corresponds to the in-quota price; the out-of-quota price is 25.9€/ton.
2. Excluding the Azores and the French overseas departments.
Table 14 shows the prices in each Member State in the four scenarios. In the quota-extension scenario, France and the Netherlands have the lowest beet price (€32.6/t). The average price for EU27 is 5% higher than this minimum price, and 10 other Member States have prices that exceed the minimum by less than 3%. The six remaining Member States have prices above the EU average, and in excess of the French and Dutch price by the following amounts: Italy (+6.7%), Finland (+7.7%), UK (+8.0%), Germany (+12.3%), Denmark (+13.5%) and Spain (+17.5%).
These differentials between countries are more or less maintained for the Member States of EU25 in the quota-expiry scenarios, since the price reduction is comparable across Member States34: for Scenario 2.00 it is in the range -14.8% to -16.1%, for Scenario 2.10 between -18.4% and -18.8%, and for Scenario 2.20 between -22.4% and -23.9%. It is only in Scenario 2.20 that the price goes below the out-of-quota beet price of €25.9/t in force for the with-quota scenario, and that occurs in seven Member States. The price reduction in Romania is less than in the other Member States: -5.8% in Scenario 2.00, increasing to -11.2% in Scenario 2.20. These results put
34 This is largely due to the way CAPRI achieves market equilibrium, solving for the three blocs EU15, EU12 and EU2 (BG and RO).

36
Romania among the four highest-priced Member States in Scenario 2.00 (along with Germany, Denmark and Spain) and with the highest price (along with Spain) in Scenario 2.20.
Table 15 reports the differences in production at Member State level. In this table, production includes all products derived from beet expressed in sugar equivalents, whereas ‘quota’ relates to the commodity sugar, for sale on the EU market for human consumption, and the corresponding quantities of beet required to produce this ‘quota sugar’. Therefore, it is not surprising that in the with-quota situation, beet production in most Member States is well in excess of quota levels, since it also includes beet destined for non-food uses.
In Scenario 1, the 18 mainland Member States still producing beet have an aggregate production level in white sugar equivalent that is about 57% above the aggregate EU quota level for sugar for human consumption. Only in Greece is beet production below the level implied by the national sugar quota.
With quota expiry, total EU production of ‘sugar’ (all beet-derived products, measured in sugar equivalents) is higher by 851 thousand tons (4.2%). As shown in Table 12, this results in higher production of the commodity sugar (which is used to replace imported sugar). Despite the higher production, less beet is used for ethanol production, which now faces the internal market price.
In the scenario without IG substitution, only the Netherlands and Greece have lower ‘sugar’ production compared with the with-quota situation. In Scenario 1, total ‘sugar’ production in Greece is only 54% of the quota limit for sugar for human consumption; thus, quota is not a constraint in Greece and therefore when quotas expire, Greek producers react only to the price fall with no offsetting incentive from the removal of a binding constraint or increase in the price of out-of-quota sugar.
A slightly different explanation applies to the Netherlands, whose total ‘sugar’ output is just 104% of its sugar quota. Clearly, in the Netherlands – a small country where sugar beet competes with other high-value crops – beet is not attractive at the level of production achieved in Scenario 1 unless it earns the high in-quota price. Therefore, the removal of the quota constraint is over-ridden by the fall in relative profitability.
It should be pointed out that the extent of quota overshoot in Scenario 1 reflects not only cost-efficient production at the margin, but also in some cases (including Germany) strong local demand for beet as an ethanol feedstock. As reported in Table 1, six of the eight Member States producing bio-ethanol are in EU15.
Therefore, a number of factors lie behind the different initial positions (Scenario 1) and the differential impacts of quota expiry (Scenario 2) of Member States that are summarised in the table. They include absolute competitivity (in terms of net returns to sugar beet), the competitive position of sugar beet vis-à-vis other crops, and the presence of an ethanol industry.

37
Table 15. Sugar production1 in Member States2 in 2020.
Scenario 1 Scenario 2.00 Scenario 2.10 Scenario 2.20
Quota Product’n Position
wrt quota Difference from
Scenario 1 Difference from
Scenario 1 Difference from
Scenario 1 1000 t % 1000 t % 1000 t % 1000 t %
Austria 351.03 602.8 171.7 21.3 3.5 11.8 2.0 -2.6 -0.4
Belgium 676.24 995.6 147.2 36.7 3.7 18.1 1.8 -10.0 -1.0
Czech Republic 372.46 695.7 186.8 16.1 2.3 7.2 1.0 -5.8 -0.8
Denmark 372.38 517.5 139.0 32.7 6.3 25.4 4.9 14.3 2.8
Finland 80.99 101.8 125.7 1.4 1.4 1.0 1.0 0.4 0.4
France 3,004.81 4,951.8 164.8 125.1 2.5 51.6 1.0 -63.8 -1.3
Germany 2,898.26 5,056.2 174.5 422.2 8.4 322.3 6.4 172.0 3.4
Greece 158.70 85.4 53.8 -2.3 -2.7 -2.9 -3.4 -3.9 -4.5
Hungary 105.42 164.8 156.3 0.7 0.4 0.2 0.1 -0.5 -0.3
Italy 508.38 609.6 119.9 17.8 2.9 10.8 1.8 -0.3 -0.1
Lithuania 90.25 160.4 177.7 4.6 2.9 2.6 1.6 -0.3 -0.2
Netherlands 804.88 834.2 103.6 -1.6 -0.2 -12.0 -1.4 -28.5 -3.4
Poland 1,405.60 2,495.7 177.6 60.1 2.4 27.2 1.1 -19.5 -0.8
Romania 104.68 118.3 113.0 6.7 5.6 5.7 4.8 4.1 3.5
Slovakia 112.32 204.7 182.2 6.3 3.1 3.5 1.7 -0.4 -0.2
Spain 498.48 584.7 117.3 8.5 1.5 6.2 1.1 2.4 0.4
Sweden 293.19 407.2 138.9 15.6 3.8 6.4 1.6 -6.5 -1.6
Un. Kingdom 1,056.47 1,506.2 142.6 79.5 5.3 54.4 3.6 16.3 1.1
Total, EU272 12,894.54 20,096.7 155.9 851.5 4.2 539.8 2.7 67.5 0.3
1. Note that ‘sugar production’ here includes all products derived from sugar beet, expressed in white sugar equivalents.
2. Nine Member States are not listed in the table, because they do not grow sugar beet. These Member States are Bulgaria, Cyprus, Estonia, Ireland, Latvia, Luxembourg, Malta, Portugal and Slovenia.
3. Excluding the French overseas departments and the Azores.
It is only in Scenario 2.20 (quota expiry and a 20% isoglucose share) that other Member States join Greece and Netherlands in having a production level lower than in Scenario 1. In fact, only four Member States (RO, DE, DK, UK) still have more production than in Scenario 1 once isoglucose takes a 20% share of the sweetener market. This is unrelated to the relative size of their over-quota ‘sugar’ in Scenario 1 —although Germany has the fifth-highest overshoot, the UK and Denmark come only 10th and 11th in the ranking, and Romania has the third-smallest overshoot.
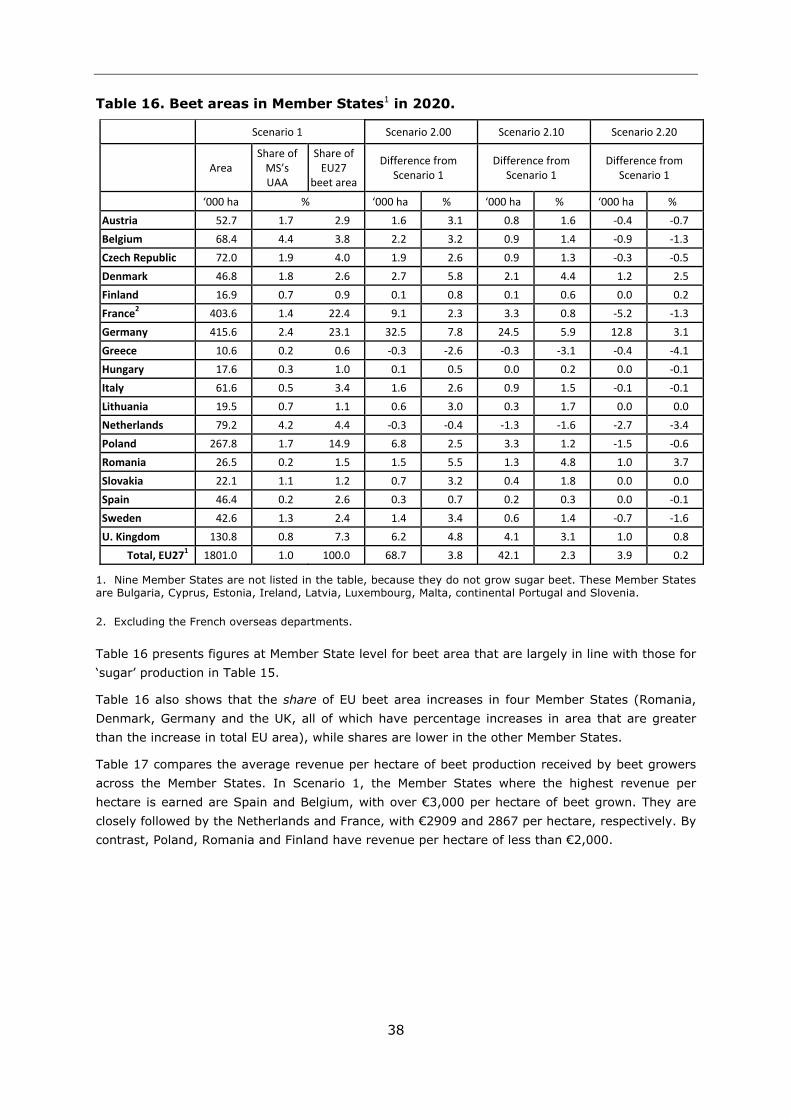
38
Table 16. Beet areas in Member States1 in 2020.
Scenario 1 Scenario 2.00 Scenario 2.10 Scenario 2.20
Area
Share of MS’s UAA
Share of EU27
beet area
Difference from Scenario 1
Difference from Scenario 1
Difference from Scenario 1
‘000 ha % ‘000 ha % ‘000 ha % ‘000 ha % Austria 52.7 1.7 2.9 1.6 3.1 0.8 1.6 -0.4 -0.7 Belgium 68.4 4.4 3.8 2.2 3.2 0.9 1.4 -0.9 -1.3 Czech Republic 72.0 1.9 4.0 1.9 2.6 0.9 1.3 -0.3 -0.5 Denmark 46.8 1.8 2.6 2.7 5.8 2.1 4.4 1.2 2.5 Finland 16.9 0.7 0.9 0.1 0.8 0.1 0.6 0.0 0.2 France2 403.6 1.4 22.4 9.1 2.3 3.3 0.8 -5.2 -1.3 Germany 415.6 2.4 23.1 32.5 7.8 24.5 5.9 12.8 3.1 Greece 10.6 0.2 0.6 -0.3 -2.6 -0.3 -3.1 -0.4 -4.1 Hungary 17.6 0.3 1.0 0.1 0.5 0.0 0.2 0.0 -0.1 Italy 61.6 0.5 3.4 1.6 2.6 0.9 1.5 -0.1 -0.1 Lithuania 19.5 0.7 1.1 0.6 3.0 0.3 1.7 0.0 0.0 Netherlands 79.2 4.2 4.4 -0.3 -0.4 -1.3 -1.6 -2.7 -3.4 Poland 267.8 1.7 14.9 6.8 2.5 3.3 1.2 -1.5 -0.6 Romania 26.5 0.2 1.5 1.5 5.5 1.3 4.8 1.0 3.7 Slovakia 22.1 1.1 1.2 0.7 3.2 0.4 1.8 0.0 0.0 Spain 46.4 0.2 2.6 0.3 0.7 0.2 0.3 0.0 -0.1 Sweden 42.6 1.3 2.4 1.4 3.4 0.6 1.4 -0.7 -1.6 U. Kingdom 130.8 0.8 7.3 6.2 4.8 4.1 3.1 1.0 0.8
Total, EU271 1801.0 1.0 100.0 68.7 3.8 42.1 2.3 3.9 0.2
1. Nine Member States are not listed in the table, because they do not grow sugar beet. These Member States are Bulgaria, Cyprus, Estonia, Ireland, Latvia, Luxembourg, Malta, continental Portugal and Slovenia.
2. Excluding the French overseas departments. Table 16 presents figures at Member State level for beet area that are largely in line with those for ‘sugar’ production in Table 15.
Table 16 also shows that the share of EU beet area increases in four Member States (Romania, Denmark, Germany and the UK, all of which have percentage increases in area that are greater than the increase in total EU area), while shares are lower in the other Member States.
Table 17 compares the average revenue per hectare of beet production received by beet growers across the Member States. In Scenario 1, the Member States where the highest revenue per hectare is earned are Spain and Belgium, with over €3,000 per hectare of beet grown. They are closely followed by the Netherlands and France, with €2909 and 2867 per hectare, respectively. By contrast, Poland, Romania and Finland have revenue per hectare of less than €2,000.

39
Table 17. Beet revenue per hectare in Member States1 in 2020.
Scenario 1 Scenario 2.00 Scenario 2. 10 Scenario 2.20 Revenue Difference from
Scenario 1 Difference from
Scenario 1 Difference from
Scenario 1 Euro/ha Euro/ha % Euro/ha % Euro/ha %
Austria 2,590.9 -140.1 -5.4 -226.9 -8.8 -353.7 -13.7 Belgium 3,149.5 -233.3 -7.4 -340.1 -10.8 -496.0 -15.7 Czech Republic 2,119.6 -124.9 -5.9 -183.9 -8.7 -264.8 -12.5 Denmark 2,294.8 -143.7 -6.3 -223.2 -9.7 -339.2 -14.8 Finland 1,582.2 -135.6 -8.6 -187.3 -11.8 -262.6 -16.6 France 2,867.3 -181.2 -6.3 -274.9 -9.6 -411.7 -14.4 Germany 2,643.4 -61.8 -2.3 -154.3 -5.8 -289.5 -11.0 Greece 2,318.6 -323.5 -14.0 -398.5 -17.2 -507.6 -21.9 Hungary 2,226.8 -153.9 -6.9 -214.3 -9.6 -297.1 -13.3 Italy 2,185.2 -195.4 -8.9 -267.8 -12.3 -373.5 -17.1 Lithuania 2,005.1 -100.1 -5.0 -154.8 -7.7 -229.9 -11.5 Netherlands 2,905.9 -359.6 -12.4 -452.8 -15.6 -588.9 -20.3 Poland 1,850.9 -118.9 -6.4 -171.3 -9.3 -243.3 -13.1 Romania 1,786.4 0.6 0.0 -31.3 -1.8 -78.6 -4.4 Slovakia 2,216.8 -125.9 -5.7 -186.4 -8.4 -269.3 -12.2 Spain 3,150.2 -305.3 -9.7 -417.3 -13.2 -580.8 -18.4 Sweden 2,148.2 -158.4 -7.4 -224.0 -10.4 -319.8 -14.9 U. Kingdom 2,532.7 -168.3 -6.6 -253.3 -10.0 -377.5 -14.9 EU272, average 2,512.0 -146.4 -5.8 -228.5 -9.1 -347.3 -13.8
1. Nine Member States are not listed in the table, because they do not grow sugar beet. These Member States are Bulgaria, Cyprus, Estonia, Ireland, Latvia, Luxembourg, Malta, Portugal and Slovenia.
2. Excluding the Azores and the French overseas departments. It might be expected that, in Scenario 1, revenue per hectare of beet would be higher for those Member States with a higher share of quota beet in total beet output, since quota beet receives a higher price. This turns out not to be the case; the simple correlation coefficient between revenue per hectare and the quota fill rate (see column 3 of Table 15) is -0.07, denoting independence between these two variables. By contrast, there is a tendency for Member States with a higher beet yield35, and a higher sugar yield from beet, to have higher revenue from beet per hectare. Finland, whose average yield in 2007-2010 was less than half that of France and Spain has about half the revenue per hectare in these two countries in Scenario 1, and the lowest revenue per hectare of the 18 beet-producing Member States.
There is a negative, but rather weak, correlation (0.27) between the level of average revenue per hectare in Scenario 1, and the absolute magnitude of the impact on revenue per hectare of quota expiry. This suggests a weak tendency for Member States with high revenue per hectare in Scenario 1 to experience a greater fall in revenue per hectare, but there are individual exceptions to this tendency.
35 See Figure 1, Section 2 for evidence on current yields for Member States.

40
What is striking is the strong link between the quota fill rate and the size of the impact on revenue, with the impact being smaller the more out-of-quota beet was produced in Scenario 1. This is illustrated dramatically by Greece and the Netherlands: Greece produces well below quota in Scenario 1 and the Netherlands has only a small overshoot. This means that in Scenario 1 all the beet produced in Greece, and nearly all the beet grown in the Netherlands, receives the in-quota price. Hence, the impact on average revenue per hectare of moving to a single sugar market price when quotas expire is greatest for these Member States (-14.0% and -12.4%, respectively), since all or nearly all the beet they produce suffers a price cut. At the other end of the spectrum, Poland, Lithuania, Slovakia, Germany, Austria and the Czech Republic, with fill rates of over 170%, have falls in revenue per hectare between -2.3% and -6.4% only, since although the price falls on their in-quota production, it improves for the considerable share of their output that was previously out-of-quota. The simple correlation coefficient between the fill rate in Scenario 1 and the absolute size of the change in revenue when passing to Scenario 2.00, is -0.62, and after dropping Romania (whose price behaviour has already been discussed) it is -0.91. This shows that higher fill rates in Scenario 1 are strongly associated with smaller per hectare revenue falls when quotas expire.
Table 18. Rankings of Member States by beet revenue per hectare, Scenarios 1 and 2.20.
Scenario ES BE NL FR DE AU UK EU 27
GR DK HU SK IT SW CZ LIT PO RO FI
1 1 2 3 4 5 6 7 8 9 10 11 12 13 14 15 16 17 18 19
2.20 2 1 5 3 4 6 8 7 12 9 11 10 14 15 13 16 18 17 19
Despite the differential rates of change in revenue per hectare across Member States, the ranking of Member States according to their revenue per hectare of beet is very similar in Scenario 2.20 compared with Scenario 1 (see Table 18). The exceptions are the Netherlands and Greece, which slip several places in the ranking, and the UK, which falls below the EU27 average. Otherwise, the rearrangement in the ranking of Member States is relatively minor.
6.4 Changes at NUTS2 level
Figures 4 and 5 show the changes in 2020 in sugar beet production and sugar beet income at NUTS2 level, relative to the quota-extension scenario.
First, it must be emphasised that these changes are not standardised to control for the size of the region or the area of sugar beet grown in the region. Hence, a large negative change can occur because (a) the region itself is large, although sugar beet is not grown particularly intensively there and is not crucially important for the agriculture of the region, (b) the region itself is not large, but it specialises in sugar beet, which is therefore an important crop for the region, (c) both or neither of (a) and (b) but rather sugar beet production, to the extent that it is grown, is particularly strongly impacted by the expiry of sugar quotas. This way of presenting the result was preferred to the alternative of showing changes on a per hectare basis since in many cases this highlights the changes in marginal sugar beet areas (where production and income changes are likely to be more extreme) as very important when in reality sugar beet may be a very small crop. Another reason is that total income captures the price effect as well as the quantity effect and complements in this way the results on revenues.

41
Figure 4 gives the regional changes in sugar beet production. It shows that, in Scenario 2.00, the largest total declines are in southern Spain, parts of Italy, northern Greece, parts of Belgium and the Netherlands, the west of England and eastern Sweden. Most other regions see an increase in production. The increases tend to be smaller in Scenario 2.10, whereas in Scenario 2.20, regions that had strong production increases in Scenario 2.00 (such as north eastern France, southern Sweden and western Poland) have decreases that, in some cases, are very substantial. In Scenario 2.20, only East Anglia, Denmark and parts of Germany still register strong production increases.
Figure 5 presents the changes in sugar beet income on a regional basis. The income shown corresponds to revenue minus intermediate consumption (feed, fertiliser, plant protection, veterinary costs, seeds, maintenance and repair, fuel and energy). It is striking that all regions see a fall in income in all scenarios, although in a number of regions the decrease is small even in Scenario 2.20. It is also very surprising that some of the regions with production gains exhibit large income decreases even in Scenario 2.00 (East Anglia and north eastern France), and in Scenario 2.10, Denmark, southern Sweden and northern Spain are also in this category. North eastern and eastern France is badly hit, from Scenario 2.00 onwards, by falling production and falling income.

42
Figure 4. Change in sugar beet production (in 1000 tons) with respect to Scenario 1, by NUTS2 region. Scenario 2.00 Scenario 2.10 Scenario 2.20
-60 to -25 -25 to 0 0 0 to 25 25 to 290 Note: regions with no colour shading do not produce sugar beet.

43
Figure 5. Change in income from sugar beet (in million euros with respect to Scenario 1, by NUTS2 region. Scenario 2.00 Scenario 2.10 Scenario 2.20
-60 to -10 -10 to -5 -5 to -2.5 -2.5 to -1.0 -1.0 to 0
Note: regions with no colour shading do not produce sugar beet.

44
7 CONCLUSIONS
This report has compared the production, market and trade outcomes of two alternative policy scenarios, expiry of EU sugar quotas in 2015/16 and extension of the current sugar quota scheme for an indefinite period. The year in which the comparison is situated is 2020. The CAPRI model was used for the simulations.
In the presentation of the results, the impacts that can be expected when quotas expire are presented in the form of differences from the hypothetical scenario that the quota scheme is extended. The main findings are:
• production of sugar beet and white sugar increases by around 4%,.
• there is little net impact on the production of cereals,
• total ethanol production hardly changes, but the importance of sugar as an ethanol feedstock declines by a few percentage points,
• raw sugar imports from high-cost third countries decline very substantially, but those from the low-cost producer Brazil decrease only slightly,
• EU sugar exports fall,
• EU human consumption of sugar increases only marginally, despite a fall of 15-16% in beet prices for sugar for internal human consumption,
• there is a very small positive welfare change, although income accruing to sugar beet producing sector falls by over 17%.
These results are all in line with the predictions and explanations provided by the theoretical model. They also agree, as far as the direction of change is concerned, with the studies covered in the literature review, and in terms of their magnitude they occupy the middle ground between the highest and lowest impacts registered in the literature surveyed. On the issue of the assumed world price level, which was shown to be so crucial for the results in two of the studies reviewed, it should be pointed out that the assumed level of world prices in the with-quota scenario in this study is more or less in line with the ‘central’ projection of the AGLINK-COSIMO model.
In addition, impacts are shown at Member State, and sub-Member State, levels. The main findings are:
• impacts at Member State level are not uniform; all Member States except Greece and the Netherlands increase production, although beet revenue per hectare falls in all Member States (except Romania, where it is unchanged),
• the size of the revenue fall (in absolute magnitude) is inversely correlated with the extent to which total sugar production (including sugar for industrial use) exceeded the sugar quota in the with-quota scenario,
• the average fall in revenue per hectare across EU27 is -5.8%,
• at NUTS2 level, impacts on production and income vary considerably across the EU and within some of the larger Member States, and some regions with strong production increases nevertheless experience substantial income declines.

45
The above summary refers to a scenario where it is assumed that sugar quotas expire and that – inevitably – isoglucose quotas are also removed, but there is no interaction between the markets for sugar and isoglucose. When it is assumed that an increasing share of the sweetener market is taken by isoglucose, the findings are modified as follows:
• increases in beet and sugar production relative to the with-quota scenario are much smaller, and disappear for an isoglucose market share of 20%.
• total ethanol production increases a little more, and the importance of sugar as an ethanol feedstock reverts towards its with-quota level due to the lower sugar price,
• raw sugar imports from high-cost third countries decline even more than when there is no isoglucose interaction, and even those from the low-cost producer Brazil decrease a little more,
• EU sugar exports fall by less than when there is no isoglucose interaction, and when isoglucose takes a 20% share of the sweetener market, exports are actually higher than in the with-quota scenario,
• As the isoglucose share of the sweetener market increases, EU human consumption of sugar declines proportionately, while the size of the total sweetener market remains more or less the same,
• the decline in income accruing to sugar beet producers is much greater,
• the fall in sugar beet prices is steeper than when there is no isoglucose interaction; when isoglucose takes a 20% share of the sweetener market the price is 22-24% lower than in the with-quota scenario (depending on the Member State), and in seven Members States it falls to a level below the out-of-quota beet price in the with-quota scenario,
• when isoglucose takes a 20% market share, only six Member States have a level of sugar production higher than in the with-quota scenario revenue per hectare is lower in all Member States and the EU27 average is 13.8% below its with-quota level,
• at NUTS2 level, loss of market share to isoglucose exacerbates the diversity of impact across the EU, both between and within Member States and with, in particular, increasing negative pressure on many French regions, most of Poland and southern England.
Clearly, the plausibility of the results would be enhanced if CAPRI contained an empirically-based depiction of the isoglucose sector and its interactions with the EU sugar market.
It has not been possible easily to quantify the impacts on third countries in terms of welfare changes or changes in export revenues. When interpreting the very small welfare changes calculated for the EU, it should be borne in mind that other non-reported welfare changes outside the EU are also triggered, and that these changes might be quite concentrated on particular third countries or economic groups (producers or consumers).

46
References
Adenäuer, M. (2005). Modelling the European Sugar Sector: Incentives to Supply Sugar Beets and Analysis of Reform Options, PhD Thesis, Institut für Agrarpolitik, Marktforschung und Wirtschaftssoziologie, University of Bonn.
Agrosynergie (2011). Evaluation of CAP measures applied to the sugar sector. Report to DG AGRI, European Commission under Framework Contract N° 30-CE-0309243/00-66.
Blume, C., Strand, N. and Färnstrand, E. (2002). Sweet Fifteen: The Competition on the EU Sugar Markets Swedish Competition Authority Report 2002:7.
Britz, W. and Witzke, H.P. (2012). CAPRI model documentation 2012. Available at <http://www.capri-model.org/docs/capri_documentation.pdf >.
Brüntrup, M. (2006). Everything But Arms (EBA) and the EU sugar market reform – Development gift or Trojan horse? Discussion Paper 10/2006, German Development Institute, Bonn.
Buysse, J., Fernagut, B., Harmignie, O., Henry de Frahan, B., Lauwers, L., Polomé, P. Van Huylenbroeck, G., and Van Meensel, J. (2007). Farm-based modelling of the EU sugar reform: impact on Belgian sugar beet suppliers. European Review of Agricultural Economics 34: 21-52.
CEFS (2011). CEFS Sugar Statistics 2011. Comité Européen des Fabricants de Sucre, Brussels.
Dillen, K., Dries, L. and Tollens, E. (2006). The impact of the EU sugar reform on sugar and sugar substitute industries. Working Paper, n° 97, Centre for Agricultural and Food Economics, Katholieke Universiteit Leuven.
European Commission (2011a). Prospects for agricultural markets and income In the EU 2011–2020, Directorate General for Agriculture and Rural Development, December 2011.
European Commission (2011b). Impact Assessment: Common Agricultural Policy towards 2020. 20.10.2011, SEC(2011) 1153 final/2. Annex 5.
Frandsen, S., Jensen, H.G., Yu, W. and Walter-Jørgensen, A. (2003). Reform of EU sugar policy: Price cuts versus quota reductions. European Review of Agricultural Economics 30: 1-26.
Gohin, A. and Bureau, J.-C. (2006). Modelling the EU sugar supply to assess sectoral policy reforms. European Review of Agricultural Economics 33: 233-247.
Leatherhead Food International (2004). Likely impact of a possible reduction in the price of EU sugar. Report prepared for DEFRA, UK.
LEI (2011). Sugar quotas: Yes or no? Economic consequences for sector, chain, international market situation and third world. Report prepared for the Dutch government.
LMC-ODI (2012). The impact of EU sugar policy reform on developing countries. Report for the Department of International Development (UK).
Mercer, D. (2010). ‘As high fructose corn syrup use declines, sugar refining increases’, The Huffington Post, 2 June 2010. Available at http://www.huffingtonpost.com/2010/06/02/corn-syrup-sales-sour-as_n_597257.html.
Netherlands Economic Institute (2000). Evaluation of the Common Organisation of the Markets in the Sugar Sector. Report prepared for the European Commission.
Nolte, S., Buysse, J. and Van Huylenbrouck, G. (2012). Modelling the effects of an abolitionof the EU sugar quota on internal prices, production and imports. European Review of Agricultural Economics 39 (1): 75-94.
OECD and FAO (2010). OECD-FAO Agricultural Outlook 2010–2019. Paris: OECD.
United States Department of Agriculture (2012). Sugar and sweeteners Yearbook Tables, at http://www.ers.usda.gov/data-products/sugar-and-sweeteners-yearbook-tables.aspx#25512

47
APPENDIX 1 Conversion coefficients used in this study Sugarbeet to white sugar The processing coefficient varies across Member States, ranging from 1 ton beet = 0.12 ton sugar to 1 ton beet = 0.17 ton sugar (depending on the sugar content of the beet) Raw sugar to white sugar
1 ton raw (cane) sugar = 0.935 ton white sugar Sugarbeet to ethanol 1 ton sugar = 0.517 ton bioethanol (this coefficient is for calculation purposes only, since ethanol is processed directly from beet, not via sugar)
Using the figures above for conversion from beet to sugar, we derive
1 ton beet = 0.062 ton ethanol - 0.088 ton ethanol, depending on the sugar content of the beet Weights and volumes of biofuels 1 litre bioethanol = 0.79 kg bioethanol 1 litre biodiesel = 0.88 kg biodiesel 1 ton bioethanol = 0.64 toe 1 ton biodiesel = 0.86 toe
Sugar and isoglucose (HFC42) 1 ton syrup = 0.71 ton dry matter 1 ton dry matter = 0.92 ton sugar (in terms of equivalent sweetness)
Therefore, 1 ton syrup = 0.77 ton sugar (in terms of equivalent sweetness)
Isoglucose and feedstocks 1 ton isoglucose (dry weight) = 2.82 ton wheat
1 ton isoglucose (dry weight) = 2.25 ton maize

European Commission
EUR 26530 – Joint Research Centre – Institute for Prospective Technological Studies
Title: EU sugar policy: A sweet transition after 2015 ?
Author(s): Alison Burrell, Mihaly Himics, Benjamin Van Doorslaer, Pavel Ciaian, Shailesh Shrestha
Luxembourg: Publications Office of the European Union
2014 – 47 pp. – 21.0 x 29.7 cm
EUR – Scientific and Technical Research series – ISSN 1831-9424 (online)
ISBN 978-92-79-35567-7 (pdf)
doi:10.2791/68116
Abstract
This report compares the production and market outcomes of two alternative policy scenarios, namely expiry of EU sugar quotas in
2015/16 and extension of the current sugar quota scheme. All other EU policy measures pertaining to the sugar sector, and to
agriculture more generally, are assumed the same in both scenarios. The year of comparison is 2020. The CAPRI model was used for
the simulations. The report begins with a description of sugar production within the EU, and outlines the policies applied in the sugar
sector within the EU’s Common Agricultural policy. This is followed by a description of the EU sugar market. A theoretical model is used
to summarise the main functional relationships in the EU sugar market and related markets, and the EU’s trade in sugar, from which a
number of theory-based predictions about the impacts of quota expiry are derived. Isoglucose quotas will expire along with sugar
quotas, and there is much speculation about the extent of potential competitive substitution between the two sweeteners. Sensitivity
analysis was performed to obtain greater insight into this issue. Two additional quota-expiry scenarios were run, in which isoglucose
was assumed to take a 10% and a 20% share of the sweetener market at the expense of sugar. The main findings are: production of
sugar beet and white sugar increases by around 4%; there is little net impact on the production of cereals; total ethanol production
hardly changes, but the importance of sugar as an ethanol feedstock declines by a few percentage points; raw sugar imports from
high-cost third countries decline very substantially, but those from the low-cost producer Brazil decrease only slightly; EU sugar exports
fall; EU human consumption of sugar increases only marginally, despite a fall of 15-16% in beet prices for sugar for internal human
consumption; there is a very small positive welfare change, although income accruing to sugar beet producers falls by over 17%.

LB-NA-xxxxx-EN
-C
As the Commission’s in-house science service, the Joint Research Centre’s mission is to provide EU policies with independent, evidence-based scientific and technical support throughout the whole policy cycle. Working in close cooperation with policy Directorates-General, the JRC addresses key societal challenges while stimulating innovation through developing new standards, methods and tools, and sharing and transferring its know-how to the Member States and international community. Key policy areas include: environment and climate change; energy and transport; agriculture and food security; health and consumer protection; information society and digital agenda; safety and security including nuclear; all supported through a cross-cutting and multi-disciplinary approach.
LF-NA-26530-EN-N
doi:10.2791/68116
ISBN 978-92-79-35567-7 (pdf)