eu rice economic fact s - european commission 2015 european commission directorate-general for...
TRANSCRIPT
March 2015
EUROPEAN COMMISSION DIRECTORATE-GENERAL FOR AGRICULTURE AND RURAL DEVELOPMENT Directorate C. Single CMO, economics and analysis of agricultural markets C.4. Arable crops
EU RICE ECONOMIC FACT SHEET
1. INTERNATIONAL MARKETS ................................................................................ 2
1.1 Production ............................................................................................................. 2
1.2 International Trade ................................................................................................ 3
1.3 Consumption ......................................................................................................... 5
1.4 World rice balance sheet ....................................................................................... 7
1.5 International market prices .................................................................................... 6
2. EU MARKET .............................................................................................................. 8
2.1 Production ............................................................................................................. 8
2.2 External Trade ..................................................................................................... 11
2.3 Consumption ....................................................................................................... 13
2. 4 EU Rice Balance sheet ....................................................................................... 14
2.5 EU market prices ................................................................................................. 14

2
1. INTERNATIONAL MARKETS
1.1 Production
Global rice production in 2014/15 has little changed from the previous year's record.
FAO forecast for global paddy production in 2014 stands at 745 million tonnes of paddy
(for a total area of 163 million ha), only 0.2% below the 2013 record estimate for 746
million tonnes of paddy.
These FAO estimates for paddy production are consistent with International Grain
Council (IGC) estimate of a global production of 474 mio tonnes (milled equivalent) in
2014/15 compared to 475 mio tonnes in 2013/14 – see graphic below.
Evolution and projection of world rice production
Source: International Grain Council
Rice production is very concentrated geographically: Asia produces more than 90% of
the total world rice production, with a production of approx. 675 million tonnes of paddy
in Asia (out of a global production of 745 million tonnes of paddy).
China and India are by far the two biggest rice producers with a production of 205 mio
tonnes and 155 mio tonnes of paddy respectively, i.e. almost 50% of the world rice
production.
Other major paddy rice producers in Asia are Indonesia (70 mio tonnes), Bangladesh (50
mio tonnes), Vietnam (45 mio tonnes) and Thailand (38 mio tonnes). Brazil with a
production of 12 mio tonnes of paddy is the biggest non-Asian producer, followed by the
USA with a production of 10 mio tonnes of paddy per year.
With a production of less than 3 mio tonnes of paddy per year (less than 2 mio tonnes in
milled equivalent), the EU-28 represents approx. 0.4% of global rice production.

3
Main rice producers
Source: FAO December 2014
1.2 International Trade
Historically, a small amount of rice is traded globally compared with other commodities
like wheat, maize or soyabeans. Despite a continuous growth, the international trade in
rice corresponds approx. to only 8% of the total rice production.
In 2014 international trade in rice surpassed the record 40 million tonne mark (milled
equivalent) corresponding to 8.4% of the global rice production of 475 million tonnes
(milled equivalent). A further small expansion is expected in 2015.
Rice is a strategic commodity for many rice producing countries. Most countries try to
reach self-sufficiency in rice due to its strategic importance in domestic food security. It
is also essential for local authorities and state agencies to control rice trade flows in order
to stabilise their domestic rice market.
Rice exports are very concentrated geographically. The top five rice exporters (Thailand,
India, Vietnam, USA, Pakistan) account for 80% of global rice exports. The share of EU
rice exports (approx. 200 000 tonnes milled eq) is minimal at global level (approx. 0.5%
of global rice exports).
Unlike the high concentration in export market, the rice imports are more evenly spread
between the continents: not only Asia but also Africa and the Middle East region
represent a significant part of the global rice imports. The top 5 importers (China,
Nigeria, Philippines, Iran and Iraq) account for approx. 30% of global rice imports. The
share of EU rice imports (approx. 1 mio tonnes milled eq.) is also minimal at global level
(approx. 2.5% of global rice imports).

4
Major rice exporters
Source: FAO December 2014
Major rice importers
Source: FAO December 2014

5
1.3 Consumption
In 2014/15 global rice consumption is projected at a record 500.5 million tonnes (milled
basis) and to outpace production for the first time in a decade. Global rice consumption is
projected to further increase in the coming years.
About 83% of rice utilization (415 million tonnes milled basis) would correspond to food
uses, while feed uses would represent 3% and other uses (seed, industrial, waste) would
represent 14%.
China (30 %) and India (21%) are the world biggest rice consumers, being responsible
for more than half of the total world rice consumption. Other significant consumers are
Indonesia (9 %), Bangladesh (8 %), Vietnam (4 %) and the Philippines (3 %). The EU-28
ranks 20th with a stable share of 0.6%.
Main rice consumers (million tonnes, milled basis)
Country 2013/14 est. 2012/13
China 146.30 144.00
India 99.18 94.03
Indonesia 38.50 38.13
Vietnam 22.00 21.90
Philippines 12.85 12.85
Thailand 10.88 10.60
Myanmar 10.50 10.40 Source: USDA Dec. 2014
The global rice production-consumption balance is very fragile due to the minor
difference between the annual output and demand. Since global rice consumption is
predicted to surpass production in 2014/15, global rice stocks are expected to decrease
but despite the decline, world reserves remain high, with a stock-to-use ratio estimated at
34.8% in 2014/15.
Projection of world rice consumption vs. production vs. stocks (milled basis)
Source: IGC Nov. 2014
6
1.4 International market prices
The significance of rice in food security and the relatively low international trade volume
(only 8% approx. of the total rice production) can make world market prices unstable.
Any unexpected change of demand or supply (e.g. adverse weather conditions, natural
disasters, political decisions) in one of the major players can significantly affect
international prices.
Such disruption was observed in 2008, when the Philippines – due to natural disasters
affecting their major rice producing areas – signed a high volume government-to-
government contract with Vietnam. In reaction several major exporters ban rice exports
to protect their local food security (e.g. India, Egypt).
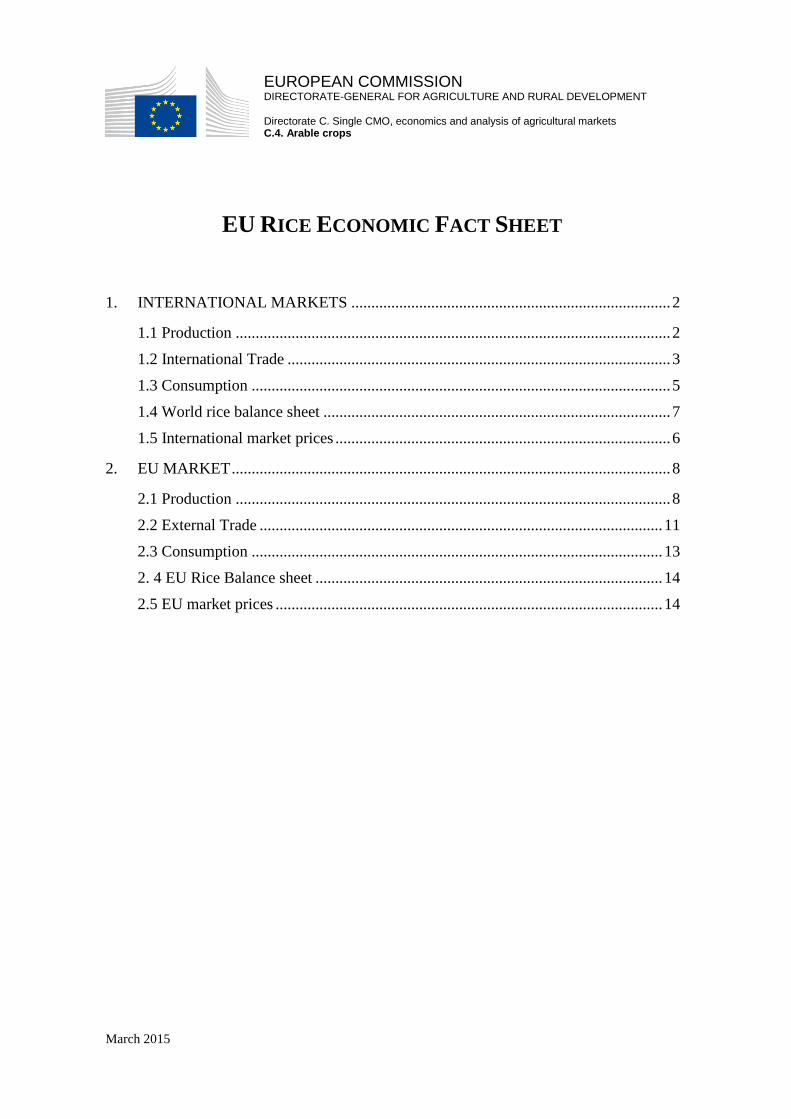
Major measures of the main rice producer/consumer/trader countries during the
rice price boom in 2008
Source: World Bank
After the 2008 price hike, international rice prices decreased but stabilized well above
their former level (prices approx. twice higher in 2012-2014 than in 2002-2004).
Price volatility also increased after the price hike of 2008, as illustrated by the evolution
of the FAO Rice Price Indices over the period 2008-2014 (see chart below).

7
Source: FAO Rice Market Monitor
1.5 World rice balance sheet
Years 2013/14 and 2014/15 have been characterised by:
- High level of rice production (coming close to 500 million tonnes milled basis)
- High level of rice consumption, with global rice consumption projected at a
record 500.5 million tonnes (milled basis) in 2014/15 and to outpace production
for the first time in a decade
- Record level of rice trade, above 40 million tonnes (milled basis)
Global Rice Supply and Demand Estimate
(million tonnes milled eq.)
2012/13 2013/14 2014/15
2014/15
Vs
2013/14
Production 490.5 497.5 496.6 -0.2%
Total Supply 690.7 712.5 718.6
Consumption 477.4 491.2 500.5 +1.9%
Food uses 401.9 409.6 415.4
Feed uses 13.3 14.1 14.5
Other uses 62.3 67.5 70.6
Trade 37.3 40.2 40.5
Ending Stocks 175.7 181.21 177.5 -2.1%
Source: FAO December 2014
This trend of high production, high consumption and high trade on the global rice
markets is expected to stay in the medium term, as illustrated with the five-year global
supply and demand projections issued by IGC end 2014 (see table below).

8
Source: IGC, December 2014
2. EU MARKET
2.1 Production
Over the last years the annual EU rice production has been approx. 1.8 million tonnes
(milled basis) over an area of approx. 450 000 ha (incl. approx. two-thirds of Japonica
rice and one-third of Indica rice).
More precisely in the 2013/14 marketing year the EU-28 produced 1.77 million tonnes
(milled basis) over 425 000 ha. For 2014/15, the forecast is 1.64 million tonnes (milled
basis) over 414 000 ha (due to a significant reduction of the Indica rice area and
production).
EU rice production ('000 t, milled equivalent)
Source: DG AGRI, based on communication from Member States

9
EU rice production is dominated by Japonica rice, which represents approx. 65-70% of
total EU rice production. Historically, Japonica rice has been the traditional rice in
Europe and part of the Mediterranean diet notably in Italy and Spain. Traditional foods
such as paella or risotto are made with Japonica varieties, whose characteristics (e.g.
ability to absorb the flavour of the spices or the sauce itself) make it much more suitable
for the preparation of these foods than Indica rice.
The relative scarcity of Japonica rice at global level (approx. 13% only of global rice
production is Japonica), the small volumes traded internationally and its higher price on
the world market also support predominance of EU japonica rice on the EU market, with
limited competition from imports.
EU rice production is located in 8 Member States. Italy and Spain together are
responsible for 80% of the total rice production (50% for Italy, 30% for Spain)
Share from the EU rice production (2014/15, milled basis)

10
The tables below show the recent evolution of Japonica and Indica areas in the Member
States (in ha).
Japonica area (ha) 2010/11 2011/12 2012/13 2013/14 2014/15
Italy
174 159 181 063
174 974
144 573
164 234
Spain
63 718 62 936
72 452
65 583
58 235
Portugal
22 903 22 905
24 936
25 000
16 243
Greece
10 520 10 835
8 584
9 690
15 433
France
16 000 18 481
18 805
14 500
13 743
Bulgaria
11 059 10 983
8 711
9 595
9 839
Romania
5 300 10 748
10 000
7 750
9 528
Hungary
2 500 2 500
2 463
3 000
2 191
EU
306 000 320 000
321 000
280 000
290 000
Indica area (ha)
2010/11 2011/12
2012/13
2013/14
2014/15
Italy
73 494 65 478
60 078
71 446
55 298
Spain
58 747 58 810
52 687
43 037
43 003
Portugal
5 027 6 745
6 500
6 174
12 425
Greece
23 200 21 743
21 832
17 690
10 573
France
2 800 3 000
3 175
3 500
1 207
Bulgaria
70 100
509
130
31
Romania
8 000 1 912
1 000
3 806
1 733
Hungary
0 0
0
0
0
EU
171 000 158 000
146 000
146 000
124 000
Source: DG AGRI/Member States
Rice yields are quite stable over time, with lower yields for Japonica than for Indica.
2010/11 2011/12 2012/13 2013/14 2014/15
Japonica
Area ( '000 ha) 306 320 321 280 290
Yield (t/ha) paddy 6.2 6.2 6.5 6.4 6.3
Indica
Area ( '000 ha) 171 158 146 146 124
Yield (t/ha) paddy 7.1 7.5 7.8 7.8 7.3 Source: DG AGRI/Member States

11
2.2 External Trade
The role of the external trade, in particular imports, is very significant in the EU, as
around one third of EU rice needs must be imported.
The EU imports every year approx. 1 million tonnes of rice (milled basis) and 300 000
tonnes of broken rice.
EU rice imports consist mainly of Indica rice. For Japonica, the EU is self-sufficient and
a small exportable surplus is produced (approx. 200 000 tonnes milled eq). Around 90%
of EU rice exports are made of Japonica rice. Italy is responsible for around 70% of the
total exports and Spain provides an additional 15 %.
Volumes and origin are influenced by the tariff preferences granted by the EU to various
EU rice producing countries. For instance:
- around 300 000 tonnes or 30% of total EU rice imports come as duty-free imports
from countries benefiting from the so-called EBA agreement like Cambodia and
Myanmar
- around 300 000 tonnes or 30% of total EU rice imports come as duty-free imports
of husked Basmati rice from India and Pakistan
The structure of rice imports has changed over the last years with an increase of imports
of milled rice (approx. 600 000 tonnes ie 60% of all rice imports) and a decrease of
imports of husked rice (non-Basmati).

12
EU Rice Imports
2008/09 2009/10 2010/11 2011/12 2012/13 2013/14
paddy 988 934 337 650 1,191 1,189
husked 494,091 492,776 552,324 454,194 441,896 453,883
husked basmati 155,715 238,485 238,153 250,020 286,593 294,483
husked non-basmati 338,375 254,291 314,171 204,174 155,303 159,400
milled/semi-milled 353,312 411,072 426,904 418,141 494,068 604,171
Total (excl. broken) 848,391 904,781 979,565 872,984 937,154 1,059,243
broken 322,768 258,670 217,206 246,059 304,861 312,107
Grand Total (incl. broken) 1,171,159 1,163,451 1,196,771 1,119,042 1,242,015 1,371,350
Source: COMEXT
Imports of husked Basmati rice have been increasing thanks to the commercial
agreement with India and Pakistan which allow duty-free imports of husked Basmati rice
produced from 9 eligible varieties (see Regulation (EC) No 972/2006). Basmati imports
represent ~ 30 % of total EU rice imports (300 000 tonnes milled eq). In general, two-
thirds of Basmati imports are covered by India and one-third by Pakistan.
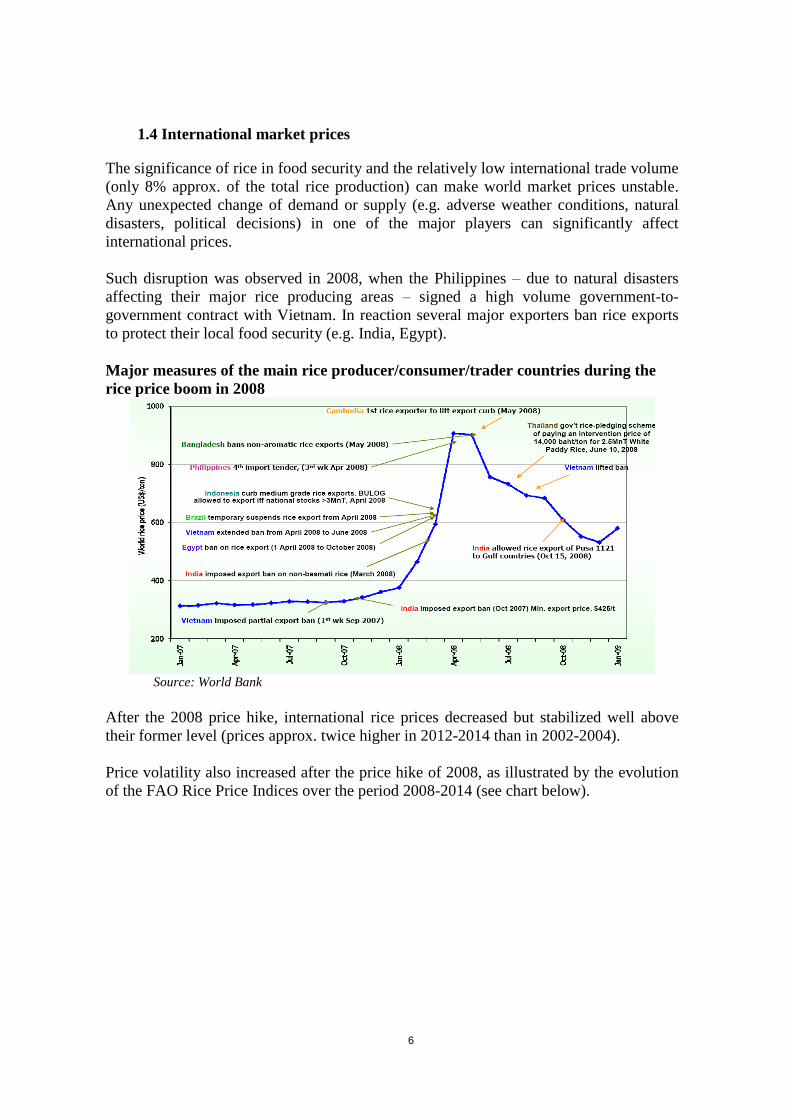
The origin of EU rice imports has also significantly changed over the last years. While
India and Thailand remain key suppliers, duty free imports originating from countries
benefiting from the Every But Arms (EBA) agreement, mainly Cambodia and Myanmar,
have been increasing, while imports originating from ACP countries such as Guyana and
Surinam have been decreasing.
Origin of EU Rice Imports (tonnes milled eq., excl. broken)
Country of Origin 2013/14
India 253 140
Cambodia 235 968
Thailand 189 560
Pakistan 159 970
United States 39 887
Uruguay 36 719
Myanmar 35 135
Vietnam 28 929
Guyana 25 847
Others 54 088
Total 1 059 243
13
Main rice suppliers to the EU (2013/14 EU rice imports, excl. broken rice)
Source: COMEXT
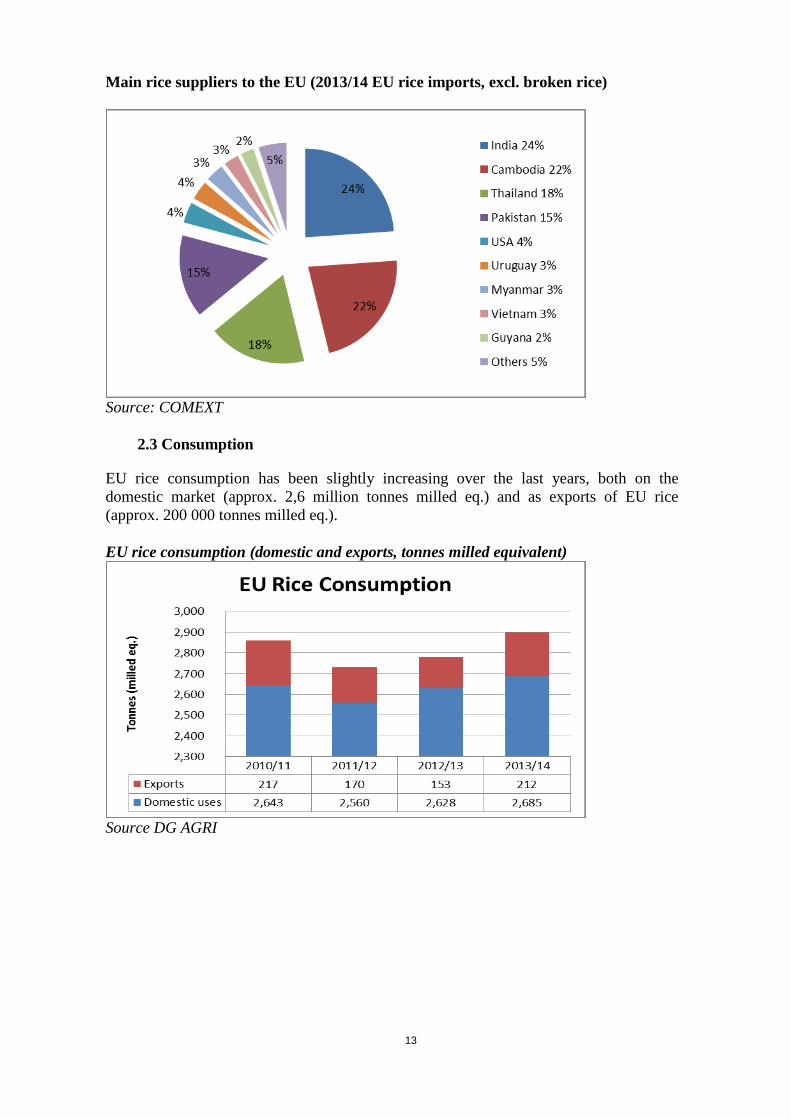
2.3 Consumption
EU rice consumption has been slightly increasing over the last years, both on the
domestic market (approx. 2,6 million tonnes milled eq.) and as exports of EU rice
(approx. 200 000 tonnes milled eq.).
EU rice consumption (domestic and exports, tonnes milled equivalent)
Source DG AGRI

14
2. 4 Balance sheet
The EU rice balance sheet is regularly updated and published at
http://ec.europa.eu/agriculture/cereals/balance-sheets/rice/overview_en.pdf
LAST UPDATED: 26/02/2015 '000 metric tonnes (in milled eqivalent)
Japonica IndicaTOTAL
RICEJaponica Indica
TOTAL
RICEJaponica Indica
TOTAL
RICEJaponica Indica
TOTAL
RICEJaponica Indica
TOTAL
RICE
Beginning stocks
Private 226 277 503 197 274 471 237 257 494 285 255 540 191 281 471
Intervention - - - - - - - - - - - - - - -
Total beginning stocks 226 277 503 197 274 471 237 257 494 285 255 540 191 281 471
Usable production 1,125 723 1,847 1,180 705 1,885 1,205 685 1,890 1,077 693 1,770 1,089 548 1,637
Area ('000 ha) 306 171 477 320 158 478 321 146 467 280 146 425 290 124 414
Agronomic yield (t/ha, on paddy basis) 6.2 7.1 6.5 6.2 7.5 6.6 6.5 7.8 6.9 6.4 7.8 6.9 6.3 7.3 6.6
Milling yield (%) 59% 60% 59% 59% 60% 59% 57% 61% 58% 60% 61% 61% 60% 61% 60%
Imports (from third countries) 69 911 980 76 793 869 81 856 937 92 967 1,059 90 1,050 1,140
TOTAL SUPPLY 1,420 1,910 3,330 1,452 1,772 3,224 1,523 1,798 3,321 1,454 1,915 3,369 1,370 1,878 3,249
Domestic uses
Human consumption / Industrial uses / Animal feed 1,008 1,584 2,592 1,031 1,472 2,503 1,069 1,503 2,573 1,046 1,583 2,629 973 1,579 2,553
Seed *** 32 19 51 36 21 57 36 19 55 34 22 56 37 19 56
Total domestic uses 1,039 1,604 2,643 1,067 1,493 2,560 1,106 1,522 2,628 1,079 1,605 2,685 1,010 1,598 2,609
Exports (to third countries) 183 33 217 148 22 170 133 21 153 183 29 212 220 30 250
TOTAL USE 1,223 1,637 2,860 1,215 1,515 2,730 1,238 1,542 2,781 1,263 1,635 2,897 1,230 1,628 2,859
Final stocks ****
Private 197 274 471 237 257 494 285 255 540 191 281 471 140 250 390
Intervention - - - - - - - - - - - - - - -
Total final stocks 197 274 471 237 257 494 285 255 540 191 281 471 140 250 390
Change in stocks -29 -3 -33 40 -17 23 48 -1 46 -94 25 -69 -51 -31 -81
Change in public stocks - - - - - - - - - - - - - - -
2010/11 2011/12 2012/13 2013/14** 2014/15 fc
2.5 EU market prices
EU prices for Indica paddy rice are lower (approx. 275 EUR/tonne on average since
2010) than for Japonica paddy rice (approx. 300 EUR/tonne on average since 2010). The
same applies for EU prices of milled rice which correspond approx. twice to the EU
prices of paddy rice (ie. approx. 550 - 600 EUR/tonne). Rice prices on the EU market are
higher than on the world market (approx. 550 EUR/tonne for EU milled rice (indica) vs
approx. 400 USD/tonne for Asia milled rice (indica))
Average paddy prices in key EU markets
Source: DG AGRI and Member States communications