eu environmental implementation review 2017ec.europa.eu/environment/eir/pdf/report_nl_en.pdf · the...
TRANSCRIPT
EN EN
EUROPEAN COMMISSION
Brussels, 3.2.2017
SWD(2017) 52 final
COMMISSION STAFF WORKING DOCUMENT
The EU Environmental Implementation Review
Country Report - THE NETHERLANDS
Accompanying the document
Communication from the Commission to the European Parliament, the Council, the
European Economic and Social Committee and the Committee of the Regions
The EU Environmental Implementation Review: Common Challenges and how to
combine efforts to deliver better results
{COM(2017) 63 final}
{SWD(2017) 33 - 51 final}
{SWD(2017) 53 - 60 final}

The Netherlands 2
This report has been written by the staff of the Directorate-General for Environment, European Commission. Any comments are welcome to the following e-mail address: [email protected]
More information on the European Union is available on the internet (http://europa.eu).
Photographs: p.13 – ©LIFE06 NAT/NL/000078/Johannes Timmermars; p.14 – ©Mavermick/iStock; p.19 – ©LIFE06 ENV/NL/000167/iStock; p.20 – ©Kivilcim Pinar/iStock; p.25 – ©vichie81/iStock
For reproduction or use of these photos, permission must be sought directly from the copyright holder.
©European Union, 2017
Reproduction is authorised provided the source is acknowledged.

The Netherlands 3
Environmental Implementation Report – Netherlands
Table of Content
EXECUTIVE SUMMARY .................................................................................................................................... 4
PART I: THEMATIC AREAS ................................................................................................................................ 5
1. TURNING THE EU INTO A CIRCULAR, RESOURCE-EFFICIENT, GREEN AND COMPETITIVE LOW-CARBON ECONOMY ............................................................................................................................... 5
Developing a circular economy and improving resource efficiency ...................................................... 5
Waste management .............................................................................................................................. 8
2. PROTECTING, CONSERVING AND ENHANCING NATURAL CAPITAL ..................................................... 10
Nature and Biodiversity ....................................................................................................................... 10
Estimating Natural Capital ................................................................................................................... 12
Green Infrastructure ............................................................................................................................ 12
Soil protection ..................................................................................................................................... 13
Marine protection ............................................................................................................................... 13
3. ENSURING CITIZENS' HEALTH AND QUALITY OF LIFE .......................................................................... 16
Air quality ............................................................................................................................................ 16
Water quality and management ......................................................................................................... 17
Enhancing the sustainability of cities .................................................................................................. 20
International agreements .................................................................................................................... 21
PART II: ENABLING FRAMEWORK: IMPLEMENTATION TOOLS ...................................................................... 22
4. MARKET BASED INSTRUMENTS AND INVESTMENT............................................................................. 22
Green taxation and environmentally harmful subsidies ..................................................................... 22
Green Public Procurement .................................................................................................................. 23
Investments: the contribution of EU funds ......................................................................................... 23
5. EFFECTIVE GOVERNANCE AND KNOWLEDGE ...................................................................................... 25
Effective governance within central, regional and local government ................................................. 25
Compliance assurance ......................................................................................................................... 27
Public participation and access to justice ............................................................................................ 29
Access to information, knowledge and evidence ................................................................................ 29
The Netherlands 4
Environmental Implementation Report – Netherlands
Executive summary
About the Environmental Implementation Review
In May 2016, the Commission launched the Environmental Implementation Review (EIR), a two-year cycle of analysis, dialogue and collaboration to improve the implementation of existing EU environmental policy and legislation1. As a first step, the Commission drafted 28 reports describing the main challenges and opportunities on environmental implementation for each Member State. These reports are meant to stimulate a positive debate both on shared environmental challenges for the EU, as well as on the most effective ways to address the key implementation gaps. The reports rely on the detailed sectoral implementation reports collected or issued by the Commission under specific environmental legislation as well as the 2015 State of the Environment Report and other reports by the European Environment Agency. These reports will not replace the specific instruments to ensure compliance with the EU legal obligations.
The reports will broadly follow the outline of the 7th Environmental Action Programme2 and refer to the 2030 Agenda for Sustainable development and related Sustainable Development Goals (SDGs)3 to the extent to which they reflect the existing obligations and policy objectives of EU environmental law4.
The main challenges have been selected by taking into account factors such as the importance or the gravity of the environmental implementation issue in the light of the impact on the quality of life of the citizens, the distance to target, and financial implications.
The reports accompany the Communication "The EU Environmental Implementation Review 2016: Common challenges and how to combine efforts to deliver better results", which identifies challenges that are common to several Member States, provides preliminary conclusions on possible root causes of implementation gaps and proposes joint actions to deliver better results. It also groups in its Annex the actions proposed in each country report to improve implementation at national level.
General profile
The Netherlands has since long been a forerunner in environmental policy, both in terms of tackling environmental pressures and in organising effective
1
Communication "Delivering the benefits of EU environmental policies through a regular Environmental Implementation Review" (COM/2016/ 316 final).
2 Decision No. 1386/2013/EU of 20 November 2013 on a General Union
Environmental Action Programme to 2020 "Living well, within the limits of our planet".
3 United Nations, 2015. The Sustainable Development Goals
4 This EIR report does not cover climate change, chemicals and energy.
environmental governance in partnership with regional and local administrations, with business and civil society. However, there are still several main challenges to be addressed and opportunities to be exploited.
Main Challenges
The main challenges with regard to implementation of EU environmental policy and law in the Netherlands are:
Improving water quality, in particular regarding nutrients concentrations in surface waters.
Improving air quality, in particular the concentrations of nitrogen dioxide and ozone to prevent premature deaths.
Optimising the contribution of the Natura 2000 and the national nature networks to achieving good conservation status, and to reduce habitat fragmentation and biodiversity loss, atmospheric nitrogen deposition, desiccation and acidification.
Main Opportunities
The Netherlands could perform better on topics where there is already a good knowledge base and good practices. This applies in particular to:
Exploring the full potential of resource efficiency measures by small and medium enterprises (SMEs) by hands-on technical and financial support to SMEs.
Building on the experience with flood protection measures and promoting green infrastructure as priority solution for restoring the Dutch natural capital and for delivering multiple services to people.
Points of Excellence
The Netherlands is a leader on environmental implementation, which is supported by innovative multi-level governance. The results could be shared more widely with other countries. Good examples are:
The Dutch green public procurement approach is one of the most ambitious and successful in the EU, stimulating markets for sustainable products.
The ‘Green Deals’ signed by government and stakeholders to overcome obstacles for green growth are very successful and can be seen as an EU good practice.
Mainstreaming green thinking in the financial sector, for example by the largest Dutch pension fund (ABP), which adopted a policy for sustainable investment in 2015.
Pioneering work on mapping and assessment the ecosystems and their services, and on developing natural capital accounting system.

The Netherlands 5
Environmental Implementation Report – Netherlands
Part I: Thematic Areas
1. Turning the EU into a circular, resource-efficient, green and competitive low-carbon economy
Developing a circular economy and improving resource efficiency
The 2015 Circular Economy Package emphasizes the need to move towards a lifecycle-driven ‘circular’ economy, with a cascading use of resources and residual waste that is close to zero. This can be facilitated by the development of, and access to, innovative financial instruments and funding for eco-innovation.
SDG 8 invites countries to promote sustained, inclusive and sustainable economic growth, full and productive employment and decent work for all. SDG 9 highlights the need to build resilient infrastructure, promote inclusive and sustainable industrialization and foster innovation. SDG 12 encourages countries to achieve the sustainable management and efficient use of natural resources by 2030.
Measures towards a circular economy
Transforming our economies from linear to circular offers an opportunity to reinvent them and make them more sustainable and competitive. This will stimulate investments and bring both short and long-term benefits for the economy, environment and citizens alike5.
The Netherlands aims to be a hotspot for the circular economy where new social and economic processes go hand in hand with innovative technology and production processes, by 2020. The Netherlands can be considered as a frontrunner in this field and was one of the first to present a circular economy programme (2014), followed in September 2016 by government wide Programme on Circular Economy by 2050.6 Over the past years, circular economy, cradle-to-cradle and sustainable design have become main trends.
All policy efforts in the Netherlands related to the circular economy are captured in the action plan ‘From waste to resource’ (VANG-programme). The VANG-programme has nine overall operational goals and 54 actions in total. The original number of actions (in 2013) was 39. This shows the flexibility of the programme to adapt to circumstances and seize opportunities. The nine operational goals and some of their key activities will be presented briefly below.
5 European Commission, 2015. Proposed Circular Economy Package
6 Government of the Netherlands, 2016. A Circular Economy in the
Netherlands by 2050.
Within the theme of Product design for circularity the aim is to diminish material losses by 50%, to 5 million tonnes, within 10 years. In the past period the programme Creating Business through Circular Design (CIRCO) was launched and input was provided for the European policy process to integrate EU product legislation with the EU Ecodesign Directive.
In order to integrate circular economy in industry and policy, as well as in the curricula of relevant educational courses, a specific programme, the Practice Research From Waste to Resource (PRO VANG), has been set up so that technical colleges can work in partnership with business students on specific technical solutions that fit into the circular economy. It has funded 110 projects. Results are used in the development of training programmes. SME-focused research agendas were also set up in the field of plastics, metals and organic-waste processing. In addition, in the ‘Top’ sectors, the targeted sectors for growth of the Dutch Economy, research agendas are being developed. Furthermore, within this activity the RACE-coalition (Realisation Acceleration Circular Economy) was set up to coordinate acceleration of the circular economy.
Companies are supported in assessing their risks in relation to resources. This includes research on the resource situation for 64 possibly critical materials (and activities to translate the findings to useful information for entrepreneurs), two activities on promoting the role of harbours in the circular economy, and support for the Dutch participation in the Knowledge and Innovation Community (KIC) for Raw Materials.
Financial and other market incentives have been developed to promote circular entrepreneurship. Since 1 January 2015, the waste tax is extended from waste deposit to waste incineration. Work is in progress on adapting other taxes for waste. In order to further develop the theme of taxation in the context of circular economy, this topic has been promoted during the Dutch EU Presidency in 2016. Within BENELUX there is also cooperation on the circular economy78.
An important trend is the mainstreaming of green thinking in the financial sector. Where in past years sustainability was an issue only for a limited number of frontrunner and specialised green banks, sustainability,
7 BENELUX, Roundtable 14.12.2015 8 Luxembourg Government, Portail de l'environnement.
The Netherlands 6
Environmental Implementation Report – Netherlands
as part of the broader concept of Corporate Social Responsibility (CSR), is now becoming a more prominent issue. This increase of attention is not limited to the relation between the customer and the financial institution, but also on the relations between financial institutions and the companies they invest in.
A good practice comes from the Dutch Pension Fund for Civil Servants (ABP, the largest Dutch pension fund) which adopted a new policy for sustainable investment in 2015. Over the next five years, it will assess the sustainability and responsible entrepreneurship of all 4,000 companies in which it invests. Furthermore, ABP wants to reduce the CO2-footprint of the companies it invests in by 25%, increase the assets in High Sustainability Investments (HSIs) from EUR 29 billion to EUR 58 billion, increase investments in sustainable energy from EUR 1 billion to EUR 5 billion, and increase involvement in issues such as human rights, security and education (all by 2020).
Circular Procurement is promoted as well as circular consumption patterns. Various experiments have been set up, including reuse of ICT equipment that is discarded by the government. A specific project is set-up to remove regulatory barriers for the circular economy and increase waste separation by household to at least 75% in 2020 (or max. 100 kg of residual household waste per inhabitant per year). Finally, indicators and statistics are developed to increase insight in developments that may promote the circular economy.
One of the most innovative instruments are the so-called 'Green Deals', which are concluded by the Dutch government with business and other stakeholders to overcome obstacles blocking green developments, through specific initiatives that contribute to green growth and can serve as an example. Since this initiative started in 2011, more than 200 Green Deals have been concluded, for example on energy, climate, water, natural resources, bio-based economy, construction and food.9 As part of the Dutch EU Presidency, a first international Green Deal was closed in March 2016, in the field of circular economy, with participation from the Netherlands, France, the UK, Flanders, businesses and environmental NGOs10. The strong agro-food and chemical sectors offer opportunities for replacement of fossil fuels by other bio-based sources. The ambition of the Dutch Platform Green Resources is to replace 30% of fossil resources by 203011.
To support implementation of Green Deals and other innovative approaches, the government is keen to
9 http://www.greendeals.nl/english/
10 Eco-innovation Observatory, Eco-innovation in The Netherlands - EIO Country Profile 2014-2015
11 Ecologic Institute, IEEP, BIO by Deloitte, 2015. A framework for Member States to support business in improving its resource efficiency. Study for the European Commission
remove laws and regulations obstructing entrepreneurs in making their production processes circular.
Part of the move to a circular economy is also stimulating a shift from some products to services. Interesting examples include providing ‘light’ instead of lamp bulbs and the leasing of jeans instead of buying one12.
The Netherlands do not have central tools to support industrial symbiosis (collaboration between companies to enable, for example, that waste of one company becomes resource for another), but there are many local initiatives on this, in e.g. the energy, metals, chemicals, food and agricultural sectors13.
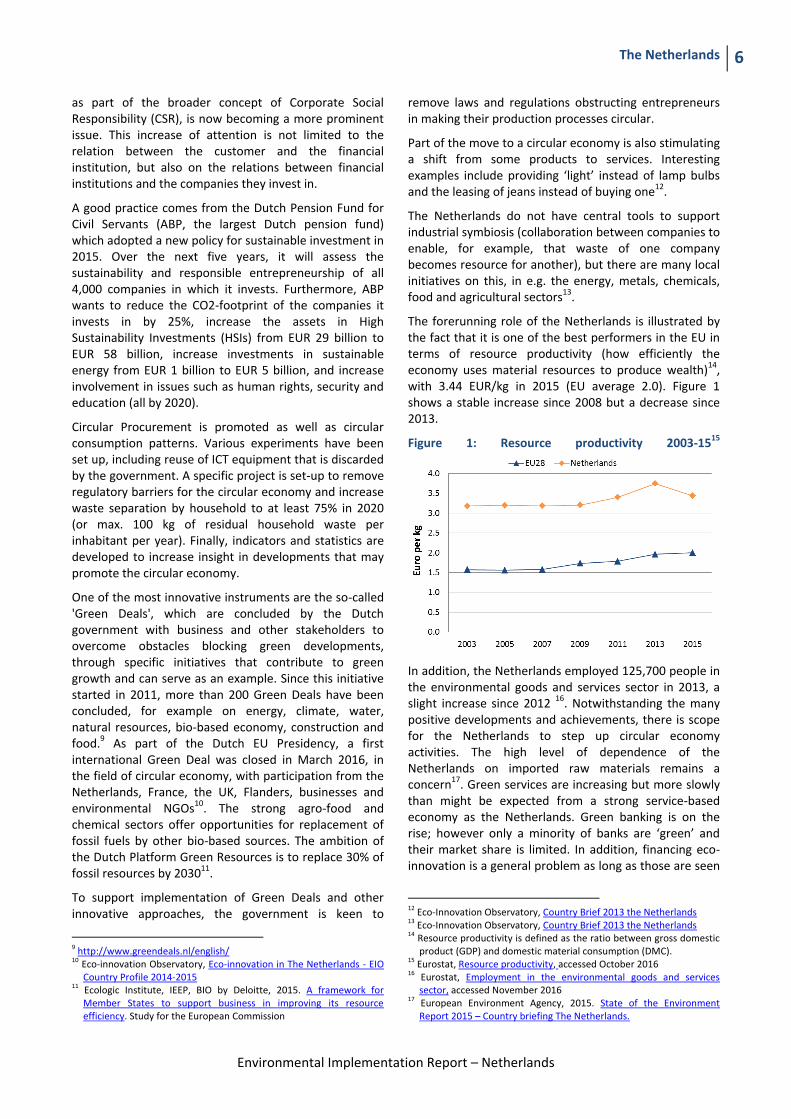
The forerunning role of the Netherlands is illustrated by the fact that it is one of the best performers in the EU in terms of resource productivity (how efficiently the economy uses material resources to produce wealth)14, with 3.44 EUR/kg in 2015 (EU average 2.0). Figure 1 shows a stable increase since 2008 but a decrease since 2013.
Figure 1: Resource productivity 2003-1515
In addition, the Netherlands employed 125,700 people in the environmental goods and services sector in 2013, a slight increase since 2012 16. Notwithstanding the many positive developments and achievements, there is scope for the Netherlands to step up circular economy activities. The high level of dependence of the Netherlands on imported raw materials remains a concern17. Green services are increasing but more slowly than might be expected from a strong service-based economy as the Netherlands. Green banking is on the rise; however only a minority of banks are ‘green’ and their market share is limited. In addition, financing eco-innovation is a general problem as long as those are seen
12
Eco-Innovation Observatory, Country Brief 2013 the Netherlands 13
Eco-Innovation Observatory, Country Brief 2013 the Netherlands 14
Resource productivity is defined as the ratio between gross domestic product (GDP) and domestic material consumption (DMC).
15 Eurostat, Resource productivity, accessed October 2016
16 Eurostat, Employment in the environmental goods and services sector, accessed November 2016
17 European Environment Agency, 2015. State of the Environment Report 2015 – Country briefing The Netherlands.
The Netherlands 7
Environmental Implementation Report – Netherlands
as high-risk investments.
SMEs and resource efficiency
A recent study illustrates that the Netherlands strongly relies on voluntary agreements and initiatives to improve resource efficiency18. No national policies exist on other support measures, such as improving financing, supporting Extended Producer Responsibility, incentivising external audits and improving company accounting and reporting practices19.
A recent study illustrates that the Netherlands strongly relies on voluntary agreements and initiatives to improve resource efficiency20. No national policies exist on other support measures, such as improving financing, supporting Extended Producer Responsibility, incentivising external audits and improving company accounting and reporting practices21.
In the Flash 426 Eurobarometer "SMEs, resource efficiency and green markets" it is shown that 62% of the Dutch SMEs have invested up to 5% of their annual turnover in their resource efficiency actions (EU28 average 50%), 27% of them are currently offering green products and services (EU28 average 26%), 59% took measures to save energy (EU28 average 59%), 63% to minimise waste (EU28 average 60%), 29% to save water (EU28 average 44%), and 57% to save materials (EU28 average 54%). From a circular economy perspective, 45% took measures to recycle by reusing material or waste within the company (EU28 average 40%), 24% to design products that are easier to maintain, repair or reuse (EU28 average 22%) and 34% were able to sell their scrap material to another company (EU28 average 25%).
According to the Flash 426 Eurobarometer, the resource efficiency actions undertaken allowed the reduction of production costs in a 40% of the Netherlands' SMEs (EU28 average 45%).
The full potential of resource efficiency could be better tapped into by these companies. It has been estimated that cost saving for only four SME sectors (food & beverages; energy, power & utilities; environmental technologies; construction) could already amount to EUR 3.6 billion. This implies an average potential saving of EUR 27,600 per enterprise for in total 132,400 businesses
18 Ecologic Institute, IEEP, BIO by deloitte, 2015. A framework
for Member States to support business in improving its resource efficiency. Study for the European Commission
19 Ecologic Institute, IEEP, BIO by deloitte, 2015. A framework for Member States to support business in improving its resource efficiency. Study for the European Commission
20 Ecologic Institute, IEEP, BIO by deloitte, 2015. A framework for Member States to support business in improving its resource efficiency. Study for the European Commission
21 Ecologic Institute, IEEP, BIO by deloitte, 2015. A framework for Member States to support business in improving its resource efficiency. Study for the European Commission
in the four sectors (17% of all SMEs)22.
Around 29,000 new jobs could be created and 82,000 jobs could be secured if all SMEs in these four sectors would fully use their potential for resource efficiency. The Flash 426 Eurobarometer shows that 25% of the SMEs in the Netherlands have one or more full time employee working in a green job at least some of the time (EU28 average 35%). The Netherlands has an average number of 2.5 full time green employees per SME (EU28 average 1.7%)23.
Eco-innovation
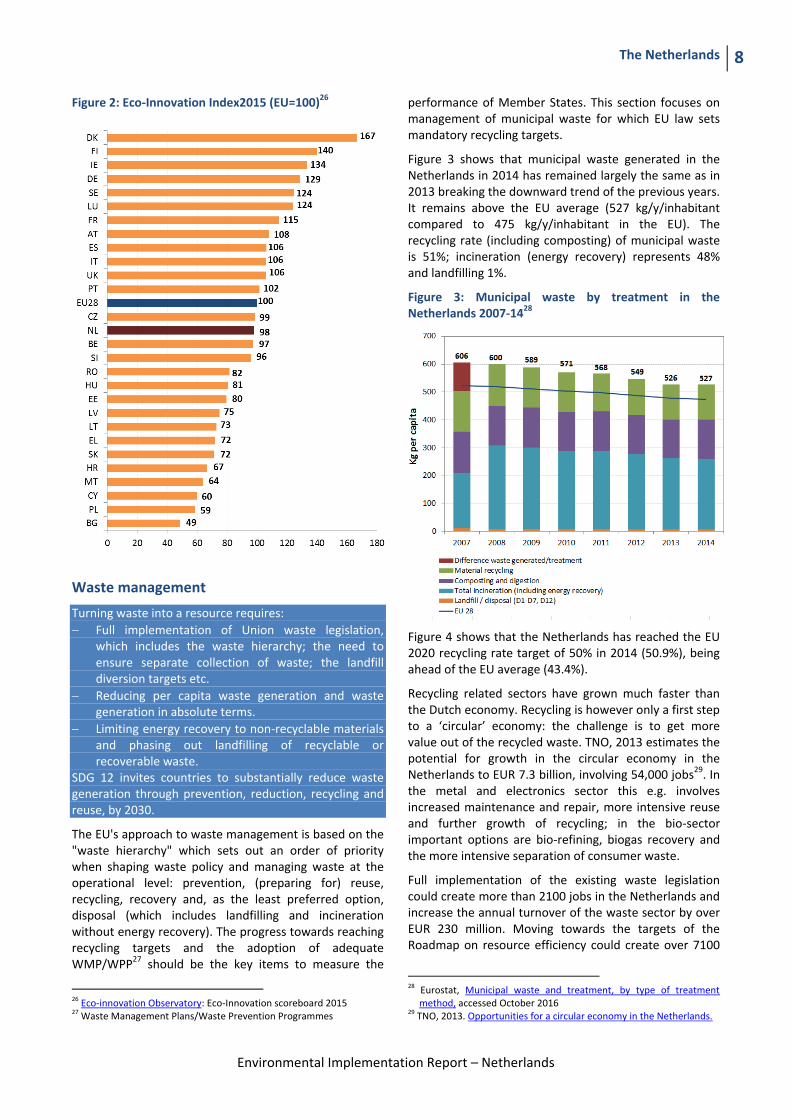
Although eco-innovation in the Netherlands has a long-standing tradition dating back to the 1970s, the Netherlands ranks only 14th in 2015 on the eco-innovation scoreboard as shown in Figure 2.
The main barriers of eco-innovation in the Netherlands are lack of entrepreneurs, risk aversion and the cultural climate for eco-innovation, which is rather negative. At the same time, its technical position is rather good, as many Dutch universities are among the top in the world in scientific and technological disciplines24.
Finally, the Netherlands shows relatively limited application of the Eco-Management and Audit Schemes (EMAS) and the Eco-label25.
Suggested action
Explore the full potential of resource efficiency measures for and by SMEs. Cost savings of at least EUR 4 billion per year are within reach with an adequate investment climate and hands-on, direct technical and financial support to SMEs.
22
RPA, 2014. Study on Economic and Social Benefits of Environmental Protection and Resource Efficiency Related to the European Semester. Study for the European Commission
23 The Flash 426 Eurobarometer "SMEs, resource efficiency and green markets" defines "green job" as a job that directly deals with information, technologies, or materials that preserves or restores environmental quality. This requires specialised skills, knowledge, training, or experience (e.g. verifying compliance with environmental legislation, monitoring resource efficiency within the company, promoting and selling green products and services).
24 Eco-Innovation Observatory, Country Brief 2013 the Netherlands, p. 11
25 For example, the Netherlands was awarded 85 Eco label licences in March 2015, slightly above the EU average. The Netherlands performed below the EU average with 1068 Eco-label products and services. See European Commission, 2016. Ecolabel
The Netherlands 8
Environmental Implementation Report – Netherlands
Figure 2: Eco-Innovation Index2015 (EU=100)26
Waste management
Turning waste into a resource requires:
Full implementation of Union waste legislation, which includes the waste hierarchy; the need to ensure separate collection of waste; the landfill diversion targets etc.
Reducing per capita waste generation and waste generation in absolute terms.
Limiting energy recovery to non-recyclable materials and phasing out landfilling of recyclable or recoverable waste.
SDG 12 invites countries to substantially reduce waste generation through prevention, reduction, recycling and reuse, by 2030.
The EU's approach to waste management is based on the "waste hierarchy" which sets out an order of priority when shaping waste policy and managing waste at the operational level: prevention, (preparing for) reuse, recycling, recovery and, as the least preferred option, disposal (which includes landfilling and incineration without energy recovery). The progress towards reaching recycling targets and the adoption of adequate WMP/WPP27 should be the key items to measure the
26
Eco-innovation Observatory: Eco-Innovation scoreboard 2015 27
Waste Management Plans/Waste Prevention Programmes
performance of Member States. This section focuses on management of municipal waste for which EU law sets mandatory recycling targets.
Figure 3 shows that municipal waste generated in the Netherlands in 2014 has remained largely the same as in 2013 breaking the downward trend of the previous years. It remains above the EU average (527 kg/y/inhabitant compared to 475 kg/y/inhabitant in the EU). The recycling rate (including composting) of municipal waste is 51%; incineration (energy recovery) represents 48% and landfilling 1%.
Figure 3: Municipal waste by treatment in the Netherlands 2007-1428
Figure 4 shows that the Netherlands has reached the EU 2020 recycling rate target of 50% in 2014 (50.9%), being ahead of the EU average (43.4%).
Recycling related sectors have grown much faster than the Dutch economy. Recycling is however only a first step to a ‘circular’ economy: the challenge is to get more value out of the recycled waste. TNO, 2013 estimates the potential for growth in the circular economy in the Netherlands to EUR 7.3 billion, involving 54,000 jobs29. In the metal and electronics sector this e.g. involves increased maintenance and repair, more intensive reuse and further growth of recycling; in the bio-sector important options are bio-refining, biogas recovery and the more intensive separation of consumer waste.
Full implementation of the existing waste legislation could create more than 2100 jobs in the Netherlands and increase the annual turnover of the waste sector by over EUR 230 million. Moving towards the targets of the Roadmap on resource efficiency could create over 7100
28
Eurostat, Municipal waste and treatment, by type of treatment method, accessed October 2016
29 TNO, 2013. Opportunities for a circular economy in the Netherlands.

The Netherlands 9
Environmental Implementation Report – Netherlands
additional jobs and increase the annual turnover of the waste sector by over EUR 750 million30.
Figure 4: Recycling rate of municipal waste 2007-1431
Within the national action plan ‘From waste to resource’ (VANG) a goal is set to reduce the amount of residual waste incinerated/landfilled from 10 Mton in 2012 to 5Mton in 2022. Besides that a target has been set to reduce the amount of residual waste from households to 100kg per inhabitant per year. This target can only be achieved when prevention as well as recycling increase.
Suggested action
Introduce new policies, including economic instruments, to promote prevention, make reuse and recycling more economically attractive, building further on the existing policy to promote 'pay as you throw' schemes.
30
Bio Intelligence service, 2011. Implementing EU Waste legislation for Green Growth, study for European Commission. The breakdown per country on job creation was made by the consultant on Commission demand but was not included in the published document.
31 Eurostat, Recycling rate of municipal waste, accessed October 2016

The Netherlands 10
Environmental Implementation Report – Netherlands
2. Protecting, conserving and enhancing natural capital
Nature and Biodiversity
The EU Biodiversity Strategy aims to halt the loss of biodiversity in the EU by 2020, restore ecosystems and their services in so far as feasible, and step up efforts to avert global biodiversity loss. The EU Birds and Habitats Directives aim at achieving favourable conservation status of protected species and habitats.
SDG 14 requires countries to conserve and sustainably use the oceans, seas and marine resources, while SDG 15 requires countries to protect, restore and promote the sustainable use of terrestrial ecosystems, sustainably manage forests, combat desertification, and halt and reverse land degradation and halt biodiversity loss.
The 1992 EU Habitats Directive and the 1979 Birds Directive are the cornerstone of the European legislation aimed at the conservation of the EU's wildlife. Natura 2000, the largest coordinated network of protected areas in the world, is the key instrument to achieve and implement the Directives' objectives to ensure the long-term protection, conservation and survival of Europe's most valuable and threatened species and habitats and the ecosystems they underpin.
The adequate designation of protected sites as Special Ares of Conservation (SAC) under the Habitats Directive and as Special Protection Areas (SPA) under the Birds Directive is a key milestone towards meeting the objectives of the Directives. The results of Habitats Directive Article 17 and Birds Directive Article 12 reports and the progress towards adequate Sites of Community Importance (SCI)-SPA and SAC designation32 both in land and at sea, should be the key items to measure the performance of Member States.
Biodiversity has steadily declined during the past century in the Netherlands. In the last years, this decline has been gradually slowing down. In 2014 Dutch Environment Assessment Agency concluded that 75% of the habitats and species protected by the Birds and Habitats Directives are still in an unfavourable status of conservation.33 34 This is also confirmed by the reports received by the Commission.
Decreasing over-fertilization and acidification have had
32
Sites of Community Importance (SCIs) are designated pursuant to the Habitats Directive whereas Special Areas of Protection (SPAs) are designated pursuant to the Birds Directive; figures of coverage do not add up due to the fact that some SCIs and SPAs overlap. Special Areas of Conservation (SACs) means a SCI designated by the Member States.
33 Planbureau voor de Leefomgeving, 2014. Balans van de Leefomgeving
34 Conservation status is assessed using a standard methodology as being either ‘favourable’, ‘unfavourable-inadequate’ and ‘unfavourable-bad’, based on four parameters as defined in Article 1 of the Habitats Directive.
positive effects on biodiversity. Due to expansion of nature areas, land available to plant and animal species is increasing. Overall, biodiversity loss has slowed, but not stopped and outside the nature areas, however, biodiversity still continues to decline35.
Habitat fragmentation, atmospheric nitrogen deposition, desiccation and acidification are still major threats to terrestrial biodiversity in the Netherlands. Desiccation of groundwater dependent nature is a wide-spread problem and in two-thirds of the natural area critical loads for nitrogen deposition are still exceeded. At sea the main threats to biodiversity result from pollution and fishing industry. The threat of potentially invasive alien pecies is increasing36.
By early 2016, 13.29% of the national land area of the Netherlands was covered by Natura 2000 (EU average 18.1%), with Birds Directive SPAs covering 11.48% (EU average 12.3%) and Habitats Directive SCIs covering 7.55 % (EU average 13.8%)37.
The Natura 2000 sites are being complemented by national network nature areas. The process for the designation of the sites as special areas of conservation is almost complete and the establishment of management plans for all sites is making good progress.
The latest assessment of the Natura 2000 network shows that the Netherlands have largely completed their Natura 2000 network on land and on sea. Only a few minor gaps still need to be addressed38 as shown in Figure 539.
35
European Environment Agency, 2015. State of the Environment Report 2015 – Country briefing The Netherlands
36 Rijksoverheid, 2014. Rijksnatuurvisie 2014 'Natuurlijk verder'
37 Sites of Community Importance (SCIs) are designated pursuant to the Habitats Directive whereas Special Areas of Protection (SPAs) are designated pursuant to the Birds Directive; figures do not add up due to the fact that some sites are designated as both SCIs and SPAs. Special Areas of Conservation (SACs) means a SCI designated by the Member States.
38 For each Member State, the Commission assesses whether the species and habitat types on Annexes I and II of the Habitats Directive, are sufficiently represented by the sites designated to date. This is expressed as a percentage of species and habitats for which further areas need to be designated in order to complete the network in that country. The current data, which were assessed in 2014-2015, reflect the situation up until December 2013.
39 The percentages in Figure 5 refer to percentages of the total number of assessments (one assessment covering 1 species or 1 habitat in a given biographical region with the Member State); if a habitat type or a species occurs in more than 1 Biogeographic region within a given Member State, there will be as many individual assessments as there are Biogeographic regions with an occurrence of that species or habitat in this Member State.

The Netherlands 11
Environmental Implementation Report – Netherlands
Figure 5: Sufficiency assessment of SCI networks in the Netherlands based on the situation until December 201340
In 2014 the Dutch Government adopted a new nature vision, ‘Nature of the Future’, which has at its core a desired shift in thinking about nature policy: from protecting nature against society towards strengthening nature with society41. Biodiversity targets should be reached by using all opportunities for synergy between nature values and social and economic activities. The approach should give more room to dynamic and robust ecosystems, while focusing on landscape and national levels rather than on the local level. Nature is seen as the basis of general prosperity and well-being and the interests of society as going beyond the preservation of biodiversity per se. The combination of nature conservation with private and public initiatives should be encouraged and any ineffective elements of the existing regulatory framework will be questioned.
According to the latest report on the conservation status of habitats and species covered by the Habitats Directive42, 3.8% of the habitats' biogeographic assessments were favourable in 2013 (EU 27: 16%). On the other hand, 50 % are considered to be unfavourable–inadequate (EU27: 47%) and 46% are unfavourable – bad (EU27: 30%). As for the species, 23% of the assessments were favourable in 2013 (EU 27: 23%), 23% at unfavourable-inadequate (EU27: 42%) and 50% unfavourable-bad status (EU27: 18%). This is depicted in Figure 643. 54.4% and 10% of the unfavourable
40
European Commission internal assessment. 41 Netherland Environment Assessment Agency, Nature Outlook 42
The core of the ‘Article 17’ report is the assessment of conservation status of the habitats and species targeted by the Habitats Directive.
43 Please note that a direct comparison between 2007 and 2013 data is complicated by the fact that Bulgaria and Romania were not covered by the 2007 reporting cycle, that the ‘unknown’ assessments have strongly diminished particularly for species, and that some reported changes are not genuine as they result from improved data / monitoring methods.
assessments respectively for species and habitats were showing a positive trend in 2013.
Figure 6: Conservation status of habitats and species in the Netherlands in 2007/2013 (%)44
Figure 7 illustrates that that a substantial part - more than one-third - of the bird species breeding in the Netherlands has decreasing populations. For wintering species this is around 20%.
Figure 7: Short-term population trend of breeding and wintering bird species in the Netherlands in 2012 (%)45
The Netherlands have established a programmatic approach to address agricultural activities in a general context of very high levels of nitrogen deposition.
They are implementing a new collective approach to financing agri-environmental measures under their Rural
44
These figures show the percentage of biogeographical assessments in each category of conservation status for habitats and species (one assessment covering 1 species or 1 habitat in a given biographical region with the Member State), respectively. The information is based on Article 17 of the Habitats Directive reporting - national summary of the Netherlands.
45 Article 12 of the Birds Directive reporting - national summary of the Netherlands
The Netherlands 12
Environmental Implementation Report – Netherlands
Development Programme, which is part of the EU's Common Agricultural Policy. Restricting subsidies under this scheme to groups of farmers who commit to agreed nature conservation objectives for large areas, aims at improving the efficiency and coherence of the measures involved and enhancing the interest and motivation of the farming community to participate in nature conservation efforts.
In the Netherlands the share of forests is one of the lowest in the EU. Only 11% of the land (and 0.2 ha per capita) is forests & other wooded land – the second lowest value in the EU. Management of Dutch forests is well framed but also characterised by high intensity practices and a relatively poor biodiversity situation. Forest Europe data from 2006 suggest that forests in the Netherlands are more fragmented than in most other EU countries.
In 2010, the entire Dutch forest area was under a management plan or equivalent. All assessments of their conservation status during the 2007-12 period were 'unfavourable'46.
The rich and unique fauna and flora in the Dutch overseas entities is not covered by Natura 2000 and therefore targeted protection measures and adequate financial resources supported by sustainable partnerships should be devoted to conserving their exceptional wealth of biodiversity, in line with the conclusions of Environment Council of December 2015.
Suggested action
Further optimise the contribution of Natura 2000 and national nature protection networks to achieving good conservation status, and reduce habitat fragmentation, atmospheric nitrogen deposition, desiccation and acidification.
Complete the establishment of management plans for all Natura 2000 sites and ensure their full and active implementation in order to maintain/restore species and habitats of community interest to a favourable conservation status across their natural range.
Ensure that the Rural Development Programme and the implementation of greening favour biodiversity measures and contribute to achieving a favourable conservation status of habitats and species.
Estimating Natural Capital
The EU Biodiversity Strategy to 2020 calls on the Member States to map and asses the state of ecosystems and their services in their national territory by 2014, assess the economic value of such services, and promote the integration of these values into accounting and reporting systems at EU and national level by 2020.
46
Article 17 of the Habitats Directive reporting - national summary of the Netherlands.
The Netherlands is developing an Atlas of Natural Capital (ANK) in the context of the Mapping and Assessment of Ecosystems and their Services (MAES)47. The Dutch environmental Assessment Agency (PBL) finalised a large natural capital programme that provides evidence on how different domains can use the concepts of natural capital and ecosystem services to make their decisions more nature-inclusive. It included a number of studies on the use of ecosystem services48 in agriculture under the new CAP, in flood defence, in new biobased production opportunities and in business-development, as well as on ecosystem services and international trade in agricultural and forestry products49.
The Netherlands has a well-developed system of environmental accounts, in particular in the water sector, and is one of the few Member States to have experimented concretely with ecosystem accounts at local level. The experiments are at the moment being scaled up to a regional and national level. NGO’s, companies and governmental organisations have agreed to collaborate on transparency regarding natural and social capital. In the province of Limburg, accounts have been developed for a number of ecosystem types and ecosystem types, using bio physical information, as well as monetary estimates.
Suggested action
Continue the current efforts to map and assess ecosystems and their services, and develop natural capital accounting systems, and share the experience gained with other Member States.
Green Infrastructure
The EU Green Infrastructure Strategy50 promotes the incorporation of green infrastructure into related plans and programmes to help overcome fragmentation of habitats and preserve or restore ecological connectivity, enhance ecosystem resilience and thereby ensure the continued provision of ecosystem services.
Green Infrastructure provides ecological, economic and social benefits through natural solutions. It helps to understand the value of the benefits that nature provides to human society and to mobilise investments to sustain and enhance them.
Whilst the Netherlands were one of the frontrunners in developing its National Ecological Network in the years following its design phase in the 1990s, the subsequent budget and resource cuts at national level have limited
47
Atlas Natural Capital, 2016. Natural Capital 48
Ecosystem services are benefits provided by nature such as food, clean water and pollination on which human society depends.
49 TEEB, 2016. Making Nature's Values Visible
50 European Union, Green Infrastructure — Enhancing Europe’s Natural Capital, COM/2013/0249
The Netherlands 13
Environmental Implementation Report – Netherlands
the functionality of the national ecological network51 for biodiversity protection and its capacity to deliver multiple ecosystem services to citizens.
Further to the biodiversity conservation function of such Green Infrastructure, the Netherlands have invested considerably into solutions for climate change adaptation by restoring the water retention capacity of floodplain ecosystems in its 'ruimte voor de rivier'52 programme, but the integration of climate adaptation and biodiversity53 aspects would need to be further intensified in the future.
Considerations for sustainable urban development through Green Infrastructure are taken up locally 54 and should be further promoted and integrated in the relevant financing tools. Benefits for health policy, sustainable agriculture and innovation/creating markets for SMEs through Green Infrastructure are tapped into locally but there is scope to promote them also at national level. The government stimulates climate adaptation in the framework of the Delta programme.
Soil protection
The EU Soil Thematic Strategy highlights the need to ensure a sustainable use of soils. This requires the prevention of further soil degradation and the preservation of its functions, as well as the restoration of degraded soils. The 2011 Road Map for Resource-Efficient Europe, part of Europe 2020 Strategy provides that by 2020, EU policies take into account their direct and indirect impact on land use in the EU and globally, and the rate of land take is on track with an aim to
51
Bakker, M., Alam, S., van Dijk, J., Rounsevell, M., Spek, T. & van den Brink, A., 2015. The feasibility of implementing an ecological network in The Netherlands under conditions of global change. Landscape Ecology 30(5), pp.791-804
52 Commission Staff Working Document Technical information on Green Infrastructure Accompanying the document Green infrastructure – enhancing Europe's Natural Capital, SWD(2013)155, p. 21
53 PBL Netherlands Environmental Assessment Agency, 2010. Adaptation strategy for climate-proofing biodiversity
54 Green Surge, 2016. Green Infrastructure and Urban Biodiversity for Sustainable Urban Development and the Green Economy, case studies Amsterdam, Utrecht
achieve no net land take by 2050.
SDG 15 requires countries to combat desertification, restore degraded land and soil, including land affected by desertification, drought and floods, and strive to achieve a land-degradation-neutral world by 2020.
Soil is an important resource for life and the economy. It provides key ecosystem services including the provision of food, fibre and biomass for renewable energy, carbon sequestration, water purification and flood regulation, the provision of raw and building material. Soil is a finite and extremely fragile resource and increasingly degrading in the EU. Land taken by urban development and infrastructure is highly unlikely to be reverted to its natural state; it consumes mostly agricultural land and increases fragmentation of habitats. Soil protection is indirectly addressed in existing EU policies in areas such as agriculture, water, waste, chemicals, and prevention of industrial pollution.
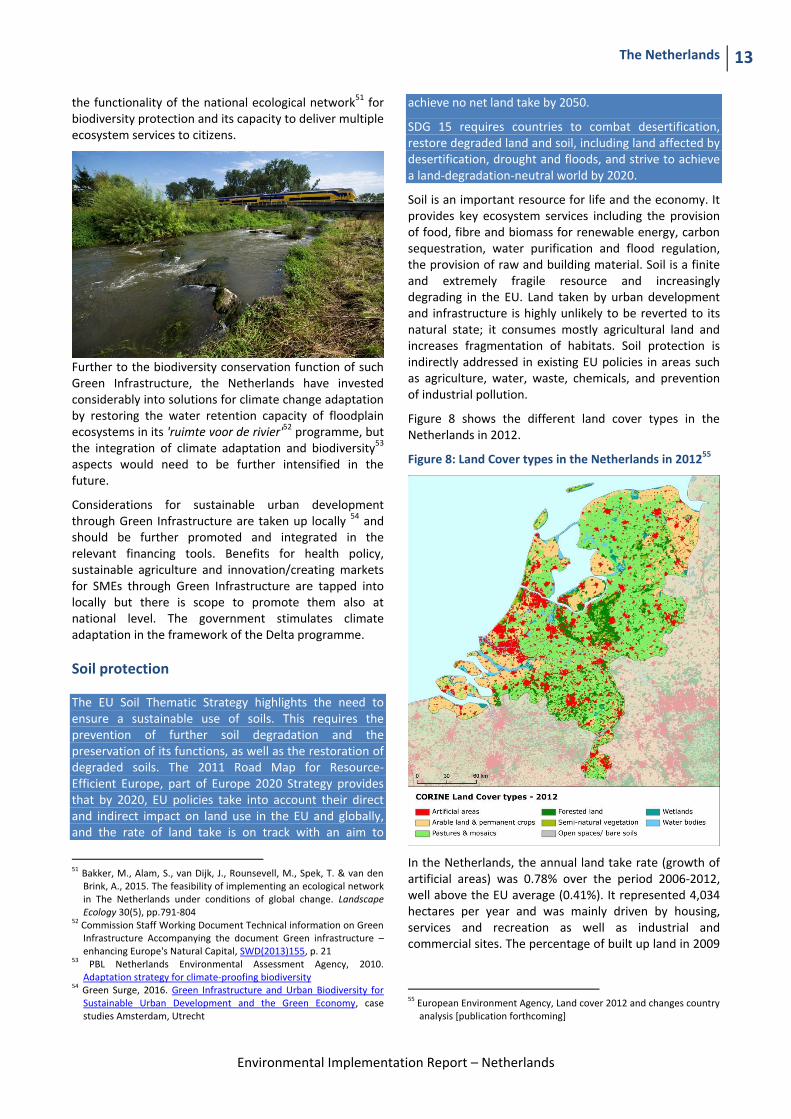
Figure 8 shows the different land cover types in the Netherlands in 2012.
Figure 8: Land Cover types in the Netherlands in 201255
In the Netherlands, the annual land take rate (growth of artificial areas) was 0.78% over the period 2006-2012, well above the EU average (0.41%). It represented 4,034 hectares per year and was mainly driven by housing, services and recreation as well as industrial and commercial sites. The percentage of built up land in 2009
55
European Environment Agency, Land cover 2012 and changes country analysis [publication forthcoming]

The Netherlands 14
Environmental Implementation Report – Netherlands
was 8.22%, well above the EU average (3.23%)56.
The rate of soil erosion by water in 2010 was 0.27 tonnes per ha per year, well below EU-28 average (2.46 tonnes)57.
There are still not EU-wide datasets enabling the provision of benchmark indicators for the decline of organic matter in soil, contaminated sites, pressures on soil biology and diffuse pollution. An updated inventory and assessment of soil protection policy instruments in the Netherlands and other EU Member States is being performed by the EU Expert Group on Soil Protection.
Marine protection
The EU Coastal and Marine Policy and legislation require that by 2020 the impact of pressures on marine waters is reduced to achieve or maintain good environmental status and coastal zones are managed sustainably.
SDG 14 requires countries to conserve and sustainably use the oceans, seas and marine resources for sustainable development.
The Marine Strategy Framework Directive (MSFD)58 aims to achieve Good Environmental Status (GES) of the EU's marine waters by 2020 by providing an ecosystem approach to the management of human activities with impact on the marine environment. The Directive requires Member States to develop and implement a marine strategy for their marine waters, and cooperate with Member States sharing the same marine region or subregion.
As part of their marine strategies, Member States had to make an initial assessment of their marine waters, determine GES59 and establish environmental targets by July 2012. They also had to establish monitoring programmes for the on-going assessment of their marine waters by July 2014. The next element of their marine strategy is to establish a Programme of Measures (2016). The Commission assesses whether these elements constitute an appropriate framework to meet the requirements of the MSFD.
The Dutch marine waters are part of the North-East Atlantic marine region and North Sea sub-region. The Netherlands is party to the Convention for the protection of the marine environment of the North-East Atlantic (OSPAR Convention). The North Sea is one of the busiest
56
European Environment Agency Draft results of CORINE Land Cover (CLC) inventory 2012; mean annual land take 2006-12 as a % of 2006 artificial land.
57 European Environment Agency, 2016. Imperviousness and imperviousness change
58 European Union, Marine Strategy Framework Directive 2008/56/EC
59 The MSFD defines Good Environmental Status (GES) in Article 3 as:
“The environmental status of marine waters where these provide ecologically diverse and dynamic oceans and seas which are clean, healthy and productive”
maritime areas, with exploitation of oil and gas reserves also occurring in parallel to important maritime traffic. Two of the world's largest ports are situated on the Dutch North Sea coast, and the coastal zone is used intensively for recreation. In addition, overfishing and bottom-trawling constitute potential threats to the biodiversity in that region.
In 2012, the Netherlands evaluated the additional government expenditure on the implementation of their marine strategy between 2012 and 2020 to approximately EUR 26 million60, mainly for seabed protection, intensifying the policy on marine litter, addressing gaps in knowledge and monitoring. The Netherlands report that the total expenditure is meanwhile EUR 35 million, contributing to achieving GES.
It is too early to say whether Dutch waters are in good status as there were weaknesses in identifying what GES is in the first place, especially since the Netherlands did not always meet minimum requirements when determining their GES, were unable to provide information about baseline and references and existing EU legislation or international agreements was not always referred to.
The Netherlands established a monitoring programme of their marine waters in 2014. Most of the monitoring programme seems adequate and it is already mostly in place since 2014. However, it seems that for a few selected descriptors (biodiversity, non-indigenous species, hydrographical changes and marine litter), the Dutch monitoring programme may need further refinement and development to monitor progress towards GES for those descriptors. 61
In 2012, Dutch marine protected areas covered 11913.4
60
Report from the Commission "The first phase of implementation of the Marine Strategy Framework Directive (2008/56/EC) - The European Commission's assessment and guidance" COM(2014)097
61 Commission Staff Working Document Accompanying the Commission Report assessing Member States' monitoring programmes under the Marine Strategy Framework Directive (COM(2017)3 and SWD(2017)1 final)

The Netherlands 15
Environmental Implementation Report – Netherlands
square kilometres of its marine waters in the North Sea.62
Suggested action
Continue work to improve the definitions of GES in particular for biodiversity descriptors, including through regional cooperation by using the work of the relevant Regional Sea Convention.
Address knowledge gaps.
Further develop approaches assessing (and quantifying) impacts from the main pressures in order to lead to improved and more conclusive assessment results for 2018 reporting.
Continue to integrate monitoring programmes already existing under other EU legislation and to implement joint monitoring programmes developed at (sub)regional level.
Enhance the comparability and consistency of monitoring methods within the Dutch marine region.
Ensure that the monitoring programme is fully appropriate to monitor progress towards GES.
62
2012 Data provided by the European Environmental Agency – Not published.

The Netherlands 16
Environmental Implementation Report – Netherlands
3. Ensuring citizens' health and quality of life
Air quality
The EU Clean Air Policy and legislation require that air quality in the Union is significantly improved, moving closer to the WHO recommended levels. Air pollution and its impacts on ecosystems and biodiversity should be further reduced with the long-term aim of not exceeding critical loads and levels. This requires strengthening efforts to reach full compliance with Union air quality legislation and defining strategic targets and actions beyond 2020.
The EU has developed a comprehensive suite of air quality legislation63, which establishes health-based standards and objectives for a number of air pollutants. As part of this, Member States are also required to ensure that up-to-date information on ambient
concentrations of different air pollutants is routinely made available to the public. In addition, the National Emission Ceilings Directive provides for emission reductions at national level that should be achieved for main pollutants.
The emission of several air pollutants has decreased significantly in the Netherlands64. Reductions between 1990 and 2014 for sulphur oxides (-85%), nitrogen oxides (-61%), as well as volatile organic compounds (-71%) ensure air emissions for these pollutants are within the currently applicable national emission ceilings65.
63
European Commission, 2016. Air Quality Standards 64
See EIONET Central Data Repository and Air pollutant emissions data viewer (NEC Directive)
65 The current national emission ceilings apply since 2010 (Directive 2001/81/EC); revised ceilings for 2020 and 2030 have been set by
Although significant emission reductions have been recorded also for ammonia (-64%), these are still insufficient efforts to comply with current ceilings, surpassing them by 5%. It should be noted that the exceedance of the ammonia emission ceiling is partly due to the reporting of new sources of ammonia emissions which were not estimated or considered at the time when the emission ceilings were set.
At the same time, air quality in the Netherlands continues to give cause for concern. For the year 2013, the European Environment Agency estimated that about 11,530 premature deaths were attributable to fine particulate matter concentrations66, with an additional 270 to ozone concentration67 and over 1,820 to nitrogen dioxide68. This is due also to exceedances above the EU
air quality standards (see Figure 969,70).
Directive (EU) 2016/2284 on the reduction of national emissions of certain atmospheric pollutants, amending Directive 2003/35/EC and repealing Directive 2001/81/EC.
66 Particulate matter (PM) is a mixture of aerosol particles (solid and liquid) covering a wide range of sizes and chemical compositions. PM10 (PM2.5) refers to particles with a diameter of 10 (2.5) micrometres or less. PM is emitted from many human sources, including combustion.
67 Low level ozone is produced by photochemical action on pollution and it is also a greenhouse gas
68 NOx is emitted during fuel combustion e.g. from industrial facilities and the road transport sector. NOx is a group of gases comprising nitrogen monoxide (NO) and nitrogen dioxide (NO2).
69 European Environment Agency, 2016. Air Quality in Europe – 2016 Report. (Table 10.2, please see details in this report as regards the underpinning methodology)
Figure 9: Attainment situation for PM10, NO2 and O3 in 2014

The Netherlands 17
Environmental Implementation Report – Netherlands
For 2014, exceedances above the EU air quality standards have been registered related to concentration of nitrogen dioxide in two air quality zones (Amsterdam/Haarlem, and Rotterdam/Dordrecht – both of which were covered by a time extension and will only need to show compliance from 2015 onwards) and related to concentration of particulate matter in one air quality zone (in air quality zone 'South'). Furthermore, the long-term objectives regarding ozone concentrations are not being met in nine air quality zones71.
There are indications that the health-related external costs from air pollution in the Netherlands are above EUR 13 billion/year (income adjusted, 2010), which include not only the intrinsic value of living a full health life but also direct costs to the economy. These direct economic costs relate to 4 million workdays lost each year due to sickness related to air pollution, with associated costs for employers of EUR 584 million/year (income adjusted, 2010), for healthcare of above EUR 45.3 million/year (income adjusted, 2010), and for agriculture (crop losses) of EUR 22 million/year (2010)72.
Finally, peak hour congestion constitutes a problem in the Netherlands, both inside the agglomerations and on essential interurban links. The three largest cities Rotterdam, Amsterdam and The Hague are among the 12 worst performing urban areas in the EU73. Overall, the Netherlands is the second worst in the EU with regard to the economic costs caused by traffic congestion, which causes high levels of air pollution.
There is scope to use economic instruments and/or other measures stimulating a shift from diesel to gasoline or other alternative transport fuels (less particulate matter and nitrogen oxides), reducing kilometres driven, and improve public transport in order to reduce nitrogen dioxide emissions from traffic that result in health effects particularly near busy roads, which is a particularly pressing issue for the Netherlands.
Suggested action
Maintain downward emissions trends of air pollutants in order to achieve full compliance with currently applicable national emission ceilings and air quality limit values - and reduce adverse air pollution impacts on health, environment and economy.
Reduce ammonia (NH3) emissions to comply with currently applicable national emission ceilings, for example by introducing or expanding the use of low-emission agricultural techniques.
70
Based on European Environment Agency, 2016. Air Quality in Europe – 2016 Report.. (Figures 4.1, 5.1 and 6.1)
71 See The EEA/Eionet Air Quality Portal and the related Central Data Repository
72 These figures are based on the Impact Assessment for the European Commission Integrated Clean Air Package (2013)
73 INRIX, 2015. Key Findings: INRIX 2015 Traffic Scoreboard
Reduce nitrogen oxide (NOx) emissions to comply with currently applicable national emission ceilings and/or to reduce nitrogen dioxide (NO2) (and ozone concentrations), inter alia, by reducing transport related emissions - in particular in urban areas.
Noise
The Environmental Noise Directive provides for a common approach for the avoidance, prevention and reduction of harmful effects due to exposure to environmental noise.
Excessive noise is one of the main causes of health issues74. To alleviate this, the EU acquis sets out several requirements, including assessing the exposure to environmental noise through noise mapping, ensuring that information on environmental noise and its effects is made available to the public, and adopting action plans with a view to preventing and reducing environmental noise where necessary and to preserving the acoustic environment quality where it is good.
The Dutch implementation of the Environmental Noise Directive75 is slightly delayed. For the most recent reporting round, for the reference year 2011, the Dutch authorities have fulfilled all their obligations regarding the noise mapping of major agglomerations, major airports, major roads and major railways. With regard to action plans for noise management in the current period, they have been adopted for all major airports and major railways. However, action plans are still missing for some agglomeration sections and for some major roads.
Water quality and management
The EU water policy and legislation require that the impact of pressures on transitional, coastal and fresh waters (including surface and ground waters) is significantly reduced to achieve, maintain or enhance good status of water bodies, as defined by the Water Framework Directive; that citizens throughout the Union benefit from high standards for safe drinking and bathing water; and that the nutrient cycle (nitrogen and phosphorus) is managed in a more sustainable and resource-efficient way.
SDG 6 encourages countries to ensure availability and sustainable management of water and sanitation for all.
The main overall objective of EU water policy and
74
WHO/JRC, 2011, Burden of disease from environmental noise, Fritschi, L., Brown, A.L., Kim, R., Schwela, D., Kephalopoulos, S. (eds), World Health Organization, Regional Office for Europe, Copenhagen, Denmark
75 The Noise Directive requires Member States to prepare and publish, every 5 years, noise maps and noise management action plans for agglomerations with more than 100,000 inhabitants, and for major roads, railways and airports.

The Netherlands 18
Environmental Implementation Report – Netherlands
legislation is to ensure access to good quality water in sufficient quantity for all Europeans. The EU water acquis76 seeks to ensure good status of all water bodies across Europe by addressing pollution sources (from e.g. agriculture, urban areas and industrial activities), physical and hydrological modifications to water bodies) and the management of risks of flooding.
River Basin Management Plans (RBMPs) are a requirement of the Water Framework Directive and a means of achieving the protection, improvement and sustainable use of the water environment across Europe. This includes surface freshwaters such as lakes and rivers, groundwater, estuaries and coastal waters up to one nautical mile.
The Netherlands has provided information to the Commission from its second generation of RBMPs77. However, as the Commission has not yet been able to validate this information for all Member States, it is not reported here.
Water management in the Netherlands is generally good78. All eleven directives are reported to be implemented nationwide across all four River Basin Districts (RBDs) in the Netherlands. Most basic measures were implemented in 2009 already, and further progress has been made by 2012. There is good process in implementation and making measures operational. However, the Netherlands postponed the achievement of the objectives under the WFD to 2027 (86% of water bodies are subject to time exemptions).
The four first generation RBMPs covering the Dutch territory were updated by the end of 2015, based among others on the Commission's analysis79.
In its first generation of RBMPs the Netherlands reported the status of 254 rivers, 450 lakes, 5 transitional, 15 coastal and 23 groundwater bodies80. None of these
76
This includes the Bathing Waters Directive (2006/7/EC); the Urban Waste Water Treatment Directive (91/271/EEC) concerning discharges of municipal and some industrial waste waters; the Drinking Water Directive (98/83/EC) concerning potable water quality; the Water Framework Directive (2000/60/EC) concerning water resources management; the Nitrates Directive (91/676/EEC) and the Floods Directive (2007/60/EC)
77 The Netherlands have indicated that the status of most of their water bodies have improved in the meantime, documented in the 2
nd
RBMPs submitted in December 2015, which are currently being assessed by the Commission.
78 More information on the implementation status and more specific recommendations can be found at European Commission, Water Framework Directive Implementation Reports
79 Commission Staff Working Document Accompanying the Report on the Implementation of the Water Framework Directive River Basin Management Plans COM(2012)670 final; European Commission, Assessment of Member States’ progress in the implementation of Programmes of Measures during the first planning cycle of the Water Framework Directive Member State Report: Netherlands (NL) and recommendations from the bilateral meeting between the NL and the Commission that took place on 4
th June 2013.
80 For groundwater, a precautionary approach has been taken that
natural surface water bodies achieved at that time good or high ecological status81 (while the status of 28% was unknown) and less than 1% of heavily modified or artificial water bodies82 achieved a good or high ecological potential. Only 28% of surface water bodies, 71% of heavily modified and artificial water bodies and 61% of groundwater bodies achieved good chemical status83. 100% of groundwater bodies were in good quantitative status. 18% of the 112 supplementary measures were reported to be delayed because of funding/finance obstacles. Other reasons are legislation barriers (5%) and lack of land/acquisition (4%).
According to the RBMPs, the level of cost recovery for water services is between 95-100%. Financing of water management in the Netherlands is based on the "polluters pays principle" and "the user pays principle".
The Dutch RBMPs are well developed but the Programmes of Measures are still insufficient to close the implementation gap in particular as regards the agricultural pollution and a high number of exemptions is used. The planned measures are expected to improve the ecological status of natural water bodies by 28% and the ecological potential of heavily modified and artificial bodies by 12%84.
Overall it should be acknowledged that surface water quality has improved considerably both chemically (nutrients, pesticides) and ecologically. However almost all (99%) of the water bodies are still subject to significant pressures. In all the four RBDs the basic measures were not enough to meet the Water Framework Directive objectives of ecological quality of surface waters in rivers and lakes. Roughly half of rivers, drainage ditches and lakes have too high concentrations of nitrogen and phosphates as a result of over-fertilization in agricultural areas85.
The main pressure on the Dutch surface waters is diffuse pollution86 that affects 90% of water bodies followed by river management that affects 73% and by flow regulation and morphological alterations and other
comprises a prohibition on direct discharges to groundwater, and a requirement to monitor groundwater bodies.
81 Good ecological status is defined in the Water Framework Directive referring to the quality of the biological community, the hydrological characteristics and the chemical characteristics.
82 Many European river basins and waters have been altered by human activities, such as land drainage, flood protection and building of dams to create reservoirs.
83 Good chemical status is defined in the Water Framework Directive referring to compliance with all the quality standards established for chemical substances at European level.
84 More information on the implementation status and more specific recommendations can be found at European Commission, Water Framework Directive Implementation Reports
85 European Environment Agency, 2015. State of the Environment Report 2015 – Country briefing The Netherlands.
86 Diffuse pollution comes from widespread activities with no one discrete source, e.g. acid rain, pesticides, urban run-off, etc.
The Netherlands 19
Environmental Implementation Report – Netherlands
alterations that affect 58% and 69% of water bodies. Point sources of pollution and abstractions are also significant pressures that affect 30% and 17% of water bodies respectively.
Water quality remains of high concern due to pollution by nitrates (resulting from effluents of intensive live-stock rearing and dairy farming87). Moreover, eutrophication is a widespread phenomenon. The Netherlands applies an Action Programme implementing the Nitrates Directive to the whole territory. A derogation concerning nitrogen originating from livestock manure has been granted to the Netherlands in connection to the Action Programme, on the basis of scientific evidence and on a number of conditions, including phosphate production not exceeding the 2002 level (172.9 million kg).
The significant intensification of livestock farming activities due to the end of the milk quota system has resulted in a sharp increase in the cattle sector representing an additional challenge to the management of nutrients in the country. This has brought the phosphate levels beyond the above limits, thus posing additional concerns on the water quality objectives and prompting the Commission to open an investigation. In view of the surplus of livestock effluents the Netherlands is strongly engaged in innovative manure processing techniques. These techniques are improving the efficiency of nutrient use and management of the surplus, even if the Netherlands recognise that progress continues to be necessary to achieve the same features as conventional fertilisers88.
The Commission is closely following how the
87
The Netherlands are the biggest manure producers per land area in the EU.
88 Reports from research institutions are available on the subject. For instance, information on variability in term of Nitrogen Fertiliser Replacement Value of mineral concentrate (a Dutch processed product) can be found in: Velthof, G.L., 2015. Mineral concentrate from processed manure as fertiliser. Wageningen, Alterra Wageningen UR (University & Research centre), Alterra report 2650. 36 pp.; 5 fig.; 8 tab.; 54 ref.
implementation of both the Nitrates and the Water Framework Directives in the Netherlands will contribute to ensure that the Netherlands achieves the water quality objectives in EU legislation.
The Netherlands shows very high compliance rates for drinking water quality89 and urban waste water treatment, so there are no particular issues of implementation. It is important to note that investments in wastewater infrastructure by Netherlands however remain high (around EUR 1300 Million/year), compared to other Member States, not only to maintain but also to improve the basic implementation needs of the urban waste water treatment Directive.
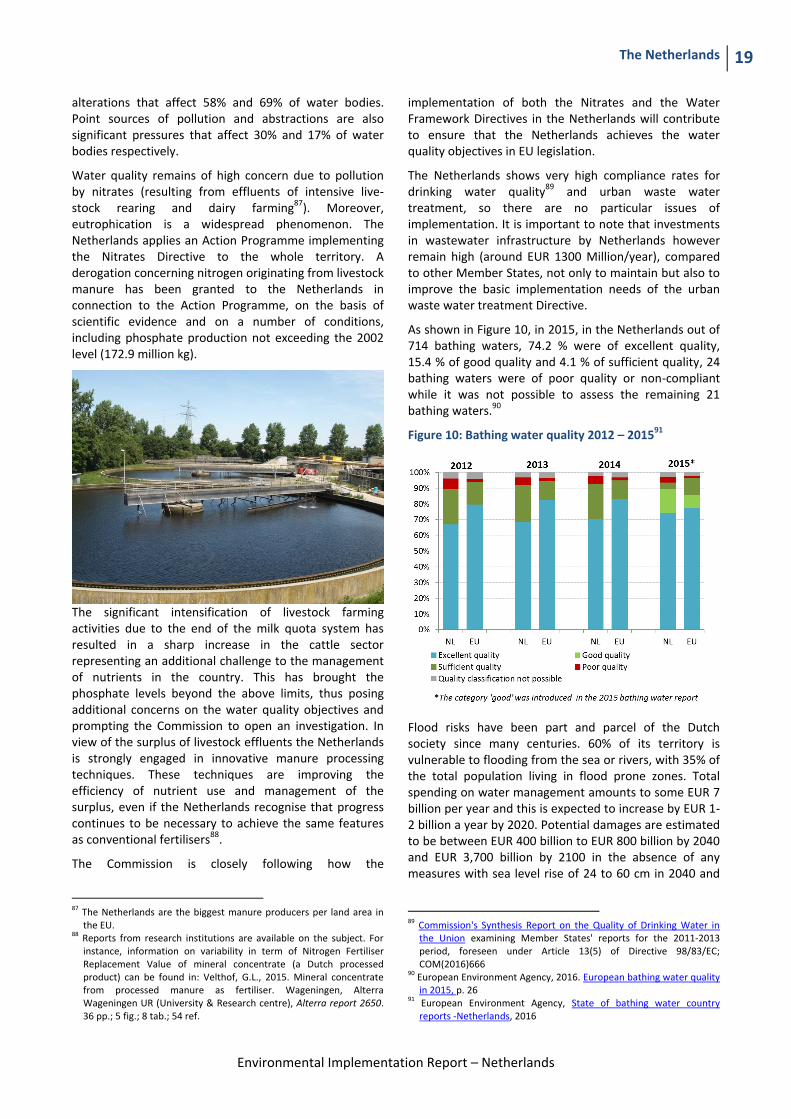
As shown in Figure 10, in 2015, in the Netherlands out of 714 bathing waters, 74.2 % were of excellent quality, 15.4 % of good quality and 4.1 % of sufficient quality, 24 bathing waters were of poor quality or non-compliant while it was not possible to assess the remaining 21 bathing waters.90
Figure 10: Bathing water quality 2012 – 201591
Flood risks have been part and parcel of the Dutch society since many centuries. 60% of its territory is vulnerable to flooding from the sea or rivers, with 35% of the total population living in flood prone zones. Total spending on water management amounts to some EUR 7 billion per year and this is expected to increase by EUR 1-2 billion a year by 2020. Potential damages are estimated to be between EUR 400 billion to EUR 800 billion by 2040 and EUR 3,700 billion by 2100 in the absence of any measures with sea level rise of 24 to 60 cm in 2040 and
89
Commission's Synthesis Report on the Quality of Drinking Water in the Union examining Member States' reports for the 2011-2013 period, foreseen under Article 13(5) of Directive 98/83/EC; COM(2016)666
90 European Environment Agency, 2016. European bathing water quality in 2015, p. 26
91 European Environment Agency, State of bathing water country reports -Netherlands, 2016

The Netherlands 20
Environmental Implementation Report – Netherlands
150cm in 2100.92
A Delta Fund and Programme (fed with EUR 1 billion per year) has been established to ensure flood protection and freshwater supply in the long-term future. Drawing on the expertise and resources of government, local water authorities, universities and private industry, some aspects of the project could serve as a model for other countries and regions facing similar challenges.93
The Dutch government has introduced new standards for primary defences in 2015. All primary floods defences will have to meet these standards by 2017.
Suggested action94
The Netherlands should identify the implementation gap and design Programmes of Measures to close the gap in particular effective basic and supplementary measures for nutrients pollution and substance specific measures for chemical pollutions are necessary.
The Netherlands should maintain their effort to reduce the number of exemptions.
Ensure that water pollution, inter alia by agriculture, is effectively addressed both under the Nitrates and the Water Framework Directive – to ensure that good status objectives can be reached.
Enhancing the sustainability of cities
The EU Policy on the urban environment encourages cities to implement policies for sustainable urban planning and design, including innovative approaches for urban public transport and mobility, sustainable buildings, energy efficiency and urban biodiversity conservation.
SDG11 aims at making cities and human settlements inclusive, safe, resilient and sustainable.
Europe is a Union of cities and towns; around 75% of the EU population are living in urban areas.95 The urban environment poses particular challenges for the environment and human health, whilst also providing opportunities and efficiency gains in the use of resources.
The Member States, European institutions, cities and stakeholders have prepared a new Urban Agenda for the EU (incorporating the Smart Cities initiative) to tackle these issues in a comprehensive way, including their
92
RPA, 2014. Study on Economic and Social Benefits of Environmental Protection and Resource Efficiency Related to the European Semester. Study for the European Commission, Annex 1: Country fiches
93 RPA, 2014. Study on Economic and Social Benefits of Environmental Protection and Resource Efficiency Related to the European Semester. Study for the European Commission, Annex 1: Country fiches
94 The full set of recommendations in relation to the Water Framework Directive are here.
95 European Environment Agency, Urban environment
connections with social and economic challenges. At the heart of this Urban Agenda will be the development of twelve partnerships on the identified urban challenges, including air quality and housing96.
The European Commission will launch a new EU benchmark system in 201797.
The EU stimulates green cities through awards and funding, such as the EU Green Capital Award aimed at cities with more than 100,000 inhabitants and the EU Green Leaf initiative aimed at cities and towns, with between 20,000 and 100,000 inhabitants. Amsterdam, s-Hertogenbosch and Nijmegen have been among the finalists of the European Green Capital Award, and Nijmegen is the winner of the 2018 Green Capital Award.
Among the main challenges observed in this report (water, air, nature and biodiversity), it is especially air quality – to an extent related to traffic congestion – that requires a priority at the local level. Innovative solutions as regards traffic management are being developed and tested in a number of cities but coherence between national and municipal policies may be improved. Some municipalities (Utrecht, Rotterdam) develop zones with restricted access to old polluting vehicles while the national government refuses to support this with official traffic signs. Similarly, national climate policy subsidizes wood burning while cities try to reduce wood burning to improve local air quality.
The Netherlands have allocated EUR 45 million or 9% of its allocation under the European Regional Development Fund (ERDF) excluding technical assistance to sustainable urban development.
96
http://urbanagendaforthe.eu/
97 The Commission is developing an Urban Benchmarking and
Monitoring ('UBaM') tool to be launched in 2017. Best practices emerge and these will be better disseminated via the app featuring the UBaM tool, and increasingly via e.g. EUROCITIES, ICLEI, CEMR, Committee of the Regions, Covenant of Mayors and others.

The Netherlands 21
Environmental Implementation Report – Netherlands
International agreements
The EU Treaties require that the Union policy on the environment promotes measures at the international level to deal with regional or worldwide environmental problems.
Most environmental problems have a transboundary nature and often a global scope and they can only be addressed effectively through international co-operation. International environmental agreements concluded by the Union are binding upon the institutions of the Union and on its Member States. This requires the EU and the Member States to sign, ratify and effectively implement all relevant multilateral environmental agreements (MEAs) in a timely manner. This will also be an important contribution towards the achievement of the SDGs, which Member States committed to in 2015 and include many commitments contained already in legally binding agreements.
The fact that some Member States did not sign and/or ratify a number of MEAs compromises environmental implementation, including within the Union, as well as the Union’s credibility in related negotiations and international meetings where supporting the participation of third countries to such agreements is an established EU policy objective. In agreements where voting takes place it has a direct impact on the number of votes to be cast by the EU.
The Netherlands are performing as one of the best in the EU with regard to signing and ratifying such agreements.

The Netherlands 22
Environmental Implementation Report – Netherlands
Part II: Enabling Framework: Implementation Tools
4. Market based instruments and investment
Green taxation and environmentally harmful subsidies
The Circular Economy Action Plan encourages the use of financial incentives and economic instruments, such as taxation to ensure that product prices better reflect environmental costs. The phasing out of environmentally harmful subsidies without delay is highlighted and monitored through the annual (European Semester) National Reform Programmes.
Taxing pollution and resource use can generate increased revenue and bring important social and environmental benefits.
In 2014 environmental tax revenues accounted for 8.96% of total revenues from taxes and social-security contributions (EU 28 average: 6.35%). Figure 11 shows that the Netherlands belong to the top 25% of the Member States as regards tax revenue percentage derived from environmental taxes.
Shifting taxation away from labour towards taxes less harmful to growth is a key challenge in the Netherlands. With 57.5% the tax burden on labour is the 2nd highest in the EU (2012) and this is a strong disincentive for creating employment.
A 2016 study98 suggests that there is considerable potential for shifting taxes from labour to environmental taxes in the Netherlands. Under a good practice scenario99, these taxes could generate an additional EUR 4.27 billion in 2018, rising to EUR 7.54 billion in 2030 (both in real 2015 terms). This is equivalent to 0.59% and 0.86% of GDP in 2018 and 2030, respectively.
The OECD states that there is scope to improve the design of several environmentally related taxes, including energy taxes, to enhance both their environmental effectiveness and cost100. A recent study commissioned
98
Eunomia Research and Consulting, IEEP, Aarhus University, ENT, 2016. Study on Assessing the Environmental Fiscal Reform Potential for the EU28. N.B. National governments are responsible for setting tax rates within the EU Single Market rules and this report is not suggesting concrete changes as to the level of environmental taxation. It merely presents the findings of the 2016 study by Eunomia et al on the potential benefits various environmental taxes could bring. It is then for the national authorities to assess this study and their concrete impacts in the national context. A first step in this respect, already done by a number of Member States, is to set up expert groups to assess these and make specific proposals.
99 The good practice scenario means benchmarking to a successful taxation practice in another Member State. 100 OECD, 2015. OECD Environmental Performance Reviews: The
Netherlands 2015, OECD Publishing.
by the European Commission confirms this.101
The reduction of environmentally harmful subsidies (EHS) is another key challenge. The Netherlands has a diesel-petrol differential of 63%102. It has been estimated that in the Netherlands, company car taxation subsidies result in an annual revenue loss of around EUR 750 million103.
Figure 11: Environmental tax revenues as a share of total revenues from taxes and social contributions (excluding imputed social contributions) in 2014104
Other environmentally harmful subsidies relate to energy and agriculture, the latter in particular because of the very intensive livestock sector in the Netherlands, leading
101 Eunomia Research and Consulting, IIEP, Aarhus University,
ENT, 2016. Study on Assessing the Environmental Fiscal Reform Potential for the EU28
102 Update by European Commission, 2015 based on Harding M., 2014. The Diesel Differential: Differences in the Tax Treatment of Gasoline and Diesel for Road Use. OECD Taxation Working Papers, No. 21
103 Harding M. 2014. Personal Tax Treatment of Company Cars and Commuting Expenses – Estimating the Fiscal and Environmental Costs. OECD Taxation Working Papers, No. 20
104 Eurostat, Environmental tax revenues, accessed October 2016
The Netherlands 23
Environmental Implementation Report – Netherlands
to nutrient run-off 105.
Green Public Procurement
The EU green public procurement policies encourage Member States to take further steps to reach the target of applying green procurement criteria to at least 50% of public tenders. Green Public Procurement (GPP) is a process whereby public authorities seek to procure goods, services and works with a reduced environmental impact throughout their life-cycle when compared to goods, services and works with the same primary function that would otherwise be procured.
The purchasing power of public procurement equals to approximately 14% of GDP106. A substantial part of this money is spent on sectors with a high environmental impact such as construction or transport, so GPP can help to significantly lower the impact of public spending and foster sustainable innovative businesses.
The Netherlands is one of the frontrunners in the EU with regard to GPP, already exceeding the Commission's recommendations107 for 2009/2010 public contracts.
Recently, more than 40 GPP criteria108 were published in order to share the Dutch experience at EU level. This good practice has been recognised as very effective for sharing information among Member States and towards GPP harmonisation in the EU.
The Netherlands has achieved a high level of professionalization of their procurement processes and are concentrating the competence for public purchasing in a small number of clusters, which is a very promising approach. The Netherlands is also forerunner in the field of circular procurement where it is running a couple of pilot projects. On 20-22 April 2016, the Netherlands organised, together with the Commission, a Circular Procurement conference which allowed public procurers from all over Europe (and beyond) to share experience and learn from the Dutch approaches in this area.
The Commission would welcome a continuation of the sharing of good practice on Circular Procurement by the Netherlands with the other countries.
105 OECD, 2015. OECD Environmental Performance Reviews: The
Netherlands 2015, OECD Publishing.p. 30-31. 106
European Commission, 2015. Public procurement 107
In the Communication “Public procurement for a better environment” (COM (2008)400) the Commission recommended the creation of a process for setting common GPP criteria. The basic concept of GPP relies on having clear, verifiable, justifiable and ambitious environmental criteria for products and services, based on a life-cycle approach and scientific evidence base.
108 Pianoo, 2016. Environmental criteria for sustainable public procurement
Investments: the contribution of EU funds
European Structural and Investment Funds Regulations provide that Member States promote environment and climate objectives in their funding strategies and programmes for economic, social and territorial cohesion, rural development and maritime policy, and reinforce the capacity of implementing bodies to deliver cost-effective and sustainable investments in these areas.
Making good use of the European Structural and Investment Funds (ESIF)109 is essential to achieve the environmental goals and integrate these into other policy areas. Other instruments such as the Horizon 2020, the LIFE programme and European Fund for Strategic Investment110 (EFSI) may also support implementation and spread off best practice.
For the Netherlands, the total budget for the European Regional Development Fund (ERDF) and the European Social Fund (ESF) 2014-2020 is fairly small: EUR 1.014 million, of which 50% is for the ESF, and the ERDF has a strong focus on innovation. There are four ERDF operational programmes (OPs) and one ESF OP.
With regard to the estimation of environmental expenditure, the ERDF allocation for low carbon economy is EUR 121 million. No expenditure is foreseen for climate adaptation, environment and sustainable transport, but environmental topics will play a role under innovation and low carbon economy. Around 9% of the ERDF budget will be used for sustainable urban development, concentrated in one of the OPs (West). The OP ESF (total EUR 30 million) includes skills training for green jobs. In particular the ERDF-funded international cooperation programmes provide ample opportunities for environment-related projects.
It is too early to draw conclusions as regards the use and results of the ERDF for the period 2014-2020, as the relevant programmes are still in an early stage of their implementation.
Current data suggest that the EU funds for the 2007-2013 period were almost fully spent.111
109
ESIF comprises five funds – the European Regional Development Funds (ERDF), the Cohesion Fund (CF), the European Social Fund (ESF), the European Agricultural Fund for Rural Development (EAFRD), and the European Maritime and Fisheries Fund (EMFF). The ERDF, the CF and the ESF together form the Cohesion Policy funds.
110 EIB: European Fund for Strategic Investments
111 Final data for the period 2007-2013 will only be available at the end of 2017.

The Netherlands 24
Environmental Implementation Report – Netherlands
Figure 12: European Structural and Investment Funds 2014-2020: Budget Netherlands by theme, EUR billion112
With regard to the integration of environmental concerns into the Common Agricultural Policy (CAP), the two key areas for the Netherlands (as for all Member States) are, first, using EU rural development fund (EAFRD) to pay for environmental land management and other environmental measures, while avoiding financing measures which could damage the environment; and secondly, ensuring an effective implementation of the first pillar of the CAP with regard to cross compliance and 1st pillar 'greening'
The approved National Rural Development Program (RDP) under the EAFRD amounts overall to EUR 614 million. The planned spending on the ecosystem priority is EUR 358 million, which represents 58.3% of the total budget, with EUR 238 million and 38.7% of the total budget dedicated to agri-environment measures. The agri-environment measure can potentially play a very good role in reversing the biodiversity decline in the country in some targeted areas. However, in the absence of an ambitious baseline and ambitious greening, the contribution of the RDP to improve the environment in most of the agricultural area of the Netherlands is likely to be limited.
The Direct Payment envelope of the Netherlands for the period 2015-2020 is EUR 3,624 billion, according to Commission delegated regulation (EU) No 994/2014 of 13 May 2014, 30 % of which EUR 1,087 billion are being allocated to greening practices beneficial for the environment. An environmentally ambitious implementation of 1st pillar greening would clearly help to improve the environmental situation in areas not covered by rural development, and if appropriate the Netherlands could review its implementation of this.
112
European Commission, European Structural and Investment Funds Data By Country

The Netherlands 25
Environmental Implementation Report – Netherlands
5. Effective governance and knowledge
SDG 16 aims at providing access to justice and building effective, accountable and inclusive institutions at all levels. SDG 17 aims at better implementation, improving policy coordination and policy coherence, stimulating science, technology and innovation, establishing partnerships and developing measurements of progress.
Effective governance of EU environmental legislation and policies requires having an appropriate institutional framework, policy coherence and coordination, applying legal and non-legal instruments, engaging with non-governmental stakeholders, and having adequate levels of knowledge and skills113. Successful implementation depends, to a large extent, on central, regional and local government fulfilling key legislative and administrative tasks, notably adoption of sound implementing legislation, co-ordinated action to meet environmental objectives and correct decision-making on matters such as industrial permits. Beyond fulfilment of these tasks, government must intervene to ensure day-to-day compliance by economic operators, utilities and individuals ("compliance assurance"). Civil society also has a role to play, including through legal action. To underpin the roles of all actors, it is crucial to collect and share knowledge and evidence on the state of the environment and on environmental pressures, drivers and impacts.
Equally, effective governance of EU environmental legislation and policies benefits from a dialogue within Member States and between Member States and the Commission on whether the current EU environmental legislation is fit for purpose. Legislation can only be properly implemented when it takes into account experiences at Member State level with putting EU commitments into effect. The Make it Work initiative, a Member State driven project, established in 2014, organizes a discussion on how the clarity, coherence and structure of EU environmental legislation can be improved without lowering existing protection standards.
Effective governance within central, regional and local government
Those involved in implementing environment legislation at Union, national, regional and local levels need to be equipped with the knowledge, tools and capacity to improve the delivery of benefits from that legislation, and the governance of the enforcement process.
113
The Commission has work ongoing to improve the country-specific knowledge about quality and functioning of the administrative systems of Member States.
Capacity to implement rules
It is crucial that central, regional and local administrations have the necessary capacities and skills and training to carry out their own tasks and co-operate and co-ordinate effectively with each other, within a system of multi-level governance.
The Netherlands have three territorial tiers of government: the central government, the 12 provincial authorities, and 393 municipal authorities. The decentralised authorities are autonomous (having their own rules and regulations). However, 90% of the work of municipalities consists of co-administrative tasks: implementing national rules and policies114. They are responsible for implementing the main part of the comprehensive Environmental Management Act. In addition, the regional Water boards and the regional units of Rijkswaterstaat play an important role in environmental governance. They have specific tasks regarding permitting, inspection and enforcement of water issues.
Overall, the Netherlands has an adequate to excellent capacity of their administrations in place to fulfil its environmental obligations. Moreover, there is a longstanding tradition to involve all relevant stakeholders in early stages of policy-making already and where appropriate, in implementation.
In the Netherlands, legislative competences are mainly with the central government, and the Parliament, Provinces and local authorities bear most of the responsibilities for the application and enforcement of environmental legislation. Local authorities, like in most Member States, have the responsibility for e.g. waste management. These tasks are in many cases undertaken by private entities, with an overseeing role for local governments. The implementation of environmental regulation e.g. permitting, inspection and enforcement
114
Ministry of the Interior and Kingdom Relations, 2016. The Dutch Public Service, p.13.
The Netherlands 26
Environmental Implementation Report – Netherlands
are also done at the national and municipal level. Most of the SMEs fall under the environmental jurisdiction of municipalities.
In 2014, to address some major deficiencies that had emerged in policy implementation, the Netherlands established 29 Environmental Services to consolidate and reinforce expertise in environmental licensing and enforcement115.
Over the years, the Netherlands has integrated and simplified its environmental legal instruments and the division of responsibilities across the three layers of government. According to the OECD, impressive progress in streamlining included a major legislative overhaul to consolidate all of the national environmental legislation into the Environment and Planning Act (Omgevingswet).
While the process of simplifying national permitting procedures by integrating existing legislations in one overarching Act on environment and land use is to be welcomed, it must be secured that all existing EU obligations (procedural and substantial) are complied with. With the 'Make it Work' initiative the Netherlands have argued that national streamlining can also be assisted by streamlining at EU level116.
The OECD117 warned that the decentralisation of tasks has not necessarily been accompanied by additional resources. As a result, sub-national governments may struggle with the necessary financial, managerial, human and technical capacity to manage their new functions, which may lead to inconsistent policy implementation.
The transposition of EU Directives by the Netherlands is generally timely. Conformity checking identifies normally only minor issues. This reflects the generally very serious approach to protection of human health and the environment, despite the intensively competing interests. The number of infringements procedures and complaints/petitions against the Netherlands in relation to environmental legislation is very low, due to a culture of genuine constructive discussion before the adoption of new polices and also because of a well-functioning national legal system. However, the high density of population, the pressure on the environment by traffic, agriculture and industry narrow down the margins for new policies. Traffic (air quality) and agriculture (nitrates pollution) are particularly difficult to tackle and repeatedly lead to seeking flexibility within the existing EU legal framework.
In some of the environmental cases where individuals or NGOs have gained access before the national courts over the past years, the Dutch judges referred several
115
OECD, 2015. OECD Environmental Performance Reviews: The Netherlands 2015, OECD Publishing
116 http://www.ieep.eu/work-areas/environmental-governance/better-regulation/make-it-work
117 idem
requests for preliminary rulings to the Court of Justice of the EU. This represented a valuable contribution to the development of EU environment law, since preliminary rulings enable the Court of Justice to give a coherent interpretation of the EU law.
Indeed, the Netherlands can support other Member States with know-how based on lessons learned on multi-level governance for the environment.
Coordination and integration
The Netherlands has a long tradition of comprehensive national environmental plans (NEPs), which have served as a good practice for other countries. However, since the 4th NEP (2001), no new overall plan was adopted. This, in addition to the fact that no comprehensive sustainable development strategy exists, might be responsible for a certain fragmentation which has resulted in a plethora of action plans, programmes, and voluntary agreements. Moreover, the OECD states in its 2015 Environmental Performance Review of the Netherlands, that as a result, short-term actions may not have been the most effective in light of longer-term aims.
It should be welcomed that the Government has announced a modernisation of its environmental policy118, focusing among other on emerging risks and emphasising more active international co-operation and continued efforts to streamline environmental legislation and regulations. It also advocates a new role for the government as a facilitator of “new coalitions” to tap into the energy of civil society and the private sector. The OECD has suggested that there are limits to this approach and that such covenants should be used in a more selective manner by only using them where “win-win” solutions can lead to expected policy outcomes without reliance on regulatory sanctions119.
All 12 Dutch provinces work together in the European ENCORE network of regional environment ministers. The provinces are also responsible for setting the priorities for the ESIF Funds in their Operational Programmes. Provinces set conditions for local action.
Impact assessments are important tools to ensure environmental integration in all government policies120. As regards Strategic Environmental Assessments (SEA) for plans and programmes, and Environmental Impact Assessments (EIA) for projects, the Netherlands has a
118
Memorandum to the House of Representatives from the State Secretary for the Environment
(Government of the Netherlands, 2014). 119
OECD, 2015. OECD Environmental Performance Reviews: The Netherlands 2015, OECD Publishing
120 Article 11 of the TFEU provides that "Environmental protection requirements must be integrated into the definition and implementation of the Union's policies and activities, in particular with a view to promoting sustainable development."
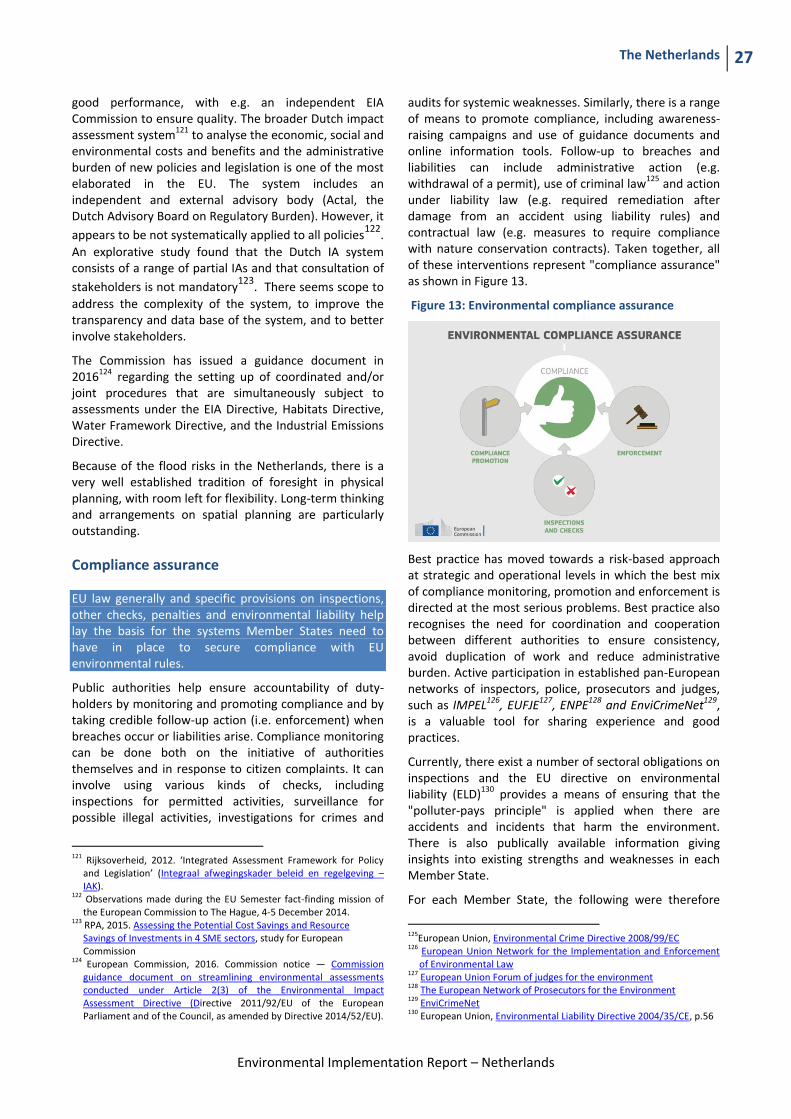
The Netherlands 27
Environmental Implementation Report – Netherlands
good performance, with e.g. an independent EIA Commission to ensure quality. The broader Dutch impact assessment system121 to analyse the economic, social and environmental costs and benefits and the administrative burden of new policies and legislation is one of the most elaborated in the EU. The system includes an independent and external advisory body (Actal, the Dutch Advisory Board on Regulatory Burden). However, it
appears to be not systematically applied to all policies122
.
An explorative study found that the Dutch IA system consists of a range of partial IAs and that consultation of
stakeholders is not mandatory123
. There seems scope to
address the complexity of the system, to improve the transparency and data base of the system, and to better involve stakeholders.
The Commission has issued a guidance document in 2016124 regarding the setting up of coordinated and/or joint procedures that are simultaneously subject to assessments under the EIA Directive, Habitats Directive, Water Framework Directive, and the Industrial Emissions Directive.
Because of the flood risks in the Netherlands, there is a very well established tradition of foresight in physical planning, with room left for flexibility. Long-term thinking and arrangements on spatial planning are particularly outstanding.
Compliance assurance
EU law generally and specific provisions on inspections, other checks, penalties and environmental liability help lay the basis for the systems Member States need to have in place to secure compliance with EU environmental rules.
Public authorities help ensure accountability of duty-holders by monitoring and promoting compliance and by taking credible follow-up action (i.e. enforcement) when breaches occur or liabilities arise. Compliance monitoring can be done both on the initiative of authorities themselves and in response to citizen complaints. It can involve using various kinds of checks, including inspections for permitted activities, surveillance for possible illegal activities, investigations for crimes and
121
Rijksoverheid, 2012. ‘Integrated Assessment Framework for Policy and Legislation’ (Integraal afwegingskader beleid en regelgeving – IAK).
122 Observations made during the EU Semester fact-finding mission of the European Commission to The Hague, 4-5 December 2014.
123 RPA, 2015. Assessing the Potential Cost Savings and Resource Savings of Investments in 4 SME sectors, study for European Commission
124 European Commission, 2016. Commission notice — Commission
guidance document on streamlining environmental assessments conducted under Article 2(3) of the Environmental Impact Assessment Directive (Directive 2011/92/EU of the European Parliament and of the Council, as amended by Directive 2014/52/EU).
audits for systemic weaknesses. Similarly, there is a range of means to promote compliance, including awareness-raising campaigns and use of guidance documents and online information tools. Follow-up to breaches and liabilities can include administrative action (e.g. withdrawal of a permit), use of criminal law125 and action under liability law (e.g. required remediation after damage from an accident using liability rules) and contractual law (e.g. measures to require compliance with nature conservation contracts). Taken together, all of these interventions represent "compliance assurance" as shown in Figure 13.
Figure 13: Environmental compliance assurance
Best practice has moved towards a risk-based approach at strategic and operational levels in which the best mix of compliance monitoring, promotion and enforcement is directed at the most serious problems. Best practice also recognises the need for coordination and cooperation between different authorities to ensure consistency, avoid duplication of work and reduce administrative burden. Active participation in established pan-European networks of inspectors, police, prosecutors and judges, such as IMPEL126, EUFJE127, ENPE128 and EnviCrimeNet129, is a valuable tool for sharing experience and good practices.
Currently, there exist a number of sectoral obligations on inspections and the EU directive on environmental liability (ELD)130 provides a means of ensuring that the "polluter-pays principle" is applied when there are accidents and incidents that harm the environment. There is also publically available information giving insights into existing strengths and weaknesses in each Member State.
For each Member State, the following were therefore
125
European Union, Environmental Crime Directive 2008/99/EC 126
European Union Network for the Implementation and Enforcement of Environmental Law
127 European Union Forum of judges for the environment
128 The European Network of Prosecutors for the Environment
129 EnviCrimeNet
130 European Union, Environmental Liability Directive 2004/35/CE, p.56
The Netherlands 28
Environmental Implementation Report – Netherlands
reviewed: use of risk-based compliance assurance; coordination and co-operation between authorities and participation in pan-European networks; and key aspects of implementation of the ELD based on the Commission's recently published implementation report and REFIT evaluation131.
The Netherlands has a broad risk-based approach to compliance assurance, exemplified by the following:
The Table of Eleven is a tool that defines the key factors influencing compliance. It allows analysis of the causes of non-compliance and is widely used in the environmental sector to steer compliance assurance work132.
The Netherlands has established good compliance promotion practices, in particular in terms of structured dialogues with the regulated community.
The Dutch inspection authorities implement the concept of the Environmental Inspection Cycle developed within a major IMPEL project led by the Netherlands.
Risk based assessments to classify sectors, target inspection work and inform inspection frequencies are widely used.133. In The Netherlands, risk-based inspections often include reducing the frequency of inspection activity for duty-holders with a good compliance record.
Up-to-date information is lacking in relation to the following:
data-collection arrangements to track the use and effectiveness of different compliance assurance interventions134;
the extent to which risk-based methods are used to direct compliance assurance in specific problem-areas highlighted elsewhere in this Country Report,
131
COM(2016)204 final and COM(2016)121 final of 14.4.2016. This highlighted the need for better evidence on how the directive is used in practice; for tools to support its implementation, such as guidance, training and ELD registers; and for financial security to be available in case events or incidents generate remediation costs.
132 De Schraaf, A., 2005. 'The Compliance Strategy in the Netherlands,' in Proceedings of the Seventh International Conference on Environmental Compliance and Enforcement, Marrakech, Morocco.
133 For instance, the Rijnmond Environmental Protection Agency (DCMR) has developed a sophisticated risk-based approach to enforcement (based on environmental risk, environmental impact and environmental performance of individual installations) to employ the available instruments in a more effective and efficient way and to stimulate operators to improve their environmental performance.The objective is to reduce the inspection burden for businesses by introducing a risk categorisation to distinguish between businesses with good compliance (fewer inspections) and businesses with low compliance.
134 That there is scope for improvement is suggested in Faure, M./Svatikova, K., 2012. Criminal or Administrative Law to Protect the Environment? Evidence from Western Europe, Journal of Environmental Law, p. 22; IMPEL, 2014. IRI Report DCMR Environmental Protection Agency
i.e. the threats to protected habitat types and species, air quality problems and the pressures on water quality from diffuse water pollution.
The Netherlands has undertaken serious efforts to ensure proper coordination and cooperation between the numerous inspection authorities at different levels. Environmental networks have been established at national level, and the Inspection Council (Inspectieraad) has been established as a collaborative body at senior level aiming at ensuring consistency of inspection work across policy areas135. In The Netherlands, coordination includes setting common priorities for the criminal and administrative law136. A database called Inspection View has been developed to make it possible to digitally exchange inspection results between national and sub-national inspectorates.
As a founding member, the Netherlands is one of the main driving forces of IMPEL, taking the leadership for many individual projects and contributing to the internal network governance. The Netherlands is actively involved also in the work of other supra-national environmental enforcement networks, such as ENPE, EnviCrimeNet and EUFJE and together with the United Kingdom, Germany and other Member States prepared in the framework of the 'Make it Work' project principles for drafting provisions on compliance assurance in EU Environmental law137.
The Netherlands has issued guidelines on the application of the Dutch transposing legislation for the Environmental Liability Directive. The pre-existing national legislation applies simultaneously to liability situations, above the significance threshold, but the competencies for the public authorities laid down in the transposing legislation prevail in case of conflict with other competencies; this mainly will be of use for the difference between the mandatory cost recovery based on the ELD and the discretion for the competent authority to mitigate cost recovery based on the Soil Protection Act; therefore the implementing act provides that in case of conflicting competencies the implementating act always prevails. However, in the case of a major accident of January 2011 at Moerdijk, the pre-existing legislation has been applied by the local authorities. Following the operator's bankruptcy in that case, there was only limited recovery of environmental costs (total costs of around EUR 70 million). In general, the Netherlands do not have a national adequate
135
Inspectieraad, 2016. Samenwerkende rijksinspecties 136
The priorities are determined on the basis of risk analyses as the National Threat Assessment of Environmental Crime and elements of the regional enforcement programs. The National Environmental Security Taskforce (Landelijke Milieukamer) decides on a tactical level on the allocation of investigations. Participants are: the Specialised Prosecutors Office, the National Police, ILT IOD and NVWA IOD.
137 Make it work, drafting principles on compliance assurance.
The Netherlands 29
Environmental Implementation Report – Netherlands
financial security system to cover all liabilities under the Directive. However, financial security is obligatory for specific activities such as storage in underground tanks or the storage or handling of professional pyrotechnical articles
Suggested action Improve transparency on the organisation and
functioning of compliance assurance and on how significant risks are addressed, as outlined above.
Take further steps to ensure an effective system of financial security for environmental liabilities so that operators not only have insurance cover available to them but actually take it up (recently a proposal has been launched to introduce a competence for public authorities to require financial security for Seveso-activities).
Public participation and access to justice
The Aarhus Convention, related EU legislation on public participation and environmental impact assessment, and the case-law of the Court of Justice require that citizens and their associations should be able to participate in decision-making on projects and plans and should enjoy effective environmental access to justice.
Citizens can more effectively protect the environment if they can rely on the three "pillars" of the Convention on Access to Information, Public Participation in Decision-making and Access to Justice in Environmental Matters ("the Aarhus Convention"). Public participation in the administrative decision making process is an important element to ensure that the authority takes its decision on the best possible basis. The Commission intends to examine compliance with mandatory public participation requirements more systematically at a later stage.
Access to justice in environmental matters is a set of guarantees that allows citizens and their associations to challenge acts or omissions of the public administration before a court. It is a tool for decentralised implementation of EU environmental law.
For each Member State, two crucial elements for effective access to justice have been systematically reviewed: the legal standing for the public, including NGOs and the extent to which prohibitive costs represent a barrier.
The Netherlands grant generally broad access to justice, both for individuals and NGOs138. There is also no evidence that costs for court actions are prohibitively expensive.
138
Over 70% of the Dutch citizens perceive judges and courts as independent, which is the 7th highest level in the EU. See European Commission, 2016. The 2016 Justice Scoreboard, p. 35.
Access to information, knowledge and evidence
The Aarhus Convention and related EU legislation on access to information and the sharing of spatial data require that the public has access to clear information on the environment, including on how Union environmental law is being implemented.
It is of crucial importance to public authorities, the public and business that environmental information is shared in an efficient and effective way. This covers reporting by businesses and public authorities and active dissemination to the public, increasingly through electronic means.
The Aarhus Convention139, the Access to Environmental Information Directive140 and the INSPIRE Directive141 together create a legal foundation for the sharing of environmental information between public authorities and with the public. They also represent the green part of the ongoing EU e-Government Action Plan142. The first two instruments create obligations to provide information to the public, both on request and actively. The INSPIRE Directive is a pioneering instrument for electronic data-sharing between public authorities who can vary in their data-sharing policies, e.g. on whether access to data is for free. The INSPIRE Directive sets up a geoportal which indicates the level of shared spatial data in each Member State – i.e. data related to specific locations, such as air quality monitoring data. Amongst other benefits it facilitates the public authorities' reporting obligations.
For each Member State, the accessibility of environmental data (based on what the INSPIRE Directive envisages) as well as data-sharing policies ('open data') have been systematically reviewed.143
An active dissemination legal framework was established in the Netherlands and can be considered operational144. Obstacles reported included too technical information under the ePRTR reporting obligations not always easily understandable to the public.145
The Netherlands established a publicly accessible
139
European Union, Directive 2003/4/EC on public access to environmental information
140 European Union, INSPIRE Directive 2007/2/EC
141 European Commission, 2016. INSPIRE Directive
142 European Union, EU eGovernment Action Plan 2016-2020 Accelerating the digital transformation of government COM(2016) 179 final
143 Upon request by the Commission, most Member States provided an INSPIRE Action Plan addressing implementation issues. These plans are currently being assessed by the Commission. 144
Reference to the report submitted by the Netherlands to the Aarhus Convention Secretariat in 2013.
145UNECE, 2013. Aarhus Convention National Implementation Reports Netherlands
The Netherlands 30
Environmental Implementation Report – Netherlands
knowledge base146 for environmental legislation and tools for implementation.
The Netherlands' performance on the implementation of the INSPIRE Directive as enabling framework to actively disseminate environmental information to the public is good.
The Netherlands has indicated in the 3-yearly INSPIRE implementation report147 that the necessary data-sharing policies allowing access and use of spatial data by national administrations, other Member States' administrations and EU institutions without procedural obstacles are available and implemented. The Netherlands has an open data policy. It is estimated that 95% of the available spatial information is open data.
Assessments of monitoring reports148 issued by the Netherlands and the spatial information that the Netherlands has published on the INSPIRE geoportal149 indicate that not all spatial information needed for the evaluation and implementation of EU environmental law has been made available or is accessible. The larger part of this missing spatial information consists of the environmental data required to be made available under the existing reporting and monitoring regulations of EU environmental law.
Suggested action
Identify and document all spatial data sets required for the implementation of environmental law, and make the data and documentation at least accessible 'as is' to other public authorities and the public through the digital services foreseen in the INSPIRE Directive.
146
http://www.infomil.nl/ 147
European Commission, INSPIRE reports 148
Inspire indicator trends 149
Inspire Resources Summary Report