eu electricity markets in january and february 2017 · eu electricity markets in january and...
TRANSCRIPT

© 2017 S&P Global Platts, a division of S&P Global Inc. All rights reserved
EU Electricity Markets in January and February 2017
Understanding the Impact of the Cold Spell and the Special Measures Introduced in Select Member States and Concerned Energy Community Contracting Parties
December 20, 2017
A report to DG ENERGY
S&P Global Platts has participated in the study only as an objective independent third party – and in the capacity of performing quantitative, empirical analysis
of the topic in question. S&P Global Platts understands this survey is neither investigative nor intended to support punitive outcomes.

DG ENERGY | EU ELECTRICITY MARKETS IN JAN AND FEB 2017
DECEMBER 20, 2017
1
Executive Summary
Colder weather generally prevailed across the Continent in January 2017, with particularly severe conditions emerging in Southeast Europe (SEE). Several countries in this region (namely, Bulgaria, Serbia, the Former Yugoslav Republic of Macedonia, Romania, and Greece) experienced low temperatures, close to a 20-year minimum during week 1 and 2, although conditions turned more in line with typical cold spells during week 3 and 4. Warmer weather generally prevailed thereafter in February.
While day-ahead power prices across the regions generally reflected scarcity, several measures were announced to safeguard the systems because of the expected widening imbalances between surging demand and available generating capacity1. This report focuses on the major and most costly measures from the perspective of distortions in an otherwise functioning market, through their impact on cross-border electricity trading and day ahead market prices2:
In Bulgaria, Order 16-64 of Jan. 11, 2017 was issued by the Minister of Energy imposing on the Electricity System Operator (ESO) “an additional public service obligation consisting of the termination of access to the electricity transmission network of users exporting electricity generated in the country for the period from 01:00 on Jan. 13, 2017 until the reserves necessary for the operation of Bulgaria’s electricity system have been restored.” The Deputy Minister for Energy was appointed in charge to supervise the implementation of this order. The measure resulted in a suspension of the cross-border capacity allocation for exports through Feb. 9, 2017.
In Greece, export capacity was curtailed for two days, on Jan. 11 and 12, 2017.
In France, capacity from France to Spain was reduced for the peak hours from Jan. 14 to Jan. 20 to ensure operations remained within operationally security limits in observations. More specifically, Net Transfer Capacity (NTC) from France to Spain was brought down to 800 MW on Jan. 14 (hour 9 to hour 23), Jan. 15 (hour 19 to 21) and again from Jan. 16 to Jan. 20 (hour 8 to hour 23).
In Italy, exports capacities towards France were curtailed for a few hours on Jan. 18 and 19.
It should be noted that in Romania, the Government Decision no. 10 of Jan. 13, 2017 related to “Safeguard Measures in the Romanian Energy Market” introduced the possibility of applying extraordinary measures, including a reduction of interconnection capacity, curtailment of exports and load limitations to industrial clients. However, none of these measures were applied in Romania.
1 The study is based solely on actual observed temperatures and not on weather forecasts. As is known, TSOs make projections based on forecasts, with decisions being based on those projections. The assumption of using only observed temperatures could therefore underestimate the need for exceptional measures. 2 The report describes and analyzes the measures that were indicated as disruptive of cross-border flows, trading and day ahead
prices. The measures listed and analyzed in the report have been identified after a closer review of the Platts European Power
Daily bulletins for the period Jan. 1 through Feb. 15, 2017, the ENTSO-E Presentation Winter Outlook 2016/2017 follow-up by the
Electricity Coordination Group (Feb. 14, slide 8) and other inputs from relevant authorities of the countries concerned.
No content below the line
Footer : Never change the footer text on individual slides. Change, turn on or off Data color order: Complimentary colors:
Platts
Colors:
2017 Minimum Temperatures as a Difference From 1-in-20 Minimum Weekly Temperatures
-5
0
5
10
15
20
Wk-1 Wk-2 Wk-3 Wk-4 Wk-5 Wk-6 Wk-7 Wk-8 Wk-9
BG RS MK RO GR DE FR IToC
Bulgaria
Serbia
FYROM
Data source: Weekly temperatures provided by JRC/EC/ENER
DG ENERGY | EU ELECTRICITY MARKETS IN JAN AND FEB 2017
DECEMBER 20, 2017
2
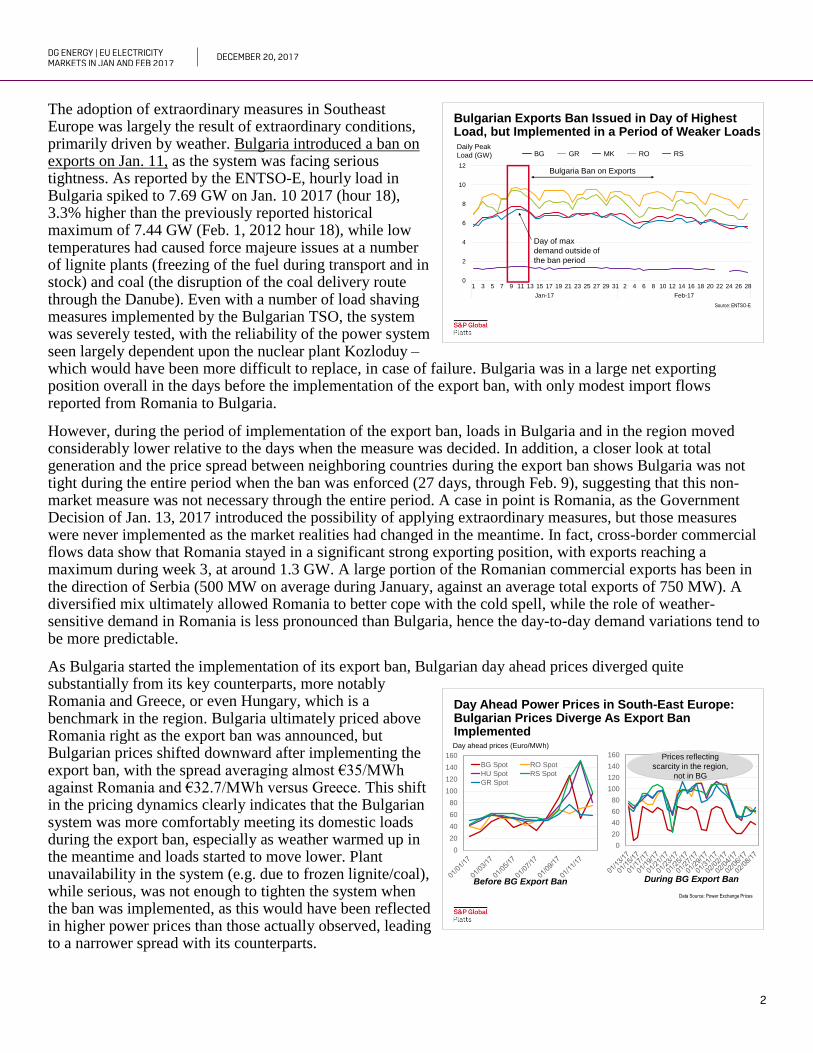
The adoption of extraordinary measures in Southeast Europe was largely the result of extraordinary conditions, primarily driven by weather. Bulgaria introduced a ban on exports on Jan. 11, as the system was facing serious tightness. As reported by the ENTSO-E, hourly load in Bulgaria spiked to 7.69 GW on Jan. 10 2017 (hour 18), 3.3% higher than the previously reported historical maximum of 7.44 GW (Feb. 1, 2012 hour 18), while low temperatures had caused force majeure issues at a number of lignite plants (freezing of the fuel during transport and in stock) and coal (the disruption of the coal delivery route through the Danube). Even with a number of load shaving measures implemented by the Bulgarian TSO, the system was severely tested, with the reliability of the power system seen largely dependent upon the nuclear plant Kozloduy – which would have been more difficult to replace, in case of failure. Bulgaria was in a large net exporting position overall in the days before the implementation of the export ban, with only modest import flows reported from Romania to Bulgaria.
However, during the period of implementation of the export ban, loads in Bulgaria and in the region moved considerably lower relative to the days when the measure was decided. In addition, a closer look at total generation and the price spread between neighboring countries during the export ban shows Bulgaria was not tight during the entire period when the ban was enforced (27 days, through Feb. 9), suggesting that this non-market measure was not necessary through the entire period. A case in point is Romania, as the Government Decision of Jan. 13, 2017 introduced the possibility of applying extraordinary measures, but those measures were never implemented as the market realities had changed in the meantime. In fact, cross-border commercial flows data show that Romania stayed in a significant strong exporting position, with exports reaching a maximum during week 3, at around 1.3 GW. A large portion of the Romanian commercial exports has been in the direction of Serbia (500 MW on average during January, against an average total exports of 750 MW). A diversified mix ultimately allowed Romania to better cope with the cold spell, while the role of weather-sensitive demand in Romania is less pronounced than Bulgaria, hence the day-to-day demand variations tend to be more predictable.
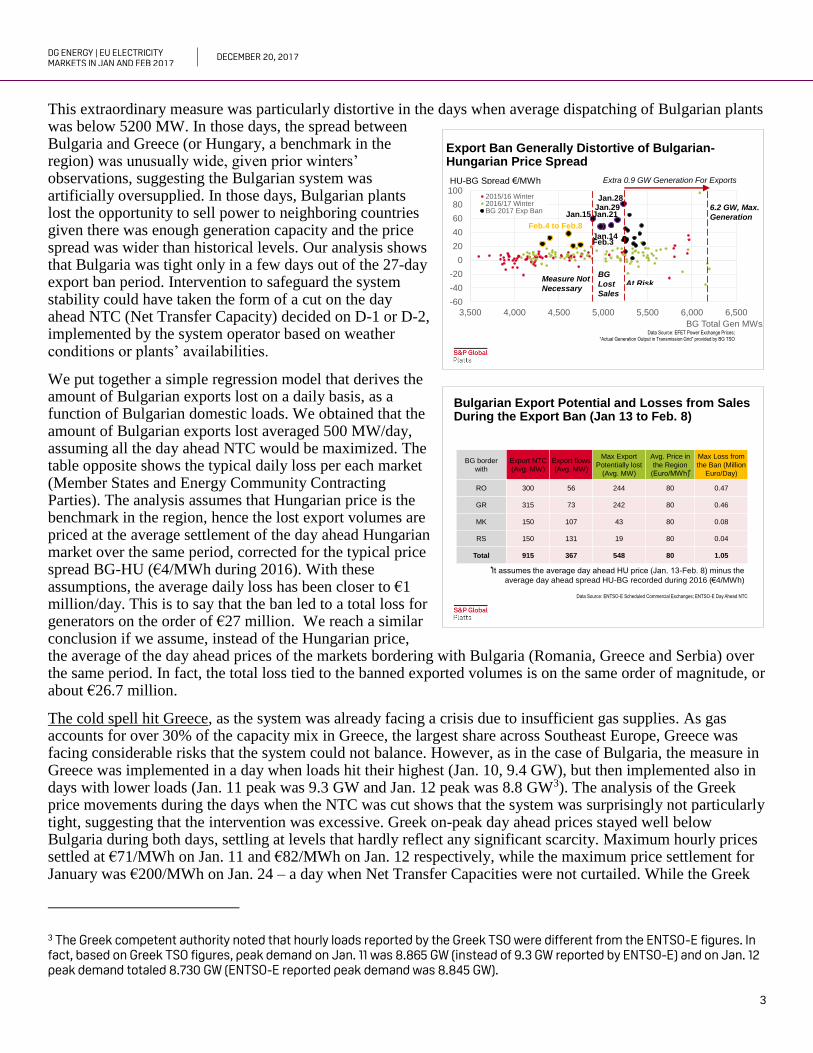
As Bulgaria started the implementation of its export ban, Bulgarian day ahead prices diverged quite substantially from its key counterparts, more notably Romania and Greece, or even Hungary, which is a benchmark in the region. Bulgaria ultimately priced above Romania right as the export ban was announced, but Bulgarian prices shifted downward after implementing the export ban, with the spread averaging almost €35/MWh against Romania and €32.7/MWh versus Greece. This shift in the pricing dynamics clearly indicates that the Bulgarian system was more comfortably meeting its domestic loads during the export ban, especially as weather warmed up in the meantime and loads started to move lower. Plant unavailability in the system (e.g. due to frozen lignite/coal), while serious, was not enough to tighten the system when the ban was implemented, as this would have been reflected in higher power prices than those actually observed, leading to a narrower spread with its counterparts.
No content below the line
Footer : Never change the footer text on individual slides. Change, turn on or off Data color order: Complimentary colors:
Platts
Colors:
Day Ahead Power Prices in South-East Europe: Bulgarian Prices Diverge As Export Ban Implemented
0
20
40
60
80
100
120
140
160
During BG Export Ban
Day ahead prices (Euro/MWh)
0
20
40
60
80
100
120
140
160
BG Spot RO Spot
HU Spot RS Spot
GR Spot
Before BG Export Ban
Prices reflecting
scarcity in the region,
not in BG
Data Source: Power Exchange Prices
No content below the line
Footer : Never change the footer text on individual slides. Change, turn on or off Data color order: Complimentary colors:
Platts
Colors:
Bulgarian Exports Ban Issued in Day of Highest Load, but Implemented in a Period of Weaker Loads
0
2
4
6
8
10
12
1 3 5 7 9 11 13 15 17 19 21 23 25 27 29 31 2 4 6 8 10 12 14 16 18 20 22 24 26 28
Jan-17 Feb-17
BG GR MK RO RSDaily Peak
Load (GW)
Bulgaria Ban on Exports
Day of max
demand outside of
the ban period
Source: ENTSO-E
DG ENERGY | EU ELECTRICITY MARKETS IN JAN AND FEB 2017
DECEMBER 20, 2017
3
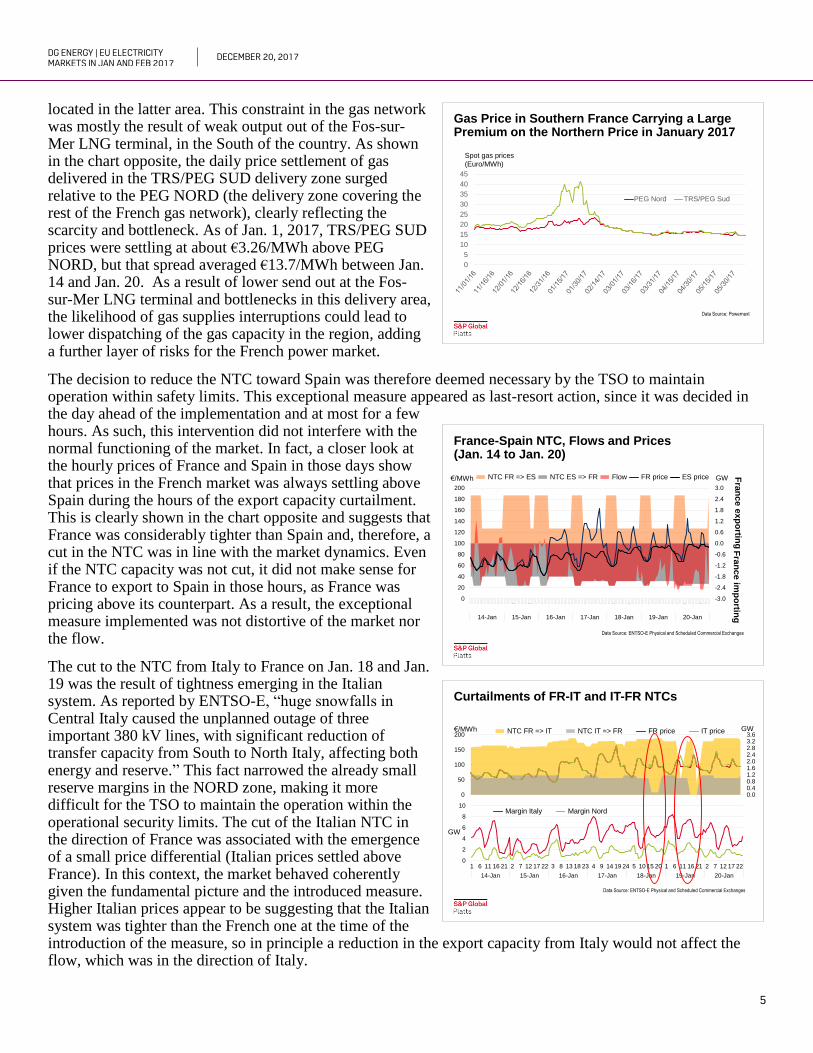
This extraordinary measure was particularly distortive in the days when average dispatching of Bulgarian plants was below 5200 MW. In those days, the spread between Bulgaria and Greece (or Hungary, a benchmark in the region) was unusually wide, given prior winters’ observations, suggesting the Bulgarian system was artificially oversupplied. In those days, Bulgarian plants lost the opportunity to sell power to neighboring countries given there was enough generation capacity and the price spread was wider than historical levels. Our analysis shows that Bulgaria was tight only in a few days out of the 27-day export ban period. Intervention to safeguard the system stability could have taken the form of a cut on the day ahead NTC (Net Transfer Capacity) decided on D-1 or D-2, implemented by the system operator based on weather conditions or plants’ availabilities.
We put together a simple regression model that derives the amount of Bulgarian exports lost on a daily basis, as a function of Bulgarian domestic loads. We obtained that the amount of Bulgarian exports lost averaged 500 MW/day, assuming all the day ahead NTC would be maximized. The table opposite shows the typical daily loss per each market (Member States and Energy Community Contracting Parties). The analysis assumes that Hungarian price is the benchmark in the region, hence the lost export volumes are priced at the average settlement of the day ahead Hungarian market over the same period, corrected for the typical price spread BG-HU (€4/MWh during 2016). With these assumptions, the average daily loss has been closer to €1 million/day. This is to say that the ban led to a total loss for generators on the order of €27 million. We reach a similar conclusion if we assume, instead of the Hungarian price, the average of the day ahead prices of the markets bordering with Bulgaria (Romania, Greece and Serbia) over the same period. In fact, the total loss tied to the banned exported volumes is on the same order of magnitude, or about €26.7 million.
The cold spell hit Greece, as the system was already facing a crisis due to insufficient gas supplies. As gas accounts for over 30% of the capacity mix in Greece, the largest share across Southeast Europe, Greece was facing considerable risks that the system could not balance. However, as in the case of Bulgaria, the measure in Greece was implemented in a day when loads hit their highest (Jan. 10, 9.4 GW), but then implemented also in days with lower loads (Jan. 11 peak was 9.3 GW and Jan. 12 peak was 8.8 GW3). The analysis of the Greek price movements during the days when the NTC was cut shows that the system was surprisingly not particularly tight, suggesting that the intervention was excessive. Greek on-peak day ahead prices stayed well below Bulgaria during both days, settling at levels that hardly reflect any significant scarcity. Maximum hourly prices settled at €71/MWh on Jan. 11 and €82/MWh on Jan. 12 respectively, while the maximum price settlement for January was €200/MWh on Jan. 24 – a day when Net Transfer Capacities were not curtailed. While the Greek
3 The Greek competent authority noted that hourly loads reported by the Greek TSO were different from the ENTSO-E figures. In fact, based on Greek TSO figures, peak demand on Jan. 11 was 8.865 GW (instead of 9.3 GW reported by ENTSO-E) and on Jan. 12 peak demand totaled 8.730 GW (ENTSO-E reported peak demand was 8.845 GW).
No content below the line
Footer : Never change the footer text on individual slides. Change, turn on or off Data color order: Complimentary colors:
Platts
Colors:
Export Ban Generally Distortive of Bulgarian-Hungarian Price Spread
-60
-40
-20
0
20
40
60
80
100
3,500 4,000 4,500 5,000 5,500 6,000 6,500
BG Total Gen MWs
2015/16 Winter2016/17 WinterBG 2017 Exp Ban
HU-BG Spread €/MWh
6.2 GW, Max.
Generation
At RiskMeasure Not
Necessary
BG
Lost
Sales
Feb.4 to Feb.8
Jan.15
Jan.14Feb.3
Jan.21Jan.29Jan.28
Data Source: EFET Power Exchange Prices;
“Actual Generation Output in Transmission Grid” provided by BG TSO
Extra 0.9 GW Generation For Exports
No content below the line
Footer : Never change the footer text on individual slides. Change, turn on or off Data color order: Complimentary colors:
Platts
Colors:
Bulgarian Export Potential and Losses from Sales During the Export Ban (Jan 13 to Feb. 8)
BG border
with
Export NTC
(Avg. MW)
Export flows
(Avg. MW)
Max Export
Potentially lost
(Avg. MW)
Avg. Price in
the Region
(Euro/MWh)
Max Loss from
the Ban (Million
Euro/Day)
RO 300 56 244 80 0.47
GR 315 73 242 80 0.46
MK 150 107 43 80 0.08
RS 150 131 19 80 0.04
Total 915 367 548 80 1.05
It assumes the average day ahead HU price (Jan. 13-Feb. 8) minus the
average day ahead spread HU-BG recorded during 2016 (€4/MWh)
Data Source: ENTSO-E Scheduled Commercial Exchanges; ENTSO-E Day Ahead NTC

DG ENERGY | EU ELECTRICITY MARKETS IN JAN AND FEB 2017
DECEMBER 20, 2017
4
authorities have reported that gas units were forced to switch to oil, surprisingly a switch to more expensive oil products is not priced into the hourly power prices of Jan. 11 and Jan. 12. In fact, if we assume diesel prices (GO 0.1%S) in the MED region averaged $64/BBL in January and $60/BBL in 4Q 2016, this should have implied power prices in the €100 - €150/MWh order of magnitude. Interestingly, 150 hours in the day-ahead market settled above €100/MWh during January, but none of those settlements occurred on Jan. 11 and Jan. 12, which were the days when the extraordinary measures were implemented. In the case of Greece, the intervention appeared to exceed its purpose, especially on Jan. 12.
The export reductions on the French interconnectors offer a good example of intervention decided on a D-1 basis and confined to short-term horizons. These measures were implemented in form of reductions of the Net Transfer Capacities and were known by market participants as they were made public through the REMIT platforms. We believe these extraordinary measures could have been expected, given the reduced nuclear availability in France, and did not lead to market distortions. While the weather was not as severe as in Southeastern Europe, the French market had already been experiencing a period of tightness because of lower nuclear availability. The French nuclear regulator ASN explicitly set a deadline of three months to perform safety checks on a number of units (ASN Decision of Oct. 18, 2016). The checks resulted in large declines in French nuclear availability, even in January, a month with typically high electricity demand due to heating. This issue was widely known in the marketplace. As shown in the chart above, nuclear availability was at multi-year lows from July 2016. In the cold spell of Feb. 2012, which was more severe than the Jan. 2017 one, French nuclear availability was almost 3 GW higher (59.4 GW against 55.6 GW reported for Jan. 20, 2017, the day with the highest load in 2017). In addition, back in Feb. 2012, France had significantly higher fossil fuel capacities (over 8.3 GW of coal and oil units relative to Jan. 2017). Even before the cold spell, the market was anticipating significant tightness in the French market relative to Spain and Italy. With the French installed fossil fuel capacity reduced to 21.8 GW, as a result of recent closures, the French market was severely constrained in days with colder weather, especially as the operational fossil fuel capacity was already highly utilized.
Due to delays in carrying out the checks on the first reactors and for the ASN to validate the restart of these reactors, EDF requested that the three-month deadline be extended for two reactors (Tricastin 2 and Civaux 1), so that their shutdown would not occur before restarting other reactors for which the ASN had validated the results of the checks. ASN approved EDF's request and allowed a delay of inspections by a few weeks, on the basis of information on the situation of the French electricity supply and the risks to that supply in the event of a significant cold wave.
An additional factor this past winter was the coincident saturation of the gas transport capacities from the Northern to the Southern part of France, with consequences on the availability and generation of the gas units
No content below the line
Footer : Never change the footer text on individual slides. Change, turn on or off Data color order: Complimentary colors:
Platts
Colors:
French Nuclear Availability in Winter 2016/17At Multi-year Lows
35
40
45
50
55
60
65
1 2 3 4 5 6 7 8 9 10 11 12
2012 2013 2014 2015 2016 2017
Month
GW
Data Source: RTE France
No content below the line
Footer : Never change the footer text on individual slides. Change, turn on or off Data color order: Complimentary colors:
Platts
Colors:
France’s Ability to Withstand Cold Spell Weakened by Lower Installed/Available Capacity
Installed
Jan. 1,
2012
Historical Max
8 Feb. 2012
Installed
Jan. 1,
2017
20-Jan-17 25-Jan-17
Price €220/MWh €122/MWh €206/MWh
Time 7 PM 10 AM 9:00 AM
Demand 101.65 93.7 89.6
Fuel oil 10.4 5.5 7.1 4.0 2.5
Coal 7.9 5.1 3 2.6 2.3
Gas 11.7 8 11.7 9.3 9.1
Nuclear 63.1 59.4 63.1 55.6 56.6
Wind 6.6 1.7 11.7 2.7 1.2
Solar 2.2 0 6.7 0.5 0.1
Hydro 25.4 13.771 25.4 13.7 12.7
Other 1.3 0.6 1.9 0.9 0.8
Imports 7.9 4.2 4.3
UK 2 1 1
Spain 1 2.3 2.2
Italy 0.9 -1.3 0.2
Switzerland -0.4 0.8 1.4
Belgium/Germany 4.4 1.3 0.3
Adj -0.2 0.1 -0.8Data Source: RTE France and EPEX Spot
DG ENERGY | EU ELECTRICITY MARKETS IN JAN AND FEB 2017
DECEMBER 20, 2017
5
located in the latter area. This constraint in the gas network was mostly the result of weak output out of the Fos-sur-Mer LNG terminal, in the South of the country. As shown in the chart opposite, the daily price settlement of gas delivered in the TRS/PEG SUD delivery zone surged relative to the PEG NORD (the delivery zone covering the rest of the French gas network), clearly reflecting the scarcity and bottleneck. As of Jan. 1, 2017, TRS/PEG SUD prices were settling at about €3.26/MWh above PEG NORD, but that spread averaged €13.7/MWh between Jan. 14 and Jan. 20. As a result of lower send out at the Fos-sur-Mer LNG terminal and bottlenecks in this delivery area, the likelihood of gas supplies interruptions could lead to lower dispatching of the gas capacity in the region, adding a further layer of risks for the French power market.
The decision to reduce the NTC toward Spain was therefore deemed necessary by the TSO to maintain operation within safety limits. This exceptional measure appeared as last-resort action, since it was decided in the day ahead of the implementation and at most for a few hours. As such, this intervention did not interfere with the normal functioning of the market. In fact, a closer look at the hourly prices of France and Spain in those days show that prices in the French market was always settling above Spain during the hours of the export capacity curtailment. This is clearly shown in the chart opposite and suggests that France was considerably tighter than Spain and, therefore, a cut in the NTC was in line with the market dynamics. Even if the NTC capacity was not cut, it did not make sense for France to export to Spain in those hours, as France was pricing above its counterpart. As a result, the exceptional measure implemented was not distortive of the market nor the flow.
The cut to the NTC from Italy to France on Jan. 18 and Jan. 19 was the result of tightness emerging in the Italian system. As reported by ENTSO-E, “huge snowfalls in Central Italy caused the unplanned outage of three important 380 kV lines, with significant reduction of transfer capacity from South to North Italy, affecting both energy and reserve.” This fact narrowed the already small reserve margins in the NORD zone, making it more difficult for the TSO to maintain the operation within the operational security limits. The cut of the Italian NTC in the direction of France was associated with the emergence of a small price differential (Italian prices settled above France). In this context, the market behaved coherently given the fundamental picture and the introduced measure. Higher Italian prices appear to be suggesting that the Italian system was tighter than the French one at the time of the introduction of the measure, so in principle a reduction in the export capacity from Italy would not affect the flow, which was in the direction of Italy.
No content below the line
Footer : Never change the footer text on individual slides. Change, turn on or off Data color order: Complimentary colors:
Platts
Colors:
France-Spain NTC, Flows and Prices (Jan. 14 to Jan. 20)
-3.0
-2.4
-1.8
-1.2
-0.6
0.0
0.6
1.2
1.8
2.4
3.0
1 6 111621 2 7 121722 3 8 131823 4 9 141924 5 101520 1 6 111621 2 7 121722
14-Jan 15-Jan 16-Jan 17-Jan 18-Jan 19-Jan 20-Jan
0
20
40
60
80
100
120
140
160
180
200
NTC FR => ES NTC ES => FR Flow FR price ES price€/MWh GW
Fra
nc
e e
xp
ortin
gF
ran
ce
imp
ortin
g
Data Source: ENTSO-E Physical and Scheduled Commercial Exchanges
No content below the line
Footer : Never change the footer text on individual slides. Change, turn on or off Data color order: Complimentary colors:
Platts
Colors:
Curtailments of FR-IT and IT-FR NTCs
0
50
100
150
200
0.00.40.81.21.62.02.42.83.23.6
NTC FR => IT NTC IT => FR FR price IT price
0
2
4
6
8
10
1 6 11 16 21 2 7 12 17 22 3 8 13 18 23 4 9 14 19 24 5 10 15 20 1 6 11 16 21 2 7 12 17 22
14-Jan 15-Jan 16-Jan 17-Jan 18-Jan 19-Jan 20-Jan
Margin Italy Margin Nord
GW€/MWh
GW
Data Source: ENTSO-E Physical and Scheduled Commercial Exchanges
No content below the line
Footer : Never change the footer text on individual slides. Change, turn on or off Data color order: Complimentary colors:
Platts
Colors:
Gas Price in Southern France Carrying a Large Premium on the Northern Price in January 2017
Data Source: Powernext
0
5
10
15
20
25
30
35
40
45
PEG Nord TRS/PEG Sud
Spot gas prices
(Euro/MWh)

DG ENERGY | EU ELECTRICITY MARKETS IN JAN AND FEB 2017
DECEMBER 20, 2017
6
A first lesson from the cold spell of Jan. 2017 is the need to continuously assess the need for exceptional measures, at least on a daily basis, against changing temperatures and market conditions. The implementation of exceptional intrusive measures in the Southeastern European markets lasted well beyond the days with extreme weather conditions. Unlike Southeastern Europe, the export reductions on the French interconnectors were rather NTC optimizations that were decided in relatively shorter timeframes and limited to short-term horizons (hours to days), in line with weather conditions and with no implications on the market dynamics. It should be remembered that, as of Jan. 11, RTE was expecting French demand would hit 101 GW on Jan. 19, but the realized peak demand was actually much lower, as shown in the chart opposite. While these forecasts had created serious concerns among market participants, the decision and implementation of these measures on a narrow window (D-1) is more ideal as it would take into account more reliable weather forecasts, without interfering with trading.
In addition, the events of the cold spell in Jan. 2017 highlight how the decisions on export reductions or curtailments have larger implications on a regional scale. A stricter cooperation among TSOs and authorities is therefore absolutely necessary, especially in periods of system stress. The French authorities pointed out that daily meetings were taking place among the 41 grid operators, yet a lack of coordination has nevertheless emerged in the Southeastern European markets, in spite of their high level of interconnection and integration. This cooperation should include the computation of complex or multiple regional demand/supply forecasts on different time horizons (D-1, D-2 and W-1) for the entire region, which could better anticipate system stress under extreme events. The cooperation of the European TSOs within the CORESO4 offers an example of regional coordination enabling TSOs to ensure security of supply on a regional level. It is crucial to make those scenarios publicly available to market participants so that this information can be adequately taken into account. This stricter cooperation could be limited to periods when there are enhanced risks of imbalances, such as winter season, or when specific events occur, such as exceptionally low hydro levels, or more specific generation losses, such as higher nuclear or thermal unavailability.
Finally, from a broader perspective, the cold spell of January 2017 – the first major weather event since at least Feb. 2012 - highlights how reserve capacity margins have been thinning in major European markets, due to a chronic lack of investments, especially on the generation side. In addition, the events of the cold spell in January 2017 highlight the need to develop even more sophisticated short-term forecast methodologies, together with mid-term (2-3 years ahead) and seasonal outlooks, with several detailed sensitivities that take into account of a number of deviations from normal to include the emergence of extreme conditions on a regional basis. Furthermore the findings of the study underline the need for a stronger regional cooperation between neighbouring countries' relevant authorities and the concerned TSOs. The study indicates that if there had been a greater emphasis on regional cooperation, the measures taken could have been less intrusive and more effective. A more regional approach could have lessened the implications of the cold spell.
4 The voluntary regional cooperation initiative CORESO was informed of the risk of tightness in France by mid October 2016. CORESO therefore asked the French TSO (RTE) for further information and followed the development of the situation from a general regional perspective."
No content below the line
Footer : Never change the footer text on individual slides. Change, turn on or off Data color order: Complimentary colors:
Platts
Colors:
French Daily Peak Demand: Forecasts Vs. Realized
80,000
85,000
90,000
95,000
100,000
105,000
14-Jan 15-Jan 16-Jan 17-Jan 18-Jan 19-Jan 20-Jan 21-Jan
View on Wednesday, Jan. 11
View on Thursday, Jan. 12
View on Friday, Jan. 13
View on Monday Jan. 16
View on Tuesday Jan. 17
Realized
MW
Data Source: RTE France

DG ENERGY | EU ELECTRICITY MARKETS IN JAN AND FEB 2017
DECEMBER 20, 2017
7
Table of Contents
Study Contributors ............................................................................................................................................... 8
Introduction ......................................................................................................................................................... 10
Chapter 1. The Cold Spell of Jan. 2017 ............................................................................................................ 11
Chapter 2. Assessing the Impact of Measures Introduced to Face the Cold Spell of Jan. 2017 .................. 14
Chapter 3. Lessons Learned............................................................................................................................... 29
DG ENERGY | EU ELECTRICITY MARKETS IN JAN AND FEB 2017
DECEMBER 20, 2017
8
Study Contributors
STUDY LEADER
Bruno Brunetti, Head of Global Power Strategy, Analytics, S&P Global Platts
Bruno Brunetti manages PIRA European Electricity Service, which provides market insights into the developments of power generation, demand, cross-border trading, and prices for Europe’s most relevant markets. Bruno is a contributor to the PIRA International Coal and the European Emissions Trading System Market Outlook reports. Bruno is currently working to expand and combine the European power offering of Eclipse Energy and PIRA, both recent acquisitions. He is also working with S&P Global Market Intelligence to link the power assets of PIRA and Platts Analytics to serve the financial markets with interest in European and global power. Bruno also co-leads the efforts to expand PIRA’s current power offerings toward a deeper focus on renewables, technology and policy. Prior to joining PIRA in 2001, he was at Caminus (Sungard, leading provider of software for energy, now part of FIS), where he wrote studies on new projects and on asset acquisitions and divestments. He began his career in strategic planning at Enel. For Cedigaz, the international center dedicated to natural gas information, Bruno drafted the study “Natural Gas in Power Generation” in 1998. Bruno graduated magna cum laude in economics and management from Bari University (Italy) and obtained a masters in energy economics from the ENSPM / Institut Français du Pétrole (Paris).
KEY CONTRIBUTORS
Dr. Lin Fan, Director, Global Gas and Power, Analytics, S&P Global Platts
Dr. Lin Fan is responsible for tracking historical trends and modeling the European electricity market. She maintains our proprietary Daily Electricity Demand Forecast Model, and recently she developed a Daily Renewable Generation Forecast, a report that provides hourly generation from solar and wind for 10 days in all the key European markets. Lin joined PIRA, now part of Platts/S&P Global, after receiving her Ph.D. in the Environmental Economics, Policy and System Analysis Group at Johns Hopkins University. She has published articles in key academic journals, including Journal of Environmental Economics and Management, Global Environmental Change, and Energy Economics. Lin also holds an M.S. in economics from Hopkins and a B.S. in environmental economics from Renmin University in China.
Giuliano Bordignon, Director, European Electricity, Analytics, S&P Global Platts
Giuliano joined PIRA, now part of Platts/S&P Global, in July 2016 as Director in the European Electricity team. In this role, Giuliano is a key contributor to the weekly PIRA European Electricity Market Scorecard and European Electricity Market Outlook reports, which analyze the European power fundamentals and pricing dynamics. Before moving to the US, he was part of the UK Energy Strategy team at National Grid, leading the power generation modeling for the Future Energy Scenarios analysis. His expertise includes modeling of European power markets and consulting work on wind, solar and CHP projects. Giuliano holds a PhD in Physics from the University of Southampton in the UK.
Javier Díaz, Manager, Energy Analysis & Consulting, S&P Global Platts
Mr. Díaz provides consulting services for the energy sector including the LNG, natural gas, NGLs and crude oil markets and also leads analytics for Mexico and South American markets. He has served as an expert panel participant and presenter at several national and international conferences, and has been quoted on printed media (news and industry), and interviewed for several news outlets. He has presented in front of international State Department officials and governments. Mr. Diaz has presented at conferences and advised clients in over 17 countries across four continents. Previously, as Head of the LNG Analytics team for Bentek Energy, which was acquired by S&P Global Platts in 2011, Mr. Díaz was responsible for providing analytical coverage of the global LNG market. He developed a full new suit of LNG products and analytical tools, including methodology, LNG transportation and production costs, as well as for forecasting LNG global supply/demand and prices, and reports that cover Atlantic and Pacific Basins, Global Markets, and North American LNG Exports. Mr. Díaz

DG ENERGY | EU ELECTRICITY MARKETS IN JAN AND FEB 2017
DECEMBER 20, 2017
9
also developed the Bentek Energy content included in Platts LNG Daily and the Platts LNG data products. Mr. Díaz previously served as the Chief Operating Officer of the 8th Continent Project, which received the 2010 Jefferson Economic Council’s Genesis Award “Economic Developer of the Year," for creating new jobs, investment opportunities, and economic expansion within Jefferson County, Colorado, and held a Research Faculty position at the Colorado School of Mines Center for Space Resources, collaborating with NASA (Jet Propulsion Laboratory, Johnson Space Center), DARPA, Lockheed Martin, Bechtel, Norcat, and MD Robotics.

DG ENERGY | EU ELECTRICITY MARKETS IN JAN AND FEB 2017
DECEMBER 20, 2017
10
Introduction
As a severe cold spell emerged in January 2017, the European Commission closely followed the events in the electricity markets, especially as several Member States adopted special measures – in some cases intrusive to the market - to face imbalances between demand and available generation. As a follow-up from the Electricity Coordination Group meeting of February 12, 2017, the Directorate-General for Energy (DG ENERGY) has asked S&P Global Platts to review all relevant quantitative and quality information tied to the cold spell and the major measures undertaken by a number of Member States. DG ENERGY has provided relevant data, while additional information was submitted by all concerned stakeholders through a detailed questionnaire, sent in mid-April 2017.
PIRA, now part of S&P Global Platts, has reviewed all the data and information provided and, in this report, offers an assessment of the facts and major, or more costly measures, from the perspective of distortion of the market functioning, through their impact on cross-border electricity trading and day ahead market prices. A draft of this report – dated July, 24 2017 - was shared with the relevant authorities of the countries concerned. France, Spain and Greece submitted their comments to the study, which were incorporated in the final version.
The report is structured as follow:
Chapter 1 (The Cold Spell of Jan. 2017) provides a description of the broader context in January through mid- February across the Continent, with particular reference to the weather patterns, duration and intensity of the cold spell.
Chapter 2 (Assessing the Impact of Extraordinary Measures Introduced to Face the Cold Spell of Jan. 2017) provides a description and an assessment of the major extraordinary measures adopted in Bulgaria, Greece, Romania, France and Italy. These countries are the focus of the report, since they were the most affected by the adverse weather conditions, while also responded very differently to the tightening supply/demand balances.
Chapter 3 (Lessons Learned). This chapter provides an assessment on whether the implemented extraordinary measures could have been expected, considering weather conditions or market context.
It should be noted that S&P Global Platts and PIRA have participated in the study only as an objective independent third party – and in the capacity of performing quantitative, empirical analysis of the topic in question. S&P Global Platts and PIRA understand this survey is neither investigative nor intended to support punitive outcomes.

DG ENERGY | EU ELECTRICITY MARKETS IN JAN AND FEB 2017
DECEMBER 20, 2017
11
Chapter 1. The Cold Spell of Jan. 2017
Europe experienced periods of particularly cold weather early in 2017, especially in January. The charts below present maps with daily temperature deviations from average all across Europe for January through mid-February 2017 (week 1 to 6). More specifically, the areas in turquoise indicate deviations from normal of 0 to 3oC, the blue color represents temperatures of 3 to 6oC below normal, and the dark blue shows the most freezing weather conditions, with temperatures plummeting by over 6oC below normal levels. On the other end of the scale, the colors of yellow, orange, and red indicate periods of warmer weather, based on the data from the JRC/EC/ENER.
As shown in the charts, colder weather generally prevailed from week 1 to week 4 across the Continent, with warmer weather emerging thereafter. However, the cold spell was more severe and lasted longer in Southeast Europe, especially in Bulgaria, Romania, Serbia and the Former Yugoslav Republic of Macedonia (FYROM). Temperatures were reported to be 3.9 to 5.2oC below normal in Bulgaria for weeks 1-4, whereas Romanian temperatures were 3.1 to 5.1oC below normal in weeks 1-4. Temperature deviations in Serbia were between 4.2 and 7oC versus normal, with FYROM at similar levels (as low as -6.7oC from normal in week 2).
In order to understand the severity of the cold spell, we have also looked at the deviation of the minimum temperatures recorded in 2017 from the 1-in-20 winters (i.e., the coldest winter in 20 years). The 1-in-20 data shows that Bulgaria and Serbia were colder than 1-in-20 in week 1 and 2, while FYROM was colder than 1-in-20 only in week 1. In all of the other countries, the 2017 minimum weekly temperature was never below the historical 1-in-20 minimum weekly temperature.
No content below the line
Footer : Never change the footer text on individual slides. Change, turn on or off Data color order: Complimentary colors:
Platts
Colors:
2017: Temperature Deviations from Average (Week 1-3)
Week 1 Week 2 Week 3
Data source: Weekly temperatures provided by JRC/EC/ENER No content below the line
Footer : Never change the footer text on individual slides. Change, turn on or off Data color order: Complimentary colors:
Platts
Colors:
2017: Temperature Deviations from Average (Week 4-6)
Week 4 Week 5 Week 6
Data source: Weekly temperatures provided by JRC/EC/ENER
No content below the line
Footer : Never change the footer text on individual slides. Change, turn on or off Data color order: Complimentary colors:
Platts
Colors:
2017 Minimum Temperatures as a Difference From 1-in-20 Minimum Weekly Temperatures
-5
0
5
10
15
20
Wk-1 Wk-2 Wk-3 Wk-4 Wk-5 Wk-6 Wk-7 Wk-8 Wk-9
BG RS MK RO GR DE FR IToC
Bulgaria
Serbia
FYROM
Data source: Weekly temperatures provided by JRC/EC/ENER

DG ENERGY | EU ELECTRICITY MARKETS IN JAN AND FEB 2017
DECEMBER 20, 2017
12
Several special extraordinary and intrusive measures were taken starting from week 2, as described in Chapter 2, but when we look at the detailed data for week 2 and 3 (see chart opposite), minimum temperatures in Bulgaria, Serbia, Romania and FYROM were comparable or colder than 1-in-20 minimum temperatures in the first half of week 2. Temperatures in Bulgaria and Serbia dropped again towards those levels at the end of week 3, when also France experienced a cold spell. As we describe in Chapter 2, extraordinary measures were introduced in Bulgaria and Greece, and to a lesser extent, France, but it should be noted that other countries which were affected by exceptionally colder weather, such as Serbia or FYROM, did not resort to similar measures.
The chart opposite puts the cold spell in Bulgaria into a wider historical context, as it shows a comparison between the one observed at the beginning of 2017 and the most severe in the past decades. The length (x-axis) is determined by the number of days when the temperature was colder than normal, whereas the temperature (y-axis) is taken as the average across those days. The 8-day period between January 6 and January 13, 2017 was among the coldest of the past 42 years, comparable to the 7-day period starting from January 23, 2006 and second only to the 5-day period starting on December 16, 1997. By comparison, we have also highlighted a more recent cold spell – Jan./Feb. 2012 – which was significantly longer, but not as severe in terms of temperatures deviations from normal. The following weeks were less cold and are not really comparable to prior severe cold spells (e.g. the observations fall outside the chart). This is important to note, as Bulgaria adopted a ban on exports starting on January 13 (a week with extreme cold weather), but the extraordinary measure lasted through February 8, or a period when the weather conditions were not as severe as the week of Jan. 6.
The impact of the weather conditions on electricity demand in Southeast Europe has been amplified by the relatively larger role of the residential and commercial sectors, which tend to be more sensitive to weather conditions. In fact, according to data by Eurostat, these sectors combined account for approximately 70% of the final electricity demand in Bulgaria, Greece, Serbia and FYROM, a proportion that is similar to the one of France – the most thermo-sensitive market in Europe5. The chart above in prior page shows a more granular detail – with indication of the role of the residential sector, services/small enterprises, industry and others. Demand in the residential and, to some extent, the services sectors as well, is more largely driven by temperatures and, while the Southeastern European
5 French power demand increases by 2.4 GW when temperatures decrease by 1 Degree C from normal levels.
No content below the line
Footer : Never change the footer text on individual slides. Change, turn on or off Data color order: Complimentary colors:
Platts
Colors:
0%
10%
20%
30%
40%
50%
60%
70%
80%
90%
100%
Others
Residential
Services
Industry
Power Demand by Sector in Selected European Countries: Large Role of R/C in South East Europe
Higher sensitivity to weatherSource: Eurostat
No content below the line
Footer : Never change the footer text on individual slides. Change, turn on or off Data color order: Complimentary colors:
Platts
Colors:
2017 Minimum Temperatures as a Difference From 1-in-20 Minimum Daily Temperatures: W 2-3
-10
-5
0
5
10
15
20
BG RS MK RO GR DE FR IToC
Bulgaria
SerbiaFYROM
Romania France
Data source: Weekly temperatures provided by JRC/EC/ENER
No content below the line
Footer : Never change the footer text on individual slides. Change, turn on or off Data color order: Complimentary colors:
Platts
Colors:
Bulgaria: Cold Spells in an Historical Context*:Cold Spell Severe, but Short
* The difference is calculated starting from Normal-1oC
02-Oct-83 >> 03-Oct-83
16-Feb-08 >> 18-Feb-08
30-Dec-14 >> 02-Jan-15
16-Dec-97 >> 20-Dec-97
03-Feb-86 >> 07-Feb-86
30-Jan-96 >> 03-Feb-96
22-Jan-04 >> 27-Jan-04
23-Jan-06 >> 29-Jan-06
06-Jan-17 >> 13-Jan-17
06-Feb-96 >> 13-Feb-96
19-Nov-95 >> 27-Nov-95
24-Sep-77 >> 02-Oct-77
07-Dec-02 >> …
04-Nov-95 >> 14-Nov-95
19-Jan-10 >> 30-Jan-10
30-Jan-05 >> 12-Feb-05
11-Nov-93 >> 08-Dec-93
26-Jan-12 >> 23-Feb-12
-11.0
-10.0
-9.0
-8.0
-7.0
-6.0
-5.0
0 5 10 15 20 25 30 35
Length of cold spell (nr. of days)
oC
Data source: Weekly and daily temperatures provided by JRC/EC/ENER

DG ENERGY | EU ELECTRICITY MARKETS IN JAN AND FEB 2017
DECEMBER 20, 2017
13
markets are smaller in size, their demand still tends to fluctuate quite significantly because of temperatures during the winter. In other words, the risk of demand spikes is larger in these countries and drives market participants’ response and, ultimately, TSOs and policy makers’ actions while planning measures to face imbalances between demand and available capacity.
PIRA’s daily demand model calculates the impact of temperatures on loads for a number of European countries, using a methodology that captures the non-linearity of temperature/load response. Based on this methodology and PIRA’s own temperatures, we observed that the extra weather-related demand in Bulgaria during the month of January averaged 0.4 GW, equivalent to the largest weather correction for any given month in more than a decade (see on the right side of the first chart below). Our models do not account for load curtailments, so it’s a theoretical demand response to temperatures – all other things being equal. Romania also saw large weather-related gains during January, but those were not the largest ever recorded based on our calculations. This may be in part the result of a lower role of residential/commercial/services (only ~47.6% of demand in Romania, against 67% combined in Bulgaria), but also relatively more benign weather conditions in Romania. The second chart below shows the estimated weather-related demand as a percentage of the average demand in any given month. The impact of the cold spell was more important for Bulgaria (~7% of the average demand in January 2017), against about 3% in Romania.
Nevertheless, both Romania and Bulgaria saw their hourly loads reach multi-year highs in January 2017. As reported by the ENTSO-E, hourly load in Bulgaria spiked to 7.69 GW on Jan. 10 2017 (hour 18), 3.3% higher than the previously reported historical maximum of 7.44 GW (Feb. 1, 2012 hour 18), with Romanian demand hitting an historical high of 9.728 GW on Jan. 10, higher than the previously reported peak (Dec. 19, 2007).
As for France, the extra weather-related demand was estimated to be on the order of 5.4 GW on average for the month of January, which was far below the amount of weather-related demand for February 2012 (10 GW), being the most severe cold spell over the past decade in France. On a relative basis, French extra-weather demand was about 7% of total loads, far below the amount estimated for Feb. 2012 or Dec. 2010. French maximum hourly demand totaled 93.8 GW on Jan. 20, well below the 101.6 GW historic high reached in Feb. 2012. While the French system was significantly strained back in February 2012, France held at that point significantly larger fossil fuel capacities (an additional 8.3 GW of coal and oil units relative to Jan. 2017), which allowed France to withstand considerably better the cold spell. In addition, interconnection capacity with Spain is larger now, while finally, as discussed in Chapter 2, nuclear availability was significantly lower this year for specific technical issues (probe on the steam generators). These factors (more specifically, lower installed capacities and nuclear availability) complicate the comparison between this year’s cold spell and the one in Feb. 2012.
No content below the line
Footer : Never change the footer text on individual slides. Change, turn on or off Data color order: Complimentary colors:
Platts
Colors:
Estimated Weather-Impact on Demand in Selected European Markets
Weather-Impact Demand as % of Avg. Demand
Data from PIRA’s daily demand model
France, Jan-17
Italy, Jan-17
-20%
-15%
-10%
-5%
0%
5%
10%
15%
Jan-06 Jan-07 Jan-08 Jan-09 Jan-10 Jan-11 Jan-12 Jan-13 Jan-14 Jan-15 Jan-16 Jan-17
France Germany Italy
Bulgaria, Jan-17Romania, Jan-17
-20%
-15%
-10%
-5%
0%
5%
10%
15%
Jan-06 Jan-07 Jan-08 Jan-09 Jan-10 Jan-11 Jan-12 Jan-13 Jan-14 Jan-15 Jan-16 Jan-17
Bulgaria Romania
No content below the line
Footer : Never change the footer text on individual slides. Change, turn on or off Data color order: Complimentary colors:
Platts
Colors:
Estimated Weather-Impact on Demand in Selected European Markets
Average GW
Data from PIRA’s daily demand model
Month
France: Jan. 2017, 5.4
IT: Jan. 2017, 0.4
-8
-6
-4
-2
0
2
4
6
8
10
12 France
Germany
Italy
Bulgaria: Jan. 2017, 0.40
Romania:Jan. 2017
0.23
-1
-0.8
-0.6
-0.4
-0.2
0
0.2
0.4
0.6
Bulgaria
Romania
DG ENERGY | EU ELECTRICITY MARKETS IN JAN AND FEB 2017
DECEMBER 20, 2017
14
Chapter 2. Assessing the Impact of Non-Market Measures Introduced to Face the Cold Spell of Jan. 2017
The severe weather conditions led to the announcement of a number of extraordinary measures deemed necessary to safeguard the systems, as a result of the widening imbalances between surging demand and available generating capacities.
In Bulgaria, order 16-64 of Jan. 11, 2017 was issued by the Minister of Energy imposing on the Electricity System Operator (ESO) “an additional public service obligation consisting of the termination of access to the electricity transmission network of users exporting electricity generated in the country for the period from 01:00 on 13 January 2017 until the reserves necessary for the operation of Bulgaria’s electricity system have been restored.” The Deputy Minister for Energy was appointed in charge to supervise the implementation of this order. The measure resulted in suspension of the cross-border capacity allocation for exports through Feb. 9, 2017.
In Greece, curtailment of export capacity for two days, for Jan. 11 and 12 2017.
In Romania, the Government Decision no. 10 of Jan. 13, 2017 related to “Safeguard Measures in the Romanian Energy Market” introduced the possibility of applying extraordinary measures, including a reduction of interconnection capacity, curtailment of exports and load limitations to industrial clients. However, none of these measures were actually implemented.
Capacity from France to Spain was reduced for the peak hours from Jan. 14 to Jan. 20 to ensure operations remained within operational security limits in observations. The French representatives also highlighted that France took actions to increase the French import capacity from Spain between Jan. 17 and Jan. 20 in order to face tighter conditions in France.
In Italy, curtailments of exports capacities towards France for a few hours on January 18 and 19 were implemented.
This list of extraordinary measures is also consistent with the ENTSO-E Presentation Winter Outlook 2016/2017 follow-up by the Electricity Coordination Group (Feb. 14, slide 8) and other stakeholder inputs. A closer review of the Platts European Power Daily bulletins for the period Jan. 1 through Feb. 15, 2017 did not highlight other major measures signaled by market participants significantly impacting market dynamics and cross-border flows.
DG ENERGY | EU ELECTRICITY MARKETS IN JAN AND FEB 2017
DECEMBER 20, 2017
15
Bulgaria’s Ban on Exports
The Bulgarian ban on exports was issued on Jan. 11 and
implemented on Jan. 13 “in order to prevent any disruption
in the supply of electricity in Bulgaria owing to the
prolonged extreme winter conditions resulting in a shortfall
in generating capacity, including at regional level”6.
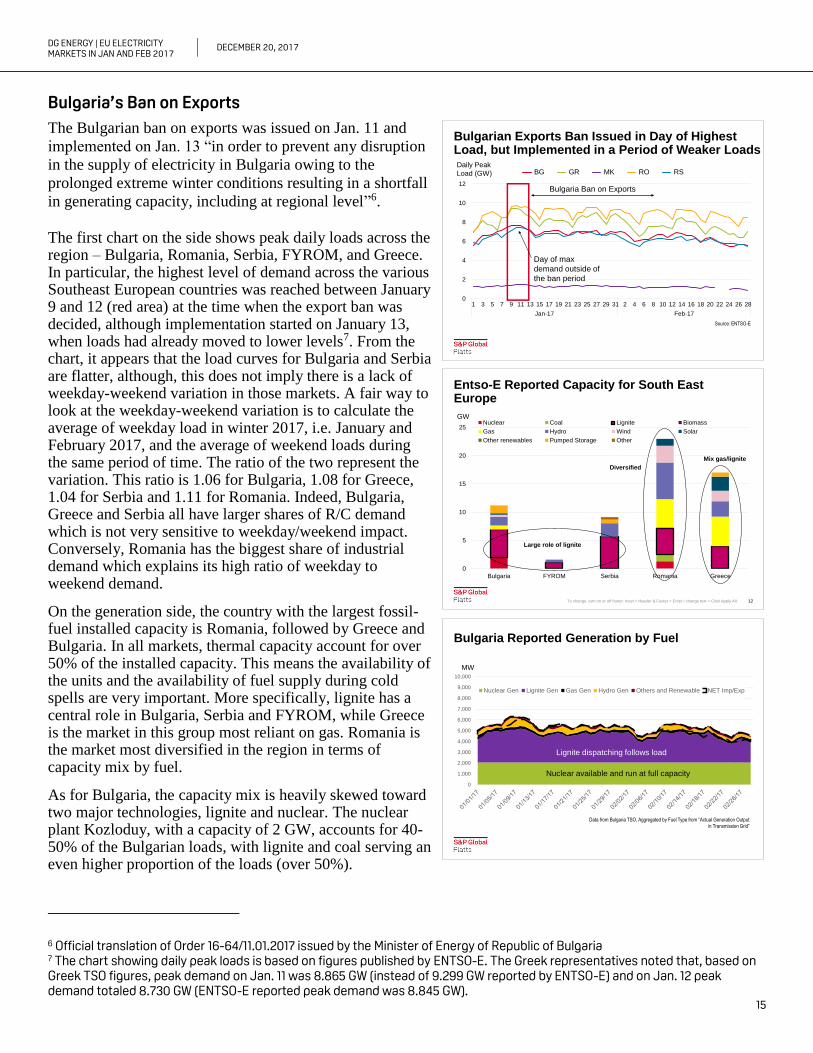
The first chart on the side shows peak daily loads across the region – Bulgaria, Romania, Serbia, FYROM, and Greece. In particular, the highest level of demand across the various Southeast European countries was reached between January 9 and 12 (red area) at the time when the export ban was decided, although implementation started on January 13, when loads had already moved to lower levels7. From the chart, it appears that the load curves for Bulgaria and Serbia are flatter, although, this does not imply there is a lack of weekday-weekend variation in those markets. A fair way to look at the weekday-weekend variation is to calculate the average of weekday load in winter 2017, i.e. January and February 2017, and the average of weekend loads during the same period of time. The ratio of the two represent the variation. This ratio is 1.06 for Bulgaria, 1.08 for Greece, 1.04 for Serbia and 1.11 for Romania. Indeed, Bulgaria, Greece and Serbia all have larger shares of R/C demand which is not very sensitive to weekday/weekend impact. Conversely, Romania has the biggest share of industrial demand which explains its high ratio of weekday to weekend demand.
On the generation side, the country with the largest fossil-fuel installed capacity is Romania, followed by Greece and Bulgaria. In all markets, thermal capacity account for over 50% of the installed capacity. This means the availability of the units and the availability of fuel supply during cold spells are very important. More specifically, lignite has a central role in Bulgaria, Serbia and FYROM, while Greece is the market in this group most reliant on gas. Romania is the market most diversified in the region in terms of capacity mix by fuel.
As for Bulgaria, the capacity mix is heavily skewed toward two major technologies, lignite and nuclear. The nuclear plant Kozloduy, with a capacity of 2 GW, accounts for 40-50% of the Bulgarian loads, with lignite and coal serving an even higher proportion of the loads (over 50%).
6 Official translation of Order 16-64/11.01.2017 issued by the Minister of Energy of Republic of Bulgaria 7 The chart showing daily peak loads is based on figures published by ENTSO-E. The Greek representatives noted that, based on Greek TSO figures, peak demand on Jan. 11 was 8.865 GW (instead of 9.299 GW reported by ENTSO-E) and on Jan. 12 peak demand totaled 8.730 GW (ENTSO-E reported peak demand was 8.845 GW).
No content below the line
Footer : Never change the footer text on individual slides. Change, turn on or off Data color order: Complimentary colors:
Platts
Colors:
Entso-E Reported Capacity for South East Europe
To change, turn on or off footer: Inset > Header & Footer > Enter / change text > Click Apply All. 12
0
5
10
15
20
25
Bulgaria FYROM Serbia Romania Greece
Nuclear Coal Lignite Biomass
Gas Hydro Wind Solar
Other renewables Pumped Storage Other
Large role of lignite
Diversified
GW
Mix gas/lignite
No content below the line
Footer : Never change the footer text on individual slides. Change, turn on or off Data color order: Complimentary colors:
Platts
Colors:
Bulgarian Exports Ban Issued in Day of Highest Load, but Implemented in a Period of Weaker Loads
0
2
4
6
8
10
12
1 3 5 7 9 11 13 15 17 19 21 23 25 27 29 31 2 4 6 8 10 12 14 16 18 20 22 24 26 28
Jan-17 Feb-17
BG GR MK RO RSDaily Peak
Load (GW)
Bulgaria Ban on Exports
Day of max
demand outside of
the ban period
Source: ENTSO-E
No content below the line
Footer : Never change the footer text on individual slides. Change, turn on or off Data color order: Complimentary colors:
Platts
Colors:
Bulgaria Reported Generation by Fuel
0
1,000
2,000
3,000
4,000
5,000
6,000
7,000
8,000
9,000
10,000
Nuclear Gen Lignite Gen Gas Gen Hydro Gen Others and Renewable NET Imp/Exp
Lignite dispatching follows load
MW
Nuclear available and run at full capacity
Data from Bulgaria TSO, Aggregated by Fuel Type from “Actual Generation Output
in Transmission Grid”
DG ENERGY | EU ELECTRICITY MARKETS IN JAN AND FEB 2017
DECEMBER 20, 2017
16
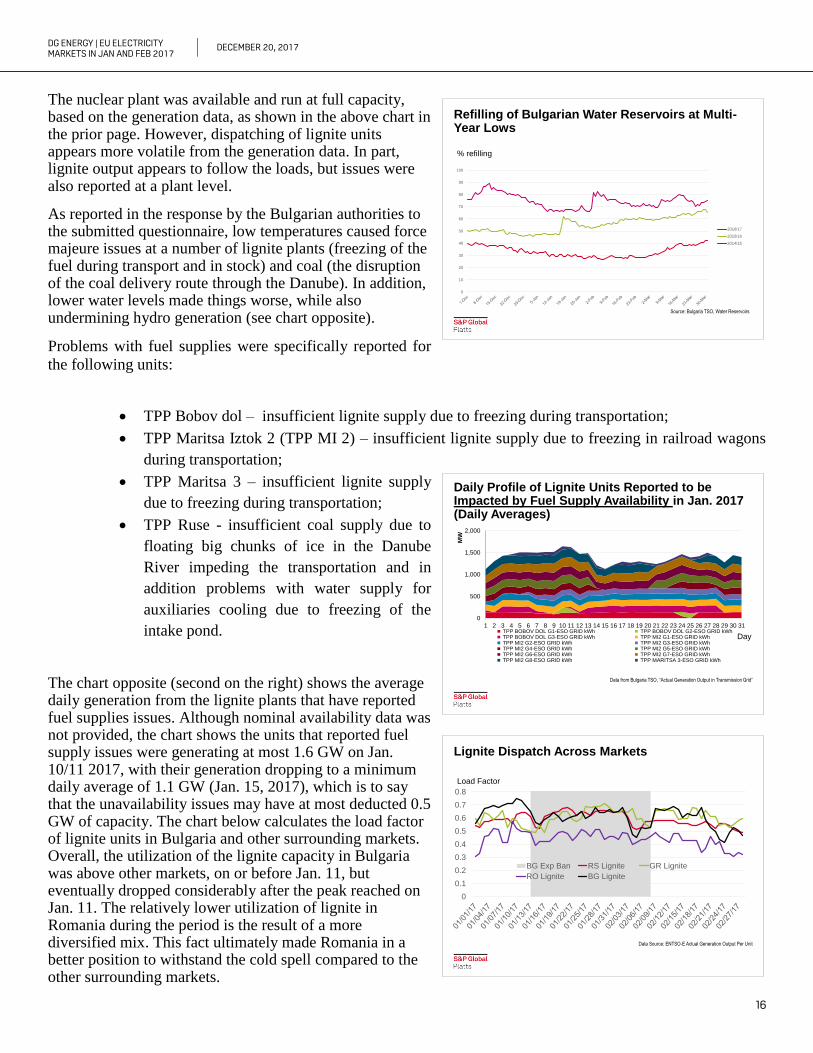
The nuclear plant was available and run at full capacity, based on the generation data, as shown in the above chart in the prior page. However, dispatching of lignite units appears more volatile from the generation data. In part, lignite output appears to follow the loads, but issues were also reported at a plant level.
As reported in the response by the Bulgarian authorities to the submitted questionnaire, low temperatures caused force majeure issues at a number of lignite plants (freezing of the fuel during transport and in stock) and coal (the disruption of the coal delivery route through the Danube). In addition, lower water levels made things worse, while also undermining hydro generation (see chart opposite).
Problems with fuel supplies were specifically reported for
the following units:
TPP Bobov dol – insufficient lignite supply due to freezing during transportation;
TPP Maritsa Iztok 2 (TPP MI 2) – insufficient lignite supply due to freezing in railroad wagons
during transportation;
TPP Maritsa 3 – insufficient lignite supply
due to freezing during transportation;
TPP Ruse - insufficient coal supply due to
floating big chunks of ice in the Danube
River impeding the transportation and in
addition problems with water supply for
auxiliaries cooling due to freezing of the
intake pond.
The chart opposite (second on the right) shows the average daily generation from the lignite plants that have reported fuel supplies issues. Although nominal availability data was not provided, the chart shows the units that reported fuel supply issues were generating at most 1.6 GW on Jan. 10/11 2017, with their generation dropping to a minimum daily average of 1.1 GW (Jan. 15, 2017), which is to say that the unavailability issues may have at most deducted 0.5 GW of capacity. The chart below calculates the load factor of lignite units in Bulgaria and other surrounding markets. Overall, the utilization of the lignite capacity in Bulgaria was above other markets, on or before Jan. 11, but eventually dropped considerably after the peak reached on Jan. 11. The relatively lower utilization of lignite in Romania during the period is the result of a more diversified mix. This fact ultimately made Romania in a better position to withstand the cold spell compared to the other surrounding markets.
No content below the line
Footer : Never change the footer text on individual slides. Change, turn on or off Data color order: Complimentary colors:
Platts
Colors:
Daily Profile of Lignite Units Reported to be Impacted by Fuel Supply Availability in Jan. 2017 (Daily Averages)
0
500
1,000
1,500
2,000
1 2 3 4 5 6 7 8 9 10 11 12 13 14 15 16 17 18 19 20 21 22 23 24 25 26 27 28 29 30 31
MW
TPP BOBOV DOL G1-ESO GRID kWh TPP BOBOV DOL G2-ESO GRID kWh TPP BOBOV DOL G3-ESO GRID kWh TPP MI2 G1-ESO GRID kWh TPP MI2 G2-ESO GRID kWh TPP MI2 G3-ESO GRID kWh TPP MI2 G4-ESO GRID kWh TPP MI2 G5-ESO GRID kWh TPP MI2 G6-ESO GRID kWh TPP MI2 G7-ESO GRID kWh TPP MI2 G8-ESO GRID kWh TPP MARITSA 3-ESO GRID kWh
Day
Data from Bulgaria TSO, “Actual Generation Output in Transmission Grid”
No content below the line
Footer : Never change the footer text on individual slides. Change, turn on or off Data color order: Complimentary colors:
Platts
Colors:
Lignite Dispatch Across Markets
0
0.1
0.2
0.3
0.4
0.5
0.6
0.7
0.8
BG Exp Ban RS Lignite GR Lignite
RO Lignite BG Lignite
Load Factor
Data Source: ENTSO-E Actual Generation Output Per Unit
No content below the line
Footer : Never change the footer text on individual slides. Change, turn on or off Data color order: Complimentary colors:
Platts
Colors:
Refilling of Bulgarian Water Reservoirs at Multi-Year Lows
0
10
20
30
40
50
60
70
80
90
100
2016/17
2015/16
2014/15
% refilling
Source: Bulgaria TSO, Water Reservoirs

DG ENERGY | EU ELECTRICITY MARKETS IN JAN AND FEB 2017
DECEMBER 20, 2017
17
With the availability of the lignite impacted by unforeseen circumstances, the capability to cope with the cold spell was reduced from the Bulgarian standpoint. Bulgaria had contracted extra 30 MW reserve capacity compared to the past two winters. The full contracted capacity was available except on selected days in mid to late February, indicating no major unavailability. As shown in the chart opposite, for the first time in the past three years, Bulgaria activated the full contracted capacity cold reserve in response to the cold spell from Jan. 8 to Jan. 26. The actual used cold reserve reached 92% of available capacity on Jan. 27.
Other than the activation of the cold reserve, the Bulgarian representatives indicated that the Bulgarian TSO implemented load shaving measures to reduce the domestic demand:
The number of autotransformers and transformers in operation was optimized resulting in a reduction of the load by around 20 MW;
The medium voltage of the buses in the substations was reduced by 3 to 5% without affecting the quality of supplied electricity to the end-users, including the distribution companies. As a result, the electrical load was reduced by more than 250MW;
Finally, following a suggestion by the Maritsa Iztok mining complex, the wheel excavators were put out of operation from 17:00 to 23:00 without interruption of coal supply. As a result, the electrical load was reduced by up to 60 MW.
However, in spite of these measures, the Bulgarian representatives warned that the reliability of the power system was largely dependent upon the NPP Kozloduy unit – which would have been more difficult to replace, in case of failure.
Additionally, assistance from neighboring TSOs was deemed insufficient from the Bulgarian standpoint. Bulgaria was overall in a large net exporting position in the days before the implementation of the export ban, with only modest flows reported from Romania to Bulgaria. Finally, Greece implemented a cut on export capacity on Jan. 11, which further limited the ability of Bulgaria to meet its domestic loads. In other words, any potential supply shortage in Bulgaria had to be balanced by emergency imports from Greece, Turkey, Serbia and, to a minor extent, FYROM, which were experiencing similar tight conditions. The ban on exports was therefore seen as a preventive measure in the policy maker’s view. The charts below show the commercial net import-export flows between Bulgaria and the surrounding markets on a daily basis during January and February. As shown, the ban has mostly affected the exports to Greece and, to a lower extent, Romania. As seen more clearly in the table in next page, before the export ban, i.e. up to January 12, Greece was the country importing the most from Bulgaria.
No content below the line
Footer : Never change the footer text on individual slides. Change, turn on or off Data color order: Complimentary colors:
Platts
Colors:
Bulgaria Contracted/Activated and Used Cold Reserve – 2017 Vs. Prior Winters
010509131721252902061014182226
01 02
2016
010509131721252902061014182226
01 02
2017
Average of Contracted
Average of Available
Average of Activated
Average of Used
0
100
200
300
400
500
600
010509131721252902061014182226
01 02
2015
Data Source: “Actual Available and Activated and Used Cold Reserve” provided by Bulgaria TSO
DG ENERGY | EU ELECTRICITY MARKETS IN JAN AND FEB 2017
DECEMBER 20, 2017
18
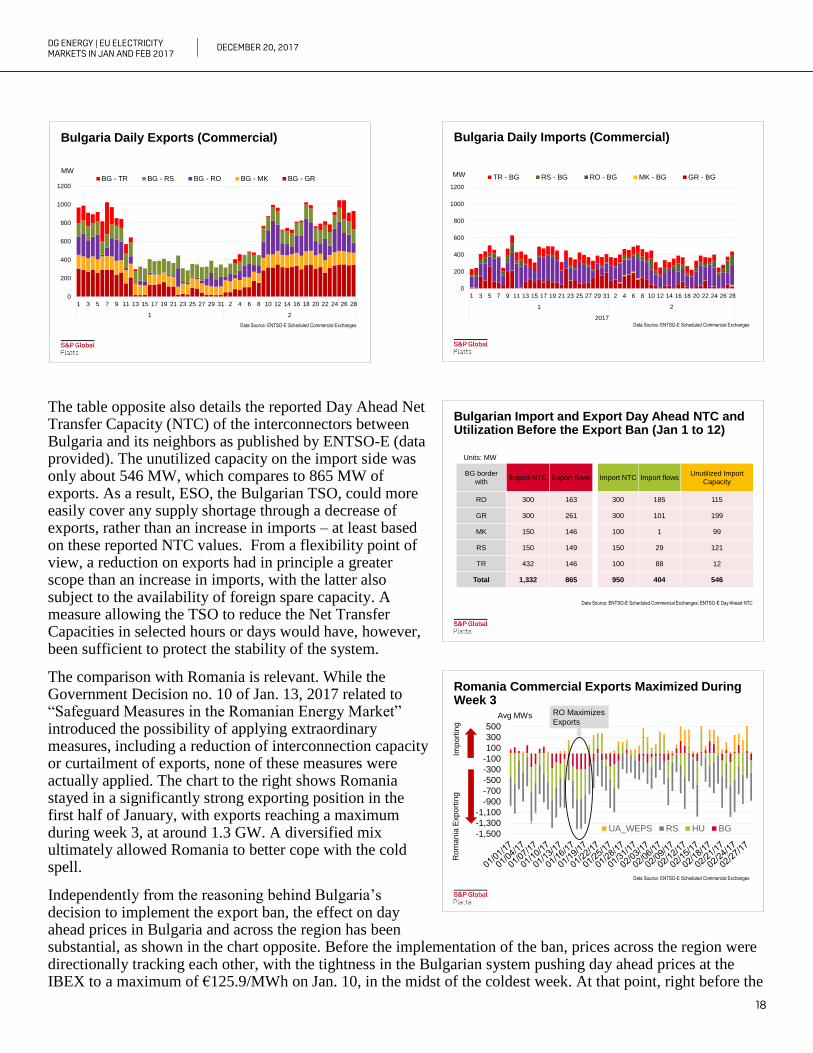
The table opposite also details the reported Day Ahead Net Transfer Capacity (NTC) of the interconnectors between Bulgaria and its neighbors as published by ENTSO-E (data provided). The unutilized capacity on the import side was only about 546 MW, which compares to 865 MW of exports. As a result, ESO, the Bulgarian TSO, could more easily cover any supply shortage through a decrease of exports, rather than an increase in imports – at least based on these reported NTC values. From a flexibility point of view, a reduction on exports had in principle a greater scope than an increase in imports, with the latter also subject to the availability of foreign spare capacity. A measure allowing the TSO to reduce the Net Transfer Capacities in selected hours or days would have, however, been sufficient to protect the stability of the system.
The comparison with Romania is relevant. While the Government Decision no. 10 of Jan. 13, 2017 related to “Safeguard Measures in the Romanian Energy Market” introduced the possibility of applying extraordinary measures, including a reduction of interconnection capacity or curtailment of exports, none of these measures were actually applied. The chart to the right shows Romania stayed in a significantly strong exporting position in the first half of January, with exports reaching a maximum during week 3, at around 1.3 GW. A diversified mix ultimately allowed Romania to better cope with the cold spell.
Independently from the reasoning behind Bulgaria’s decision to implement the export ban, the effect on day ahead prices in Bulgaria and across the region has been substantial, as shown in the chart opposite. Before the implementation of the ban, prices across the region were directionally tracking each other, with the tightness in the Bulgarian system pushing day ahead prices at the IBEX to a maximum of €125.9/MWh on Jan. 10, in the midst of the coldest week. At that point, right before the
No content below the line
Footer : Never change the footer text on individual slides. Change, turn on or off Data color order: Complimentary colors:
Platts
Colors:
Bulgaria Daily Exports (Commercial)
0
200
400
600
800
1000
1200
1 3 5 7 9 11 13 15 17 19 21 23 25 27 29 31 2 4 6 8 10 12 14 16 18 20 22 24 26 28
1 2
BG - TR BG - RS BG - RO BG - MK BG - GRMW
Data Source: ENTSO-E Scheduled Commercial Exchanges
No content below the line
Footer : Never change the footer text on individual slides. Change, turn on or off Data color order: Complimentary colors:
Platts
Colors:
Bulgaria Daily Imports (Commercial)
0
200
400
600
800
1000
1200
1 3 5 7 9 11 13 15 17 19 21 23 25 27 29 31 2 4 6 8 10 12 14 16 18 20 22 24 26 28
1 2
2017
TR - BG RS - BG RO - BG MK - BG GR - BGMW
Data Source: ENTSO-E Scheduled Commercial Exchanges
No content below the line
Footer : Never change the footer text on individual slides. Change, turn on or off Data color order: Complimentary colors:
Platts
Colors:
Bulgarian Import and Export Day Ahead NTC and Utilization Before the Export Ban (Jan 1 to 12)
BG border
withExport NTC Export flows Import NTC Import flows
Unutilized Import
Capacity
RO 300 163 300 185 115
GR 300 261 300 101 199
MK 150 146 100 1 99
RS 150 149 150 29 121
TR 432 146 100 88 12
Total 1,332 865 950 404 546
Units: MW
Data Source: ENTSO-E Scheduled Commercial Exchanges; ENTSO-E Day Ahead NTC
No content below the line
Footer : Never change the footer text on individual slides. Change, turn on or off Data color order: Complimentary colors:
Platts
Colors:
Romania Commercial Exports Maximized During Week 3
-1,500
-1,300
-1,100
-900
-700
-500
-300
-100
100
300
500
UA_WEPS RS HU BG
Ro
ma
nia
Exp
ort
ing
Imp
ort
ing
Data Source: ENTSO-E Scheduled Commercial Exchanges
Avg MWs RO Maximizes
Exports

DG ENERGY | EU ELECTRICITY MARKETS IN JAN AND FEB 2017
DECEMBER 20, 2017
19
implementation of the ban, Serbia also observed spot prices as high as €151/MWh, tracking another major regional hub – Hungary – which settled at €150 on Jan. 11, 2017. This is when demand across all the markets was at maximum levels (see again chart on page 15).
However, as Bulgaria starts implementing the export ban, Bulgarian day ahead prices diverged quite substantially from their counterparts. Bulgaria ultimately priced above Romania before the export ban, but as the export ban was implemented, Bulgarian prices shifted more significantly below, with the spread averaging almost €35/MWh against Romania and €32.7/MWh versus Greece. This shift indicates that the Bulgarian system was more comfortably meeting its domestic loads, especially as weather warmed up. The plants’ unavailability in the system (e.g. due to frozen lignite/coal) was not large enough to tighten the system when the ban was implemented, as this would have been reflected in higher Bulgarian power prices than those actually observed, leading to a narrower spread with its counterparts. The other markets were indeed experiencing tightness in the period when the Bulgarian ban was implemented. In fact, Hungarian day ahead prices, a benchmark in Central-Eastern Europe, averaged €84/MWh, with several days settling in proximity and above €100/MWh, a a level closer to the marginal costs of oil units and a clear sign that the available thermal capacities were getting fully utilized.
The chart opposite shows the daily average demand in Bulgaria (x-axis) for the past two winters, and actual exports on the y-axis. Bulgaria is typically a net exporter during the winter, but the amount of exports tend to fluctuate with the domestic demand and other fundamental factors (such as plants availability, market conditions in neighboring markets). The black dots in the chart represent the days when the export ban was implemented. Given the level of demand in those days, Bulgarian exports would have been on the order of 300 to 1000 MW/day, based on prior winter observations (see points in the red square). As shown in the table on the prior page, the NTC from Bulgaria to Greece and Bulgaria to Romania are both reported at 300 MW, while the NTC from Bulgaria to Turkey is a bit more than 400 MW, totaling in excess of 1 GW. The data provided showed that an average of 127 MW was flowing out of Bulgaria, even during the export ban. Taking these flows into account, in principle, up to 900 MW of additional exports could be achieved, all other things being equal.
No content below the line
Footer : Never change the footer text on individual slides. Change, turn on or off Data color order: Complimentary colors:
Platts
Colors:
Day Ahead Power Prices in South-East Europe: Bulgarian Prices Diverge As Export Ban Implemented
0
20
40
60
80
100
120
140
160
During BG Export Ban
Day ahead prices (Euro/MWh)
0
20
40
60
80
100
120
140
160
BG Spot RO Spot
HU Spot RS Spot
GR Spot
Before BG Export Ban
Prices reflecting
scarcity in the region,
not in BG
Data Source: Power Exchange Prices
No content below the line
Footer : Never change the footer text on individual slides. Change, turn on or off Data color order: Complimentary colors:
Platts
Colors:
BG Export Ban: Losses of 0.3 to 1 GW/day of Exports to Surrounding Markets
-1,200
-1,000
-800
-600
-400
-200
0
200
3,000 3,500 4,000 4,500 5,000 5,500 6,000 6,500
BG Imp/Exp MW
Avg Demand in BG MWs
2015/16 Winter 2016/17 Winter BG 2017 Exp Ban
BG
EX
PO
RT
ING
Export in this
demand range is
0.3 to 1 GW
Data Source: ENTSO-E Scheduled Commercial Exchanges;
Actual Total Load in Transmission Grid provided by Bulgaria TSO

DG ENERGY | EU ELECTRICITY MARKETS IN JAN AND FEB 2017
DECEMBER 20, 2017
20
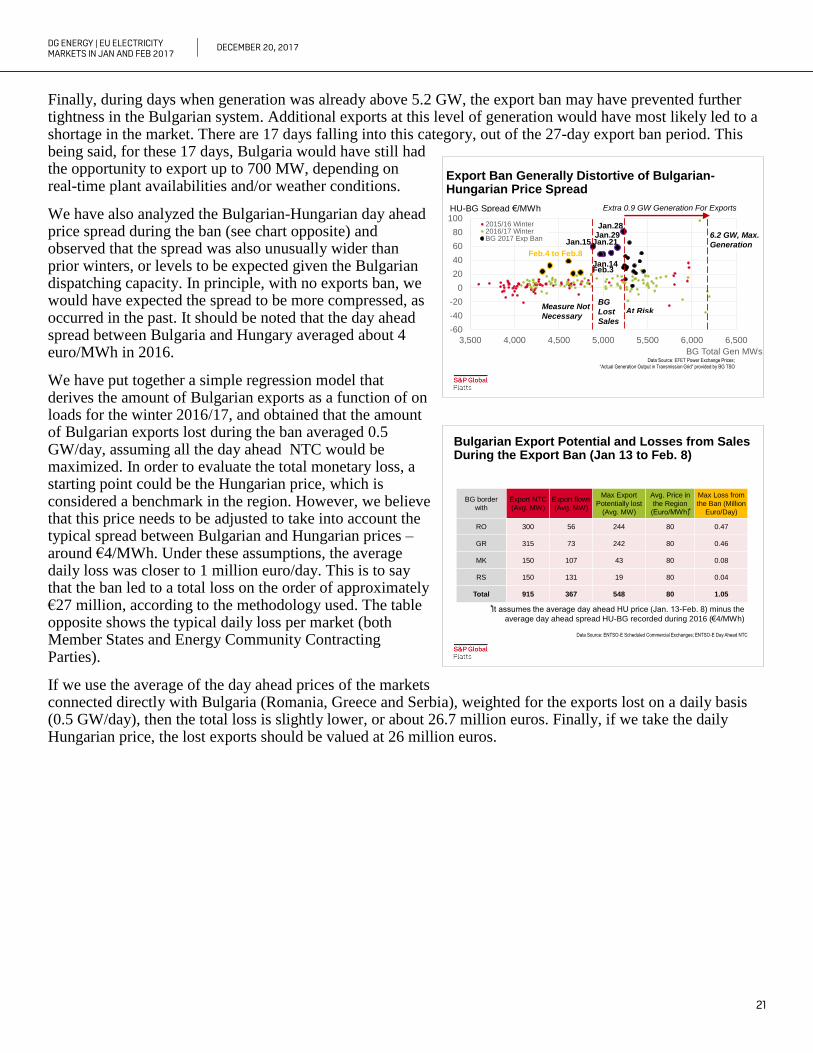
In order to evaluate the costs of the extraordinary and intrusive measure implemented by Bulgaria, we have looked closely at the day ahead price spread between Bulgaria and Greece, as this market was the most impacted by the lack of Bulgarian exports8. The chart opposite shows the Bulgarian average daily generation against the daily price spread between Bulgaria and Greece. As shown, the higher the call on Bulgarian plants, the narrower the price spread between the two markets. In days when the utilization of the Bulgarian fleet is higher than 6 GW, the spread can turn into negative territory – as Bulgaria would be dispatching more expensive units.
The impact of the export ban when Bulgarian generation was below 4.8 GW was more muted, as domestic demand was not high enough in those days, and the spread between realized Bulgarian and Greek prices was already on the same order of magnitude than in prior winters (€20/MWh or so). Specifically, during the last days of the ban period, from Feb. 4 to Feb. 8, total generation was generally below 4.8 GW and the price spread between GR and BG is on average approximately €27 /MWh, according to the methodology used. These spreads should be seen as normal, given the level of demand and generation. Even assuming that Bulgarian exports would have increased by an additional 0.9 GW, then prices in Bulgaria would have probably still settled some €20/MWh below Greece. In other words, we do not think the export ban was necessary in those days, as the market was not tight.
However, the measure was particularly distortive in the days when average dispatching of Bulgarian plants was between 4.8 to 5.2 GW. In those days, the spread between Bulgaria and Greek prices was unusually wide, given prior winters’ observations, suggesting the Bulgarian system was artificially oversupplied. In those days, Bulgarian plants lost the opportunity to sell their power to neighboring countries given there was enough generation capacity and the price spread was larger than historical levels. Again, if plant unavailability was critically high, then the price spread would not have been as wide. Higher than normal plant unavailability would have required the dispatching of more expensive marginal units domestically, resulting in higher Bulgarian prices. Even if Bulgaria had increased its exports to full capacity, or by 0.9 GW, total generation would have been closer to the maximum level, 6.2 GW. In those days, the measure led to revenue losses for the plant operators.
8 The scope of the report is to evaluate the costs of the non-market measures, especially in form of disruption of day ahead flows, trading and prices. As such, the day ahead price is the most logical benchmark to use to estimate the costs of these measures, although there may be additional ways to estimate the costs. Also, as shown in table and charts on page 18, Greece was importing the largest amount of power from Bulgaria before the export ban.
No content below the line
Footer : Never change the footer text on individual slides. Change, turn on or off Data color order: Complimentary colors:
Platts
Colors:
Bulgaria-Greece Spread Vs. Bulgaria Generation: Spread Narrows as BG Stack Fully Dispatched
-80
-60
-40
-20
0
20
40
60
80
3,500 4,000 4,500 5,000 5,500 6,000 6,500
BG Total Gen MWs
2015/16 Winter
2016/17 Winter
BG 2017 Exp Ban
GR-BG Spread €/MWh
6.2 GW, Max.
At RiskMeasure Not
Necessary
BG
Lost
Sales
Extra 0.9 GW Generation For Exports
Data Source: Power Exchange Prices;
“Actual Generation Output in Transmission Grid” provided by BG TSO
Jan.15
Jan.14Feb.3
Jan.21
Jan.29Jan.28
Feb.4 to Feb.8
DG ENERGY | EU ELECTRICITY MARKETS IN JAN AND FEB 2017
DECEMBER 20, 2017
21
Finally, during days when generation was already above 5.2 GW, the export ban may have prevented further tightness in the Bulgarian system. Additional exports at this level of generation would have most likely led to a shortage in the market. There are 17 days falling into this category, out of the 27-day export ban period. This being said, for these 17 days, Bulgaria would have still had the opportunity to export up to 700 MW, depending on real-time plant availabilities and/or weather conditions.
We have also analyzed the Bulgarian-Hungarian day ahead price spread during the ban (see chart opposite) and observed that the spread was also unusually wider than prior winters, or levels to be expected given the Bulgarian dispatching capacity. In principle, with no exports ban, we would have expected the spread to be more compressed, as occurred in the past. It should be noted that the day ahead spread between Bulgaria and Hungary averaged about 4 euro/MWh in 2016.
We have put together a simple regression model that derives the amount of Bulgarian exports as a function of on loads for the winter 2016/17, and obtained that the amount of Bulgarian exports lost during the ban averaged 0.5 GW/day, assuming all the day ahead NTC would be maximized. In order to evaluate the total monetary loss, a starting point could be the Hungarian price, which is considered a benchmark in the region. However, we believe that this price needs to be adjusted to take into account the typical spread between Bulgarian and Hungarian prices – around €4/MWh. Under these assumptions, the average daily loss was closer to 1 million euro/day. This is to say that the ban led to a total loss on the order of approximately €27 million, according to the methodology used. The table opposite shows the typical daily loss per market (both Member States and Energy Community Contracting Parties).
If we use the average of the day ahead prices of the markets connected directly with Bulgaria (Romania, Greece and Serbia), weighted for the exports lost on a daily basis (0.5 GW/day), then the total loss is slightly lower, or about 26.7 million euros. Finally, if we take the daily Hungarian price, the lost exports should be valued at 26 million euros.
No content below the line
Footer : Never change the footer text on individual slides. Change, turn on or off Data color order: Complimentary colors:
Platts
Colors:
Export Ban Generally Distortive of Bulgarian-Hungarian Price Spread
-60
-40
-20
0
20
40
60
80
100
3,500 4,000 4,500 5,000 5,500 6,000 6,500
BG Total Gen MWs
2015/16 Winter2016/17 WinterBG 2017 Exp Ban
HU-BG Spread €/MWh
6.2 GW, Max.
Generation
At RiskMeasure Not
Necessary
BG
Lost
Sales
Feb.4 to Feb.8
Jan.15
Jan.14Feb.3
Jan.21Jan.29Jan.28
Data Source: EFET Power Exchange Prices;
“Actual Generation Output in Transmission Grid” provided by BG TSO
Extra 0.9 GW Generation For Exports
No content below the line
Footer : Never change the footer text on individual slides. Change, turn on or off Data color order: Complimentary colors:
Platts
Colors:
Bulgarian Export Potential and Losses from Sales During the Export Ban (Jan 13 to Feb. 8)
BG border
with
Export NTC
(Avg. MW)
Export flows
(Avg. MW)
Max Export
Potentially lost
(Avg. MW)
Avg. Price in
the Region
(Euro/MWh)
Max Loss from
the Ban (Million
Euro/Day)
RO 300 56 244 80 0.47
GR 315 73 242 80 0.46
MK 150 107 43 80 0.08
RS 150 131 19 80 0.04
Total 915 367 548 80 1.05
It assumes the average day ahead HU price (Jan. 13-Feb. 8) minus the
average day ahead spread HU-BG recorded during 2016 (€4/MWh)
Data Source: ENTSO-E Scheduled Commercial Exchanges; ENTSO-E Day Ahead NTC
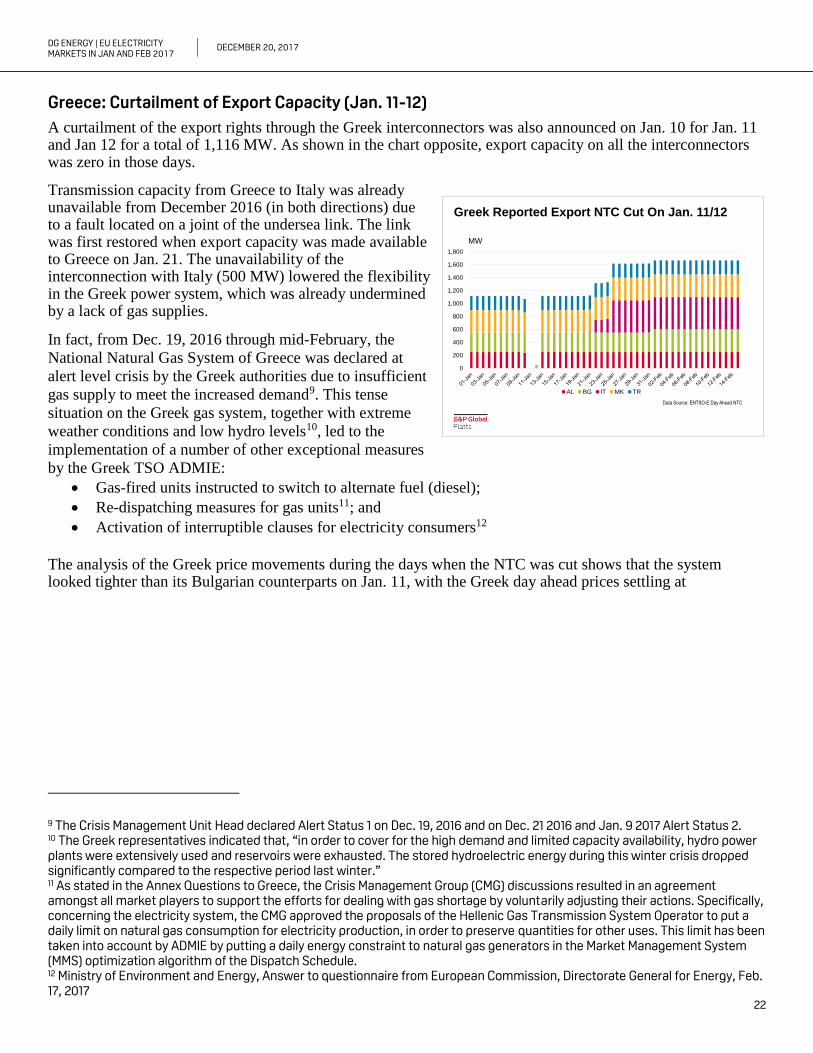
DG ENERGY | EU ELECTRICITY MARKETS IN JAN AND FEB 2017
DECEMBER 20, 2017
22
Greece: Curtailment of Export Capacity (Jan. 11-12)
A curtailment of the export rights through the Greek interconnectors was also announced on Jan. 10 for Jan. 11 and Jan 12 for a total of 1,116 MW. As shown in the chart opposite, export capacity on all the interconnectors was zero in those days.
Transmission capacity from Greece to Italy was already unavailable from December 2016 (in both directions) due to a fault located on a joint of the undersea link. The link was first restored when export capacity was made available to Greece on Jan. 21. The unavailability of the interconnection with Italy (500 MW) lowered the flexibility in the Greek power system, which was already undermined by a lack of gas supplies.
In fact, from Dec. 19, 2016 through mid-February, the
National Natural Gas System of Greece was declared at
alert level crisis by the Greek authorities due to insufficient
gas supply to meet the increased demand9. This tense
situation on the Greek gas system, together with extreme
weather conditions and low hydro levels10, led to the
implementation of a number of other exceptional measures
by the Greek TSO ADMIE:
Gas-fired units instructed to switch to alternate fuel (diesel);
Re-dispatching measures for gas units11; and
Activation of interruptible clauses for electricity consumers12
The analysis of the Greek price movements during the days when the NTC was cut shows that the system looked tighter than its Bulgarian counterparts on Jan. 11, with the Greek day ahead prices settling at
9 The Crisis Management Unit Head declared Alert Status 1 on Dec. 19, 2016 and on Dec. 21 2016 and Jan. 9 2017 Alert Status 2. 10 The Greek representatives indicated that, “in order to cover for the high demand and limited capacity availability, hydro power plants were extensively used and reservoirs were exhausted. The stored hydroelectric energy during this winter crisis dropped significantly compared to the respective period last winter.” 11 As stated in the Annex Questions to Greece, the Crisis Management Group (CMG) discussions resulted in an agreement amongst all market players to support the efforts for dealing with gas shortage by voluntarily adjusting their actions. Specifically, concerning the electricity system, the CMG approved the proposals of the Hellenic Gas Transmission System Operator to put a daily limit on natural gas consumption for electricity production, in order to preserve quantities for other uses. This limit has been taken into account by ADMIE by putting a daily energy constraint to natural gas generators in the Market Management System (MMS) optimization algorithm of the Dispatch Schedule. 12 Ministry of Environment and Energy, Answer to questionnaire from European Commission, Directorate General for Energy, Feb. 17, 2017
No content below the line
Footer : Never change the footer text on individual slides. Change, turn on or off Data color order: Complimentary colors:
Platts
Colors:
Greek Reported Export NTC Cut On Jan. 11/12
0
200
400
600
800
1,000
1,200
1,400
1,600
1,800
AL BG IT MK TR
MW
Data Source: ENTSO-E Day Ahead NTC

DG ENERGY | EU ELECTRICITY MARKETS IN JAN AND FEB 2017
DECEMBER 20, 2017
23
€59.95/MWh versus €53.05/MWh at the IBEX. The tightness in the Greek system is also reflected in the direction of the flow, with Greece importing from Bulgaria 144 MW.
However, the situation changes on Jan. 12, as the Greek market settles €37.32 below Bulgaria, while the flow remains in the direction of Greece (209 MW). The chart opposite shows the import-export flows for Greece, compared to the price spread for Greece vs. Bulgaria.
In other words, the decision to cut the export capacity to zero on Jan. 12 was not in line with the market realities, as the Greek prices (SMP) implied that the Greek system was better able to cope that day. While we look at the hourly profile, Greek on-peak prices stayed in both days well below Bulgaria at on-peak hours, settling at levels that hardly reflect any significant scarcity. The hourly prices for the SUD zone in Italy are shown as a theoretical comparison, since the Italian-Greek interconnector was not available at the time for both import and exports, but nevertheless provide additional evidence that the Greek system was not particularly tight.
While the Greek authorities have reported that three gas units (1,174 MW) were forced to switch to oil, surprisingly, a switch to oil products is not priced into the power prices in those days. If we assume diesel prices (GO 0.1%S) in the MED region averaged $64/BBL in January and $60/BBL in 4Q 2016, this should have implied power prices in the €100 - €150/MWh order of magnitude. While the Greek representatives have highlighted that the Variable Cost Recovery Mechanism in effect in Greece prevented day ahead prices from moving higher, it’s interesting to note that there were still 150 hours priced above €100/MWh during January, with none of those settlements occurred on Jan. 11 and Jan. 12, which were the days when the extraordinary and intrusive measures were implemented.
Finally, the prices do not reflect any of the other extraordinary measures, more specifically the Value of Lost Load (VoLL), or the estimated amount that customers would be willing to pay to avoid a disruption in their electricity service. It was specifically stated that 577 MW of interruptible customers were instructed to reduce their load (with a two hours-notice, for 48 hours). Given the short notice, it’s understandable that this was not factored in prices for Jan. 11, but it’s surprising that the load reduction was not priced in Jan. 12. While the Greek representatives have explained that the interruptibility scheme in Greece is an auction-based mechanism which provides remuneration to large industrial customers for reducing their consumption when instructed by the TSO, yet it is surprising that the day ahead market did not reflect scarcity in those days.
Measures on Interconnectors France-Italy and France-Spain
The Western portion of the Continent saw colder weather, but in those countries the deviation from historical winter temperatures was not as severe as the ones seen in Southeast Europe. While the French TSO RTE did not make major changes to the trade programs, nevertheless, the adoption of special measures was deemed necessary in certain circumstances, notably on the interconnectors for France-Spain and Italy-France.
No content below the line
Footer : Never change the footer text on individual slides. Change, turn on or off Data color order: Complimentary colors:
Platts
Colors:
Greece Imp/Exp Flow Vs. Price Spread with BG (Commercial)
Data Source: ENTSO-E Scheduled Commercial Exchanges; EFET Power Exchange Prices
-50
-30
-10
10
30
50
70
90
-500
0
500
1000
1500
BG Export Ban GR-ALGR-BG GR-ITGR-MK GR-TR
Spread
(Euro/MWh)
GR
Exp
MWs
GR
Imp
Greek
system
tighter than
Bulgaria
(Jan. 11)
Jan. 12: Greek system less tight than Bulgaria
No content below the line
Footer : Never change the footer text on individual slides. Change, turn on or off Data color order: Complimentary colors:
Platts
Colors:
Hourly Prices Jan. 11/Jan. 12: Greek Prices Not Reflecting Scarcity
0
20
40
60
80
100
120
140
01 03 05 07 09 11 13 15 17 19 21 23 01 03 05 07 09 11 13 15 17 19 21 23
Greece Bulgaria Italy - SUD
Jan. 11 Jan. 12
Euro/MWh
Data Source: Power Exchange Prices

DG ENERGY | EU ELECTRICITY MARKETS IN JAN AND FEB 2017
DECEMBER 20, 2017
24
French import capacity was increased, especially from Spain and Switzerland, while Net Transfer Capacity toward Spain was reduced significantly for a number of days – starting from Jan. 14 to Jan. 20, to ensure operations remained within operational security limits in observations. More specifically, NTC was brought down to 800 MW on Jan. 14 (hour 9 to hour 23), Jan. 15 (hour 19 to 21) and again from Jan. 16 to Jan. 20 (hour 8 to hour 23).
Similarly, NTC to Italy was cut in the direction of Italy on Jan. 19. That day NTC reached a low of 921 MW on hour 11 and 724 MW on hour 21. Additionally, Italy has cut its NTC to France on Jan 18 and Jan. 1913. The chart opposite provides an overview of the NTC most affected during January. This information was public and market participant were made aware to these changes in the NTC.
While weather was not as severe as in Southeastern Europe, the French market has been experiencing a period of tightness, as a result of lower nuclear availability. As shown in the chart below, nuclear availability was at multi-year lows from July 2016 to March 2017.
An anomaly in the chemical composition of the central part of the Flamanville EPR vessel closure and bottom heads led the French Nuclear Safety Authority ASN to ask the manufacturer Areva and EDF to conduct a full experience feedback analysis with regard to this event and the parts manufactured in the AREVA's Creusot Forge plant. This effort has been ongoing since at least late 2014 and led to detect more recently an anomaly in the steam generator channel heads, which is critical to the safe operation of nuclear plants because it involves components within the reactor containment building (see also ASN press release of June 28 2016). While it was initially thought that the tests to these plants would occur in coincidence with the plants scheduled maintenance (spring-summer 2016 and 2017), it later emerged that the potential safety issues required a more urgent approach. In fact, the French nuclear regulator ASN explicitly set a deadline of 3 months to perform the safety checks to a number of units (ASN Decision of Oct. 18, 2016). These plant checks kept the French nuclear output at exceptionally lower level, even in January, a month with typically high electricity demand for heating. This issue was widely known in the marketplace, keeping French forward prices at a premium relatively to both Italy and Spain. In fact, the French Jan. 2017 baseload contract settled at €71.5/MWh on the exchange EEX on Dec. 30 2016 (last day of trading), against the Spanish Jan. 2017 contract closing at €59/MWh and the Italian at €57.28/MWh. This is to say that, even before the cold spell, the market was anticipating significant tightness in the French market relative to Spain and Italy.
13 Curtailments of the NTC on the interconnectors from Italy to France were reported by the Joint Allocation Office JAO for both days (Jan. 18: http://www.jao.eu/news/messageboard/view?parameters=%7B%22NewsId%22%3A%22813ae083-a961-4294-b256-a6fe008db31f%22%2C%22FromOverview%22%3A%221%22%7D and Jan. 19: http://www.jao.eu/news/messageboard/view?parameters=%7B%22NewsId%22%3A%225ffa83e4-cf7d-44fb-ab9b-a6ff00890086%22%2C%22FromOverview%22%3A%221%22%7D
No content below the line
Footer : Never change the footer text on individual slides. Change, turn on or off Data color order: Complimentary colors:
Platts
Colors:
Reduction of Interconnection Capacity France Toward Italy and Spain
0
500
1,000
1,500
2,000
2,500
3,000
3,500
4,000
1 17 9 1 17 9 1 17 9 1 17 9 1 17 9 1 17 9 1 17 9 1 17 9 1 17 9 1 17 9 1 17 9 1 17 9 1 17 9 1 17 9 1 17 9 1 17
1 2 3 4 5 6 7 8 9 10 11 12 13 14 15 16 17 18 19 20 21 22 23 24 25 26 27 28 29 30 31
Jan-17
FR => ES FR => IT
Data Source: ENTSO-E Scheduled Commercial Exchanges
No content below the line
Footer : Never change the footer text on individual slides. Change, turn on or off Data color order: Complimentary colors:
Platts
Colors:
French Nuclear Availability in Winter 2016/17At Multi-year Lows
35
40
45
50
55
60
65
1 2 3 4 5 6 7 8 9 10 11 12
2012 2013 2014 2015 2016 2017
Month
GW
Data Source: RTE France
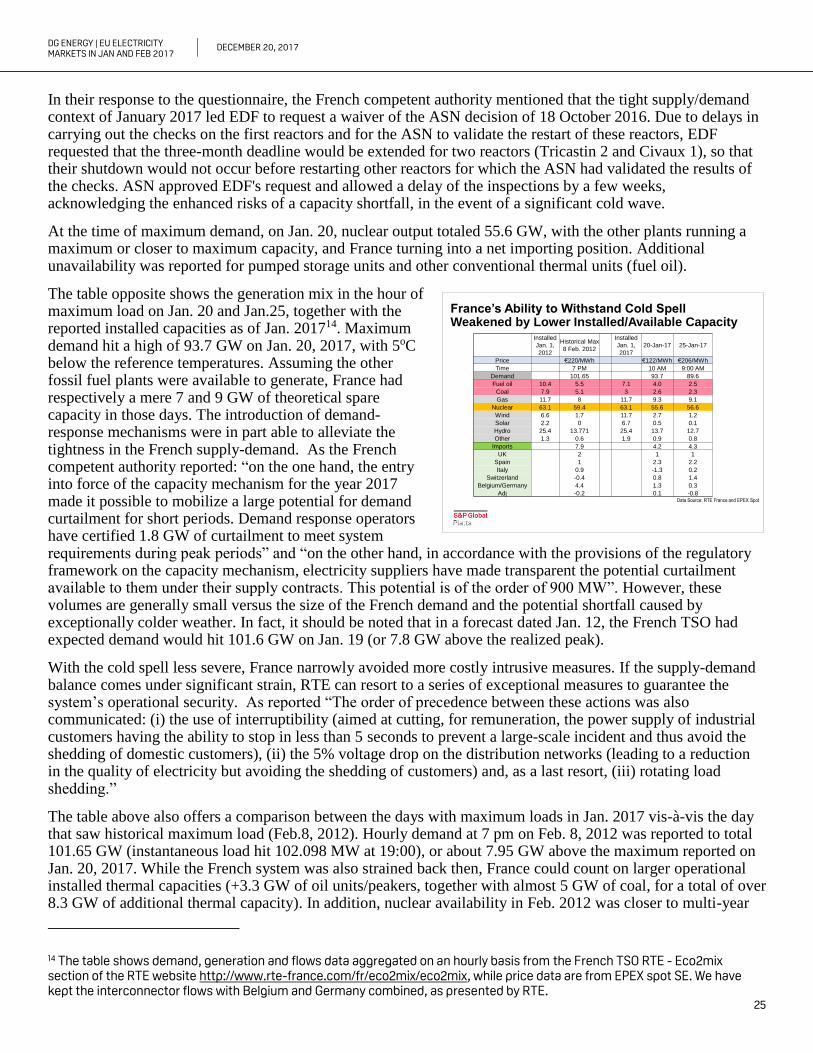
DG ENERGY | EU ELECTRICITY MARKETS IN JAN AND FEB 2017
DECEMBER 20, 2017
25
In their response to the questionnaire, the French competent authority mentioned that the tight supply/demand context of January 2017 led EDF to request a waiver of the ASN decision of 18 October 2016. Due to delays in carrying out the checks on the first reactors and for the ASN to validate the restart of these reactors, EDF requested that the three-month deadline would be extended for two reactors (Tricastin 2 and Civaux 1), so that their shutdown would not occur before restarting other reactors for which the ASN had validated the results of the checks. ASN approved EDF's request and allowed a delay of the inspections by a few weeks, acknowledging the enhanced risks of a capacity shortfall, in the event of a significant cold wave.
At the time of maximum demand, on Jan. 20, nuclear output totaled 55.6 GW, with the other plants running a maximum or closer to maximum capacity, and France turning into a net importing position. Additional unavailability was reported for pumped storage units and other conventional thermal units (fuel oil).
The table opposite shows the generation mix in the hour of maximum load on Jan. 20 and Jan.25, together with the reported installed capacities as of Jan. 201714. Maximum demand hit a high of 93.7 GW on Jan. 20, 2017, with 5oC below the reference temperatures. Assuming the other fossil fuel plants were available to generate, France had respectively a mere 7 and 9 GW of theoretical spare capacity in those days. The introduction of demand-response mechanisms were in part able to alleviate the tightness in the French supply-demand. As the French competent authority reported: “on the one hand, the entry into force of the capacity mechanism for the year 2017 made it possible to mobilize a large potential for demand curtailment for short periods. Demand response operators have certified 1.8 GW of curtailment to meet system requirements during peak periods” and “on the other hand, in accordance with the provisions of the regulatory framework on the capacity mechanism, electricity suppliers have made transparent the potential curtailment available to them under their supply contracts. This potential is of the order of 900 MW”. However, these volumes are generally small versus the size of the French demand and the potential shortfall caused by exceptionally colder weather. In fact, it should be noted that in a forecast dated Jan. 12, the French TSO had expected demand would hit 101.6 GW on Jan. 19 (or 7.8 GW above the realized peak).
With the cold spell less severe, France narrowly avoided more costly intrusive measures. If the supply-demand balance comes under significant strain, RTE can resort to a series of exceptional measures to guarantee the system’s operational security. As reported “The order of precedence between these actions was also communicated: (i) the use of interruptibility (aimed at cutting, for remuneration, the power supply of industrial customers having the ability to stop in less than 5 seconds to prevent a large-scale incident and thus avoid the shedding of domestic customers), (ii) the 5% voltage drop on the distribution networks (leading to a reduction in the quality of electricity but avoiding the shedding of customers) and, as a last resort, (iii) rotating load shedding.”
The table above also offers a comparison between the days with maximum loads in Jan. 2017 vis-à-vis the day that saw historical maximum load (Feb.8, 2012). Hourly demand at 7 pm on Feb. 8, 2012 was reported to total 101.65 GW (instantaneous load hit 102.098 MW at 19:00), or about 7.95 GW above the maximum reported on Jan. 20, 2017. While the French system was also strained back then, France could count on larger operational installed thermal capacities (+3.3 GW of oil units/peakers, together with almost 5 GW of coal, for a total of over 8.3 GW of additional thermal capacity). In addition, nuclear availability in Feb. 2012 was closer to multi-year
14 The table shows demand, generation and flows data aggregated on an hourly basis from the French TSO RTE - Eco2mix section of the RTE website http://www.rte-france.com/fr/eco2mix/eco2mix, while price data are from EPEX spot SE. We have kept the interconnector flows with Belgium and Germany combined, as presented by RTE.
No content below the line
Footer : Never change the footer text on individual slides. Change, turn on or off Data color order: Complimentary colors:
Platts
Colors:
France’s Ability to Withstand Cold Spell Weakened by Lower Installed/Available Capacity
Installed
Jan. 1,
2012
Historical Max
8 Feb. 2012
Installed
Jan. 1,
2017
20-Jan-17 25-Jan-17
Price €220/MWh €122/MWh €206/MWh
Time 7 PM 10 AM 9:00 AM
Demand 101.65 93.7 89.6
Fuel oil 10.4 5.5 7.1 4.0 2.5
Coal 7.9 5.1 3 2.6 2.3
Gas 11.7 8 11.7 9.3 9.1
Nuclear 63.1 59.4 63.1 55.6 56.6
Wind 6.6 1.7 11.7 2.7 1.2
Solar 2.2 0 6.7 0.5 0.1
Hydro 25.4 13.771 25.4 13.7 12.7
Other 1.3 0.6 1.9 0.9 0.8
Imports 7.9 4.2 4.3
UK 2 1 1
Spain 1 2.3 2.2
Italy 0.9 -1.3 0.2
Switzerland -0.4 0.8 1.4
Belgium/Germany 4.4 1.3 0.3
Adj -0.2 0.1 -0.8Data Source: RTE France and EPEX Spot
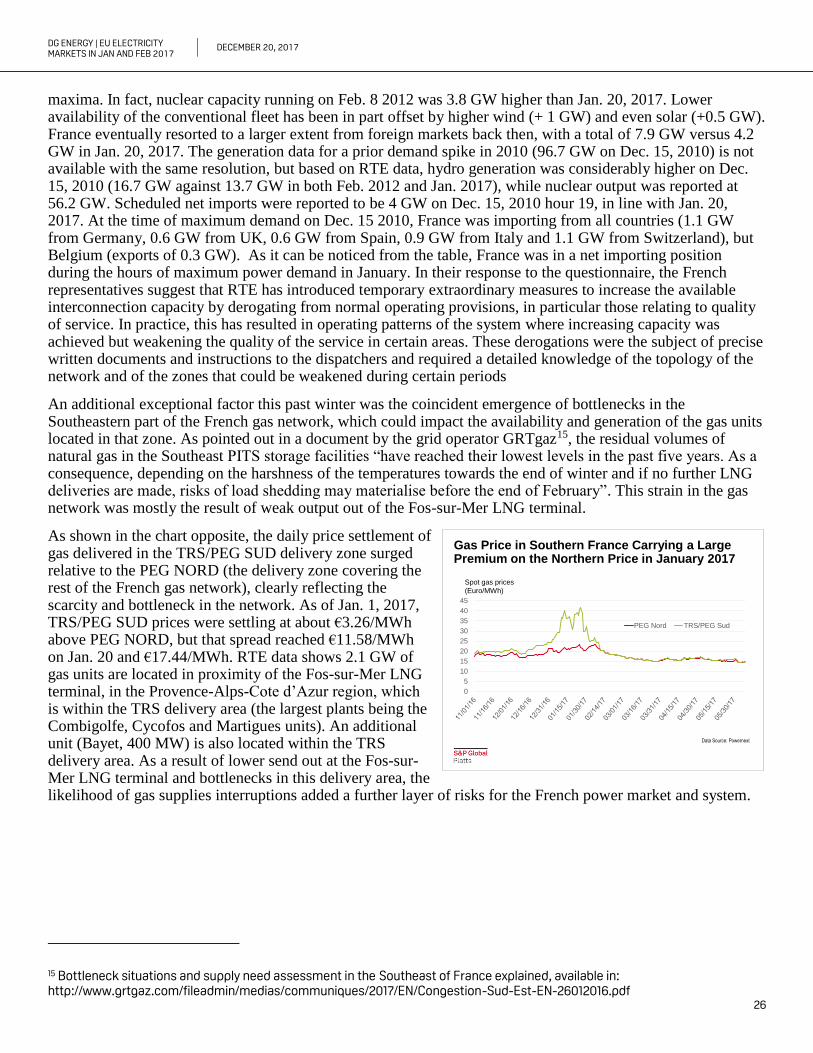
DG ENERGY | EU ELECTRICITY MARKETS IN JAN AND FEB 2017
DECEMBER 20, 2017
26
maxima. In fact, nuclear capacity running on Feb. 8 2012 was 3.8 GW higher than Jan. 20, 2017. Lower availability of the conventional fleet has been in part offset by higher wind (+ 1 GW) and even solar (+0.5 GW). France eventually resorted to a larger extent from foreign markets back then, with a total of 7.9 GW versus 4.2 GW in Jan. 20, 2017. The generation data for a prior demand spike in 2010 (96.7 GW on Dec. 15, 2010) is not available with the same resolution, but based on RTE data, hydro generation was considerably higher on Dec. 15, 2010 (16.7 GW against 13.7 GW in both Feb. 2012 and Jan. 2017), while nuclear output was reported at 56.2 GW. Scheduled net imports were reported to be 4 GW on Dec. 15, 2010 hour 19, in line with Jan. 20, 2017. At the time of maximum demand on Dec. 15 2010, France was importing from all countries (1.1 GW from Germany, 0.6 GW from UK, 0.6 GW from Spain, 0.9 GW from Italy and 1.1 GW from Switzerland), but Belgium (exports of 0.3 GW). As it can be noticed from the table, France was in a net importing position during the hours of maximum power demand in January. In their response to the questionnaire, the French representatives suggest that RTE has introduced temporary extraordinary measures to increase the available interconnection capacity by derogating from normal operating provisions, in particular those relating to quality of service. In practice, this has resulted in operating patterns of the system where increasing capacity was achieved but weakening the quality of the service in certain areas. These derogations were the subject of precise written documents and instructions to the dispatchers and required a detailed knowledge of the topology of the network and of the zones that could be weakened during certain periods
An additional exceptional factor this past winter was the coincident emergence of bottlenecks in the Southeastern part of the French gas network, which could impact the availability and generation of the gas units located in that zone. As pointed out in a document by the grid operator GRTgaz15, the residual volumes of natural gas in the Southeast PITS storage facilities “have reached their lowest levels in the past five years. As a consequence, depending on the harshness of the temperatures towards the end of winter and if no further LNG deliveries are made, risks of load shedding may materialise before the end of February”. This strain in the gas network was mostly the result of weak output out of the Fos-sur-Mer LNG terminal.
As shown in the chart opposite, the daily price settlement of gas delivered in the TRS/PEG SUD delivery zone surged relative to the PEG NORD (the delivery zone covering the rest of the French gas network), clearly reflecting the scarcity and bottleneck in the network. As of Jan. 1, 2017, TRS/PEG SUD prices were settling at about €3.26/MWh above PEG NORD, but that spread reached €11.58/MWh on Jan. 20 and €17.44/MWh. RTE data shows 2.1 GW of gas units are located in proximity of the Fos-sur-Mer LNG terminal, in the Provence-Alps-Cote d’Azur region, which is within the TRS delivery area (the largest plants being the Combigolfe, Cycofos and Martigues units). An additional unit (Bayet, 400 MW) is also located within the TRS delivery area. As a result of lower send out at the Fos-sur-Mer LNG terminal and bottlenecks in this delivery area, the likelihood of gas supplies interruptions added a further layer of risks for the French power market and system.
15 Bottleneck situations and supply need assessment in the Southeast of France explained, available in: http://www.grtgaz.com/fileadmin/medias/communiques/2017/EN/Congestion-Sud-Est-EN-26012016.pdf
No content below the line
Footer : Never change the footer text on individual slides. Change, turn on or off Data color order: Complimentary colors:
Platts
Colors:
Gas Price in Southern France Carrying a Large Premium on the Northern Price in January 2017
Data Source: Powernext
0
5
10
15
20
25
30
35
40
45
PEG Nord TRS/PEG Sud
Spot gas prices
(Euro/MWh)
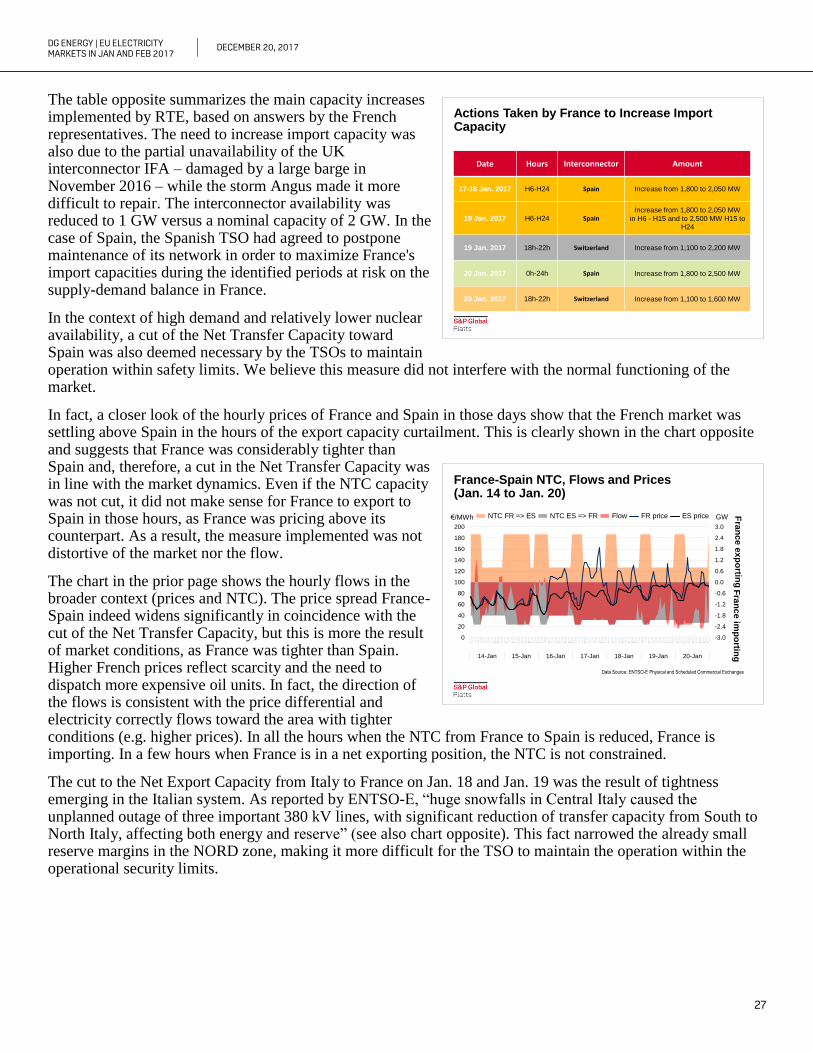
DG ENERGY | EU ELECTRICITY MARKETS IN JAN AND FEB 2017
DECEMBER 20, 2017
27
The table opposite summarizes the main capacity increases implemented by RTE, based on answers by the French representatives. The need to increase import capacity was also due to the partial unavailability of the UK interconnector IFA – damaged by a large barge in November 2016 – while the storm Angus made it more difficult to repair. The interconnector availability was reduced to 1 GW versus a nominal capacity of 2 GW. In the case of Spain, the Spanish TSO had agreed to postpone maintenance of its network in order to maximize France's import capacities during the identified periods at risk on the supply-demand balance in France.
In the context of high demand and relatively lower nuclear availability, a cut of the Net Transfer Capacity toward Spain was also deemed necessary by the TSOs to maintain operation within safety limits. We believe this measure did not interfere with the normal functioning of the market.
In fact, a closer look of the hourly prices of France and Spain in those days show that the French market was settling above Spain in the hours of the export capacity curtailment. This is clearly shown in the chart opposite and suggests that France was considerably tighter than Spain and, therefore, a cut in the Net Transfer Capacity was in line with the market dynamics. Even if the NTC capacity was not cut, it did not make sense for France to export to Spain in those hours, as France was pricing above its counterpart. As a result, the measure implemented was not distortive of the market nor the flow.
The chart in the prior page shows the hourly flows in the broader context (prices and NTC). The price spread France-Spain indeed widens significantly in coincidence with the cut of the Net Transfer Capacity, but this is more the result of market conditions, as France was tighter than Spain. Higher French prices reflect scarcity and the need to dispatch more expensive oil units. In fact, the direction of the flows is consistent with the price differential and electricity correctly flows toward the area with tighter conditions (e.g. higher prices). In all the hours when the NTC from France to Spain is reduced, France is importing. In a few hours when France is in a net exporting position, the NTC is not constrained.
The cut to the Net Export Capacity from Italy to France on Jan. 18 and Jan. 19 was the result of tightness emerging in the Italian system. As reported by ENTSO-E, “huge snowfalls in Central Italy caused the unplanned outage of three important 380 kV lines, with significant reduction of transfer capacity from South to North Italy, affecting both energy and reserve” (see also chart opposite). This fact narrowed the already small reserve margins in the NORD zone, making it more difficult for the TSO to maintain the operation within the operational security limits.
No content below the line
Footer : Never change the footer text on individual slides. Change, turn on or off Data color order: Complimentary colors:
Platts
Colors:
Actions Taken by France to Increase Import Capacity
Date Hours Interconnector Amount
17-18 Jan. 2017 H6-H24 Spain Increase from 1,800 to 2,050 MW
19 Jan. 2017 H6-H24 SpainIncrease from 1,800 to 2,050 MW
in H6 - H15 and to 2,500 MW H15 toH24
19 Jan. 2017 18h-22h Switzerland Increase from 1,100 to 2,200 MW
20 Jan. 2017 0h-24h Spain Increase from 1,800 to 2,500 MW
20 Jan. 2017 18h-22h Switzerland Increase from 1,100 to 1,600 MW
No content below the line
Footer : Never change the footer text on individual slides. Change, turn on or off Data color order: Complimentary colors:
Platts
Colors:
France-Spain NTC, Flows and Prices (Jan. 14 to Jan. 20)
-3.0
-2.4
-1.8
-1.2
-0.6
0.0
0.6
1.2
1.8
2.4
3.0
1 6 111621 2 7 121722 3 8 131823 4 9 141924 5 101520 1 6 111621 2 7 121722
14-Jan 15-Jan 16-Jan 17-Jan 18-Jan 19-Jan 20-Jan
0
20
40
60
80
100
120
140
160
180
200
NTC FR => ES NTC ES => FR Flow FR price ES price€/MWh GW
Fra
nc
e e
xp
ortin
gF
ran
ce
imp
ortin
g
Data Source: ENTSO-E Physical and Scheduled Commercial Exchanges
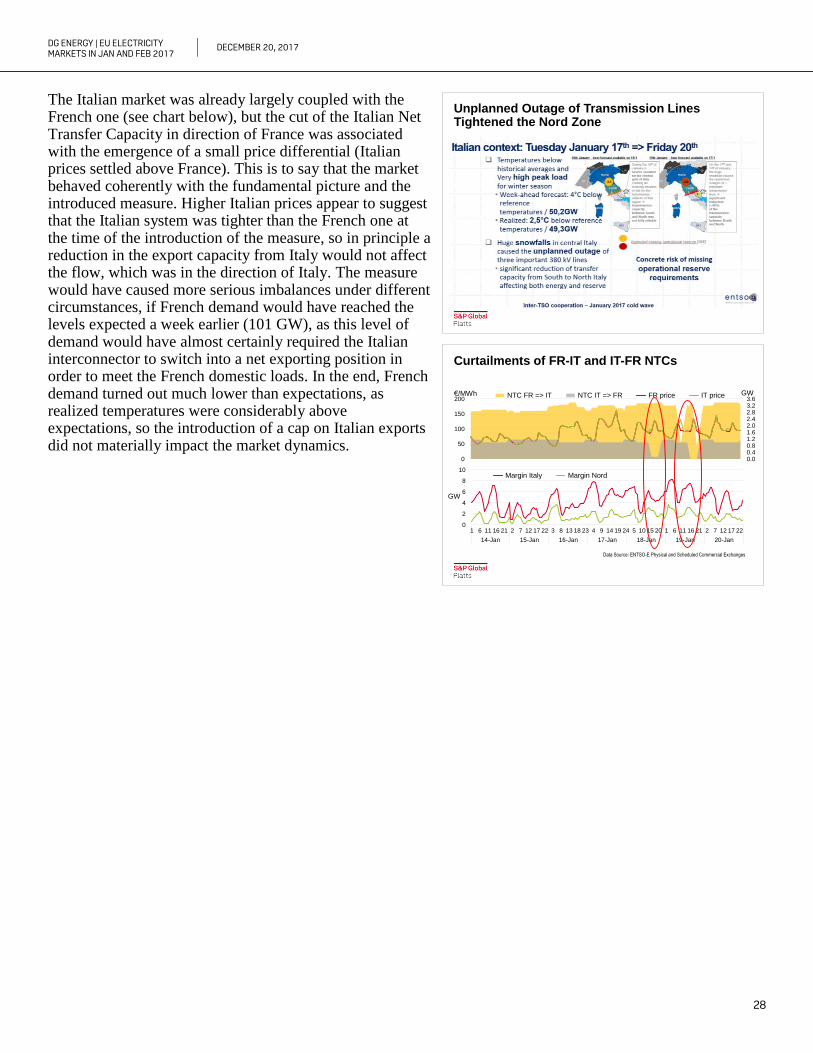
DG ENERGY | EU ELECTRICITY MARKETS IN JAN AND FEB 2017
DECEMBER 20, 2017
28
The Italian market was already largely coupled with the French one (see chart below), but the cut of the Italian Net Transfer Capacity in direction of France was associated with the emergence of a small price differential (Italian prices settled above France). This is to say that the market behaved coherently with the fundamental picture and the introduced measure. Higher Italian prices appear to suggest that the Italian system was tighter than the French one at the time of the introduction of the measure, so in principle a reduction in the export capacity from Italy would not affect the flow, which was in the direction of Italy. The measure would have caused more serious imbalances under different circumstances, if French demand would have reached the levels expected a week earlier (101 GW), as this level of demand would have almost certainly required the Italian interconnector to switch into a net exporting position in order to meet the French domestic loads. In the end, French demand turned out much lower than expectations, as realized temperatures were considerably above expectations, so the introduction of a cap on Italian exports did not materially impact the market dynamics.
No content below the line
Footer : Never change the footer text on individual slides. Change, turn on or off Data color order: Complimentary colors:
Platts
Colors:
Unplanned Outage of Transmission Lines Tightened the Nord Zone
No content below the line
Footer : Never change the footer text on individual slides. Change, turn on or off Data color order: Complimentary colors:
Platts
Colors:
Curtailments of FR-IT and IT-FR NTCs
0
50
100
150
200
0.00.40.81.21.62.02.42.83.23.6
NTC FR => IT NTC IT => FR FR price IT price
0
2
4
6
8
10
1 6 11 16 21 2 7 12 17 22 3 8 13 18 23 4 9 14 19 24 5 10 15 20 1 6 11 16 21 2 7 12 17 22
14-Jan 15-Jan 16-Jan 17-Jan 18-Jan 19-Jan 20-Jan
Margin Italy Margin Nord
GW€/MWh
GW
Data Source: ENTSO-E Physical and Scheduled Commercial Exchanges
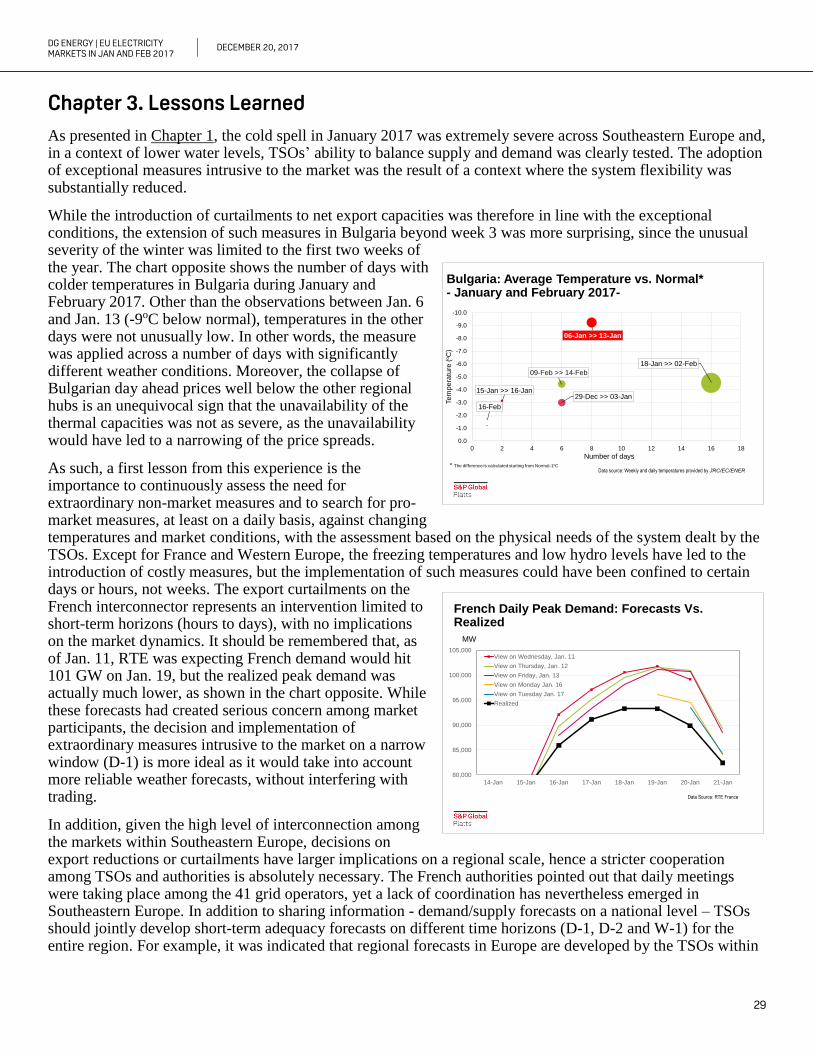
DG ENERGY | EU ELECTRICITY MARKETS IN JAN AND FEB 2017
DECEMBER 20, 2017
29
Chapter 3. Lessons Learned
As presented in Chapter 1, the cold spell in January 2017 was extremely severe across Southeastern Europe and, in a context of lower water levels, TSOs’ ability to balance supply and demand was clearly tested. The adoption of exceptional measures intrusive to the market was the result of a context where the system flexibility was substantially reduced.
While the introduction of curtailments to net export capacities was therefore in line with the exceptional conditions, the extension of such measures in Bulgaria beyond week 3 was more surprising, since the unusual severity of the winter was limited to the first two weeks of the year. The chart opposite shows the number of days with colder temperatures in Bulgaria during January and February 2017. Other than the observations between Jan. 6 and Jan. 13 (-9oC below normal), temperatures in the other days were not unusually low. In other words, the measure was applied across a number of days with significantly different weather conditions. Moreover, the collapse of Bulgarian day ahead prices well below the other regional hubs is an unequivocal sign that the unavailability of the thermal capacities was not as severe, as the unavailability would have led to a narrowing of the price spreads.
As such, a first lesson from this experience is the importance to continuously assess the need for extraordinary non-market measures and to search for pro-market measures, at least on a daily basis, against changing temperatures and market conditions, with the assessment based on the physical needs of the system dealt by the TSOs. Except for France and Western Europe, the freezing temperatures and low hydro levels have led to the introduction of costly measures, but the implementation of such measures could have been confined to certain days or hours, not weeks. The export curtailments on the French interconnector represents an intervention limited to short-term horizons (hours to days), with no implications on the market dynamics. It should be remembered that, as of Jan. 11, RTE was expecting French demand would hit 101 GW on Jan. 19, but the realized peak demand was actually much lower, as shown in the chart opposite. While these forecasts had created serious concern among market participants, the decision and implementation of extraordinary measures intrusive to the market on a narrow window (D-1) is more ideal as it would take into account more reliable weather forecasts, without interfering with trading.
In addition, given the high level of interconnection among the markets within Southeastern Europe, decisions on export reductions or curtailments have larger implications on a regional scale, hence a stricter cooperation among TSOs and authorities is absolutely necessary. The French authorities pointed out that daily meetings were taking place among the 41 grid operators, yet a lack of coordination has nevertheless emerged in Southeastern Europe. In addition to sharing information - demand/supply forecasts on a national level – TSOs should jointly develop short-term adequacy forecasts on different time horizons (D-1, D-2 and W-1) for the entire region. For example, it was indicated that regional forecasts in Europe are developed by the TSOs within
No content below the line
Footer : Never change the footer text on individual slides. Change, turn on or off Data color order: Complimentary colors:
Platts
Colors:
French Daily Peak Demand: Forecasts Vs. Realized
80,000
85,000
90,000
95,000
100,000
105,000
14-Jan 15-Jan 16-Jan 17-Jan 18-Jan 19-Jan 20-Jan 21-Jan
View on Wednesday, Jan. 11
View on Thursday, Jan. 12
View on Friday, Jan. 13
View on Monday Jan. 16
View on Tuesday Jan. 17
Realized
MW
Data Source: RTE France
No content below the line
Footer : Never change the footer text on individual slides. Change, turn on or off Data color order: Complimentary colors:
Platts
Colors:
Bulgaria: Average Temperature vs. Normal*- January and February 2017-
16-Feb
15-Jan >> 16-Jan
09-Feb >> 14-Feb
29-Dec >> 03-Jan
06-Jan >> 13-Jan
18-Jan >> 02-Feb
-10.0
-9.0
-8.0
-7.0
-6.0
-5.0
-4.0
-3.0
-2.0
-1.0
0.0
0 2 4 6 8 10 12 14 16 18Te
mp
era
ture
(oC
)Number of days
* The difference is calculated starting from Normal-1oCData source: Weekly and daily temperatures provided by JRC/EC/ENER

DG ENERGY | EU ELECTRICITY MARKETS IN JAN AND FEB 2017
DECEMBER 20, 2017
30
the CORESO16, in line with ENTSO-E guidelines. This stricter cooperation could be limited to periods when there are enhanced risks of imbalances, such as winter season, or when specific events occur, such as exceptionally low hydro levels, or more specific generation losses, such as higher nuclear or thermal unavailability.
Finally, from a broader perspective, the cold spell of January 2017 – the first major weather event since at least Feb. 2012 - highlights how the system in several countries has become more vulnerable. The significant changes occurring on the generation side require the development of even more sophisticated short-term forecast methodologies, together with the regional mid-term (2-3 years ahead) and seasonal outlooks, with several detailed sensitivities that take into account of a number of deviations from normal to include the emergence of extreme conditions. Finally, the cold spell of January 2017 highlighted the need for these forecasts to be carried out on a regional level and across TSOs.
16CORESO is a voluntary regional cooperation initiative of the TSOs in Europe. It aims at helping TSOs ensure security of supply on a regional level by possibly acting, in the future, as a Regional Security Coordinator. CORESO has a coordination function in cooperation with TSOs while the TSOs remain responsible for operation at national level. CORESO was informed of the risk of tightness in France by mid October 2016 and therefore asked the French TSO (RTE) for further information and followed the development of the situation from a general regional perspective.