etsi gs nfv-rel 004 v1.1...etsi 2 etsi gs nfv-rel 004 v1.1.1 (2016-04) reference dgs/nfv-rel004...
TRANSCRIPT
ETSI GS NFV-REL 004 V1.1.1 (2016-04)
Network Functions Virtualisation (NFV); Assurance;
Report on Active Monitoring and Failure Detection
Disclaimer
The present document has been produced and approved by the Network Functions Virtualisation (NFV) ETSI Industry Specification Group (ISG) and represents the views of those members who participated in this ISG.
It does not necessarily represent the views of the entire ETSI membership.
GROUP SPECIFICATION
ETSI
ETSI GS NFV-REL 004 V1.1.1 (2016-04)2
Reference DGS/NFV-REL004
Keywords assurance, NFV, testing
ETSI
650 Route des Lucioles F-06921 Sophia Antipolis Cedex - FRANCE
Tel.: +33 4 92 94 42 00 Fax: +33 4 93 65 47 16
Siret N° 348 623 562 00017 - NAF 742 C
Association à but non lucratif enregistrée à la Sous-Préfecture de Grasse (06) N° 7803/88
Important notice
The present document can be downloaded from: http://www.etsi.org/standards-search
The present document may be made available in electronic versions and/or in print. The content of any electronic and/or print versions of the present document shall not be modified without the prior written authorization of ETSI. In case of any
existing or perceived difference in contents between such versions and/or in print, the only prevailing document is the print of the Portable Document Format (PDF) version kept on a specific network drive within ETSI Secretariat.
Users of the present document should be aware that the document may be subject to revision or change of status. Information on the current status of this and other ETSI documents is available at
https://portal.etsi.org/TB/ETSIDeliverableStatus.aspx
If you find errors in the present document, please send your comment to one of the following services: https://portal.etsi.org/People/CommiteeSupportStaff.aspx
Copyright Notification
No part may be reproduced or utilized in any form or by any means, electronic or mechanical, including photocopying and microfilm except as authorized by written permission of ETSI.
The content of the PDF version shall not be modified without the written authorization of ETSI. The copyright and the foregoing restriction extend to reproduction in all media.
© European Telecommunications Standards Institute 2016.
All rights reserved.
DECTTM, PLUGTESTSTM, UMTSTM and the ETSI logo are Trade Marks of ETSI registered for the benefit of its Members. 3GPPTM and LTE™ are Trade Marks of ETSI registered for the benefit of its Members and
of the 3GPP Organizational Partners. GSM® and the GSM logo are Trade Marks registered and owned by the GSM Association.

ETSI
ETSI GS NFV-REL 004 V1.1.1 (2016-04)3
Contents Intellectual Property Rights ................................................................................................................................ 5
Foreword ............................................................................................................................................................. 5
Modal verbs terminology .................................................................................................................................... 5
1 Scope ........................................................................................................................................................ 6
2 References ................................................................................................................................................ 6
2.1 Normative references ......................................................................................................................................... 6
2.2 Informative references ........................................................................................................................................ 6
3 Definitions and abbreviations ................................................................................................................... 8
3.1 Definitions .......................................................................................................................................................... 8
3.2 Abbreviations ..................................................................................................................................................... 9
4 Active Monitoring in traditional networks ............................................................................................... 9
5 Impact of NFV on active monitoring ..................................................................................................... 10
6 Proposed Active Monitoring Framework for NFV ................................................................................ 12
6.0 Introduction ...................................................................................................................................................... 12
6.1 Roles and responsibilities for a virtual test agent ............................................................................................. 12
6.2 Roles and responsibilities for a Test Controller ............................................................................................... 13
6.3 Roles and Responsibilities for Test Results Analysis Module ......................................................................... 14
6.4 Workflow Definition ........................................................................................................................................ 14
7 Alternate Active Monitoring Architecture Considerations .................................................................... 16
7.0 Introduction ...................................................................................................................................................... 16
7.1 Alternate workflow definition .......................................................................................................................... 17
8 Fault Notification Quality Indicators ..................................................................................................... 17
8.1 Purpose ............................................................................................................................................................. 17
8.2 Canonical Failure Notification Model .............................................................................................................. 17
8.3 Quantitative Failure Notification Indicators ..................................................................................................... 19
8.4 Failure Notification Quality Indicators in NFV................................................................................................ 19
9 Methods of Measurement ....................................................................................................................... 20
9.1 Introduction ...................................................................................................................................................... 20
9.2 Service Activation ............................................................................................................................................ 20
9.3 Fault Isolation and Troubleshooting ................................................................................................................. 22
9.4 Failure detection ............................................................................................................................................... 24
9.5 Framework for End to End in Situ Monitoring ................................................................................................ 25
9.6 Capacity Planning............................................................................................................................................. 27
9.6.0 Introduction................................................................................................................................................. 27
9.6.1 Capacity validation ..................................................................................................................................... 27
9.6.2 Capacity planning forecast .......................................................................................................................... 29
9.6.3 Optimize service endpoint location ............................................................................................................ 29
9.7 Performance monitoring ................................................................................................................................... 29
9.7.1 SLA Monitoring for E2E services .............................................................................................................. 29
9.7.2 Overload Detection ..................................................................................................................................... 31
9.8 Use Case: Active Monitoring of Service Chains .............................................................................................. 32
10 Evaluating NFV Resiliency .................................................................................................................... 34
10.0 Introduction ...................................................................................................................................................... 34
10.1 Network Resiliency Principles ......................................................................................................................... 34
10.2 NFV Resiliency Evaluation using active fault injection ................................................................................... 35
10.2.0 Introduction................................................................................................................................................. 35
10.2.1 Fault Injection framework for evaluating NFV resiliency .......................................................................... 35
10.2.2 Multilevel Challenge/Fault modelling ........................................................................................................ 36
10.2.3 NFVI faults & failures ................................................................................................................................ 37
10.3 Traffic Tolerance .............................................................................................................................................. 38
10.4 Failure Impact .................................................................................................................................................. 38
ETSI
ETSI GS NFV-REL 004 V1.1.1 (2016-04)4
11 Security Considerations .......................................................................................................................... 39
12 Deployment Scenarios ............................................................................................................................ 40
13 Recommendations .................................................................................................................................. 40
Annex A (informative): Active Monitoring Framework Specifics ..................................................... 42
A.1 Why Active Monitoring ......................................................................................................................... 42
A.2 Test VNF ................................................................................................................................................ 42
A.2.1 Test VNF Descriptor ........................................................................................................................................ 42
A.2.2 Test VNF Record (VNFR) ............................................................................................................................... 43
A.2.3 Test Instruction Set ........................................................................................................................................... 44
A.2.4 KeepAlive messages......................................................................................................................................... 44
A.3 Test Measurement Methods ................................................................................................................... 45
A.3.1 Fault Localization ............................................................................................................................................. 45
A.3.2 NFVI Metrics for fault co-relation ................................................................................................................... 47
A.4 Synchronization protocol definition for Test Controller HA ................................................................. 47
Annex B (informative): Test Workload Distributions ........................................................................ 48
B.1 Service QoS & QoE measurements methods ......................................................................................... 48
B.2 User Traffic Workloads and Distributions ............................................................................................. 49
B.2.1 Workload Mix .................................................................................................................................................. 49
B.2.2 Workload Distributions .................................................................................................................................... 49
Annex C (informative): Example Measurement Methods and Metrics ............................................ 51
C.1 Example SLAs ........................................................................................................................................ 51
C.2 Application Test Methodologies for QoE measurements....................................................................... 51
C.2.1 NetFLIX™ Adaptive Streaming Load Generator with Quality Detection ....................................................... 51
C.2.2 HTTP Adaptive Streaming Video Start Time and Underflow Scale Test ........................................................ 53
C.2.3 CloudMark Virtualised Performance Benchmark ............................................................................................ 54
C.2.4 Example Test Methodology for Evaluating NFV Resiliency ........................................................................... 57
Annex D (informative): Authors & contributors ................................................................................. 59
Annex F (informative): Bibliography ................................................................................................... 60
History .............................................................................................................................................................. 61

ETSI
ETSI GS NFV-REL 004 V1.1.1 (2016-04)5
Intellectual Property Rights IPRs essential or potentially essential to the present document may have been declared to ETSI. The information pertaining to these essential IPRs, if any, is publicly available for ETSI members and non-members, and can be found in ETSI SR 000 314: "Intellectual Property Rights (IPRs); Essential, or potentially Essential, IPRs notified to ETSI in respect of ETSI standards", which is available from the ETSI Secretariat. Latest updates are available on the ETSI Web server (https://ipr.etsi.org/).
Pursuant to the ETSI IPR Policy, no investigation, including IPR searches, has been carried out by ETSI. No guarantee can be given as to the existence of other IPRs not referenced in ETSI SR 000 314 (or the updates on the ETSI Web server) which are, or may be, or may become, essential to the present document.
Foreword This Group Specification (GS) has been produced by ETSI Industry Specification Group (ISG) Network Functions Virtualisation (NFV).
Modal verbs terminology In the present document "shall", "shall not", "should", "should not", "may", "need not", "will", "will not", "can" and "cannot" are to be interpreted as described in clause 3.2 of the ETSI Drafting Rules (Verbal forms for the expression of provisions).
"must" and "must not" are NOT allowed in ETSI deliverables except when used in direct citation.
ETSI
ETSI GS NFV-REL 004 V1.1.1 (2016-04)6
1 Scope The present document develops a report detailing methods for active monitoring of VNFs, NFVI and E2E network services and detection of failures. It addresses the following two aspects of active monitoring:
1) Periodic testing of VNFs and service chains in a live environment to ensure proper functionality and performance adherence to SLAs.
2) Failure prevention and detection - Active monitoring methods for failure prevention (proactive) or timely detection and recovery from failures. Failures include loss or degradation of network connectivity, loss or degradation of session capacity, loss of services, VM failures, VM stalls, etc.
The present document proposes that the monitoring agents be on boarded into the NFV environment, just like other VNFs.
2 References
2.1 Normative references References are either specific (identified by date of publication and/or edition number or version number) or non-specific. For specific references, only the cited version applies. For non-specific references, the latest version of the referenced document (including any amendments) applies.
Referenced documents which are not found to be publicly available in the expected location might be found at http://docbox.etsi.org/Reference.
NOTE: While any hyperlinks included in this clause were valid at the time of publication, ETSI cannot guarantee their long term validity.
The following referenced documents are necessary for the application of the present document.
Not applicable.
2.2 Informative references References are either specific (identified by date of publication and/or edition number or version number) or non-specific. For specific references, only the cited version applies. For non-specific references, the latest version of the referenced document (including any amendments) applies.
NOTE: While any hyperlinks included in this clause were valid at the time of publication, ETSI cannot guarantee their long term validity.
The following referenced documents are not necessary for the application of the present document but they assist the user with regard to a particular subject area.
[i.1] IETF RFC 5357: "A two-way active measurement protocol".
[i.2] Recommendation ITU-T Y.1564: "Ethernet Service Activation Test Methodologies".
[i.3] IETF RFC 2544: "Benchmarking Methodology for Network Interconnect Devices".
[i.4] IETF RFC 2681: "A Round-trip Delay Metric for IPPM".
[i.5] ETSI GS NFV-SEC 003: "Network Functions Virtualisation (NFV); NFV Security; Security and Trust Guidance".
[i.6] IETF RFC 7594: "A Framework for Large-Scale Measurement of Broadband Performance (LMAP)".
[i.7] IETF RFC 7536: "Large-Scale Broadband Measurement Use Cases".
[i.8] IETF draft-ietf-lmap-information-model-06: "Information Model for Large-Scale Measurement Platforms (LMAP)".

ETSI
ETSI GS NFV-REL 004 V1.1.1 (2016-04)7
[i.9] Recommendation ITU-T Y.1731: "Internet protocol aspects - Quality of service and network Performance".
[i.10] ISO/IEC/IEEE 24765:2010: "Systems and software engineering - Vocabulary".
[i.11] IETF RFC 6349: "Framework for TCP Throughput Testing".
[i.12] ETSI GS NFV 003 (V1.1.1): "Network Functions Virtualisation (NFV); Terminology for Main Concepts in NFV".
[i.13] ETSI GS NFV-MAN 001: "Network Functions Virtualisation (NFV); Management and Orchestration".
[i.14] ETSI GS NFV-REL 001 (V1.0.0): "Network Functions Virtualisation (NFV); Resiliency Requirements".
[i.15] Saurabh Kumar Garg et al.: "SLA-based virtual machine management for heterogeneous workloads in a cloud datacenter", Journal of Network and Computer Applications, Vol. 45, October 2014, pp. 108-120.
[i.16] Eric Bauer, and Randee Adams: "Service Quality of Cloud-Based Applications, Wiley-IEEE Press, February 2014.
[i.17] TM Forum Cloud SLA Application Note Version 1.2 - GB963.
[i.18] TM Forum TR 178: "E2E Cloud SLA Management".
[i.19] Raimund Schatz, Tobias Hoßfeld, Lucjan Janowski, and Sebastian Egger: "From Packets to People: Quality of Experience as a New Measurement Challenge", in 'Data Traffic Monitoring and Analysis' (E. Biersack, C. Callegari, and M. Matijasevic, Eds.), Springer Lecture Notes in Computer Science, Vol. 7754, 2013.
[i.20] OPNFV Doctor project stable draft.
NOTE: Available at https://wiki.opnfv.org/display/doctor/Doctor+Home.
[i.21] Michael R. Lyu (Ed.): "Handbook of Software Reliability Engineering", IEEE Computer Society Press & McGraw-Hill, 1996.
[i.22] SNAPSHOT Draft: "NFV Quality Management Framework", April 23, 2015.
NOTE: The NFV white paper is posted on the NFV team portal on the QuEST Forum member web site/Executive Board/NFV Strategic Initiative/Files & Documents.
[i.23] D. Cotroneo, L. De Simone, A. Ken Iannillo, A. Lanzaro, and R. Natella: "Dependability Evaluation and Benchmarking of Network Function Virtualization Infrastructures", IEEE Conference on Network Softwarization, London, UK, April 2015.
[i.24] CSMIC defined measures.
NOTE: Available at http://csmic.org.
[i.25] "NIST Cloud Computing Cloud Services Description", Rev. 2.3d9.
[i.26] R. Ghosh, F. Longo, V.K. Naik, and K.S. Trivedi: "Quantifying Resiliency of IaaS Cloud", 29th IEEE International Symposium on Reliable Distributed Systems, New Delhi, Punjab, India, October-November 2010.
[i.27] J.P.G. Sterbenz, E.K. Çetinkaya, M.A. Hameed, A. Jabbar, S. Qian, J.P. Rohrer: "Evaluation of network resilience, survivability, and disruption tolerance: analysis, topology generation, simulation, and experimentation", Telecommunication Systems, Vol. 52, Issue 2, February 2013, pp. 705-736.
[i.28] ETSI GS NFV-REL 002 (V1.0.0): "Network Functions Virtualisation (NFV); Reliability; Report on Scalable Architectures for Reliability Management".
ETSI
ETSI GS NFV-REL 004 V1.1.1 (2016-04)8
[i.29] ETSI GS NFV-REL 003: "Network Functions Virtualisation (NFV); Reliability; Report on Models and Features for E2E Reliability".
[i.30] ETSI GS NFV-SEC 008: "Security Management and Monitoring for NFV".
[i.31] ETSI GS NFV-REL 005 (V1.1.1): "Network Functions Virtualisation (NFV); Accountability; Report on Quality Accountability Framework".
[i.32] IETF draft-browne-sfc-nsh-timestamp-00: "Network Service Header Timestamping".
NOTE: Available at https://tools.ietf.org/html/draft-browne-sfc-nsh-timestamp-00.
[i.33] IETF draft-irtf-nfvrg-resource-management-service-chain-02: "Resource Management in Service Chaining".
NOTE: Available at https://tools.ietf.org/html/draft-irtf-nfvrg-resource-management-service-chain-02.
[i.34] Mark Sylor: "Testing the Cloud," EXFO White Paper 023, 2012.
3 Definitions and abbreviations
3.1 Definitions For the purposes of the present document, the terms and definitions given in ETSI GS NFV-REL 001 [i.14], ETSI GS NFV 003 [i.12] and the following apply:
failure: termination of the ability of a product to perform a required function or its inability to perform within previously specified limits or an event in which a system or system component does not perform a required function within specified limits
NOTE: As defined in ISO/IEC/IEEE 24765:2010 [i.10].
FaultLoad: set of faults to inject in the NFVI for resiliency evaluation
NOTE: As defined in [i.23].
frame loss ratio: ratio, expressed as a percentage, of the number of service frames not delivered divided by the total number of service frames during a time interval T, where the number of service frames not delivered is the difference between the number of service frames arriving at the ingress ETH flow point and the number of service frames delivered at the egress ETH flow point in a point-to-point ETH connection
NOTE: As defined in Recommendation ITU-T Y.1731 [i.9].
frame delay: round-trip delay for a frame, where frame delay is defined as the time elapsed since the start of transmission of the first bit of the frame by a source node until the reception of the last bit of the loop backed frame by the same source node, when the loopback is performed at the frame's destination node
NOTE: As defined in Recommendation ITU-T Y.1731 [i.9].
frame delay variation: measure of the variations in the frame delay between a pair of service frames, where the service frames belong to the same CoS instance on a point-to-point ETH connection
NOTE: As defined in Recommendation ITU-T Y.1731 [i.9].
Test Controller: management module responsible for management of the test agents/probes
NOTE 1: Provides test instructions to the test probes.
NOTE 2: Co-ordinates the test scheduling when multiple tests with large number of test probes are executed.
NOTE 3: Retrieves results from the results analysis engine to provide actionable information to the network operator via NFVO. In this case result reporting to OSS/BSS via NFVO has been used as a deployment option to keep a single interface for communication between Test Controller and MANO. This keeps the changes required to interfaces of the MANO components to minimum and minimizes the effort for Active monitoring System integration with NFV framework.
ETSI
ETSI GS NFV-REL 004 V1.1.1 (2016-04)9
Test Results Analysis Module (TRAM): integral part of the active monitoring framework that collects or receives test results from the VTAs, NFVI resource statistics and alarms from VIM and analyses test results and presents it to Test Controller, NFVO or other management entities in an actionable format
throughput: maximum rate at which no frame is dropped. This is typically measured under test conditions
NOTE: As defined in IETF RFC 2544 [i.3].
Virtual Test Agent (VTA): VNF for active monitoring probe capable of sending and analysing control plane and data plane testing
3.2 Abbreviations For the purposes of the present document, the abbreviations given in ETSI GS NFV 003 [i.12] and the following apply:
BSS Business Support Systems CBS Constant Bit Rate CCDF Complementary Cumulative Distribution Function CiGoodput Cloud infrastructure Goodput CiQoE Cloud infrastructure Quality of Experience CiR Cloud infrastructure Reliability CoS Class of Service DPI Deep Packet Inspection DUT Device Under Test EBS Excess Burst Size EIR Excess Information Rate IETF Internet Engineering Task Force IPPM IP Performance Metrics LMAP Large scale Measurement of Broadband Performance NFF No Fault Found OSS Operations Support Systems PoP Point of Presence PPB Parts Per Billion PTP Precision Time Protocol NTP Network Time Protocol NSR Network Service Record QoE Quality of Experience QoS Quality of Service SLA Service Level Agreement SPC Statistical Process Control TCO Total Cost of Ownership TRAM Test Results Analysis Module VLR Virtual Link Record VNFR Virtual Network Function Record VTA Virtual Test Agent
4 Active Monitoring in traditional networks In general the 3 stages of service lifecycle are addressed in the present document:
1) Service activation - whereby a service or VNF is deployed and verified that the service is running as expected.
2) Service monitoring - where the resource usage by a service is monitored and management components are alerted upon KPI violation.
3) Service debug - where troubleshooting probes and tools to ascertain the root cause of a service failure are used.
Live testing typically involves end-to-end testing of services versus single node testing where the testing can be performed at the pre-activation, or post-activation, of services. Three key components of a test system in live networks are:
1) Test Controller;
ETSI
ETSI GS NFV-REL 004 V1.1.1 (2016-04)10
2) results analysis module; and
3) test agent.
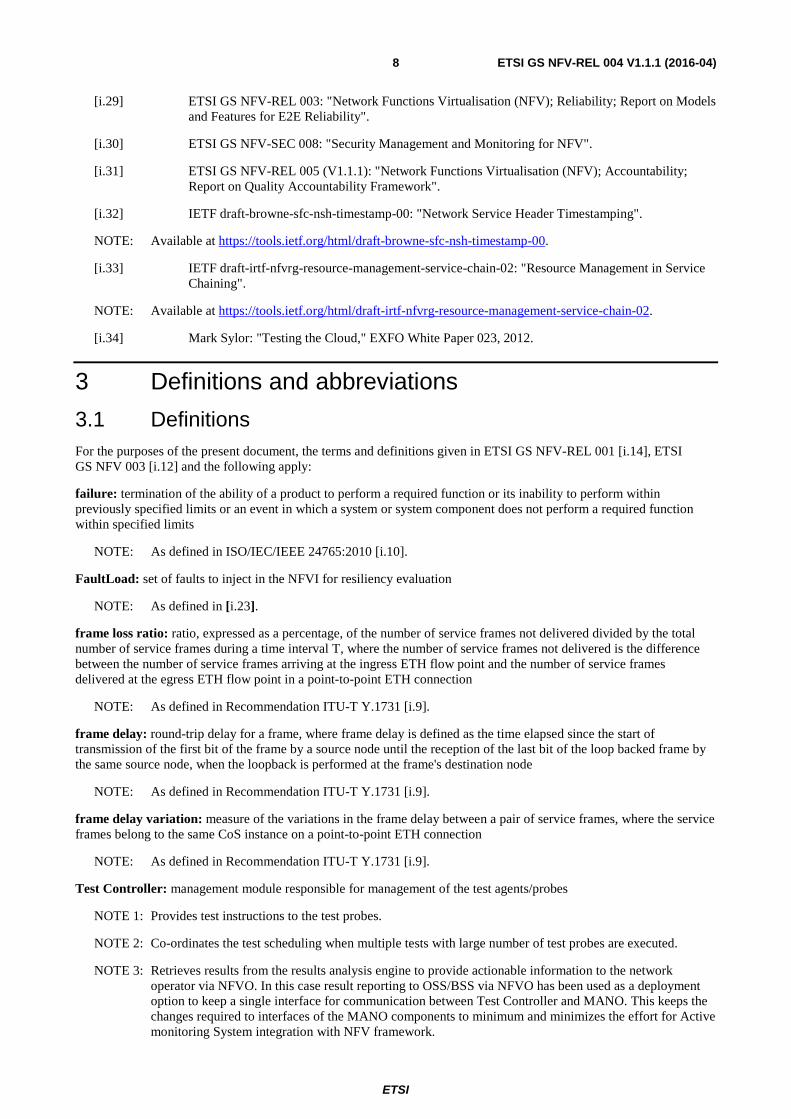
In non-NFV network deployments, the testing agents are typically deployed in the long-term as long as the testing or monitoring PoP does not change. Test Controller and results analysis module can be part of the OSS/BSS system or can be a standalone application in the same administration domain as the OSS/BSS system. Figure 1 illustrates a generic active monitoring deployment scenario.
Figure 1: Live network testing in non-NFV networks
Network monitoring methods can be categorized into active, passive or hybrid modes.
• Active may operate in two modes:
- Test mode involves sending test traffic (based on an OAM protocol such as Recommendation ITU-T Y.1731 [i.9] or alternative) into the network to validate the services and applications performance, SLAs and to perform fault isolation.
- Subscriber mode involves marking subscriber traffic user plane headers in a way such that QoE for subscribers may be derived accurately as flows traverse the network.
• Passive mode testing involves observing the user traffic, providing an analysis based on this untampered traffic and raising alarms if pre-set thresholds are crossed.
• Hybrid mode approach, as the name suggests, uses the information obtained from both active and passive approaches.
5 Impact of NFV on active monitoring NFV increases the variability in the network topology imposing additional requirements on the active monitoring framework. The active monitoring solution should be able to deal with NFV aspects such as VNF migration, auto-scaling and multi-tenancy of VNFs in order to be effective in a NFV environment.
Note that there has been extensive work done which defines a similar framework as defined in the present document for performance measurement in a traditional broadband network. The IETF Large-scale Measurement has defined a framework for communication between LMAP Controller functions, LMAP Measurement Agents, and LMAP Collector functions in IETF RFC 7594 [i.6]. The LMAP Measurement Agent is similar to the VTA in role and function, but leaving the specifics of active measurement to other protocols and functions (e.g. the IETF IPPM working group supplies these metrics and protocols). Once the functions and agents are deployed, the LMAP specifications will provide a standard Information model, a YANG Data model, and a RESTCONF communications protocol.
ETSI
ETSI GS NFV-REL 004 V1.1.1 (2016-04)11
Multi-tenancy of VNFs on the same host introduces network visibility challenges when using traditional physical probes for monitoring within VNF service chains. Additionally, VNF migration may result in modification of point of presence for active monitoring. This presents a challenge of how to maintain the POP without changing the physical connections for the probes.
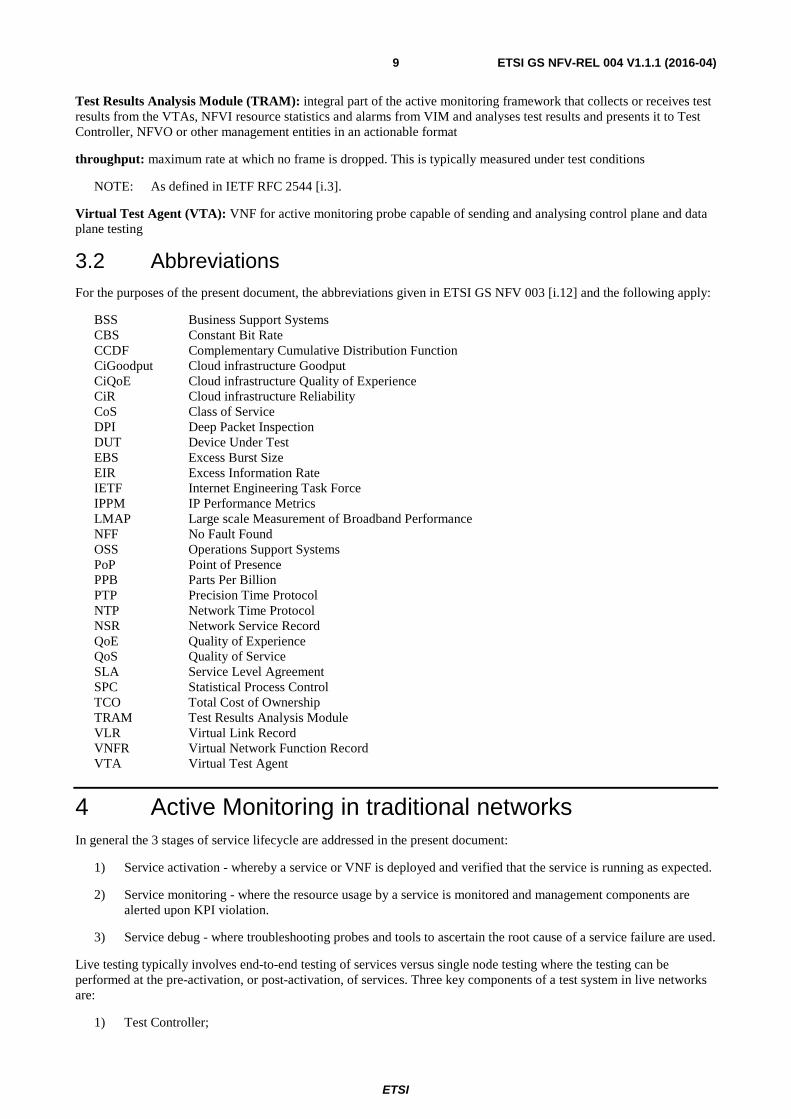
In the case where VNFs are so critical that they are protected in a 1+1 scenario and affinity rules specify that the active and standby VNFs are placed in different NFVI-PoPs, there is also an implication during VNF 1+1 protection switches. In such scenarios Test Controller should be notified of the VNF protection switch and the protection switch should take into account the NFVI resources required for the VTA on the protection path. Figure 2 shows such a scenario where EPC site 1 and EPC site 2 represents a 1+1 protection scenario.
Figure 2: VNF 1+1 impacts
Although LMAP framework provides a comprehensive details for large scale measurement for broadband networks it does not address the challenges applicable to the NFV environment. The present document presents an active monitoring framework to address these challenges. It is the intent of the present document to present the NFV active monitoring framework at a level that is not prescriptive. Although it does not preclude any future normative work to detail the operation of the framework to the level as described in LMAP framework for broadband networks.
ETSI
ETSI GS NFV-REL 004 V1.1.1 (2016-04)12
6 Proposed Active Monitoring Framework for NFV
6.0 Introduction
Figure 3: Active Monitoring Framework
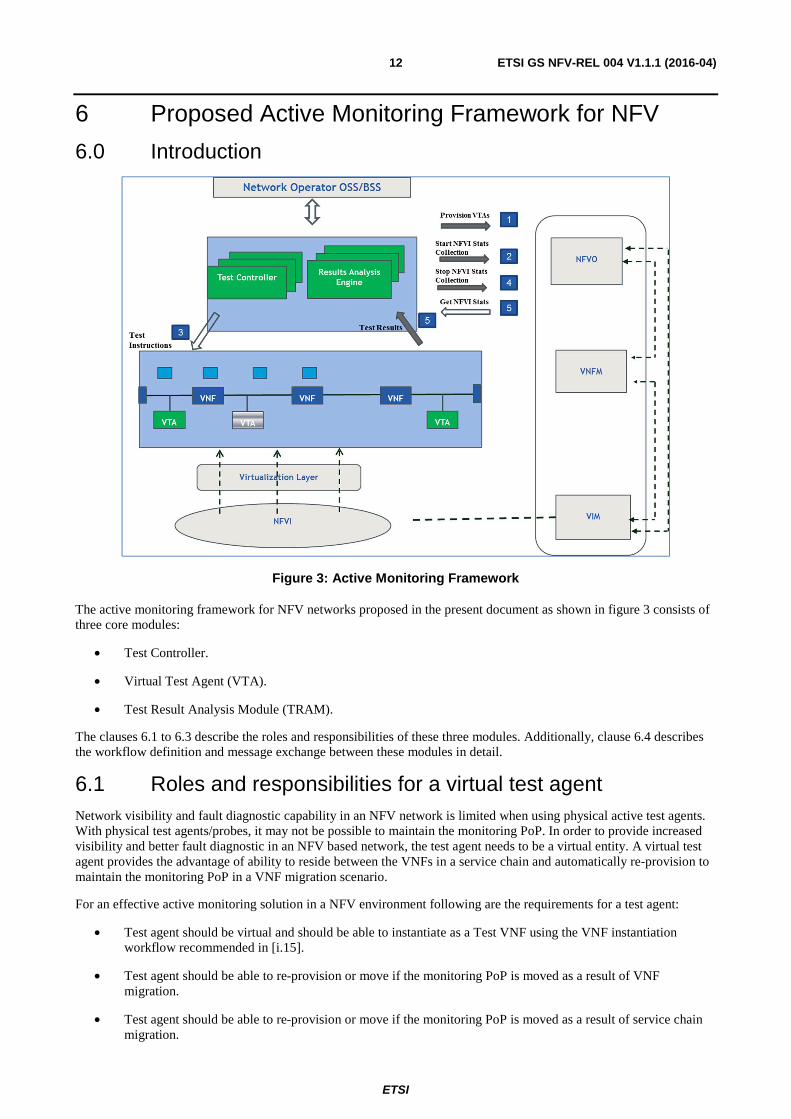
The active monitoring framework for NFV networks proposed in the present document as shown in figure 3 consists of three core modules:
• Test Controller.
• Virtual Test Agent (VTA).
• Test Result Analysis Module (TRAM).
The clauses 6.1 to 6.3 describe the roles and responsibilities of these three modules. Additionally, clause 6.4 describes the workflow definition and message exchange between these modules in detail.
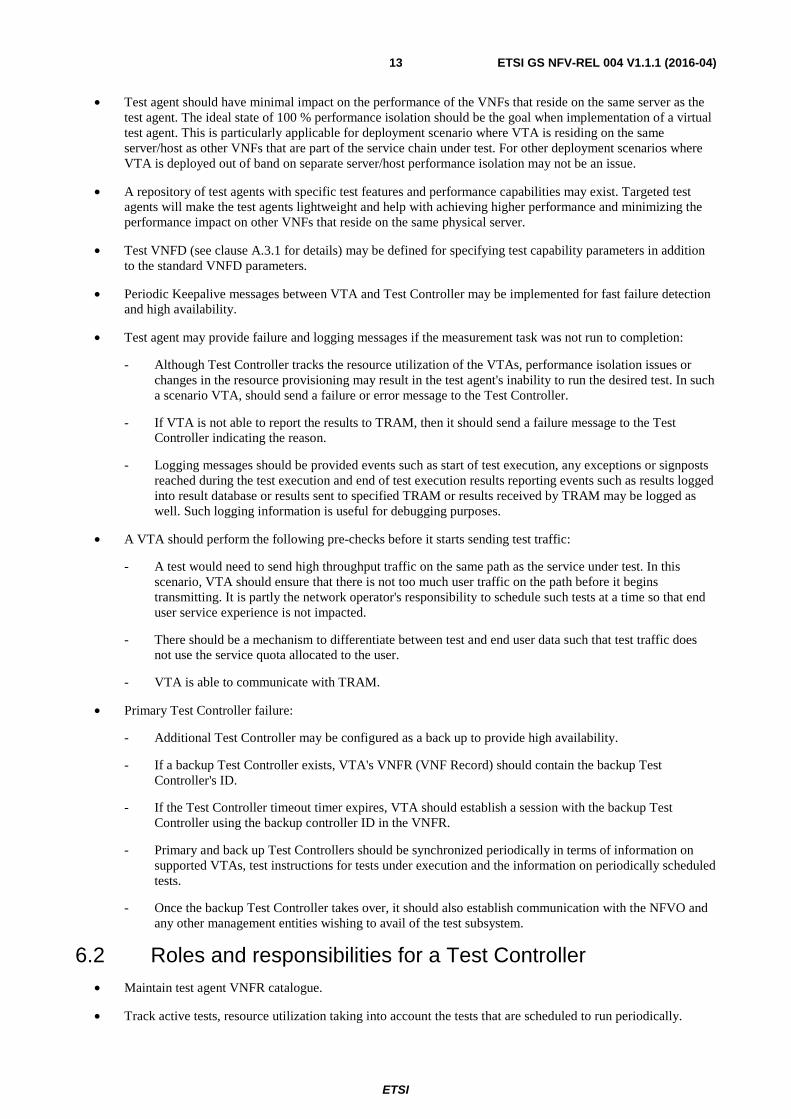
6.1 Roles and responsibilities for a virtual test agent Network visibility and fault diagnostic capability in an NFV network is limited when using physical active test agents. With physical test agents/probes, it may not be possible to maintain the monitoring PoP. In order to provide increased visibility and better fault diagnostic in an NFV based network, the test agent needs to be a virtual entity. A virtual test agent provides the advantage of ability to reside between the VNFs in a service chain and automatically re-provision to maintain the monitoring PoP in a VNF migration scenario.
For an effective active monitoring solution in a NFV environment following are the requirements for a test agent:
• Test agent should be virtual and should be able to instantiate as a Test VNF using the VNF instantiation workflow recommended in [i.15].
• Test agent should be able to re-provision or move if the monitoring PoP is moved as a result of VNF migration.
• Test agent should be able to re-provision or move if the monitoring PoP is moved as a result of service chain migration.
ETSI
ETSI GS NFV-REL 004 V1.1.1 (2016-04)13
• Test agent should have minimal impact on the performance of the VNFs that reside on the same server as the test agent. The ideal state of 100 % performance isolation should be the goal when implementation of a virtual test agent. This is particularly applicable for deployment scenario where VTA is residing on the same server/host as other VNFs that are part of the service chain under test. For other deployment scenarios where VTA is deployed out of band on separate server/host performance isolation may not be an issue.
• A repository of test agents with specific test features and performance capabilities may exist. Targeted test agents will make the test agents lightweight and help with achieving higher performance and minimizing the performance impact on other VNFs that reside on the same physical server.
• Test VNFD (see clause A.3.1 for details) may be defined for specifying test capability parameters in addition to the standard VNFD parameters.
• Periodic Keepalive messages between VTA and Test Controller may be implemented for fast failure detection and high availability.
• Test agent may provide failure and logging messages if the measurement task was not run to completion:
- Although Test Controller tracks the resource utilization of the VTAs, performance isolation issues or changes in the resource provisioning may result in the test agent's inability to run the desired test. In such a scenario VTA, should send a failure or error message to the Test Controller.
- If VTA is not able to report the results to TRAM, then it should send a failure message to the Test Controller indicating the reason.
- Logging messages should be provided events such as start of test execution, any exceptions or signposts reached during the test execution and end of test execution results reporting events such as results logged into result database or results sent to specified TRAM or results received by TRAM may be logged as well. Such logging information is useful for debugging purposes.
• A VTA should perform the following pre-checks before it starts sending test traffic:
- A test would need to send high throughput traffic on the same path as the service under test. In this scenario, VTA should ensure that there is not too much user traffic on the path before it begins transmitting. It is partly the network operator's responsibility to schedule such tests at a time so that end user service experience is not impacted.
- There should be a mechanism to differentiate between test and end user data such that test traffic does not use the service quota allocated to the user.
- VTA is able to communicate with TRAM.
• Primary Test Controller failure:
- Additional Test Controller may be configured as a back up to provide high availability.
- If a backup Test Controller exists, VTA's VNFR (VNF Record) should contain the backup Test Controller's ID.
- If the Test Controller timeout timer expires, VTA should establish a session with the backup Test Controller using the backup controller ID in the VNFR.
- Primary and back up Test Controllers should be synchronized periodically in terms of information on supported VTAs, test instructions for tests under execution and the information on periodically scheduled tests.
- Once the backup Test Controller takes over, it should also establish communication with the NFVO and any other management entities wishing to avail of the test subsystem.
6.2 Roles and responsibilities for a Test Controller • Maintain test agent VNFR catalogue.
• Track active tests, resource utilization taking into account the tests that are scheduled to run periodically.
ETSI
ETSI GS NFV-REL 004 V1.1.1 (2016-04)14
• Support high scale requirement for test agents (100 thousand virtual test agents and up), Test Controller may be implemented in a distributed manner where multiple instances of Test Controller work in collaboration.
NOTE: NFV based networks will require more number of test agents for effective monitoring and greater network visibility. The active monitoring solution for NFV is expected to reduce the cost per test agent. Considering that cost of the test agent/probe is one of the major factor that influences the SPs decision on the number of test agents that are deployed in the network, service providers and network operators may be inclined to deploy larger number of VTAs as compared to physical test probes to achieve higher network visibility and fault isolation capability
• Consider catastrophic implications of a compromised VTA or a Test Controller, a secure channel should be established for communication between Test Controller and VTAs.
• If the VTA does not have sufficient NFVI resources or feature capabilities to support the test instructions, then the Test Controller may deploy new VTAs or increase the resource allocation for the existing VTA.
• A unique test instruction identifier may be defined to compare multiple result instances for the same set of test instructions.
• Ability to supress/un-supress measurement tasks of specific VTAs, suppress specific tasks, or supress specific schedules, or suppress specific schedules of specific tasks.
• Collaboration between Test Controllers is required for HA implementations where multiple Test Controllers exist and a subset of test agents implement different communication protocol with Test Controller and TRAM.
6.3 Roles and Responsibilities for Test Results Analysis Module Result report may contain the following information:
• TRAM may be implemented as a distributed topology with multiple smaller entities collecting subset of results for achieving higher scalability when large numbers of VTAs are deployed in the network.
• It is assumed that any service SLA parameters or subscriber contract information will be available to Test Controller and association mapping will exist between the service deployed and SLA information. SLA information for the deployed service as part of the network service descriptor or network service record is one of the option to achieve the mapping and access to SLA information. The results analysis module will use this information to compare it against the test results for SLA validation.
• TRAM may use push or pull model to get the results from the virtual test agent and subsequently provide the processed results to the presentation module in the OSS/BSS via the NFVO.
• Test results:
- Start/stop timestamp for test run and the timestamp when the test results were reported.
- Test instructions, input parameters, list of VNFD ID's for test VMs that were part of the test may be included as part of results reported.
- NSR ID (Network Service Record ID) may be included.
- Alarms information for any threshold violations.
6.4 Workflow Definition Figure 4 illustrates the messages exchanged between the active monitoring entities and NFV entities for provisioning of VTAs and collection of NFVI stats from VIM.
ETSI
ETSI GS NFV-REL 004 V1.1.1 (2016-04)15
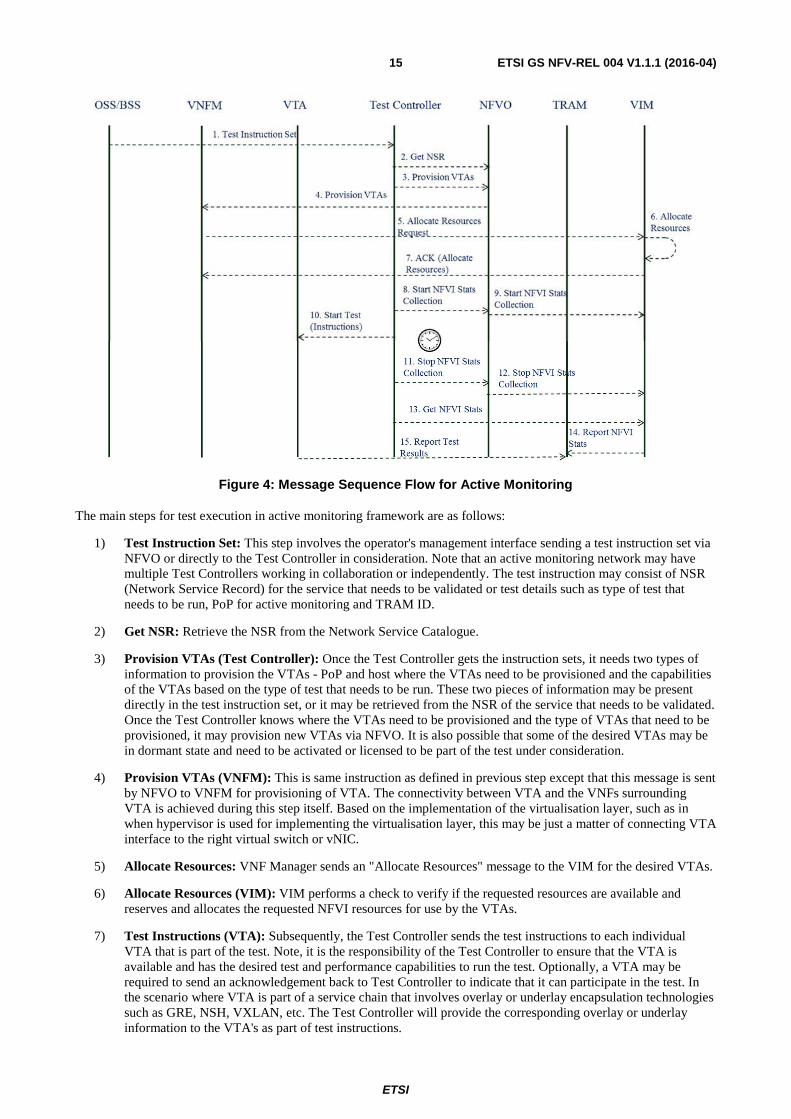
Figure 4: Message Sequence Flow for Active Monitoring
The main steps for test execution in active monitoring framework are as follows:
1) Test Instruction Set: This step involves the operator's management interface sending a test instruction set via NFVO or directly to the Test Controller in consideration. Note that an active monitoring network may have multiple Test Controllers working in collaboration or independently. The test instruction may consist of NSR (Network Service Record) for the service that needs to be validated or test details such as type of test that needs to be run, PoP for active monitoring and TRAM ID.
2) Get NSR: Retrieve the NSR from the Network Service Catalogue.
3) Provision VTAs (Test Controller): Once the Test Controller gets the instruction sets, it needs two types of information to provision the VTAs - PoP and host where the VTAs need to be provisioned and the capabilities of the VTAs based on the type of test that needs to be run. These two pieces of information may be present directly in the test instruction set, or it may be retrieved from the NSR of the service that needs to be validated. Once the Test Controller knows where the VTAs need to be provisioned and the type of VTAs that need to be provisioned, it may provision new VTAs via NFVO. It is also possible that some of the desired VTAs may be in dormant state and need to be activated or licensed to be part of the test under consideration.
4) Provision VTAs (VNFM): This is same instruction as defined in previous step except that this message is sent by NFVO to VNFM for provisioning of VTA. The connectivity between VTA and the VNFs surrounding VTA is achieved during this step itself. Based on the implementation of the virtualisation layer, such as in when hypervisor is used for implementing the virtualisation layer, this may be just a matter of connecting VTA interface to the right virtual switch or vNIC.
5) Allocate Resources: VNF Manager sends an "Allocate Resources" message to the VIM for the desired VTAs.
6) Allocate Resources (VIM): VIM performs a check to verify if the requested resources are available and reserves and allocates the requested NFVI resources for use by the VTAs.
7) Test Instructions (VTA): Subsequently, the Test Controller sends the test instructions to each individual VTA that is part of the test. Note, it is the responsibility of the Test Controller to ensure that the VTA is available and has the desired test and performance capabilities to run the test. Optionally, a VTA may be required to send an acknowledgement back to Test Controller to indicate that it can participate in the test. In the scenario where VTA is part of a service chain that involves overlay or underlay encapsulation technologies such as GRE, NSH, VXLAN, etc. The Test Controller will provide the corresponding overlay or underlay information to the VTA's as part of test instructions.
ETSI
ETSI GS NFV-REL 004 V1.1.1 (2016-04)16
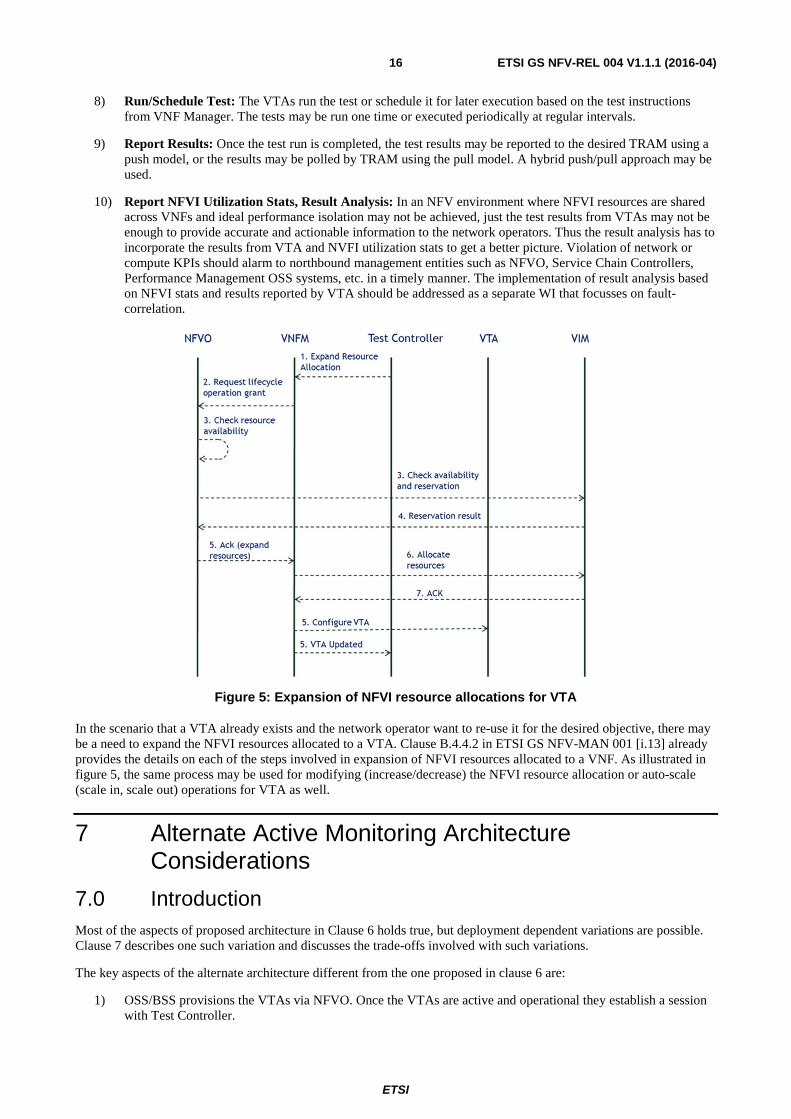
8) Run/Schedule Test: The VTAs run the test or schedule it for later execution based on the test instructions from VNF Manager. The tests may be run one time or executed periodically at regular intervals.
9) Report Results: Once the test run is completed, the test results may be reported to the desired TRAM using a push model, or the results may be polled by TRAM using the pull model. A hybrid push/pull approach may be used.
10) Report NFVI Utilization Stats, Result Analysis: In an NFV environment where NFVI resources are shared across VNFs and ideal performance isolation may not be achieved, just the test results from VTAs may not be enough to provide accurate and actionable information to the network operators. Thus the result analysis has to incorporate the results from VTA and NVFI utilization stats to get a better picture. Violation of network or compute KPIs should alarm to northbound management entities such as NFVO, Service Chain Controllers, Performance Management OSS systems, etc. in a timely manner. The implementation of result analysis based on NFVI stats and results reported by VTA should be addressed as a separate WI that focusses on fault-correlation.
Figure 5: Expansion of NFVI resource allocations for VTA
In the scenario that a VTA already exists and the network operator want to re-use it for the desired objective, there may be a need to expand the NFVI resources allocated to a VTA. Clause B.4.4.2 in ETSI GS NFV-MAN 001 [i.13] already provides the details on each of the steps involved in expansion of NFVI resources allocated to a VNF. As illustrated in figure 5, the same process may be used for modifying (increase/decrease) the NFVI resource allocation or auto-scale (scale in, scale out) operations for VTA as well.
7 Alternate Active Monitoring Architecture Considerations
7.0 Introduction Most of the aspects of proposed architecture in Clause 6 holds true, but deployment dependent variations are possible. Clause 7 describes one such variation and discusses the trade-offs involved with such variations.
The key aspects of the alternate architecture different from the one proposed in clause 6 are:
1) OSS/BSS provisions the VTAs via NFVO. Once the VTAs are active and operational they establish a session with Test Controller.
ETSI
ETSI GS NFV-REL 004 V1.1.1 (2016-04)17
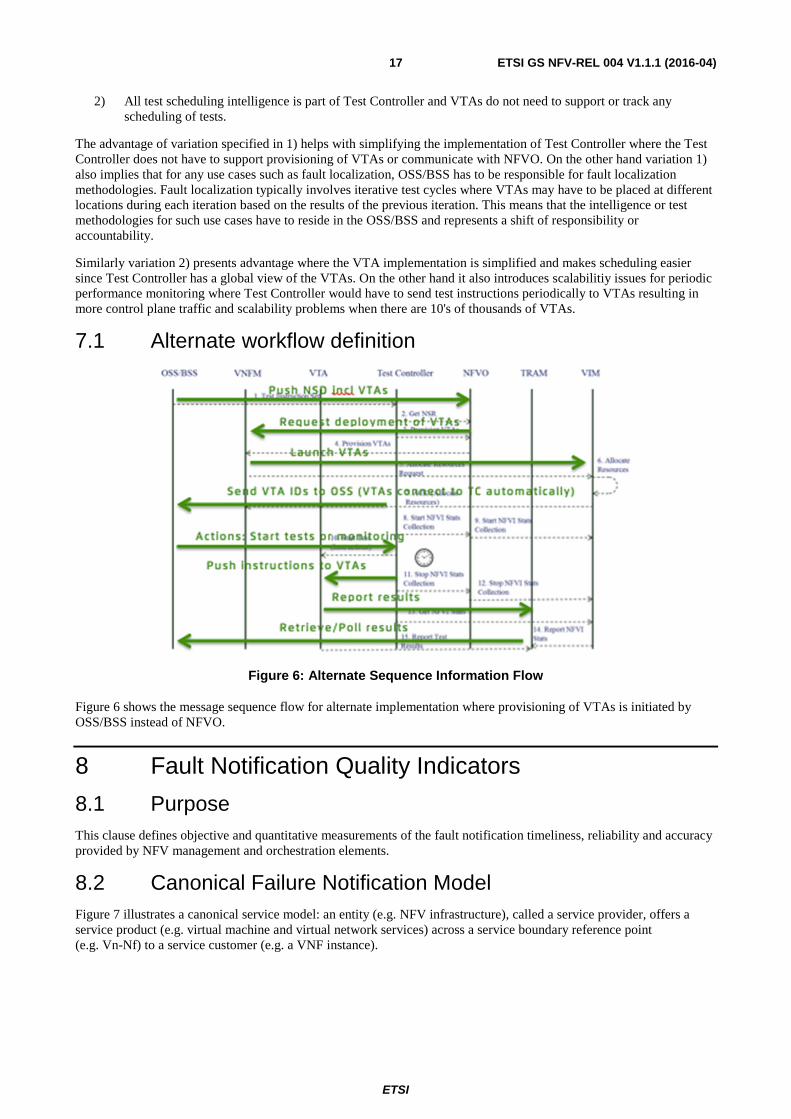
2) All test scheduling intelligence is part of Test Controller and VTAs do not need to support or track any scheduling of tests.
The advantage of variation specified in 1) helps with simplifying the implementation of Test Controller where the Test Controller does not have to support provisioning of VTAs or communicate with NFVO. On the other hand variation 1) also implies that for any use cases such as fault localization, OSS/BSS has to be responsible for fault localization methodologies. Fault localization typically involves iterative test cycles where VTAs may have to be placed at different locations during each iteration based on the results of the previous iteration. This means that the intelligence or test methodologies for such use cases have to reside in the OSS/BSS and represents a shift of responsibility or accountability.
Similarly variation 2) presents advantage where the VTA implementation is simplified and makes scheduling easier since Test Controller has a global view of the VTAs. On the other hand it also introduces scalabilitiy issues for periodic performance monitoring where Test Controller would have to send test instructions periodically to VTAs resulting in more control plane traffic and scalability problems when there are 10's of thousands of VTAs.
7.1 Alternate workflow definition
Figure 6: Alternate Sequence Information Flow
Figure 6 shows the message sequence flow for alternate implementation where provisioning of VTAs is initiated by OSS/BSS instead of NFVO.
8 Fault Notification Quality Indicators
8.1 Purpose This clause defines objective and quantitative measurements of the fault notification timeliness, reliability and accuracy provided by NFV management and orchestration elements.
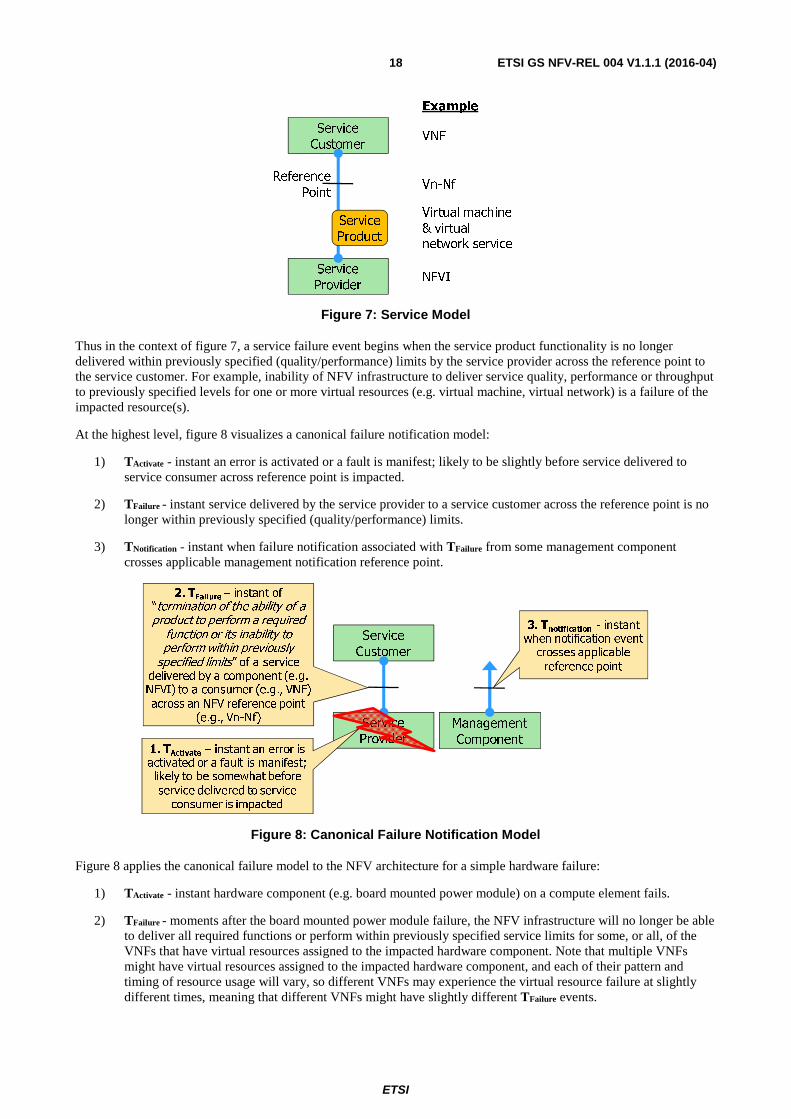
8.2 Canonical Failure Notification Model Figure 7 illustrates a canonical service model: an entity (e.g. NFV infrastructure), called a service provider, offers a service product (e.g. virtual machine and virtual network services) across a service boundary reference point (e.g. Vn-Nf) to a service customer (e.g. a VNF instance).
ETSI
ETSI GS NFV-REL 004 V1.1.1 (2016-04)18
Figure 7: Service Model
Thus in the context of figure 7, a service failure event begins when the service product functionality is no longer delivered within previously specified (quality/performance) limits by the service provider across the reference point to the service customer. For example, inability of NFV infrastructure to deliver service quality, performance or throughput to previously specified levels for one or more virtual resources (e.g. virtual machine, virtual network) is a failure of the impacted resource(s).
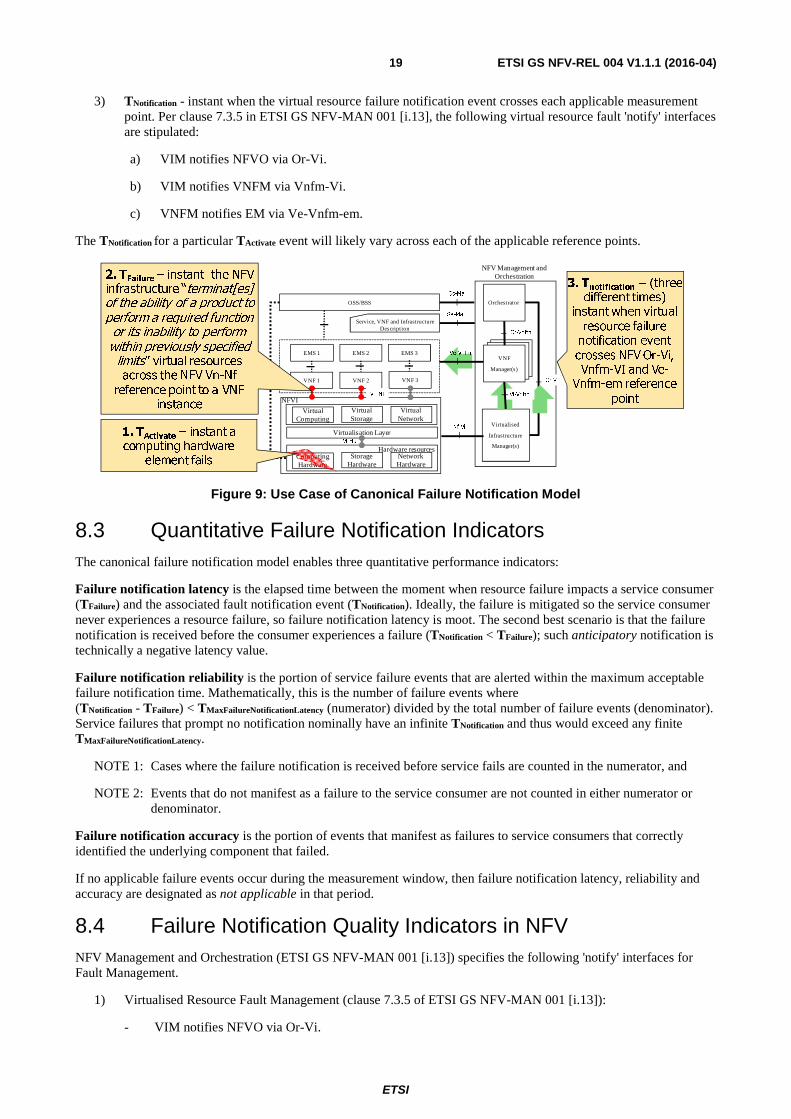
At the highest level, figure 8 visualizes a canonical failure notification model:
1) TActivate - instant an error is activated or a fault is manifest; likely to be slightly before service delivered to service consumer across reference point is impacted.
2) TFailure - instant service delivered by the service provider to a service customer across the reference point is no longer within previously specified (quality/performance) limits.
3) TNotification - instant when failure notification associated with TFailure from some management component crosses applicable management notification reference point.
Figure 8: Canonical Failure Notification Model
Figure 8 applies the canonical failure model to the NFV architecture for a simple hardware failure:
1) TActivate - instant hardware component (e.g. board mounted power module) on a compute element fails.
2) TFailure - moments after the board mounted power module failure, the NFV infrastructure will no longer be able to deliver all required functions or perform within previously specified service limits for some, or all, of the VNFs that have virtual resources assigned to the impacted hardware component. Note that multiple VNFs might have virtual resources assigned to the impacted hardware component, and each of their pattern and timing of resource usage will vary, so different VNFs may experience the virtual resource failure at slightly different times, meaning that different VNFs might have slightly different TFailure events.
Service
Provider
Service
Customer
Service
Product
Reference
Point
VNF
Vn-Nf
Virtual machine
& virtual
network service
NFVI
Example
Service
Provider
Service
Customer
Management
Component
2. TFailure – instant of “termination of the ability of a product to perform a required
function or its inability to perform within previously
specified limits” of a service delivered by a component (e.g. NFVI) to a consumer (e.g., VNF) across an NFV reference point
(e.g., Vn-Nf)
3. Tnotification - instant when notification event
crosses applicable reference point
1. TActivate – instant an error is activated or a fault is manifest; likely to be somewhat before service delivered to service
consumer is impacted
ETSI
ETSI GS NFV-REL 004 V1.1.1 (2016-04)19
3) TNotification - instant when the virtual resource failure notification event crosses each applicable measurement point. Per clause 7.3.5 in ETSI GS NFV-MAN 001 [i.13], the following virtual resource fault 'notify' interfaces are stipulated:
a) VIM notifies NFVO via Or-Vi.
b) VIM notifies VNFM via Vnfm-Vi.
c) VNFM notifies EM via Ve-Vnfm-em.
The TNotification for a particular TActivate event will likely vary across each of the applicable reference points.
Figure 9: Use Case of Canonical Failure Notification Model
8.3 Quantitative Failure Notification Indicators The canonical failure notification model enables three quantitative performance indicators:
Failure notification latency is the elapsed time between the moment when resource failure impacts a service consumer (TFailure) and the associated fault notification event (TNotification). Ideally, the failure is mitigated so the service consumer never experiences a resource failure, so failure notification latency is moot. The second best scenario is that the failure notification is received before the consumer experiences a failure (TNotification < TFailure); such anticipatory notification is technically a negative latency value.
Failure notification reliability is the portion of service failure events that are alerted within the maximum acceptable failure notification time. Mathematically, this is the number of failure events where (TNotification - TFailure) < TMaxFailureNotificationLatency (numerator) divided by the total number of failure events (denominator). Service failures that prompt no notification nominally have an infinite TNotification and thus would exceed any finite TMaxFailureNotificationLatency.
NOTE 1: Cases where the failure notification is received before service fails are counted in the numerator, and
NOTE 2: Events that do not manifest as a failure to the service consumer are not counted in either numerator or denominator.
Failure notification accuracy is the portion of events that manifest as failures to service consumers that correctly identified the underlying component that failed.
If no applicable failure events occur during the measurement window, then failure notification latency, reliability and accuracy are designated as not applicable in that period.
8.4 Failure Notification Quality Indicators in NFV NFV Management and Orchestration (ETSI GS NFV-MAN 001 [i.13]) specifies the following 'notify' interfaces for Fault Management.
1) Virtualised Resource Fault Management (clause 7.3.5 of ETSI GS NFV-MAN 001 [i.13]):
- VIM notifies NFVO via Or-Vi.
ComputingHardware
StorageHardware
NetworkHardware
Hardware resources
Virtualisation LayerVirtualised
Infrastructure
Manager(s)
VNF 2
OrchestratorOSS/BSS
NFVI
VNF 3VNF 1
Virtual Computing
Virtual Storage
Virtual Network
NFV Management and Orchestration
EMS 2 EMS 3EMS 1
Service, VNF and Infrastructure Description
Or-Vnfm
Os-Ma
Se-Ma
Nf-Vi
Vn-Nf
Vl-Ha
VNF
Manager(s)
Or-Vi
Vi-Vnfm
Ve-Vnfm
2. TFailure – instant the NFV infrastructure “terminat[es] of the ability of a product to perform a required function or its inability to perform within previously specified
limits” virtual resources across the NFV Vn-Nf
reference point to a VNF instance
3. Tnotification – (three different times)
instant when virtual resource failure
notification event crosses NFV Or-Vi, Vnfm-VI and Ve-
Vnfm-em reference point
1. TActivate – instant a computing hardware
element fails
ETSI
ETSI GS NFV-REL 004 V1.1.1 (2016-04)20
- VIM notifies VNFM via Vnfm-Vi.
- VNFM notifies EM via Ve-Vnfm-em.
2) VNF Fault Management (clause 7.2.8 of ETSI GS NFV-MAN 001 [i.13]):
- VNF notifies VNFM via Ve-Vnfm-vnf.
- VNFM notifies NFVO via Or-Vnfm.
3) Network Service Fault Management (clause 7.1.5 of ETSI GS NFV-MAN 001 [i.13]):
- NFVO notifies OSS via Os-Ma-nfvo.
It is likely that fault notification reliability and accuracy will be identical for a particular fault type (e.g. virtual resource failures) across all supported reference points (e.g. Or-Vi, Vnfm-Vi, Ve-Vnfm-em); however, the fault notification latency will likely vary across each of the reference points. Thus, the maximum acceptable fault notification time (TMaxFailureNotificationLatency) may vary both by fault type and by notification reference point. TMaxFailureNotificationLatency values are agreed by service providers and their suppliers for particular deployments rather than being subject to standardization.
9 Methods of Measurement
9.1 Introduction This clause focuses on the use cases and the methods that are currently used for the use cases. Following three use cases have been described in this clause:
• Service Activation
• Fault Isolation and troubleshooting
• Capacity Planning
The clauses 9.1 to 9.8 go into details for each of the use cases listed above and highlight the need and importance of active monitoring to address these use cases in NFV environment.
9.2 Service Activation IETF RFC 2544 [i.3] is a well-established benchmark for measuring performance of standalone network devices, but is not good enough for measuring performance of services. Activation or deployment of a service not only involves multiple network devices but also adds more complexity with associated SLAs for the end-to-end service (ETSI GS NFV-REL 005 [i.31]). NFV brings additional dependencies on virtualisation technologies and NFVI resource performance. NFV is marked by variability of performance due to multi-vendor environment and performance impact of interaction between the network functions that form the service chain. This requires periodic testing of end-to-end services to account for time varying impairments in the network.
In such an environment, it becomes imperative to test the service in an end-to-end manner and validate the ability of the network to satisfy the SLAs associated for to-be-deployed services as well as already existing services.
Recommendation ITU-T Y.1564 [i.2] defines methodologies for service activation. It tests the service configuration and performance of Committed Information Rate (CIR), Excess Information Rate (EIR), Committed Burst Size (CBS) and Excess Burst Size (EBS). Timing characteristics such as latency and delay variation are assessed not only at the maximum no loss transmit rate, but also at a rate that exceeds the CIR. Exceeding the CIR and CBS is expected in a real network and the Service Provider should be able to monitor and measure these parameters. Please refer to [i.16] for detailed methodologies on service activation in live networks.

ETSI
ETSI GS NFV-REL 004 V1.1.1 (2016-04)21
Figure 10: High level test methodology for service activation (as defined in Recommendation ITU Y.1564 [i.2])
The flowchart in figure 10 portrays how Recommendation ITU Y.1564 [i.2] can be used for service configuration test, service performance test and for troubleshooting services. These are integral activities that the Service Providers need to perform before service activation.
For NFV environments, it is important to understand the impact of supporting the SLAs associated with service together with the understanding of the NFVI resource utilization when these services are exposed to the extremes of the SLA limits. Thus, result analysis for live testing should take into account both the results obtained from test traffic and the NFVI utilization statistics when the service is exposed to various test workloads during the test.
In addition, the sharing of NFVI resources, across the services deployed, warrants verifying that the SLAs for existing services still holds true when new services are provisioned and activated.
Traditionally, service activation has focused on testing using L2-L3 traffic. With the transition from traditional networks to NFV based networks, performance testing based on L2-L3 test traffic is not sufficient. The variability in the network due to shared NFVI resources raises the importance of testing that focuses on QoE for the E2E services versus QoS. End users are primarily concerned about the QoE of the services and may not care about the QoS based SLAs provided by service providers. Thus, there is a need for service activation testing using stateful L4-L7 traffic or application traffic that emulates the end user service. IETF RFC 6349 [i.11] provides a well-established standard for benchmarking TCP throughput performance and is useful for establishing the performance benchmark for most of the stateful E2E services and applications. In addition, application testing by emulation of high scale real application traffic is an important feature in a test tool to validate the QoE for the end user.
NOTE 1: Generating high-scale application level traffic may impose some significant requirements on the test infrastructure. Any high-scale or high-volume traffic should be used in a turn up scenario only.
1) In a scenario where high volume test traffic is generated in-line with active subscriber traffic, the SP or network operator needs to ensure that such tests do not become intrusive to active subscriber traffic, and thus should not have an inadvertent negative impact on QoE.
2) When VTA needs to be migrated, operator needs to ensure that the target compute node supports the NFVI resources and capabilities required by the VTA.
ETSI
ETSI GS NFV-REL 004 V1.1.1 (2016-04)22
A mechanism that may be of interest here is detailed in [i.32]. This measures subscriber traffic (not OAM) in the underlay and VNFs along a service chain. This does not impose any requirements for complex application traffic generation. Also INT may be of interest here in the mid term
Clause B.1 lists some of the test methodologies for application level testing that measures the QoE for specific types of user workloads [i.34].
There are multiple vectors for improving QoE in a constrained resource environment. One vector, as an example, is elasticity, or capacity on demand. Elasticity or capacity on demand may have an impact on the end user's experience. As part of the service activation, it is important to test the ability of the network to rapidly auto-scale based on the user traffic, such that the end user's QoE is not impacted. This testing may be done by exposing the service to various user workloads with varying slew rate and distribution mechanisms.
Clause B.2 lists some of the common workloads that exercise the network's capacity to dynamically expand, or contract, capacity. The max rate or max burst size of these workloads should be calibrated such that it triggers auto-scale at the appropriate threshold to allow the orchestration of the additional capacity to complete.
NOTE 2: The support for realistic user workloads requires advanced capabilities from the VTA. The complexity of feature support in VTA and the comprehensive testing during service activation is a trade-off that a network operator has to make.
9.3 Fault Isolation and Troubleshooting
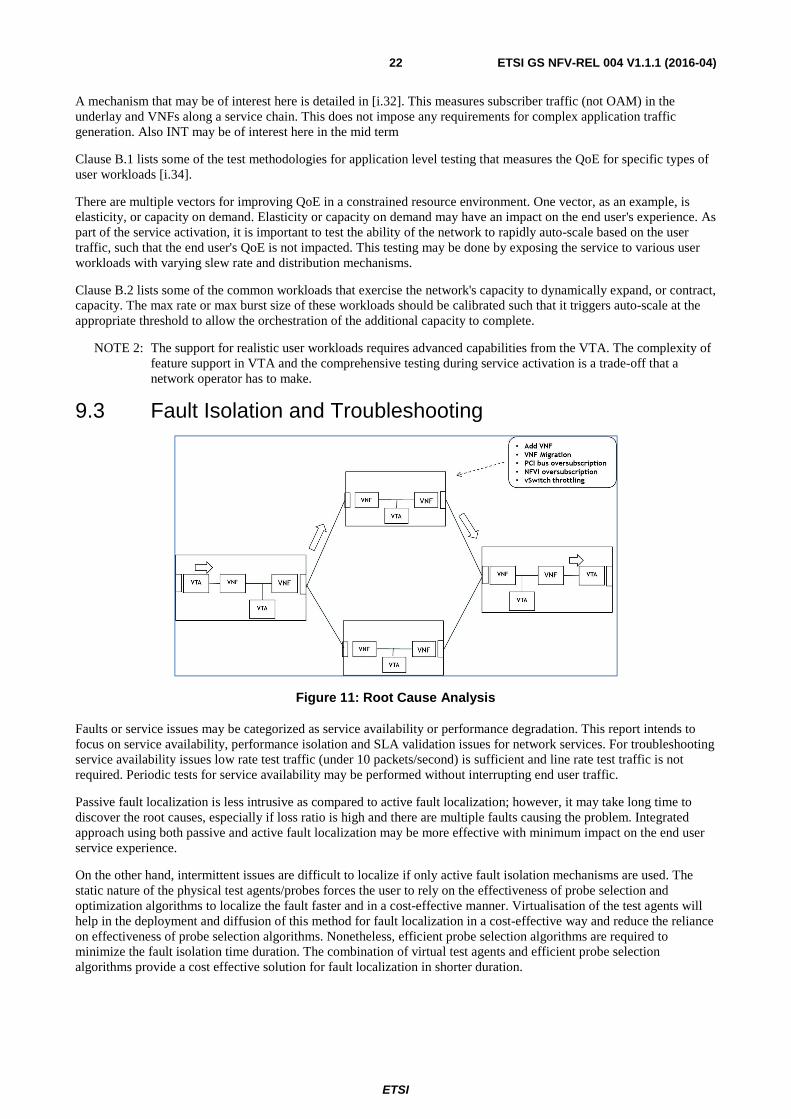
Figure 11: Root Cause Analysis
Faults or service issues may be categorized as service availability or performance degradation. This report intends to focus on service availability, performance isolation and SLA validation issues for network services. For troubleshooting service availability issues low rate test traffic (under 10 packets/second) is sufficient and line rate test traffic is not required. Periodic tests for service availability may be performed without interrupting end user traffic.
Passive fault localization is less intrusive as compared to active fault localization; however, it may take long time to discover the root causes, especially if loss ratio is high and there are multiple faults causing the problem. Integrated approach using both passive and active fault localization may be more effective with minimum impact on the end user service experience.
On the other hand, intermittent issues are difficult to localize if only active fault isolation mechanisms are used. The static nature of the physical test agents/probes forces the user to rely on the effectiveness of probe selection and optimization algorithms to localize the fault faster and in a cost-effective manner. Virtualisation of the test agents will help in the deployment and diffusion of this method for fault localization in a cost-effective way and reduce the reliance on effectiveness of probe selection algorithms. Nonetheless, efficient probe selection algorithms are required to minimize the fault isolation time duration. The combination of virtual test agents and efficient probe selection algorithms provide a cost effective solution for fault localization in shorter duration.
ETSI
ETSI GS NFV-REL 004 V1.1.1 (2016-04)23
It is well understood that when a critical failure occurs, it is important to restore the service or have redundancy built into the network design to protect against failures so that the end user service impact is minimal. The first step to restore the service is to isolate the fault. This process is well understood in traditional networks, but not so much in the NFV environment. A single E2E service failure may have multiple causes and, at the same time, single root cause may be responsible for multiple service failures. Additionally, service failures may not be just service availability failure, but it may be service quality degradation as well.
Note that although the general procedure outlined in the following steps for fault localization is applicable, there is plenty of room to optimize the fault localization time through proprietary probe selection algorithms, and procedures to isolate faults affecting multiple services at the same time. In addition, the fault localization procedures have to take into account any dependency on dynamic routing for calculation of service VNFFG. There is a possibility that VNFFG may be modified when the fault localization procedure is not completed. In addition, due to the presence of load balancers and high availability architectures, the test packets need to test the alternative paths through explicit routes. Policies may be defined at the NFVO level to restrict any changes to the components of the service till the fault localization procedure on the service is completed. It is not the intent of the present document to provide optimized algorithms for fault localization, but to highlight the need and possibility of such mechanisms.
Recommendation: Feature request for IFA to add API at NFVO to restrict any changes to the service or its components till the API to reset this behaviour is called.
Figure 11 shows a service chain that spans across compute nodes and shows how VTAs may be provisioned at various monitoring PoPs to localize and identify the faults.
A generic procedure for fault localization is as follows:
1) Sectionalize the service.
2) Test each of the sections independently to localize the server and then, subsequently, specific the VNF/VNFs causing the service degradation or failure.
3) The Test Controller should have the ability to parse through the VNFs within the sections and determine how the payload may be modified by the intermediate VNFs and configure the test gents to take the payload modification into account for making various types of SLA, QoS or QoE measurements, e.g. MPLS labels, VXLAN encapsulation or any other type of encapsulation or de-capsulation.
4) Once the causal VNF, or set of VNFs, is localized, narrow down the cause for the fault to VNF software, hypervisor or other NVFI resources based on looking at the alarms, triggers and NFVI statistics obtained when the test iterations were executed. The detailed procedure of identifying the individual components and type of faults/failures is explained in ETSI GS NFV-REL 001 [i.14], clauses 7 and 8. Subsequently, the results may be reported to the results analysis engine.
5) The network operator may go through similar iterations to verify the service reliability once the cause of the fault has been fixed, since there may be multiple reasons for the service degradation.
Setting of NFVI utilization thresholds may help in detection of service degradation, but determining the correct value of the threshold that represents service performance degradation is difficult as the E2E service degradation is a function of resource allocation at each of the intermediate points. There may also be an impact of another service taking more of shared resources or temporary capacity degradation of an NFVI resource.
Due to so much variability in the NFV environment setting of appropriate thresholds for each of the NFVI resources that indicate E2E service degradation is a gargantuan task. If at all such an attempt is made it may not provide reliable and repeatable diagnosis.
That's why it becomes important to continuously validate the thresholds set for monitoring service quality by using active monitoring techniques in a proactive manner.
The scenarios when active monitoring is required in tandem with monitoring of NFVI resource utilization include:
• Elasticity thresholds or policies are incorrect or slew rate is slower than expected and cannot adapt to the changing workload pattern.
• VNFs respond or forward appropriately to test traffic, but are not processing subscriber traffic correctly for some reason.
• NFVI performance measurements are not accurate or obtained timely for the corrective action.

ETSI
ETSI GS NFV-REL 004 V1.1.1 (2016-04)24
• Elasticity actions taken in response to threshold violation or alarms generation need to be verified as the actions may not have fixed the issue or the actions may not have been completed successfully for variety of reasons.
Once the fault isolation is narrowed down to a particular VNF, further analysis is required to identify if the VNF is causing the service failure or is it due to NFVI impairment or is it due to the guest OS used by the VNF. This may be done using simple analysis such as presented in [i.16]:
1) Probing availability of the VM instance's operating system (e.g. via ping).
2) Checking status of the VM instance hosting the non-response VNF component instance via a cloud service provider mechanism (e.g. API) to see if the VM instance is reported to be operational.
3) Heartbeat mechanism to check the liveness of the VNF.
9.4 Failure detection Chapter 14 of [i.16] further illustrates how measurement of aspects such as non-delivery of VNF/VNFC capacity, measurement of service latency, clock event jitter and clock drift can help in drilling down deeper as part of the fault isolation process.
Following measurements as described in [i.16] further illustrate the type of actions that may be taken as part of fault detection and isolation.
"Measurement of non-delivery of VM capacity
Measurement of non-delivery of configured VM CPU capacity can be measured by comparing the timestamps of high frequency regularly scheduled events to isolate intervals when the VM did not run. Non-delivery of network capacity can be measured by comparing output queues with transmit data statistics. An increase in queue depth without a corresponding increase in transmitted bits may indicate a network non-delivery condition.
NOTE: How do you check queue length?
Measurement of delivery of degraded VM capacity
Growing work queues when the volume of offered work remains stable may indicate that the virtualized infrastructure is delivering less resource capacity. Likewise, an increase in IP packet retransmissions or lost packets suggests that cloud networking infrastructure may be congested and thus is discarding packets. Analysis of performance counters from the guest OS or the hypervisor can offer insights into the quality of infrastructure service delivered by the cloud service provider.
Measurement of service latency
The traditional way to monitor and characterize that service latency would be to build latency performance complimentary cumulative distribution functions (CCDF) or histograms. As we know that only limited number of buckets for histogram measurements are available and it is cumbersome to determine the size the limits of the histograms to monitor the latency. Additionally the variance in case of NFV environment is high and the latency measurements need to be done more frequently. This may yield large amount of data which to store and analyze. Average latency and variance in latency may be used instead of actual latency measurement to deal with the large data challenge in order to characterize the latency of a service, or Bid Data techniques may be used to address the issue.
Measurement of clock event jitter
Measure the mean and variance latency between when each clock event was requested to trigger (e.g. 1000 μs from now) and when the timer service routine was actually executed e.g. 2345 μs later).
Measurement of clock drift
Time synchronization programs, such as NTP and PTP daemon, can be configured to log the clock adjustments they make, and analysis of these adjustment logs enables one to characterize the nature and magnitude of clock drive experienced by each VM instance. Clock synchronization status should be accessible to management entities and synchronization state transition should alarm into the VIM.
ETSI
ETSI GS NFV-REL 004 V1.1.1 (2016-04)25
Measurement of failed or slow allocation and startup of VNF
If the application's monitoring and control component explicitly initiates VM instance allocation for application startup and growth actions, then that monitoring and control component can measure the response latency and status of the allocation and startup of VM instances. It is useful to record at least the following details for each VM allocation request:
1) Time of allocation request
2) Characteristics of VM being requested (e.g. number of CPU cores and RAM allocation) 3. Time of allocation response
3) Final status of allocation request (e.g. success or error code)."
Additionally, some of the described in service quality metrics such as packet delay, packet delay variation, and frame loss as described in Recommendation ITU-T Y.1731 [i.9] can be used to localize the root cause of service degradation by measuring these metrics for each section of the impacted network segment.
9.5 Framework for End to End in Situ Monitoring
Historically, non-NFV networks have been monitored using standalone passive monitoring methodologies that are reactive in nature. The traditional monitoring techniques by themselves do not provide the capability to detect errors proactively and there is a need for a different level of monitoring in NFV based networks, in addition to the traditional monitoring techniques. Also, having network components from a variety of vendors has made it even more difficult to find patterns in the data because this data is usually not in a standard format particularly so in VNFC-to-VNFC communication. This has ultimately contributed to relatively high sustained No Fault Found (NFF) rates under certain circumstances. Anticipating how dynamic and decentralized NFV networks will likely become in the future, there is an opportunity to utilize the new type of network to take a much more ubiquitous and proactive monitoring approach that makes use of the best known practices that have matured in the IT industry (Agile, Big Data, ubiquitous in situ monitoring, etc.) to ensure a much more flexible and adaptable network to better address the current and future needs of the end user. This monitoring would occur in a live network rather than a lab environment and, subsequently, get scaled up as appropriate while still implementing concepts from the automobile production methods (e.g. Lean, SPC, continuous improvement, etc.). To make this approach much more effective than what has been done in non-NFV networks, monitoring the VNF, NFVI, and MANO components would be essential to identify the root cause in timely and effective manner. The in-situ monitoring in combination with active monitoring and passive monitoring of user traffic presents a comprehensive monitoring solution for NFV based networks.
Assuming a Fault�Error�Failure model [i.21] in conjunction with utilizing a modular network element approach, a basic set of metrics can be monitored from an end to end perspective (e.g. error rate, junction temperature, memory utilization, etc.) in situ on an ongoing basis to determine, with a minimal number of resources, the basic health of the network. If a monitored value is determined to be outside of a tolerance or specification range, then additional metrics from a larger standard set of metrics list (active/passive/hybrid metrics) can be captured and reported to an automatically updated network health dashboard and technical resources that can evaluate, as well as permanently resolve, the issue(s). This would be a two-step process. The first step would be a short term solution to identify the root cause of the problem by catching it early enough to clearly see the initiating issue and fix the symptom. For example, for a software coding fault, the erroneous value can then be replaced with a known safe value as part of a fault tolerance mechanism to help the overall network be more fault-tolerant. If there is a hardware fault, then the appropriate action can be prompted (e.g. sharing the resource load if the processor temperature gets too high, using an alternative hardware resource if the voltage is unstable or within specification, but not within the defined tolerance range, correlating reliability data from chipsets or other components based on service time or use cases). The longer term fix would be to remove it from the network and/or change the hardware or software design to prevent the problem from ever occurring again. The Fault�Error�Failure model [i.21], along with this larger standard set of metrics list, will enable operators to proactively find patterns in the data which will help to identify the root causes of errors before they cascade into such large and complex issues that it becomes difficult to identify the root cause of the problem. Since the hardware, and likely the software, will be common among operators, this information can potentially be aggregated globally while still maintaining privacy to help reduce the uncertainty in any reliability models, as well as, finding subtle problems in either the hardware or software that may only be seen at a Parts Per Million (PPM) or Parts Per Billion (PPB) level rather than just at a percent level. This approach will help catch problems like last year's industry wide memory design issue much earlier in the cycle so that it will not take years to find it, as well as reducing the number of resources necessary to eliminate the problem.
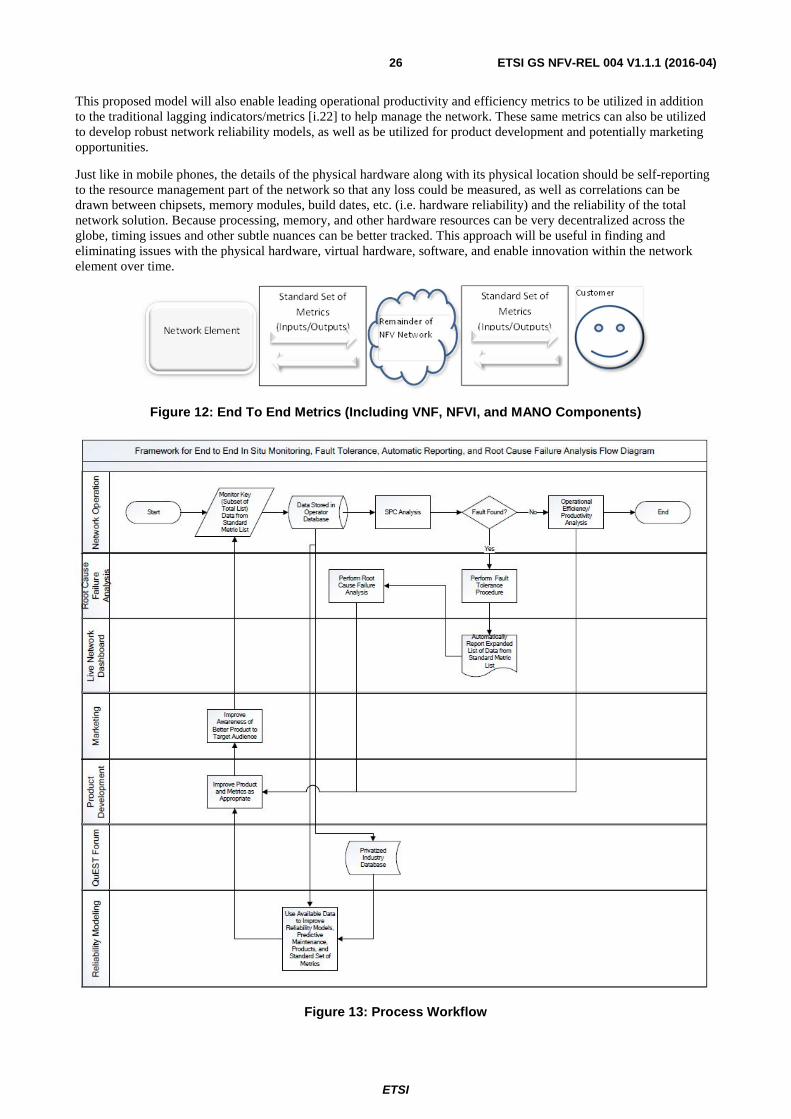
ETSI
ETSI GS NFV-REL 004 V1.1.1 (2016-04)26
This proposed model will also enable leading operational productivity and efficiency metrics to be utilized in addition to the traditional lagging indicators/metrics [i.22] to help manage the network. These same metrics can also be utilized to develop robust network reliability models, as well as be utilized for product development and potentially marketing opportunities.
Just like in mobile phones, the details of the physical hardware along with its physical location should be self-reporting to the resource management part of the network so that any loss could be measured, as well as correlations can be drawn between chipsets, memory modules, build dates, etc. (i.e. hardware reliability) and the reliability of the total network solution. Because processing, memory, and other hardware resources can be very decentralized across the globe, timing issues and other subtle nuances can be better tracked. This approach will be useful in finding and eliminating issues with the physical hardware, virtual hardware, software, and enable innovation within the network element over time.
Figure 12: End To End Metrics (Including VNF, NFVI, and MANO Components)
Figure 13: Process Workflow
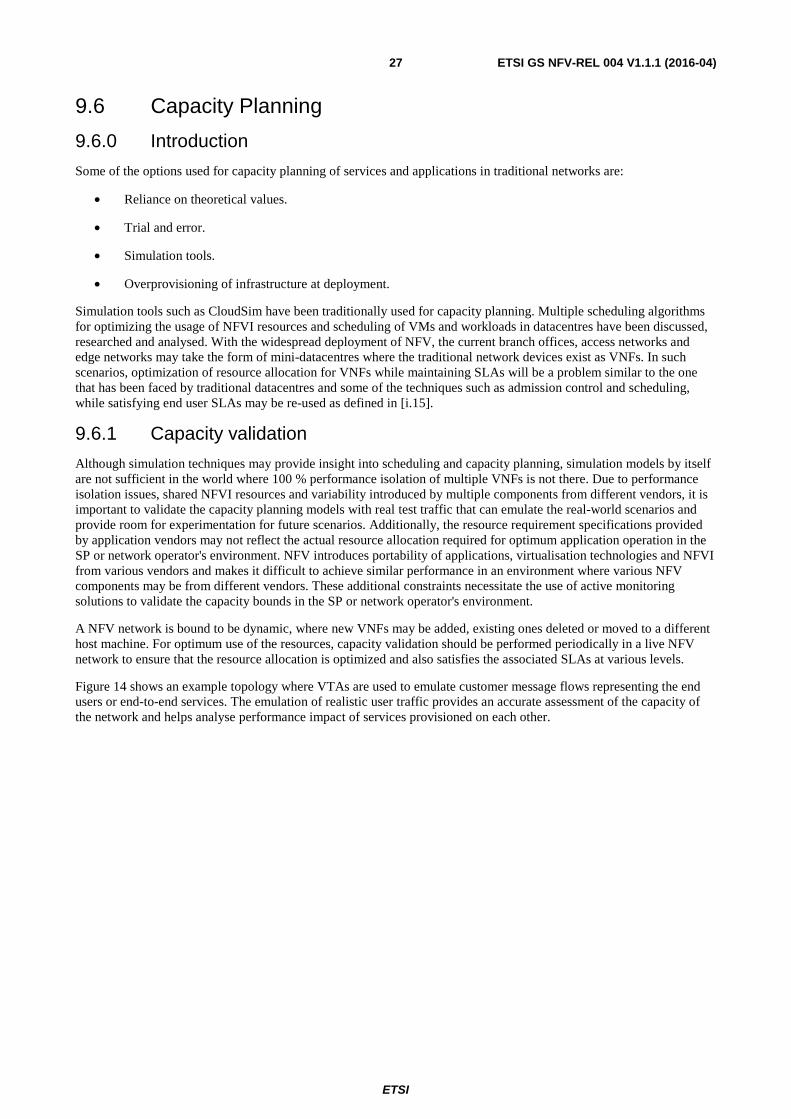
ETSI
ETSI GS NFV-REL 004 V1.1.1 (2016-04)27
9.6 Capacity Planning
9.6.0 Introduction
Some of the options used for capacity planning of services and applications in traditional networks are:
• Reliance on theoretical values.
• Trial and error.
• Simulation tools.
• Overprovisioning of infrastructure at deployment.
Simulation tools such as CloudSim have been traditionally used for capacity planning. Multiple scheduling algorithms for optimizing the usage of NFVI resources and scheduling of VMs and workloads in datacentres have been discussed, researched and analysed. With the widespread deployment of NFV, the current branch offices, access networks and edge networks may take the form of mini-datacentres where the traditional network devices exist as VNFs. In such scenarios, optimization of resource allocation for VNFs while maintaining SLAs will be a problem similar to the one that has been faced by traditional datacentres and some of the techniques such as admission control and scheduling, while satisfying end user SLAs may be re-used as defined in [i.15].
9.6.1 Capacity validation
Although simulation techniques may provide insight into scheduling and capacity planning, simulation models by itself are not sufficient in the world where 100 % performance isolation of multiple VNFs is not there. Due to performance isolation issues, shared NFVI resources and variability introduced by multiple components from different vendors, it is important to validate the capacity planning models with real test traffic that can emulate the real-world scenarios and provide room for experimentation for future scenarios. Additionally, the resource requirement specifications provided by application vendors may not reflect the actual resource allocation required for optimum application operation in the SP or network operator's environment. NFV introduces portability of applications, virtualisation technologies and NFVI from various vendors and makes it difficult to achieve similar performance in an environment where various NFV components may be from different vendors. These additional constraints necessitate the use of active monitoring solutions to validate the capacity bounds in the SP or network operator's environment.
A NFV network is bound to be dynamic, where new VNFs may be added, existing ones deleted or moved to a different host machine. For optimum use of the resources, capacity validation should be performed periodically in a live NFV network to ensure that the resource allocation is optimized and also satisfies the associated SLAs at various levels.
Figure 14 shows an example topology where VTAs are used to emulate customer message flows representing the end users or end-to-end services. The emulation of realistic user traffic provides an accurate assessment of the capacity of the network and helps analyse performance impact of services provisioned on each other.
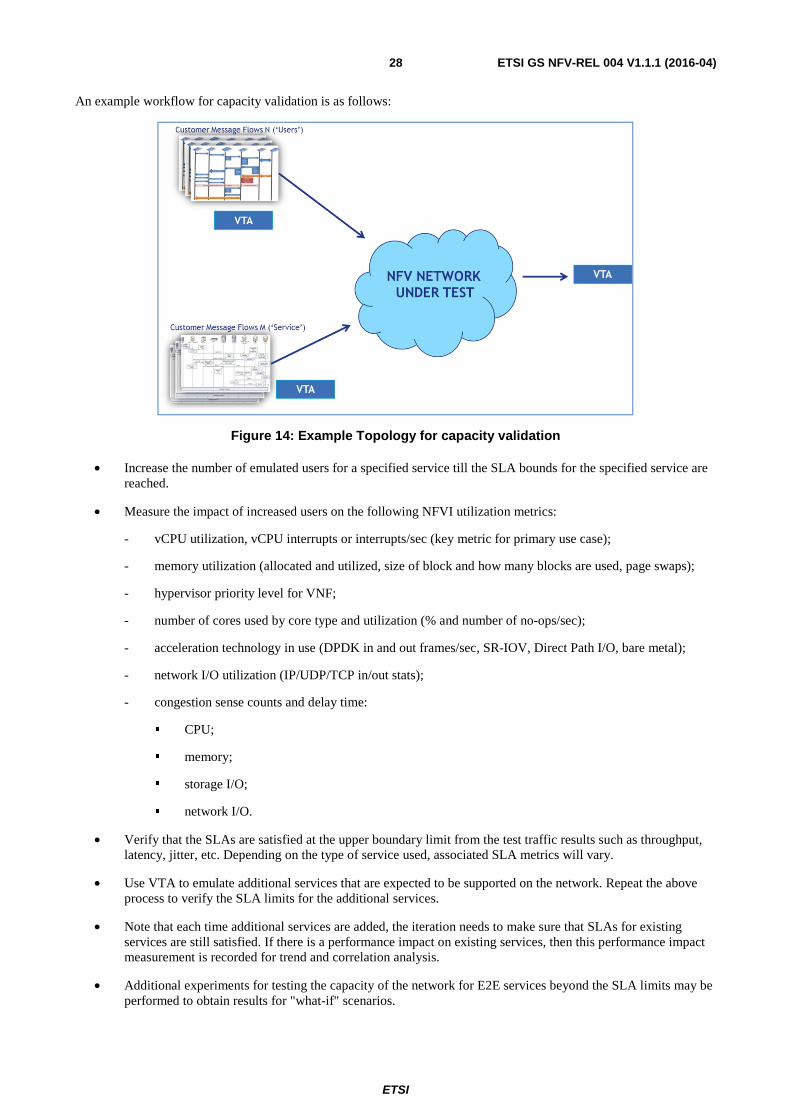
ETSI
ETSI GS NFV-REL 004 V1.1.1 (2016-04)28
An example workflow for capacity validation is as follows:
Figure 14: Example Topology for capacity validation
• Increase the number of emulated users for a specified service till the SLA bounds for the specified service are reached.
• Measure the impact of increased users on the following NFVI utilization metrics:
- vCPU utilization, vCPU interrupts or interrupts/sec (key metric for primary use case);
- memory utilization (allocated and utilized, size of block and how many blocks are used, page swaps);
- hypervisor priority level for VNF;
- number of cores used by core type and utilization (% and number of no-ops/sec);
- acceleration technology in use (DPDK in and out frames/sec, SR-IOV, Direct Path I/O, bare metal);
- network I/O utilization (IP/UDP/TCP in/out stats);
- congestion sense counts and delay time:
� CPU;
� memory;
� storage I/O;
� network I/O.
• Verify that the SLAs are satisfied at the upper boundary limit from the test traffic results such as throughput, latency, jitter, etc. Depending on the type of service used, associated SLA metrics will vary.
• Use VTA to emulate additional services that are expected to be supported on the network. Repeat the above process to verify the SLA limits for the additional services.
• Note that each time additional services are added, the iteration needs to make sure that SLAs for existing services are still satisfied. If there is a performance impact on existing services, then this performance impact measurement is recorded for trend and correlation analysis.
• Additional experiments for testing the capacity of the network for E2E services beyond the SLA limits may be performed to obtain results for "what-if" scenarios.

ETSI
ETSI GS NFV-REL 004 V1.1.1 (2016-04)29
This testing may be performed periodically to assess the capacity of the network as the NFV network is expected to be dynamic and addition, deletion and migration of VNFs are expected.
9.6.2 Capacity planning forecast
Forecasting capacity requirements in any environment is a difficult task that requires ability to run experiments for hypothetical workload scenarios. Consider a situation where an application or a service becomes popular in a very short duration of time leading to exponential increase in workload for the service. This warrants some type of modelling where the SP can anticipate the resource requirement needs, chart out a roadmap for such events and assign signposts for such a roadmap. The SP or network operator can subsequently monitor the signals that indicate towards the signposts on the roadmap and get a head start on resource procurement and planning before the increased workload hits the end-user QoE. This technique of road mapping and signposts has been traditionally used in predicting technology futures, but it should be equally effective in forecasting demand and the type of resource required in the near future. This applies the legacy physical constraint model to the NFV world, in which VNFs share the same physical resources.
Here again, a combination of active and passive monitoring can be used to achieve the forecasting objectives for resource planning.
9.6.3 Optimize service endpoint location
It is always a challenge for SPs and network operators to balance the optimization of end customer QoE and TCO for providing the service. One of the key aspects involved is the location of service delivery endpoint. Service endpoint located closer to end customer in case of services such as video do improve the QoE for the end user, as it helps with lower delays and jitter in the video stream. But at the same time, maintaining multiple caching PoP closer to end consumer may not scale well for the SP and increases the TCO. While NFV is subject to the same constraints as physical functions in terms of resource overprovisioning and workload variance/oversubscription with increasing distribution NFV does bring advantage of dynamic provisioning and helps the SP to decide an optimum PoP for the caching location. Increasingly dynamic bandwidth demand/usage and dynamic nature of NFV networks may impact the decision for PoP and the resource allocation for the service delivery PoP. Active monitoring can help validate these decisions at the provisioning time and periodic post deployment validation. Ultimately, decisions on the placement of NFV-I resources will be driven by a combination of technical criteria and economic (CAPEX, OPEX) criteria.
Another important aspect as part of the capacity planning and network design for NFV networks is the PoP selection for VNF provisioning. Operator decisions for the treatment of traffic at utilization thresholds will vary. It may be an operator decision to satisfy or exceed SLA constraints at the expense of optimum utilization, or it may be the operator decision to violate SLAs in order to optimize resource utilization. The PoP or NFVI resource location should be such that the SLA constraints for the services served by the VNF are satisfied and, at the same time, achieve optimum resource utilization. At the initial provisioning time, it may not be evident which and how many services will be traversing the VNF.
Additionally, the number of services and the type of services traversing the VNF can change during the lifecycle of the VNF. This again warrants periodic verification of the SLA validation to ensure that appropriate NFVI resources are available and if there is a need for NFVI resource consolidation or VNF migration.
In addition to the NFVI resource allocated to the VNFs that form the E2E service, underlay and overlay network design impact the performance and SLAs for the E2E services as well. This introduces another variable which needs to be validated to ensure that the underlay and overlay network design and resource provisioning provides enough capacity for the E2E services. Active monitoring can help validate the appropriate design by measuring the performance and SLA validation for the design options of the underlay and overlay networks.
9.7 Performance monitoring
9.7.1 SLA Monitoring for E2E services
The above service lifecycle figure in TM Forum TR 178 [i.18] highlights some of the important components of a monitoring system. Components such as Service Metrics Monitor, Service Resource Monitor and Service Usage Monitor re-iterate the need to develop and understand the correlation between service behaviour, NFVI resource usage and provisioning. Service dashboard becomes an integral part of the periodic monitoring scenario which provides information related to the metrics and resource usage for the services that are monitored.
The following text introduces the tools that are used for performance monitoring and discusses the applicability of the tools at a high level.

ETSI
ETSI GS NFV-REL 004 V1.1.1 (2016-04)30
Tools such as ping and traceroute serve a good purpose to verify connectivity and map the topology path for the service, but have limitations in providing these services or accurate latency measurements for the following scenarios:
• When using ping for measuring RTT, due to path asymmetry, the intermediate hop may not be part of the reverse path from the destination, thus the RTT calculation may not represent the correct value.
• When using ping, the forward path up to the intermediate hop may not represent a sub-path of the forward path toward the destination, since forwarding is destination-based.
TWAMP
TWAMP is a two way active measurement protocol that uses a TCP client/server model and primarily focuses on round trip performance measurement. The details of TWAMP protocol and measurement mechanisms can be found in IETF RFC 5357 [i.1]. Two way measurements are useful and desired in certain situations such as when measurement tools are not available at destination, or reference clock timing synchronization between source and destination is not achievable. Getting high accuracy in timing synchronization in virtual environments is a difficult problem to solve and is particularly applicable to NFV. Additionally, round-trip measurements provide a better estimate of processing time at the destination.
On the other hand, there are scenarios where round-trip measurements are not preferred and may introduce inaccuracies in measurement.
The issues with round-trip measurements [i.4] include:
• "The Internet path from a source to a destination may differ from the path from the destination back to the source ("asymmetric paths"), such that different sequences of routers are used for the forward and reverse paths. Therefore, round-trip measurements actually measure the performance of two distinct paths together.
• Even when the two paths are symmetric, they may have radically different performance characteristics due to asymmetric queueing.
• Performance of an application may depend mostly on the performance in one direction.
• In QoS enabled networks, provisioning in one direction may be radically different than provisioning in the reverse direction, and thus the QoS guarantees differ."
Recommendation Y.1731
Recommendation ITU-T Y.1731 [i.9] defines standard Ethernet performance monitoring functionality that includes the following performance monitoring parameters:
• connectivity;
• frame delay and frame delay variation;
• frame loss ratio and availability;
• throughput.
Recommendation ITU-T Y.1731 [i.9] defines control plane Ethernet messages for the above listed OAM and performance monitoring functionality. Since Recommendation Y.1731 uses specific control plane PDUs, the nodes participating in the performance monitoring mechanisms need to implement Recommendation Y.1731. This restriction may limit the use of Recommendation Y.1731 to certain parts of the network that support and implement Recommendation Y.1731. The details for functionality and messages used for performance monitoring are described in Recommendation ITU-T Y.1731 [i.9].
Application or Service Specific Performance Monitoring
As the network elements are virtualised in the access, edge and core networks, there is a greater need for E2E performance monitoring focusing on the QoE for the end users. One of the key motivations for service providers to move to NFV is improved service agility and ability to provide new E2E services on their networks based on the rapidly changing service/application landscape. Thus, the service providers may find themselves in a situation where just guaranteeing edge to edge QoS may not be enough, but E2E QoE may become prominent. This requires the service providers to test E2E QoE for the services. Clause C.2 lists some methodologies for measuring E2E QoE for popular services and applications.
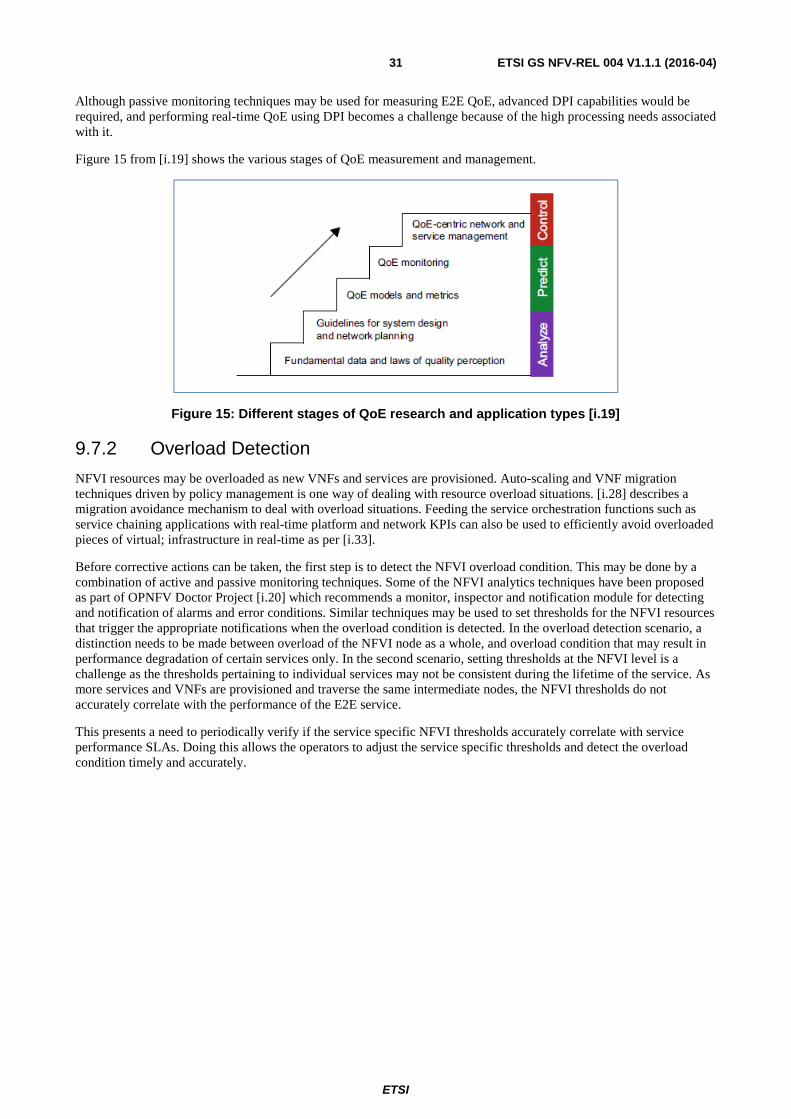
ETSI
ETSI GS NFV-REL 004 V1.1.1 (2016-04)31
Although passive monitoring techniques may be used for measuring E2E QoE, advanced DPI capabilities would be required, and performing real-time QoE using DPI becomes a challenge because of the high processing needs associated with it.
Figure 15 from [i.19] shows the various stages of QoE measurement and management.
Figure 15: Different stages of QoE research and application types [i.19]
9.7.2 Overload Detection
NFVI resources may be overloaded as new VNFs and services are provisioned. Auto-scaling and VNF migration techniques driven by policy management is one way of dealing with resource overload situations. [i.28] describes a migration avoidance mechanism to deal with overload situations. Feeding the service orchestration functions such as service chaining applications with real-time platform and network KPIs can also be used to efficiently avoid overloaded pieces of virtual; infrastructure in real-time as per [i.33].
Before corrective actions can be taken, the first step is to detect the NFVI overload condition. This may be done by a combination of active and passive monitoring techniques. Some of the NFVI analytics techniques have been proposed as part of OPNFV Doctor Project [i.20] which recommends a monitor, inspector and notification module for detecting and notification of alarms and error conditions. Similar techniques may be used to set thresholds for the NFVI resources that trigger the appropriate notifications when the overload condition is detected. In the overload detection scenario, a distinction needs to be made between overload of the NFVI node as a whole, and overload condition that may result in performance degradation of certain services only. In the second scenario, setting thresholds at the NFVI level is a challenge as the thresholds pertaining to individual services may not be consistent during the lifetime of the service. As more services and VNFs are provisioned and traverse the same intermediate nodes, the NFVI thresholds do not accurately correlate with the performance of the E2E service.
This presents a need to periodically verify if the service specific NFVI thresholds accurately correlate with service performance SLAs. Doing this allows the operators to adjust the service specific thresholds and detect the overload condition timely and accurately.
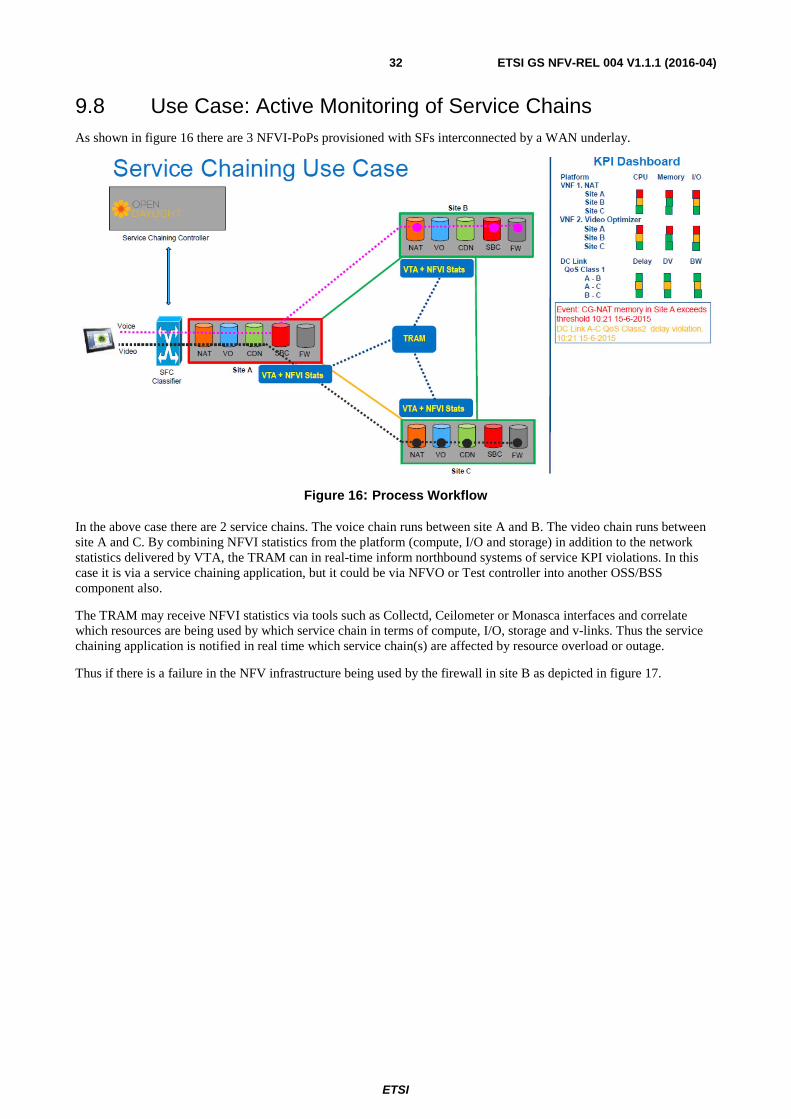
ETSI
ETSI GS NFV-REL 004 V1.1.1 (2016-04)32
9.8 Use Case: Active Monitoring of Service Chains As shown in figure 16 there are 3 NFVI-PoPs provisioned with SFs interconnected by a WAN underlay.
Figure 16: Process Workflow
In the above case there are 2 service chains. The voice chain runs between site A and B. The video chain runs between site A and C. By combining NFVI statistics from the platform (compute, I/O and storage) in addition to the network statistics delivered by VTA, the TRAM can in real-time inform northbound systems of service KPI violations. In this case it is via a service chaining application, but it could be via NFVO or Test controller into another OSS/BSS component also.
The TRAM may receive NFVI statistics via tools such as Collectd, Ceilometer or Monasca interfaces and correlate which resources are being used by which service chain in terms of compute, I/O, storage and v-links. Thus the service chaining application is notified in real time which service chain(s) are affected by resource overload or outage.
Thus if there is a failure in the NFV infrastructure being used by the firewall in site B as depicted in figure 17.
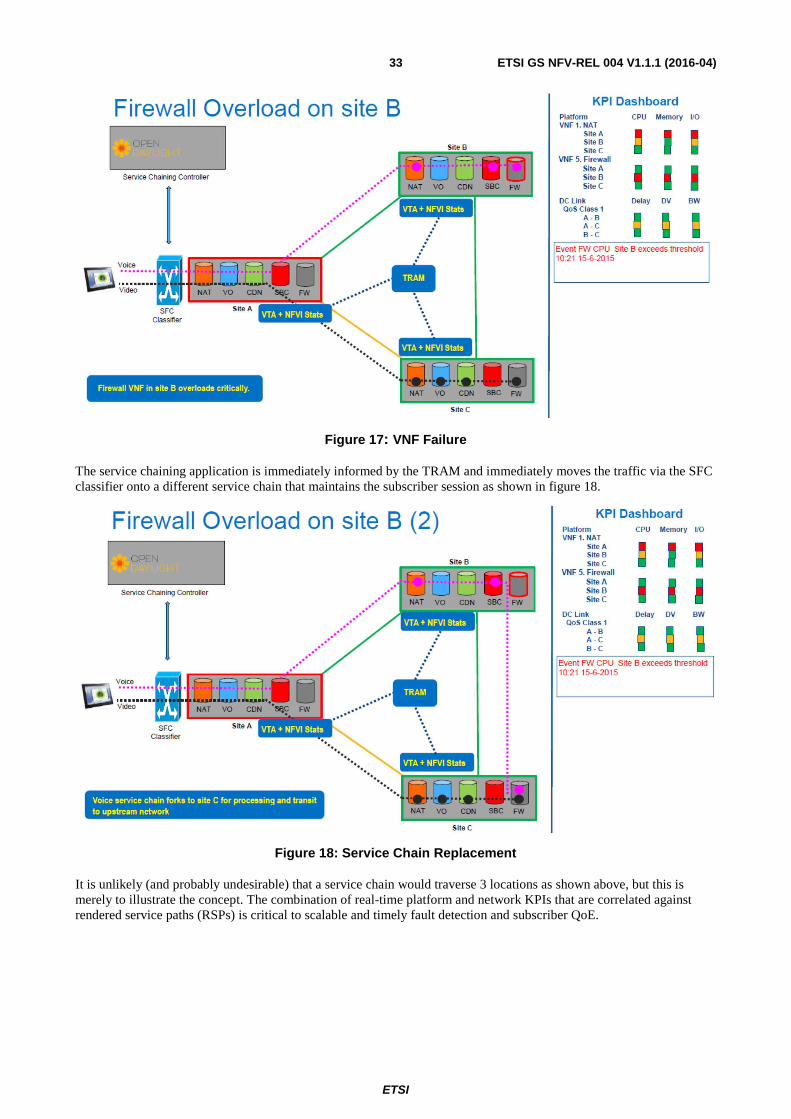
ETSI
ETSI GS NFV-REL 004 V1.1.1 (2016-04)33
Figure 17: VNF Failure
The service chaining application is immediately informed by the TRAM and immediately moves the traffic via the SFC classifier onto a different service chain that maintains the subscriber session as shown in figure 18.
Figure 18: Service Chain Replacement
It is unlikely (and probably undesirable) that a service chain would traverse 3 locations as shown above, but this is merely to illustrate the concept. The combination of real-time platform and network KPIs that are correlated against rendered service paths (RSPs) is critical to scalable and timely fault detection and subscriber QoE.
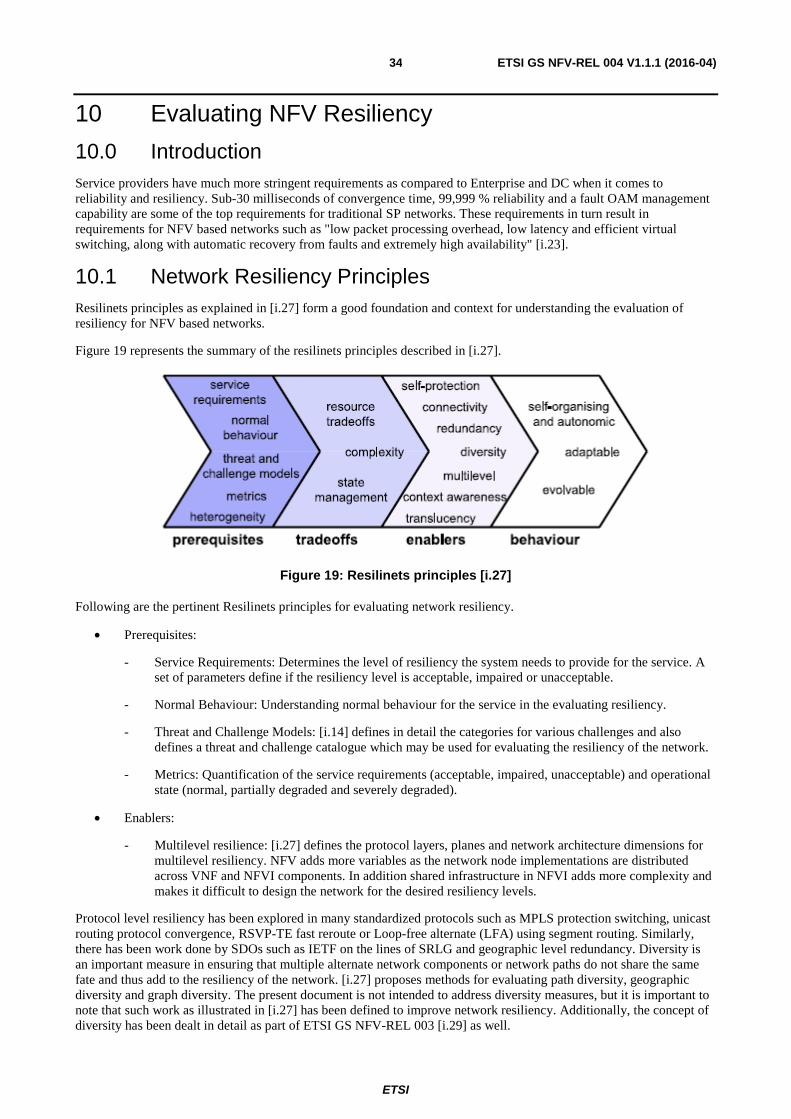
ETSI
ETSI GS NFV-REL 004 V1.1.1 (2016-04)34
10 Evaluating NFV Resiliency
10.0 Introduction Service providers have much more stringent requirements as compared to Enterprise and DC when it comes to reliability and resiliency. Sub-30 milliseconds of convergence time, 99,999 % reliability and a fault OAM management capability are some of the top requirements for traditional SP networks. These requirements in turn result in requirements for NFV based networks such as "low packet processing overhead, low latency and efficient virtual switching, along with automatic recovery from faults and extremely high availability" [i.23].
10.1 Network Resiliency Principles Resilinets principles as explained in [i.27] form a good foundation and context for understanding the evaluation of resiliency for NFV based networks.
Figure 19 represents the summary of the resilinets principles described in [i.27].
Figure 19: Resilinets principles [i.27]
Following are the pertinent Resilinets principles for evaluating network resiliency.
• Prerequisites:
- Service Requirements: Determines the level of resiliency the system needs to provide for the service. A set of parameters define if the resiliency level is acceptable, impaired or unacceptable.
- Normal Behaviour: Understanding normal behaviour for the service in the evaluating resiliency.
- Threat and Challenge Models: [i.14] defines in detail the categories for various challenges and also defines a threat and challenge catalogue which may be used for evaluating the resiliency of the network.
- Metrics: Quantification of the service requirements (acceptable, impaired, unacceptable) and operational state (normal, partially degraded and severely degraded).
• Enablers:
- Multilevel resilience: [i.27] defines the protocol layers, planes and network architecture dimensions for multilevel resiliency. NFV adds more variables as the network node implementations are distributed across VNF and NFVI components. In addition shared infrastructure in NFVI adds more complexity and makes it difficult to design the network for the desired resiliency levels.
Protocol level resiliency has been explored in many standardized protocols such as MPLS protection switching, unicast routing protocol convergence, RSVP-TE fast reroute or Loop-free alternate (LFA) using segment routing. Similarly, there has been work done by SDOs such as IETF on the lines of SRLG and geographic level redundancy. Diversity is an important measure in ensuring that multiple alternate network components or network paths do not share the same fate and thus add to the resiliency of the network. [i.27] proposes methods for evaluating path diversity, geographic diversity and graph diversity. The present document is not intended to address diversity measures, but it is important to note that such work as illustrated in [i.27] has been defined to improve network resiliency. Additionally, the concept of diversity has been dealt in detail as part of ETSI GS NFV-REL 003 [i.29] as well.
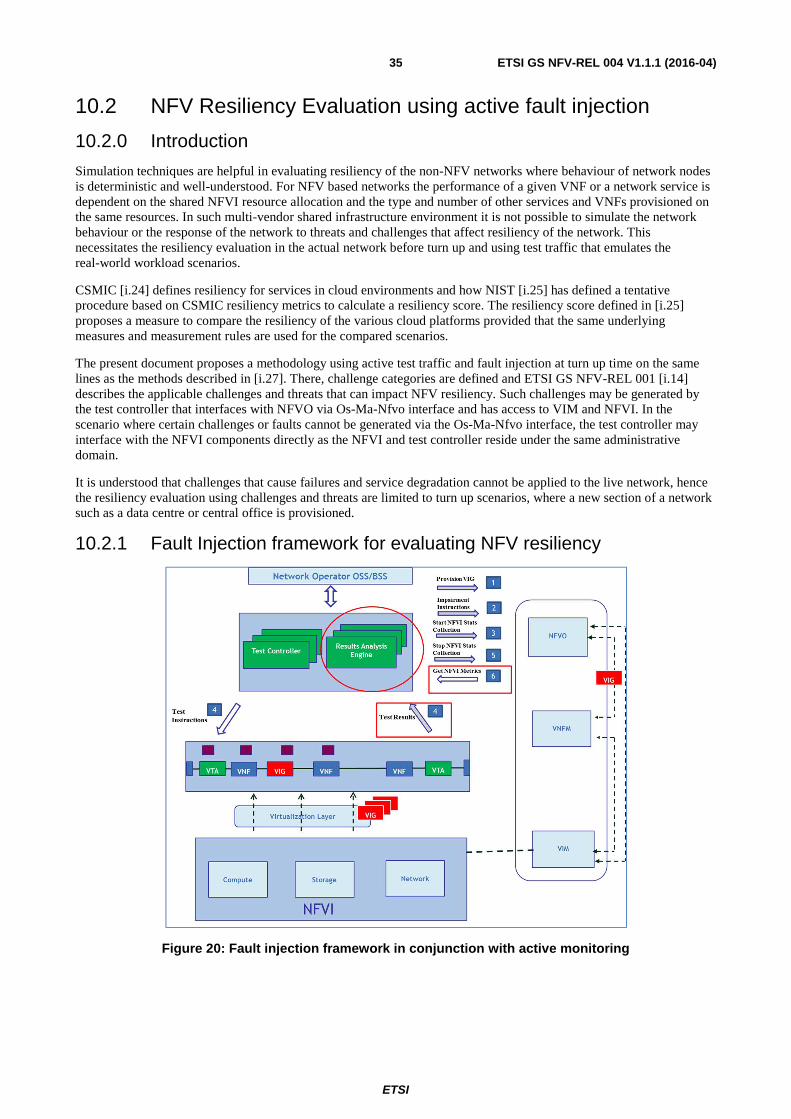
ETSI
ETSI GS NFV-REL 004 V1.1.1 (2016-04)35
10.2 NFV Resiliency Evaluation using active fault injection
10.2.0 Introduction
Simulation techniques are helpful in evaluating resiliency of the non-NFV networks where behaviour of network nodes is deterministic and well-understood. For NFV based networks the performance of a given VNF or a network service is dependent on the shared NFVI resource allocation and the type and number of other services and VNFs provisioned on the same resources. In such multi-vendor shared infrastructure environment it is not possible to simulate the network behaviour or the response of the network to threats and challenges that affect resiliency of the network. This necessitates the resiliency evaluation in the actual network before turn up and using test traffic that emulates the real-world workload scenarios.
CSMIC [i.24] defines resiliency for services in cloud environments and how NIST [i.25] has defined a tentative procedure based on CSMIC resiliency metrics to calculate a resiliency score. The resiliency score defined in [i.25] proposes a measure to compare the resiliency of the various cloud platforms provided that the same underlying measures and measurement rules are used for the compared scenarios.
The present document proposes a methodology using active test traffic and fault injection at turn up time on the same lines as the methods described in [i.27]. There, challenge categories are defined and ETSI GS NFV-REL 001 [i.14] describes the applicable challenges and threats that can impact NFV resiliency. Such challenges may be generated by the test controller that interfaces with NFVO via Os-Ma-Nfvo interface and has access to VIM and NFVI. In the scenario where certain challenges or faults cannot be generated via the Os-Ma-Nfvo interface, the test controller may interface with the NFVI components directly as the NFVI and test controller reside under the same administrative domain.
It is understood that challenges that cause failures and service degradation cannot be applied to the live network, hence the resiliency evaluation using challenges and threats are limited to turn up scenarios, where a new section of a network such as a data centre or central office is provisioned.
10.2.1 Fault Injection framework for evaluating NFV resiliency
Figure 20: Fault injection framework in conjunction with active monitoring
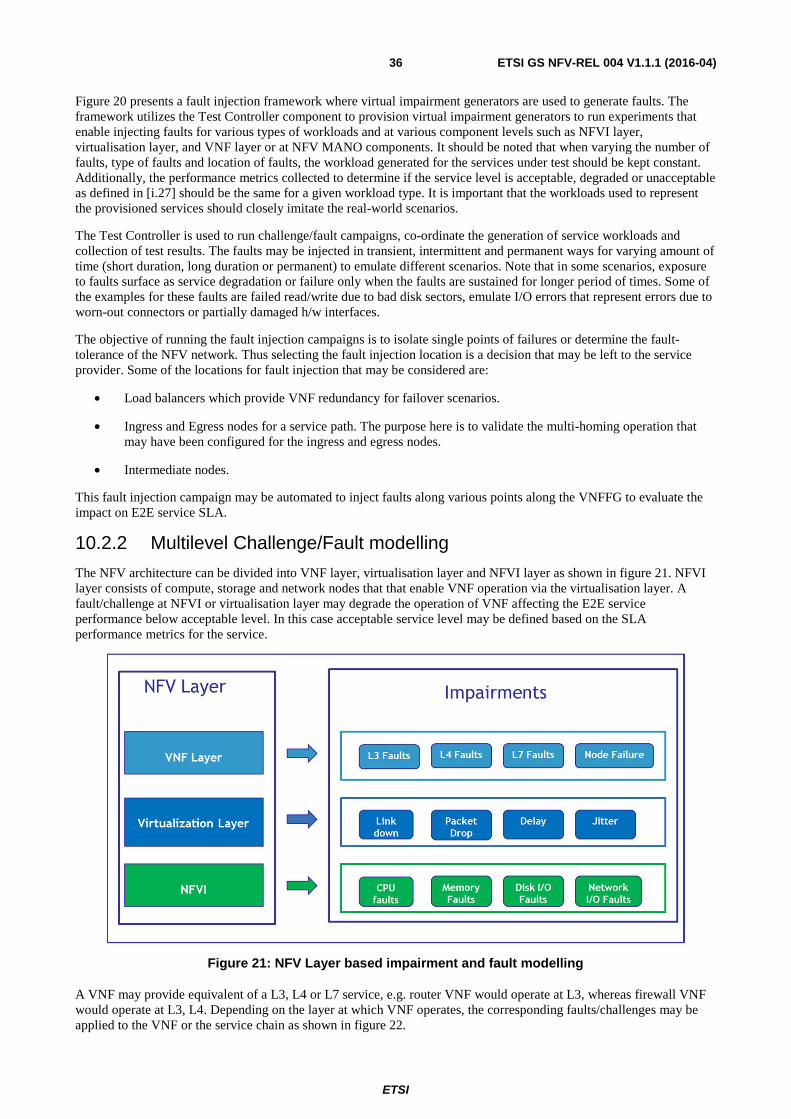
ETSI
ETSI GS NFV-REL 004 V1.1.1 (2016-04)36
Figure 20 presents a fault injection framework where virtual impairment generators are used to generate faults. The framework utilizes the Test Controller component to provision virtual impairment generators to run experiments that enable injecting faults for various types of workloads and at various component levels such as NFVI layer, virtualisation layer, and VNF layer or at NFV MANO components. It should be noted that when varying the number of faults, type of faults and location of faults, the workload generated for the services under test should be kept constant. Additionally, the performance metrics collected to determine if the service level is acceptable, degraded or unacceptable as defined in [i.27] should be the same for a given workload type. It is important that the workloads used to represent the provisioned services should closely imitate the real-world scenarios.
The Test Controller is used to run challenge/fault campaigns, co-ordinate the generation of service workloads and collection of test results. The faults may be injected in transient, intermittent and permanent ways for varying amount of time (short duration, long duration or permanent) to emulate different scenarios. Note that in some scenarios, exposure to faults surface as service degradation or failure only when the faults are sustained for longer period of times. Some of the examples for these faults are failed read/write due to bad disk sectors, emulate I/O errors that represent errors due to worn-out connectors or partially damaged h/w interfaces.
The objective of running the fault injection campaigns is to isolate single points of failures or determine the fault-tolerance of the NFV network. Thus selecting the fault injection location is a decision that may be left to the service provider. Some of the locations for fault injection that may be considered are:
• Load balancers which provide VNF redundancy for failover scenarios.
• Ingress and Egress nodes for a service path. The purpose here is to validate the multi-homing operation that may have been configured for the ingress and egress nodes.
• Intermediate nodes.
This fault injection campaign may be automated to inject faults along various points along the VNFFG to evaluate the impact on E2E service SLA.
10.2.2 Multilevel Challenge/Fault modelling
The NFV architecture can be divided into VNF layer, virtualisation layer and NFVI layer as shown in figure 21. NFVI layer consists of compute, storage and network nodes that that enable VNF operation via the virtualisation layer. A fault/challenge at NFVI or virtualisation layer may degrade the operation of VNF affecting the E2E service performance below acceptable level. In this case acceptable service level may be defined based on the SLA performance metrics for the service.
Figure 21: NFV Layer based impairment and fault modelling A VNF may provide equivalent of a L3, L4 or L7 service, e.g. router VNF would operate at L3, whereas firewall VNF would operate at L3, L4. Depending on the layer at which VNF operates, the corresponding faults/challenges may be applied to the VNF or the service chain as shown in figure 22.
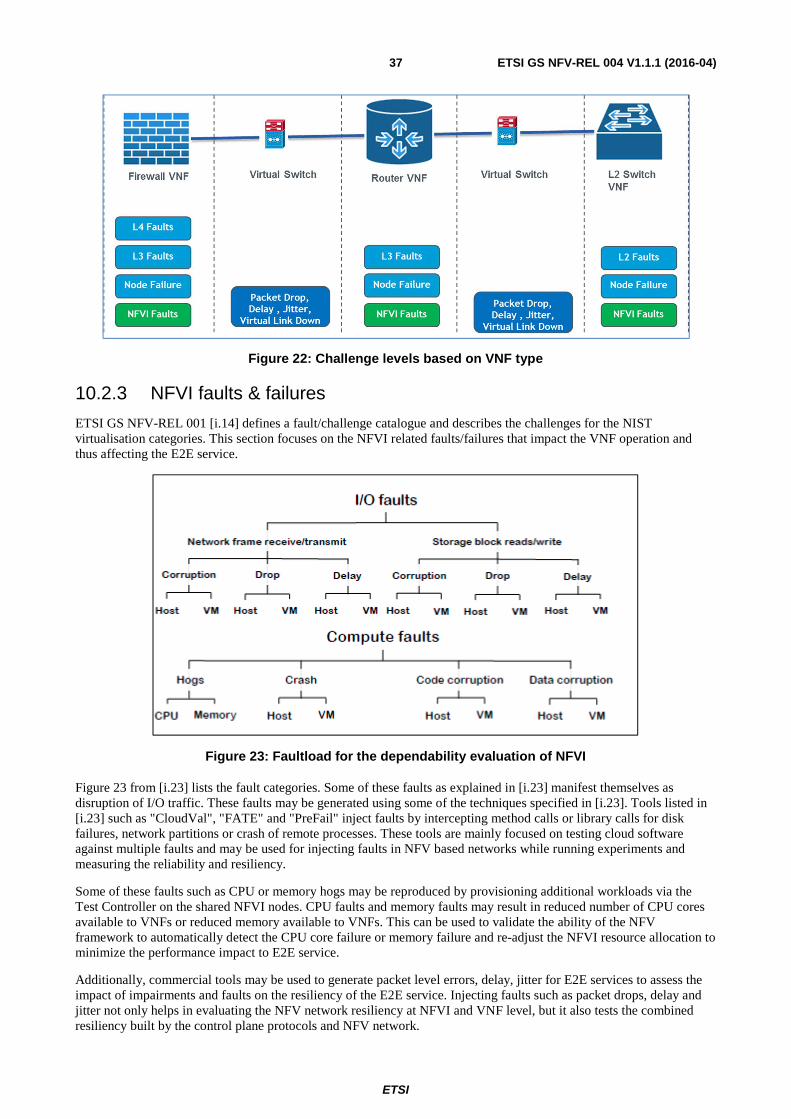
ETSI
ETSI GS NFV-REL 004 V1.1.1 (2016-04)37
Figure 22: Challenge levels based on VNF type
10.2.3 NFVI faults & failures
ETSI GS NFV-REL 001 [i.14] defines a fault/challenge catalogue and describes the challenges for the NIST virtualisation categories. This section focuses on the NFVI related faults/failures that impact the VNF operation and thus affecting the E2E service.
Figure 23: Faultload for the dependability evaluation of NFVI
Figure 23 from [i.23] lists the fault categories. Some of these faults as explained in [i.23] manifest themselves as disruption of I/O traffic. These faults may be generated using some of the techniques specified in [i.23]. Tools listed in [i.23] such as "CloudVal", "FATE" and "PreFail" inject faults by intercepting method calls or library calls for disk failures, network partitions or crash of remote processes. These tools are mainly focused on testing cloud software against multiple faults and may be used for injecting faults in NFV based networks while running experiments and measuring the reliability and resiliency.
Some of these faults such as CPU or memory hogs may be reproduced by provisioning additional workloads via the Test Controller on the shared NFVI nodes. CPU faults and memory faults may result in reduced number of CPU cores available to VNFs or reduced memory available to VNFs. This can be used to validate the ability of the NFV framework to automatically detect the CPU core failure or memory failure and re-adjust the NFVI resource allocation to minimize the performance impact to E2E service.
Additionally, commercial tools may be used to generate packet level errors, delay, jitter for E2E services to assess the impact of impairments and faults on the resiliency of the E2E service. Injecting faults such as packet drops, delay and jitter not only helps in evaluating the NFV network resiliency at NFVI and VNF level, but it also tests the combined resiliency built by the control plane protocols and NFV network.
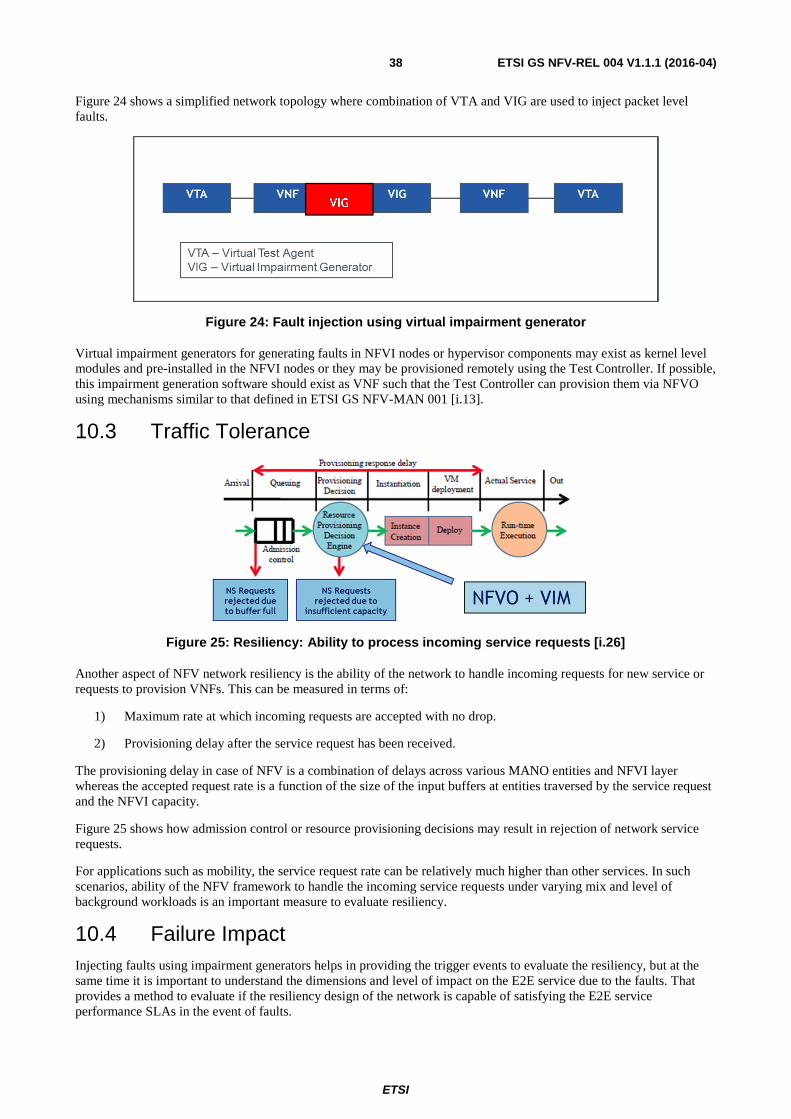
ETSI
ETSI GS NFV-REL 004 V1.1.1 (2016-04)38
Figure 24 shows a simplified network topology where combination of VTA and VIG are used to inject packet level faults.
Figure 24: Fault injection using virtual impairment generator
Virtual impairment generators for generating faults in NFVI nodes or hypervisor components may exist as kernel level modules and pre-installed in the NFVI nodes or they may be provisioned remotely using the Test Controller. If possible, this impairment generation software should exist as VNF such that the Test Controller can provision them via NFVO using mechanisms similar to that defined in ETSI GS NFV-MAN 001 [i.13].
10.3 Traffic Tolerance
Figure 25: Resiliency: Ability to process incoming service requests [i.26] Another aspect of NFV network resiliency is the ability of the network to handle incoming requests for new service or requests to provision VNFs. This can be measured in terms of:
1) Maximum rate at which incoming requests are accepted with no drop.
2) Provisioning delay after the service request has been received.
The provisioning delay in case of NFV is a combination of delays across various MANO entities and NFVI layer whereas the accepted request rate is a function of the size of the input buffers at entities traversed by the service request and the NFVI capacity.
Figure 25 shows how admission control or resource provisioning decisions may result in rejection of network service requests.
For applications such as mobility, the service request rate can be relatively much higher than other services. In such scenarios, ability of the NFV framework to handle the incoming service requests under varying mix and level of background workloads is an important measure to evaluate resiliency.
10.4 Failure Impact Injecting faults using impairment generators helps in providing the trigger events to evaluate the resiliency, but at the same time it is important to understand the dimensions and level of impact on the E2E service due to the faults. That provides a method to evaluate if the resiliency design of the network is capable of satisfying the E2E service performance SLAs in the event of faults.
VIG
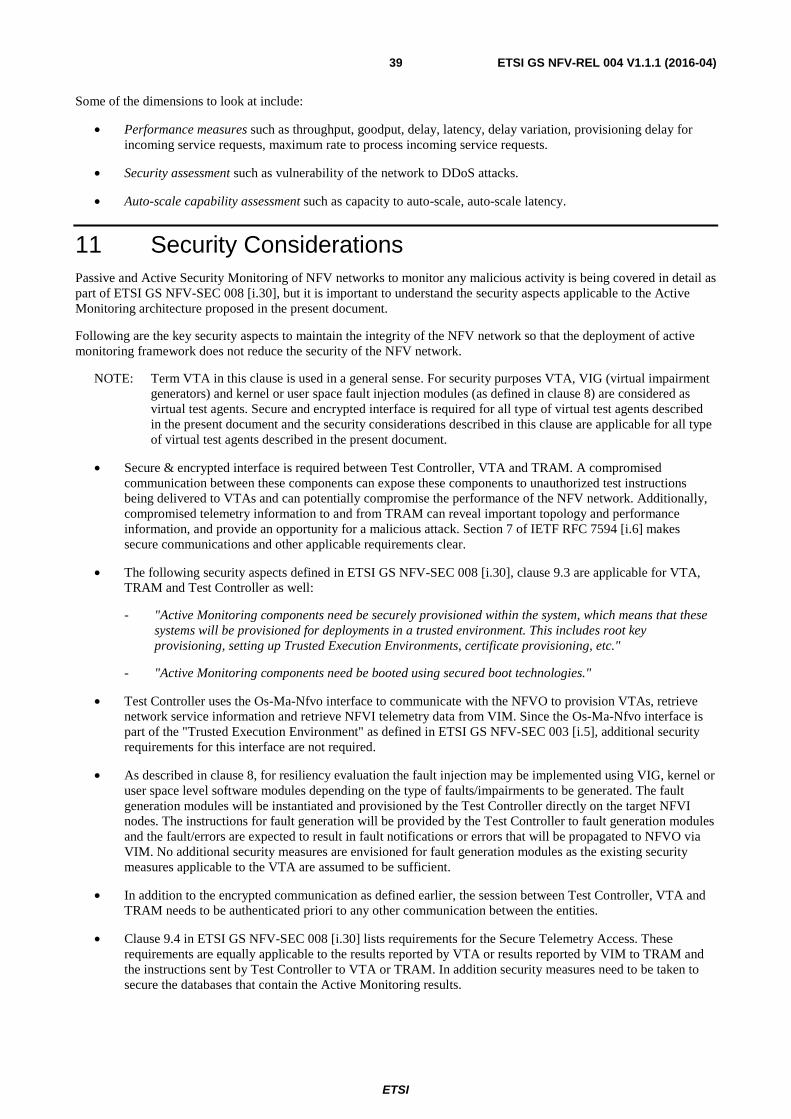
ETSI
ETSI GS NFV-REL 004 V1.1.1 (2016-04)39
Some of the dimensions to look at include:
• Performance measures such as throughput, goodput, delay, latency, delay variation, provisioning delay for incoming service requests, maximum rate to process incoming service requests.
• Security assessment such as vulnerability of the network to DDoS attacks.
• Auto-scale capability assessment such as capacity to auto-scale, auto-scale latency.
11 Security Considerations Passive and Active Security Monitoring of NFV networks to monitor any malicious activity is being covered in detail as part of ETSI GS NFV-SEC 008 [i.30], but it is important to understand the security aspects applicable to the Active Monitoring architecture proposed in the present document.
Following are the key security aspects to maintain the integrity of the NFV network so that the deployment of active monitoring framework does not reduce the security of the NFV network.
NOTE: Term VTA in this clause is used in a general sense. For security purposes VTA, VIG (virtual impairment generators) and kernel or user space fault injection modules (as defined in clause 8) are considered as virtual test agents. Secure and encrypted interface is required for all type of virtual test agents described in the present document and the security considerations described in this clause are applicable for all type of virtual test agents described in the present document.
• Secure & encrypted interface is required between Test Controller, VTA and TRAM. A compromised communication between these components can expose these components to unauthorized test instructions being delivered to VTAs and can potentially compromise the performance of the NFV network. Additionally, compromised telemetry information to and from TRAM can reveal important topology and performance information, and provide an opportunity for a malicious attack. Section 7 of IETF RFC 7594 [i.6] makes secure communications and other applicable requirements clear.
• The following security aspects defined in ETSI GS NFV-SEC 008 [i.30], clause 9.3 are applicable for VTA, TRAM and Test Controller as well:
- "Active Monitoring components need be securely provisioned within the system, which means that these systems will be provisioned for deployments in a trusted environment. This includes root key provisioning, setting up Trusted Execution Environments, certificate provisioning, etc."
- "Active Monitoring components need be booted using secured boot technologies."
• Test Controller uses the Os-Ma-Nfvo interface to communicate with the NFVO to provision VTAs, retrieve network service information and retrieve NFVI telemetry data from VIM. Since the Os-Ma-Nfvo interface is part of the "Trusted Execution Environment" as defined in ETSI GS NFV-SEC 003 [i.5], additional security requirements for this interface are not required.
• As described in clause 8, for resiliency evaluation the fault injection may be implemented using VIG, kernel or user space level software modules depending on the type of faults/impairments to be generated. The fault generation modules will be instantiated and provisioned by the Test Controller directly on the target NFVI nodes. The instructions for fault generation will be provided by the Test Controller to fault generation modules and the fault/errors are expected to result in fault notifications or errors that will be propagated to NFVO via VIM. No additional security measures are envisioned for fault generation modules as the existing security measures applicable to the VTA are assumed to be sufficient.
• In addition to the encrypted communication as defined earlier, the session between Test Controller, VTA and TRAM needs to be authenticated priori to any other communication between the entities.
• Clause 9.4 in ETSI GS NFV-SEC 008 [i.30] lists requirements for the Secure Telemetry Access. These requirements are equally applicable to the results reported by VTA or results reported by VIM to TRAM and the instructions sent by Test Controller to VTA or TRAM. In addition security measures need to be taken to secure the databases that contain the Active Monitoring results.
ETSI
ETSI GS NFV-REL 004 V1.1.1 (2016-04)40
• Test Controller and TRAM are in the same administrative domain as OSS/BSS and are in the same "Trusted Execution Environment". The security measures in use for OSS/BSS are applicable for Test Controller and TRAM as well.
• Privacy considerations are related to security, and privacy threats are mitigated in additional ways as described in section 8 of IETF RFC 7594 [i.6].
12 Deployment Scenarios The scope for deployment of VTA, Test Controller and TRAM is limited to the Service Providers networks and assumes that the VTAs would be deployed by the Network operator in a centralized manner via OSS and NFVO. Thus, it is safe to assume that the Test Controller is aware of the location of the VTAs deployed and the capabilities of the VTA. Any change in the VTA location or resource allocation for VTA is done via NFVO and the change is reported to Test Controller and catalogued by the Test Controller in its database.
As stated earlier the present document assumes the existence of library of VTAs with varying feature and performance capabilities. Performance of the VTA is of course limited by the type of compute node it resides on and the amount NFVI resources allocated to the VTA. The provisioning of VTAs is under the exclusive control of the Test Controller and the Test Controller can request NFVO for the desired NFVI resources needed for the VTA based on the metrics and methods of measurement the VTA will be used for. All this is made possible because the VTA is deployed in the form of a VNF (software module).
Physical probes do not provide this flexibility and thus the mechanisms described in IETF RFC 7594 [i.6] for provisioning of measurement agents need bootstrap procedures. The measurement agents should contact the controller as the controller may be unaware of the location of the measurement agents or the measurement agent may be behind a firewall that is not accessible by the controller.
Deployment use cases for performance measurement in traditional networks have been described in great detail as part of IETF RFC 7536 [i.7]. Additional work may need to be done to adapt those use cases for NFV environment and to study additional use cases such as the deployment of embedded agents within network devices, use in consumer communication devices such as smartphones or IoT devices. Active monitoring may also be used in ensuring net neutrality and achieving broadband coverage and usage goals by governments and authorities.
13 Recommendations The present document has touched upon various topics such as fault isolation, fault-correlation and how active monitoring can be used for performance monitoring and root cause isolation. There is lot of normative and informational work that needs to be done in order to get the concepts described in the present document closer to deployment. Following are some of the focus areas for future work and corresponding recommendations.
REC #1
• Use Case: Test Controller, TRAM and VTA need to establish session with each other and exchange information such as test instructions, test results, status update information. The present document listed such communication at a high level.
• Recommendation: Normative work to define how the session between the active monitoring components can be established and suggest the mandatory information elements that need to be present in the communication. Section 5 of IETF RFC 7594 [i.6] details such work for broadband networks. An information model specific to active monitoring for NFV may be defined similar to the one described in [i.8]. Additionally, protocol specification for inter-communication of test controllers for high availability (HA) may be defined.
• Comment: Normative specifications for communication protocol and information model should try to address the mandatory requirements only. It is understood that proprietary implementations may support optional features and capabilities.
REC#2
• Use Case: NFVI Monitoring Architecture, as outlined in use case example in clause 6.
ETSI
ETSI GS NFV-REL 004 V1.1.1 (2016-04)41
• Recommendation: Normative work to define how the platform and underlay KPIs may be combined to inform SLA violations into MANO or service orchestration layers. This middleware could be queried for real time network-wide NFVI statistics in real time and may be programmed to alert (on a per service basis) violations. That is the middle ware is made aware of service definitions defined in MANO.
REC#3
• Use Case: Deployment scenarios such as embedded test agents for CPE and IoT devices
• Recommendation: CPE and IoT devices may require control plane protocols and may have different data plane performance requirements such as very low bandwidth but low latency requirements. It is recommended that investigation be done on the type of active monitoring required for such scenarios and the design requirements for embedded test agents in CPE and IoT devices.
REC#4
• Use Case: Subscriber QoE measurement:
• Recommendation: Normative work to define how to select a given subscriber or service in the NFV infrastructure and actively measure QoE on subscriber traffic as defined in clause 3.1. Active: Subscriber mode in clause 3.1. This does not involve the use of OAM or test agents.
REC#5
• Use Case: Fault localization, fault detection and fault co-relation are critical problems that need to be resolved for NFV environment.
• Recommendation: Fault localization algorithm defined in the present document is generic. It is recommended that experiments and POCs be organized around the fault co-relation and fault localization topics. The insights from POCs and experiments should be incorporated to define a hardened fault co-relation and fault localization method. One of the extensions for fault-correlation is to determine the metrics that needs to be monitored for developing the correlation matrix. Clause 9.4 proposes a framework for data collection to aid in this process. It is recommended that additional work be done to get deeper into the type of metrics that need to be monitored and the mechanisms required to collect the desired metrics. Additionally co-operation with OPNFV Doctor Project should be developed to leverage the work done for fault detection and use of analytics mechanisms.
• Comment: Fault co-relation procedures using VTA results, NFVI utilization stats, alarms, notifications and workload-NFVI analysis should be defined.
REC#6
• Use Case: Higher performance and improved accuracy of the results reported by VTA with minimum NFVI resource allocation is the key to get closer to the deployment of an active monitoring system in the NFV environment.
• Recommendation: VTA implementation may suffer from higher NFVI resource footprint and inaccurate timing measurements. It is recommended that design requirements be defined for VTA to address these concerns. Additionally, design requirements should address the issue of performance isolation and repeatability of results.
• Comment: Often interrupts from other processes on the same server as VTA can affect the consistency and repeatability of tests using virtual test agents. This is a difficult problem to solve in case of virtual test agents as compared to physical test agents.
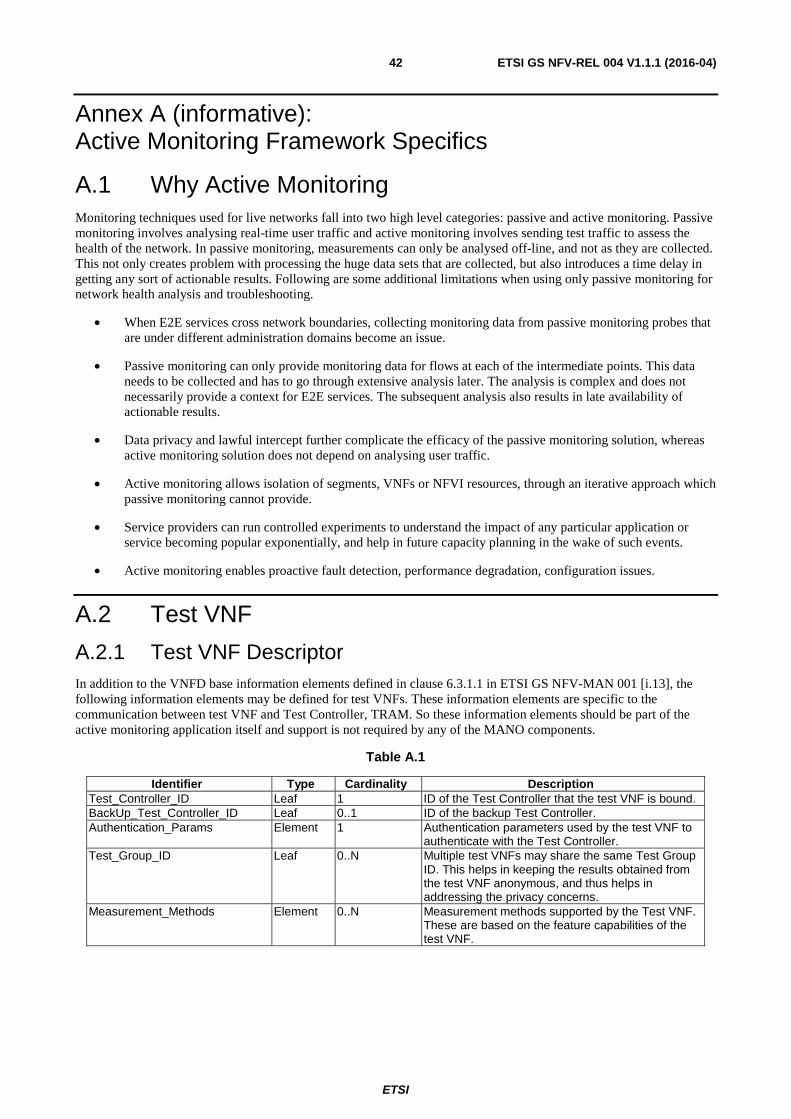
ETSI
ETSI GS NFV-REL 004 V1.1.1 (2016-04)42
Annex A (informative): Active Monitoring Framework Specifics
A.1 Why Active Monitoring Monitoring techniques used for live networks fall into two high level categories: passive and active monitoring. Passive monitoring involves analysing real-time user traffic and active monitoring involves sending test traffic to assess the health of the network. In passive monitoring, measurements can only be analysed off-line, and not as they are collected. This not only creates problem with processing the huge data sets that are collected, but also introduces a time delay in getting any sort of actionable results. Following are some additional limitations when using only passive monitoring for network health analysis and troubleshooting.
• When E2E services cross network boundaries, collecting monitoring data from passive monitoring probes that are under different administration domains become an issue.
• Passive monitoring can only provide monitoring data for flows at each of the intermediate points. This data needs to be collected and has to go through extensive analysis later. The analysis is complex and does not necessarily provide a context for E2E services. The subsequent analysis also results in late availability of actionable results.
• Data privacy and lawful intercept further complicate the efficacy of the passive monitoring solution, whereas active monitoring solution does not depend on analysing user traffic.
• Active monitoring allows isolation of segments, VNFs or NFVI resources, through an iterative approach which passive monitoring cannot provide.
• Service providers can run controlled experiments to understand the impact of any particular application or service becoming popular exponentially, and help in future capacity planning in the wake of such events.
• Active monitoring enables proactive fault detection, performance degradation, configuration issues.
A.2 Test VNF
A.2.1 Test VNF Descriptor In addition to the VNFD base information elements defined in clause 6.3.1.1 in ETSI GS NFV-MAN 001 [i.13], the following information elements may be defined for test VNFs. These information elements are specific to the communication between test VNF and Test Controller, TRAM. So these information elements should be part of the active monitoring application itself and support is not required by any of the MANO components.
Table A.1
Identifier Type Cardinality Description Test_Controller_ID Leaf 1 ID of the Test Controller that the test VNF is bound. BackUp_Test_Controller_ID Leaf 0..1 ID of the backup Test Controller. Authentication_Params Element 1 Authentication parameters used by the test VNF to
authenticate with the Test Controller. Test_Group_ID Leaf 0..N Multiple test VNFs may share the same Test Group
ID. This helps in keeping the results obtained from the test VNF anonymous, and thus helps in addressing the privacy concerns.
Measurement_Methods Element 0..N Measurement methods supported by the Test VNF. These are based on the feature capabilities of the test VNF.
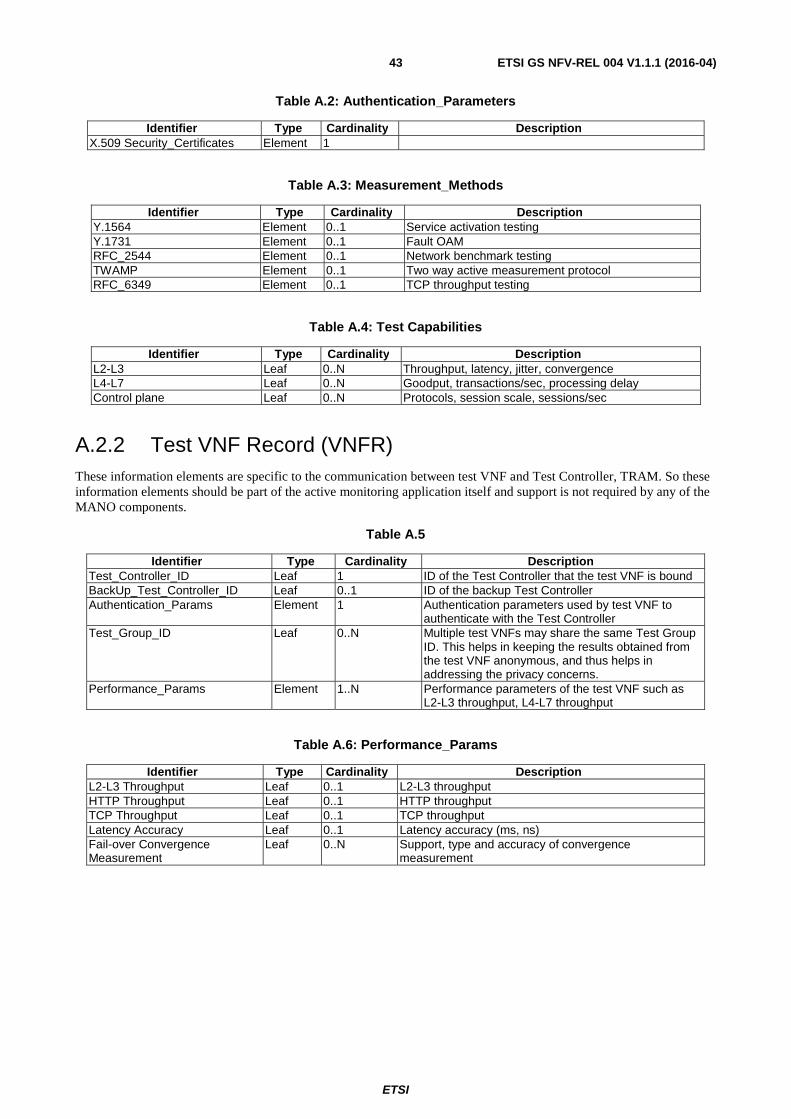
ETSI
ETSI GS NFV-REL 004 V1.1.1 (2016-04)43
Table A.2: Authentication_Parameters
Identifier Type Cardinality Description X.509 Security_Certificates Element 1
Table A.3: Measurement_Methods
Identifier Type Cardinality Description Y.1564 Element 0..1 Service activation testing Y.1731 Element 0..1 Fault OAM RFC_2544 Element 0..1 Network benchmark testing TWAMP Element 0..1 Two way active measurement protocol RFC_6349 Element 0..1 TCP throughput testing
Table A.4: Test Capabilities
Identifier Type Cardinality Description L2-L3 Leaf 0..N Throughput, latency, jitter, convergence L4-L7 Leaf 0..N Goodput, transactions/sec, processing delay Control plane Leaf 0..N Protocols, session scale, sessions/sec
A.2.2 Test VNF Record (VNFR) These information elements are specific to the communication between test VNF and Test Controller, TRAM. So these information elements should be part of the active monitoring application itself and support is not required by any of the MANO components.
Table A.5
Identifier Type Cardinality Description Test_Controller_ID Leaf 1 ID of the Test Controller that the test VNF is bound BackUp_Test_Controller_ID Leaf 0..1 ID of the backup Test Controller Authentication_Params Element 1 Authentication parameters used by test VNF to
authenticate with the Test Controller Test_Group_ID Leaf 0..N Multiple test VNFs may share the same Test Group
ID. This helps in keeping the results obtained from the test VNF anonymous, and thus helps in addressing the privacy concerns.
Performance_Params Element 1..N Performance parameters of the test VNF such as L2-L3 throughput, L4-L7 throughput
Table A.6: Performance_Params
Identifier Type Cardinality Description L2-L3 Throughput Leaf 0..1 L2-L3 throughput HTTP Throughput Leaf 0..1 HTTP throughput TCP Throughput Leaf 0..1 TCP throughput Latency Accuracy Leaf 0..1 Latency accuracy (ms, ns) Fail-over Convergence Measurement
Leaf 0..N Support, type and accuracy of convergence measurement
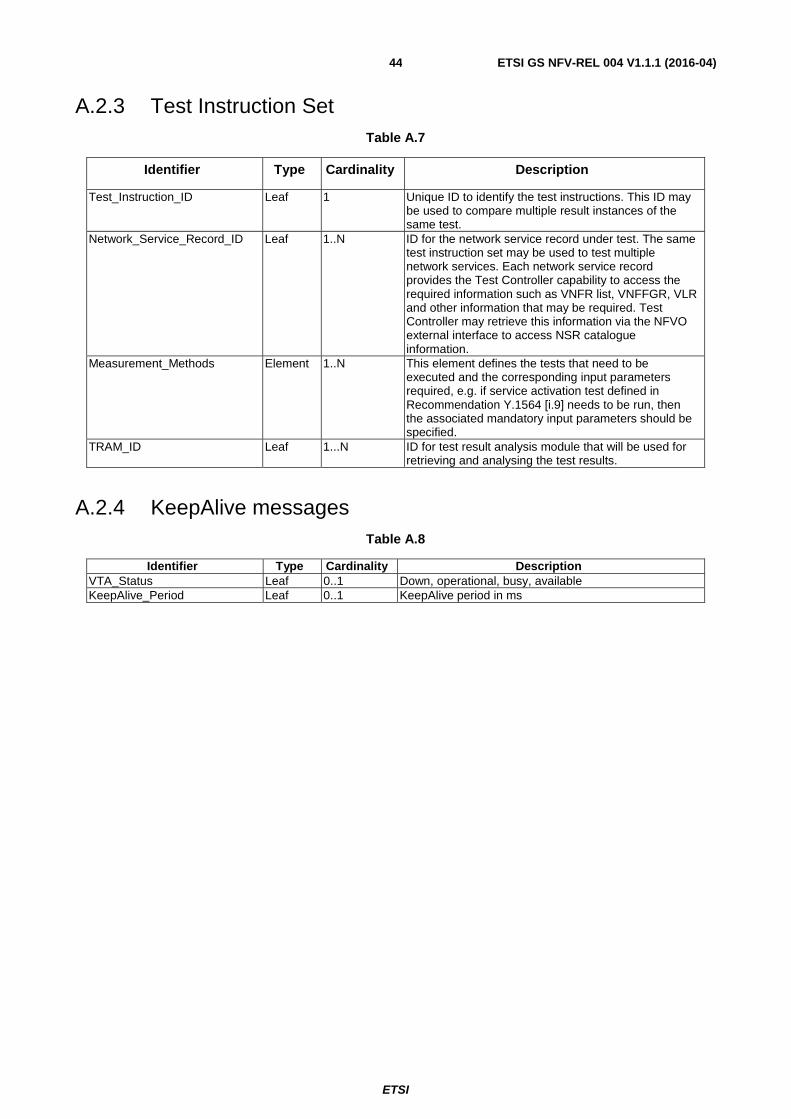
ETSI
ETSI GS NFV-REL 004 V1.1.1 (2016-04)44
A.2.3 Test Instruction Set Table A.7
Identifier Type Cardinality Description
Test_Instruction_ID Leaf 1 Unique ID to identify the test instructions. This ID may be used to compare multiple result instances of the same test.
Network_Service_Record_ID Leaf 1..N ID for the network service record under test. The same test instruction set may be used to test multiple network services. Each network service record provides the Test Controller capability to access the required information such as VNFR list, VNFFGR, VLR and other information that may be required. Test Controller may retrieve this information via the NFVO external interface to access NSR catalogue information.
Measurement_Methods Element 1..N This element defines the tests that need to be executed and the corresponding input parameters required, e.g. if service activation test defined in Recommendation Y.1564 [i.9] needs to be run, then the associated mandatory input parameters should be specified.
TRAM_ID Leaf 1...N ID for test result analysis module that will be used for retrieving and analysing the test results.
A.2.4 KeepAlive messages Table A.8
Identifier Type Cardinality Description VTA_Status Leaf 0..1 Down, operational, busy, available KeepAlive_Period Leaf 0..1 KeepAlive period in ms
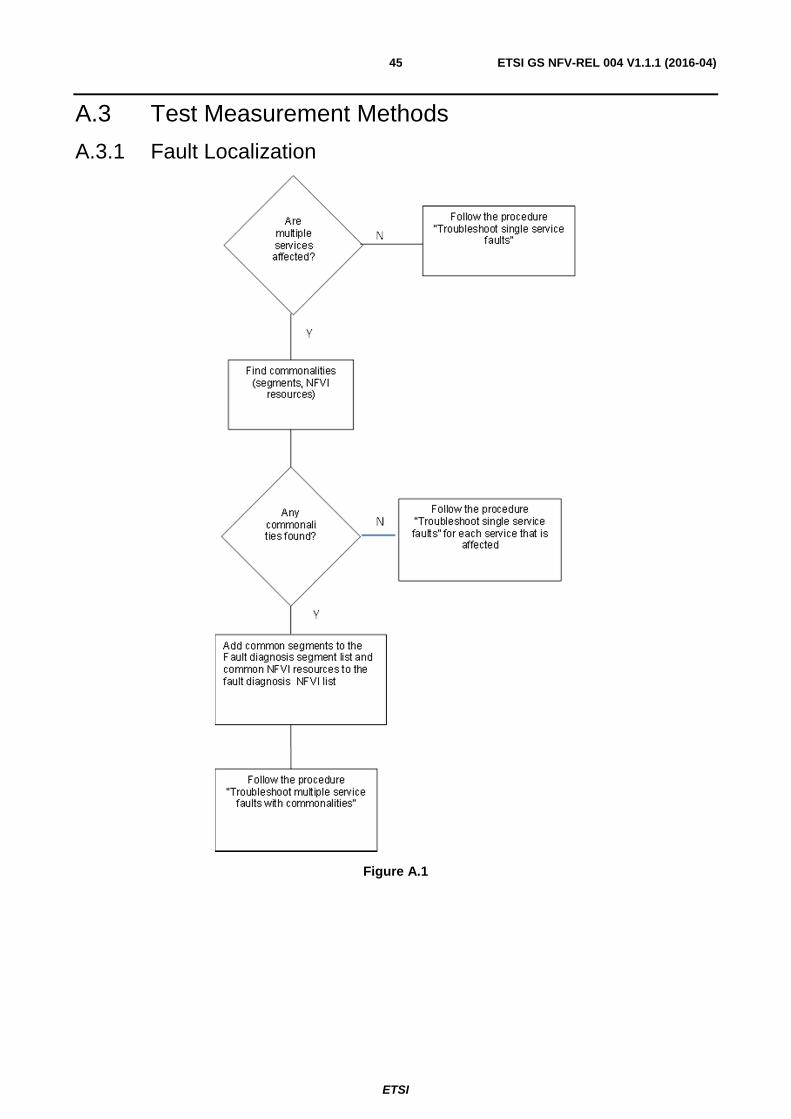
ETSI
ETSI GS NFV-REL 004 V1.1.1 (2016-04)45
A.3 Test Measurement Methods
A.3.1 Fault Localization
Figure A.1
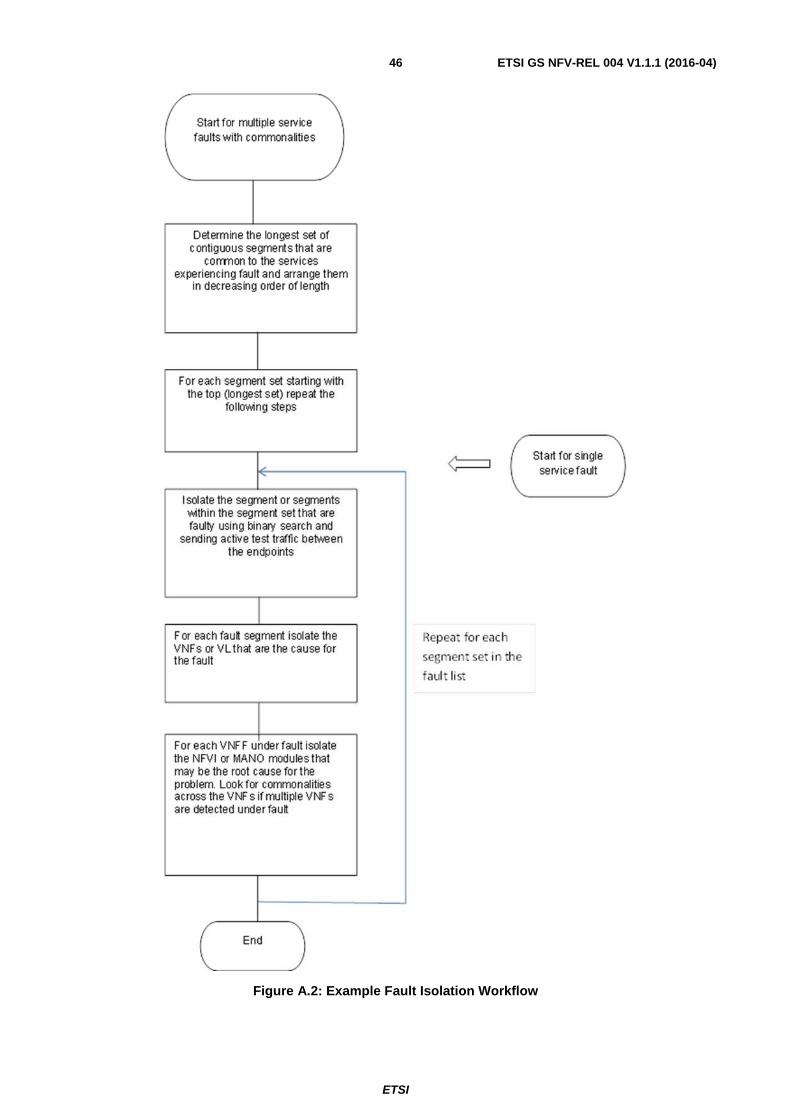
ETSI
ETSI GS NFV-REL 004 V1.1.1 (2016-04)46
Figure A.2: Example Fault Isolation Workflow
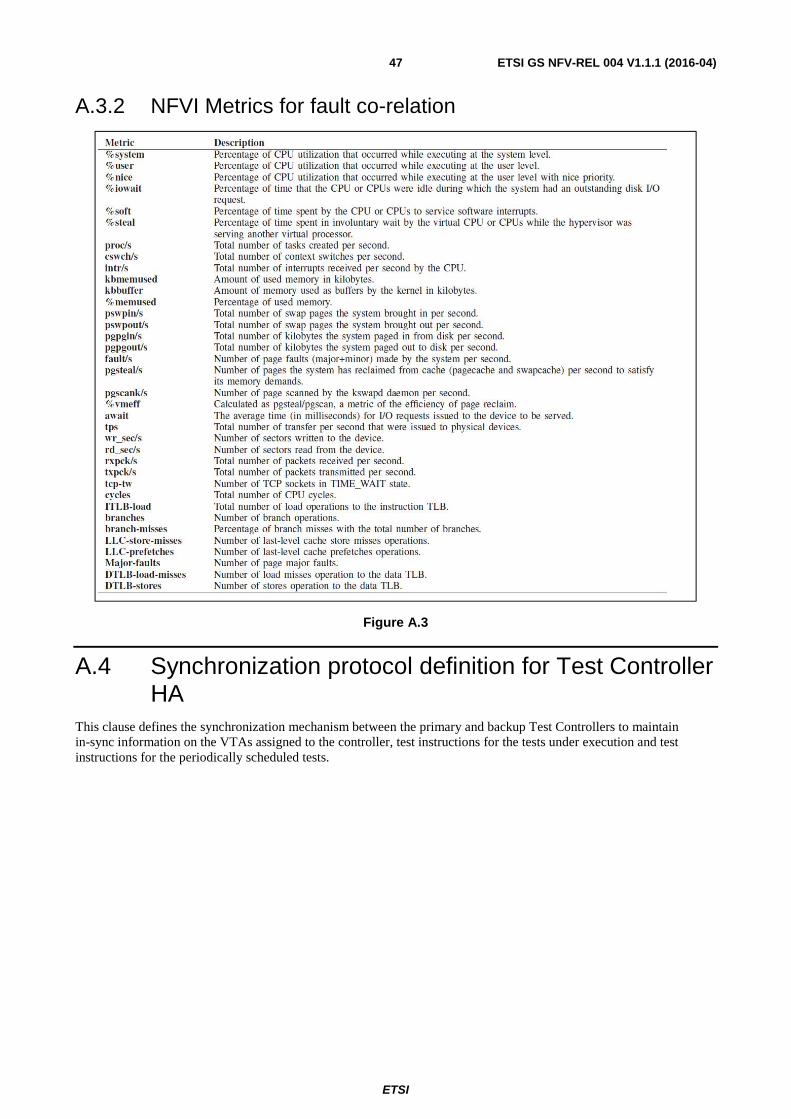
ETSI
ETSI GS NFV-REL 004 V1.1.1 (2016-04)47
A.3.2 NFVI Metrics for fault co-relation
Figure A.3
A.4 Synchronization protocol definition for Test Controller HA
This clause defines the synchronization mechanism between the primary and backup Test Controllers to maintain in-sync information on the VTAs assigned to the controller, test instructions for the tests under execution and test instructions for the periodically scheduled tests.
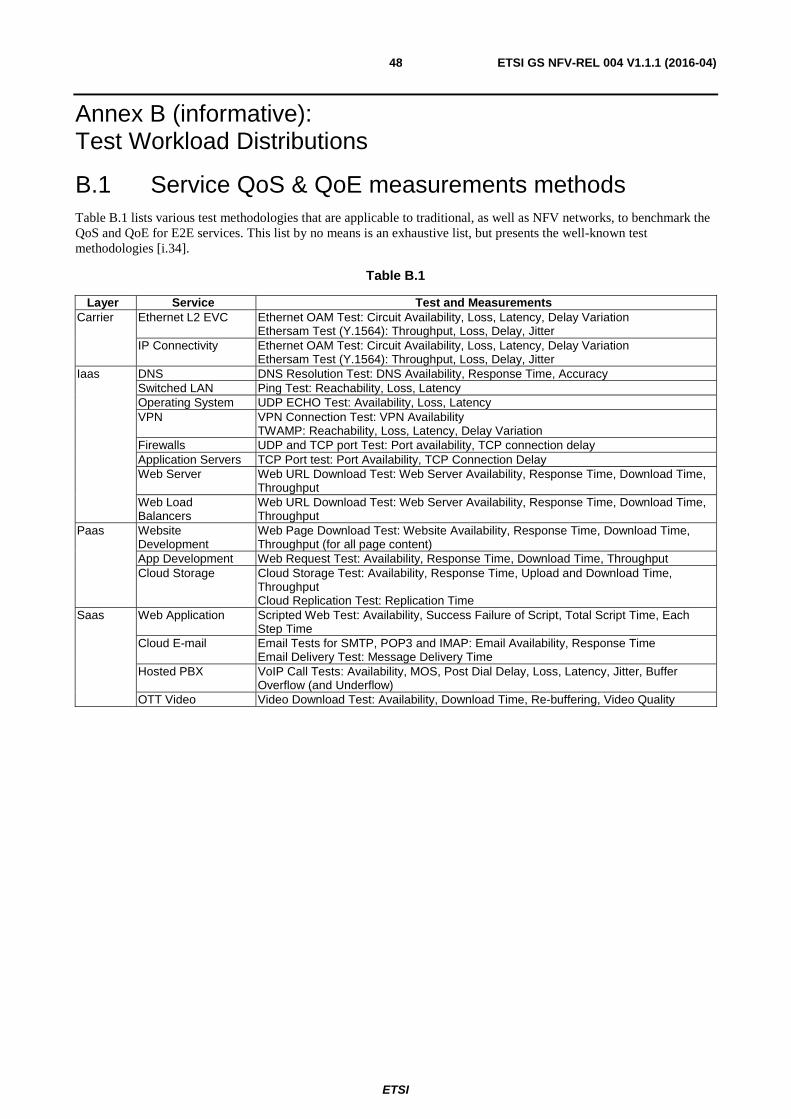
ETSI
ETSI GS NFV-REL 004 V1.1.1 (2016-04)48
Annex B (informative): Test Workload Distributions
B.1 Service QoS & QoE measurements methods Table B.1 lists various test methodologies that are applicable to traditional, as well as NFV networks, to benchmark the QoS and QoE for E2E services. This list by no means is an exhaustive list, but presents the well-known test methodologies [i.34].
Table B.1
Layer Service Test and Measurements Carrier Ethernet L2 EVC Ethernet OAM Test: Circuit Availability, Loss, Latency, Delay Variation
Ethersam Test (Y.1564): Throughput, Loss, Delay, Jitter IP Connectivity Ethernet OAM Test: Circuit Availability, Loss, Latency, Delay Variation
Ethersam Test (Y.1564): Throughput, Loss, Delay, Jitter Iaas DNS DNS Resolution Test: DNS Availability, Response Time, Accuracy
Switched LAN Ping Test: Reachability, Loss, Latency Operating System UDP ECHO Test: Availability, Loss, Latency VPN VPN Connection Test: VPN Availability
TWAMP: Reachability, Loss, Latency, Delay Variation Firewalls UDP and TCP port Test: Port availability, TCP connection delay Application Servers TCP Port test: Port Availability, TCP Connection Delay Web Server Web URL Download Test: Web Server Availability, Response Time, Download Time,
Throughput Web Load Balancers
Web URL Download Test: Web Server Availability, Response Time, Download Time, Throughput
Paas Website Development
Web Page Download Test: Website Availability, Response Time, Download Time, Throughput (for all page content)
App Development Web Request Test: Availability, Response Time, Download Time, Throughput Cloud Storage Cloud Storage Test: Availability, Response Time, Upload and Download Time,
Throughput Cloud Replication Test: Replication Time
Saas Web Application Scripted Web Test: Availability, Success Failure of Script, Total Script Time, Each Step Time
Cloud E-mail Email Tests for SMTP, POP3 and IMAP: Email Availability, Response Time Email Delivery Test: Message Delivery Time
Hosted PBX VoIP Call Tests: Availability, MOS, Post Dial Delay, Loss, Latency, Jitter, Buffer Overflow (and Underflow)
OTT Video Video Download Test: Availability, Download Time, Re-buffering, Video Quality
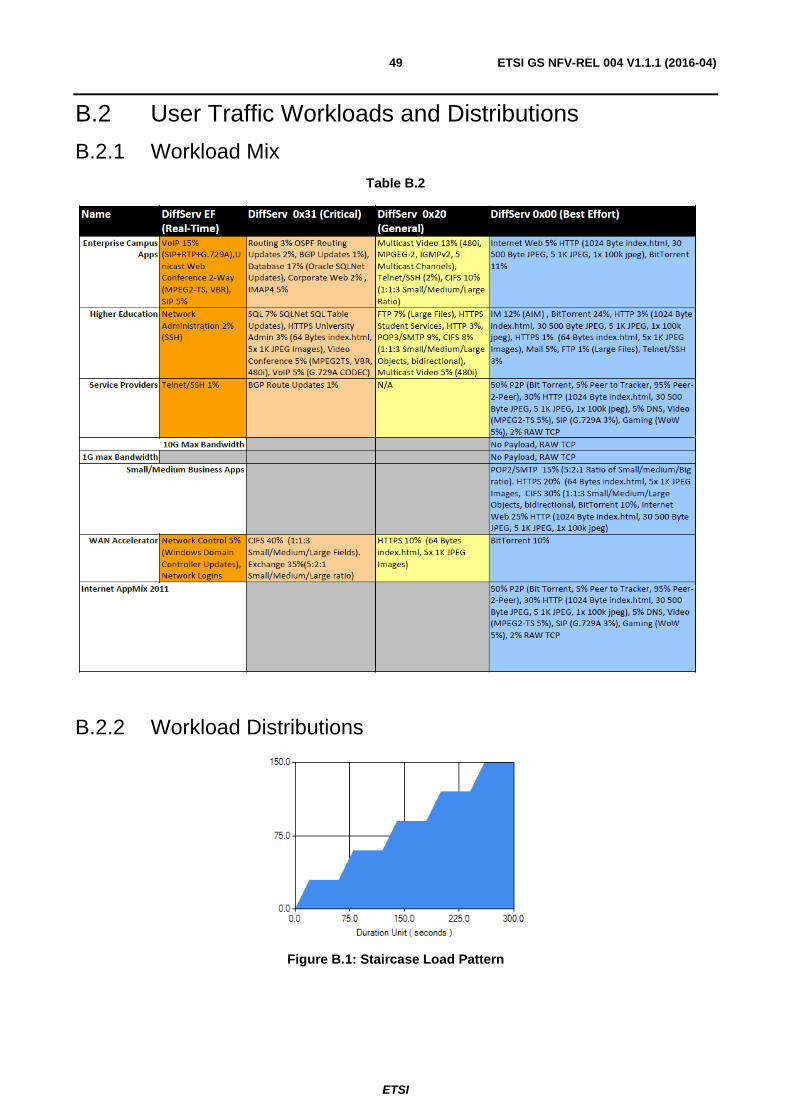
ETSI
ETSI GS NFV-REL 004 V1.1.1 (2016-04)49
B.2 User Traffic Workloads and Distributions
B.2.1 Workload Mix Table B.2
B.2.2 Workload Distributions
Figure B.1: Staircase Load Pattern
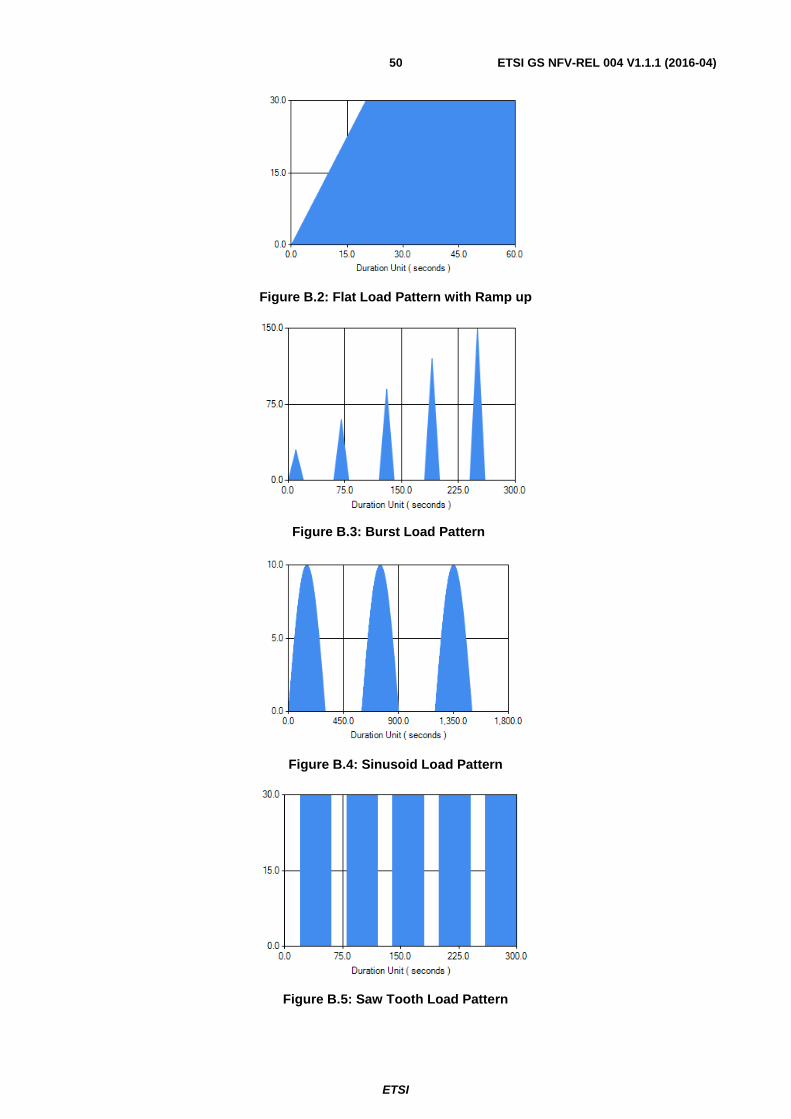
ETSI
ETSI GS NFV-REL 004 V1.1.1 (2016-04)50
Figure B.2: Flat Load Pattern with Ramp up
Figure B.3: Burst Load Pattern
Figure B.4: Sinusoid Load Pattern
Figure B.5: Saw Tooth Load Pattern

ETSI
ETSI GS NFV-REL 004 V1.1.1 (2016-04)51
Annex C (informative): Example Measurement Methods and Metrics
C.1 Example SLAs Table C.1: Example Enterprise service performance monitoring SLA ([i.17])
Component (metric) Time to Provision Time to Use Time to Restore Time to Report Interface (Kbps) Load time < 2
seconds on average ≥ 99 % of the time, response time will ≤ latency + 10 ms
Refresh time will be ≤ reload time
Logging will trail by ≤ latency + 10 ms always
Storage (GB) Time to populate data ≤ 100 mbps internal transfer rate always
Time to perform standard agreed query will be < 100 ms 99 % of the time
Time to restore from backup will be ≤ 100 mps internal transfer rate
Time to report after a change will be ≤ 1 second after transfer completed 99 % of the time
Connectivity (MB/S) Time to connect will be ≥ 10 ms + latency 99 % of the time
Time to verify end to end will be ≤ (latency x 2) + 10 ms 99 % of the time
Time to re-establish connection will be ≤ latency + 10 ms 99 % of the time
Time to electrically report performance internally will be ≤ 1 ms 99 % of the time
Processing (MIPs) Clock speeds will be as contracted in GHz ≥ 99 % of the time
Cache performance will be so many MIPS as tested
Single/double fault recovery times will be ≤ microseconds
Core dump will require ≤ milliseconds
Federated Access (Security = SAML)
Establish new access ≤ 5 seconds 99 % of the time, never to exceed 300 seconds
"Alert" on access grant/use/removal; ≤ 1 second 99 % of the time, never to exceed 10 seconds
Reconnect ≤ 500 ms 99 % of the time, never to exceed 10 seconds even if new access is being refused
Logging will trail ≤ 30 seconds 99 % of the time, never to exceed 300 seconds
Table C.2: Example cloud transport connectivity service attributes and SLA ([i.17])
Service Priority CIR EIR Frame Delay
Delay Variation
Loss Availability
VoIP calls 0 10 mbit/s 0 5 ms < 1ms 0,1 % ≥ 99,99 % Telepresence 1 50 mbit/s 0 25 ms < 10 ms 0,1 % N/A Mission critical data
2 25 mbit/s 0 5 ms < 1 ms 0,01 % ≥ 99,995 %
Streamed live content
3 40 mbit/s 0 5 ms < 1 ms 0,01 % ≥ 99,99 %
Non real-time content
4 15 mbit/s 500 mbit/s 25 ms 10 ms 1 % ≥ 99 %
C.2 Application Test Methodologies for QoE measurements
C.2.1 NetFLIX™ Adaptive Streaming Load Generator with Quality Detection
NetFLIX™ adaptive Video Streaming service can present a substantial load upon a network infrastructure. This test emulates NetFLIX™ streaming service across the Device Under Test (DUT), which is a NFV based network. Measuring the impact of NetFLIX™ streaming service on the network can be invaluable when sizing a network.
NetFLIX™ streaming video service is a popular VoD service across the Internet. The service can take up substantial bandwidth and require QoS and tunes services for proper delivery. Specifically, NetFLIX™ streams take up the following network resources.
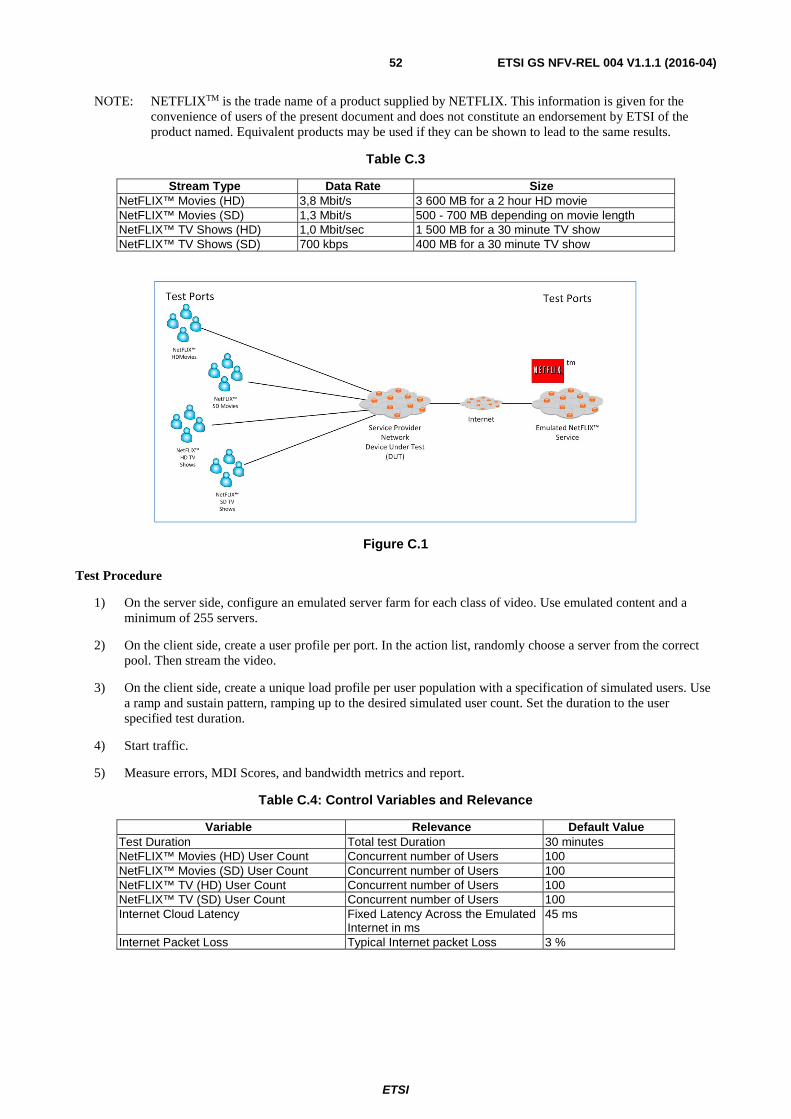
ETSI
ETSI GS NFV-REL 004 V1.1.1 (2016-04)52
NOTE: NETFLIXTM is the trade name of a product supplied by NETFLIX. This information is given for the convenience of users of the present document and does not constitute an endorsement by ETSI of the product named. Equivalent products may be used if they can be shown to lead to the same results.
Table C.3
Stream Type Data Rate Size NetFLIX™ Movies (HD) 3,8 Mbit/s 3 600 MB for a 2 hour HD movie NetFLIX™ Movies (SD) 1,3 Mbit/s 500 - 700 MB depending on movie length NetFLIX™ TV Shows (HD) 1,0 Mbit/sec 1 500 MB for a 30 minute TV show NetFLIX™ TV Shows (SD) 700 kbps 400 MB for a 30 minute TV show
Figure C.1
Test Procedure
1) On the server side, configure an emulated server farm for each class of video. Use emulated content and a minimum of 255 servers.
2) On the client side, create a user profile per port. In the action list, randomly choose a server from the correct pool. Then stream the video.
3) On the client side, create a unique load profile per user population with a specification of simulated users. Use a ramp and sustain pattern, ramping up to the desired simulated user count. Set the duration to the user specified test duration.
4) Start traffic.
5) Measure errors, MDI Scores, and bandwidth metrics and report.
Table C.4: Control Variables and Relevance
Variable Relevance Default Value Test Duration Total test Duration 30 minutes NetFLIX™ Movies (HD) User Count Concurrent number of Users 100 NetFLIX™ Movies (SD) User Count Concurrent number of Users 100 NetFLIX™ TV (HD) User Count Concurrent number of Users 100 NetFLIX™ TV (SD) User Count Concurrent number of Users 100 Internet Cloud Latency Fixed Latency Across the Emulated
Internet in ms 45 ms
Internet Packet Loss Typical Internet packet Loss 3 %
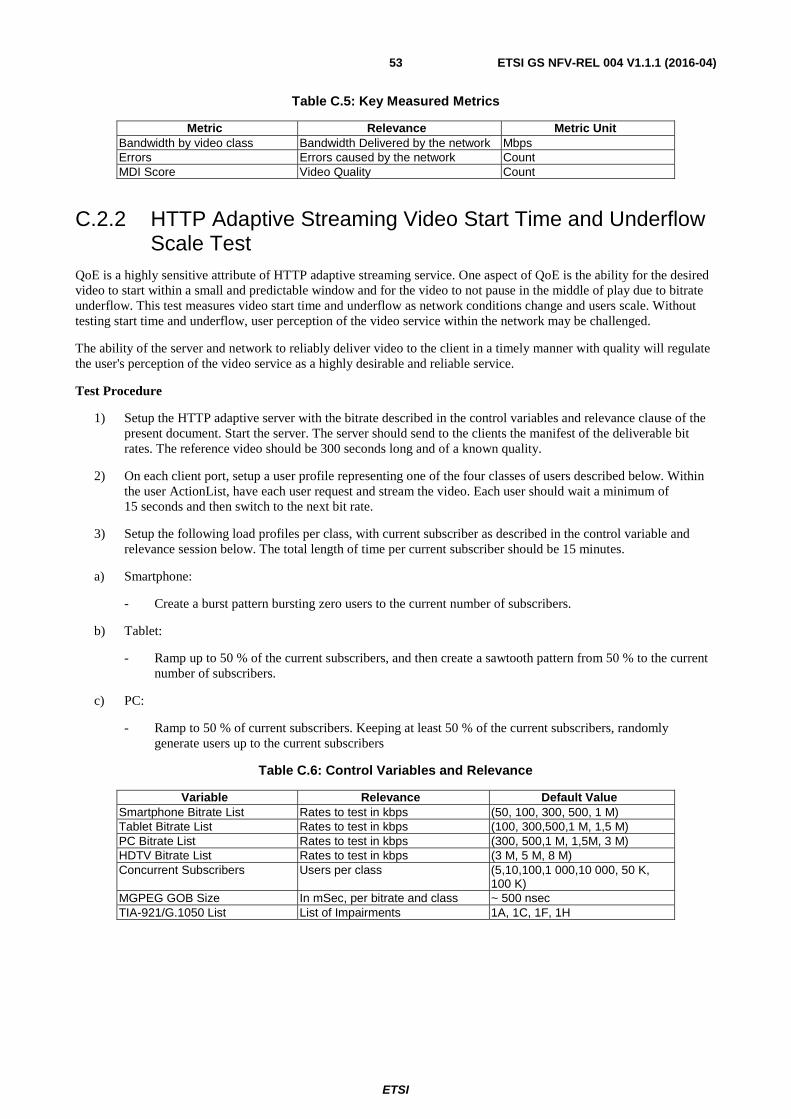
ETSI
ETSI GS NFV-REL 004 V1.1.1 (2016-04)53
Table C.5: Key Measured Metrics
Metric Relevance Metric Unit Bandwidth by video class Bandwidth Delivered by the network Mbps Errors Errors caused by the network Count MDI Score Video Quality Count
C.2.2 HTTP Adaptive Streaming Video Start Time and Underflow Scale Test
QoE is a highly sensitive attribute of HTTP adaptive streaming service. One aspect of QoE is the ability for the desired video to start within a small and predictable window and for the video to not pause in the middle of play due to bitrate underflow. This test measures video start time and underflow as network conditions change and users scale. Without testing start time and underflow, user perception of the video service within the network may be challenged.
The ability of the server and network to reliably deliver video to the client in a timely manner with quality will regulate the user's perception of the video service as a highly desirable and reliable service.
Test Procedure
1) Setup the HTTP adaptive server with the bitrate described in the control variables and relevance clause of the present document. Start the server. The server should send to the clients the manifest of the deliverable bit rates. The reference video should be 300 seconds long and of a known quality.
2) On each client port, setup a user profile representing one of the four classes of users described below. Within the user ActionList, have each user request and stream the video. Each user should wait a minimum of 15 seconds and then switch to the next bit rate.
3) Setup the following load profiles per class, with current subscriber as described in the control variable and relevance session below. The total length of time per current subscriber should be 15 minutes.
a) Smartphone:
- Create a burst pattern bursting zero users to the current number of subscribers.
b) Tablet:
- Ramp up to 50 % of the current subscribers, and then create a sawtooth pattern from 50 % to the current number of subscribers.
c) PC:
- Ramp to 50 % of current subscribers. Keeping at least 50 % of the current subscribers, randomly generate users up to the current subscribers
Table C.6: Control Variables and Relevance
Variable Relevance Default Value Smartphone Bitrate List Rates to test in kbps (50, 100, 300, 500, 1 M) Tablet Bitrate List Rates to test in kbps (100, 300,500,1 M, 1,5 M) PC Bitrate List Rates to test in kbps (300, 500,1 M, 1,5M, 3 M) HDTV Bitrate List Rates to test in kbps (3 M, 5 M, 8 M) Concurrent Subscribers Users per class (5,10,100,1 000,10 000, 50 K,
100 K) MGPEG GOB Size In mSec, per bitrate and class ~ 500 nsec TIA-921/G.1050 List List of Impairments 1A, 1C, 1F, 1H
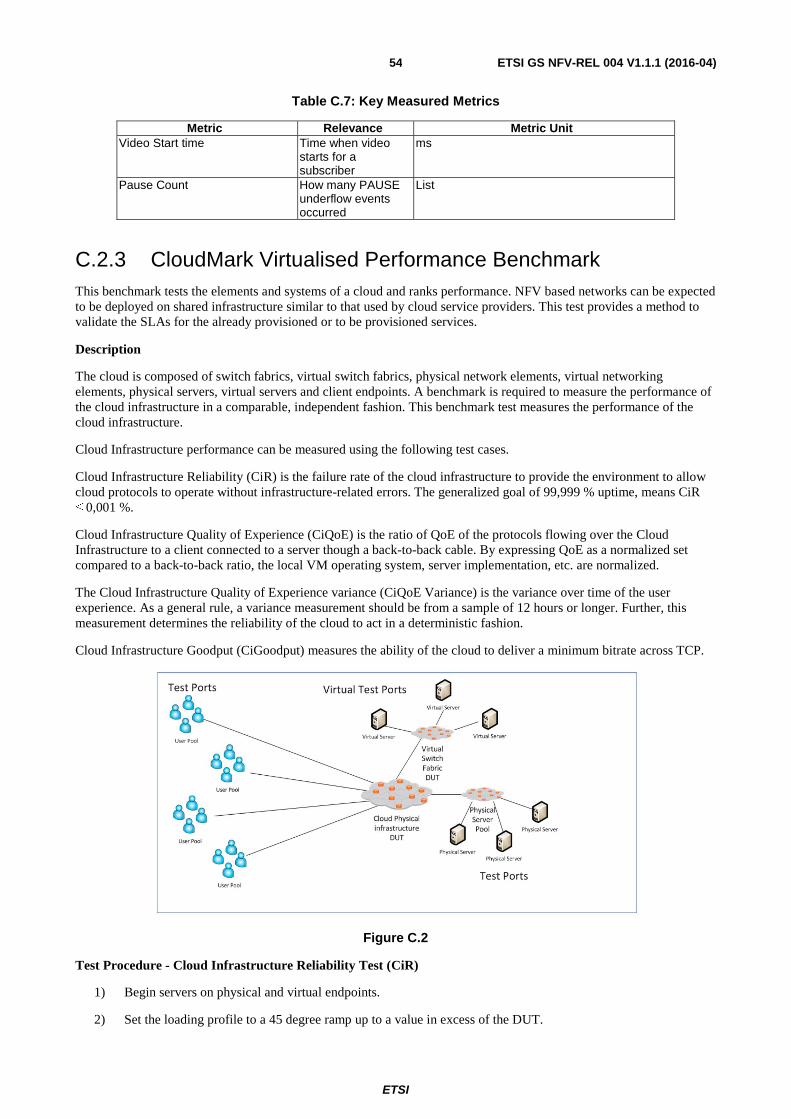
ETSI
ETSI GS NFV-REL 004 V1.1.1 (2016-04)54
Table C.7: Key Measured Metrics
Metric Relevance Metric Unit Video Start time Time when video
starts for a subscriber
ms
Pause Count How many PAUSE underflow events occurred
List
C.2.3 CloudMark Virtualised Performance Benchmark This benchmark tests the elements and systems of a cloud and ranks performance. NFV based networks can be expected to be deployed on shared infrastructure similar to that used by cloud service providers. This test provides a method to validate the SLAs for the already provisioned or to be provisioned services.
Description
The cloud is composed of switch fabrics, virtual switch fabrics, physical network elements, virtual networking elements, physical servers, virtual servers and client endpoints. A benchmark is required to measure the performance of the cloud infrastructure in a comparable, independent fashion. This benchmark test measures the performance of the cloud infrastructure.
Cloud Infrastructure performance can be measured using the following test cases.
Cloud Infrastructure Reliability (CiR) is the failure rate of the cloud infrastructure to provide the environment to allow cloud protocols to operate without infrastructure-related errors. The generalized goal of 99,999 % uptime, means CiR ≤ 0,001 %.
Cloud Infrastructure Quality of Experience (CiQoE) is the ratio of QoE of the protocols flowing over the Cloud Infrastructure to a client connected to a server though a back-to-back cable. By expressing QoE as a normalized set compared to a back-to-back ratio, the local VM operating system, server implementation, etc. are normalized.
The Cloud Infrastructure Quality of Experience variance (CiQoE Variance) is the variance over time of the user experience. As a general rule, a variance measurement should be from a sample of 12 hours or longer. Further, this measurement determines the reliability of the cloud to act in a deterministic fashion.
Cloud Infrastructure Goodput (CiGoodput) measures the ability of the cloud to deliver a minimum bitrate across TCP.
Figure C.2
Test Procedure - Cloud Infrastructure Reliability Test (CiR)
1) Begin servers on physical and virtual endpoints.
2) Set the loading profile to a 45 degree ramp up to a value in excess of the DUT.
ETSI
ETSI GS NFV-REL 004 V1.1.1 (2016-04)55
3) Start Table 1 Traffic on client and server.
4) Client traffic should be evenly split between physical server and virtual server endpoints.
5) Start test traffic client.
6) Stop once either a failed transaction or fail connection occurs.
7) Set a new loading profile to ramp up to the measured failure point minus one connection or transaction. In the case of multiple failures, use the SimUser count for the lowest value minus 1. In the sustaining portion of the load profile, run the duration in excess of 12 hours.
8) Start traffic.
9) Stop traffic if and when a failed connection or transaction was detected.
10) Calculate the CIR by creating the ratio of 1 failure divided by the cumulative number of SimUsers.
11) In the case of no failure, keep doubling the time until a failure is reached or until the CIR Ratio becomes less than 0,001 %.
12) The CiR is reported as "X % reliability at Y concurrent user sessions."
Table C.8: Control Variables and Relevance
Variable Relevance Default Value Number of open users Peak level of reliability Measured Cumulative successful SimUsers session before failure
Used to build ratio of reliability Measured
Cumulative users at Failure minus one
Upper level of measurement Measured
Test Duration Time of Steady State Phase 60 minutes
Table C.9: Key Measured Metrics
Metric Relevance Metric Unit CiR Ratio of first failure
to the number of open SimUser sessions of success
percent
Test Procedure - Cloud Infrastructure Quality of Experience (CiQoE)
1) Calculate the virtual server QoE baseline:
a) Turn off all background traffic.
b) Using the service flow describe above, setup a single virtual endpoint as a client and a single virtual endpoint as a server. The pathway should traverse the virtual switch fabric.
c) The virtual client should run one user session to the virtual server.
d) Measure the QoE metrics as describe above. These become the baseline for the virtual servers.
e) Reset all virtual endpoints as virtual servers.
2) Calculate the physical server QoE baseline:
a) Turn off all background traffic.
b) Using the service flow describe above, setup a single physical endpoint as a client and a single physical endpoint as a server. The pathway should traverse the virtual switch fabric.
c) The physical client should run one user session to the physical server.
d) Measure the QoE metrics as describe above. These become the baseline for the physical servers.

ETSI
ETSI GS NFV-REL 004 V1.1.1 (2016-04)56
3) Use the loading profile in the CiR test (Error minus one). Set the load profile to send 50 % of the traffic to the virtual servers and 50 % to the physical servers. Ramp up to the peek value and sustain for the desired duration of the test. (Minimum of 60 minutes.)
4) Start traffic.
5) If any QoE metrics failed, demine the number of concurrent SimUsers at failure and adjust the ramp down to that level. Go to Step 4 until no QoE failures are detected.
6) Measure the maximum value measure (Longest page load time, slowest FTP transfer, and smallest MOS-AV and MOS-LQ scores).
7) Divide the measure QoE number by its baseline equivalent. This is a percent impact of the infrastructure on traffic.
8) CiQoE is this calculated percent impact by protocol at a peek concurrent SimUser count.
Table C.10: Control Variables and Relevance
Variable Relevance Default Value Peek Concurrent SimUsers with No QoE Errors
Upper limit of users Measured
Baseline QoE Values Perfect case value Measured Measure Infrastructure QoE Values
Cloud impacted QoE Metrics Measured
Test Duration Time of Steady State Phase 60 minutes
Table C.11: Key Measured Metrics
Metric Relevance Metric Unit CiQoE Quality of
Experience Impact percent
Test Procedure - Cloud Infrastructure Quality of Experience Variance (CiQoEv)
1) Calculate the virtual server QoE baseline:
a) Turn off all background traffic.
b) Using the service flow described above, setup a single virtual endpoint as a client and a single virtual endpoint as a server. The pathway should traverse the virtual switch fabric.
c) The virtual client should run one user session to the virtual server.
d) Measure the QoE metrics as described above. These become the baseline for the virtual servers.
e) Reset all virtual endpoints as virtual servers.
2) Calculate the physical server QoE baseline:
a) Turn off all background traffic.
b) Using the service flow described above, setup a single physical endpoint as a client and a single physical endpoint as a server. The pathway should traverse the virtual switch fabric.
c) The physical client should run one user session to the physical server.
3) Measure the QoE metrics as described above. These become the baseline for the physical servers.
4) Use the loading profile calculated in the CiR test (Error minus one). Set the load profile to send 50 % of the traffic to the virtual servers and 50 % to the physical servers. Ramp up to the peek value and sustain for the desired duration of the test. (minimum of 60 minutes.)
5) Start Traffic.
ETSI
ETSI GS NFV-REL 004 V1.1.1 (2016-04)57
6) If any QoE metrics failed, demine the number of concurrent SimUsers at failure and adjust the ramp down to that level. Go to Step 4 until no QoE failures are detected.
7) Measure the maximum value measure (Longest page load time, slowest FTP transfer, smallest MOS-AV and MOS-LQ scores) every 4 seconds during the duration of the test.
8) By protocol, divide the measured QoE by the Baseline for each 4 second interval. This is the instantaneous cloud infrastructure impact percent.
9) With the set calculated, determine the standard deviation and variance.
10) The CiQoEv value is presented as a variance of at a measured standard deviation.
Table C.12: Control Variables and Relevance
Variable Relevance Default Value Peek Concurrent SimUsers with No QoE Errors
Upper limit of users Measured
Baseline QoE Values Perfect case value Measured Measure Infrastructure QoE Values
Cloud impacted QoE Metrics Measured
Test Duration Time of Steady State Phase 60 minutes
Table C.13: Key Measured Metrics
Metric Relevance Metric Unit CiQoEv Variance Variance of change CiQoEv Std. Dev. Deviation of change
Test Procedure - Cloud Infrastructure Quality of Experience Variance (CiGoodput)
1) Start traffic in clause B.2.1.
2) Setup client and server traffic in a fully partial mesh. All clients should talk evenly to both virtual and physical servers.
3) Use the load profile calculated in the CiR test case.
4) Generate traffic for the desired duration.
5) Measure the minimum goodput achieved after the ramping phase by protocol.
6) Report Minimum average and maximum goodput by protocol.
Table C.14: Control Variables and Relevance
Variable Relevance Default Value Peek Concurrent SimUsers with No QoE Errors
Upper limit of users Measured
Test Duration Time of Steady State Phase 60 minutes
Table C.15: Key Measured Metrics
Metric Relevance Metric Unit Minimum/Average/Maximum Goodput
Achievable goodput by protocol
bandwidth
C.2.4 Example Test Methodology for Evaluating NFV Resiliency Objective
Evaluate the resiliency of the NFV network at service or network turn up time on a real network in event of different types of faults at various NFV component levels.
ETSI
ETSI GS NFV-REL 004 V1.1.1 (2016-04)58
Test Setup
The test setup consists of a pre-defined set of services provisioned in the NFV based network. The Test Controller has the ability to provision the VTAs to generate realistic traffic to emulate the E2E service. The test traffic may be stateful or stateless based on the type of service being tested. The Test Controller should have the ability to provision virtual impairment generators (VIG), establish control plane sessions with the VIGs and send instructions that describe the type of faults, duration of the faults and location of the faults.
Test Procedure
• The Test Controller sets up VTAs to generate real world service traffic for the services provisioned in the network.
• The Test controller specifies fault injection targets, creates fault injection load distribution.
• The Test Controller instructs the VTAs to generate test traffic that emulates the service traffic. Run test traffic for short duration tests and medium duration tests. The exact value of the duration is up to the operator as long the duration of the test takes into account the time required to stabilize the input and output rate of the test traffic.
• Measure the performance metrics applicable to the service obtained from the test results, retrieve and catalog the NFVI performance metrics collected for the duration of the test. This set of metrics will form the baseline for the resiliency evaluation.
• The Test Controller injects faults at various locations and iteratively modifies the type of faults injected.
• Record the service performance metrics and NFVI metrics for each fault type injected and for each fault location.
• Repeat fault injection by varying the time for which the fault condition is maintained resulting in intermittent, periodic or permanent faults.
• Record the service performance metrics and NFVI metrics for each variation.
• The test cycle may be repeated by injecting multiple faults at the same time and assess the performance impact on services assisting in resiliency evaluation of the framework.
Test Results
The set of service performance metrics, fault information and NFVI usage and performance metrics can help in determining the following indicators that evaluate the resiliency/fault tolerance of the network and further assist in improving the network design to enhance the resiliency.
• Types of faults that have a greater impact on a given service. Note that all faults will not have similar performance impact on all services.
• Faults that impact NFVI performance and capacity the most.
• Impact of fault location on the performance of a given E2E service depending on the type of service.
Co-relation between faults and service degradation behaviour to identify what type of faults and the severity of the fault will result in violation of the performance SLAs for E2E services.
ETSI
ETSI GS NFV-REL 004 V1.1.1 (2016-04)59
Annex D (informative): Authors & contributors The following people have contributed to the present document:
Rapporteur:
Gurpreet Singh (Spirent Communications)
Contributor:
Gurpreet Singh (Spirent Communications)
Eric Bauer (Alcatel-Lucent)
Randee S Adams (Alcatel Lucent)
Cameron Shearon (AT&T)
Don Topper (Huawei)
Chidung LAC (Orange)
Al Morton (AT&T)
Marcus Scholler (NEC)
Rory Browne (Intel)
Kevin Shatzkamer (Brocade)
Marcus Friman (Netrounds)
Stefan Arntzen (Huawei)
ETSI
ETSI GS NFV-REL 004 V1.1.1 (2016-04)60
Annex F (informative): Bibliography
• IETF RFC 3393: "IP Packet Delay Variation Metric for IP Performance Metrics (IPPM)".
• IETF RFC 4656: "A one-way active measurement protocol".
• ETSI GS NFV-SEC 001: "Network Functions Virtualisation (NFV); NFV Security; Problem Statement".
• ETSI GS NFV-INF 010 (V1.1.1): "Network Functions Virtualisation (NFV); Service Quality Metrics".
• TM Forum SLA Management Handbook Release 3.1 - GB 917.
• T. Banzai, H. Koizumi, R. Kanbayashi, T. Imada, T. Hanawa, and M. Sato: "D-cloud: design of a software testing environment for reliable distributed systems using cloud computing technology," CCGRID, Melbourne, Australia, May 2010.
• CSMIC SMI Measure for Assurance Category.
NOTE: Available at http://csmic.org.

ETSI
ETSI GS NFV-REL 004 V1.1.1 (2016-04)61
History
Document history
V1.1.1 April 2016 Publication