ethanol rail transportation review - surface … rail transportation reviewethanol rail...
TRANSCRIPT

Ethanol Rail Transportation ReviewEthanol Rail Transportation Review
June 12, 2008
Paul Hammes – VP & GM Agricultural Products
STB Rail Energy Transportation Advisory Council

2
Ethanol Rail Transportation Review
• Ethanol Market Overview• Ethanol and DDGS Impact on Rail Network• Ethanol Supply Chain Components• Potential Ethanol Supply Chain Constraints• Managing Ethanol Rail Transportation
3
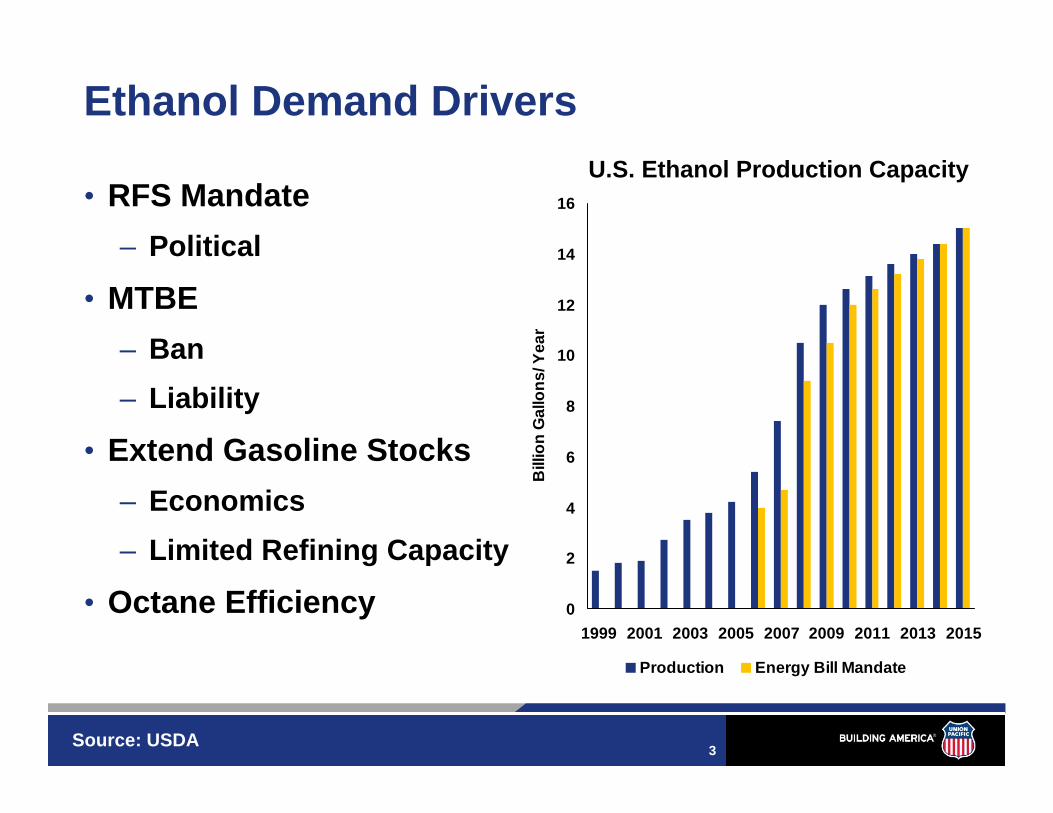
Ethanol Demand Drivers
• RFS Mandate – Political
• MTBE – Ban– Liability
• Extend Gasoline Stocks– Economics– Limited Refining Capacity
• Octane Efficiency 0
2
4
6
8
10
12
14
16
1999 2001 2003 2005 2007 2009 2011 2013 2015
Bill
ion
Gal
lons
/ Yea
r
Production Energy Bill Mandate
U.S. Ethanol Production Capacity
Source: USDA

4
Ethanol Production and Demand Markets
CA2%
IL/ IN/ OH
23%
Other19%
ND/ SD11%IA/ MN/
NE45%
CA2%
IL/ IN/ OH
23%
Other19%
ND/ SD11%IA/ MN/
NE45%
CA1%
IL/ IN/ OH
24%
ND/ SD10%
Other22%
IA/ MN/ NE
43%
CA1%
IL/ IN/ OH
24%
ND/ SD10%
Other22%
IA/ MN/ NE
43%
Other21%
CA13%
North East33%
South East24%
TX9%
Other21%
CA13%
North East33%
South East24%
TX9%
Production
Demand
2008 2015
South East17%
Other32%
North East22%
CA21%
TX8% South
East17%
Other32%
North East22%
CA21%
TX8%
Source: UPRR Estimate using various data sources

5
DDGS Production and Demand Markets
IL/ IN/ OH
14%
Other15%
CA/TX5%
ND/ SD20%
IA/ MN/ NE
46%
IL/ IN/ OH
14%
Other15%
CA/TX5%
ND/ SD20%
IA/ MN/ NE
46%
ND/ SD13%
IL/ IN/ OH
14%
CA/TX4%
Other23%
IA/ MN/ NE
46%
ND/ SD13%
IL/ IN/ OH
14%
CA/TX4%
Other23%
IA/ MN/ NE
46%
CA/ ID12%Other
26%TX/ KS/
OK25%
South West5%
Export10%
IA/ MN/ NE
22%
CA/ ID12%Other
26%TX/ KS/
OK25%
South West5%
Export10%
IA/ MN/ NE
22%
2008 2015
CA/ ID9%
South West4%
Export16%
IA/ MN/ NE
17%
TX/ KS/ OK
20%
Other34%
CA/ ID9%
South West4%
Export16%
IA/ MN/ NE
17%
TX/ KS/ OK
20%
Other34%
Source: UPRR Estimate using various data sources
Production
Demand

6
US Ethanol Biorefinery Locations
Source: Renewable Fuels Association
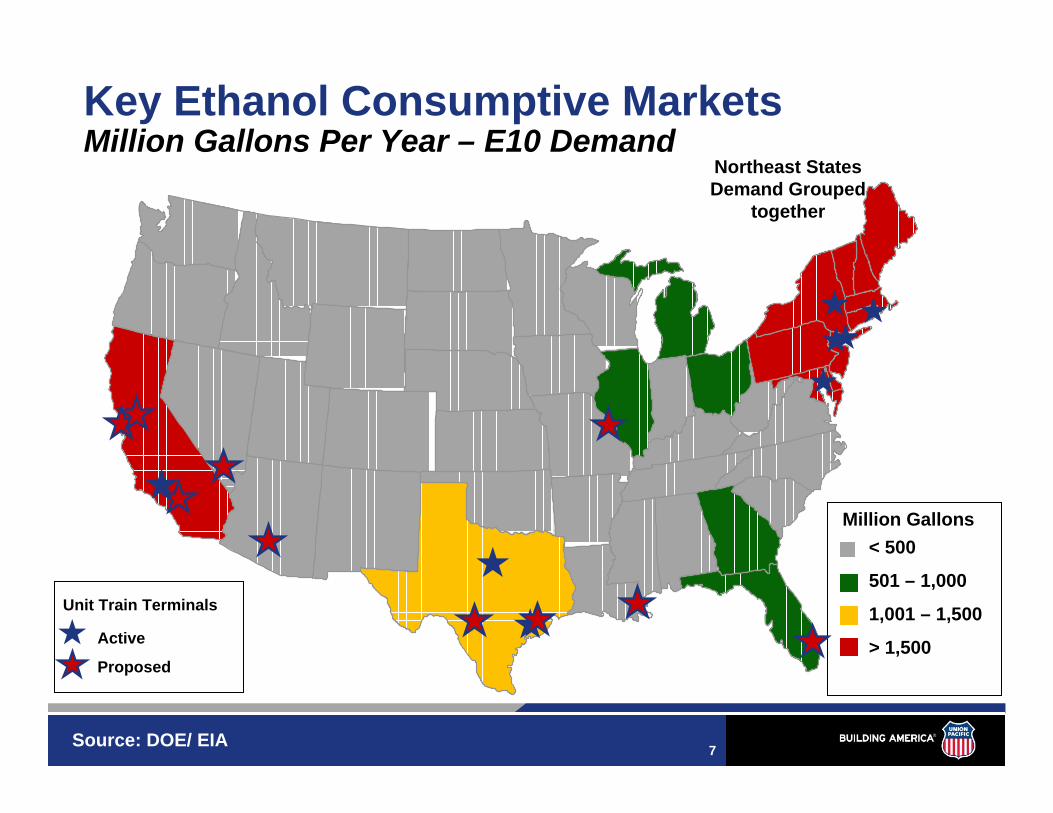
7Source: DOE/ EIA
Northeast States Demand Grouped
together
< 500
501 – 1,000
1,001 – 1,500
> 1,500
Million Gallons
Active
Proposed
Unit Train Terminals
Key Ethanol Consumptive MarketsMillion Gallons Per Year – E10 Demand
8
0
30,000
60,000
90,000
120,000
150,000
180,000
210,000
2006 2008 2015
Rai
l Car
Equ
ival
ents
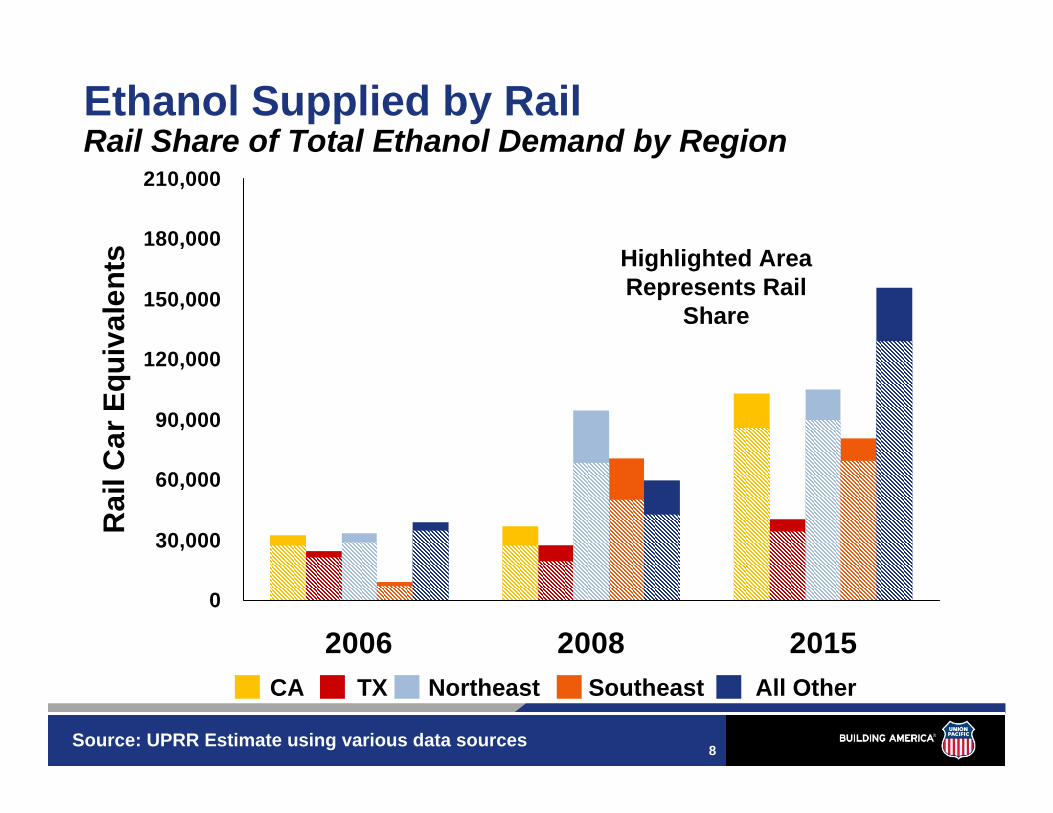
Ethanol Supplied by RailRail Share of Total Ethanol Demand by Region
Highlighted Area Represents Rail
Share
Source: UPRR Estimate using various data sources
CA Northeast Southeast All OtherTX
0
30,000
60,000
90,000
120,000
150,000
180,000
210,000
2006 2008 2015
Rai
l Car
Equ
ival
ents

9
0
20,000
40,000
60,000
80,000
100,000
120,000
2006 2008 2015
Rai
l Car
Equ
ival
ents
DDGS Supplied by RailRail Share of Total DDGS Demand by Region
CA/ ID TX/ KS/ OK IA/ MN/ NE Southwest Export Other
0
20,000
40,000
60,000
80,000
100,000
120,000
2006 2008 2015
Rai
l Car
Equ
ival
ents
Source: UPRR Estimate using various data sources
Highlighted Area Represents Rail
Share
10
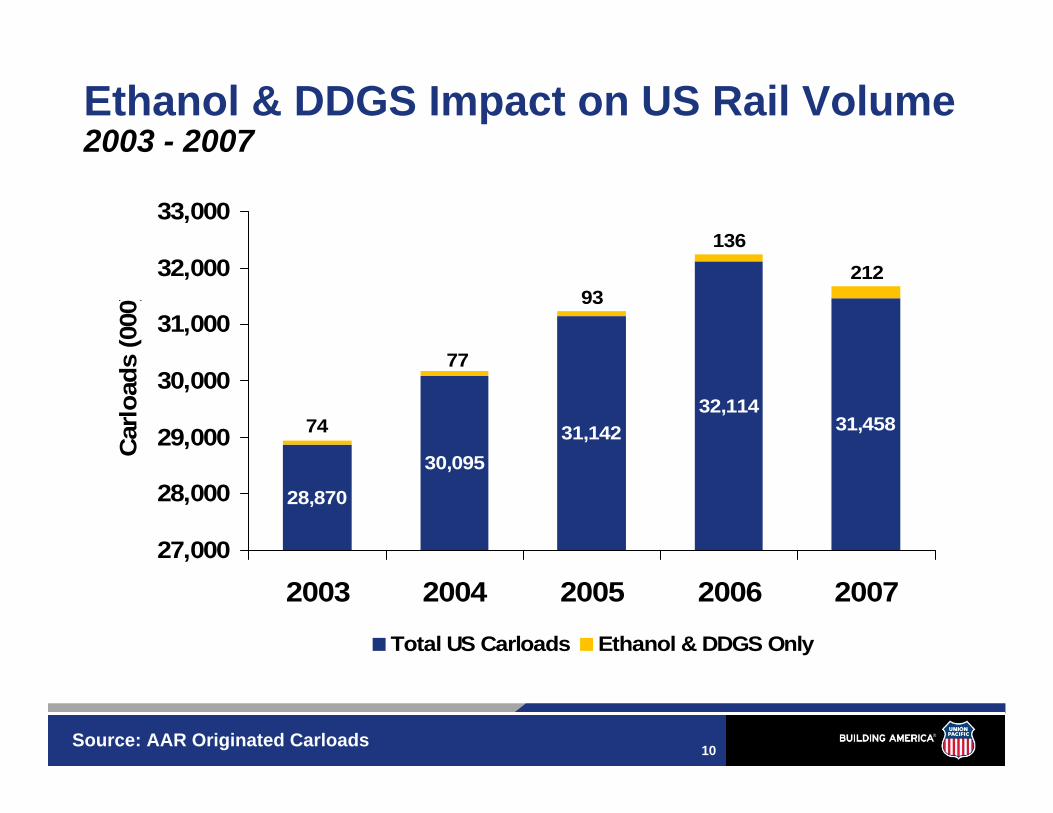
Ethanol & DDGS Impact on US Rail Volume2003 - 2007
28,870
30,09531,142
32,11431,458
212136
93
77
74
27,000
28,000
29,000
30,000
31,000
32,000
33,000
2003 2004 2005 2006 2007
Car
load
s (0
00)
Total US Carloads Ethanol & DDGS Only
Source: AAR Originated Carloads

11
Ethanol Supply Chain Components
• Production Plant– 55 MGY generates 5 cars each of ethanol and DDGS per day– Track infrastructure
• Tank Cars• Rail Network
– Manifest/Gathered-Combo/Unit– Terminal Yards/Line haul
• Unload Terminal– Unload System and Tank Storage
• Truck Rack

12
Potential Ethanol Supply Chain Constraints
• Rail Line Capacity• Rail Terminal/ Yard Capacity • Unit vs Manifest Shipments• Terminal Unload Capacity• Pipeline Management• Tank Cars• Storage Capacity

13
Future Corridor Volumes Compared to Current Corridor Capacity2035 Without Improvements
Source: National Rail Freight Infrastructure Capacity and Investment Study by Cambridge Systematics, Inc.
Note: Volumes are for the 85th percentile day
14
Sioux City
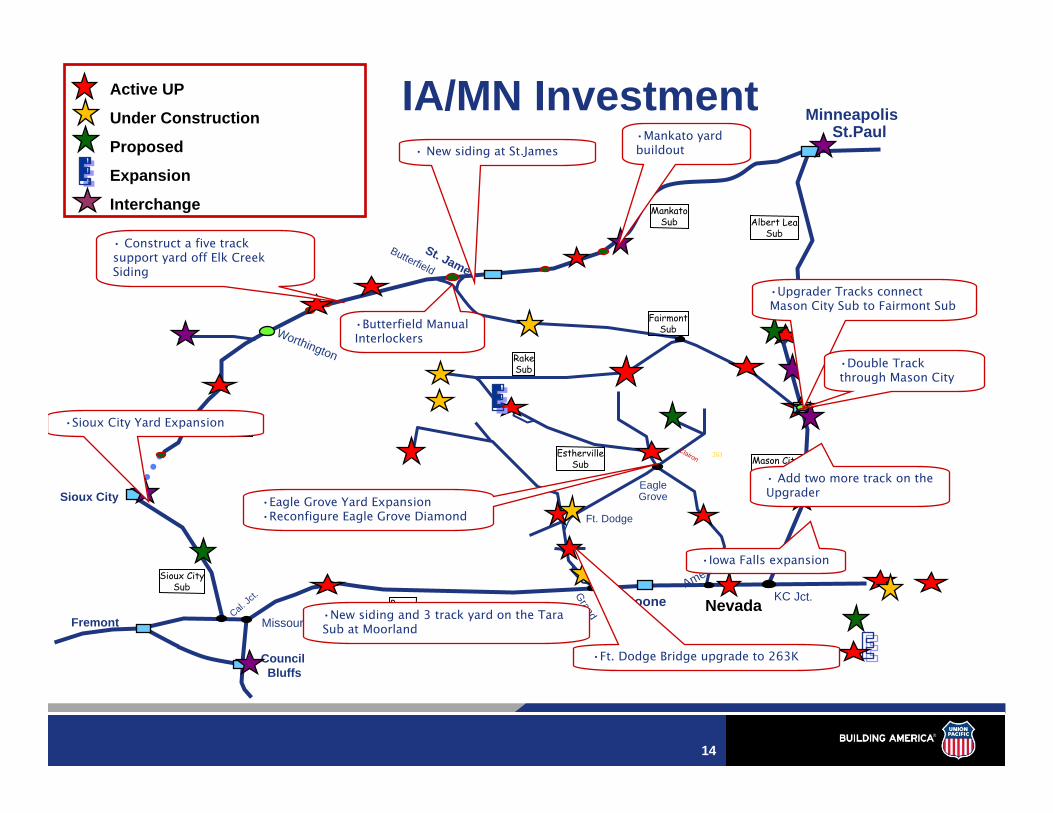
IA/MN Investment
Council Bluffs
Fremont
MinneapolisSt.Paul
Boone
Worthington
Butterfield
EagleGrove
Ames
Grand
Jct.
KC Jct.
Ft. Dodge
St. James
Clairon
Cal. Jc
t.
Missouri Valley
263
FairmontSub
EsthervilleSub
RakeSub
Mason City Sub
Albert LeaSub
BooneSub
WorthingtonSub
Sioux CitySub
Nevada
MankatoSub
Active UP
Under Construction
Proposed
Expansion
Interchange
• New siding at St.James•Mankato yard buildout
•Eagle Grove Yard Expansion•Reconfigure Eagle Grove Diamond
•Iowa Falls expansion
•New siding and 3 track yard on the Tara Sub at Moorland
• Construct a five track support yard off Elk Creek Siding
•Sioux City Yard Expansion
•Upgrader Tracks connect Mason City Sub to Fairmont Sub
•Ft. Dodge Bridge upgrade to 263K
• Add two more track on the Upgrader
•Butterfield Manual Interlockers
•Double Track through Mason City
15
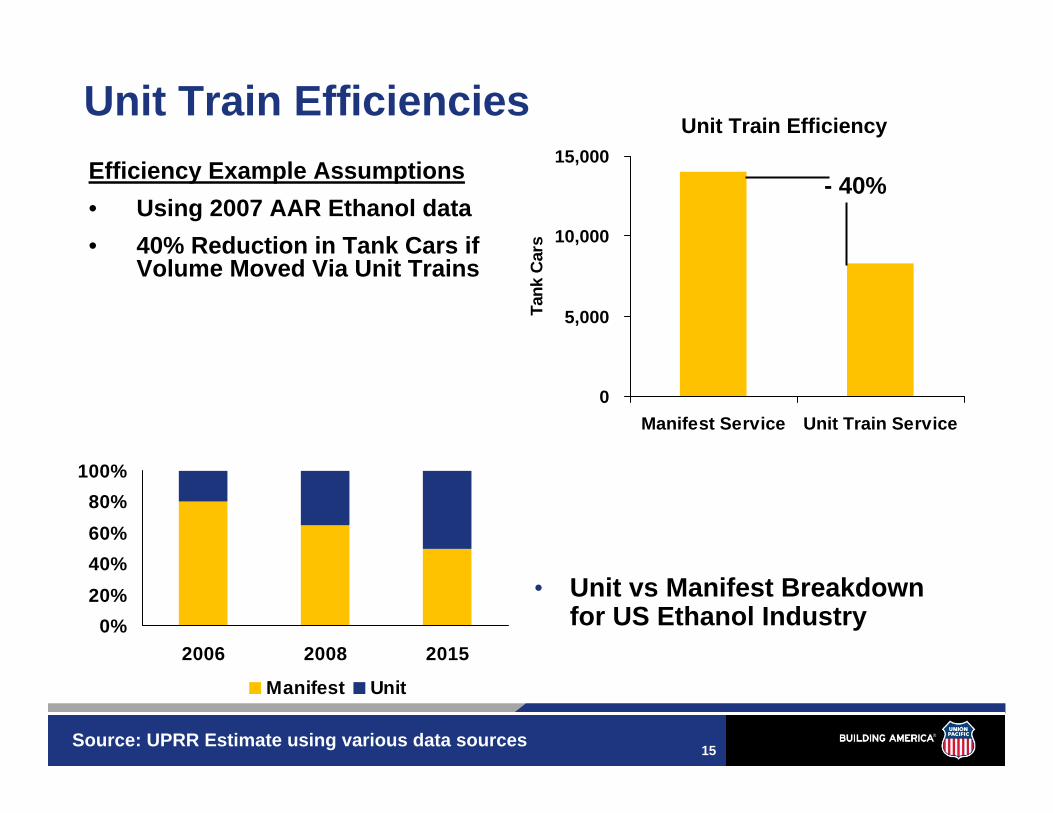
Unit Train Efficiencies
0
5,000
10,000
15,000
Manifest Service Unit Train Service
Tank
Car
s
Efficiency Example Assumptions• Using 2007 AAR Ethanol data• 40% Reduction in Tank Cars if
Volume Moved Via Unit Trains
• Unit vs Manifest Breakdown for US Ethanol Industry0%
20%40%60%80%
100%
2006 2008 2015
Manifest Unit
Unit Train Efficiency
- 40%
Source: UPRR Estimate using various data sources

16
0
20,000
40,000
60,000
80,000
100,000
120,000
140,000
160,000
2006 2008 2010
Car
load
s
0
20,000
40,000
60,000
80,000
100,000
120,000
140,000
160,000
2006 2008 2015
Car
load
sEstimated Unit Train Terminal CapacityMaximum vs Current or Forecasted
CA Northeast Southeast All OtherTX
Shaded Area Represents Current
and Expected Operating Capacity
Source: UPRR Estimate using various data sources
52% 60%
33%20%
50%
15%
31%
26%
60%
15%
25%
17
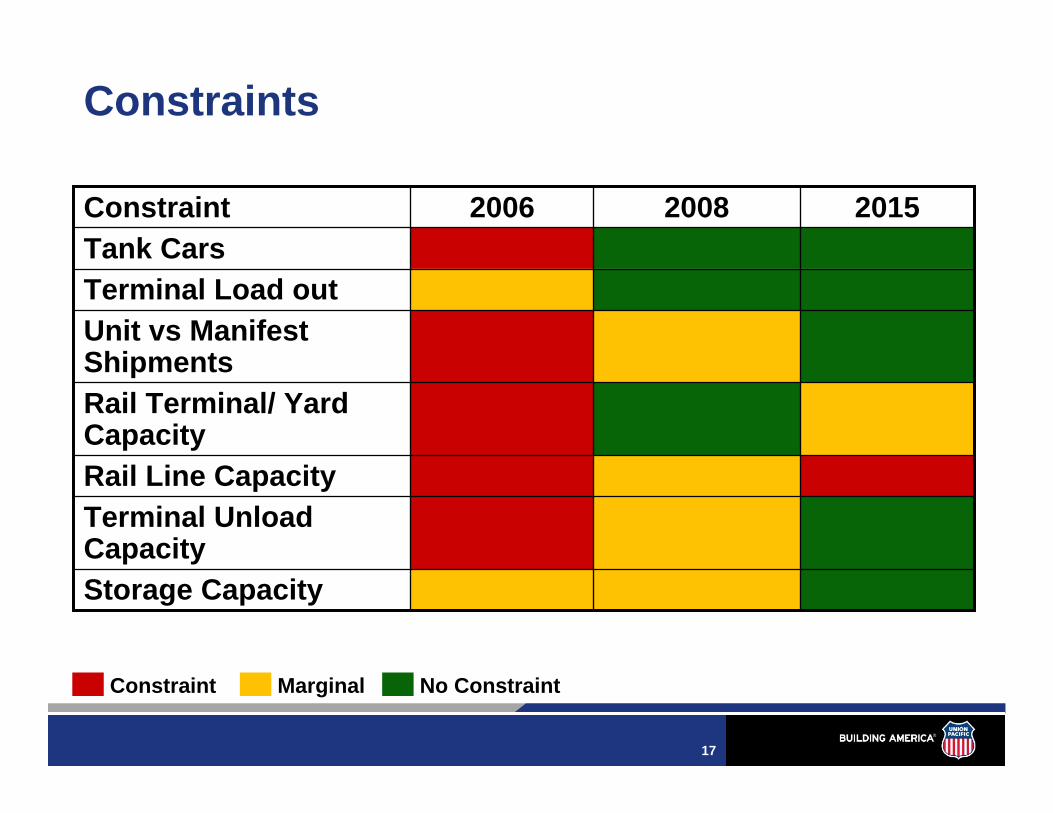
Constraints
Rail Line Capacity
Rail Terminal/ Yard Capacity
Tank CarsTerminal Load out
Storage Capacity
Terminal Unload Capacity
Unit vs Manifest Shipments
201520082006Constraint
Constraint Marginal No Constraint
18
Managing Ethanol Rail Transportation
• Resource and Capacity Planning• Pipeline Management• Tactical Management Tools

19
Resource and Capacity Planning
• Site Development Assistance• Guidelines for Rail Service to New Industry Locations• Rail Access Approval Process
– Links to Operating, Network Planning, Service Design, Engineering and Commercial Teams
• Capacity and Resource Evaluation

20
Restricted Access -- Mainline CorridorControlled Access – Mainline CorridorAllowable Access – Mainline Corridor
OregonTrunkJct
Hinkle
Ft. Worth
Oakley
San Jose
NorthPlatte
LosAngeles
Memphis
Laredo
Guidelines for Rail Service to New Industry Locations
on Union Pacific’s Mainline
San Antonio
Nampa
Poplar Bluff
Barstow
Seattle
Oakland
KansasCity
Salt Lake City
CouncilBlufffs
St.Louis
Denver
Alexandria
Pocatello
Stockton
Las Vegas
New Orleans
Lynndyl
South Morrill
Salem
Taylor
Texarkana
Livonia
Angleton
Dillon
Silver Bow
La Grande
Spokane
Eastport
Marysville
Chickasha
Bloomington
Corpus Christi
Provo
Jeff City
Robstown
N. Little Rock
Wagoner
Paola
Granger
Houston
Salina
Brownsville
Shreveport
Mason
City
MinneapolisSt.Paul
JanesvilleBelvidere
Valley Park
Clinton
K C JctBoone
Milwaukee
Sioux City
Chicago
Shawnee Jct
Adams
0
Woodland Jct
Portland
Roseville
Ogden
Santa Barbara W.Colton
Tucson
Phoenix
Dotsero
El Paso
Wichita
Pueblo
Topeka
0
Hearne
Dallas
Pine Bluff
Palestine
EaglePass
Nogales
Mojave
Bakersfield
Dexter
Yuma Picacho Lordsburg
Vaughn
Hutchinson
Fresno
Helper
GrandJct.
Lewisville
Eugene
Sierra Blanca
KlamathFalls
Flatonia
Lathrop
Martinez
JonesboroStratford
Chico
Amarillo
Tacoma
Reno
San Luis Obispo
Gibbon
Waco
Spofford
Pratt
Coffeyville
Parsons
Sanderson
Bill
Smelter
Egbert
Bond
Phippsburg
O'Fallons
Mt. Vernon
Odem
Beaumont
LakeCharles
Lafayette
Sweetwater
Arco
Niland
Portola
Elko
Marysville
Marshall
Bald Knob
Brinkley
Herington
NorthportRawlins
CheyenneFremont
Nelson
Altoona
Van Buren
San Marcos
Ontario
Chemult
Flanigan
Sacramento
Watsonville
St. James
Muskogee
Findlay Jct.
Ayer Jct
Idaho Falls
Axial
Ridgley
Round Rock
McAlester
Nogales
September 14, 2006
21
• Industrial Development contacted during site selection
• Commercial Team assesses rail transportation needs and requirements
• 10% Conceptual Drawing sent for approval• Customer Service Profile submitted• Memorandum of Understanding issued• Exhibit A Prints / Construction Drawings submitted• Track Inspection completed• Industry Track Contract issued
Rail Access Process
22
Pipeline Management
• Ethanol Shipment Forecasting System• Loaded and Empty Unit Train Coordination• Tactical Management Tools

23
Ethanol Shipment Forecasting System
• 30 Day Rolling Forecast
• Update System as Changes Arise
• Provide Trace and Buffer Cars in System 24 Hours Prior to Release
• Provide Billing Prior to 9A Cutoff
24
Ethanol Shipment Forecasting System
Compliance• Power Plan• Crew Availability• Corridor/ Terminal
Capacity• Train Slotting
Non-Compliance• Power Imbalances• Recrews/ Extras• Crew Imbalances• Power Repositioning• Increased Fuel
Consumption
25
Unit Train Coordination
• Customer Input into Forecast System• Bulk Train Planner symbols Unit Train• Weekly Communication with Load Facilities• Resource Planning Based on Customer Forecast• Daily Communication with Eastern Carriers• Daily Communication with Unload Terminals• Power Placement• Crews Forecasted Several Days
26
Tactical Management Tools
• Bulk Train Planner (BTP)– Real Time Unit Train Monitoring– Efficient Coordination of Unit Train Resources
• Customer Inventory Management System (CIMS)– Proactive Management of Customer Car Flow
• Customer Operating Instructions (COI)• Permit Distribution System (PDS)
– U.S. Development Group (USD) System– Schedule and Control Traffic Flow into USD Terminals
