ethanol & biodiesel.pdf
TRANSCRIPT
Ethanol & Biodiesel Information ServicePricing, News and Analysis for Buying and Supplying Ethanol-Blended Fuel and Biodiesel
In Each Issue ...
Ethanol & Biodiesel Information Service is an OPIS Publication | www.opisnet.com | 888.301.2645 | [email protected]
September 21, 2015 • Volume 12, Issue 38
See page 2 for more spot pricing locations
U.S. RINs (prices in U.S. $/RIN)
Fri. 09/11 Mon. 09/14 Tues. 09/15 Wed. 09/16 Thurs. 09/17 Wkly. Avg.
U.S. Ethanol RINs
Current Yr 0.2850-0.3000 0.2850-0.2900 0.2800-0.3000 0.3000-0.3200 0.3150-0.3250 0.30000
Previous Yr 0.2950-0.3100 0.2950-0.3000 0.2900-0.3100 0.3100-0.3300 0.3225-0.3325 0.30950
U.S. Cellulosic RINs
Current Yr 0.6350-0.6450 0.6350-0.6450 0.6350-0.6450 0.6350-0.6450 0.6350-0.6450 0.64000
Previous Yr 0.4850-0.4950 0.4850-0.4950 0.4850-0.4950 0.4850-0.4950 0.4850-0.4950 0.49000
U.S. Biodiesel RINs
Current Yr 0.3800-0.3900 0.3800-0.3900 0.4100-0.4300 0.4300-0.4550 0.4400-0.4600 0.41650
Previous Yr 0.3600-0.3700 0.3500-0.3700 0.3700-0.4000 0.3900-0.4100 0.4000-0.4100 0.38300
U.S. Advanced Biofuel RINs
Current Yr 0.3750-0.3800 0.3400-0.3600 0.4100-0.4250 0.4200-0.4500 0.4300-0.4400 0.40300
Previous Yr 0.3200-0.3300 0.3200-0.3400 0.3700-0.4000 0.3800-0.4000 0.3900-0.4000 0.36500
October 2015 November 2015 December 2015 January 2016
CBOT 152.20 149.60 147.40 145.50
Settlement Thursday, September 17, 2015 Source: Chicago Board of Trade
Chicago (prices in U.S. $/gal.)
Fri. 09/11 Mon. 09/14 Tues. 09/15 Wed. 09/16 Thurs. 09/17 Wkly. Avg.
Ethanol 1.4900-1.4910 1.5150-1.5250 1.5200-1.5270 1.5300-1.5400 1.5400-1.5420 1.52200
DP ETH 1.4900-1.4950 1.5150-1.5250 1.5250-1.5300 1.5300-1.5400 1.5400-1.5450 1.52350
B100 SME 2.5700-2.7500 2.5200-2.7000 2.5200-2.7000 2.5700-2.7300 2.5300-2.7000 2.62900
RBOB Unl 1.6349-1.6449 1.5193-1.5293 1.5829-1.6679 1.7071-1.7386 1.7860-1.7960 1.66069
RBOB Pre 2.3524-2.3624 2.3068-2.3168 2.3704-2.4554 2.3171-2.3486 2.3210-2.3310 2.34819
CBOB Unl 1.4149-1.4249 1.3693-1.3793 1.4329-1.5179 1.5421-1.5736 1.5460-1.5560 1.47569
ULSD 1.5650-1.5750 1.5185-1.5285 1.5150-1.5250 1.5539-1.5639 1.5447-1.5547 1.54442
Chicago Rule 11 (prices in U.S. $/gal.)
Fri. 09/11 Mon. 09/14 Tues. 09/15 Wed. 09/16 Thurs. 09/17 Wkly. Avg.
Current Yr 1.4600-1.4800 1.4900-1.5000 1.5000-1.5200 1.5300-1.5400 1.5100-1.5400 1.50700
Ethanol Market Overview:
Chicago ethanol breaks outChicago ethanol continued to step higher in
an orderly fashion over the last week and clearly moved beyond the rangebound trading that characterized the market through most of August and through the first half of September.
Near-term bulk deals at the Chicago-area’s Argo facility reached $1.54/gal at midweek, and by presstime had moved over that number, with the last word showing transactions for material available over the next week at $1.542/gal. The latest trade talks indicated Chicago ethanol rolling up gains of as much as 7.5cts week to week and breaking out of the several cents either side of the middle $1.40s/gal range that the market inhabited for most of the last six weeks or so.
Backwardation did not disappear, but in some cases became more pronounced in Chicago. Even as timing rolled into the last dozen days of the month, prompt values were said to fetch as much as a penny over any-September volumes that had reports of $1.53/gal trading. Some any-October traded $1.50/gal at midweek, and the last discussions indicated it was still either side of that number – or about 2.75-3cts cheaper than the any-September barrels.
Though market sources noted that ethanol remained relatively costly against gasoline values, demand for near-term ethanol, at least in the Chicago-area bulk market, appeared to pick up through the week. Spot CBOB in the Windy City trading around $1.55 for the spot gallon indicated about party, or perhaps a penny
Ethanol & Gasoline Component Spot Market Prices
Ethanol Futures (cts/gal contract price)
Ethanol Market Overview ......................... 1
Ethanol and Gasoline Component Spot Prices ....................... 1-2
Block Term Contract Prices in Key Markets........................................... 3
Bulk Truck Spot Prices in Key Markets........................................... 3
Renewable Fuels Averages ....................... 5
Biofuels Stock Performance ..................... 6
Inside Washington..................................... 7
In Key Commodity Markets ...................... 8
Key Supply and Demand Statistics ................................................... 8
Biodiesel/Ethanol Plant Profitability ........10
Renewable Fuel Feedstock/ Co-Product Price Index ...........................11
European, Brazilian and CBI Markets .............................................12
News of the Week ....................................15
continued on page 3

www.opisnet.com | 888.301.2645
Ethanol & Biodiesel Information Service
2
September 21, 2015 • Volume 12, Issue 38
Gulf CoastFri. 09/11 Mon. 09/14 Tues. 09/15 Wed. 09/16 Thurs. 09/17 Wkly. Avg.
Ethanol 1.5700-1.5800 1.5500-1.5800 1.5600-1.5800 1.5600-1.5900 1.5700-1.6100 1.57500
B100 SME 2.3900-2.7000 2.3000-2.6500 2.3000-2.6500 2.3500-2.6800 2.3100-2.6400 2.49700
RBOB Unl 1.2749-1.2849 1.1818-1.1918 1.2279-1.2629 1.3071-1.3171 1.3110-1.3210 1.26804
RBOB Pre 1.5399-1.5499 1.4468-1.4568 1.4929-1.5279 1.5721-1.5821 1.5760-1.5860 1.53304
CBOB Unl 1.2549-1.2599 1.1868-1.1918 1.2179-1.2479 1.2921-1.3046 1.3110-1.3260 1.25929
Unleaded 1.3174-1.3249 1.2468-1.2473 1.2779-1.2919 1.3371-1.3471 1.3360-1.3460 1.30724
ULSD 1.4525-1.4600 1.3960-1.4050 1.3915-1.4000 1.4289-1.4414 1.4127-1.4222 1.42102
61ULSD 1.4525-1.4600 1.3960-1.4050 1.3915-1.4000 1.4289-1.4414 1.4127-1.4222 1.42102
New YorkFri. 09/11 Mon. 09/14 Tues. 09/15 Wed. 09/16 Thurs. 09/17 Wkly. Avg.
Ethanol 1.5600-1.5800 1.6000-1.6100 1.6000-1.6100 1.5900-1.6200 1.5950-1.6000 1.59650
ITT ETH 1.5600-1.5900 1.6000-1.6200 1.6000-1.6200 1.5900-1.6300 1.5950-1.6000 1.60050
Ethanol FWD 1.5400-1.5800 1.5700-1.5800 1.5700-1.5800 1.5650-1.6000 1.5700-1.5900 1.57450
B100 SME 2.4800-2.6300 2.4400-2.5700 2.4400-2.5700 2.4800-2.6000 2.4300-2.5600 2.52000
RBOB Unl 1.4199-1.4299 1.3543-1.3643 1.3179-1.3269 1.3671-1.3771 1.3610-1.3710 1.36894
RBOB Pre 1.8549-1.8649 1.7893-1.7993 1.5829-1.5929 1.6271-1.6371 1.6285-1.6385 1.70154
CBOB Unl 1.4249-1.4349 1.3593-1.3693 1.3219-1.3319 1.3711-1.3811 1.3650-1.3750 1.37344
CBOB Pre 1.8349-1.8449 1.7693-1.7793 1.5829-1.5929 1.6271-1.6371 1.6285-1.6385 1.69354
Unleaded *****–***** *****–***** *****–***** *****–***** *****–***** *****
ULSD 1.5125-1.5225 1.4660-1.4760 1.4625-1.4725 1.5039-1.5139 1.4922-1.5022 1.49242
Los AngelesFri. 09/11 Mon. 09/14 Tues. 09/15 Wed. 09/16 Thurs. 09/17 Wkly. Avg.
Ethanol 1.6400-1.6600 1.6400-1.6550 1.6500-1.6700 1.6650-1.6750 1.6700-1.6900 1.66150
CARBOB - R 1.5649-1.5749 1.5593-1.5693 1.5729-1.5829 1.6321-1.6421 1.6610-1.6710 1.60304
CARBOB - P 2.0049-2.0149 1.9993-2.0093 2.0129-2.0229 2.0721-2.0821 2.1010-2.1110 2.04304
ULSD 1.4625-1.4675 1.4110-1.4210 1.4075-1.4175 1.4489-1.4589 1.4864-1.4964 1.44776
Nebraska (fob Railcar)Fri. 09/11 Mon. 09/14 Tues. 09/15 Wed. 09/16 Thurs. 09/17 Wkly. Avg.
Ethanol 1.3700-1.3900 1.3700-1.3900 1.3900-1.4200 1.4100-1.4150 1.4200-1.4250 1.40000
Tampa Fri. 09/11 Mon. 09/14 Tues. 09/15 Wed. 09/16 Thurs. 09/17 Wkly. Avg.
Ethanol 1.6600-1.6800 1.6600-1.6800 1.6600-1.7000 1.6700-1.7150 1.6800-1.7250 1.68300
DallasFri. 09/11 Mon. 09/14 Tues. 09/15 Wed. 09/16 Thurs. 09/17 Wkly. Avg.
Ethanol 1.5300-1.5600 1.5300-1.5600 1.5300-1.5800 1.5450-1.5800 1.5550-1.5900 1.55600
San FranciscoFri. 09/11 Mon. 09/14 Tues. 09/15 Wed. 09/16 Thurs. 09/17 Wkly. Avg.
Ethanol 1.6400-1.6600 1.6400-1.6550 1.6500-1.6700 1.6650-1.6750 1.6700-1.6900 1.66150
Pacific NorthwestFri. 09/11 Mon. 09/14 Tues. 09/15 Wed. 09/16 Thurs. 09/17 Wkly. Avg.
Ethanol 1.6300-1.6400 1.6200-1.6300 1.6200-1.6400 1.6350-1.6450 1.6700-1.6900 1.64200
Calif. Low Carbon Fuel StandardCarbon Credit: $/MT; Carbon Intensity Pts: $/CI; Carbon Credit per Gallon Diesel: $/gal;
Carbon Credit per Gallon Gasoline: $/gal)
Fri. 09/11 Mon. 09/14 Tues. 09/15 Wed. 09/16 Thurs. 09/17 Wkly. Avg.
Carb Credit 62.000-68.000 63.000-65.000 64.000-66.000 64.000-65.000 64.000-66.000 64.7000
CI Pts 0.00510-0.00550 0.00510-0.00530 0.00520-0.00540 0.00520-0.00530 0.00520-0.00540 0.005270
CC Dsl 0.0082-0.0090 0.0083-0.0086 0.0084-0.0087 0.0084-0.0086 0.0084-0.0087 0.00853
CC Gas 0.0090-0.0099 0.0092-0.0095 0.0093-0.0096 0.0093-0.0095 0.0093-0.0096 0.00942
Ethanol & Gasoline Component Spot Market Prices (prices in U.S $/gal.) Methodology and Definitions:OPIS derives ethanol, gasoline and biodiesel prices
from many means, including surveying buyers and sellers via phone/e-mail, and receiving postings electronically from producers and purchasers. While OPIS makes best efforts to ensure the accuracy and timeliness of its prices, it in no way guarantees either the accuracy or timeliness of any of the data included herein. Definitions are as follows:
Ethanol Spot Price (Bulk Barge/Rail): These are large quantity pure ethanol deals transacted or being discussed in certain FOB markets.
Brazil Ethanol: Undenatured anhydrous ethanol cargoes, FOB Brazil terminals for export, typically 50,000 bbl or more available 5-30 days from the date of publication. The assessment generally reflects price at the Santos export terminal, though others may be used for assessment purposes.
Block Term Contract Values: These are the three-to-six month contract deals between large buyers and sellers of pure ethanol. Some are done as fixed, and those deals are reported in the “Fixed” column. Other deals are done based on a differential to certain gasoline benchmarks (usually conventional spot unleaded). Those formulae are tracked and reported by market each week in the “Formula”column and calculated (based on the closing Thursday price of the gasoline benchmark) to arrive at a “Formula Calculated” price. All deals (“Fixed” and “Formula”) are reported from a weighted average survey.
Bulk Truck Spot Prices (Rack): These are the prices for truck quantities of pure ethanol at storage points in the given market. These prices are not posted – they are offered to buyers given supply and demand dynamics at prices discovered and published by OPIS.
Splash Blend Rack Prices: These are the average of the Thursday closing price that producers and resellers are posting at various rack locations. Typically prices are for small quantities that marketers pull to blend into gasoline to create and deliver ethanol-blended gasoline to accounts.
Splash Blend Producer Prices: These are the average of the Thursday closing price that producers (not resellers) are posting at various rack locations. Typically prices are for small quantities that marketers pull to blend into gasoline to create and deliver ethanol-blended gasoline to accounts.
Low Carbon Fuel Standard Credits: Traded in U.S. dollars per metric ton of carbon dioxide (CO2), this represents the daily traded price range or range of bids and offers on carbon credits generated for compliance under California’s Low Carbon Fuel Standard program implemented by the California Air Resources Board. Trading is for credits transferable in the current calendar year, until the last month of the year when deals for the following year may also be considered.
www.opisnet.com | 888.301.2645
Ethanol & Biodiesel Information Service
3
September 21, 2015 • Volume 12, Issue 38
advantage, versus near-term spot ethanol.
However, Gulf Coast markets had cash ethanol values running 20cts or more over spot CBOB, while New York Harbor blenders looked at spot gasoline that underpriced ethanol by 23cts or so.
Spot prices still gained elsewhere as well last week, but not as much as Chicago. New York Harbor barges that remained around $1.60/gal for September represented an increase of 4cts or so week to week, while on the West Coast, California Bay Area rail cars last trading prompt at around $1.68/gal moved 4-5cts firmer on the week.
Ethanol prices continued to hold up even as corn markets weathered several losing sessions in a row. Ethanol values also seemed to shake off the volatile swings in gasoline trading as NYMEX futures started last week with steep losses before crawling back into midweek.
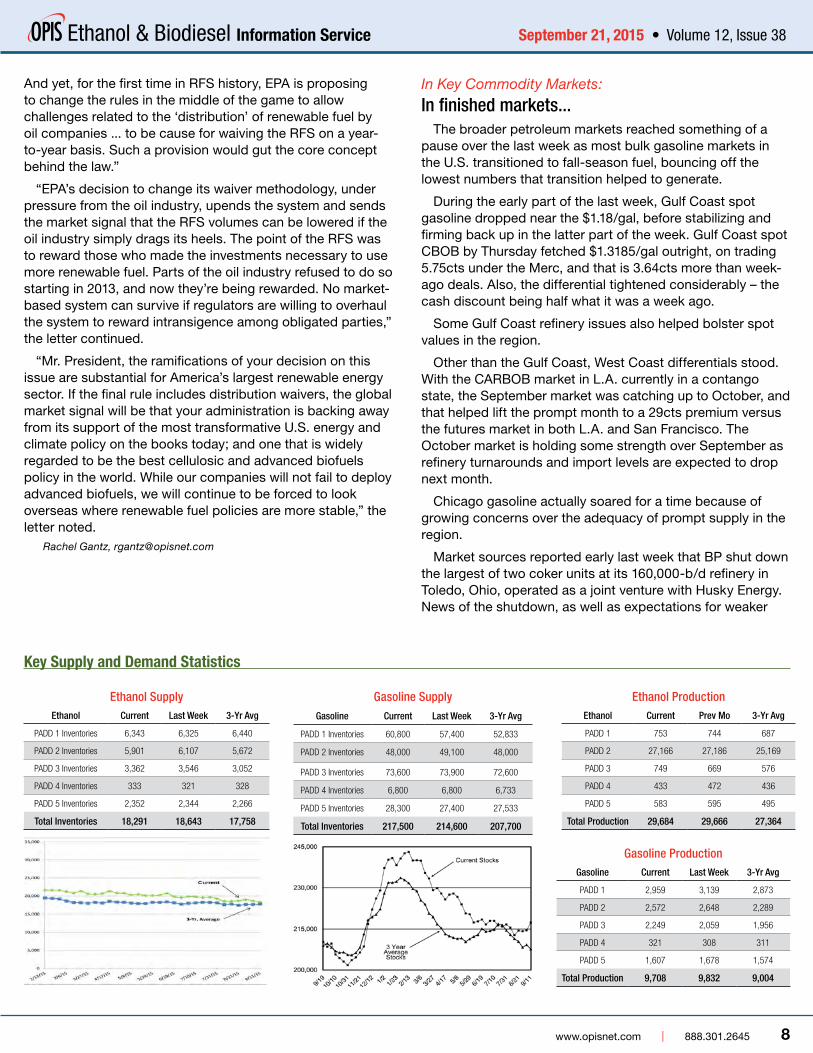
There is also the drag of demand damage that is widely anticipated as Labor Day and summer driving retreat into the rearview mirror. The first post-Labor Day report from EIA had net blender inputs of ethanol sliding back for the second week in a row, taking them down 18,000 b/d, or 2% in the last week to 878,000 b/d. That is the lowest ethanol input level reported since May, and it is also off 4.7% in the last two weeks.
At the same time, conventional gasoline blending with ethanol dropped 95,000 b/d week to week, a 1.7% loss that left it at a 23-week-low, 5.671 million b/d. Overall gasoline demand also eased under 9 million b/d for the first time since summer began, and it is down more than 5.5% over the last two weeks, according to EIA figures.
Ethanol production rates remain a mild surprise to some who anticipated tight margins, and recent summer heat might quell output. At 961,000 b/d, ethanol output added 3,000 b/d from the week before and climbed 1.4% over the last couple of weeks. Midwest plants did keep production steady week to week, at 872,000 b/d, accounting for 90.7% of all output.
However, ethanol inventory netted lower for a second consecutive week, with EIA showing a 352,000 draw for the week, to 18.291 million bbl. Over the last two weeks, the agency has supply off 3.7% and currently standing at its lowest level since December. Stocks also ran 2.7% behind what EIA reported for inventory during the same week last year.
Small builds showed in some regions, but large draws out of Midwest and Gulf Coast ethanol storage, down 3.4% and 5.2% week to week, respectively, sank supply nationally. East Coast ethanol stocks are also well behind the same time last year – down 11.4%, or about 818,000 bbl, against 2014 stores, according to EIA figures.
Reports of ethanol loadings out of Brazil mostly aimed at U.S. markets have yet to show up in weekly EIA reports, which counted virtually no U.S. ethanol imports for the second week in a row.
Spencer Kelly, [email protected]
E15 blending advantage stumbles into autumn
Sept. 15 represents the metaphorical start for the availability of much of the country’s E15 motor fuel, but some marketers have been in no rush to move back to the
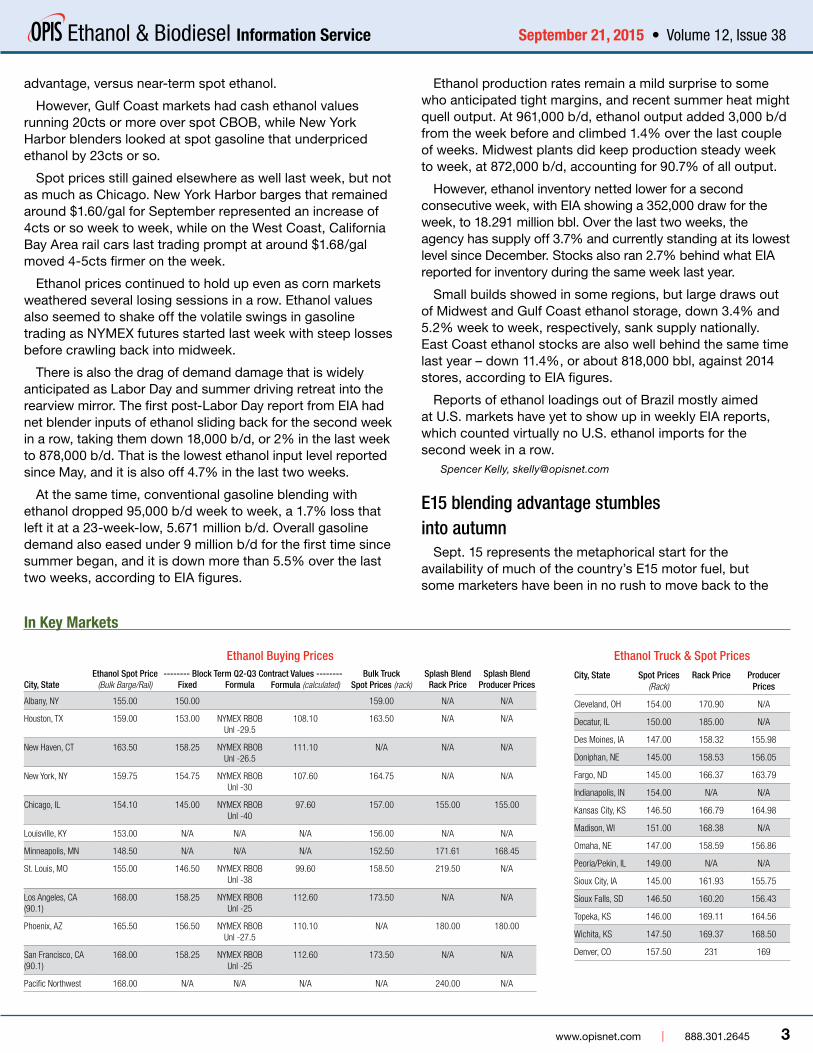
Ethanol Buying PricesEthanol Spot Price -------- Block Term Q2-Q3 Contract Values -------- Bulk Truck Splash Blend Splash Blend
City, State (Bulk Barge/Rail) Fixed Formula Formula (calculated) Spot Prices (rack) Rack Price Producer Prices
Albany, NY 155.00 150.00 159.00 N/A N/A
Houston, TX 159.00 153.00 NYMEX RBOB Unl -29.5
108.10 163.50 N/A N/A
New Haven, CT 163.50 158.25 NYMEX RBOB Unl -26.5
111.10 N/A N/A N/A
New York, NY 159.75 154.75 NYMEX RBOB Unl -30
107.60 164.75 N/A N/A
Chicago, IL 154.10 145.00 NYMEX RBOB Unl -40
97.60 157.00 155.00 155.00
Louisville, KY 153.00 N/A N/A N/A 156.00 N/A N/A
Minneapolis, MN 148.50 N/A N/A N/A 152.50 171.61 168.45
St. Louis, MO 155.00 146.50 NYMEX RBOB Unl -38
99.60 158.50 219.50 N/A
Los Angeles, CA (90.1)
168.00 158.25 NYMEX RBOB Unl -25
112.60 173.50 N/A N/A
Phoenix, AZ 165.50 156.50 NYMEX RBOB Unl -27.5
110.10 N/A 180.00 180.00
San Francisco, CA (90.1)
168.00 158.25 NYMEX RBOB Unl -25
112.60 173.50 N/A N/A
Pacific Northwest 168.00 N/A N/A N/A N/A 240.00 N/A
Ethanol Truck & Spot PricesCity, State Spot Prices
(Rack)Rack Price Producer
Prices
Cleveland, OH 154.00 170.90 N/A
Decatur, IL 150.00 185.00 N/A
Des Moines, IA 147.00 158.32 155.98
Doniphan, NE 145.00 158.53 156.05
Fargo, ND 145.00 166.37 163.79
Indianapolis, IN 154.00 N/A N/A
Kansas City, KS 146.50 166.79 164.98
Madison, WI 151.00 168.38 N/A
Omaha, NE 147.00 158.59 156.86
Peoria/Pekin, IL 149.00 N/A N/A
Sioux City, IA 145.00 161.93 155.75
Sioux Falls, SD 146.50 160.20 156.43
Topeka, KS 146.00 169.11 164.56
Wichita, KS 147.50 169.37 168.50
Denver, CO 157.50 231 169
In Key Markets

www.opisnet.com | 888.301.2645
Ethanol & Biodiesel Information Service
4
September 21, 2015 • Volume 12, Issue 38
blend that can only be legally sold in many states when RVP restrictions have eased.
A sharp decline in D6 RINs, together with stubbornly high prices of ethanol relative to gasoline, removed much of the advantage that E15 held last spring, ahead of the low-RVP season.
Chicago marketers in late April, for example, paid about $1.80/gal for conventional blendstock, or CBOB, but they were able to procure ethanol for about $1.60/gal. Blending 85% CBOB and 15% ethanol at the time yielded a linear cost of $1.77/gal, or about a penny below E10.
However, the spring magic for these formulae came by way of high RINs values.
Renewable Identification Numbers for ethanol were pegged around 75cts at the time, and thanks to the generation of those RINs, the bottom line price for E15 could be reduced by an additional 11.25cts/gal, to $1.6575/gal. That worked out to a wholesale price advantage of nearly a nickel for retailers intrepid enough to offer E15 to their customers.
Economics are still favorable for E15 in Midwestern markets close to ethanol plants, but the edge is minimal, and advantages disappear as one moves away from ethanol hubs.
For example, recent values for Chicago CBOB were around $1.56/gal, with ethanol valued at $1.52/gal. The 85%/15% linear blend yielded a value of $1.554/gal, or just a fraction below the E10 value of $1.556/gal. And with D6 ethanol RINs now pegged at about 30cts, the difference between the net cost of E10 and E15 was less than 1.75cts/gal ($1.509/gal for E15 blend and $1.526/gal for E10).
What’s worrisome for pro-E15 marketers is the forward market. Trading in the fourth quarter of 2015 is fairly thin, but buyers say they can purchase Chicago CBOB for about $1.20/gal late this year, versus values of $1.47/gal for ethanol.
If RINs stay around 30cts, the calculus results in less than 0.25cts/gal difference in the net rack prices for both products. If RINs were to drop a few more pennies, the E10 price could actually fall below the cost of the E15.
With the summer ozone season recently coming to an end, more stations in more places will have the option to offer E15 blends. The period under which E15 cannot be sold to non-flexible fuel vehicles in some parts of the country is from June 1 to Sept. 15. The restriction is in place because E15 blends do not receive the same 1-psi Reid Vapor Pressure volatility waiver that is granted to E10.
In addition, the latest on D6 RIN prices had values for the 2015 vintage apparently edging back up from sub-30cts/RIN lows traded earlier last week. Trading prices recovered to 32.25cts/RIN at the latest look, with offers backing up to 33cts/RIN. That still left current-year D6 RINs trading about 18% cheaper than they did a month ago.
Some cargo importers moved into the market, sources
noted, procuring RINs necessary to fulfill obligations as more gasoline moves onshore from foreign refineries. Attribution to importer needs may be off-target, since New York gasoline markets appear balanced and not facing great selling pressure on any of the autumn fuel grades.
Tom Kloza, [email protected]
Georgia Terminal Operator Eyes Ethanol StorageEpic Midstream, a Houston-based owner of fuel storage
terminals, is interested in building a railroad spur on property it owns near Macon, Ga., and installing ethanol tankage at its current Macon facility, Epic Midstream CEO David Vattimo told OPIS recently.
Epic Midstream proposed the project about six months ago, and it needs partial rezoning of one of two property parcels it owns. But unexpected community opposition has led to delays in votes by the Macon-Bibb County Planning & Zoning Commission – most recently on Sept. 14, when Epic Midstream asked to defer consideration until the Zoning Commission’s next meeting, on Oct. 12.
“We’re disappointed by the opposition and the delays,” Vattimo told OPIS. “We want to construct a loop track unit train facility for a customer.”
The track would connect with Norfolk Southern’s rail line, from which ethanol could be pumped from tank cars and stored at Epic Midstream’s Macon tank farm. It would not be Epic Midstream’s first experience with biofuels.
At Macon, Epic Midstream has 14 tanks, which store and distribute jet fuel and jet fuel additives, #2 fuel oil, ULSD, transmix and biodiesel. In 2014, Epic Midstream customer U.S. Oil began providing biodiesel at Epic’s Macon, Bremen, Ga., and Montgomery, Ala., facilities. Epic Midstream also stores ethanol for customers at a few terminals.
Vattimo said he believes the opposition to the storage and rail facility stems from a pipeline spill in the 1980s incurred by a previous owner.
“Remediation had to be done. There are about 15 houses across the street from our proposed project, and it’s a sensitive issue, even though we were not the owner or involved in the spill or the cleanup,” he said.
Epic Midstream has four pipeline service terminals in Georgia and Alabama, a marine service terminal in Savannah, Ga., and a pipeline terminal in Alamogordo, N.M. In total, its 77 tanks have more than 2 million bbl of shell capacity.
Kevin Adler, [email protected]
EPA: Biofuel output eases in AugustBiodiesel production in the U.S. took a breather for the first
time in six months, according to monthly tracking numbers reported by the U.S. EPA that also showed corn ethanol in August slipping back for the second straight month.

www.opisnet.com | 888.301.2645
Ethanol & Biodiesel Information Service
5
September 21, 2015 • Volume 12, Issue 38
Biomass-based diesel production at nearly 185.02 million gal during August retreated 3.98% from July, down almost 7.67 million gal, according to data accumulated and recently released from EPA’s Moderated Transaction System (EMTS). The system tracks Renewable Identification Number (RIN) credit generation for compliance under the federal
Renewable Fuels Standard, and the latest figures halted a string of month-to-month increases for domestic biodiesel production that stretched back to March.
Most of the figure that comes from EPA’s D4 biomass-based diesel credits represents traditional biodiesel production, about 156 million gal last month, which is some
Ethanol Spot Ethanol Rack w/ RIN Ethanol Blended Rack Gasoline (10%) E-85 Racks E-85 Retail (w/ tax)
153.775 176.546 163.128 160.829 211.188
B100 w/ RIN B20 w/ ULSD B15 w/ ULSD B10 w/ ULSD B5 w/ ULSD B2 w/ ULSD
336.935 175.356 166.080 --.-- 165.455 162.764
National Renewable Fuels Averages
Key Renewable Fuels Regional Averages
NortheastEthanol Spot Ethanol Rack w/ RIN Ethanol Blended Rack Gasoline (10%) E-85 Racks E-85 Retail (w/ tax)
159.750 --.-- 151.080 177.100 217.914
B100 w/ RIN B20 w/ ULSD B15 w/ ULSD B10 w/ ULSD B5 w/ ULSD B2 w/ ULSD
316.500 173.460 194.000 --.-- 160.203 161.631
SoutheastEthanol Spot Ethanol Rack w/ RIN Ethanol Blended Rack Gasoline (10%) E-85 Racks E-85 Retail (w/ tax)
159.750 174.000 148.551 162.085 225.023
B100 w/ RIN B20 w/ ULSD B15 w/ ULSD B10 w/ ULSD B5 w/ ULSD B2 w/ ULSD
287.500 155.319 180.190 --.-- 154.042 153.176
Gulf CoastEthanol Spot Ethanol Rack w/ RIN Ethanol Blended Rack Gasoline (10%) E-85 Racks E-85 Retail (w/ tax)
159.000 188.951 155.016 158.369 197.842
B100 w/ RIN B20 w/ ULSD B15 w/ ULSD B10 w/ ULSD B5 w/ ULSD B2 w/ ULSD
299.431 154.393 148.559 --.-- 156.210 157.380
MidwestEthanol Spot Ethanol Rack w/ RIN Ethanol Blended Rack Gasoline (10%) E-85 Racks E-85 Retail (w/ tax)
148.175 170.585 173.127 168.063 194.837
B100 w/ RIN B20 w/ ULSD B15 w/ ULSD B10 w/ ULSD B5 w/ ULSD B2 w/ ULSD
309.139 177.124 184.010 --.-- 166.909 166.795
RockiesEthanol Spot Ethanol Rack w/ RIN Ethanol Blended Rack Gasoline (10%) E-85 Racks E-85 Retail (w/ tax)
159.000 175.688 181.608 160.000 206.400
B100 w/ RIN B20 w/ ULSD B15 w/ ULSD B10 w/ ULSD B5 w/ ULSD B2 w/ ULSD
--.-- 169.075 159.500 --.-- 165.675 162.180
West CoastEthanol Spot Ethanol Rack w/ RIN Ethanol Blended Rack Gasoline (10%) E-85 Racks E-85 Retail (w/ tax)
167.375 180.000 173.311 184.577 303.983
B100 w/ RIN B20 w/ ULSD B15 w/ ULSD B10 w/ ULSD B5 w/ ULSD B2 w/ ULSD
426.300 204.030 150.750 --.-- 191.489 174.950

www.opisnet.com | 888.301.2645
Ethanol & Biodiesel Information Service
6
September 21, 2015 • Volume 12, Issue 38
6% off of July estimates, but a smaller portion also comes from renewable diesel output. For August, renewable diesel represented about 15.7% of the D4 total, or 29 million gal, according to estimates from the National Biodiesel Board. That’s actually 9.4% ahead of where it was estimated for July.
Compared to EPA figures from the same month last year, biomass-based diesel production for August is up 27.5% versus the 2014 month.
The August EPA figures come on the heels of other government estimates pointing to more biodiesel production this year, and next year, as well. The latest monthly forecast for biodiesel production from soy indicated the agency boosted its outlook for the 2015-2016 crop marketing year by almost 2%, the first adjustment in its data yet this year.
In addition, EIA forecasters recently said they now expect U.S. biodiesel plants to average 92,000 b/d this year, which would be 13.6% more than they collectively averaged last year.
Meantime, the number for D6 grain-based RIN generation over August indicated ethanol output at nearly 1.237 billion gal, and that is down 1.79% from July and the second slip in a row suggested by EPA’s monthly data. A year ago, EPA also showed ethanol output sliding back in August, so the year-on-year comparison still has 2015 running 2.74% ahead.
The rise of cellulosic biofuel under EPA accounting continued for the fifth month in a row, with August D3 RIN numbers suggesting nearly 13.777 million gal, for a 5.98% climb from July and a 10.3% gain over the last two months. August output D3-linked cellulosic biofuel is nearly four times what it was the same time last year, when the biofuel first came on the scene in a significant way after EPA expanded the definition of cellulosic biofuel for D3 RIN generation to include products such as renewable clean natural gas and renewable liquefied natural gas.
The volume of fuel linked to D5 advanced biofuel RINs also climbed month to month, shooting up almost 238% from July to more than 14.339 million gal. The year-on-year gain was almost as gaudy for the D5 category, according to EPA.
Meantime, the output of cellulosic diesel under EPA’s D7 RIN code did make a showing – lightly – for only the second time this year and after a couple months of virtually nothing showing on the EPA ledger. The 53,303 gal in August are well over the 5,532 gal reported a year ago.
In total, the categories of RIN-producing fuels output indicated a total of nearly 1.45 billion gal during August, and that is 1.25% behind the July total, but would also indicate 6.87% more than the agency reported for the same time last year.
Spencer Kelly, [email protected]
Stock Market Movers:
Company profile: Dyadic International With Pacific Ethanol’s completed merger with Aventine
Renewable Energy Holdings on July 1, OPIS removed Aventine from the weekly stock chart and replaced Aventine with Dyadic International Inc.
Located in Jupiter, Fla., Dyadic is a global biotechnology company with a focus on developing, manufacturing and selling enzymes and other proteins for use in the bioenergy, biochemical, industrial enzymes an biopharmaceutical industries.
According to the company’s latest financial results from the second quarter, “[o]ur current product offering, the CMAX product line, along with the C1-based enzymes developed by our licensee Abengoa, are recognized for their excellent performance characteristics at converting natural fibers (biomass) such as corn stover, and wheat straw into fermentable sugars and through our continued research efforts we expect to continue developing even better performing CMAX enzymes at lower manufacturing costs.”
Company Symbol 9/17/15 9/10/15 change % change
Abengoa ABGB ò 5.80 5.96 -$0.16 -2.68%
Aemetis AMTX ñ 3.70 3.09 $0.61 19.74%
Amyris AMRS ñ 1.79 1.76 $0.03 1.70%
Andersons ANDE ñ 35.54 34.75 $0.79 2.27%
Archer Daniels Midland ADM ñ 44.19 43.06 $1.13 2.62%
BIOX Corporation BX.TO ñ 1.14 0.95 $0.19 20.00%
Bluefire Ethanol Fuels BFRE ñ 0.01 0.00 $0.01 138.10%
Bunge BG ñ 71.67 70.20 $1.47 2.09%
Cosan CZZ ñ 3.46 3.29 $0.17 5.17%
Codexis CDXS ñ 3.78 3.50 $0.28 8.00%
Dyadic International DYAI ñ 0.95 0.90 $0.05 5.56%
FutureFuel Corp. FF ñ 10.23 10.20 0.03 0.29%
GEVO GEVO ñ 2.23 2.22 $0.01 0.45%
Green Earth Technologies GETG ó 0.02 0.02 $0.00 0.00%
Green Plains GPRE ñ 21.26 20.60 $0.66 3.20%
GreenHunter Resources GRH ò 0.48 0.53 -$0.05 -9.43%
Novozymes NVZMY ò 43.83 44.81 -$0.98 -2.19%
Pacific Ethanol PEIX ò 7.01 7.19 -$0.18 -2.50%
Renewable Energy Group REGI ò 8.05 8.45 -$0.40 -4.73%
REX American Resources REX ñ 52.61 50.65 $1.96 3.87%
Solazyme SZYM ñ 3.06 2.88 $0.18 6.25%
Valero Energy VLO ò 60.30 62.91 -$2.61 -4.15%
DJIA DJI ñ 16,739.95 16,330.40 $409.55 2.51%
Weekly Biofuels Stock Performance
www.opisnet.com | 888.301.2645
Ethanol & Biodiesel Information Service
7
September 21, 2015 • Volume 12, Issue 38
In October, Dyadic announced the receipt of a $500,000 licensing payment from Abengoa Bioenergy for commercial scale production of Abengoa’s proprietary cellulose enzymes, developed under Abengoa’s license agreement with Dyadic.
Abengoa began operating a 25 million gal/yr advanced biofuels plant in Hurgoton, Kan., that generated the licensing payment. Dyadic reported in its financial earnings review that the operation at the facility has been delayed. The company expects to receive royalties from the facility, but not in the remainder of 2015.
Dyadic sells more than 55 liquid and dry enzyme products to over 150 industry customers in approximately 50 countries.
At market close on Sept. 17, Dyadic stock was 95cts/share, up a nickel compared to closing at 90cts/share on Sept. 10.
On Dec. 31, 2014, Pacific Ethanol announced that it planned to acquire Aventine Renewable Energy and its several Midwestern ethanol plants for about $190 million in stock. The proposed merger was approved by both companies’ shareholders on June 11.
As of the July 1 acquisition, Pacific Ethanol owns and operates eight ethanol production facilities that have a combined annual production capacity of 515 million gal.
Molly M. White, [email protected]
Inside Washington:
EPA administrator: RFS targets have to ‘pass muster’ in likely court battle
Washington, D.C. – EPA is committed to growing the U.S. biofuels industry, but will do so in a way that is legally defensible in court, EPA Administrator Gina McCarthy told attendees here last week at Growth Energy’s sixth annual Advocacy Conference.
As part of EPA’s 2014-2016 Renewable Fuel Standard (RFS2) proposal, issued on May 29, the agency aims to scale back conventional biofuel targets to account for concern surrounding the ethanol blend wall while calling for a greater amount of second-generation biofuels.
The agency is expected to finalize the RFS targets by Nov. 30, and it is widely expected that the rule will end up in litigation.
“The biofuel industry is the great American success story,” said McCarthy in her remarks, noting that the U.S. is the largest producer and consumer of biofuels in the world. “The EPA proposal has to continue to build on that success and spur on ambitious, yet achievable growth,” she said. “We are working hard to make sure we are moving towards the [RFS] levels intended” by Congress, she added.
After her prepared remarks, one audience member asked McCarthy to rationalize why the EPA proposed to lower the
RFS targets, specifically focusing on the conventional biofuel carve out, when the industry is producing above capacity.
“Can I be blunt? We have been using the cellulosic waiver [authority] for a while,” McCarthy responded. “Cellulosic just didn’t progress, I think, at the rate that Congress thought it would,” she said, noting that the RFS targets also had to account for the ebbs and flows of how much gasoline was being produced.
“There have been various attempts by EPA when we go to court [on the RFS] to try to bring some larger picture policy issues to the table when we make our decisions that have fallen very flat on the courts,” she said. The RFS “wasn’t a rule that had congressional history attached to it, so the only thing we had to look at was the four corners of the language in the statute,” she added.
The RFS “is a very difficult statute for us to get our head around when you have as big a leap in production as Congress intended,” McCarthy continued. “I am readily saying my job is to reach those levels. First, there’s no reason why I wouldn’t want to, but secondly, it is my job to. The question I have is, how do I do this in a way that the courts will actually see the same as I do, as being a reasonable interpretation of that law.”
“We have had lots of back and forths of what it means or doesn’t mean,” McCarthy continued. “We’re still in the position of looking at the [RFS proposal] comments and understanding where we missed the boat.... My job is not just to respond to what Congress says, but to respond to changes in the world,” she said. “I have to ... [issue RFS targets] in a way I think will pass muster because the last thing I want is to give you what you want and we fall flat when we get to the courts. Zero win.”
Advanced biofuel groups urge Obama to finalize strong RFS
Nearly dozen advanced biofuel executives are urging President Obama to help reverse the proposed cuts in the Renewable Fuel Standard (RFS2), warning that otherwise, their companies will “be forced to look overseas where renewable fuel policies are more stable.”
“...[O]ur industry is ... dealing with the reality that on May 29, your administration re-proposed to insert a loophole into the RFS ... that would allow oil companies to avoid their obligations under the law,” wrote the advanced biofuel executives in a letter sent last week to Obama. “As you know, the point of the RFS was to require oil companies to buy and sell an increasing amount of renewable fuel to address the fact that the oil industry would otherwise use its market position to cut off market access for competitors and thereby smother investment in cellulosic ethanol and advanced biofuels that have the lowest carbon footprint in the world.
www.opisnet.com | 888.301.2645
Ethanol & Biodiesel Information Service
8
September 21, 2015 • Volume 12, Issue 38
And yet, for the first time in RFS history, EPA is proposing to change the rules in the middle of the game to allow challenges related to the ‘distribution’ of renewable fuel by oil companies ... to be cause for waiving the RFS on a year-to-year basis. Such a provision would gut the core concept behind the law.”
“EPA’s decision to change its waiver methodology, under pressure from the oil industry, upends the system and sends the market signal that the RFS volumes can be lowered if the oil industry simply drags its heels. The point of the RFS was to reward those who made the investments necessary to use more renewable fuel. Parts of the oil industry refused to do so starting in 2013, and now they’re being rewarded. No market-based system can survive if regulators are willing to overhaul the system to reward intransigence among obligated parties,” the letter continued.
“Mr. President, the ramifications of your decision on this issue are substantial for America’s largest renewable energy sector. If the final rule includes distribution waivers, the global market signal will be that your administration is backing away from its support of the most transformative U.S. energy and climate policy on the books today; and one that is widely regarded to be the best cellulosic and advanced biofuels policy in the world. While our companies will not fail to deploy advanced biofuels, we will continue to be forced to look overseas where renewable fuel policies are more stable,” the letter noted.
Rachel Gantz, [email protected]
In Key Commodity Markets:
In finished markets...The broader petroleum markets reached something of a
pause over the last week as most bulk gasoline markets in the U.S. transitioned to fall-season fuel, bouncing off the lowest numbers that transition helped to generate.
During the early part of the last week, Gulf Coast spot gasoline dropped near the $1.18/gal, before stabilizing and firming back up in the latter part of the week. Gulf Coast spot CBOB by Thursday fetched $1.3185/gal outright, on trading 5.75cts under the Merc, and that is 3.64cts more than week-ago deals. Also, the differential tightened considerably – the cash discount being half what it was a week ago.
Some Gulf Coast refinery issues also helped bolster spot values in the region.
Other than the Gulf Coast, West Coast differentials stood. With the CARBOB market in L.A. currently in a contango state, the September market was catching up to October, and that helped lift the prompt month to a 29cts premium versus the futures market in both L.A. and San Francisco. The October market is holding some strength over September as refinery turnarounds and import levels are expected to drop next month.
Chicago gasoline actually soared for a time because of growing concerns over the adequacy of prompt supply in the region.
Market sources reported early last week that BP shut down the largest of two coker units at its 160,000-b/d refinery in Toledo, Ohio, operated as a joint venture with Husky Energy. News of the shutdown, as well as expectations for weaker
Key Supply and Demand Statistics
Ethanol SupplyEthanol Current Last Week 3-Yr Avg
PADD 1 Inventories 6,343 6,325 6,440
PADD 2 Inventories 5,901 6,107 5,672
PADD 3 Inventories 3,362 3,546 3,052
PADD 4 Inventories 333 321 328
PADD 5 Inventories 2,352 2,344 2,266
Total Inventories 18,291 18,643 17,758
Gasoline Production Gasoline Current Last Week 3-Yr Avg
PADD 1 2,959 3,139 2,873
PADD 2 2,572 2,648 2,289
PADD 3 2,249 2,059 1,956
PADD 4 321 308 311
PADD 5 1,607 1,678 1,574
Total Production 9,708 9,832 9,004
Ethanol Production Ethanol Current Prev Mo 3-Yr Avg
PADD 1 753 744 687
PADD 2 27,166 27,186 25,169
PADD 3 749 669 576
PADD 4 433 472 436
PADD 5 583 595 495
Total Production 29,684 29,666 27,364
Gasoline Supply Gasoline Current Last Week 3-Yr Avg
PADD 1 Inventories 60,800 57,400 52,833
PADD 2 Inventories 48,000 49,100 48,000
PADD 3 Inventories 73,600 73,900 72,600
PADD 4 Inventories 6,800 6,800 6,733
PADD 5 Inventories 28,300 27,400 27,533
Total Inventories 217,500 214,600 207,700

www.opisnet.com | 888.301.2645
Ethanol & Biodiesel Information Service
9
September 21, 2015 • Volume 12, Issue 38
production during the upcoming turnaround season, helped send Chicago spot trading levels skyward earlier in the week. Spot CBOB trading 17.5cts over the Merc by Thursday more than tripled the week-ago premium, and outright values at $1.551/gal climbed 10.74cts in the week-to-week comparison.
In fact, Chicago RBOB jumped to the most expensive spot gasoline barrel in the country, running over $1.79/gal outright on premiums that topped 41cts against the Merc. Outright Chicago RBOB values climbed 14.74cts week to week.
It is notable that the shift in gasoline RVP from low summer levels to higher winter levels in the New York Harbor helped pull prices lower and moved spot RBOB to a slight discount versus the futures market for prompt barrels.
The broader market, however, is likely to look to the Federal Reserve for some direction, with the Fed’s recent decision to leave interest rates unchanged not constituting a surprise to the market, but also removing key uncertainty. The direction of the market was not necessarily obvious after the announcement, but volumes did perk up. The decision to hold interest rates flat stems largely from concerns about recent global and financial developments, with China being a major concern.
The thinking is that the U.S. dollar should at least get some short-term pressure and so keep oil markets somewhat stable. NYMEX crude for front-month October eased 25cts Thursday and at $46.90/bbl picked up only 98cts week to week. Refinery maintenance season is an issue for crude, but it could also help stabilize gasoline prices.
The Merc’s RBOB for October also eased Thursday, down 61pts, and at a $1.3760/gal settled price still ran 1.76cts lower against the week-ago settle. The modest downturn came after gasoline prices on the Merc popped nearly a nickel higher in the wake of the weekly supply report from EIA.
The government reported U.S. gasoline inventories added 2.8 million bbl for the week ending Sept. 11, hitting 217.4 million bbl – around 7 million bbl higher than stocks at about
the same week last year. That stock build, largely driven by inventory additions in the East and West coasts, also came with demand indications that not unexpectedly dropped for the second consecutive week.
While overall gasoline demand implied by weekly EIA numbers slipped only 0.38% week-to-week, a downturn of 34,000 b/d, it also followed up a big loss the previous week that together amounted to 5.5% in demand erosion, which took average offtake under 9 million b/d for the first time in 14 weeks.
If these wholesale prices continue to firm, things will change on the street, but average U.S. retail gasoline is on the cusp of falling below $2.30/gal, according to GasBuddy.com, with three states in the Southeast currently having average retail prices below $2/gal, and there are a couple more knocking on the door.
In natural gas...Autumn is in the offing, and that will bring the so-called
“shoulder season” of lower demand for natural gas before winter heating needs start to kick in. Gas markets outside the Northeast looked heavy through last week, and an as-expected weekly stock build did not do much to change the basic trajectory of the market.
Henry Hub spot gas traded flat day-to-day to run $2.68/mmbtu Thursday, which led to a loss of 3cts over the last week. Chicago Citygate gas also looked flat over the last couple of days, eventually losing a penny Thursday, and at $2.69/mmbtu that had spot prices off 2cts week to week in that market. Northeast gas was sometimes much more volatile and mixed over the last week, but it was a response to the immediate demands of weather, and by Thursday a lot of the trading came before the EIA storage report.
No surprises from EIA had October natural gas ending off less than a penny Thursday, after picking up some value ahead of the report. October NYMEX contracts settled down 80pts for the Thursday session, at $2.652/mmbtu, and that
Note: OPIS Refined Spots and Ethanol averages are based on full-day prompt assessments for each market.
New York Chicago Los Angeles
Ethanol vs. Spot Unleaded and “BOBs” in Key Markets

www.opisnet.com | 888.301.2645
Ethanol & Biodiesel Information Service
10
September 21, 2015 • Volume 12, Issue 38
was 6.8cts down week to week. Paper prices did recover from their largest drop in the wake of a EIA report that showed natural gas stockpiles adding 73 bcf over the week before to put inventory 16% ahead of the same time last year and 4% over the five-year average.
Meantime, in a midweek report, EIA noted that the average cost of gas going into storage since April is much less than over the same period last year. “The estimated average unit value of the natural gas put into storage from April 3 to September 11 this year is $2.76/mmbtu, 36% lower than the average value of $4.33/mmbtu for the same 24 weeks last year.”
EIA also noted an easing in production week to week, down 0.8% to average 71.9 bcf/day, but that is still 2.9% higher than the same week last year. Supply was indicated 1.4% lower week to week, added EIA, but consumption also dropped. “U.S. consumption decreased by 5% overall,” said EIA, adding that the downturn included a 15% drop in gas used for power generation during the week.
The NYMEX six-month futures contract strip averaged nearly $2.8677/mmbtu at Thursday’s settle, nosing up more than 3.28cts week to week and adding a bit to its premium over Henry Hub cash values at neared 18.77cts at the time.
In corn markets...Corn markets retreated from their post-USDA-forecast rally
that they mounted a week ago. Front-month December corn dropped 6.25cts on the CBOT futures board Thursday, but the $3.7975/bu settle still ran 5.5cts more than the contract did a week ago.
CBOT corn for March also shed 6.25cts Thursday to settle at $3.91/bu, and that is also 5.5cts more than a week ago.
At the start of the week, the USDA reported that corn conditions were actually a bit better than some might have expected, given that some market sources expected a bit of erosion in the estimates. Instead the agency reported 68% of the crop in good-to-excellent condition, just as it has for three weeks running now. A year ago, the agency rated 74% of the crop in either good or excellent shape.
USDA also reported that 35% of the crop is considered mature by Sept. 13, and that is up from 20% the week before and 25% last year, though it still trails the 40% five-year average.
Global demand for U.S. corn appeared to disappoint later in the week. Corn exports sales and shipments are sagging below the pace needed to meet USDA export expectations for the current marketing year. Shipments for corn through the first couple of weeks of the marketing year that began with September are down 24% compared with the same time last year.
Weather in the Corn Belt has also been mostly supportive for the crop as harvest gets underway. By the end of the previous week, the harvest was only 5% complete, with places such as Texas and North Carolina the most advanced at this point, and that is behind the 9% five-year average for this time of year, but ahead of 4% reported a year ago.
Corn, and other commodity moves, were said to be cautious and restrained lately as players mulled the latest decision by the Federal Reserve to leave U.S. interest rates unchanged.
As the harvest starts to gear up, more pressure is expected to come to spot corn markets. Kansas City No. yellow truck cash corn ran $3.5975-$3.6275/bu. At the same time, Chicago No. 2 yellow corn talks ran at $3.6175-$3.9275/bu.
Biodiesel Gross Margins for Midwestern Plants ($/gal) Ethanol Gross Margins for Midwestern Plants ($/gal)
*Biodiesel production margin calculated from cash feedstock costs and sales values for soy methyl ester biodiesel plants and are estimates of industry trends under current market
conditions. Profits for any given biodiesel plant could be higher or lower.
*Dry Milling margin calculated from cash feedstock and product sales values for wet and dry-mill plants and are an estimate of the industry trend under current market conditions.
Profits for any given ethanol plant could be higher or lower.
Plant Profitability
www.opisnet.com | 888.301.2645
Ethanol & Biodiesel Information Service
11
September 21, 2015 • Volume 12, Issue 38
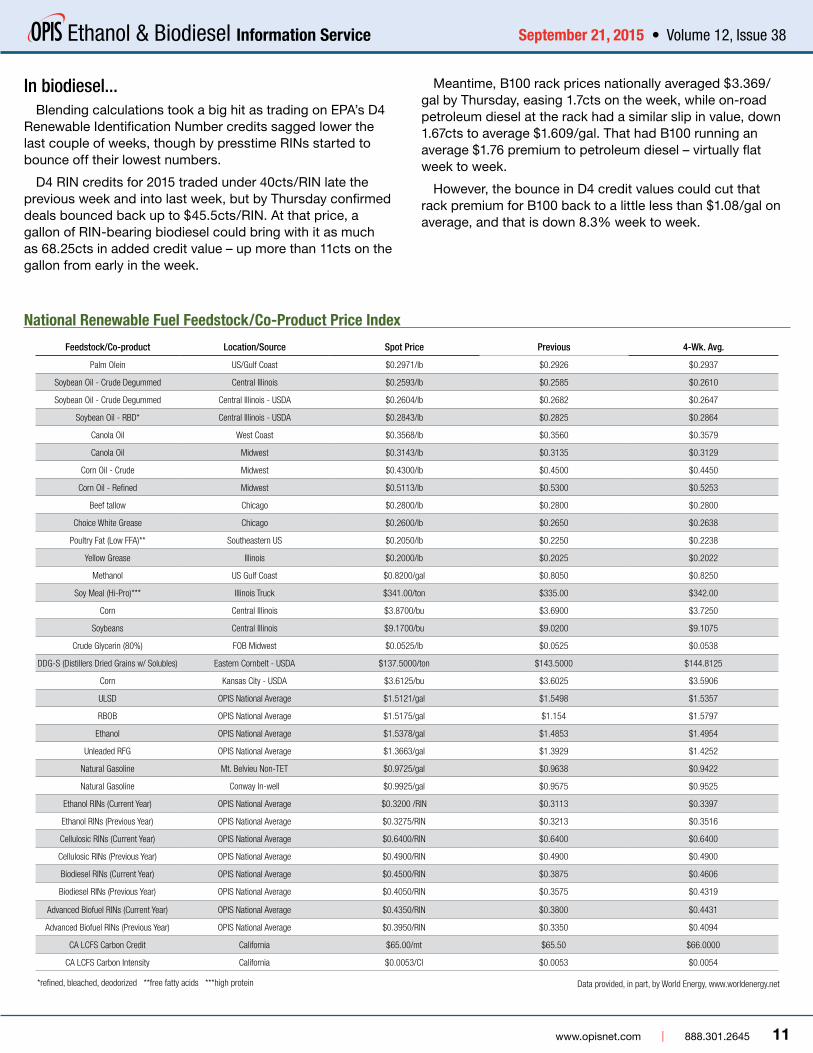
National Renewable Fuel Feedstock/Co-Product Price Index
Feedstock/Co-product Location/Source Spot Price Previous 4-Wk. Avg.
Palm Olein US/Gulf Coast $0.2971/lb $0.2926 $0.2937
Soybean Oil - Crude Degummed Central Illinois $0.2593/lb $0.2585 $0.2610
Soybean Oil - Crude Degummed Central Illinois - USDA $0.2604/lb $0.2682 $0.2647
Soybean Oil - RBD* Central Illinois - USDA $0.2843/lb $0.2825 $0.2864
Canola Oil West Coast $0.3568/lb $0.3560 $0.3579
Canola Oil Midwest $0.3143/lb $0.3135 $0.3129
Corn Oil - Crude Midwest $0.4300/lb $0.4500 $0.4450
Corn Oil - Refined Midwest $0.5113/lb $0.5300 $0.5253
Beef tallow Chicago $0.2800/lb $0.2800 $0.2800
Choice White Grease Chicago $0.2600/lb $0.2650 $0.2638
Poultry Fat (Low FFA)** Southeastern US $0.2050/lb $0.2250 $0.2238
Yellow Grease Illinois $0.2000/lb $0.2025 $0.2022
Methanol US Gulf Coast $0.8200/gal $0.8050 $0.8250
Soy Meal (Hi-Pro)*** Illinois Truck $341.00/ton $335.00 $342.00
Corn Central Illinois $3.8700/bu $3.6900 $3.7250
Soybeans Central Illinois $9.1700/bu $9.0200 $9.1075
Crude Glycerin (80%) FOB Midwest $0.0525/lb $0.0525 $0.0538
DDG-S (Distillers Dried Grains w/ Solubles) Eastern Cornbelt - USDA $137.5000/ton $143.5000 $144.8125
Corn Kansas City - USDA $3.6125/bu $3.6025 $3.5906
ULSD OPIS National Average $1.5121/gal $1.5498 $1.5357
RBOB OPIS National Average $1.5175/gal $1.154 $1.5797
Ethanol OPIS National Average $1.5378/gal $1.4853 $1.4954
Unleaded RFG OPIS National Average $1.3663/gal $1.3929 $1.4252
Natural Gasoline Mt. Belvieu Non-TET $0.9725/gal $0.9638 $0.9422
Natural Gasoline Conway In-well $0.9925/gal $0.9575 $0.9525
Ethanol RINs (Current Year) OPIS National Average $0.3200 /RIN $0.3113 $0.3397
Ethanol RINs (Previous Year) OPIS National Average $0.3275/RIN $0.3213 $0.3516
Cellulosic RINs (Current Year) OPIS National Average $0.6400/RIN $0.6400 $0.6400
Cellulosic RINs (Previous Year) OPIS National Average $0.4900/RIN $0.4900 $0.4900
Biodiesel RINs (Current Year) OPIS National Average $0.4500/RIN $0.3875 $0.4606
Biodiesel RINs (Previous Year) OPIS National Average $0.4050/RIN $0.3575 $0.4319
Advanced Biofuel RINs (Current Year) OPIS National Average $0.4350/RIN $0.3800 $0.4431
Advanced Biofuel RINs (Previous Year) OPIS National Average $0.3950/RIN $0.3350 $0.4094
CA LCFS Carbon Credit California $65.00/mt $65.50 $66.0000
CA LCFS Carbon Intensity California $0.0053/CI $0.0053 $0.0054
*refined, bleached, deodorized **free fatty acids ***high protein Data provided, in part, by World Energy, www.worldenergy.net
In biodiesel...Blending calculations took a big hit as trading on EPA’s D4
Renewable Identification Number credits sagged lower the last couple of weeks, though by presstime RINs started to bounce off their lowest numbers.
D4 RIN credits for 2015 traded under 40cts/RIN late the previous week and into last week, but by Thursday confirmed deals bounced back up to $45.5cts/RIN. At that price, a gallon of RIN-bearing biodiesel could bring with it as much as 68.25cts in added credit value – up more than 11cts on the gallon from early in the week.
Meantime, B100 rack prices nationally averaged $3.369/gal by Thursday, easing 1.7cts on the week, while on-road petroleum diesel at the rack had a similar slip in value, down 1.67cts to average $1.609/gal. That had B100 running an average $1.76 premium to petroleum diesel – virtually flat week to week.
However, the bounce in D4 credit values could cut that rack premium for B100 back to a little less than $1.08/gal on average, and that is down 8.3% week to week.

www.opisnet.com | 888.301.2645
Ethanol & Biodiesel Information Service
12
September 21, 2015 • Volume 12, Issue 38
In DDGs...The market for dried distiller grains did not change much,
with prompt demand said to be holding flat and prices mixed on the margins. Concern over demand for exports did show up on the radar screen late in the week, however.
In Iowa, FOB values for DDGs ran $120-$130/ton, and that was flat to $12 lower from a week ago. Prices in Minnesota ranged from $120 to $140 had the cheapest quotes, dropping $5 on the week. Eastern Corn Belt DDGs prices from $125-$150 remained flat.
Nebraska DDGs range widened rapidly last week, moving from $10 lower to $4 higher week to week, expanding the price range to $120-$149. In Kansas, DDGs talks at $135-$160 remained steady from a week ago.
Delivered DDGs prices to the West Coast tended to run firmer over the last week. California prices running $165-$180 picked up from $5-$7 against the week before, while Pacific Northwest DDGs prices added $5, to $165-$170.
The outlook for exports might not be as healthy as they have for most of the latter part of summer. A report making the rounds late in the week had a China-based broker anticipating 13% drop in China’s imports of DDGs during the current marketing.
In natural gasoline...Mt. Belvieu spot natural gasoline prices climbed since late
August, but have seesawed so far in September, with arbs seen as mostly closed at present. Canadian diluent prices took a hit on Thursday, to potentially back up barrels that might normally flow to Canada from the U.S.
Mt. Belvieu non-TET spot natural gasoline averaged 97.25cts/gal at midweek, with thin trading witnessed into Thursday. Bid-ask level for physical C5 natural gasoline was last seen at 93.25-97cts/gal. At the time, October natural gasoline futures traded at 96cts/gal.
In the news, Kinder Morgan Inc. said this week that it will extend its current binding open season until Dec. 15 to review shipper comments and interest, while continuing to seek commitments for the proposed Utica Marcellus Texas
Pipeline (UMTP) project. The project would transport natural gas liquids and condensate produced from the Utica and Marcellus basins to delivery points along the Texas Gulf Coast, including connectivity to a Kinder Morgan dock located along the Houston Ship Channel.
The open season was originally scheduled to end Sept. 15.
In ultra-low-sulfur diesel...After a three-week hiatus, total distillate production topped
5 million b/d in the latest week’s work of figures from EIA, coming in last week at 5.076 million b/d. Refiners are starting to see the better returns on diesel gallons in most cases, and thus making more diesel based on current spot pricing.
While refiners tilt production toward diesel, inventories of the fuel in the U.S. are already at a multiyear high. Total distillate inventories hit 154 million bbl for the week, the highest since October 2011. The ultra-low-sulfur diesel segment had stocks swelling nearly 2.4 million bbl week to week, and the overall stocks at 132.1 million bbl represent 20.7% more than storage tanks held at the same time last year. Regionally, only the Rockies have ULSD stocks running behind a year ago, and the East Coast is up nearly 40% while the Gulf Coast carries 28.2% more year on year.
Distillate demand as measured by the Energy Information Administration dropped 83,000 b/d, to 3.482 million b/d. The four-week average continues to trail last year, and the most recent measurement stands 2.8% below last year.
Spot market ULSD prices got shaky ahead of the weekend. Gulf Coast ULSD traded $1.4157/gal outright Thursday and fell 7.15cts behind week-ago trading. Chicago ULSD running $1.5497/gal for the day slumped 4.25cts compared with week-ago deals after slipping 42pts on the day.
European Biodiesel Spot Markets
Rotterdam FAME ($/gal) Rotterdam RME/Gasoil ($/gal)

www.opisnet.com | 888.301.2645
Ethanol & Biodiesel Information Service
13
September 21, 2015 • Volume 12, Issue 38
European, Brazilian and CBI Markets:
RME FAME Ethanol T2
Rotterdam $2.93 $2.73 $2.53/€2.22
Prices in U.S. $/gal., 9/17/15 Data provided, in part, by Starsupply Renewables, www.starsupply.ch and SCB & Associates, www.starcb.com
European MarketsOperations at the first Etanolix® technology outside
Finland is going well, said Patrick Pitkänen, head of business development and sales at St1 Biofuels, which developed the technology.
The Etanolix unit has been installed at the North European Bio Tech Oy (NEOT) plant in Gothenburg, Sweden, and NEOT is the operator of the unit. The refinery is processing biowaste and process residue from local bakeries and bread into advanced ethanol.
“Startup has gone like usually in this kind of plants – there are always some hiccups and surprises. Luckily, no major show-stoppers,” Pitkänen told EBIS by email last week.
“When dealing with waste feedstock, there is always a learning period where all parties in the network [need to] form feedstock source separation and logistics systems, and us as processor too have to adjust and adapt to the new system. It just doesn’t happen overnight,” he continued. “We all are learning by doing. In general, our customers and partners have welcomed us, and they have been very positive about the new service we can offer in waste processing.”
The plant has an annual production capacity of 5 million liters (about 1.32 million gal). Pitkänen said that full production could be reached during the first few months of 2016, in accord with the original expectations.
The Gothenburg project is the first in which an ethanol production plant has been integrated at an existing oil refinery to produce waste- and residue-based ethanol on a sustainable basis. It will yield savings in the use of residual heat and synergies in product distribution. It is being operated by refinery staff.
“Thanks to its feedstocks and production technology, the
ethanol produced at the Etanolix plant will be almost carbon-neutral,” Pitkänen noted.
St. 1 Biofuels has installed four other Ethanolix units, but the Gothenburg facility differs from the other installations in a few respects, said Pitkänen:
• Size. It has a capacity four times those processing the same feedstock in Finland.
• Logistics. It has new enhanced feedstock receiving system.
• Integration. There is an integrated dehydration unit to directly produce fuel-grade anhydrous ethanol. In Finland, the dehydration unit is a stand-alone operation.
• Other. “There are also a number of small enhancements based on our operation experience and product development,” Pitkänen added.
NEOT, the owner-operator of the Etanolix unit, delivers fuels to about 1,500 branded service stations – including ABC, St1 and Shell –in Finland, Sweden and Norway.
As a final update, Pitkänen added that installation of the company’s first Cellunolix technology, designed to produce ethanol from sawdust, is going well. Construction at a refinery in Kajaani, Finland, has started, and commissioning is expected in mid-2016.
Market UpdateBiodiesel prices were mixed last week, but palm-oil biodiesel
(PME) took an outsized loss. RME FOB ARA fell $2/metric ton (mt) to a bid-ask range of $865-$885/mt at the Sept. 17 close. SME FOB ARA added $11/mt to a bid-ask range of $828-$848/mt. PME dropped sharply, losing $59/mt to $748-$768/mt. FAME 0 FOB ARA was off $9/mt to $808-828/mt.
Rotterdam gasoil fell by $18/mt, to $468/mt on the week ended Sept. 17.
Prices are supplied by SCB Renewables.Kevin Adler, [email protected]
Brazil and CBI Ethanol Spot
Anhydrous Ethanol FOB Santos vs. NYH, Tampa Spot ($/gal) Anhydrous vs. Hydrous FOB Santos ($/gal)
www.opisnet.com | 888.301.2645
Ethanol & Biodiesel Information Service
14
September 21, 2015 • Volume 12, Issue 38
Brazil and CBI MarketsAnhydrous Ethanol $1.51417-$1.62773 Hydrous Ethanol $1.36275-$1.43846(FOB Santos, 9/17/15, prices in U.S. $/gal.)
A hike in the so-called CIDE tax on gasoline in Brazil – which could boost sales of hydrous ethanol by making it more price-competitive – at one point was deemed potentially crucial to helping President Dilma Rousseff save her mandate.
However, the gasoline tax hike was not part of a fiscal package unveiled by the Brazilian government on Sept. 14.
In a recent front-page editorial, the Folha de S. Paulo newspaper said Rousseff needed to take drastic step – including additional spending cuts and tax hikes – to address a 2016 budget gap that has cost Brazil its investment-grade rating from Standard & Poor’s.
Some newspapers in Brazil ran headlines warning consumers to brace for higher gasoline prices because a higher tax on gasoline was considered highly probable.
Rousseff at one point had ordered her ministers to find an additional 15 billion reals ($3.9 billion) in savings. The fiscal package announced Sept. 14 is expected to have a R$26 billion impact, largely through spending cuts.
Brazil’s ethanol producers welcomed the return of the CIDE tax on gasoline on Feb. 1 of this year. At that time, the CIDE tax on gasoline went from zero to R$0.10/liter, and the PIS/Cofins tax on gasoline rose from R$0.26 to R$0.38/liter, for a total increase of R$0.22/liter.
More recently, Brazil’s ethanol industry had proposed raising the CIDE tax on gasoline to R$0.60/liter to address the government’s budget shortfall. It was estimated that the measure would bring in an additional R$14.9 billion – R$10.6 billion for the federal government and R$4.3 billion for states and municipalities.
Participants in Brazil’s ethanol industry cite two likely reasons that the CIDE tax hike was not part of the fiscal package announced Sept. 14.
According to some projections, with a CIDE gasoline tax of R$0.60/liter, consumption of gasoline “C” (gasoline blended with 27% anhydrous ethanol) would drop to 38.8 billion liters in 2016 from 42.2 billion liters expected for 2015.
“Don’t mess with Petrobras,” one industry participant said, referring to Brazil’s state-controlled oil company.
Another likely consideration was the impact on inflation. It was projected that raising the CIDE gasoline tax to R$0.60/liter would cause inflation to rise by nearly 0.9%.
Regardless, the boost in the CIDE tax on gasoline in February has been cited repeatedly by ethanol producers this year as helping to make hydrous ethanol more price competitive with gasoline at the pump.
The Brazilian Sugarcane Industry Association (UNICA) reported last month that consumption of hydrous ethanol
in Brazil by motorists with flex-fuel vehicles hit a record level in July.
Consumption of hydrous ethanol reached 1.55 billion liters in July, according to figures from Brazil’s National Oil, Gas and Biofuels Agency (ANP). That’s the highest monthly figure recorded since 2000, which is when fuel distributors and the ANP began sharing such data.
The previous monthly record was set in December 2009 when 1.51 billion liters of hydrous ethanol were sold.
Hydrous ethanol’s share of the fuel market (hydrous ethanol versus gasoline) also reached its highest monthly level so far in 2015, hitting 24.1% in July.
Brad Addington, [email protected]
News of the Week:
Bill to extend alt fuels regulation in California passes Legislature
Earlier this month, both houses of California’s legislature passed AB 808, and the bill has moved to Gov. Jerry Brown (D) for his signature.
AB 808 will extend to the state’s Department of Food and Agriculture (DFA) the same authority over alternative fuels that it has over fossil fuels.
Ethanol and biodiesel are specifically cited in the text of the bill as included under the proposed authority.
The bill makes alternative fuels subject to the same, or similar, rules set by DFA for retail business practices related to labeling, hours of business, advertising and so on. Without the authority specifically identified in the legislation, the DFA “is restricted from establishing fuel quality specifications that would protect consumers from substandard products and regulate advertising for these new alternative fuels,” a legislative analysis states.
Calif. governor signs rail freight safety bill into lawLegislation calling for adequate crew size for trains
and light engines carrying freight throughout the state of California has been signed into law by Gov. Jerry Brown (D).
Senate Bill 730, sponsored by Sen. Lois Wolk (D-Davis), prohibits the operation of a freight train or light engine within the state unless its crew size consists of at least two individuals.
“Today’s freight trains carry extremely dangerous materials, including Bakken crude oil, ethanol, anhydrous ammonia, liquefied petroleum gas, and acids that may pose significant health and safety risks to communities and our environment in the case of an accident,” said Wolk. “With more than 5,000 miles of railroad track that crisscrosses the state through wilderness and urban areas, the potential for derailment or other accidents containing these materials is an ever present danger. This new law will provide greater protection
www.opisnet.com | 888.301.2645
Ethanol & Biodiesel Information Service
15
September 21, 2015 • Volume 12, Issue 38
to communities located along rail lines in California, and to railroad workers.”
In addition, the law will give authorization to the California Public Utilities Commission to assess any civil penalties against anyone who willfully violates the law.
Queensland, Australia, considers biofuels mandate for 2016
Legislators in the Australian state of Queensland are considering a bill that would mandate blending of ethanol and biodiesel into the state’s fuels. The bill would require, beginning on July 1, 2016, a 2.0% overall ethanol blend (in regular-grade gasoline) and a 0.5% biodiesel blend.
“In Queensland, the biofuels industry, and particularly ethanol, has struggled to advance due to a lack of long-term policy certainty. There have been a number of false starts to an ethanol mandate, including a proposal for a legislated mandate to start at the end of 2010,” said member Mark Craig Bailey, in introducing the bill in Parliament. “A legislated mandate for 2% biobased petrol such as ethanol will, therefore, provide the policy certainty that the industry can take as a solid commitment from government to back the growth of a vibrant biofuels and bio-manufacturing industry in Queensland.”
Bailey said that use of ethanol in Queensland peaked in 2010-2011 at about 900 million liters per year (about 238 million gal), but fell to 350 million liters (about 92 million gal) in 2014. At its current level, it has a market share of about 1.2%.
E15 available to Iowans after summer ozone season ends
With the summer ozone season coming to an end recently, 37 retail locations throughout Iowa have begun offering E15 fuel to 2001 and newer vehicles again.
The period under which E15 cannot be sold to non-flexible fuel vehicles in some parts of the country is from June 1-Sept. 15. The restriction is in place because E15 blends do not receive the same 1-psi Reid Vapor Pressure (RVP) volatility waiver that is granted to E10.
Oberon Fuels, Ford working on car to be poweredby dimethyl ether
Oberon Fuels, which says it was the first company to produce fuel-grade dimethyl ether (DME) in North America, is partnering with other companies in an attempt to construct the inaugural production passenger car powered by DME for on-road testing, it said recently.
Oberon will team with Ford Motor Co., Forschungsvereinigung Verbrennungskraftmaschinen e. V. (FVV) and other FVV member companies on a three-year, 3.5
million-euro ($3.95 million) project “to research, analyze and test the potential of DME and oligomethyl ether (OME) fuel in passenger cars and heavy-duty truck engines, and ultimately build the world’s first production passenger car powered by DME for on-road testing.”
The project will investigate the use of DME and OME as diesel replacements in passenger cars and heavy-duty vehicle engines, respectively, and will result in the first original equipment manufacturer-produced DME passenger car in the world, according to Oberon.
Oregon issues updated proposal for Clean Fuels Program rules
The Oregon Department of Environmental Quality (Oregon DEQ) has issued a series of proposed amendments to the state’s Clean Fuels Program rules and said it would take public comments on the proposed changes until 4 p.m. on Oct. 21.
Also, it will hold a public hearing on the proposal on Oct. 19 at Oregon DEQ headquarters in Portland.
Most of the proposed changes were spelled out in SB 324, passed earlier this year, which removed the sunset provision of the original Clean Fuels Program bill, HB 2186. Under SB 324, the state is committed to reducing the carbon intensity (CI) of transport fuels by a certain percentage each year, cumulatively reducing CI by 10% by 2025 over a 10-year period.
The proposed changes include both definitional adjustments and incorporation of updated emissions models and new procedures.
Rail safety committee to meet in D.C. on Oct. 1The Rail Energy Transportation Advisory Committee
(RETAC) will hold its semi-annual public meeting on Oct. 1 in Washington, D.C.
Established by the Surface Transportation Board (STB) of the Department of Transportation in 2007, RETAC serves as a forum for government, industry and others to discuss emerging issues in the transportation by rail of biofuels, conventional hydrocarbons and coal. Its 25 voting members span across large and small railroads, coal producers, electric utilities, the biofuels industry, the petroleum industry and the private railcar industry.
The meeting is open to the public. Comments can be submitted to RETAC in advance of the meeting c/o Michael Higgins, STB, [email protected].
USDA’s Vilsack to biofuels industry: We’re still committed to growth
Washington, D.C. – USDA “is committed” to the U.S. biofuels industry “and we will continue to focus on things we can control” at the agency to grow the industry, USDA
www.opisnet.com | 888.301.2645
Ethanol & Biodiesel Information Service
16
September 21, 2015 • Volume 12, Issue 38
Secretary Tom Vilsack told attendees at Growth Energy’s sixth annual Advocacy Conference.
Among USDA programs to help the biofuels industry are blender pump funding, the Biofuels Infrastructure Partnership, the Biomass Crop Assistance Program and the Commodity Credit Corporation, Vilsack outlined. “We’re going to continue to look for ways to expand because it’s the right thing to do for the country,” he said.
USDA recently announced that 21 states have been awarded a collective $100 million in funding to help install blender pumps. It’s estimated that the grants will support the installation of nearly 5,000 fueling pumps.
“I was extraordinarily pleased with the reaction” to the blender pump solicitation, Vilsack said, noting that the largest amount of interest came from Texas, with 763 pumps. “That is good news for the industry. ... I am looking forward to nearly 5,000 additional pumps in place, doubling access to higher blends and setting the stage for continued ways to expand access to higher blends,” he added.
European Commission extends U.S. biodiesel penalties for 5 years
The European Commission has made it official: It extended both the anti- dumping and anti-subsidy duties on U.S. biodiesel imports for an additional period of five years.
With the publication of EU Regulations 2015/1518 and 2015/1519 in the EU Official Journal, the Commission affirmed the claims of Europe’s biodiesel industry that they would be harmed if the duties were lifted.
The European Biodiesel Board (EBB) said it “welcomes today’s publication of a five-year extension of the so-called “B99” measures.... EU biodiesel producers have committed significant efforts to build a world-class leading production capacity. Over the past years, however, they have been unable to fully reap the benefits of their work due to the devastating effects of successive waves of unfair U.S. competition.”
In the U.S., the National Biodiesel Board (NBB) denounced the decision as “protectionist” and said that U.S. producers face an unfair, uneven playing field.
To read the EU’s decisions, go to:
• http://www.ebb-eu.org/EBBpressreleases/B99_AD_Extension_Reg_2015_1518_15sep2015_aj.pdf
• http://www.ebb-eu.org/EBBpressreleases/B99_CV_Extension_Reg_2015_1519_15sep2015_aj.pdf.
Taiwanese delegation to purchase U.S. corn, co-products
A Taiwanese delegation in Washington, D.C., signed a letter of intent with the U.S. Grains Council (USGC) committing
to purchase 5 million metric tons (197 million bu) of U.S. corn and 500,000 tons of U.S. corn co- products, including distiller’s dried grains with solubles (DDGS), valued at $1.23 billion by 2017, USGC said recently.
“The letter is evidence of Taiwan’s commitment to strengthening trade ties and maintaining the well-established partnership between the United States and Taiwan,” USGC said.
For the 2014/2015 marketing year, Taiwan was the sixth-largest market for U.S. corn, third-largest market for U.S. barley and a top buyer of U.S. DDGS, according to USGC.
CARB board to vote on LCFSThe Board of the California Air Resources Board (CARB)
will consider a slate of biofuels-related issues at its next meeting on Sept. 24-25 in Sacramento, highlighted by a planned vote on the readoption of the Low Carbon Fuel Standard (LCFS).
The meeting will begin with a review of the proposed Alternative Diesel Fuel (ADF) regulation – specifically an updated environmental impact analysis of ADF. With that review will come a look at how ADF integrates with and supports the goals of the LCFS. On the 25th, the Board will vote on the readoption of the LCFS.
An agenda for the meeting and links to materials about the various programs that will be discussed can be found at:http://www.arb.ca.gov/board/ma/2015/ma092415.pdf.
BIO: Oil industry could lose trillions if EPA sets RFS below statutory targets
A NERA Economic Consulting study was issued recently by the American Petroleum Institute (API), which found that if left unchanged, the statutory volumes of the Renewable Fuel Standard (RFS2) will result in “outrageously high consumer costs.” However, a recasting of that same data by the Biotechnology Industry Organization (BIO) finds the oil industry would lose more than $12.3 trillion in potential profits this year if EPA sets the RFS targets below statutory levels, BIO has announced.
Among the findings from BIO’s analysis:
• “E10 could be sold at $93.64 per gallon this year. E10 contains 10 percent ethanol, which costs $1.07 per gallon, and 90% BOB (Blendstock) at $1.40 per gallon. The final cost of each E10 gallon is therefore under $1.37. That’s a potential profit margin of more than $92 per gallon!
• The U.S. Energy Information Administration projects that nearly 138 billion gallons of gasoline will be sold at an average price of $2.31 and 58 billion gallons of diesel will be sold at an average of $2.70 in 2015. NERA Economic Consulting forecasts the oil companies would reduce gasoline production to 93 billion gallons sold at $93.64 per

www.opisnet.com | 888.301.2645
Ethanol & Biodiesel Information Service
17
OPIS Ethanol & Biodiesel Information Service is published weekly by Oil Price Information Service, the nation’s leading supplier of pricing, news and analysis for the downstream refining and marketing sector. Circulation Office/Customer Service: 301-287-2525, Pricing Services Group, Editorial Group, Production Group: 800-275-0950 Fax: 800-927-3745. Ethanol pricing inquiries, contact Spencer Kelly, 301-287-2731. Biodiesel inquiries, contact Tanya Feyereisen, 651-644-8280, ext. 8133. STAFF: Ben Brockwell, Brad Addington, Brian Crotty, Denton Cinquegrana, Diane T. Miller, Donna Calabria, Jessica Nesterak, Mary Welge, Michael Kelly, Rachel Gantz, Renee Ortner, Robert Gough, Spencer Kelly, Brit Galloway, Michael Schneider, Tom Kloza, Edgar Ang, Beth Heinsohn. Postmaster: Send address changes to OPIS, Two Washingtonian Center, 9737 Washingtonian Blvd., Ste. 200, Gaithersburg, MD 20878-7364. © Redistribution (photocopying or forwarding) without written permission is strictly prohibited and aggressively enforced. If anyone reports illegal copying/forwarding to OPIS, they will receive 10% of the net proceeds of any copyright settlement.
Start my subscription to OPIS Ethanol & Biodiesel Information Service (ETH15001)
Renew my subscription to OPIS Ethanol & Biodiesel Information Service (ETH15001)
Payment Options:
Charge $290 USD* to my: VISA MasterCard AmEx Discover
Card # ____________________ Exp. Date _________________________
Signature ___________________________________________________
Bill me $290 USD* (must initial here ____)* You will be billed/charged $290 USD/month until the service is cancelled in writing. Applicable sales tax will be added in CT, NJ, NY, TX, UT and WA.
Price is valid for 30 days from the date of this issue. After 30 days the price will be the prevailing rate.
Billing Information:
Name __________________________________________________________
Company ________________________________________________________
Address _________________________________________________________
City ________________________ State ____ ZIP _____ Country __________
Phone __________________________ Fax ____________________________
Email (required) ___________________________________________________
Mail to: Oil Price Information Service (OPIS) | 9737 Washingtonian Blvd., Suite 200, Gaithersburg, MD 20878 Call: 888.301.2645 • Fax: 301.287.2535 • Email: [email protected] • Visit: www.opisnet.com
September 21, 2015 • Volume 12, Issue 38
gallon and reduce diesel production to 40 billion gallons sold at $103 per gallon. The potential profits, including the lower cost of production, exceed $12.3 trillion.
• E0 can only be sold at $23.49 per gallon, while the cost of the gasoline blendstock would likely be higher than the $1.40 for BOB. By insisting that E0 maintain 2.5% of the gasoline market when E10 is far more profitable, the oil companies would expect to forgo more than $427 billion in potential profits; and
EPA extending comment period on ICR for E15 recordkeeping rules
EPA is providing an additional 30-day comment period on an information collection request (ICR) related to recordkeeping of E15, according to a Federal Register notice.
In 2012, EPA gave final approval to E15 for 2001 and later-model-year vehicles.
The agency also issued a final rule establishing several measures to mitigate misfueling, requiring all E15 dispensers to have a specific label, while the rule also requires a survey of retail stations to ensure compliance with the requirements, among other issues.
EPA previously sought public comments on this issue on March 24, kicking off a 60-day deadline. “This notice allows for an additional 30 days for public comments,” the Federal Register notice added.
The new comment deadline is now Oct. 13.
European Commission approves new biodiesel joint venture
The European Commission (EC) has approved a new Dutch joint venture company between Wilmar International and Fox Petrolifera Italiana SpA of Italy that will produce biodiesel.
As the EC explained, “[t]he joint venture will produce
biodiesel and its byproducts from an existing Italian biodiesel plant currently operated by Fox Petrolifera. Both companies are active in the production of biodiesel, as well as crude and refined glycerin.” However, the details of the plant, such as the production capacity and its start date, were not disclosed.
“Also, the joint venture’s parent companies sell palm and seed oil, which are both used in the production of biodiesel. The commission concluded that the proposed acquisition would raise no competition concerns, because the companies’ combined market position would remain highly limited on all markets involved and they would continue to face significant competitive pressure from various strong, multinational competitors. The transaction was examined under the simplified merger review procedure,” the EC added.
Chinese Ethanol output forecast to rise 2.6% next year: report
Chinese fuel ethanol production is forecast at 3.15 billion liters (2.49 million metric tons) in 2016, up 2.6% from this year, according to a recent report by the U.S. Agriculture Department, while biodiesel output remains flat.
The rise in ethanol production is anticipated to occur in response to increased fuel consumption in provinces with blend mandates, according to USDA.
Ethanol imports in 2016 are forecast to reach 90 million liters. Ethanol imports this year are forecast at 70 million liters, up from only 14 million liters in 2014.
“The prospect for further import growth remains uncertain given tight government controls over the sale of ethanol for fuel use,” USDA said.
The government began to withdraw policy support for grain-based ethanol in 2010 after increasing domestic grain prices triggered alarm within the government, according to the report. All subsidies for grain-based ethanol have now been removed, it said, and production volumes are tightly controlled.