etf s , swaps, futures - lyxor
TRANSCRIPT

WHICH IS THE BEST INDEX-TRACKING SOLUTION?
ETFs, SWAPS,
FUTURES
THIS DOCUMENT IS FOR THE EXCLUSIVE USE OF INVESTORS ACTING ON THEIR OWN ACCOUNT AND CATEGORIZED EITHER AS “ELIGIBLE COUNTERPARTIES” OR “PROFESSIONAL CLIENTS” WITHIN THE MEANING OF MARKETS IN FINANCIAL INSTRUMENTS
DIRECTIVE 2004/39/EC. IT IS NOT DIRECTED AT RETAIL CLIENTS.

W H I C H I S T H E B E S T I N D E X - T R A C K I N G S O L U T I O N ?
2 >>
CONTENT
PAGE 3Introduction: ETFs, Swaps, FuturesWhich Is The Best Index-Tracking Solution?
PAGE 4 ETFs, Swaps and Futures
PAGE 6 Which Index Return?
PAGE 8 Holding Costs in Delta-one Instruments
PAGE 12 Futures-only Tracker Portfolios Become Less Efficient
PAGE 14 Futures-ETF Return Comparisons in Major Equity Indices
PAGE 20 Reasons for Negative Implied Repo Rates
PAGE 22 Liquidity and Holding Periods
PAGE 23 Conclusion

Introduction
3 >>
W H I C H I S T H E B E S T I N D E X - T R A C K I N G S O L U T I O N ?
ETFs, SWAPS, FUTURESWHICH IS THE BEST INDEX-TRACKING SOLUTION?
In this brochure we review the changing market environment of the most popular financial instruments used by institutional investors wishing to track equity indices: exchange-traded funds (ETFs), swaps and futures. We outline the key factors for investors to consider when choosing between these competing index-tracking instruments, such as trading venues, tracking performance, operational costs and maintenance requirements. We note the rising operational demands facing institutional investors using derivatives.
We also highlight a recent change in the relative attractiveness of delta-one instruments, reflecting an additional return drag facing investors using derivatives in the form of negative implied repo rates. We describe the possible reasons for this change in market dynamics.
We conclude that ETFs’ cost-efficiency, performance and operational simplicity is making this type of delta-one product increasingly attractive.

ETFs, Swaps and Futures
4 >>
W H I C H I S T H E B E S T I N D E X - T R A C K I N G S O L U T I O N ?
KEY CHARACTERISTICS
ETFs, swaps and futures, together with a number of other instruments with similar characteristics (equity index forwards, equity baskets, index certificates) are commonly described as “delta-one” products, since they promise to offer a return profile that mirrors, one-for-one, the return on an underlying equity benchmark1.
However, there are some important differences between these widely used delta-one products. These are summarised on the next page in Table 1.
The following differences between ETFs, swaps and futures are worth highlighting:
– ETFs are funded investments, while swaps and futures are unfunded (derivatives), allowing investors to purchase index exposure with leverage (on margin).
– Swaps are largely traded off-exchange (“over-the-counter” or “OTC”); futures are traded on-exchange and ETFs can be traded both on and off-exchange.
– The minimum investment size for an ETF is smaller than for futures or swap.
– Commissions and bid-offer spreads are payable for trades in both futures and ETFs. Execution costs in a swap may be levied separately or built into the swap’s pricing (and a separate charge may be payable for the swap’s early termination). Trades in futures and centrally cleared.
– Factors affecting the holding cost/performance of an ETF are the fund fees, accrued dividends, the swap spread (if any), plus any return from securities lending. Factors affecting the holding cost/performance of a swap are the cost of carry, financing fees and the cost of mitigating any counterparty risk to the swap provider. Factors affecting the holding cost/performance of a futures are the three elements of the futures cost of carry (financing, dividends, repo rate). The cost of carry of derivatives is explained in further detail on pages 14-15.
– The operational demands facing investors are significantly more complex for swaps and futures than for ETFs, and are on the rise (see the text box on page 5). ETF investors face custody costs and may have to reinvest income. Swap investors face extensive documentation requirements, collateral and collateral risk management responsibilities and daily cash flow management2. Futures investors face clearing costs, the management of contract rolls, initial and variation margin posting and management, and the management of currency exposures (if cross-currency exposures arise).
– The market coverage of ETFs and swaps is more extensive than that of futures.
– For both swaps and futures, tracking error against the underlying index is minimal. The tracking error of an ETF depends on the replication methodology and the nature of the underlying index. Tracking error is typically lower in an ETF using derivatives to track the underlying index than in an ETF using direct (physical) replication.
ETFs, SWAPS AND FUTURES
1 In finance theory, “delta” measures the sensitivity of a derivative instrument to changes in the price of an underlying asset. So a delta of one means that the derivative instrument’s price movements aim to mirror those of the underlying.
2 For swaps traded OTC. An increasing number of swaps are being traded on exchanges and cleared via exchanges’ central counterparties, in which case their operational requirements resemble those of futures.

ETFs, Swaps and Futures
5 >>
W H I C H I S T H E B E S T I N D E X - T R A C K I N G S O L U T I O N ?
TABLE 1—KEY CHARACTERISTICS OF ETFs, SWAPS AND FUTURES
INSTRUMENT NAME ETFs SWAPS FUTURES
TYPE OF INVESTMENT Funded (mutual fund) Unfunded (derivatives) Unfunded (derivatives)
TRADING VENUE On-exchange or OTC OTC On-exchange
MINIMUM INVESTMENT SIZE Single share By agreement Single contract
EXECUTION COSTS Commissions, bid-offer spreadsCommissions (may be built into
swap price), possible charge for early termination
Commissions, bid-offer spreads, clearing costs
TRACKING ERROR Variable Minimal Minimal
HOLDING COST (PERFORMANCE)
Index return adjusted for fund fees, accrued dividends, accrued swap spread (if any)/
accrued securities lending return (if any)
Index return adjusted for cost of carry, financing fees, cost of
mitigating counterparty risk
Index return adjusted for carry (financing costs, dividends, repo rate)
OPERATIONAL COSTS/REQUIREMENTS
Custody costs, management of cash reinvestment
Documentation (ISDA agreement), management
of collateral & collateral risk, cash flow management
Management of contract rolls, initial margin, variation
margin posting and management, currency
management
MARKET COVERAGE Extensive Extensive Major equity indices, limited in other asset classes
THE RISING OPERATIONAL COSTS OF DERIVATIVES
Investors face an increasingly demanding operational burden when trading in derivatives as a result of ongoing regulatory changes.
Following the financial crisis, regulators determined that a large part of the OTC derivatives market should move to exchange-based trading and to central clearing as a way to reduce the build-up of bilateral risk exposures and in order to enable the easier monitoring of the linkages between dealers and their clients.
As a result, institutional investors using derivatives now face new demands to source and pay initial margin when initiating derivatives trades. In general, under the incoming regime for central clearing investors are likely to face larger margin commitments and more frequent margin calls.
Different central clearing counterparties are likely to have different asset valuation methodologies, margin calculation models and collateral eligibility requirements, increasing the operational burden for firms trading on multiple venues.
As a result, depending on the central clearing counterparty faced by the investor, clearing costs may vary substantially. And different clients may face different unit clearing costs, depending on the nature of their business.
In addition to likely headline increases in clearing costs, the costs of maintaining higher margin levels and of sourcing higher- quality securities to use as margin, trading and clearing derivatives will require additional investment in the middle and back office management infrastructure at asset management firms, further increasing the costs of doing business in this area.

Which Index Return?
6 >>
W H I C H I S T H E B E S T I N D E X - T R A C K I N G S O L U T I O N ?
WHICH INDEX RETURN?
It’s easy to overlook design differences in the indices tracked by ETFs, swaps and futures.
In both swaps and futures, tracking error against the underlying index is minimal. The tracking error of an ETF depends on the replication methodology and the nature of the underlying index.
Investors should be aware of the difference between the price return, net total return and gross total return versions of equity indices.
A price return index measures the return on the index constituent securities without the inclusion of dividends or other forms of income.
A net total return index assumes that income from the index constituents is reinvested after a deduction is made for withholding taxes. As the withholding tax rates applied to equity dividends depend on the country of domicile of the recipient, index providers usually assume that the dividend recipient is a Luxembourg investor (and therefore subject to the maximum tax rate).
For example, the Euro STOXX 50 index, a widely used index of European large-capitalisation stocks, currently includes constituents from 12 eurozone countries. When calculating its net total return index, STOXX, the index provider, assumes that dividends from these stocks are taxed at rates of between 15% and 30% before being reinvested in the index.
A gross total return index is calculated by assuming that 100% of the gross dividends from index constituents are reinvested—i.e., there is no deduction for withholding taxes.
ETFs track all these types of index. A fund distributing income typically tracks a price index. A fund reinvesting dividend income that arises in different countries typically tracks a net total return index (since the ETF faces withholding taxes on that dividend income). A few ETFs track gross total return index versions—typically, those funds which invest within a single jurisdiction and which are not liable to pay withholding taxes.

Which Index Return?
7 >>
W H I C H I S T H E B E S T I N D E X - T R A C K I N G S O L U T I O N ?
The difference in return between these index versions depends on the level of dividend income generated by the index constituents and the tax rates applied by the index provider to that income stream (in the case of the net total return index). For an example, see the table below.
TABLE 2: PRICE, NET TR AND GROSS TR INDEX RETURN EXAMPLE
EURO STOXX 50 INDEX TYPE 2013 Return (%)
PRICE INDEX 17.94
NET TOTAL RETURN INDEX 21.51
GROSS TOTAL RETURN INDEX 22.74
In 2013 the return on the Euro STOXX 50 price index was +17.94%. Assuming the reinvestment of dividends from the index’s constituent stocks at a rate net of withholding taxes, the index return rose by 3.57%, to 21.51%. If dividends were reinvested at a gross (100%) rate, the index return was 4.8% higher than that of the price-only index.
In other words, during 2013 investors in the net total return index received 74.4% of the gross dividend income from the index stocks (3.57%/4.8%). The proportion of the gross total return index’s excess return receivable by investors in the net total return index varies over time. It depends on the index weightings and countries of domicile of the index constituents, as well as the tax rates applied by the index provider to equity income sourced from those countries.
Source: STOXX

Holding Costs in Delta-one Instruments
8 >>
W H I C H I S T H E B E S T I N D E X - T R A C K I N G S O L U T I O N ?
HOLDING COSTS IN DELTA-ONE INSTRUMENTS
ETFs
Investors in an ETF receive the return on the fund’s underlying assets, less any expenses charged by the fund manager. These expenses are usually expressed as an annual total expense ratio or TER.
The difference in annual return between an ETF and its benchmark is commonly expressed as the fund’s tracking difference. All things being equal, an investor might expect an ETF’s tracking difference against its target index each year to equal the TER.
However, this is not always the case. An ETF’s tracking difference against its index can often exceed or undershoot the TER. The principal reasons for this are:
– The fund manager holding a basket of securities that does not exactly mirror the index (in markets with liquidity constraints or indices with a very large number of securities the fund manager may hold only a cross-section of the benchmark’s stocks, or substitutes for hard-to access securities).
– Differences in withholding tax treatment between the index and the fund—depending on the fund’s domicile, it may be able to receive dividend income at a more favourable tax rate than that assumed by the index compiler in the calculation of the net total return index version.
– Swap spreads—a swap spread may be charged by the counterparty to the fund, causing tracking difference to exceed/undershoot the TER.
– Securities lending income—if the fund manager lends out securities from the fund’s inventory, this will generate additional income that reduces negative tracking difference.
– Transaction costs incurred when replicating the index.
Some of these effects are interchangeable. For example, the economic effect of securities lending may be mirrored by incremental income payable to a fund by the provider of a swap (effectively, the swap provider undertakes securities finance transactions and shares the additional income with the fund via the swap).
And swap spreads can be positive or negative (i.e., they can represent a cost to the fund or they can generate additional income for the fund), reflecting the assumptions built into the benchmark and the economics of obtaining exposure to the securities included in it.
Holding Costs in Delta-one Instruments
9 >>
W H I C H I S T H E B E S T I N D E X - T R A C K I N G S O L U T I O N ?
Under the incoming guidelines3 for ETFs and UCITS funds, set out in 2012 by Europe’s securities market regulator, ESMA, ETF issuers have to disclose and explain their funds’ tracking difference against the underlying indices in the funds’ annual reports.
SWAPS
The holding costs for an investor in a swap are the cost of carry of the swap, financing costs and the cost of offsetting counterparty risk.The cost of carry of a swap (and of any forward or futures contract) is explained in the section on futures.
The swap’s cost of carry and the cost of financing are usually set out in the swap agreement at the outset of the contract. For an equity index swap, for example, the swap provider will make explicit the level of dividend income to be paid during the life of the swap (often expressed as a percentage of gross dividend income), as well as any spread payable by the counterparty on the swap’s financing leg (usually expressed as a spread over LIBOR or another money market rate). By contrast, the post-tax rate at which an ETF receives dividend income may vary and is not explicit. And a future’s cost of carry also varies over time, reflecting changing market dynamics.
Unless the swap is collateralised, an investor in a swap takes on the counterparty risk of the swap provider. The market-determined cost of offsetting this counterparty risk is called a “Credit Valuation Adjustment” or CVA. This charge should be incorporated in the cost of holding a swap in any comparison between swaps and other delta-one instruments, such as ETFs and futures.
By contrast with ETFs and futures, for which explicit execution costs are payable, execution costs (and sometimes additional costs for early exit) are built into the price of swaps.
3 http://www.esma.europa.eu/system/files/2012-832en_guidelines_on_ETFs_and_other_ucits_issues.pdf

Holding Costs in Delta-one Instruments
10 >>
W H I C H I S T H E B E S T I N D E X - T R A C K I N G S O L U T I O N ?
Where t is the current time T is the time of maturity of the future/forward F(t) is the current futures price S(t) is the current (cash) price of the index rate is the risk-free interest rate over the term of the future Dividends are the dividends expected on the underlying index between t and T repo is the market-implied repo rate on the index between t and T
FUTURES
The price of a futures (and, more broadly, any forward) contract is derived from the current (cash) price of the underlying asset via an adjustment for the so-called cost of carry.
Taking the example of an equity index future/forward, the cost of carry has three components: dividends, the risk-free interest rate and an implied repo rate. These are used in the futures pricing equation as follows:
F(t)=S(t)*(1+rate)(T-t) - Dividends - S(t)*{(1+repo)(T-t) - 1}
To understand these components of the futures cost of carry, it helps to perceive things from the point of view of the market counterparty selling the futures contract to a buyer. The seller has an obligation to deliver to the buyer the underlying basket of securities at the futures contract’s expiry. On the same date, the buyer has the obligation to take delivery of the basket4 and to pay for it.
To hedge itself against this future obligation, the market counterparty borrows money to purchase the index stocks and holds them until the futures contract expires. The interest expense associated with doing this is reflected in the first term of the futures cost of carry. This interest expense is offset by the dividend income received from the basket of index stocks (this is the second term on the right hand side of the cost of carry equation).
From the futures buyer’s perspective, the futures price represents an adjustment from the current price of the index basket in the same way: the futures price is discounted from the current price of the index stocks to reflect the fact that the buyer will be forgoing the index stocks’ dividends over the term of the future; but an interest expense is added back on to reflect the cost to the futures seller of hedging itself by borrowing the index stocks.
Depending on the relative levels of dividend income and interest, futures prices may be quoted at a premium to the cash index price (in which case the market is said to be in contango) or at a discount (when the market is said to be in backwardation).
4 In many futures contracts the convention is for delivery to be made in cash, rather than in the physical assets tracked by the future.

Holding Costs in Delta-one Instruments
11 >>
W H I C H I S T H E B E S T I N D E X - T R A C K I N G S O L U T I O N ?
The third component of the cost of carry, the implied repo rate, reflects the opportunities available to the futures seller to generate additional income (assuming that the repo rate is positive) from the basket of securities via the repo and securities loan markets. However, if the repo rate is negative, this means that holding the basket of index securities over the contract term represents a marginal cost (rather than an opportunity to earn additional revenue) for the market counterparty.
Based on the above, a long position in a futures contract implies a short position in dividends and repo rates, as reflected by the minus signs in the futures pricing equation for the dividend and repo rate terms. This means that any decline in dividend expectations and/or repo rates increases the value of futures contracts, all other things being equal. In the same way, any rise in dividend expectations and/or repo rates reduces the value of futures contracts.
An investor can create a synthetic long position in an index by buying a futures contract and rolling it just ahead of every expiry date into a new contract. Although the investor does not physically receive dividends on the index stocks, pay interest on the notional amount used to invest in the index or incur the implied repo rate, the prices used to enter into and sell out of each futures contract will reflect all these three components of the cost of carry, as well as any movements in the prices of the underlying index stocks.
For a futures investor, a “roll risk” may materialise when the price of the expiring futures contract is lower than that of the new contract being entered into, which may arise in the case of declining dividend expectations and/or repo rates.
UNFUNDED VS. FUNDED INSTRUMENTS AND THE USE OF CASH
For an institutional investor, the decision on whether to use an unfunded (leveraged) instrument like a future or swap or a funded instrument (like an ETF) to track an index hinges largely on the use the investor can make of his cash.
It’s important to remember that the market interest rate is an important part of the cost of carry of an unfunded instrument. If an investor is able to achieve a better return on uninvested cash than the interest rate expense assumed by the futures or swap cost of carry, this increases the attractiveness of this way of tracking the index.
Conversely, an investor that is unable to achieve the futures-implied interest rate for a risk-free (on nearly risk-free) deposit will suffer an additional return drag if using futures, since the return on uninvested cash will not match the rate assumed by the futures market. As a result, this investor may well prefer to use a funded index-tracking instrument such as an ETF.
Since the financial crisis, widely used benchmarks for unsecured funding such as LIBOR have been thrown into question and earlier assumptions of common market financing and deposit rates have broken down. This has made it ever more important for investors to check the interest rate assumptions used in any unfunded instrument.

Futures-only Tracker Portfolios Become Less Efficient
12 >>
W H I C H I S T H E B E S T I N D E X - T R A C K I N G S O L U T I O N ?
FUTURES-ONLY TRACKER PORTFOLIOS BECOME LESS EFFICIENT
Up until 2011, an investor buying, holding and rolling equity index futures was able to achieve a return close to that of the underlying equity index, plus an income stream close or equal to 100% of the gross dividends from the index stocks.
From a top-line perspective (i.e., ignoring the additional operational costs involved in using derivatives) this made a long futures position economically attractive when compared with using ETFs.
As we have described above, an ETF investor in a fund with cross-border exposures typically achieves an equity income stream that falls short of 100% of gross dividend income from the index basket, reflecting deductions for withholding tax from equity dividends. However, in the last two years there has been a noticeable decrease in the relative efficiency of futures from a return perspective.
Below, we compare the average annual returns on the Euro STOXX 50 gross total return index and the Euro STOXX 50 futures roll total return index over two periods: from 31/12/2000 to 31/12/2011 and from 31/12/2011 to 31/12/2013.
The Euro STOXX 50 gross total return index measures the return on the index’s constituent stocks with dividends reinvested at a 100% rate (i.e., without any deduction for withholding taxes).
The Euro STOXX 50 futures roll total return index replicates the returns of an investor buying, holding and rolling the Euro STOXX 50 futures contract. The total return index calculation also assumes that the futures buyer earns interest on uninvested cash at a rate that matches the interest expense used in the futures cost of carry (in this case, the Euro Overnight Index Average rate—EONIA).
The futures roll index ignores some real-life costs faced by investors. First, a futures buyer may not be able to earn interest at a rate that matches the rate used in the futures cost of carry calculation. Any shortfall in interest earned, by comparison with the interest expense assumed in the futures calculation, will result in return slippage, vis-à-vis the index, for the futures buyer. Second, the futures roll index assumes that no initial margin is payable on a futures position. Third, the roll index ignores the effects of bid-offer spreads and commissions payable when futures are rolled each quarter.

Futures-only Tracker Portfolios Become Less Efficient
13 >>
W H I C H I S T H E B E S T I N D E X - T R A C K I N G S O L U T I O N ?
TABLE 3: EURO STOXX 50 GROSS TR INDEX VS. EURO STOXX 50 FUTURES ROLL TR INDEX
PERIOD EURO STOXX 50 GROSS TR INDEX (%)
EURO STOXX 50 FUTURES ROLL TR
INDEX (%)
2001-2011, p.a. -3.09 -3.10
2012-2013, p.a. 21.41 20.47
Table 3 shows that between 2001 and 2011 an investor rolling a long Euro STOXX 50 futures position would have earned an average annual return almost exactly equal to the return on the Euro STOXX 50 gross total return index. In other words (ignoring costs—see above), an investor holding a rolling futures position achieved the return on the index stocks plus 100% of the index constituents’ gross dividends.
In the last two years, however, the return on the futures roll index has lagged that of the Euro STOXX 50 gross total return index by 94 basis points a year. Why? The reason is a fall in the futures implied repo rate (the third component of the futures cost of carry calculation) into negative territory.
Source: STOXX

Futures-ETF Return Comparisons in Major Equity Indices
14 >>
W H I C H I S T H E B E S T I N D E X - T R A C K I N G S O L U T I O N ?
FUTURES-ETF RETURN COMPARISONS IN MAJOR EQUITY INDICES
The recent shift of implied repo rates into negative territory has had a dual effect: it has reduced the efficiency of a long-only futures position for index-tracking investors; and it has increased the relative attractiveness of other index-tracking instruments such as ETFs.
Below we show the effect of negative implied repo rates on the futures cost of carry in widely used equity indices: the Euro STOXX 50, the FTSE 100, the MSCI Emerging Markets and the S&P 500.
The charts display the following variables:
– “RepoRoll” is an annualised measure of the repo-related cost of futures investing. It is calculated as the rolling, one-year impact of 3-month repos on futures investors rolling into a new contract at each quarterly expiry. RepoRoll aims to measure the economic effect of repo rates on futures pricing and is comparable in methodology to the Euro STOXX 50 futures roll index.
– “Futures cost of carry” is the sum of “RepoRoll”, dividend withholding tax effects and a 2 basis point per year assumed roll cost. Futures cost of carry is a measure of the performance, relative to the index, of a rolled futures position. It shows whether futures investors can expect to over- or underperform the benchmark, based upon current market levels for the implied repo rate, withholding tax assumptions and costs.
– “ETF” shows the performance of a representative ETF tracking the benchmark. The ETF’s performance (tracking difference) against the index reflects the fund’s fees, swap spreads and/or securities lending income and any differences in withholding tax assumptions between the benchmark and the post-tax income realisable in practice by the ETF manager.
Futures-ETF Return Comparisons in Major Equity Indices
15 >>
W H I C H I S T H E B E S T I N D E X - T R A C K I N G S O L U T I O N ?
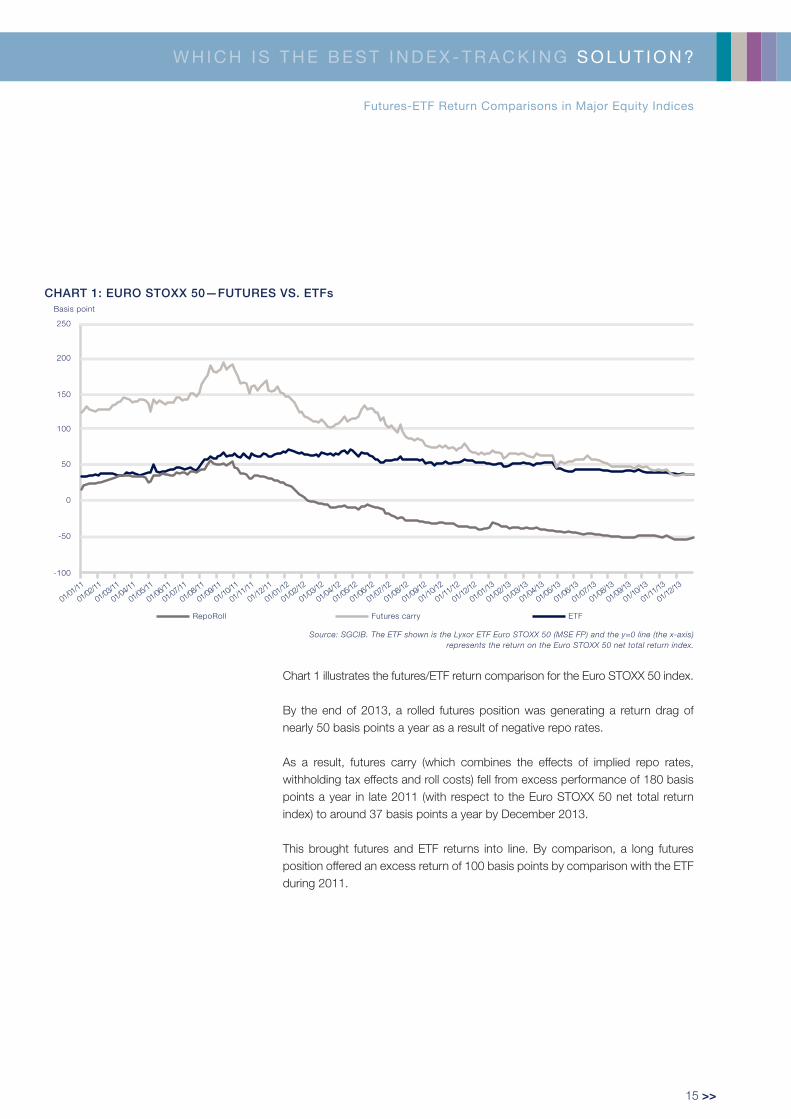
CHART 1: EURO STOXX 50—FUTURES VS. ETFs
Source: SGCIB. The ETF shown is the Lyxor ETF Euro STOXX 50 (MSE FP) and the y=0 line (the x-axis) represents the return on the Euro STOXX 50 net total return index.
Chart 1 illustrates the futures/ETF return comparison for the Euro STOXX 50 index.
By the end of 2013, a rolled futures position was generating a return drag of nearly 50 basis points a year as a result of negative repo rates.
As a result, futures carry (which combines the effects of implied repo rates, withholding tax effects and roll costs) fell from excess performance of 180 basis points a year in late 2011 (with respect to the Euro STOXX 50 net total return index) to around 37 basis points a year by December 2013.
This brought futures and ETF returns into line. By comparison, a long futures position offered an excess return of 100 basis points by comparison with the ETF during 2011.
-100
-50
50
0
100
150
200
250
RepoRoll Futures carry ETF
Basis point
01/01
/11
01/04
/11
01/07
/11
01/10
/11
01/01
/12
01/04
/12
01/07
/12
01/10
/12
01/01
/13
01/04
/13
01/07
/13
01/10
/13
01/12
/13
01/02
/11
01/05
/11
01/08
/11
01/11
/11
01/02
/12
01/05
/12
01/08
/12
01/11
/12
01/02
/13
01/05
/13
01/08
/13
01/11
/13
01/03
/11
01/06
/11
01/09
/11
01/12
/11
01/03
/12
01/06
/12
01/09
/12
01/12
/12
01/03
/13
01/06
/13
01/09
/13

Futures-ETF Return Comparisons in Major Equity Indices
16 >>
W H I C H I S T H E B E S T I N D E X - T R A C K I N G S O L U T I O N ?
Chart 2 illustrates the futures/ETF return comparison for the FTSE 100 index.
By contrast with the Euro STOXX 50 index, withholding tax effects are absent in the FTSE 100 (since the index equities are all domiciled in a single country, the UK).
As a result, futures carry (the combined effect of repo rates and roll costs) represented a return drag of 33 basis points a year by the end of 2013.
By contrast, the return drag of the ETF declined over the period from 47 basis points a year at the start of 2011 to 6 basis points by the end of 2013.
It’s clear from the chart that the ETF has offered a superior return profile to a long-only FTSE 100 futures portfolio since September 2012 (when the black line—the annual cost of the ETF—moved above the light grey line, the annual cost of carry of the future).
Source: SGCIB. The ETF shown is the Lyxor ETF FTSE 100 (L100 LN) and the y=0 line (the x-axis) represents the return on the FTSE 100 total return index.
CHART 2: FTSE 100—FUTURES VS. ETFs
-80
-60
-40
-20
0
20
40
60
RepoRoll Futures carry ETF
01/01
/11
01/04
/11
01/07
/11
01/10
/11
01/01
/12
01/04
/12
01/07
/12
01/10
/12
01/01
/13
01/04
/13
01/07
/13
01/10
/13
01/12
/13
01/02
/11
01/05
/11
01/08
/11
01/11
/11
01/02
/12
01/05
/12
01/08
/12
01/11
/12
01/02
/13
01/05
/13
01/08
/13
01/11
/13
01/01
/14
01/03
/11
01/06
/11
01/09
/11
01/12
/11
01/03
/12
01/06
/12
01/09
/12
01/12
/12
01/03
/13
01/06
/13
01/09
/13
Basis point

Futures-ETF Return Comparisons in Major Equity Indices
17 >>
W H I C H I S T H E B E S T I N D E X - T R A C K I N G S O L U T I O N ?
Chart 3 illustrates the futures/ETF return comparison for the MSCI Emerging Markets index.
As both the future and the ETF track the net total return version of the index, we assume withholding tax effects to be absent (and so, as in the case of the FTSE 100). The Futures carry on a rolled futures position with respect to the MSCI Emerging Markets net total return index currently represents a return drag of around 45 basis points a year.
Currently, an ETF incurs a greater return drag vis-à-vis the index than a rolled futures position.
However, MSCI Emerging Markets ETFs may offer superior liquidity than futures contracts on the same index.
Source: SGCIB. The ETF shown is the Lyxor ETF MSCI Emerging Markets (LEM FP) and the y=0 line (the x-axis) represents the return on the MSCI Emerging Markets net total return index.
CHART 3: MSCI EMERGING MARKETS—FUTURES VS. ETFs
RepoRoll Futures carry ETF
-140
-120
-100
-80
-60
-40
-20
0
01/01
/11
01/04
/11
01/07
/11
01/10
/11
01/01
/12
01/04
/12
01/07
/12
01/10
/12
01/01
/13
01/04
/13
01/07
/13
01/10
/13
01/12
/13
01/02
/11
01/05
/11
01/08
/11
01/11
/11
01/02
/12
01/05
/12
01/08
/12
01/11
/12
01/02
/13
01/05
/13
01/08
/13
01/11
/13
01/01
/14
01/03
/11
01/06
/11
01/09
/11
01/12
/11
01/03
/12
01/06
/12
01/09
/12
01/12
/12
01/03
/13
01/06
/13
01/09
/13
Basis point

Futures-ETF Return Comparisons in Major Equity Indices
18 >>
W H I C H I S T H E B E S T I N D E X - T R A C K I N G S O L U T I O N ?
Chart 4 illustrates the futures/ETF return comparison for the S&P 500 index.
Futures investors currently benefit from an implied dividend yield pick-up of around 60 basis points (the S&P 500 net total return index is calculated on the assumption that US dividends suffer a 30% withholding tax, while the gross yield on the S&P 500 index is around 2% a year).
However, the decline of the futures implied repo rate into negative territory during the course of 2012 and 2013 means that the carry on a long-only futures position (relative to the net total return index) is now around 24 basis points a year.
The return profile of the Lyxor S&P 500 ETF is now almost exactly the same as that of the long-only futures position—the ETF currently generates around 23 basis points in additional return a year vis-à-vis the net total return index.
As in the case of the Euro STOXX 50 index (shown in Chart 1), a rolled futures position on the S&P 500 index offered a significant return pick-up by comparison with an S&P 500 ETF during 2011, but that extra futures return has now been eroded completely.
Source: SGCIB. The ETF shown is the Lyxor ETF S&P 500 (SP5 FP) and the y=0 line (the x-axis) represents the return on the S&P 500 net total return index.
CHART 4: S&P 500—FUTURES VS. ETFs
-60
-40
-20
0
20
40
60
80
RepoRoll Futures carry ETF
01/01
/12
01/04
/12
01/07
/12
01/10
/12
01/01
/13
01/04
/13
01/07
/13
01/10
/13
01/02
/12
01/05
/12
01/08
/12
01/11
/12
01/02
/13
01/05
/13
01/08
/13
01/11
/13
01/12
/13
01/03
/12
01/06
/12
01/09
/12
01/12
/12
01/03
/13
01/06
/13
01/09
/13
Basis point

Futures-ETF Return Comparisons in Major Equity Indices
19 >>
W H I C H I S T H E B E S T I N D E X - T R A C K I N G S O L U T I O N ?

Reasons for Negative Implied Repo Rates
20 >>
W H I C H I S T H E B E S T I N D E X - T R A C K I N G S O L U T I O N ?
REASONS FOR NEGATIVE IMPLIED REPO RATES
What are the reasons for the decline of futures-implied repo rates into negative territory? As described earlier, a negative futures repo rate means that the seller of futures is charging the futures buyer to hold the index portfolio (i.e., the hedge portfolio) during the life of the futures contract.
A number of factors have helped push repo rates for equity derivatives below zero:
– Bank levies/balance sheet taxes: these have been introduced in a number of jurisdictions, including the UK, France and Germany. In the US, a proposed Financial Crisis Responsibility Fee is under discussion. Such taxes have acted to reduce the capacity of banks’ delta-one desks: if a delta-one desk acts as a repo seller, for example (lending securities against cash), the cash boosts the liability side of the bank’s balance sheet, incurring additional balance sheet taxes.
– Supplemental Leverage Ratio Proposals: regulators, led by the Basel Committee for Banking Supervision, propose to introduce a supplemental leverage ratio (a formal leverage limit) to act as a backstop to the current regulatory regime, under which banks use internal models to calculate their own risk-weighted assets to meet capital requirements. In addition, regulators propose to reduce banks’ ability to use counterparty netting in the calculation of their balance sheet size and, hence, their overall leverage. Such a change would limit banks’ use of so-called matched book repo (when the bank acts as intermediary between a repo seller and a repo buyer). As repo is a key activity in determining a bank’s overall balance sheet size (and therefore leverage), the introduction of a leverage ratio would have a major impact on both the availability and pricing of repo trades.
– The Basel III Liquidity Coverage Ratio (LCR): under the incoming Basel III regulatory framework, banks are required to hold enough liquid assets to meet expected outflows during a 30-day period of stress. This means that banks will be obliged to invest in low-yielding (sometimes negative-yielding) liquid assets if they engage in repo or other secured finance transactions of under 30 days’ maturity.
– Dividend Tax Uncertainty: European tax authorities propose to harmonise the rates of dividend withholding taxes paid by domestic funds and UCITS funds domiciled in other European countries. Currently, these tax rates are uneven. The uncertainty over future tax rates limits the long-term supply of equity forward contracts (futures and swaps), depressing implied repo rates.
– Financial Transaction Taxes: under proposals for a European financial transaction tax (FTT) each and every leg of a secured finance transaction could be subject to taxation. Since the FTT is a “cascading” tax, its effective rate will be considerably higher than the headline rate, especially for high-turnover transactions like those in repo and secured finance.
The outcome of several of these regulatory initiatives is unclear. A significant relaxation of the current balance sheet constraints on banks could push implied repo rates back up into positive territory. Currently, however, there are few signs of this happening.

Reasons for Negative Implied Repo Rates
21 >>
W H I C H I S T H E B E S T I N D E X - T R A C K I N G S O L U T I O N ?
WHY DOESN’T ETFs’ PERFORMANCE REFLECT CHANGES IN THE IMPLIED REPO RATE?
Physical ETFs (those which own the basket of stocks constituting the index) are not involved in equity forward transactions and therefore are not affected by changes in the equity implied repo rate, except when they undertake securities loans.
Many physical ETFs lend securities and falls in the implied equity repo rate represent an additional cost to the securities lender. When the implied equity repo rate is negative, the securities lender will have to pay the counterparty borrowing the stock.
If the ETF takes equity collateral (rather than cash) in return for the securities loan, this additional cost can be offset (as the negative implied repo rate for forward equity transactions means the ETF is being paid to receive the collateral). In such cases, the ETF is exposed to any difference (spread) between the repo rate on the securities loaned and the repo rate on the collateral received.
In the EU, synthetic (derivatives-based) ETFs purchase equity index forwards in the form of total return swaps from market counterparties. However, under Europe’s UCITS rules they must also receive collateral to offset the risk exposure to that counterparty (and to reduce it to a maximum of 10% of the fund’s net asset value).
Although a negative implied equity repo rate increases the effective cost to the fund of the equity index forward, it also increases the return received by the ETF on the collateral. Similarly to securities loan transactions, a synthetic ETF is therefore exposed to any difference (spread) between the repo rate on the equity index basket and the repo rate on the collateral basket, but not to the absolute level of the repo rate on the index basket.

Liquidity and Holding Periods
22 >>
W H I C H I S T H E B E S T I N D E X - T R A C K I N G S O L U T I O N ?
LIQUIDITY AND HOLDING PERIODS
Investors must also consider execution costs and holding periods when choosing between different delta-one investment products.
As described in Table 1 on page 5 investors in ETFs and futures face bid-offer spreads and commissions when buying and selling; in swaps, however, execution costs are built into the financing terms of the swap (although separate fees may be payable for early termination).
Investors maintaining long index exposure via a continuously rolled position in futures have to undertake 2(n+1) transactions for a position held over n futures contract cycles (assuming that the investor sells out of each terminating contract pre-expiry).
Futures on major indices are among the most liquid financial instruments in the world, and execution costs are readily measurable from exchange data. However, in order to obtain the best roll terms, investors need to pay careful attention to shifts in trading volume from an expiring futures contract to the contract with the succeeding expiration date during each contract roll period, which typically lasts several days. During such roll periods, futures contracts can also move temporarily to premiums or discounts, potentially affecting the return of the investor involved in the roll.
Measuring execution costs for ETFs is trickier, since European ETFs frequently offer “hidden liquidity” that is not displayed on exchanges’ order books. As a result of the region’s fragmented post-trade clearing and settlement infrastructure, market makers may not display the full potential depth of the ETF order book via their exchange quotations in all but the most heavily traded ETFs.
For institutional investors, one way to unearth ETFs’ hidden liquidity is to consult the capital markets desks at ETF issuers for advice on execution techniques. Another increasingly popular option is to poll several market makers simultaneously to obtain a price for immediate execution in the OTC market, using one of the “request for quote” trading systems designed for this purpose.
However, if execution costs in ETFs are harder to measure than those in futures and swaps, it’s important to remember that post-trade costs in futures and swaps are more complex to measure, and potentially significantly greater, than those in ETFs.
Conclusion
23 >>
W H I C H I S T H E B E S T I N D E X - T R A C K I N G S O L U T I O N ?
In this brochure we have reviewed the three most popular delta-one instruments used by institutional investors—ETFs, swaps and futures—with the aim of identifying the key questions investors need to ask to identify the best index-tracking solution.
We described the main characteristics of each instrument and highlighted the increasing operational complexity and rising costs facing institutional investors using derivatives such as swaps and futures. We also showed that the returns from equity futures and other derivatives have faced an rising headwind during the last two years as a result of the descent of implied equity repo rates into negative territory.
From both a cost and return perspective, these factors have increased the relative attractiveness of ETFs for those wishing to track indices.
CONCLUSION
Arnaud Llinas
Head of ETFs & indexing,Lyxor Asset Management
Thanks to Edouard Midy and Vincent Maury for their support and helpful comments.

LYXOR INTERNATIONAL ASSET MANAGEMENTSAS with share capital of EUR 1.059.696
Registered office: Tours Société Générale 17, cours Valmy 92800 Puteauxwww.lyxoretf.com
This document is for Professional clients only. It is not directed at Retail clients.
LYXOR ETF MAIN RISKS - Capital at risk: The capital invested is not guaranteed. - Replication risk: The fund objectives might not be reached due to unexpected events on the underlying markets which will impact the index
calculation and the efficient fund replication. - Fund Liquidity risk: The Fund’s liquidity and/or value may be negatively affected by different factors.- Counterparty risk: The Fund shall be exposed to the counterparty risk resulting from the use of OTC forward financial instruments contracted
with a lending institution.- Currency risk: The UCITS ETFs are exposed to currency risk, as they may be denominated in a currency different from the index. - Past performance: The figures relating to past performances and simulated past performances refer or relate to past periods and are not a
reliable indicator of future results. This also applies to historical market data.
This document is of a commercial nature and not of a regulatory nature.It is each investor’s responsibility to ascertain that it is authorised to subscribe, or invest into this product.Prior to investing in the product, investors should seek independent financial, tax, accounting and legal advice.The indexes and the trademarks used in this document are the intellectual property of index sponsors and/or its licensors. The indexes are used.under license from index sponsors. The Funds based on the indexes are in no way sponsored, endorsed, sold or promoted by index sponsors.and/or its licensors and neither index sponsors nor its licensors shall have any liability with respect thereto.Lyxor ETFs referred on this document are open ended mutual investment funds (i) established under the French law and approved by the Autorité des Marchés Financiers (the French Financial Markets Authority) or (ii) established under Luxembourg law and approved by the Commission de Surveillance du Secteur Financier (the Luxembourg Financial Markets Authority) (CSSF) and authorized for marketing of their units or shares in France pursuant to the article 93 of the 2009/65/EC Directive.Société Générale, Lyxor International Asset Management (“Lyxor AM”) and Lyxor Asset Management Luxembourg recommend that investors read carefully the “risk factors” section of the product’s prospectus and the “Risk and reward” section of the Key Investor Information Document (KIID). The prospectus in French for French Lyxor ETFs and in English for Luxembourg Lyxor ETFs and the KIID in French are available free of charge on www.lyxoretf.com or upon request to [email protected] attention of investors is drawn to the fact that, the prospectus of Luxembourg Lyxor ETFs is only available in English.Lyxor ETFs which are listed on NYSE Euronext are the object of market-making contracts, the purpose of which is to ensure the liquidity of the product on NYSE Euronext, assuming normal market conditions and normally functioning computer systems.Units of a specific Lyxor ETFs managed by an asset manager and purchased on the secondary market cannot usually be sold directly back to the asset manager itself. Investors must buy and sell units on a secondary market with the assistance of an intermediary (e.g. a stockbroker) and may incur fees for doing so. In addition, investors may pay more than the current net asset value when buying units and may receive less than the current net asset value when selling them.Updated composition of the product’s investment portfolio is available on www.lyxoretf.com. In addition, the indicative net asset value is published on the Reuters and Bloomberg pages of the product, and might also be mentioned on the websites of the stock exchanges where the product is listed.There is no guarantee that the fund’s objective will be met. The fund may not always be able to replicate exactly the performance of the index (or indices).This product includes a risk of capital loss. The redemption value of this product may be less than the amount initially invested. In a worst case scenario, investors could sustain the loss of their entire investment.The index referred to herein (the “Index”) is not sponsored, approved or sold by Société Générale, Lyxor AM or Lyxor Asset Management Luxembourg. Société Générale, Lyxor AM and Lyxor Asset Management Luxembourg shall not assume any responsibility in this respect.The accuracy, completeness or relevance of the information which has been drawn from external sources is not guaranteed although it is drawn from sources reasonably believed to be reliable. Subject to any applicable law, Société Générale, Lyxor AM and Lyxor Asset Management Luxembourg shall not assume any liability in this respect.The market information displayed in this document is based on data at a given moment and may change from time to time.This document does not constitute an offer for sale of securities in the United States of America. The product herein described will not be registered under the U.S. Securities Act of 1933, as amended (the “U.S. Securities Act”) and may not be offered or sold in the United States of America without being registered or being exempted from registration under the U.S. Securities Act.
Société Générale is a French credit institution (bank) authorised by the Autorité de contrôle prudentiel et de Résolution (the French Prudential Control Authority).
Notice to investors in the UK: This material is issued in the UK by Lyxor Asset Management UK LLP, which is authorized and regulated by the Financial Conduct Authority in the UK under Registration Number 435658.
© COPYRIGHT 2014 LYXOR INTERNATIONAL ASSET MANAGEMENT ALL RIGHTS RESERVED