et al., 2007. massive sulphides search at the iberian .... 2.pdf · massive sulphides search at the...
TRANSCRIPT

Fernández, E. M. et al., 2007. Massive sulphides search at the Iberian Pyrite Belt: petrophysical data, geophysical natural fields and mineral favourabilitymapping. Boletín Geológico y Minero, 118 (1): 19-36ISSN: 0366-0176
19
Massive sulphides search at the Iberian Pyrite Belt:petrophysical data, geophysical natural fields and
mineral favourability mappingE.M. Fernández, J.L. García-Lobón and C. Ayala
Instituto Geológico y Minero de España. Ríos Rosas, 23. 28003 [email protected], [email protected], [email protected]
ABSTRACT
In this study we describe an application of several algorithms for mineral favourability mapping in a well-known metallogenic province,the Iberian Pyrite Belt. We have processed and interpreted some available high resolution geophysical coverages (ground gravity and air-borne magnetic and radiometric data), and related them to surface geology, to detailed structural maps, and to the occurrence of the PyriteBelt ore deposits. We also analyse the variation of petrophysical properties (rock density, magnetic susceptibility, remanent magnetiza-tion, and natural gamma radiation) measured in field and laboratory from surface rocks at the Northwestern Domain of the Belt, and des-cribe the relationship of these properties with the available regional geophysical data as well as their significance for massive sulphideexploration in the Belt. Using all the aforementioned information, a test of several integrated GIS-based data driven classifiers has beenrun. These tools generate mineral favourability images using several mapping function algorithms (neural network, weights of evidence,and logistic regression methods). Mineral favourability maps allow areal evaluation and definition of possible massive sulphide occu-rrences, suitable for developing new mining prospects. The utility of petrophysical data and regional natural-field geophysical images forsubsurface mapping and deposit search is discussed, and some useful indications on the statistical integration of geophysical potentialfield images with surface geology, structure and mineral occurrences are extracted.
Key words: geophysical natural fields, Iberian Pyrite Belt, mineral favourability mapping, petrophysics
Búsqueda de depósitos de sulfuros masivos en la Faja Pirítica: petrofísica, imágenes geofísicas de campo natural y mapas de favorabilidad minera
RESUMEN
En este trabajo describimos la aplicación de diversos algoritmos de generación de mapas de favorabilidad minera en una provincia meta-logénica bien conocida: la Faja Pirítica Ibérica. Hemos procesado e interpretado las coberturas geofísicas de alta resolución disponiblesen la zona (datos gravimétricos terrestres y datos de magnetometría y radiometría aeroportadas de alta resolución), estableciéndose sucorrelación con la geología de superficie, mapas estructurales detallados y depósitos minerales de la Faja Pirítica. También hemos anali-zado la variación de las propiedades petrofísicas (densidad, susceptibilidad magnética, magnetización remanente y radiación gammanatural) medidas en campo y en laboratorio de las rocas del Dominio Noroeste de la Faja, describiendo la relación entre dichas propie-dades y los datos geofísicos disponibles así como su importancia en la exploración de depósitos de sulfuros masivos. Utilizando toda lainformación mencionada, hemos llevado a cabo un ensayo con varios algoritmos de clasificación implementados en SIG. Mediante estasherramientas, hemos generado mapas de favorabilidad minera utilizando los métodos de redes neuronales, pesos de las evidencias yregresión logística. Los mapas de favorabilidad minera permiten la evaluación areal y la definición de la posible localización de nuevosdepósitos de sulfuros masivos. Discutimos la utilidad de los datos petrofísicos y las imágenes geofísicas de campo natural para la carto-grafía de subsuelo y la búsqueda de recursos minerales y proporcionamos indicaciones útiles acerca de la integración estadística de losmapas de campo potencial con la geología de superficie, los mapas estructurales y los depósitos minerales.
Palabras clave: campos geofísicos naturales, Faja Pirítica Ibérica, mapas de favorabilidad minera, petrofísica
Introduction. Geological setting
The Iberian Pyrite Belt (IPB, SW Spain) is one of thelargest and most important metallogenic provinces inthe world with more than twenty centuries of miningactivity (Leistel et al., 1997; Gumiel and Mirete, 1999).The area has been extensively explored for volcano-genic massive sulphide deposits (VMS) and a com-
plete data coverage is available, including high reso-lution ground gravity and airborne magnetic andradiometric surveys carried out by IGME (GeologicalSurvey of Spain), in the last decade (Bates and GarcíaLobón, 1998).
Recently, IGME has been involved in several inte-grated projects aimed to improve the geological inter-pretation of high-resolution magnetic and radiome-
Fernández, E. M. et al., 2007. Massive sulphides search at the Iberian Pyrite Belt:... Boletín Geológico y Minero, 118 (1): 19-36
20
tric airborne data. Petrophysical characterisation ofVMS sites sets up the basis for processing and analy-sing radiometric and potential field images with thepurpose of building up geophysical documents forguiding mining prospecting. This guiding is improvedby the integration of all these datasets in the frame-work of GIS algorithmic tools.
The IPB is the northern segment of the SouthPortuguese Terrane (southwesternmost corner of theVariscan Iberian Massif). The oldest lithologies appe-ar in the North and the youngest in the South, reflec-ting the thin-skinned south-verging tectonics of theBelt. The geological record exposed in the
Northwestern Domain of IPB includes (Leistel y otrosand references therein):
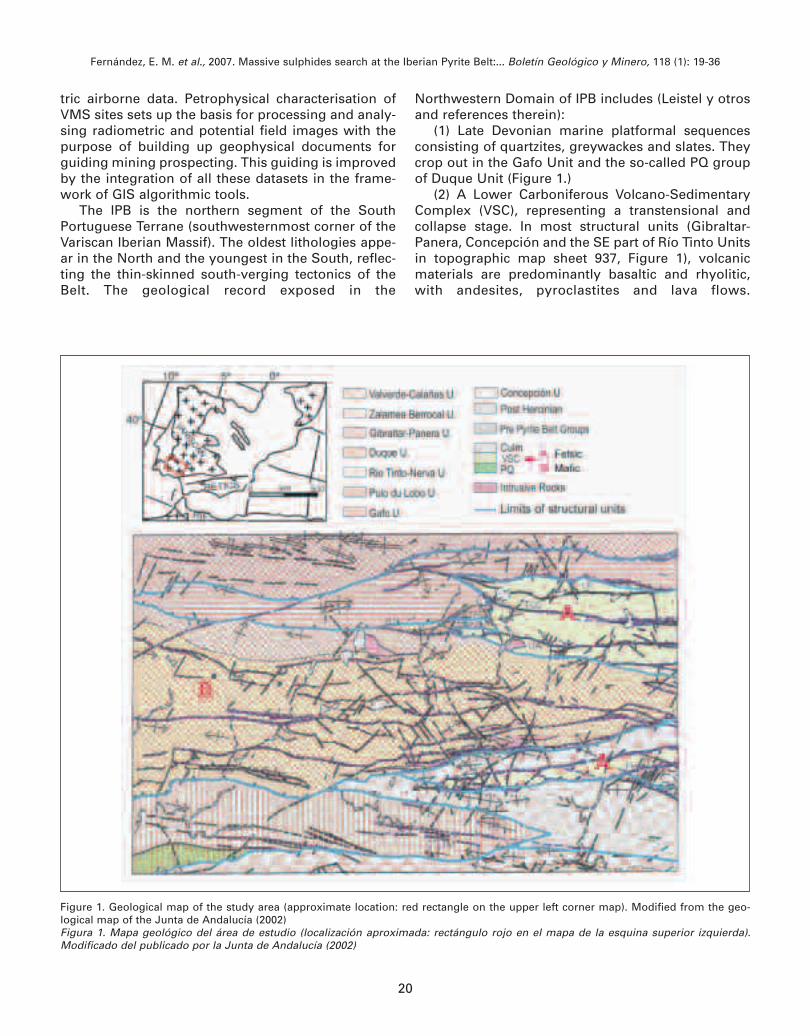
(1) Late Devonian marine platformal sequencesconsisting of quartzites, greywackes and slates. Theycrop out in the Gafo Unit and the so-called PQ groupof Duque Unit (Figure 1.)
(2) A Lower Carboniferous Volcano-SedimentaryComplex (VSC), representing a transtensional andcollapse stage. In most structural units (Gibraltar-Panera, Concepción and the SE part of Río Tinto Unitsin topographic map sheet 937, Figure 1), volcanicmaterials are predominantly basaltic and rhyolitic,with andesites, pyroclastites and lava flows.
Figure 1. Geological map of the study area (approximate location: red rectangle on the upper left corner map). Modified from the geo-logical map of the Junta de Andalucía (2002)Figura 1. Mapa geológico del área de estudio (localización aproximada: rectángulo rojo en el mapa de la esquina superior izquierda).Modificado del publicado por la Junta de Andalucía (2002)
Fernández, E. M. et al., 2007. Massive sulphides search at the Iberian Pyrite Belt:... Boletín Geológico y Minero, 118 (1): 19-36
21
Volcanites are interstratified in a pelite-black shaleand sandstone sequence, which contains beds of jas-per; and,
(3) A Middle-Upper Carboniferous thick turbiditeformations of greywackes and slates, known as Culmgroup, outcropping in the rest of the units of thestudy area.
It will be shown that tectonic units (Figure 1) andthe main structural limits are of great importance forgeophysical interpretation and orebody searching.The massive sulphides are hosted by the VSCsequence, either directly in the black shale, or restingon acidic volcanic facies albeit commonly separatedby a thin pelitic layer. The mineralization model is ofVMS type, genetically related to submarine volcanicactivity. Main metallic ores are copper, lead and zinc;gold and silver appear as accessories.
Petrophysical measurements and results
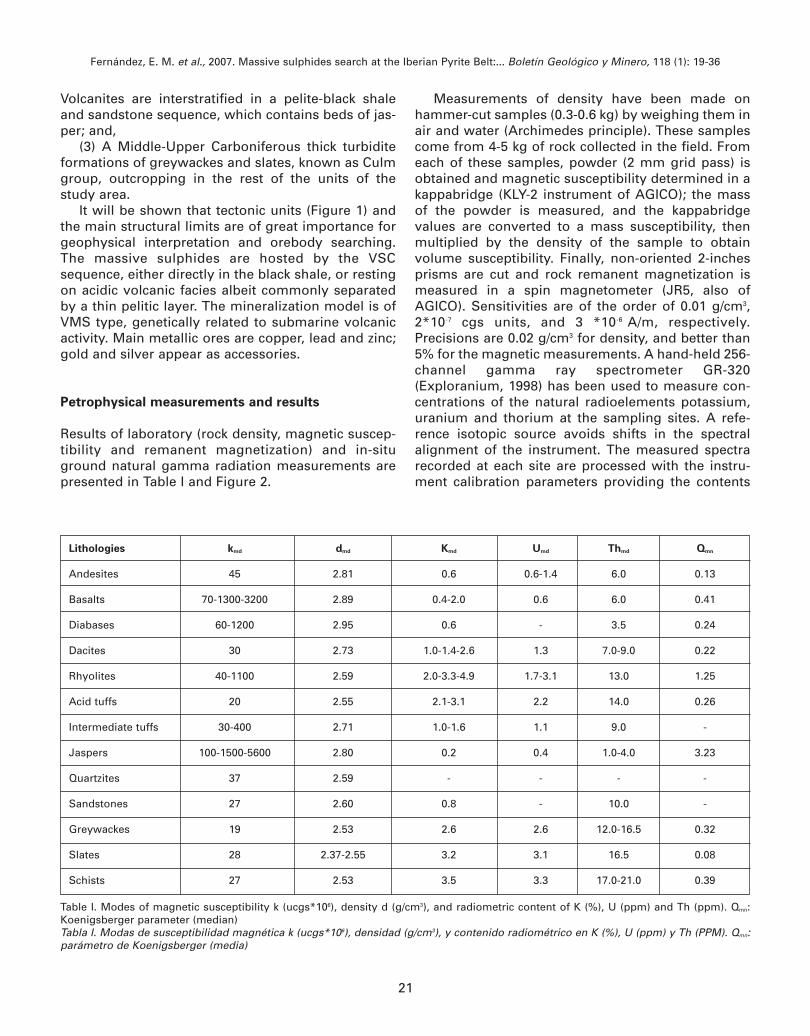
Results of laboratory (rock density, magnetic suscep-tibility and remanent magnetization) and in-situground natural gamma radiation measurements arepresented in Table I and Figure 2.
Measurements of density have been made onhammer-cut samples (0.3-0.6 kg) by weighing them inair and water (Archimedes principle). These samplescome from 4-5 kg of rock collected in the field. Fromeach of these samples, powder (2 mm grid pass) isobtained and magnetic susceptibility determined in akappabridge (KLY-2 instrument of AGICO); the massof the powder is measured, and the kappabridgevalues are converted to a mass susceptibility, thenmultiplied by the density of the sample to obtainvolume susceptibility. Finally, non-oriented 2-inchesprisms are cut and rock remanent magnetization ismeasured in a spin magnetometer (JR5, also ofAGICO). Sensitivities are of the order of 0.01 g/cm3,2*10-7 cgs units, and 3 *10-6 A/m, respectively.Precisions are 0.02 g/cm3 for density, and better than5% for the magnetic measurements. A hand-held 256-channel gamma ray spectrometer GR-320(Exploranium, 1998) has been used to measure con-centrations of the natural radioelements potassium,uranium and thorium at the sampling sites. A refe-rence isotopic source avoids shifts in the spectralalignment of the instrument. The measured spectrarecorded at each site are processed with the instru-ment calibration parameters providing the contents
Lithologies kmd dmd Kmd Umd Thmd Qmn
Andesites 45 2.81 0.6 0.6-1.4 6.0 0.13
Basalts 70-1300-3200 2.89 0.4-2.0 0.6 6.0 0.41
Diabases 60-1200 2.95 0.6 - 3.5 0.24
Dacites 30 2.73 1.0-1.4-2.6 1.3 7.0-9.0 0.22
Rhyolites 40-1100 2.59 2.0-3.3-4.9 1.7-3.1 13.0 1.25
Acid tuffs 20 2.55 2.1-3.1 2.2 14.0 0.26
Intermediate tuffs 30-400 2.71 1.0-1.6 1.1 9.0 -
Jaspers 100-1500-5600 2.80 0.2 0.4 1.0-4.0 3.23
Quartzites 37 2.59 - - - -
Sandstones 27 2.60 0.8 - 10.0 -
Greywackes 19 2.53 2.6 2.6 12.0-16.5 0.32
Slates 28 2.37-2.55 3.2 3.1 16.5 0.08
Schists 27 2.53 3.5 3.3 17.0-21.0 0.39
Table I. Modes of magnetic susceptibility k (ucgs*106), density d (g/cm3), and radiometric content of K (%), U (ppm) and Th (ppm). Qmn:Koenigsberger parameter (median)Tabla I. Modas de susceptibilidad magnética k (ucgs*106), densidad (g/cm3), y contenido radiométrico en K (%), U (ppm) y Th (PPM). Qmn:parámetro de Koenigsberger (media)
of potassium, uranium and thorium (%K, ppmU andppmTh). In situ radiometric estimates of K, U and Thcan be expected to correlate well with the actual pro-portions in the rock sample, if the outcrop offers goodmeasurement conditions (fresh rock, locally flat geo-metry; Chiozzi et al., 1998).
The results can be summarized as follows (García-Lobón and Ayala, 2004):
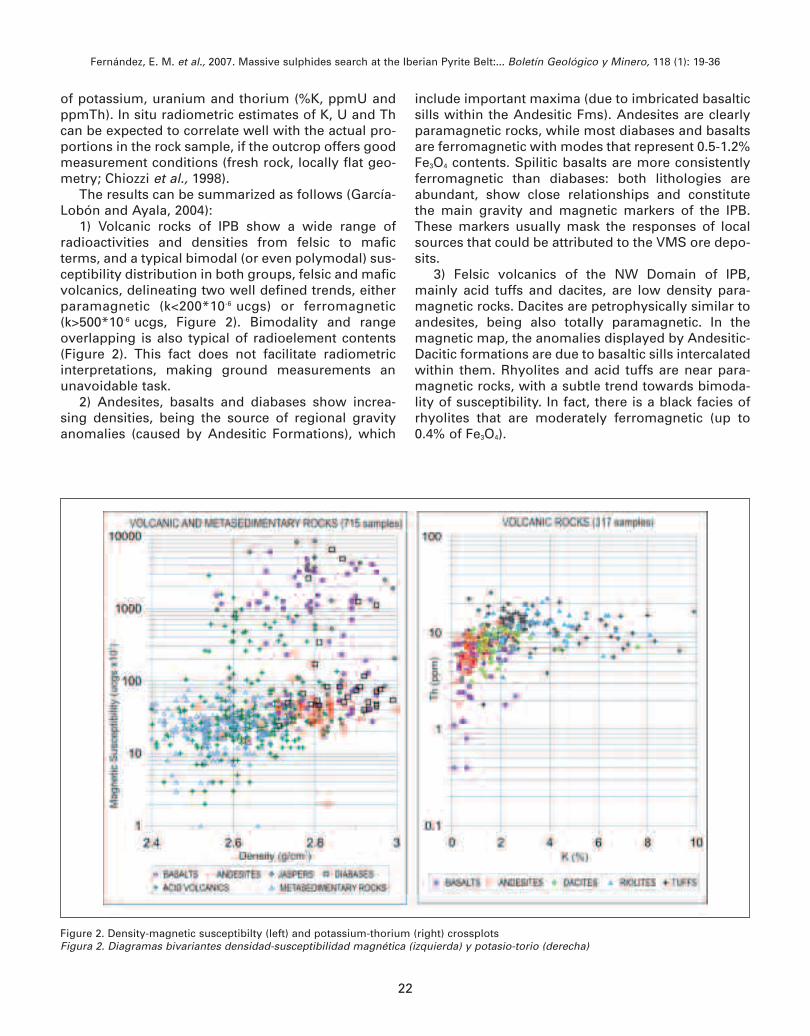
1) Volcanic rocks of IPB show a wide range ofradioactivities and densities from felsic to maficterms, and a typical bimodal (or even polymodal) sus-ceptibility distribution in both groups, felsic and maficvolcanics, delineating two well defined trends, eitherparamagnetic (k<200*10-6 ucgs) or ferromagnetic(k>500*10-6 ucgs, Figure 2). Bimodality and rangeoverlapping is also typical of radioelement contents(Figure 2). This fact does not facilitate radiometricinterpretations, making ground measurements anunavoidable task.
2) Andesites, basalts and diabases show increa-sing densities, being the source of regional gravityanomalies (caused by Andesitic Formations), which
include important maxima (due to imbricated basalticsills within the Andesitic Fms). Andesites are clearlyparamagnetic rocks, while most diabases and basaltsare ferromagnetic with modes that represent 0.5-1.2%Fe3O4 contents. Spilitic basalts are more consistentlyferromagnetic than diabases: both lithologies areabundant, show close relationships and constitutethe main gravity and magnetic markers of the IPB.These markers usually mask the responses of localsources that could be attributed to the VMS ore depo-sits.
3) Felsic volcanics of the NW Domain of IPB,mainly acid tuffs and dacites, are low density para-magnetic rocks. Dacites are petrophysically similar toandesites, being also totally paramagnetic. In themagnetic map, the anomalies displayed by Andesitic-Dacitic formations are due to basaltic sills intercalatedwithin them. Rhyolites and acid tuffs are near para-magnetic rocks, with a subtle trend towards bimoda-lity of susceptibility. In fact, there is a black facies ofrhyolites that are moderately ferromagnetic (up to0.4% of Fe3O4).
Fernández, E. M. et al., 2007. Massive sulphides search at the Iberian Pyrite Belt:... Boletín Geológico y Minero, 118 (1): 19-36
22
Figure 2. Density-magnetic susceptibilty (left) and potassium-thorium (right) crossplotsFigura 2. Diagramas bivariantes densidad-susceptibilidad magnética (izquierda) y potasio-torio (derecha)
4) Average densities and susceptibilities of sands-tones, greywackes, quartzites, schists and slatesrange between 2.49-2.57 g/cm3 and 19-37*10-6 ucgs.As felsic volcanics, metasedimentary rocks have lowdensities and susceptibilities, which do not causemagnetic or gravity anomalies. Jaspers are denseand ferromagnetic, and frequently produce shortwavelength magnetic anomalies that constitute anindirect guide for ore body searching in many areasof IPB.
5) Remanence measurements indicate that multi-domain magnetite is the main ferromagnetic mineralin basalts and diabases (1.000<k<10.000*10-6 ucgs,Q≅0.5). In general, magnetic induction dominatesover remanent magnetization, with Koenigsbergerratios Q characteristic of a normal orientated viscousremanence, the exception being jaspers and somerhyolites (the black facies ferromagnetic set). No k-Qvalues typical of pyrrhotite bearing rocks have beendetected in the dataset.
6) Mafic and intermediate volcanics show weak
radioactivities (Figure 2). Bimodality of radiometriccontents reflects the occurrence of alterations (e.g.,potassification of plagioclase and mafic minerals)that confer higher radioactivities to these rocks.
Concerning the felsic terms, typical dacites(1.3<%K<2.8), acid tuffs, and rhyolites of K< 5%, dis-play increasing radioactivity within a common K-Thtrend that reflects their genetic relationship. Rhyolitesare nearly always easily discernible from dacites.
Dacites appear on low radioactivity areas in theternary airborne radiometric map, similar to thoseoccurring over andesites, so it is usually not possibleto differentiate dacites from andesites in Andesitic-Dacitic Formations. Rhyolites are the most radioacti-ve volcanic rocks, showing great heterogeneity, withseveral modes in their radioelement histograms.Although acid tuffs radioactivity on the ground datatends to be high, there are wide areas of these rockson the geological maps with low-moderate emissionsin the radiometric images.
7) As acid volcanics, metasedimentary rocks dis-
Fernández, E. M. et al., 2007. Massive sulphides search at the Iberian Pyrite Belt:... Boletín Geológico y Minero, 118 (1): 19-36
23
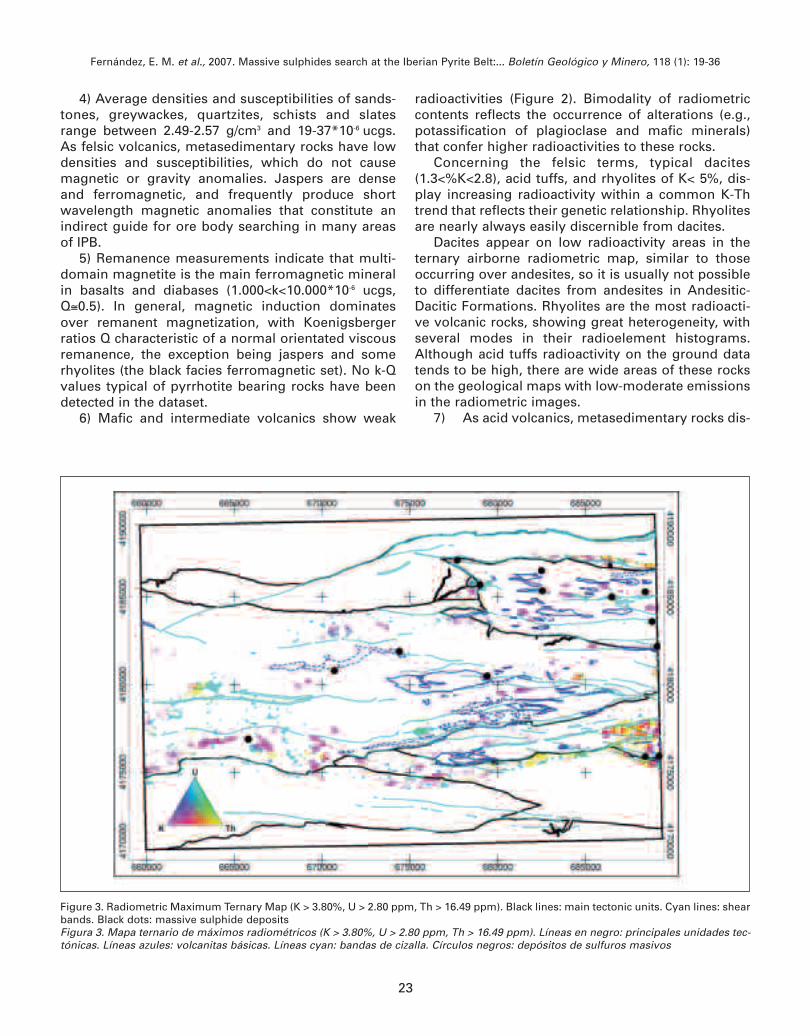
Figure 3. Radiometric Maximum Ternary Map (K > 3.80%, U > 2.80 ppm, Th > 16.49 ppm). Black lines: main tectonic units. Cyan lines: shearbands. Black dots: massive sulphide depositsFigura 3. Mapa ternario de máximos radiométricos (K > 3.80%, U > 2.80 ppm, Th > 16.49 ppm). Líneas en negro: principales unidades tec-tónicas. Líneas azules: volcanitas básicas. Líneas cyan: bandas de cizalla. Círculos negros: depósitos de sulfuros masivos
Fernández, E. M. et al., 2007. Massive sulphides search at the Iberian Pyrite Belt:... Boletín Geológico y Minero, 118 (1): 19-36
24
play a wide spectrum of radiometric values, showingincreasing radioactivites from sandstones to schists,through greywackes and slates. Radioactive histo-grams of greywackes suggest a tendency to bimoda-lity, with a group of intermediate radioactivity, similarto sandstones, and another more radioactive, similarto slates. Slates and schists are the most radioactiverocks of the NW Domain of IPB, displaying strongradiometric contrasts with the volcanic set in airbornemaps.
8) An outstanding feature of ground radiometricdata refers to extreme values, very well separated inthe K-Th diagram (K>6%, Figure 2). In particular, spec-tacular potassifications occur in rhyolites and acidtuffs located close to thrust limits and shear zones,that clearly control them, at least in the felsic volcanicUnits (Figure 3). These potassifications constitute agood guide for prospecting VMS deposits. A remar-kable fact depicted in Figure 3 is the general lowradioactive level of the studied area.
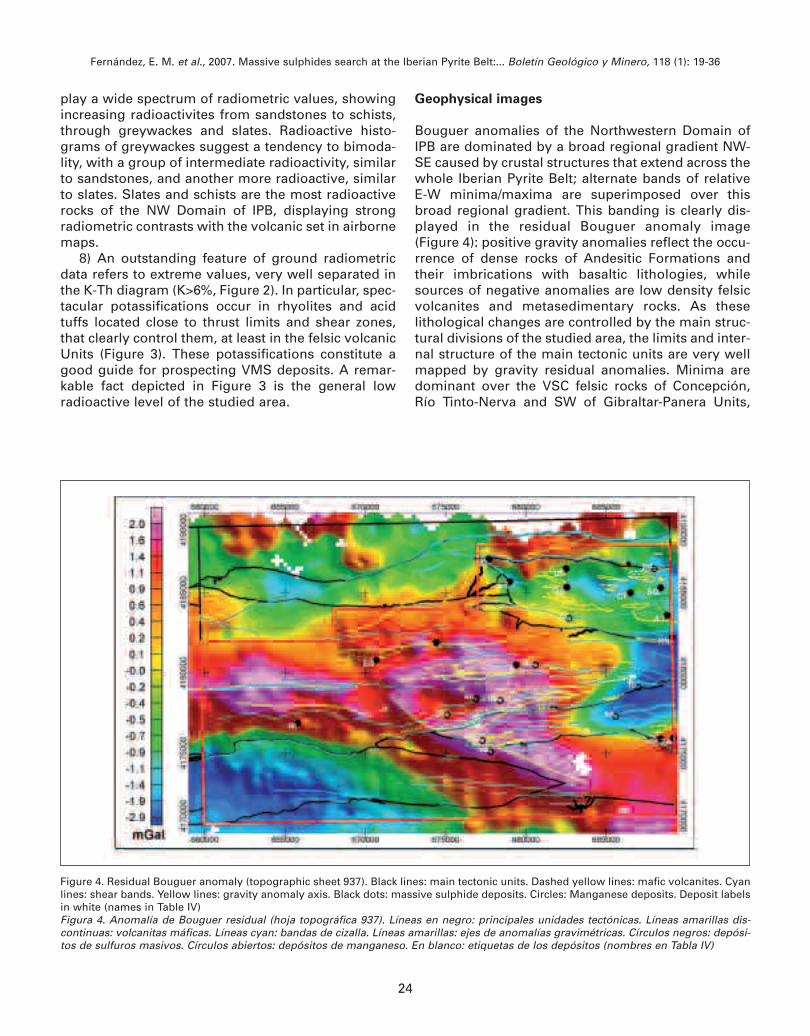
Geophysical images
Bouguer anomalies of the Northwestern Domain ofIPB are dominated by a broad regional gradient NW-SE caused by crustal structures that extend across thewhole Iberian Pyrite Belt; alternate bands of relativeE-W minima/maxima are superimposed over thisbroad regional gradient. This banding is clearly dis-played in the residual Bouguer anomaly image(Figure 4): positive gravity anomalies reflect the occu-rrence of dense rocks of Andesitic Formations andtheir imbrications with basaltic lithologies, whilesources of negative anomalies are low density felsicvolcanites and metasedimentary rocks. As theselithological changes are controlled by the main struc-tural divisions of the studied area, the limits and inter-nal structure of the main tectonic units are very wellmapped by gravity residual anomalies. Minima aredominant over the VSC felsic rocks of Concepción,Río Tinto-Nerva and SW of Gibraltar-Panera Units,
Figure 4. Residual Bouguer anomaly (topographic sheet 937). Black lines: main tectonic units. Dashed yellow lines: mafic volcanites. Cyanlines: shear bands. Yellow lines: gravity anomaly axis. Black dots: massive sulphide deposits. Circles: Manganese deposits. Deposit labelsin white (names in Table IV)Figura 4. Anomalía de Bouguer residual (hoja topográfica 937). Líneas en negro: principales unidades tectónicas. Líneas amarillas dis-continuas: volcanitas máficas. Líneas cyan: bandas de cizalla. Líneas amarillas: ejes de anomalías gravimétricas. Círculos negros: depósi-tos de sulfuros masivos. Círculos abiertos: depósitos de manganeso. En blanco: etiquetas de los depósitos (nombres en Tabla IV)

Fernández, E. M. et al., 2007. Massive sulphides search at the Iberian Pyrite Belt:... Boletín Geológico y Minero, 118 (1): 19-36
25
and over metasedimentary ones of Duque and GafoUnits. Maxima in the central area of Gibraltar-PaneraUnit and south of it are caused by VSC intermediate-mafic volcanites.
The reduced to pole total magnetic field (Figure 5)maps very well the different magnetic character ofvolcanic versus metasedimentary rocks. This field ischaracterised by a superposition of E-W anomalybands of different wavelength. Broader maxima arelocated over the Gibraltar-Panera and Río Tinto-NervaUnits, with several narrower and more intense bandsof maxima on top, which delineate either structurallimits and/or elongated outcrops of mafic volcanites.An arcuated band of prominent maxima is spatiallycoincident with the long wavelength gravity mini-mum that characterises Concepción Unit. Magneticanomalies constitute a good tool for mapping theferromagnetic basic materials, clearly suggesting thefull extension of basaltic-diabase sills and jasperoccurrences only partially represented in the geologi-cal map. Paramagnetic felsic volcanites and metase-dimentary materials produce magnetic lows.
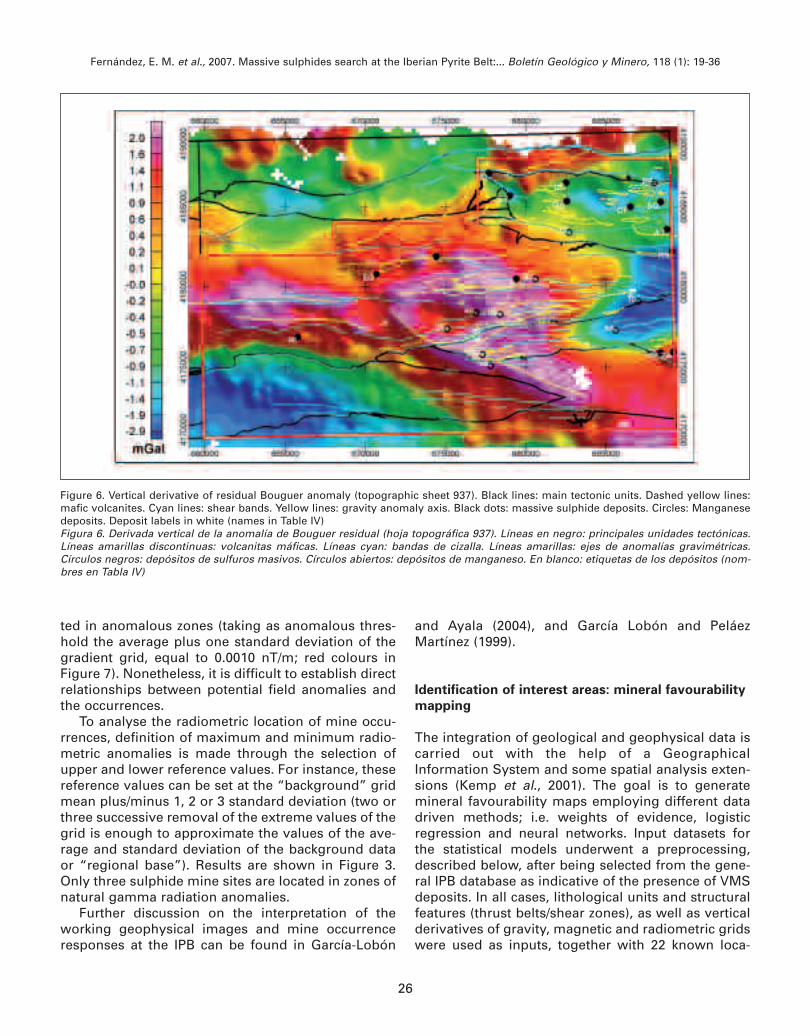
As measured gravity data points are spaced some0.5-1.0 km, and grid cell size is 0.5 km, vertical deriva-tive of the residual Bouguer anomaly contains shortwavelength (less than 4 km) anomalous responseseither from near surface mafic volcanic axes or fromnot very deep buried bodies that may have mininginterest (Figure 6). In the latter case we can observethat some maxima of wavelengths around or lessthan 2 km are associated to known mineral deposits.
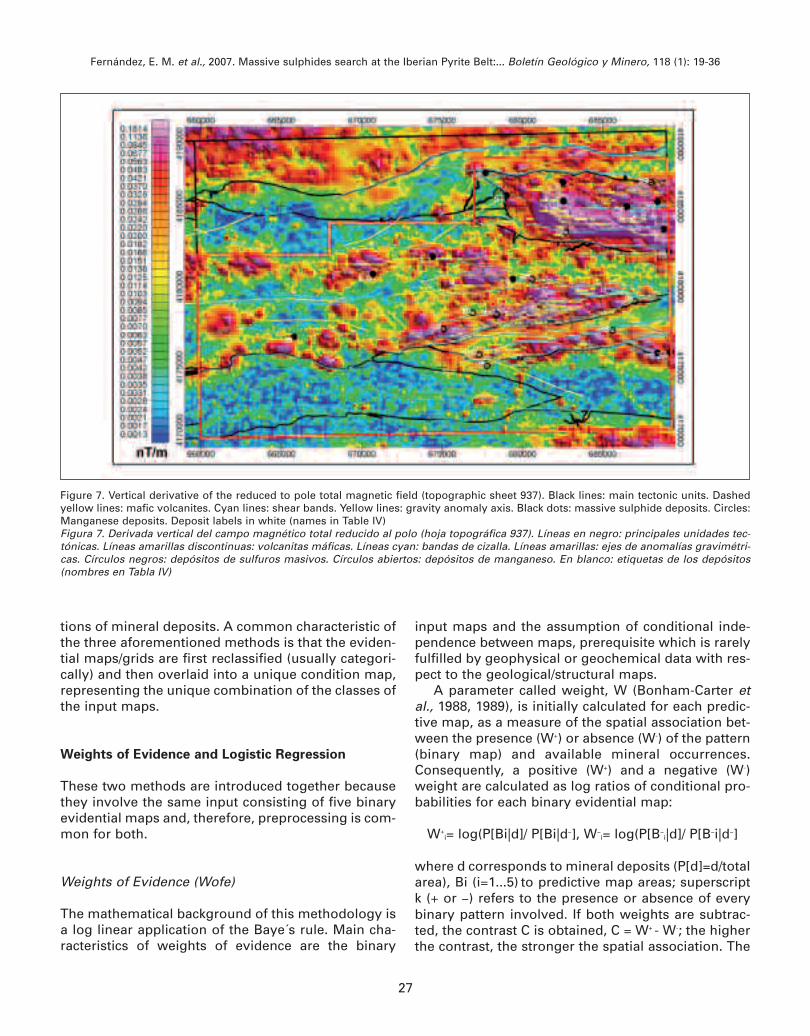
The vertical derivative of the reduced to pole totalmagnetic field shows a good correlation with mainbasic volcanic outcroppings, structural limits andshear zones (Figure 7). This image is more difficult tointerpret in terms of local anomalies of mining inte-rest, due to the masking effect of mafic volcanics thatproduce responses of wavelength greater than 2 km.
Most of the massive sulphide occurrences (9 out of14) are located in areas of vertical gradient gravityanomalies (taking as anomalous threshold the meanplus one standard deviation of the gradient grid,equal to 0.0011 mGal/m). In the case of the magneticvertical gradient, all the occurrences but one are loca-
Figure 5. Reduced to pole total magnetic field (topographic sheet 937). Black lines: main tectonic units. Dashed yellow lines: mafic vol-canites. Cyan lines: shear bands. Yellow lines: gravity anomaly axis. Black dots: massive sulphide deposits. Circles: Manganese deposits.Deposit labels in white (names in Table IV)Figura 5. Campo total reducido al polo (hoja topográfica 937). Líneas en negro: principales unidades tectónicas. Líneas amarillas discon-tinuas: volcanitas máficas. Líneas cyan: bandas de cizalla. Líneas amarillas: ejes de anomalías gravimétricas. Círculos negros: depósitosde sulfuros masivos. Círculos abiertos: depósitos de manganeso. En blanco: etiquetas de los depósitos (nombres en Tabla IV)
Fernández, E. M. et al., 2007. Massive sulphides search at the Iberian Pyrite Belt:... Boletín Geológico y Minero, 118 (1): 19-36
26
ted in anomalous zones (taking as anomalous thres-hold the average plus one standard deviation of thegradient grid, equal to 0.0010 nT/m; red colours inFigure 7). Nonetheless, it is difficult to establish directrelationships between potential field anomalies andthe occurrences.
To analyse the radiometric location of mine occu-rrences, definition of maximum and minimum radio-metric anomalies is made through the selection ofupper and lower reference values. For instance, thesereference values can be set at the “background” gridmean plus/minus 1, 2 or 3 standard deviation (two orthree successive removal of the extreme values of thegrid is enough to approximate the values of the ave-rage and standard deviation of the background dataor “regional base”). Results are shown in Figure 3.Only three sulphide mine sites are located in zones ofnatural gamma radiation anomalies.
Further discussion on the interpretation of theworking geophysical images and mine occurrenceresponses at the IPB can be found in García-Lobón
and Ayala (2004), and García Lobón and PeláezMartínez (1999).
Identification of interest areas: mineral favourabilitymapping
The integration of geological and geophysical data iscarried out with the help of a GeographicalInformation System and some spatial analysis exten-sions (Kemp et al., 2001). The goal is to generatemineral favourability maps employing different datadriven methods; i.e. weights of evidence, logisticregression and neural networks. Input datasets forthe statistical models underwent a preprocessing,described below, after being selected from the gene-ral IPB database as indicative of the presence of VMSdeposits. In all cases, lithological units and structuralfeatures (thrust belts/shear zones), as well as verticalderivatives of gravity, magnetic and radiometric gridswere used as inputs, together with 22 known loca-
Figure 6. Vertical derivative of residual Bouguer anomaly (topographic sheet 937). Black lines: main tectonic units. Dashed yellow lines:mafic volcanites. Cyan lines: shear bands. Yellow lines: gravity anomaly axis. Black dots: massive sulphide deposits. Circles: Manganesedeposits. Deposit labels in white (names in Table IV)Figura 6. Derivada vertical de la anomalía de Bouguer residual (hoja topográfica 937). Líneas en negro: principales unidades tectónicas.Líneas amarillas discontinuas: volcanitas máficas. Líneas cyan: bandas de cizalla. Líneas amarillas: ejes de anomalías gravimétricas.Círculos negros: depósitos de sulfuros masivos. Círculos abiertos: depósitos de manganeso. En blanco: etiquetas de los depósitos (nom-bres en Tabla IV)
Fernández, E. M. et al., 2007. Massive sulphides search at the Iberian Pyrite Belt:... Boletín Geológico y Minero, 118 (1): 19-36
27
tions of mineral deposits. A common characteristic ofthe three aforementioned methods is that the eviden-tial maps/grids are first reclassified (usually categori-cally) and then overlaid into a unique condition map,representing the unique combination of the classes ofthe input maps.
Weights of Evidence and Logistic Regression
These two methods are introduced together becausethey involve the same input consisting of five binaryevidential maps and, therefore, preprocessing is com-mon for both.
Weights of Evidence (Wofe)
The mathematical background of this methodology isa log linear application of the Baye´s rule. Main cha-racteristics of weights of evidence are the binary
input maps and the assumption of conditional inde-pendence between maps, prerequisite which is rarelyfulfilled by geophysical or geochemical data with res-pect to the geological/structural maps.
A parameter called weight, W (Bonham-Carter etal., 1988, 1989), is initially calculated for each predic-tive map, as a measure of the spatial association bet-ween the presence (W+) or absence (W-) of the pattern(binary map) and available mineral occurrences.Consequently, a positive (W+) and a negative (W-)weight are calculated as log ratios of conditional pro-babilities for each binary evidential map:
W+i= log(P[Bi|d]/ P[Bi|d−], W−
i= log(P[B−i|d]/ P[B−i|d−]
where d corresponds to mineral deposits (P[d]=d/totalarea), Bi (i=1...5) to predictive map areas; superscriptk (+ or −) refers to the presence or absence of everybinary pattern involved. If both weights are subtrac-ted, the contrast C is obtained, C = W+ - W-; the higherthe contrast, the stronger the spatial association. The
Figure 7. Vertical derivative of the reduced to pole total magnetic field (topographic sheet 937). Black lines: main tectonic units. Dashedyellow lines: mafic volcanites. Cyan lines: shear bands. Yellow lines: gravity anomaly axis. Black dots: massive sulphide deposits. Circles:Manganese deposits. Deposit labels in white (names in Table IV)Figura 7. Derivada vertical del campo magnético total reducido al polo (hoja topográfica 937). Líneas en negro: principales unidades tec-tónicas. Líneas amarillas discontinuas: volcanitas máficas. Líneas cyan: bandas de cizalla. Líneas amarillas: ejes de anomalías gravimétri-cas. Círculos negros: depósitos de sulfuros masivos. Círculos abiertos: depósitos de manganeso. En blanco: etiquetas de los depósitos(nombres en Tabla IV)
Fernández, E. M. et al., 2007. Massive sulphides search at the Iberian Pyrite Belt:... Boletín Geológico y Minero, 118 (1): 19-36
28
pairwise ¯2 test can be calculated to check if the requi-site of conditional independence is violated (in caseof a strong conditional dependency, the theme shouldbe excluded of the evidential map set).
The combination of five binary evidential mapsresults into a set of unique conditions (with up to 25
classes, or feature vectors). Using Baye´s rule, a pos-terior probability value p,
p=p[d|B1k?B2
k?B3k?B4
k?B5k],
is calculated for each input feature vector:
log(p/(1-p))=log(P[d]/(1-P[d]))+™5i=1Wk
i
Logistic Regression (LR)
This method applies regression equations to evaluatethe degree of correlation existing between the varia-bles of the model. It is a log linear method as well,and results are similar to those yielded by weights ofevidence. However, no assumption of conditionalindependence is required between input data.
A regression analysis Y=b0 + b1 X1 + ...........+ bn Xnhas two main parts:
The dependent variable Y is the predictive pheno-menon. In our case it refers to deposit occurrences.
The independent variables X1…Xn or known attri-butes are the evidential maps.
Correlation coefficients bo….....bn are calculatedfor every evidential map. These coefficients quantifythe strength of the spatial association between inputsand mineral deposits. As a result, binary predictorthemes can be arranged decreasingly according to itsspatial association with mineral deposits. In our casethe order is: shear zones, magnetic and gravity fields(vertical derivatives), lithology and radiometric ima-ges. Finally, posterior probability values are calcula-ted for the unique conditions obtaining the favourabi-lity map:
log (p/1-p)=b0 + b1 X1 + ...........+ bn Xn
Model generation
The five predictive maps selected for the applicationof Wofe and LR in the in the Northwestern Domain ofIPB were reclassified into binary maps following thecriteria of maximizing the contrast, to assure thestrongest spatial association between binary mapsand training points (known mine sites). Several trialswere carried out to obtain the binary maps. For exam-
ple, shear zones (available in digitized form from thegeological MAGNA 1:25,000 series) were successi-vely buffered at distances of 100, 150, 200, 250 and300 m. After calculation of contrasts C, it was conclu-ded that the 100 m buffer distance maximized thisparameter; so it was selected as the shear band pre-dictive binary map (100 m buffer area = class 2, restof the map = class 1). Criteria applied for preparingthe binary lithology map (digital MAGNA 937,1:50,000 sheet) were: class 2 = presence of VSC rocks,class 1 = VSC absent. For vertical derivatives of thegeophysical grids, criteria were: class 2 = grid values> mean + 1 standard deviation, class 1 = rest of grid.The binary maps resulting of this process were usedto calculate the posterior probability values usingWofe and LR mathematics.
Neural network method (RBFLN algorithm)
Artificial neural networks can be classified in twomain sets concerning the type of training: in the unsu-pervised training the neural network learns by statis-tical patterns intrinsic to the data; supervised trainingmeans that the neural network learns by examples ofinput data where the characteristic parameter (pre-sence or absence of mineral deposits) is known.
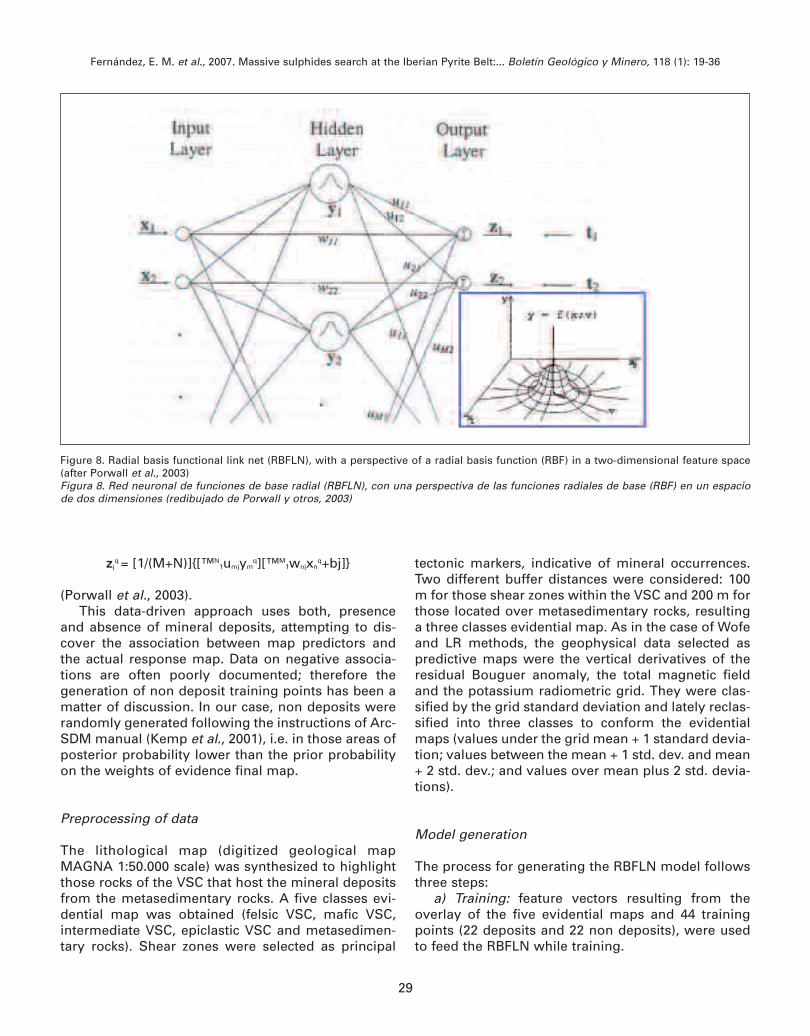
In this study we have selected a supervised trai-ning algorithm called radial basis functional link net(RBFLN) already used for mineral resources assess-ment in several works (e.g. Looney, 2002; Porwall etal., 2003; Behnia and Deren, 2005). This feedforwardnetwork has a three-layer structure comprising theinput, hidden and output layers. Each node of the hid-den layer, also called neuron, is a radial basis function(RBF) which is a Gaussian function with a center vec-tor v and a spread parameter σ that processes anyinput vector x by (Figure 8)
y=f(x, v)=e[ - ||x-v||2/2Û2]
The name radial indicates that all points x equidis-tant from v yield the same value y. The network is trai-ned by an back-propagation error processing with anumber of deposit and non deposit training vectorsxi, which means an iterative adjustment until theweights at the neurons (umj, wnj) force the outputs z toapproximate their targets t very closely. This ismathematically represented by minimizing the totalsum of squared error
E=™(q=1,Q) ™(j=1,J)(tjq- zj
q)2
Outputs are obtained by
Fernández, E. M. et al., 2007. Massive sulphides search at the Iberian Pyrite Belt:... Boletín Geológico y Minero, 118 (1): 19-36
29
zjq = [1/(M+N)]{[™N
1umjymq][™M
1wnjxnq+bj]}
(Porwall et al., 2003).This data-driven approach uses both, presence
and absence of mineral deposits, attempting to dis-cover the association between map predictors andthe actual response map. Data on negative associa-tions are often poorly documented; therefore thegeneration of non deposit training points has been amatter of discussion. In our case, non deposits wererandomly generated following the instructions of Arc-SDM manual (Kemp et al., 2001), i.e. in those areas ofposterior probability lower than the prior probabilityon the weights of evidence final map.
Preprocessing of data
The lithological map (digitized geological mapMAGNA 1:50.000 scale) was synthesized to highlightthose rocks of the VSC that host the mineral depositsfrom the metasedimentary rocks. A five classes evi-dential map was obtained (felsic VSC, mafic VSC,intermediate VSC, epiclastic VSC and metasedimen-tary rocks). Shear zones were selected as principal
tectonic markers, indicative of mineral occurrences.Two different buffer distances were considered: 100m for those shear zones within the VSC and 200 m forthose located over metasedimentary rocks, resultinga three classes evidential map. As in the case of Wofeand LR methods, the geophysical data selected aspredictive maps were the vertical derivatives of theresidual Bouguer anomaly, the total magnetic fieldand the potassium radiometric grid. They were clas-sified by the grid standard deviation and lately reclas-sified into three classes to conform the evidentialmaps (values under the grid mean + 1 standard devia-tion; values between the mean + 1 std. dev. and mean+ 2 std. dev.; and values over mean plus 2 std. devia-tions).
Model generation
The process for generating the RBFLN model followsthree steps:
a) Training: feature vectors resulting from theoverlay of the five evidential maps and 44 trainingpoints (22 deposits and 22 non deposits), were usedto feed the RBFLN while training.
Figure 8. Radial basis functional link net (RBFLN), with a perspective of a radial basis function (RBF) in a two-dimensional feature space(after Porwall et al., 2003)Figura 8. Red neuronal de funciones de base radial (RBFLN), con una perspectiva de las funciones radiales de base (RBF) en un espaciode dos dimensiones (redibujado de Porwall y otros, 2003)

In the general methodology, the set of trainingvectors xi is assigned to a binary target output to indi-cate the presence of deposits (1) or non deposits (0).This means that training vectors labelled as 1, can berandomly divided in two subsets: training and testingsets. Training vectors labelled as 0 can also be dividedinto a training and a testing set. Masters (1993)recommends the use of three sets (deposit trainingand testing, non-deposit training) to avoid overlear-ning. In this study we have employed three sets dueto the small number of available deposit vectors.
b) Test: when the procedure is effective, trainingparameters are applied to the testing set, to validatethe network behaviour.
c) Classify: after training, the network recognisesthe presence or absence of mineral deposits and as aresult it can be used for classifying the whole featurevector space (of 274 elements in our case). The clas-sification sum of squared error (SSE) depends onhow well deposits and non deposits are distributedalong the study area (Behnia and Deren, 2005).
Results
The three employed methods offer results of similarpattern. This can be observed in the Figure 9 whereall histograms have a 3-fold mode, close to posteriorprobabilities of 0.02, 0.16 and 0.4 for Wofe; 3%, 16%and 22% for LR; and predictive classification (patternmembership) values of 0.35, 0.6 and 0.9 in the case ofRBFLN.
Values exceeding the highest modes can be inter-
preted as representing the most favourable areas ineach case (some 5%, 4%, and 5% of the total area forWofe, LR and RBFLN, respectively).
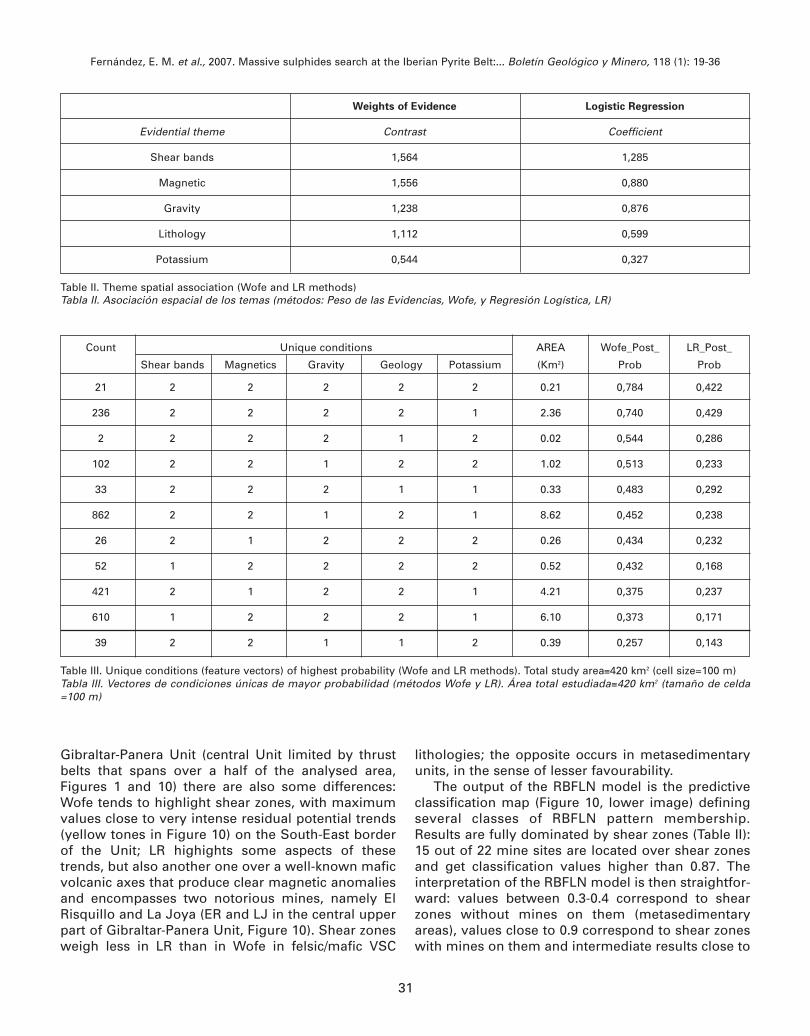
Wofe and LR spatial association values fall withinusual ranges (Bonham-Carter et al., 1988, 1989) (con-trast C = W+ - W- is only low in the case of the potas-sium grid, Table II).
Table III shows the feature vectors of highest pro-bability (there are 31 different spatial combinationsbetween the binary maps): data are ordered byWofe_Posterior_Probability value. The columns appe-ar from right to left with diminishing significance forhighest Wofe results (from binary buffered shearzones to binary potassium grid values, through mag-netics, gravity and geology). Wofe values higher than0.37 represents 5.7% of the total analysed area; LRvalues higher than 0.23 represents the 4.03%.
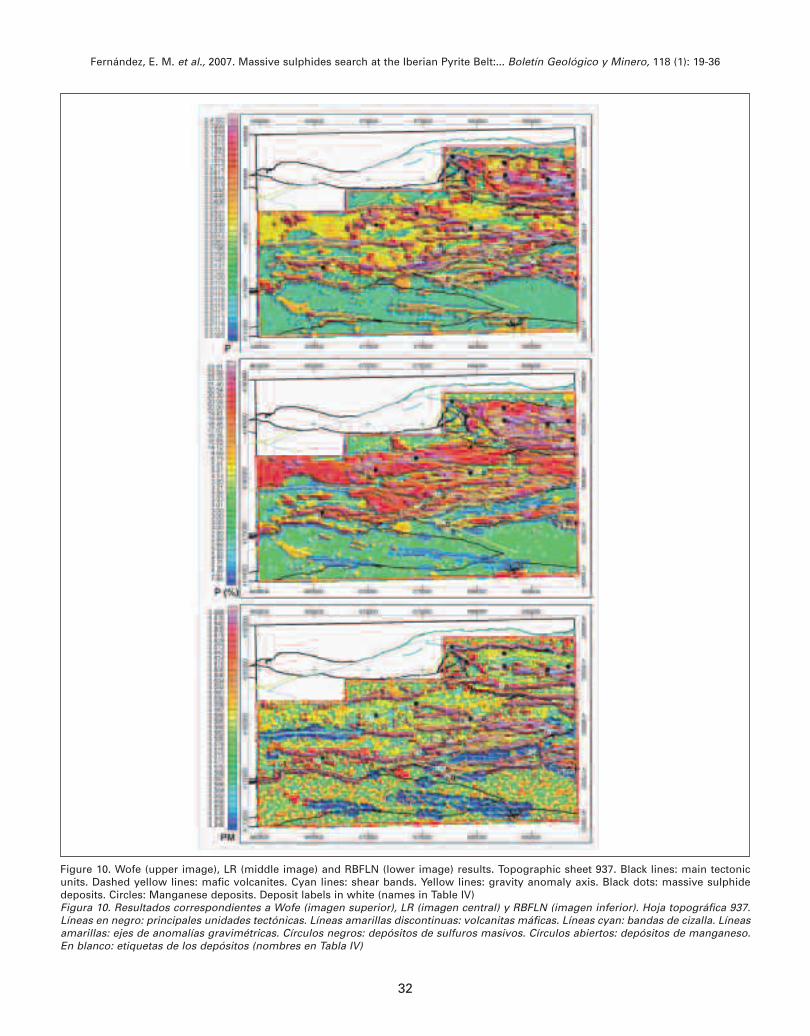
Predictive maps with the distribution of posteriorprobabilities are shown in Figure 10.
Wofe and LR results are favoured by the occurren-ce of VSC rocks (Figure 10), which, as expected, arevery well mapped by the two methods (the VSCcorresponds with intermediate through high favoura-bility values). Areas of felsic VSC displaying potentialfield anomalies are highlighted by both, Wofe and LR,especially in the case of Concepción Unit (upper-rightcorner Unit in figures 1 and 10, with the highest minesite concentration, where mining research programsare still being run). However, some differences can beobserved: maximum Wofe values appear over centralshear zones of Concepción Unit, while LR maximaappear aside these bands.
Within intermediate and mafic VSC rocks of
Fernández, E. M. et al., 2007. Massive sulphides search at the Iberian Pyrite Belt:... Boletín Geológico y Minero, 118 (1): 19-36
30
Figure 9. Left to right: Wofe, LR and RBFLN histogramsFigura 9. De derecha a izquierda: histogramas correspondientes a Wofe, LR y RBFLN
Fernández, E. M. et al., 2007. Massive sulphides search at the Iberian Pyrite Belt:... Boletín Geológico y Minero, 118 (1): 19-36
31
Gibraltar-Panera Unit (central Unit limited by thrustbelts that spans over a half of the analysed area,Figures 1 and 10) there are also some differences:Wofe tends to highlight shear zones, with maximumvalues close to very intense residual potential trends(yellow tones in Figure 10) on the South-East borderof the Unit; LR highights some aspects of thesetrends, but also another one over a well-known maficvolcanic axes that produce clear magnetic anomaliesand encompasses two notorious mines, namely ElRisquillo and La Joya (ER and LJ in the central upperpart of Gibraltar-Panera Unit, Figure 10). Shear zonesweigh less in LR than in Wofe in felsic/mafic VSC
lithologies; the opposite occurs in metasedimentaryunits, in the sense of lesser favourability.
The output of the RBFLN model is the predictiveclassification map (Figure 10, lower image) definingseveral classes of RBFLN pattern membership.Results are fully dominated by shear zones (Table II):15 out of 22 mine sites are located over shear zonesand get classification values higher than 0.87. Theinterpretation of the RBFLN model is then straightfor-ward: values between 0.3-0.4 correspond to shearzones without mines on them (metasedimentaryareas), values close to 0.9 correspond to shear zoneswith mines on them and intermediate results close to
Weights of Evidence Logistic Regression
Evidential theme Contrast Coefficient
Shear bands 1,564 1,285
Magnetic 1,556 0,880
Gravity 1,238 0,876
Lithology 1,112 0,599
Potassium 0,544 0,327
Table II. Theme spatial association (Wofe and LR methods)Tabla II. Asociación espacial de los temas (métodos: Peso de las Evidencias, Wofe, y Regresión Logística, LR)
Count Unique conditions AREA Wofe_Post_ LR_Post_
Shear bands Magnetics Gravity Geology Potassium (Km2) Prob Prob
21 2 2 2 2 2 0.21 0,784 0,422
236 2 2 2 2 1 2.36 0,740 0,429
2 2 2 2 1 2 0.02 0,544 0,286
102 2 2 1 2 2 1.02 0,513 0,233
33 2 2 2 1 1 0.33 0,483 0,292
862 2 2 1 2 1 8.62 0,452 0,238
26 2 1 2 2 2 0.26 0,434 0,232
52 1 2 2 2 2 0.52 0,432 0,168
421 2 1 2 2 1 4.21 0,375 0,237
610 1 2 2 2 1 6.10 0,373 0,171
39 2 2 1 1 2 0.39 0,257 0,143
Table III. Unique conditions (feature vectors) of highest probability (Wofe and LR methods). Total study area≅420 km2 (cell size=100 m)Tabla III. Vectores de condiciones únicas de mayor probabilidad (métodos Wofe y LR). Área total estudiada≅420 km2 (tamaño de celda=100 m)
Fernández, E. M. et al., 2007. Massive sulphides search at the Iberian Pyrite Belt:... Boletín Geológico y Minero, 118 (1): 19-36
32
Figure 10. Wofe (upper image), LR (middle image) and RBFLN (lower image) results. Topographic sheet 937. Black lines: main tectonicunits. Dashed yellow lines: mafic volcanites. Cyan lines: shear bands. Yellow lines: gravity anomaly axis. Black dots: massive sulphidedeposits. Circles: Manganese deposits. Deposit labels in white (names in Table IV)Figura 10. Resultados correspondientes a Wofe (imagen superior), LR (imagen central) y RBFLN (imagen inferior). Hoja topográfica 937.Líneas en negro: principales unidades tectónicas. Líneas amarillas discontinuas: volcanitas máficas. Líneas cyan: bandas de cizalla. Líneasamarillas: ejes de anomalías gravimétricas. Círculos negros: depósitos de sulfuros masivos. Círculos abiertos: depósitos de manganeso.En blanco: etiquetas de los depósitos (nombres en Tabla IV)

Fernández, E. M. et al., 2007. Massive sulphides search at the Iberian Pyrite Belt:... Boletín Geológico y Minero, 118 (1): 19-36
33
0.6 represent indifferent areas. These facts are irres-pective of the mine situation within the potential fieldanomalies; VSC outcrops or potential field anomalyaxes do not influence RBFLN results.
Table IV presents mineral deposits and theirgeophysical and algorithmic method responses.
Table IV shows that in the case of VMS deposits,64% of the mineral deposits are located in gravity
X_UTM Y_UTM SITE C Su Un SB G M ET W_PPr LR_PPr Rbfln_PM
688800 4183600 Aguas Teñidas Ep S CO x x x AT 0.740 0.429 0.988
689200 4175950 La Zarza Ep S RT x x x ZA 0.740 0.429 1.016
688400 4175900 Perrunal Ep S RT x x x PE 0.740 0.429 0.913
679000 4185700 San Telmo Ep S CO x x x ST 0.165 0.145 0.988
674400 4181900 La Joya Vb S GP x x x LJ 0.373 0.171 0.975
682500 4186500 Lomero-Poyatos FA S CO - - x LP 0.147 0.079 0.586
689100 4182200 Romanita Ep S CO x - x RN 0.513 0.233 0.879
686500 4185000 Confesionarios Ep S CO x x x CF 0.375 0.237 0.988
688400 4185300 Sorpresa Ep S CO x x x SO 0.111 0.079 0.976
670700 4180800 El Risquillo FA S GP - - x ER 0.035 0.034 0.562
665800 4176900 La Rica Ep S GP - x x RI 0.011 0.019 0.564
682550 4185350 La Gallega Ep S CO x x x GA 0.452 0.238 0.873
677700 4187100 El Carpio Ep S CO x - x EC 0.148 0.114 0.881
679400 4180500 Lancha-Roma Ep S GP x - x LR 0.148 0.114 0.995
682700 4183400 Cicerón Pz Mn CO x x x ci 0,452 0,238 0,988
688000 4186500 Palomera Pz Mn CO x - x pa 0,182 0,112 0,979
678400 4178300 Bodegón Ep Mn GP - - x bo 0,147 0,079 0,582
680600 4180500 Adelfitas Pz Mn GP x x x ad 0,054 0,066 0,882
675100 4177400 Guerra Ep Mn GP - x x fo 0,375 0,237 0,556
687000 4179100 Fontanilla Pz Mn GP x - - fo 0,054 0,066 1,028
676900 4178400 Ángel Pz Mn GP - - x an 0,012 0,019 0,591
677300 4175800 Madroñosa Vb Mn RT - - x ma 0,147 0,079 0,590
Table IV. Characteristics of mine sites used within the data driven methods framework. C: host rock (felsic epiclastites, Ep; shales, Pz; maficvolcanites Vb; Andesitic Fm., FA). Su: ore type (S: sulphides, Mn: manganese). Un: tectonic unit (CO Concepción, GP Gibraltar-Panera, RTRío Tinto). SB: mine site associated to shear band (11 out of 14 VMS sites; 4 out of 8 Mn sites). G/M: occurrence of gravimetric/ magneticvertical gradient anomaly (site values> grid mean + 1 std dev). ET: deposit label in figures 4, 5, etc. W_PPr, LR_PPr : posterior probabili-ties for Weights of Evidence and Logistic Regression. Rbfln_PM: RBFLN pattern membership valueTabla IV. Características de las minas utilizadas en los métodos estudiados. C: roca encajante (epiclastitas félsicas, Ep; pizarras, Pz; volca-nitas máficas, Vb; Formación Andesítica, FA). Su: sustancia (S: sulfuros; Mn: manganeso). Un: unidad tectónica (CO: Concepción; GP:Gibraltar-Panera, RT: Río Tinto). SB: mina asociada a banda de cizalla (11 de catorce depósitos de sulfuros masivos; 4 de 8 depósitos demanganeso). G/M: anomalía de gradiente vertical gravimétrico/magnético (valores > media de la malla + 1 desv. std.). ET: etiquetas de losdepósitos correspondientes a las figuras 4, 5, 6, 7, 10. W_PPr, LR_PPr: probabilidades a posteriori para los métodos Pesos de las Evidencias(Wofe) y Regresión Logística (LR). Rbfln_P: clasificación predictiva para el método Red neuronal de funciones de bases radiales (RBFLN)

anomaly areas, 100% in magnetic anomaly areas, and50% in high favourability areas of the mineral poten-tial map for Wofe and LR, and 79% for RBFLN.
In summary, most favourable zones defined by theused algorithmic mapping methods (Wofe, LR andRBFLN) amount to a similar percentage of the totalinvestigated area (5%). In the case of RBFLN models,these most prospective zones strictly coincide withstructural boundaries, thrust or shear zones. In thecase of Wofe and LR models, favourable zones aredirectly related to these limits where they producepotential field anomalies. Consequently, areas closeto shear zones in felsic VSC are highlighted by the lat-ter, especially in the case of Concepción Unit, wherepotential anomalies are abundant. Outside felsicareas, some volcanic axes show enhanced Wofe andLR results. At the opposite extreme, most unfavoura-ble zones correspond to shear zones in metasedi-mentary areas.
Conclusions
Main geophysical conclusions can be summarized asfollows:
1) Structural imbrication of igneous (felsic-mafic)and metasedimentary units originates the recordedanomalous responses of potential fields (Figures 4and 5). High resolution gravity and magnetic map-ping in the NW domain of the IPB constitutes an exce-llent example of the advantage of using potentialfields to map volcanic areas.
2) Potential field data provide clear evidence of therelationship between mineral deposits and structuralboundaries (thrust or shear zones), within whose vici-nity the former take place in most of cases.
3) In the NW domain of the IPB, high amplitude(tens to hundreds of nT and 1-3 mGal) long (λ>4 km)and intermediate (4 km>λ>2 km) wavelength magne-tic and gravimetric anomalies can be mainly attribu-ted to basaltic or intermediate rocks (the latter, withonly gravity effects). Most of volcanic massive sulphi-de deposits appear over anomalous potential fieldareas of complex origin, where long and intermedia-te wavelength anomalies mask local responses (offew tens of nT and 0.5-1 mGal).
4) The most conspicuous short wavelength mag-netic and gravimetric anomalies (λ<2 km; anomaliesisolated by means of wavelength filtering) take placealong the gravity axis originated from mafic volcani-tes and structural axes of the area. Gravity filteredimages contain important families of short wave-length anomalies less related to mafic volcanites andstructural bands than magnetic images.
Ferromagnetic jaspers of CVS produce high amplitu-de, short wavelength magnetic anomalies that pointout the occurrence of highly prospective volcanic andepiclastic rocks under the sedimentary cover.
5) A remarkable feature of radiometric data refersto extreme values, with spectacular potassificationsoccurring in rhyolites and acid tuffs located close tothrust limits and shear zones, that clearly controlthem.
6 A compact set of physical properties is now avai-lable for the geological interpretation of airborne andground surveys in a characteristic mining area. Thepetrophysical database constitutes an outstandingreference for any study and modelling of the rocks inthe NW Domain of IPB by means of natural gammaradiation and potential fields.
Concerning the combined use of favourabilitymapping techniques and geophysical images, themain conclusions are:
1) Results of predictive mapping methods (Wofe,LR and RBFLN) reflect the fact that most of the depo-sits (70 %) are structurally controlled by thrust orshear zones, so these structural boundaries are theprospective areas highlighted by all the algorithmicmethods we have employed. This does not add verymuch to what is already known in the study area. Asthe methods are data driven, based on deposit andnon deposit training points, some inconveniencesmust be borne in mind, as the criterion of generatingnon-deposits in the RBFLN method (based on theposterior probability obtained by Wofe), or the num-ber and quality distribution of available mine sites (areduced number of deposit locations in the featurespace could imply overfitting, that seems to havebeen the case of RBFLN results).
2) Away from structural boundaries, the spatialassociation of the used themes with respect to thetraining points can be described as moderate. SomeWofe and LR results, enlarging the influence area ofsome well-known mineralized axes, offer more inte-resting details than RBFLNs. The validations of themodels are acceptable: in the final maps more than ahalf of the VMS deposits can be found in areas of highfavourability.
3) Geophysical responses, especially magneticones, are not selective enough as to characterisemine areas when the structural control is absent. Thespatial association between geophysical anomaliesand mine sites could be improved by airborne resisti-vity coverages, but these are not yet available in thestudy area.
4) Radiometric images (total counts, potassium,and thorium) are not useful inputs to feed the neural,Wofe and LR systems. Radiometric high spots (potas-
Fernández, E. M. et al., 2007. Massive sulphides search at the Iberian Pyrite Belt:... Boletín Geológico y Minero, 118 (1): 19-36
34

Fernández, E. M. et al., 2007. Massive sulphides search at the Iberian Pyrite Belt:... Boletín Geológico y Minero, 118 (1): 19-36
35
sium, thorium) do not show a close spatial relation tomineral occurrences. However, ultrapotassificationsconstitute a good guide of VMS deposit prospectivityas they indicate fertile shear zones.
Acknowledgements
The present work is a contribution to a regional pro-ject on massive sulphides search in the NW Domainof the Iberian Pyrite Belt carried out by an IGME wor-king group during 2002-2005, coordinated byAlejandro Sánchez, to whom we are in debt. CecilioQuesada, Félix Bellido and Pablo Gumiel are thankedfor their thoughtful comments and valuable contribu-tions, which have helped to improve this paper.
References
Bates, M. y García Lobón, J. L. (1998). Exploración aero-magnética y radiométrica de la Faja Pirítica y zonas limí-trofes. Fondo documental del IGME, Informe 40464.Madrid.
Behnia, P.; and Deren, L., 2005. Application of Radial BasisFunctional Link Networks to Mineral Potential Mappingof Proterozoic Mineralization in Saghand-ChadormaluArea, Central Iran. Proceedings of IAMG´05, 1, 523-528
Bonham-Carter, G. F., Agterberg, F. P., and Wright, D. F.,1988. Integration of Geological Datasets for GoldExploration in Nova Scotia. Photogrammettry andRemote Sensing, 54, 1585-1592.
Bonham-Carter, G. F., Agterberg, F. P., and Wright, D. F.,1989. Weights of evidence modelling: a new approach tomapping mineral potential. Geological Survey ofCanada, Paper 89-9, 171-183.
Chiozzi, P., Pasquale, V., y Verdoya, M., 1998. Ground
radiometric survey of U, Th y K on the Lipari Island, Italy.Journal of Applied Geophysics, 38: 209-217.
Exploranium (1998). GR-320. Portable gamma ray spectro-meter users manual. 73 p.
García Lobón, J. L., y Peláez Martínez, A. (1999). Cartografíageofísica y situación de indicios mineros respecto deanomalías magnéticas, radiométricas y gravimétricasen cuatro áreas de la Faja Pirítica. Boletín Geológico yMinero, 110 (6): 715-738.
García-Lobón, J.L. and Ayala, C., 2004, Petrofísica,Aeromagnetismo, Radiometría y Gravimetría:Exploración Regional y Delimitación de ZonasAnómalas en el Dominio Noroccidental de la FajaPirírica. IGME Technical Report 589 (In Spanish). CD-Rom 157
Gumiel Martínez, P. y Mirete Mayo, S., 1999. Los yacimien-tos de sulfuros de la Faja Pirítica. Colección PatrimonioGeológico De Andalucía, pp. 224-229, ISBN: 84-931224-0-8
Junta de Andalucía, 2002. Proyecto de InvestigaciónGeológica y Cartografía Básica en la Faja Pirítica y ÁreasAledañas. 1998-2000.
Kemp, L.D., Bonham-Carter,G.F., Raines,G.L., and Looney,C.G., 2001. Arc-SDM: Arc-View extension for spatial datamodelling using weights of evidence, logistic regres-sion, fuzzy logic and neural network analysis, http://net-serv.gis.nrcan.gc.ca/sdm/.
Leistel, E. Marcoux, D. Thiéblemont, C. Quesada, A.Sánchez, G. R. Almodóvar, E. Pascual and R. Sáez., 1997.The volcanic-hosted massive sulphide deposits of theIberian Pyrite Belt. Journal Mineralium Deposita. IssueVolume 33, Numbers 1-2
Looney, C. G., 2002, Radial basis functional link nets andfuzzy reasoning. Neurocomputing, 43, 489-509.
Masters, T. 1993. Practical neural network recipes in C++.Academic Press, Inc. 493 p.
Porwal, A., Carranza, E.J.M., and Hale, M., 2003, ArtificialNeural networks for mineral-potential mapping: A casestudy from Aravalli province, western India. Naturalresources research, 12 (3), 155-171
Recibido: mayo 2006Aceptado: febrero 2007