estudos sobre a sismicidade de caraíbas-itacarambi, minas...
TRANSCRIPT

UNIVERSIDADE DE BRASÍLIA – INSTITUTO DE GEOCIÊNCIAS
CURSO DE PÓS-GRADUAÇÃO EM GEOLOGIA
TESE DE DOUTORADO N° 111
Estudos sobre a sismicidade de Caraíbas-Itacarambi, Minas Gerais: causas e características
Área de concentração: Geologia Regional
CRISTIANO NAIBERT CHIMPLIGANOND
Orientador: Prof. Dr. George Sand Leão Araújo de França (Universidade de Brasília)
Co-orientador: PhD Zaher Hossein Shomali (Uppsala Universitet)
Brasília DF
2013

Universidade de Brasília Instituto de Geociências
Estudos sobre a sismicidade de Caraíbas-Itacarambi, Minas Gerais: causas e
características
Autor* Cristiano Naibert Chimpliganond
Orientador: Prof. Dr. George Sand Leão Araújo de França (Univ. de Brasília – Brasil)
Co-orientador: PhD Zaher Hossein Shomali (Uppsala Universitet – Suécia)
Tese apresentada ao Instituto de Geociências da Universidade de Brasília, para a obtenção do título de Doutor em Geologia, na área de Geologia Regional.
Brasília DF 2013
* Este trabalho contou com apoio financeiro do CNPq.

Cristiano Naibert Chimpliganond
Estudos sobre a sismicidade de Caraíbas-Itacarambi, Minas Gerais: causas e
características Tese apresentada ao Instituto de Geociências da Universidade de Brasília, para a obtenção do título de Doutor em Geologia, na área de Geologia Regional. Autor: Cristiano Naibert Chimpliganond Orientador: Prof. Dr. George Sand Leão Araújo de França (Univ. de Brasília) Co-orientador: PhD Zaher Hossein Shomali (Uppsala Universitet)
Brasília DF 2013

Chimpliganond, Cristiano Naibert.
Estudos sobre a sismicidade de Caraíbas-Itacarambi, Minas Gerais: causas e características 100 páginas Tese de Doutorado – Instituto de Geociências da Universidade
de Brasília. Observatório Sismológico
1. Sismicidade Intraplaca 2. Inversão de Forma de onda 3. Tensor Momento Sísmico 4. Cráton São Francisco
I. Universidade de Brasília. Instituto de Geociências. Observatório Sismológico
Comissão Julgadora:
Prof. Dr. George Sand Leão Araújo de França
Prof. Dr. João Willy Corrêa Rosa
Prof. Dr. Marcelo Peres Rocha
Prof. Dr. Joaquim Mendes Ferreira
PhD Stéphane Drouet

DEDICATÓRIA
Dedico este trabalho à minha esposa Mônica, minha filha Taís e meu filho Júlio.
Em memória de Jeissiane Oliveira da Silva
(vítima do terremoto de Caraíbas-Itacarambi de 9 de dezembro de 2007).

AGRADECIMENTOS
Gostaria de registrar aqui meus sinceros agradecimentos a todas as pessoas que contribuíram
para a realização desta Tese. Em primeiro lugar à minha família, que sempre esteve ao meu
lado me apoiando em todos os momentos, em especial minha esposa Mônica e meus filhos
Taís e Júlio. Minha eterna gratidão aos meus pais, que em nenhum momento deixaram de
acreditar na Educação.
Ao meu orientador e amigo, Prof. George Sand França pela amizade, orientação e estímulo
durante o decorrer do trabalho. Aos Professores Vasile Marza (in memorian), meu primeiro
orientador, por sempre acreditar em mim e Marcelo Assumpção pelos valiosos ensinamentos
durante a primeira etapa do doutorado e construtivas discussões ao longo da pesquisa. Ao co-
orientador Dr. Hossein Shomali pela confiança, amizade, disposição e orientação durante o
período em Uppsala (Suécia). Ao Prof. Jiri Zahradnik pela amizade, pelos preciosos
ensinamentos e discussões que muito contribuíram para a evolução da pesquisa. Ao Dr.
Ronnie Quintero (OVSICORI-UNA, Costa Rica) pelo constante incentivo e por tornar viável
meu estágio em Uppsala. Ao Prof. Lucas Vieira Barros pelas discussões e auxílio na
elaboração do mapa macrossísmico. Aos Professores João Willy C. Rosa e Marcelo Peres
Rocha, pelas discussões e sugestões que enriqueceram o trabalho.
Agradeço ao CNPq pelas bolsas Doutorado GD (142949/2009-4) e Doutorado Sanduíche no
Exterior (201813/2011-4). Ao Observatório Sismológico (SIS) por ceder as estações
sismográficas para a rede local e pelo apoio financeiro. A Sidinei Sebastião Tomás e Daniel
Linhares, eternos companheiros das viagens de campo. Agradeço também ao pessoal do
Parque Nacional Cavernas do Peruaçu-PARNA/IBAMA, em especial a Evandro Pereira da
Silva e Ivan Borba Lima, pelo essencial suporte logístico na instalação e manutenção da rede
local e coleta de dados. A Afonso E. de Vasconcelos Lopes por disponibilizar programas e
scripts de muita valia para a primeira etapa do doutorado.
Gostaria de agradecer aos meus amigos e colegas de pós-graduação Sidinei Sebastião Tomás
Lucas Paes Moreira, Kate T. S. Algarte, Umberto Travaglia Filho e Guilherme Ferreira pelo
companheirismo, amizade e discussões ao longo destes anos.

Resumo
A vila de Caraíbas e localidades próximas, no Município de Itacarambi, norte de
Minas Gerais, começaram a ser afetadas por tremores de terra em março de 2007. Em 9 de
dezembro daquele ano um forte tremor de magnitude 4,6 mb produziu uma vítima fatal,
dezenas de casas foram destruídas e 50 famílias foram removidas definitivamente para a
cidade de Itacarambi. A intensidade máxima produzida por este evento principal foi VII MM
e seus efeitos foram sentidos a distâncias de até 80 quilômetros. A análise dos dados
produzidos por uma rede sismográfica instalada nas proximidades de Caraíbas em outubro de
2007 permitiu detectar a sismicidade e localizar os eventos com boa precisão. O evento
principal figura, de forma inédita no Brasil, como evento de referência em estudos mundiais
sobre estrutura de velocidades e perigo/risco sísmicos. Foram identificados padrões na
distribuição temporal dos eventos da seqüência sísmica, com pré-abalos, quiescência sísmica,
pré-abalos iminentes, evento principal e pós-abalos. A distribuição espacial dos eventos
sugere alinhamento ao longo da direção NE-SW, com extensão de aproximadamente 3
quilômetros e os focos mostram-se mais profundos (até 2 quilômetros) para SE. O mecanismo
focal obtido indica falhamento inverso com direção N30ºE, mergulho de 30º, mergulho de 40º
e rake de 105º. O tensor momento sísmico foi determinado para três eventos utilizando
inversão da forma de onda completa. Os resultados indicam fontes sísmicas com porcentagens
double-couple superiores a 70%. Foram selecionados 17 eventos, dentre os quais o evento
principal, subdivididos em 4 grupos com localizações hipocentrais muito próximas entre si,
para estudo de inversão relativa do tensor momento sísmico. A grande maioria apresenta
fontes com porcentagem double-couple superior a 80%. Existe uma grande correlação entre
os mecanismos focais determinados, tanto pela polaridade da onda P, quanto pelas inversões,
mostrada pelos ângulos Kagan em sua grande maioria inferiores a 30º. Os resultados obtidos
indicam claramente uma origem tectônica para a sismicidade de Caraíbas-Itacarambi. No
entanto, não foi observada em superfície a expressão da falha ativa que produz os eventos.
Interpretações de imagens de satélite e de dados geofísicos aéreos sugerem a presença de
feições de amplitudes locais com direções concordantes com as orientações obtidas nas
análises sismológicas. A sismicidade em Caraíbas-Itacarambi provavelmente está relacionada
a movimentação ao longo de uma fratura/falha pré-existente em resposta a um esforço
compressivo com orientação aproximadamente E-W.

Abstract
The Caraíbas village and vicinities at Itacarambi municipality, north of Minas Gerais,
started to be affected from earthquakes in March 2007. On December 9, 2007 a moderate
earthquake with 4.6 magnitude produced a fatal victim, tens of houses were destructed and 50
families were definitely removed to Itacarambi city. The maximum intensity produced by this
event was VII Modified Mercalli and its effects were felt up to 80 kilometers away. The
analysis of the data recorded by a seismographic network installed near Caraíbas on October
2007 allows us to detect the seismicity and locate hypocenters with good precision. The
Caraíbas-Itacarambi mainshock is the first Brazilian earthquake used as reference event for
global velocity structure and seismic hazard/risk studies. We could identify patterns on
temporal distribution of the seismic sequence events, such as foreshocks, seismic gap,
imminent foreshocks, mainshock and aftershocks. The spatial distribution of events suggests
an approximately 3-km long zone roughly aligned in the NE-SW direction, with focus of
increasing depth (down to 2 km) to SE. The focal mechanism solution indicates reverse fault
striking N30°E and dipping 40º to the Southeast, and rake of 105º. Seismic moment tensor
was determined for three events using complete waveform inversion. The result indicates
seismic sources with double-couple percentages larger than 70%. Seventeen events were
selected, including the mainshock, distributed over 4 groups with collocated hypocenters, to
be used in relative moment tensor inversion. Most of them are sources with double-couple
percentages greater than 80%. Very high correlation is observed between the focal mechanism
obtained here both using P-wave first motion polarities or inversion methods, indicated by the
Kagan angles lower than 30º. The obtained results indicate clear tectonic nature for the
Caraíbas-Itacarambi seismicity. However, no surface indicators of the active fault can be
observed. Processing of satellite images and geophysical data suggest local-scale features
(fractures, lineaments) with coincident trending to the seismological data. The Caraíbas-
Itacarambi seismicity is probably related to movement along one hidden fracture/fault in
response of a roughly E-W compressive stress.

i
Sumário
Capítulo 1 - Introdução ............................................................................................................1
1.1 – Introdução à Tese e apresentação do problema .............................................................1 1.2 – Objetivos da Tese .............................................................................................................2 1.4 – Localização da área de estudo e dados utilizados...........................................................4 1.5 – Aspectos Geológicos ........................................................................................................6 1.4.3 - Grupo Urucuia..............................................................................................................10 1.7 – Resumo dos artigos ........................................................................................................16 1.7.1 – Artigo 1 - Capítulo 2....................................................................................................16 Capítulo 2 ................................................................................................................................22
The intracratonic Caraíbas-Itacarambi earthquake of December 09, 2007 (4.9 mb), Minas
Gerais State, Brazil .................................................................................................................22
ABSTRACT ..............................................................................................................................23 2.1. Introduction .....................................................................................................................23 2.3.1. The mainshock of December 9, 2007.............................................................................27 2.3.2. Local Seismographic Network.......................................................................................29 2.3.4. Hypocentral Determination ...........................................................................................31 2.4. Discussion ........................................................................................................................39 Acknowledgements .................................................................................................................41 Capítulo 3 ................................................................................................................................45
Moment tensor solutions for weak earthquakes at Caraíbas-Itacarambi, São Francisco
Craton, Brazil..........................................................................................................................45
3.1. Introduction .....................................................................................................................46 3.2. Geological setting and data .............................................................................................47 3.3.1 – Time Domain Waveform Inversion..............................................................................50 3.3.2 - Relative Moment Tensor Inversion ..............................................................................57 Cluster 1 (foreshocks)..............................................................................................................60 Cluster 2 ..................................................................................................................................61 Cluster 3 (aftershocks) ............................................................................................................63 Cluster 4 ..................................................................................................................................64 3.4. Tectonic implications.......................................................................................................65 Synthetic Tests ........................................................................................................................70 Acknowledgments ...................................................................................................................73 References ...............................................................................................................................73 Capítulo 4 - Discussão ............................................................................................................79
4.1 – Introdução......................................................................................................................79 4.2 – Dados Geológicos ..........................................................................................................79 4.3 – Dados Geofísicos............................................................................................................80 4.4 – Dados Geomorfológicos (Imagens de Satélite e SRTM) ..............................................83 4.5 – Dados Sismológicos regionais .......................................................................................90 4.6 – Considerações Finais ....................................................................................................91 Capítulo 5 - Conclusões..........................................................................................................96
Anexo 1 ...................................................................................................................................99

ii
Lista de Figuras
Figura 1. 1 – Localização da área de estudo no norte do Estado de Minas Gerais ...................5 Figura 1. 2 – Mapa com a rede local composta por 6 estações sismográficas da Rede 1
e da Rede 2 instaladas na área epicentral do evento principal de 9 de dezembro de 2007 (4,9 mb)................................................................................6
Figura 1. 3 – Mapa geológico simplificado do Cráton do São Francisco .................................7 Figura 1. 4 – Mapa geológico simplificado da Bacia do São Francisco. ..................................8 Figura 1. 5 - Mapa geológico da área de estudo (CPRM, 2003).. ...........................................11 Figura 1. 6 – Esquema estrutural do horst-anticlinal de Itacarambi, na área de
Itacarambi-Mina Grande .................................................................................13 Figura 1. 7 – Mapa com a localização dos epicentros dos eventos com magnitudes
iguais ou maiores que 4,0 documentados no período de 1808 a 2012. ...........15
Figure 2. 1 - Geologic map of the Caraíbas-Itacarambi/MG area (CPRM, 2003) ..................25 Figure 2. 2 - Map with the isoseismal curves (dashed lines) for the December 9, 2007
(4.9 mb) earthquake with Modified Mercalli (MM) intensities ......................28 Figure 2. 3 - Epicentral distribution of Caraíbas-Itacarambi seismicity..................................30 Figure 2. 4 - Temporal distribution of the seismicity at Caraíbas-Itacarambi area from
October 23, 2007 to August 9, 2008................................................................32 Figure 2. 5 - Composite Wadati diagram for Caraíbas-Itacarambi seismicity
determined using 75 events and 352 data........................................................33 Figure 2. 6 - (a) Map of the Caraíbas-Itacarambi seismicity showing foreshocks,
imminent foreshocks, mainshock and aftershocks. (b) Vertical section AB passing through Station 8..........................................................................35
Figure 2. 7 - Waveform correlations at Station 9 for the events located inside the
dashed box of Figure 6, using the vertical component for the P-wave (a) and N-S component for the S-waves (b). ...................................................36

iii
Figure 2. 8 - (a) Map of the southern cluster (dashed box in Figure 2.6). (b) Vertical
projection along line AB. ................................................................................37 Figure 2. 9 - Composite focal mechanism for Caraíbas-Itacarambi seismicity. .....................38 Figure 2. 10 - First order vertical derivatives of the aeromagnetic field in the region of
study. ...............................................................................................................40
Figure 3. 1 – Geological map of Caraíbas-Itacarambi region. ................................................48 Figure 3. 2 – Epicentral distribution of Caraíbas-Itacarambi seismicity (gray circles)...........51 Figure 3. 3 - Correlation plot for all 25 trial source positions of the spatial grid of 0.2
x 0.2 km increments in the West-East and South-North direction for Event c (Tables 3.1 and 3.2) at depth of 1 km.................................................54
Figure 3. 4 – Plot of correlation coefficient as function of temporal source shift for
source number 14 of Event c (Tables 3.1 and 3.2). .........................................55 Figure 3. 5 – Waveform fit between observed and synthetic displacements at stations
and the moment tensor inversion result for source position number 14 of Event c (Tables 3.1 and 3.2)........................................................................56
Figure 3. 6 - Correlation coefficient and DC% values for all trial solutions of Event c
(Tables 3.1 and 3.2). ........................................................................................57 Figure 3. 7 – Clusters of events used for RMTI analysis. .......................................................59 Figure 3. 8 – Waveforms of all events of Cluster 1 in station JAN2 at components
vertical (a), radial (b) and tangential (c). .........................................................61 Figure 3. 9 – (a) Deviatoric moment tensor solutions for events of Cluster 1 based on
DC at flat part of spectrum for P- and S-waves. (b) Double-couple percentage for deviatoric moment tensor inversion. .......................................62
Figure 3. 10 – Deviatoric moment tensor solutions for events of Cluster 3 based on
DC at flat part of spectrum for P- and S-waves...............................................65 Figure 3. 11 – Double-couple percentage (DC%) for deviatoric (vertical bar) moment
tensor inversion for events of Cluster 3...........................................................66 Figure 3. 12 – Final moment tensor solutions obtained with RMTI. ......................................67
Figura 4. 1 – Esquema estrutural do horst-anticlinal de Itacarambi, na área de Itacarambi-Mina Grande. ................................................................................80

iv
Figura 4. 2 – Imagem da Amplitude do Sinal Analítico (ASA) do campo magnético
para a região de Caraíbas-Itacarambi. .............................................................81 Figura 4. 3 – Imagem da Inclinação do Vetor Sinal Analítico (ISA) do campo
magnético para a região de Caraíbas-Itacarambi.............................................82 Figura 4. 4 – Imagem da Deconvolução de Euler do campo magnético para a região
de Caraíbas-Itacarambi. ...................................................................................83 Figura 4. 5 – Mapa hipsométrico SRTM da região de Caraíbas-Itacarambi. ..........................84 Figura 4. 6 – Imagem de satélite Landsat 7+ETM (bandas 3,4,5) da região de
Caraíbas-Itacarambi.........................................................................................86 Figura 4. 7 – Imagem SRTM – TOPODATA (resolução espacial: 30 metros) da
região de Caraíbas-Itacarambi. ........................................................................87 Figura 4. 8 – Lineamentos e foliações obtidos de imagem de satélite para região de
Caraíbas-Itacarambi.........................................................................................88 Figura 4. 9 – Lineamentos e foliações obtidos de imagem SRTM para região de
Caraíbas-Itacarambi.........................................................................................89 Figura 4. 10 – Mapa apresentando os mecanismos focais obtidos para as seqüências
sísmicas: Correntina/BA, Manga/MG, Caraíbas/MG, Brasília/DF e Encruzilhada/BA. ............................................................................................91

v
Lista de Tabelas
Table 2. 1 – Source parameters for the December 9, 2007 earthquake. .....................................29 Table 2. 2 – Focal mechanism solutions used to determine the stress tensor in the
central part of the São Francisco Craton. ..............................................................39
Table 3. 1 - Events selected for waveform inversion using ISOLA...........................................52 Table 3. 2 – Deviatoric moment tensor solutions of the studied events using ISOLA
(Table 3.1). ............................................................................................................53 Table 3. 3 – Events used for Relative Moment Tensor Inversion. .............................................60 Table 3. 4 – Deviatoric moment tensor solutions of all events studied using RMTI
(Table 3.3). ............................................................................................................63
Table A 1 - Focal mechanism solution adopted to events of Cluster 3 for synthetic tests using RMTI method. .....................................................................................71

Sismicidade de Caraíbas-Itacarambi/MG: causas e características 1
Capítulo 1 - Introdução
1.1 – Introdução à Tese e apresentação do problema
No dia 24 de maio de 2007, um tremor de terra de magnitude 3,5 foi sentido pela
população do vilarejo de Caraíbas, próximo à cidade de Itacarambi, localizada a
aproximadamente 35 quilômetros de distância, norte de Minas Gerais. As comunidades
vizinhas de Vargem Grande e Araçá também sentiram o tremor e rachaduras em casas de
adobe foram relatadas. Posteriormente, em 9 de dezembro de 2007, outro tremor maior de
magnitude 4,9 mb ocorreu na mesma localidade, sendo seguido por centenas de tremores de
menores magnitudes. A intensidade máxima atingiu VII graus na Escala Mercalli Modificada
(MM) e os efeitos desse tremor foram sentidos num raio de aproximadamente 80 quilômetros.
Todas as 50 casas do vilarejo de Caraíbas foram desocupadas pela Defesa Civil do Estado de
Minas Gerais e seus moradores foram removidos e instalados em Itacarambi.
A sismicidade em Caraíbas-Itacarambi apresenta as seguintes características:
i) ocorre no interior do Cráton do São Francisco, em uma área até então sem registros, sejam
históricos ou instrumentais, de ocorrências anteriores;
ii) apresenta focos (hipocentros) a profundidades muito rasas (até 2 quilômetros);
iii) apesar da magnitude não tão elevada, infelizmente provocou a primeira vítima fatal direta
de um terremoto no Brasil.
Essas são algumas características que tornam a sismicidade de Caraíbas-Itacarambi
uma questão de grande interesse científico/social, não só pela busca de uma explicação sobre
sua origem e correlação com a sismicidade intraplaca brasileira como um todo, mas também
como pré-requisito para avaliações de perigo/risco sísmicos no território nacional.
Dessa forma, esta Tese é apresentada na forma de artigos e tem como objetivo o
estudo da zona sísmica de Caraíbas-Itacarambi, localizada no extremo norte do Estado de
Minas Gerais. Composta por cinco capítulos: introdução, dois artigos (um publicado e outro
submetido), discussão e conclusão. No Capítulo 1 é apresentado o problema, o conhecimento
dos aspectos geológicos da área de estudo, assim como uma visão geral da sismicidade
brasileira; no Capítulo 2 são apresentadas as características da sismicidade de Caraíbas-
Itacarambi, sua distribuição no tempo e no espaço, e mecanismo focal; no Capítulo 3 são
mostrados estudos mais detalhados do tensor momento sísmico dos tremores, por meio de

Sismicidade de Caraíbas-Itacarambi/MG: causas e características 2
inversão usando dados no domínio do tempo e da freqüência; no Capítulo 4 são feitas
discussões sobre os resultados obtidos nos capítulos 2 e 3, correlacionando-os com
informações obtidas no processamento e análise de dados aerogeofísicos, imagens de satélite
e radar; e por fim, no Capítulo 5 são apresentadas as conclusões a respeito do estudo
realizado.
1.2 – Objetivos da Tese
O objetivo principal da Tese é estudar a sismicidade da área de Caraíbas-Itacarambi,
norte de Minas Gerais, apresentando suas causas, características e sugerir um modelo
explicativo para a sismicidade. Os objetivos secundários são: determinação hipocentral dos
eventos, definição da distribuição no espaço-tempo da sismicidade, solução do mecanismo
focal, e correlação dos resultados sismológicos com informações geológicas e geofísicas
existentes. São definidos parâmetros sísmicos da fonte (falha sismogênica), quais sejam:
informações temporais e espaciais (horário de origem, latitude, longitude e profundidade do
foco), dimensões físicas (comprimento, largura) e disposição geográfica (direção, mergulho,
profundidade).
Para atingir este objetivo aplicamos aos dados sísmicos locais e regionais
metodologias de localização e relocalização hipocentral, determinação do mecanismo focal
composto usando informações de primeiro movimento da onda P, inversão de forma de onda
no domínio do tempo e inversão relativa do tensor momento sísmico no domínio da
freqüência.

Sismicidade de Caraíbas-Itacarambi/MG: causas e características 3
1.3 – Estratégia utilizada para estudo do problema
O estudo realizado nesta Tese baseia-se na análise dos registros produzidos por uma
rede sismográfica local instalada na área, composta por seis estações de banda larga, com
distâncias epicentrais entre 0,5 e 20 quilômetros.
A instalação de uma rede sismográfica local em Outubro/2007 permitiu, de maneira
singular no Brasil, detectar toda a seqüência sísmica, composta por pré-abalos, pré-abalos
iminentes (algumas horas antes do evento principal), evento principal e pós-abalos. Dessa
forma foi possível analisar de forma completa a distribuição espaço-temporal da sismicidade.
Para um modelo de velocidades mais próximo do real foram utilizadas informações de
levantamentos geológicos (mapeamentos e sondagens geológicas), dados de poços tubulares
profundos para extração de água subterrânea e análises de aerolevantamentos geofísicos. Este
modelo foi utilizado na localização hipocentral de 75 eventos selecionados com base na
qualidade das formas de onda (chegadas claras das ondas P e S) e na quantidade de registros
(no mínimo 4 estações) usando o programa HYPO71 (Lee & Lahr, 1975). O refinamento das
localizações foi feito com o método da dupla-diferença usando o programa hypoDD
(Waldhauser, 2001).
As localizações hipocentrais finais apresentam erros baixos (menor que 50 metros).
Por este motivo e por também ter sido registrado por estações a distâncias regionais e
telessísmicas, o evento principal de Caraíbas-Itacarambi torna-se o primeiro terremoto do
Brasil a ser um evento de referência (veja Anexo 1) nos estudos de avaliação de risco e perigo
sísmicos no mundo, pelo Projeto IASPEI – GT Events do ISC (http://www.isc.ac.uk).
Mecanismos focais para os eventos de Caraíbas-Itacarambi foram determinados
utilizando três métodos independentes. No primeiro, foram utilizadas informações de
polaridades dos primeiros movimentos da onda P em estações locais, regionais e
telessísmicas, usando o programa FPFIT (Reasenberg & Oppenheimer, 1985). O segundo
método consiste na inversão (no domínio do tempo) da forma de onda completa nas estações
locais para determinação do tensor momento sísmico, usando o programa ISOLA (Sokos &
Zahradnik, 2008). Por fim, o terceiro método consiste na inversão (no domínio da freqüência)
relativa do tensor momento sísmico com evento de referência.
Os resultados obtidos pela análise dos dados sismológicos foram comparados com
estudos usando informações de imagens de satélite e geofísica aérea. O intuito é correlacionar

Sismicidade de Caraíbas-Itacarambi/MG: causas e características 4
a sismicidade com alguma feição geológica não identificada nos mapeamentos geológicos,
uma vez que a feição em superfície da falha sismicamente ativa é muito difícil de ser
observada no caso de sismicidade intraplaca.
A presente Tese vem de colaborar com informações inéditas sobre a sismicidade em
Caraíbas-Itacarambi, uma área sem relatos históricos ou instrumentais, até então, de
ocorrência de tremores de terra. As investigações realizadas neste estudo conferem o caráter
tectônico aos sismos, apesar das inúmeras cavernas catalogadas na região. Além disso, a
aplicação das metodologias de inversão de forma de onda e inversão relativa do tensor
momento sísmico, apesar de amplamente aplicados no mundo há vários anos, puderam ser
aplicados a eventos muito pequenos, fato pioneiro no Brasil e raro no mundo, graças à
instalação de uma rede sismográfica a distâncias muito locais.
1.4 – Localização da área de estudo e dados utilizados
A área de estudo localiza-se no extremo norte do Estado de Minas Gerais, nas
proximidades da cidade de Itacarambi, mais precisamente no vilarejo de Caraíbas (Figura
1.1). No primeiro semestre de 2007 eventos sísmicos foram sentidos pela população desta
localidade, produzindo rachaduras em algumas casas. A recorrência dessa sismicidade desde
maio de 2007 assustou a população local de tal forma que autoridades locais entraram em
contato com o Observatório Sismológico da Universidade de Brasília (SIS/UnB) para estudar
as causas do fenômeno e esclarecer a população sobre o ocorrido.
Assim, em outubro de 2007 foi instalada uma rede local de seis (6) sismógrafos
circundando o vilarejo de Caraíbas para monitorar a atividade sísmica (Figura 1.2). Estes
equipamentos permaneceram instalados até abril de 2008, produzindo um significativo banco
de dados da sismicidade local. A rede teve duas configurações (Rede 1 e Rede 2) ao longo do
tempo, como é explicado mais adiante no Capítulo 2 (seção 3.2).
Os equipamentos utilizados neste trabalho, assim como os recursos para a instalação
da rede local, foram fornecidos pelo Observatório Sismológico (SIS) da Universidade de
Brasília (UnB). Os equipamentos consistem em sismômetros de banda larga CMG-6TD
(Güralp Systems), com resposta plana entre 0,03 e 100 Hz. Os dados foram digitalizados a

Sismicidade de Caraíbas-Itacarambi/MG: causas e características 5
400 amostras por segundo e o sistema foi configurado para aquisição contínua dos dados, com
sincronismo de tempo utilizando sinal de Sistema de Posicionamento Global (GPS).
Figura 1. 1 – Localização da área de estudo no norte do Estado de Minas Gerais (quadrado vermelho no quadro do canto superior direito do mapa). A estrela vermelha representa o epicentro do evento principal de 9 de dezembro de 2007 (4,9 mb). As cidades de Itacarambi/MG e Brasília/DF estão representadas por quadrados verdes.
Diversos eventos foram detectados, inclusive o evento principal com magnitude 4,9
mb e uma réplica de magnitude 4,0 mD. Esses eventos maiores também foram registrados por
estações localizadas a distâncias regionais e também compõe o banco de dados a ser utilizado
no presente projeto.

Sismicidade de Caraíbas-Itacarambi/MG: causas e características 6
Figura 1. 2 – Mapa com a rede local composta por 6 estações sismográficas da Rede 1 e da Rede 2 instaladas na área epicentral do evento principal de 9 de dezembro de 2007 (4,9 mb).
1.5 – Aspectos Geológicos
A área epicentral de Caraíbas-Itacarambi está localizada no meio do Cráton do São
Francisco (Figura 1.3). O Cráton do São Francisco faz parte do supercontinente
Neoproterozóico Gondwana, formado pela aglutinação de massas continentais envolvidas em
múltiplas e sucessivas colisões (Cordani et al., 2000). Sua evolução teve início no Arqueano e
terminou no final do Mesoproterozóico e início do Neoproterozóico. É balizado a sul e oeste
pela Faixa Brasília, a noroeste pela Faixa Rio Preto, a norte pelas faixas Riacho do Pontal e
Sergipana e a sudeste pela Faixa Araçuaí, todas de idades brasilianas.
O interior do cráton é coberto por unidades pré-cambrianas e fanerozóicas
representadas pela Bacia do São Francisco (Figura 1.4), onde se localiza a área de estudo
(quadrado vermelho na Figura 1.3). A Bacia do São Francisco ocupa quase a totalidade da
parte de orientação meridiana do cráton (Figura 1.4).

Sismicidade de Caraíbas-Itacarambi/MG: causas e características 7
Figura 1. 3 – Mapa geológico simplificado do Cráton do São Francisco (modificado de Martins-Neto et al., 2001). O quadrado vermelho localiza a área de estudo.
As unidades pré-cambrianas da Bacia do São Francisco foram afetadas pelas frentes
orogênicas brasilianas. Dessa forma, pode ser subdividida em três compartimentos estruturais
(Figura 1.4) segundo Alkmim & Martins-Neto (2001): compartimento oeste (W)
correspondente à porção externa das faixas Brasília e Rio Preto; compartimento central (C) no
qual os sedimentos do Supergrupo São Francisco encontram-se indeformados; compartimento
leste (E) que corresponde à porção externa da Faixa Araçuaí.

Sismicidade de Caraíbas-Itacarambi/MG: causas e características 8
Figura 1. 4 – Mapa geológico simplificado da Bacia do São Francisco: a) distribuição das unidades estratigráficas, principais feições estruturais e faixas móveis brasilianas circundantes; b) esquema das maiores feições estruturais do embasamento da bacia (Alkmim & Martins-Neto, 2001). Quadrado vermelho mostra área de estudo.
Outras importantes feições estruturais da bacia são: o Alto de Sete Lagoas; o Arco do
Alto Paranaíba, que separa as bacias do Paraná e São Francisco; o Arco do São Francisco, que
separa as Bacias do São Francisco e Parnaíba; o grande Baixo de Pirapora; e o Alto de
Januária (Figura 1.4). A maioria dessas estruturas foi nucleada no Neoproterozóico e foi
reativada no Cretáceo (Alkmim & Martins-Neto, 2001).
A seguir serão descritas, de forma sucinta, as unidades litoestratigráficas que
compõem a área de estudo.

Sismicidade de Caraíbas-Itacarambi/MG: causas e características 9
1.4.1 - Complexo Januária
O embasamento do Cráton do São Francisco compreende terrenos indeformados e
deformados, de médio a alto grau metamórfico de idade Arqueana, representados
principalmente por rochas graníticas e gnáissicas do Complexo Januária (Nobre-Lopez, 2002;
CPRM, 2003; Martínez, 2007). O último evento deformacional/metamórfico que estas rochas
sofreram ocorreu antes de 1,8 Ga.
Segundo Almeida & Uchigasaki (2003) os corpos intrusivos graníticos aflorantes na
margem esquerda do Rio São Francisco são um granito branco e um biotita-granito,
encaixados nos gnaisses. Os gnaisses correspondem à maior extensão dos afloramentos do
embasamento e constituem de gnaisses bandados com enclaves máficos de anfibolito
(Almeida & Uchigasaki, 2003). Nas proximidades das cidades de Bonito de Minas e Januária
(Figura 1.5) é possível observar afloramentos das rochas deste Complexo.
1.4.2 – Supergrupo São Francisco – Grupo Bambuí
Durante o Neoproterozóico, uma seqüência de rochas sedimentares de ambiente de
plataforma a continental se depositou sobre o embasamento cratônico, constituindo-se o
Grupo Bambuí. Dardenne (1978) subdividiu o Grupo Bambuí em seis formações:
1) Formação Jequitaí: é representada por paraconglomerados de matriz esverdeada, com
seixos de quartzitos, calcários, dolomitos, chert, gnaisses, micaxistos, granitos e
rochas vulcânicas. É interpretada como indicativa de sedimentação glacial de idade
Neoproterozóica. Na área em estudo não são observadas rochas desta formação.
2) Formação Sete Lagoas: constituída por sucessão carbonática de idade Neoproterozóica
de dolomito rosa laminado na base, seguido por calcários argilosos roxos finamente
laminados, frequentemente dolomíticos, calcários cinza escuros a pretos, bem
estratificados, calciruditos com brechas intraformacionais, calcarenitos dolomíticos e
dolomitos estromatolíticos.
3) Formação Serra de Santa Helena: sucessão sedimentar predominantemente pelítica,
composta de siltitos, folhelhos, argilitos e margas de cores esverdeadas, com
intercalações de calcários cinza escuro. Seus litotipos fazem contato concordante e

Sismicidade de Caraíbas-Itacarambi/MG: causas e características 10
gradativo com rochas da Formação Sete Lagoas na base e da Formação Lagoa do
Jacaré no topo.
4) Formação Lagoa do Jacaré: representada por alternância de calcários oolíticos e
psolíticos cinza escuro, cristalinos e lenticulares, com siltitos e margas. Os calcários
apresentam-se em estratos paralelos, com presença de estratificações cruzadas.
5) Formação Serra da Saudade: assenta-se sobre a Formação Lagoa do Jacaré por meio
de contato concordante e gradacional. Constituída por siltitos e folhelhos de cor
esverdeada. As rochas desta formação não são encontradas na área de estudo.
6) Formação Três Marias: é representada por um conjunto de arcóseos, arenitos e siltitos,
dispostos concordantemente e transicionalmente sobre a Formação Serra da Saudade.
Na área de estudo não foram identificadas rochas representantes desta formação.
1.4.3 - Grupo Urucuia
O Grupo Urucuia, do Cretáceo Superior, é constituído predominantemente por
arenitos quartzosos, avermelhados e brancos, de granulação fina a média, com grãos
arredondados, bem selecionados e escassa matriz argilosa. Realizam contato discordante com
as formações inferiores, podendo estar sobre quaisquer delas, inclusive o embasamento
cristalino (Martínez, 2007).
A presença de estratificação cruzada tabular e acanalada, conglomerados, grãos
subesféricos, ótimo selecionamento e escassa matriz argilosa, levaram Campos (2001) a
relacionar a sedimentação do Grupo Urucuia a um sistema eólico-fluvial.
1.4.4 - Coberturas aluvionares
São sedimentos inconsolidados de idade Cenozóica, representados por cascalhos,
areias, argilas e siltes, associados a planícies de inundação das maiores drenagens (Cunha
Filho, 2004).

Sismicidade de Caraíbas-Itacarambi/MG: causas e características 11
1.4.5 - Coberturas detrito-lateríticas
As coberturas Tércio-Quaternárias detrito-lateríticas são representadas por latossolos,
areias quartzosas, argilosolos e outras classes de menor representatividade em área (Campos,
2001).
Figura 1. 5 - Mapa geológico da área de estudo (CPRM, 2003). Círculo vermelho representa epicentro do evento principal de 9 de dezembro de 2007 (magnitude 4,9 mb). Retângulo tracejado delimita área de estudo utilizando imagens de satélite (Capítulo 4).

Sismicidade de Caraíbas-Itacarambi/MG: causas e características 12
1.4.6 - Arcabouço estrutural do Cráton São Francisco e coberturas
A área de estudo encontra-se localizada no compartimento estrutural central (C) do
Cráton do São Francisco (Figura 1.4) segundo a subdivisão de Alkmim & Martins-Neto
(2001). Neste compartimento as rochas não foram afetadas pelos dobramentos brasilianos que
delimitam o cráton (Figura 1.3).
As rochas do embasamento do Cráton do São Francisco foram afetadas, durante o
Neoproterozóico, por estruturas tectônicas do tipo “horst” e “graben” ao longo de
falhamentos com direções E-W e N40º-50ºW (Costa, 1978 apud Martínez, 2007).
Adicionalmente, diques máficos e ultramáficos seccionaram o complexo cristalino ao longo
de fraturas regionais com direções N40º-50ºW.
Estudos geofísicos de Cunha Filho (2004) utilizando dados de levantamentos aéreos
de magnetometria e gamaespectrometria, além de dados de gravimetria terrestre, permitem
identificar com clareza os diques e reforçam hipótese da tectônica de “horst” e “graben” na
região.
O mapa de isoanomalias magnéticas de Luz (1975) produzido pelos diques indica que
as estruturas do embasamento estão truncadas na altura do curso do rio São Francisco,
mudando de direção N40º-50ºW para N-S. Uma possível explicação para este comportamento
é a presença de uma falha de direção NNE paralela ao atual curso do rio São Francisco
(Martínez, 2007).
Anteriormente, outros pesquisadores já sugeriram que a direção geral NE-SW do rio
São Francisco, entre as localidades de São Francisco e Januária, seja controle estrutural por
falha, provavelmente normal, responsável pela falta de correspondência litológica observada
entre as sucessões da margem esquerda (Fm. Sete Lagoas) e da margem direita (Fm. Serra de
Santa Helena, Fm. Lagoa do Jacaré; Martínez (2007).
Também é evidenciada uma subsidência diferencial do embasamento, por meio de
falhas normais, durante o início da sedimentação do Grupo Bambuí (Martínez, 2007). Uma
evidência para esta hipótese é o aumento progressivo da espessura da Fm. Sete Lagoas à
medida que se afasta do Alto de Januária em todas as direções (Martínez, 2007).
As rochas do Grupo Bambuí, de maneira geral, apresentam-se horizontalizadas, sem
grandes evidências de tectonismo. Localmente são observadas falhas normais de pequeno

Sismicidade de Caraíbas-Itacarambi/MG: causas e características 13
rejeito, produzindo estreitos “horsts” com direções NW-SE, e amplos dobramentos (Martínez,
2007).
Podemos destacar o horst-anticlinal de Itacarambi, localizado a oeste da cidade
homônima, possuindo direção do traço axial N45ºW e caimento de 10º para NW (Figura 1.6).
O flanco nordeste tem direção aproximada N65ºW e mergulho geral de 20º para NE. O flanco
sudoeste tem direção N15ºW e mergulho suave para W-SW (Brandalise et al., 1980).
Figura 1. 6 – Esquema estrutural do horst-anticlinal de Itacarambi, na área de Itacarambi-Mina Grande. Ku: arenitos Urucuia; FSL: Formação Sete Lagoas (Brandalise et al., 1980). U e D representam blocos elevados e abatidos respectivamente.

Sismicidade de Caraíbas-Itacarambi/MG: causas e características 14
Estes flancos estão relacionados a longas falhas normais longitudinais e mostram-se
seccionados por outro sistema de falhas de menor extensão (Figura 1.6) na maior parte das
vezes em mosaicos de blocos deslocados (Brandalise et al., 1980). Lineamentos estruturais
mapeados a sul da área de estudo possuem direções gerais NE-SW que sofrem rotação para
NW-SE (Figura 1.5) na porção a norte da área (Nobre-Lopes, 2002; CPRM, 2003; Martínez,
2007).
1.6 – A sismicidade de Caraíbas-Itacarambi no âmbito da Sismicidade
Brasileira
A região intraplaca da Placa Sul Americana é caracterizada por taxa de sismicidade
muito baixa, típica de interior continental estável. A magnitude máxima observada no Brasil
foi de 6,2 mb (França, 2006; Barros et al., 2009), valor bem inferior comparado ao observado
em outras regiões intraplaca, como o leste dos Estados Unidos da América, Austrália e Índia,
onde magnitudes maiores que 7 já foram relatadas (Johnston, 1989; Johnston & Kanter, 1990;
Johnston, 1996; Schulte & Mooney, 2005).
No Brasil, assim como em outras regiões continentais estáveis, as intensidades
máximas produzidas superam as observadas em regiões interplacas, considerando-se uma
mesma magnitude. Adicionalmente, a área afetada por um evento de determinada magnitude
em regiões continentais estáveis é maior que em regiões interplaca. Dessa forma, apesar das
baixas magnitudes observadas para a sismicidade brasileira, intensidades máximas de VI MM
são relativamente comuns (e.g. Berrocal et al., 1984; Ferreira et al., 1998), tornando a
avaliação de perigo sísmico um tópico importante principalmente em projetos para
implementação de obras críticas como usinas nucleares e grandes reservatórios hidrelétricos.
Os modelos propostos para explicar a sismicidade intraplaca consideram que os
terremotos resultam de rupturas em zonas de fraquezas ou de concentrações de esforços (e.g.
Sykes, 1978; Talwani, 1989; Talwani & Rajendran, 1991; Kenner & Segal, 2000). Johnston
(1989) e Schulte & Mooney (2005) correlacionaram zonas de fraquezas crustais, como crostas
extendidas em riftes abortados ou margens continentais, com terremotos intraplaca.
Concentração de esforços na crosta superior devido a heterogeneidades estruturais também

Sismicidade de Caraíbas-Itacarambi/MG: causas e características 15
tem sido usada para tentar explicar a sismicidade intraplaca (Sykes, 1978; Talwani, 1989;
Talwani & Rajendran, 1991; Kenner & Segal, 2000; Assumpção et al., 2004).
Dentre os vinte terremotos com magnitude igual ou superior a 5 que ocorreram no
Brasil até 2008, dez localizam-se próximos à margem continental (Assumpção, 1998; Barros
et al., 2009) o que é uma feição comum em sismicidade intraplaca (Johnston & Kanter, 1990;
Schulte & Mooney, 2005). Dos demais epicentros no interior continental, nove estão
localizados em bordas ou no interior de bacias Fanerozóicas e um está numa faixa dobrada
Neoproterozóica-Paleozóica (Barros et al., 2009).
O mapa da sismicidade brasileira para magnitudes superiores a 4,0 mostrado na Figura
1.7 apresenta uma característica importante: os eventos apresentam distribuição geográfica
não-uniforme.
Figura 1. 7 – Mapa com a localização dos epicentros dos eventos com magnitudes iguais ou maiores que 4,0 documentados no período de 1808 a 2012.

Sismicidade de Caraíbas-Itacarambi/MG: causas e características 16
Assim, estudos sobre a sismicidade brasileira são de grande importância para o
entendimento de suas causas e efeitos, principalmente no sentido de fornecer subsídios para
melhor avaliar o perigo sísmico da região intraplaca brasileira. Dessa forma, a presente Tese
apresenta os resultados dos estudos sobre a sismicidade na área de Caraíbas-Itacarambi, com
o intuito de definir as características da fonte geradora dos eventos.
1.7 – Resumo dos artigos
A seguir apresentamos o resumo dos dois artigos produzidos durante o doutorado, o
primeiro já publicado e o segundo submetido.
1.7.1 – Artigo 1 - Capítulo 2
“The intracratonic Caraíbas-Itacarambi earthquake of December 09, 2007 (4.9
mb), Minas Gerais State, Brazil”
Publicado na revista Tectonophysics 480 (2010) 48-56
Neste artigo é apresentada e discutida a sismicidade de Caraíbas-Itacarambi, norte de
Minas Gerais. Inicialmente é situado o caso em estudo no contexto da sismicidade brasileira,
tipicamente intraplaca, bem como no aspecto da geologia.
Toda a seqüência sísmica relacionada ao evento principal de 09 de dezembro de 2007
foi registrada por uma rede sismográfica local composta por 6 estações. Este monitoramento
local permitiu a identificação de feições interessantes, quais sejam: precursores ocorridos dias
antes, quiescência sísmica de aproximadamente 21 dias, precursores iminentes (algumas horas
antes), evento principal e centenas de réplicas. Duas réplicas tiveram magnitudes superiores a
3,0. Levantamento macrossísmico para o evento principal foi realizado, resultando em
intensidade máxima de VII na Escala Mercalli Modificada (MM) e o evento tendo sido
sentido a até 80 quilômetros de distância do epicentro.

Sismicidade de Caraíbas-Itacarambi/MG: causas e características 17
A determinação hipocentral dos eventos foi realizada com o programa HYPO71, com
posterior relocalização utilizando o programa hypoDD. Nesta etapa foi utilizado modelo de
velocidades baseado em informações geológicas, geofísicas e de poços para prospecção de
água subterrânea. A razão Vp/Vs foi estimada em 1,72 pelo Diagrama de Wadati composto. A
distribuição dos epicentros sugere uma zona de 3 quilômetros de extensão aproximadamente
alinhada na direção NE-SW. Os eventos possuem focos mais rasos que 2 quilômetros.
Hipocentros com profundidades mais confiáveis apresentam-se mais rasos a NW e mais
profundos a SE.
O mecanismo focal composto para a seqüência sísmica de Caraíbas-Itacarambi foi
determinado utilizando informações das polaridades dos primeiros movimentos da onda P
utilizando o programa FPFIT. Combinando o resultado obtido com dados de polaridades da
onda P para o evento principal em estações regionais e telessísmicas, e usando a direção dos
hipocentros, o mecanismo focal escolhido possui plano de falha com direção de 30º, mergulho
de 40º e rake de 105º.

Sismicidade de Caraíbas-Itacarambi/MG: causas e características 18
1.7.2 – Artigo 2 - Capítulo 3
“Moment tensor solutions for weak earthquakes at Caraíbas-Itacarambi, São
Francisco Craton, Brazil”
Submetido à revista Bulletin of the Seismological Society of America
Neste artigo foram utilizados dois métodos de inversão distintos para estudar com
maior detalhe os mecanismos focais dos eventos de Caraíbas-Itacarambi. Foram selecionados
19 eventos com magnitudes entre 1,0 e 4,6 para determinação do tensor momento sísmico.
Foi realizada inversão de forma de onda completa no domínio do tempo utilizando o
programa ISOLA para 3 eventos com magnitudes entre 0,9 e 1,4. Uma busca em malha
espacial e temporal foi realizada para determinação da posição do centróide de cada evento.
Os resultados obtidos mostram fontes com porcentagens double-couple de pelo menos 70%,
com redução de variância da ordem de 0,7. Considerando o resultado do mecanismo focal
obtido para a sismicidade de Caraíbas-Itacarambi (Capítulo 2) como referência, foi calculado
o ângulo Kagan para as soluções obtidas na inversão. Os valores deste ângulo indicam que os
mecanismos focais são correlacionáveis entre si.
O método de inversão do tensor momento relativo, no domínio da freqüência, foi
aplicado a 17 eventos, incluindo o evento principal de 09 de dezembro de 2007. Os eventos
apresentam-se em 4 grupos. Foi possível determinar o tensor momento sísmico para 14
eventos. Os ângulos Kagan em geral são inferiores a 30º, o que indica correlação entre os
mecanismos focais. As porcentagens double-couple para a maioria das fontes são superiores a
80%, sugerindo que a movimentação ao longo da falha é o principal causador da sismicidade.

Sismicidade de Caraíbas-Itacarambi/MG: causas e características 19
Referências Alkmim, F.F. & M.A. Martins-Neto, 2001. A bacia intracratônica do São Francisco:
Arcabouço estrutural e cenários evolutivos. In: C.P. Pinto, M.A. Martins-Neto (Eds). Bacia do São Francisco: geologia e recursos naturais. SBG MG, Belo Horizonte, p.9-30.
Almeida, A.M. de & K. Uchigasaki, 2003. Mapeamento geológico em área dos municípios de
Cônego Marinho e Januária-MG. Trabalho de Graduação. UFMG, 83 p. Assumpção, M., 1998. Seismicity and stresses in the Brazilian passive margin. Bull. Seismol.
Soc. Am. 78 (1), 160-169. Assumpção, M., Schimmel, M., Escalante, C., Barbosa, J.R., Rocha, M., Barros, L.V., 2004.
Intraplate seismicity in SE Brazil: stress concentration in lithospheric thin spot. Geophys. J. Int. 159, 390–399.
Barros, L.V., Assumpção, M., Quintero, R., Caixeta, D., 2009. The intraplate Porto dos
Gaúchos seismic zone in the Amazon craton — Brazil, Tectonophysics (2009), doi:10.1016/j.tecto.2009.01.006.
Berrocal, J., Assumpção, M., Antezana, R., Dias Neto, C., Ortega, R., França, H., Veloso,
J.A., 1984. Sismicidade do Brasil. Published by IAG/USP and Comissão Nacional de Energia Nuclear, Brazil, 320 pp.
Brandalise, L.A., Pimentel, G.B., Steiner, H.P., Soares, J., Mendes, J.R., Queiroz, N.F., Lima,
O.M., Pádua, W. de, 1980. Projeto Sondagens Bambuí em Minas Gerais: relatório final. Belo Horizonte, DNPM/CPRM, v.5.
Campos, J.E.G., 2001. Zoneamento Ecológico-Econômico – ZEE do Vale do São Francisco –
nota explicativa do Mapa Geológico do Vale do Rio São Francisco. CODEVASF. Cordani, U.G., Sato, K., Teixeira, W., Tassinari, C., Basel, M.A., 2000. Crustal evolution of
the South América Platform, In: Cordani, U.G., Thomaz Filho, A., Milani, J. (Eds.), Tectoni evolution of South America, CPRM, Rio de Janeiro, pp. 41-95.
Costa, P.C.G., 1978. Geologia das Folhas de Januária, Mata do Jaíba, Japoré e Manga, Minas
Gerais. Memória Técnica. CETEC. Belo Horizonte. CPRM, 2003. Digital atlas of geology and mineral resources of Minas Gerais State, scale
1:500.000. Cunha Filho, E.M. da, 2004. Contribution to the geology and evaluation of mineral potential
in the Januária-Itacarambi-Montalvânia region (Minas Gerais State), Master Degree Thesis (in Portuguese), Institute of Geosciences, University of Brasília, 141 pp.
Dardenne, M.A., 1978. Síntese sobre a estratigrafia do Grupo Bambuí no Brasil Central,
Anais do 30° Congr. Bras. Geol. Recife, PE: SBG, 2, 597-610.

Sismicidade de Caraíbas-Itacarambi/MG: causas e características 20
Ferreira, J.M., Oliveira, R.T., Takeya, M.K., Assumpção, M., 1998. Superposition of local and regional stresses in northeast Brazil: evidence from focal mechanisms around the Potiguar marginal basin. Geophys. J. Int. 134, 341–355.
França, G. S., 2006. Brazil Seismicity. Bulletin of the International Institute of Seismology
and Earthquake Engineering, Japão, v. 40, p. 23-36, 2006. ISC, 2008. International Seismological Centre, Reference Event Bulletin,
http://www.isc.ac.uk, Internatl. Seis. Cent., Thatcham, United Kingdom, 2008. Johnston, A. C., 1989. Seismicity of “stable continental interiors”, in Earthquakes at North-
Atlantic Passive Margin: Neotectonics and Postglacial Rebound, edited by S. Gregersen and P. W. Basham, pp.299-327, Kluwer Acad., Norwell, Mass.
Johnston, A.C. & Kanter, L.R., 1990. Earthquakes in stable continental crust. Sci. Am. 262,
68–75. Johnston, A.C., 1996. Seismic moment assessment of earthquakes in stable continental
regions.1. Instrumental seismicity. Geophys. J. Int. 124, 381–414. Kenner, S.J. & Segal, P., 2000. A mechanical model for intraplate earthquakes: application to
the New Madrid seismic zone. Science 289 (5488), 2329–2332. Lee, W. H. K., Lahr, J.C., 1975. HYPO71: A computer program for determining hypocenter,
magnitude, and first motion pattern of local earthquakes. U.S. Geol. Surv. Open-File Rep. pp. 75-311.
Luz, A.A. da, 1975. Mapa de isoanomalias aeromagnéticas de Minas Gerais – Convênio
Geofísica Brasil-Alemanha. DNPM. Belo Horizonte. Martins-Neto, M.A., Pedrosa-Soares, A.C., Lima, S.A.A., 2001. Tectono-sedimentary
evolution of sedimentary basins from Late Paleoproterozoic to Late Neoproterozoic in the São Francisco craton and Araçuaí fold belt, eastern Brazil, Sedimentary Geology 141-142, 343-370.
Martínez, M.I., 2007. Stratigraphy of Bambuí Group at the north of the São Francisco River
Valley, MG. Master Degree Thesis (in Portuguese), Institute of Geosciences, Federal University of Minas Gerais, 122 pp.
Nobre-Lopes, J., 2002. Diagenesis of the dolomites hosting Zn/Ag mineral deposits in the
Bambui Group at Januaria Region-MG, PhD Thesis, University of Campinas, Campinas, São Paulo, Brazil, 183 pp.
Reasenberg, P., Oppenheimer, D., 1985. FPFIT, FPPLOT and FPPAGE: Fortran computer
programs for calculating and displaying earthquake fault-plane solutions. U.S. Geol. Surv. Open-File Rep. 85-739, 109 pp.
Schulte, S.M. & Mooney, W.D., 2005. An updated global earthquake catalogue for stable
continental regions: reassessing the correlation with ancient rifts. Geophys. J. Int. 161, 707–721.

Sismicidade de Caraíbas-Itacarambi/MG: causas e características 21
Sokos, E. and J. Zahradník (2008) ISOLA – a Fortran code and a Matlab GUI to perform
multiple-point source inversion of seismic data, Comput. Geosci. 34, 967-977. Sykes, L.R., 1978. Intraplate seismicity, reactivation of preexisting zone of weakness, alkaline
magmatism, and other tectonism posdating continental fragmentation. Rev. Geophys. Space Phys. 245, 298–302.
Talwani, P., 1989. Characteristic features of intraplate earthquakes and the models proposed
to explain them. In: Gregersen, S., Basham, P.W. (Eds.), Earthquakes at North Atlantic Passive Margins: Neotectonics and Post-Glacial Rebound. Kluwer, Dordrecht, pp. 289–297.
Talwani, P. & Rajendran, K., 1991. Some seismological and geometric features of
intraplateearthquakes. Tectonophysics 186, 19–41. Waldhauser, F., 2001. HYPODD – A program to compute double-difference hypocenter
locations. U.S. Geol. Surv. Open-File Rep pp. 01-113.

Sismicidade de Caraíbas-Itacarambi/MG: causas e características 22
Capítulo 2
The intracratonic Caraíbas-Itacarambi earthquake of December 09,
2007 (4.9 mb), Minas Gerais State, Brazil
Cristiano Chimpliganond1, Marcelo Assumpção2, Mônica Von Huelsen1 & George Sand
França1
1 Seismological Observatory, University of Brasilia, Brasilia, 70910-000, Brazil – {naibert,
monisis, georgesand}@unb.br
2 Institute of Astronomy, Geophysics and Atmospheric Sciences, University of São Paulo,
05508-090, São Paulo, Brazil – [email protected]
Key words: Intracratonic earthquake, intraplate seismicity, focal mechanism, São Francisco
Craton, Brazilian seismicity
Article history:
Submitted to Tectonophysics: 25 March 2009
Revised version: 15 September 2009
Accepted: 16 September 2009
Available online: 26 September 2009

Sismicidade de Caraíbas-Itacarambi/MG: causas e características 23
ABSTRACT
On December 9, 2007, a 4.9 mb earthquake occurred in the middle of the São Francisco
Craton, in a region with no known previous activity larger than 4 mb. This event reached
intensity VII MM (Modified Mercalli) causing the first fatal victim in Brazil. The activity had
started in May 25, 2007 with a 3.5 magnitude event and continued for several months,
motivating the deployment of a local 6-stations network. A three weeks seismic quiescence
was observed before the mainshock. Initial absolute hypocenters were calculated with best
fitting velocity models and then relative locations were determined with hypoDD. The
aftershock distribution indicates a 3 km long rupture for the mainshock. The fault plane
solution, based on P-wave polarities and hypocentral trend, indicates a reverse faulting
mechanism on a N30°Ε striking plane dipping about 40° to the SE. The rupture depth extends
from about 0.3 to 1.2 km only. Despite the shallow depth of the mainshock, no surface feature
could be correlated with the fault plane. Aeromagnetic data in the epicentral area show short-
wavelength lineaments trending NNE-SSW to NE-SW which we interpret as faults and
fractures in the craton basement beneath the surface limestone layer. We propose that the
Caraíbas-Itacarambi seismicity is probably associated with reactivation of these basement
fractures and faults under the present E-W compressional stress field in this region of the
South American Plate.
2.1. Introduction
The mid-plate region of the South American Plate is characterized by very low rate of
seismicity, typical of stable continental interior. The seismicity in Brazil shows maximum
magnitude of 6.2 mb (Barros et al., 2009) which is lower than the maximum observed in other
intraplate regions, such as Eastern North America, Australia and India where magnitudes
larger than 7 have occurred (Johnston, 1989; Johnston and Kanter, 1990; Johnston, 1996;
Schulte and Mooney, 2005). Despite the low magnitudes in Brazil, maximum intensities of
VII MM (Modified Mercalli) are relatively common (e.g., Berrocal et al., 1984; Ferreira et al.,
1998) making seismic risk evaluation an important issue in projects of critical facilities such
as nuclear installations. On December 9, 2007, a 4.9 mb earthquake occurred in the middle of

Sismicidade de Caraíbas-Itacarambi/MG: causas e características 24
the São Francisco Craton (Figure 2.1). This event with epicenter near Itacarambi city, State of
Minas Gerais, caused the first fatal victim in Brazil, injured six persons, damaged 76
buildings, reaching intensity VII MM in the Caraíbas village. All the inhabitants of Caraíbas
were displaced to new houses constructed by the Minas Gerais State government at
Itacarambi city, located about 36 km east. At Caraíbas, on May 24, 2007, occurred a 3.5
magnitude event. According to historical records of the last century or more this was the first
earthquake ever reported at an area with radius of 30 km from Caraíbas village (Berrocal et
al., 1984).
The models proposed to explain the intraplate seismicity consider that the earthquakes
result from ruptures in weakness zones or from stress concentration (e.g. Sykes, 1978;
Talwani, 1989; Talwani and Rajendran, 1991; Kenner and Segal, 2000). Correlations between
crustal zones of weakness, such as extended crust in aborted rifts or continental margins, and
intraplate earthquakes have been made (Johnston, 1989; Schulte and Mooney, 2005). Stress
concentration in the upper crust due to structural inhomogeneities is also used to try to explain
intraplate seismicity (Sykes, 1978; Talwani, 1989; Talwani and Rajendran, 1991; Kenner and
Segal, 2000; Assumpção et al., 2004).
About half of the earthquakes larger than 5.0 mb in Brazil have occurred near the
continental margin (Assumpção, 1998; Barros et al., 2009) which is a common feature of
intraplate seismicity (Johnston and Kanter, 1990; Schulte and Mooney, 2005). Of the
remaining epicenters in the continental interior, nine are located at the border or inside
Phanerozoic basins and one lies in a Neoproterozoic/Paleozoic fold belt. On the other hand,
no major structural feature is known in the middle of the São Francisco Craton that could be
easily associated with the 2007 event. The study of the 2007 earthquake, therefore, is
important to help understand the causes of mid-plate seismicity in stable continental interiors.
In this paper we present the results obtained with a local seismographic network
installed in the area of the Caraíbas village forty six days before the mainshock occurrence.
The data set comprises foreshocks, the mainshock and aftershocks, including also two large
aftershocks with magnitudes of 3.8 mb and 3.1 mD. The equipments and the financial support
used in the field campaigns for the deployment of the seismic network and the macroseismic
survey were given by the Seismological Observatory of the University of Brasília (SIS/UnB).

Sismicidade de Caraíbas-Itacarambi/MG: causas e características 25
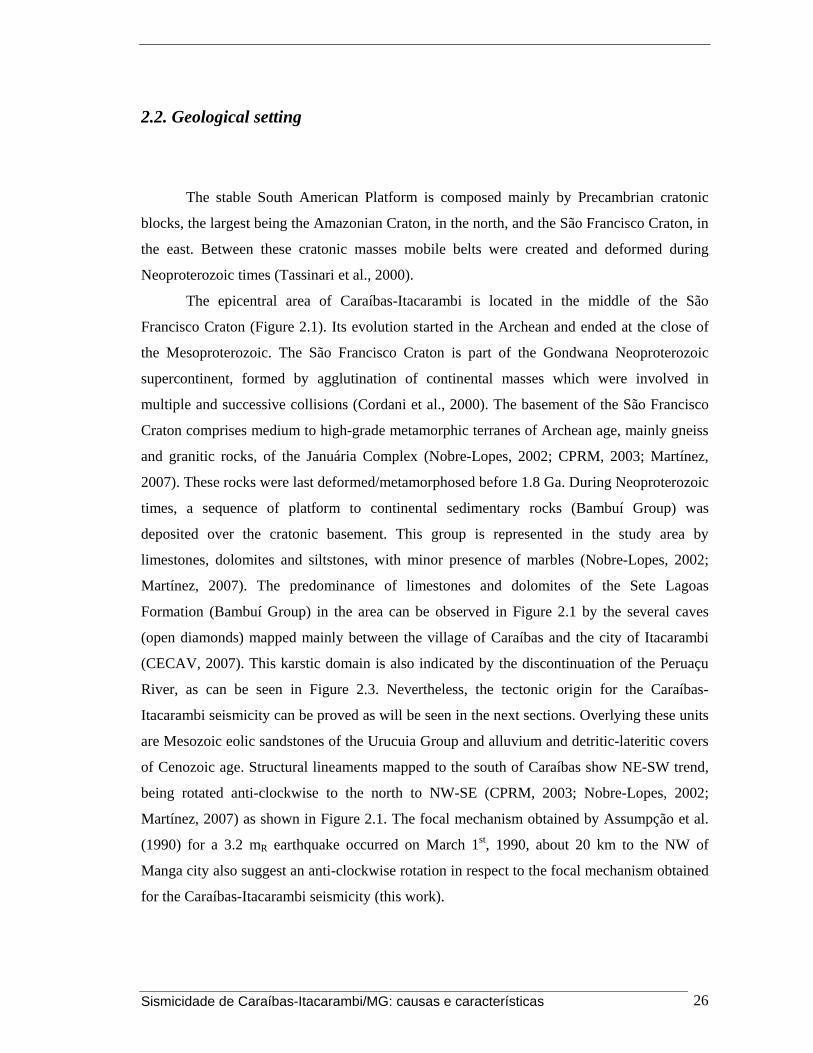
Figure 2. 1 - Geologic map of the Caraíbas-Itacarambi/MG area (CPRM, 2003). The red star and the red circle indicate the epicentral locations of the Caraíbas-Itacarambi earthquake of December 9, 2007 (4.3 mR) (this work) and the Manga earthquake of March 1st, 1990 (3.2 mR) (Assumpção et al., 1990) with the focal mechanisms (beach balls). The structural lineaments are from CPRM (2003) and the open diamonds correspond to mapped caves (CECAV, 2007). The dashed square corresponds to the area of Figure 2.3. In the bottom right the map shows the geographic location of the study area (red square) inside the São Francisco Craton (SF).
Sismicidade de Caraíbas-Itacarambi/MG: causas e características 26
2.2. Geological setting
The stable South American Platform is composed mainly by Precambrian cratonic
blocks, the largest being the Amazonian Craton, in the north, and the São Francisco Craton, in
the east. Between these cratonic masses mobile belts were created and deformed during
Neoproterozoic times (Tassinari et al., 2000).
The epicentral area of Caraíbas-Itacarambi is located in the middle of the São
Francisco Craton (Figure 2.1). Its evolution started in the Archean and ended at the close of
the Mesoproterozoic. The São Francisco Craton is part of the Gondwana Neoproterozoic
supercontinent, formed by agglutination of continental masses which were involved in
multiple and successive collisions (Cordani et al., 2000). The basement of the São Francisco
Craton comprises medium to high-grade metamorphic terranes of Archean age, mainly gneiss
and granitic rocks, of the Januária Complex (Nobre-Lopes, 2002; CPRM, 2003; Martínez,
2007). These rocks were last deformed/metamorphosed before 1.8 Ga. During Neoproterozoic
times, a sequence of platform to continental sedimentary rocks (Bambuí Group) was
deposited over the cratonic basement. This group is represented in the study area by
limestones, dolomites and siltstones, with minor presence of marbles (Nobre-Lopes, 2002;
Martínez, 2007). The predominance of limestones and dolomites of the Sete Lagoas
Formation (Bambuí Group) in the area can be observed in Figure 2.1 by the several caves
(open diamonds) mapped mainly between the village of Caraíbas and the city of Itacarambi
(CECAV, 2007). This karstic domain is also indicated by the discontinuation of the Peruaçu
River, as can be seen in Figure 2.3. Nevertheless, the tectonic origin for the Caraíbas-
Itacarambi seismicity can be proved as will be seen in the next sections. Overlying these units
are Mesozoic eolic sandstones of the Urucuia Group and alluvium and detritic-lateritic covers
of Cenozoic age. Structural lineaments mapped to the south of Caraíbas show NE-SW trend,
being rotated anti-clockwise to the north to NW-SE (CPRM, 2003; Nobre-Lopes, 2002;
Martínez, 2007) as shown in Figure 2.1. The focal mechanism obtained by Assumpção et al.
(1990) for a 3.2 mR earthquake occurred on March 1st, 1990, about 20 km to the NW of
Manga city also suggest an anti-clockwise rotation in respect to the focal mechanism obtained
for the Caraíbas-Itacarambi seismicity (this work).

Sismicidade de Caraíbas-Itacarambi/MG: causas e características 27
2.3. Seismological data
2.3.1. The mainshock of December 9, 2007
Small earthquakes started to occur in the village of Caraíbas, north of Minas Gerais
State, on May 24, 2007, when a 3.5 magnitude event produced some cracks in poor quality
houses, constructed some years ago, consisting of adobe masonry and with walls built up
using earth bricks unconnected to wooden beams and columns.
The mainshock of December 9, 2007 (4.9 mb) produced intense damage in the village
of Caraíbas, mainly in these adobe houses. The maximum intensity reached VII MM (red area
in Figure 2.2), producing the first fatal victim of an earthquake ever reported in Brazil. The
best constructed houses, with reinforced concrete frame structures and masonry infill, suffered
only few superficial wall cracks. This mainshock was felt up to 80 km away from Caraíbas,
and the isoseismal of VI MM intensity comprise an area of about 100 square kilometers.
Figure 2.2 shows the isoseismal map for the Caraíbas-Itacarambi mainshock with the
isoseismal curves (dashed lines). The symbols correspond to Modified Mercalli intensity
values obtained at the places where macroseismic questionnaires were applied to the citizens
during the first weeks after the mainshock occurrence.

Sismicidade de Caraíbas-Itacarambi/MG: causas e características 28
Figure 2. 2 - Map with the isoseismal curves (dashed lines) for the December 9, 2007 (4.9 mb) earthquake with Modified Mercalli (MM) intensities. The symbols represent MM intensities according to the legend. The inset map indicates the location of the study area (red hachured square) next to the border between the states of Minas Gerais and Bahia.

Sismicidade de Caraíbas-Itacarambi/MG: causas e características 29
Table 2.1 shows the source parameters for the December 9, 2007 earthquake
determined by the International Data Center (IDC), National Earthquake Information Center
(NEIC/USGS) and this paper. The epicenters are shown in Figure 2.3. Magnitudes were also
calculated using data from six stations in the range 200 to 1500 km distance, using the
regional magnitude scale for Brazil mR (Assumpção 1983), based on the maximum particle
velocity of the P-wave train, which is equivalent to the teleseismic mb scale. The regional
magnitude of the mainshock is mR = 4.3, lower than the teleseismic 4.9 mb (NEIC).
Table 2. 1 – Source parameters for the December 9, 2007 earthquake.
Origin time hh:mm:ss.ss
Latitude (°)
Longitude(°)
ERH (km)
Depth (km)
Magnitude/ no stations
RMS (s) Reference
02:03:27.96 -15.0632 -44.3242 7.5 0.0f 4.5 mb / 23 0.98 IDC
02:03:29.44 -15.0480 -44.2310 16 10f 4.9 mb / 32 0.92 NEIC/USGS
02:03:28.36 -15.0326 -44.2953 0.2 0.65 4.3 mR / 6 0.02 This work ERH – Horizontal error f – fixed depth
2.3.2. Local Seismographic Network
After the May 24, 2007, 3.5 magnitude event, the local seismic activity in the area
continued to be felt in the following months, and motivated the deployment in October 23,
2007 of a 6-stations network. The seismic stations were composed by broadband sensors
CMG 6TD (Güralp Systems) with flat response from 30 seconds to 100 Hz, acquiring data
continuously at a sampling rate of 400 Hz. During the period of seismic monitoring, the
network configuration was changed. The first distribution of stations (October 23 to
November 1) followed the estimated epicentral area of the 3.5 mR event of May 24,
determined with regional stations. After the epicentral determination of the first events
detected by the local network, the distribution of stations was changed (November 1) to better
constrain the hypocenters. Figure 2.3 shows these two network configurations. The local
network was deactivated in May 25, 2008, and only Station 7 remained to monitor the seismic
activity.

Sismicidade de Caraíbas-Itacarambi/MG: causas e características 30
2.3.3. Temporal Distribution of the Caraíbas Seismicity
Figure 2.4 shows the temporal distribution of the seismicity detected by the local
network (October 23, 2007 to May 25, 2008) and by the single Station 7 (May 26 to August
09, 2008). The figure includes all events with a threshold magnitude of about 0.5 mD,
comprising a total of 662 events. Large aftershocks occurred on March 19, 2008 and April 09,
2008, with magnitudes of 3.8 mR and 3.1 mD, respectively.
Figure 2. 3 - Epicentral distribution of Caraíbas-Itacarambi seismicity. Gray inverse triangles and black triangles indicate the seismographic stations of the first and second networks, respectively (from JAN1 to JAN10). The gray circles, open star and crosses represent the foreshocks, mainshock and aftershocks, respectively. The open diamond and the open inverse triangle indicate the epicentral determination of the mainshock by NEIC and IDC agencies, respectively, with the error ellipses. White squares are villages.

Sismicidade de Caraíbas-Itacarambi/MG: causas e características 31
For the events detected only by the local network, we calculated duration magnitudes (mD)
using the coda duration in seconds (D), measured from the P-wave onset until the amplitude
reaches the local noise level. The equations used (Assumpção et al., 1989) are:
mD = 1.00 log D – 0.02 (D less than 30 seconds) (2.1)
mD = 2.05 log D – 1.61 (D 30 or more) (2.2)
Because of operational problems, several data gaps occurred during the monitoring
period, such as just after the peak of seismicity following the mainshock, from December 13
to 16, 2007, and the longest period of no data, starting in December 29, 2007, and lasting until
January 31, 2008.
Despite the data gaps, a clear decrease in seismicity rate can be observed. An average
of 2.5 events/day was detected until November 16, 2007. From November 17 to December 7,
2007, only three events were detected. Immediately before the mainshock, three events
occurred on December 8, 2007. This pattern characterizes a 21 days seismic quiescence,
followed by immediate precursors to the mainshock. The 21-days seismic quiescence for a
magnitude 4.9mb to 4.4 mR is consistent with the empirical relations obtained from several
other cases as compiled by Scholz (1990).
2.3.4. Hypocentral Determination
From a total of 662 detected events we selected 95 with at least four P- and/or S-wave
readings to perform the hypocentral determination using HYPO71 code (Lee & Lahr, 1975).
An initial velocity model for the area was estimated based on geological data from wells
drilled in sedimentary cover down to the crystalline basement (Nobre-Lopes, 2002; Martínez,
2007), geophysical studies of magnetic and gravimetric fields (Cunha Filho, 2004), and
information of water wells drilled in the north part of the Minas Gerais State (Souza, 1995). In
the Caraíbas-Itacarambi seismic area the thickness of the limestone layer varies between 50
and 200 m (Martínez, 2007). The initial model consists of two horizontal layers over a half-
space. The most superficial layer has P-wave velocity of 3.5 km/s and thickness of 50 meters,
representing the limestones from the Sete Lagoas Formation. The second layer consists of 95
meters of fractured gneiss from the Januaria Complex (basement of the São Francisco
Craton), with P-wave velocity of 5.6 km/sec. The half-space, comprising compact gneiss from

Sismicidade de Caraíbas-Itacarambi/MG: causas e características 32
the Januaria Complex, has P-wave velocity of 6.0 km/s. The Vp/Vs ratio of 1.720 (+- 0.003)
was obtained by a composite Wadati diagram (Figure 2.5). From the located events we
selected a data set of 75 events (including the mainshock) with clear P- and S-wave arrivals,
maximum RMS residual of 0.05 seconds, and magnitude above 1.0 mD. These events have
epicentral distances between 3.5 and 18 km (first network configuration) and 0.5 to 13 km
(second one).
Figure 2. 4 - Temporal distribution of the seismicity at Caraíbas-Itacarambi area from October 23, 2007 to August 9, 2008. Vertical bars indicate the daily number of events recorded by the local networks, the horizontal bars represent periods with no data from the local networks. The stars indicate the three largest events with their magnitudes. Notice the evidence of a seismic quiescence from mid November to early December 2007. The total numbers of events detected on December 9 and December 17, 2007, are indicated at the top of the histogram (163 and 62 events, respectively).
We also searched for a velocity model that gives the least overall RMS travel time
residual for the 75 events, using genetic algorithm (Lopes, 2003), starting with the initial
velocity model. P-wave velocities (Vp) and thicknesses at the two layers and the half-space
were varied to find the model with the least overall RMS travel time residual in the
hypocenter determinations. The best model has, from top to bottom, a first layer 0.1 km thick

Sismicidade de Caraíbas-Itacarambi/MG: causas e características 33
with Vp = 4.4 km/s; a second layer 0.5 km thick with 5.5 km/s and the half-space with Vp =
5.8 km/s.
After the determination of the hypocentral locations for all 75 events using this final
velocity model obtained by the genetic algorithm, we applied the double-difference algorithm
of Waldhauser and Ellsworth (2000) using the hypoDD code (Waldhauser, 2001) to relocate
the events. This algorithm requires that the distance between two events is small compared to
the distance of the pair to a single station. The double-difference algorithm attempts to
minimize the difference between the travel time residuals (double-differences) for a pair of
earthquakes at a single station, compensating for unmodeled velocity heterogeneities along
the path.
Figure 2. 5 - Composite Wadati diagram for Caraíbas-Itacarambi seismicity determined using 75 events and 352 data (squares). The best fit (solid line) corresponds to a Vp/Vs ratio of 1.720 (+- 0.003).
The result of hypocentral determinations using hypoDD is shown in Figure 2.6. The
epicentral map for the 75 relocated events is shown in Figure 2.6a. Figure 2.6b shows the
vertical profile along the continuous line AB (azimuth of 115°) shown in the map passing
through Station 8 (black triangle). The events are differentiated as foreshocks (circles),
imminent foreshocks (diamonds), mainshock of December 9, 2007 (large star) and

Sismicidade de Caraíbas-Itacarambi/MG: causas e características 34
aftershocks (squares). The little star corresponds to the largest aftershock of March 19, 2008
(3.8 mR). Depths shallower than 0.6 km are denoted by open symbols deeper by gray symbols.
The epicentral distribution suggests an approximately 3-km long zone roughly aligned
in the NE-SW direction. Station 8 (second deployment) nearest to the epicenters better
constrains the depths of the events. Only the events detected by this station (imminent
foreshocks, the mainshock and most of the aftershocks including the largest one) have more
reliable focus depths and are displayed in the vertical profile AB (Figure 2.6b). The early
foreshocks detected only by the first network stations, at larger distances from the epicenters
and less constrained hypocentral depths, are not plotted in the profile. A general trend is seen
with shallower events to the Northwest (depths between 0.3 and 0.6 km) and deeper to the
Southeast (down to 1.2 km).
The fifteen events with epicenters near Station 8 (dashed box in Figure 2.6a) were
analyzed with more detail. We performed a visual P and S-waveform cross-correlation for the
events of this cluster, as shown in Figure 2.7, to get more accurate relative arrival times. The
relocated hypocenters for this cluster are presented in Figure 2.8, following the same symbol
and color criteria used in Figure 2.6. The continuous line AB, with azimuth of 115° (passing
through Station 8) in Figure 2.8a, defines the vertical profile presented in Figure 2.8b. This
vertical section shows that the events are well aligned starting with a depth of 0.4 km at the
NW and reaching down to depths of approximately 0.8 km to the SE. This feature can be
interpreted as the fault plane dipping to the SE with an angle of approximately 40°.

Sismicidade de Caraíbas-Itacarambi/MG: causas e características 35
Figure 2. 6 - (a) Map of the Caraíbas-Itacarambi seismicity showing foreshocks (circles), imminent foreshocks (diamonds), mainshock (large star) and aftershocks (squares). The little star corresponds to the 3.8 mR magnitude aftershock. Events shallower than 0.6 km are shown in open symbols, and deeper in gray. Line AB indicates the direction (azimuth of 115 degrees) of the vertical profile that passes through Station 8 (black triangle). The dashed box corresponds to the zoom area of Fig. 2.8. (b) Vertical section AB passing through Station 8 (black triangle) showing the depth distribution of the hypocenters. The symbols follow the pattern of Figure 2.8a. Only events recorded by Station 8, with better constrained depths, are shown. The abscissa axis indicates relative distances in kilometers over the line AB, with positive values from Station 8 to point B and negative ones to A.

Sismicidade de Caraíbas-Itacarambi/MG: causas e características 36
2.3.5. Focal Mechanism
From the data set of 75 relocated events we used 37 events to determine composite
focal mechanism using FPFIT code (Reasenberg and Oppenheimer, 1985), assuming that all
the events have the same source mechanism. The selected 37 events have at least 8 readings
(4 P- and 4 S-wave readings), azimuth gaps between 119° and 165°, RMS travel time
residuals equal or lower than 0.035 sec, and ERH (horizontal error) smaller than 0.20 km. A
total number of 150 P-wave polarities from the data set of these 37 events were used to
determine the composite focal mechanism. For some events the first polarities were affected
by a-causal effects of the anti-alias digital filter, mainly at Station 7, which is the only station
located in an outcrop. In these cases a correction was applied before reading the P-wave
polarities.
Figure 2. 7 - Waveform correlations at Station 8 for the events located inside the dashed box of Figure 2.6, using the vertical component for the P-wave (a) and N-S component for the S-waves (b).

Sismicidade de Caraíbas-Itacarambi/MG: causas e características 37
For the local data set, the best FPFIT solution corresponds to a plane with strike 10°,
dip of 70° and rake of 60° (Figure 2.9a). Including P-wave polarities of regional and
teleseismic stations (larger symbols in Figure 2.9b) to the local data set, and using the
hypocenter trends seen in Figures 2.6 and 2.8, a preferred solution is given as 30° of strike,
40° of dip and 105° of rake (Figure 2.9b). This is the adopted focal mechanism solution for
the Caraíbas-Itacarambi seismicity.
Figure 2. 8 - (a) Map of the southern cluster (dashed box in Figure 2.6). All symbols and colors follow the pattern of Figure 2.6; (b) Vertical projection along line AB showing depth distribution of hypocenters indicating a dip of about 40º to the SE.

Sismicidade de Caraíbas-Itacarambi/MG: causas e características 38
Some inconsistencies found for this solution (such as the compressional polarities of the local
data in the SW quadrant) can be related to hypocentral errors causing large deviations in
azimuth and take-off angles at Station 8. This fault plane solution corresponds to a reverse
fault with near horizontal, E-W trending P-axis.
This result is similar to the focal mechanism solution obtained for another seismic
activity occurred near Manga, 50 km to the North of Caraíbas, occurred in 1990, which also
showed a reverse mechanism with N-S trending fault (Assumpção et al., 1990) as showed in
Figure 2.1.
Figure 2. 9 - Composite focal mechanism for Caraíbas-Itacarambi seismicity. (a) Result of FPFIT code using only local data. (b) Adopted final solution taking into account the local (small symbols), regional and teleseismic (larger symbols) polarities, as well as the hypocentral distribution. Circles and crosses represent dilatational and compressional P-wave first arrivals, respectively. P and T indicate the tension and compression axes, respectively.

Sismicidade de Caraíbas-Itacarambi/MG: causas e características 39
Table 2. 2 – Focal mechanism solutions used to determine the stress tensor in the central part of the São Francisco Craton.
# Location Latitude Longitude Depth (km) Strike Dip Rake
1 Correntina/BA -13.458° -44.554° 0.6 342° 71° 68° 2 Brasília/DF -16.062° -47.599° 2.2 280° 70° 70° 3 Manga/MG -14.575° -44.118° 0.8 350° 65° 70° 4 Encruzilhada/MG -15.910° -40.910° 1.0 335° 25° 90° 5 Caraíbas-Itacarambi/MG -15.0326° -44.2953° 0.65 030° 40° 105°
# - Event number Source: (1) and (2) – Lopes (2008); (3) – Assumpção et al. (1990); (4) – Veloso (1990); (5) –this work.
2.4. Discussion
The length of the rupture zone of the mainshock, as determined by the aftershocks, is
about 3 km long. This is consistent with scaling relations for mid-plate earthquakes, which
indicate a mb magnitude between 4.5 and 5.0 for a 3 km rupture (Nuttli, 1983).
The shallow depth of the rupture is well constrained by the local network. Different
velocity models, as discussed earlier, were used to locate the hypocenters and the best
constrained focal depths are consistently less than about 1 km. Despite the shallow depth of
the mainshock (less than 1 km), no clear topographical or geomorphological feature could be
associated with the SSW-NNE fault plane. To investigate basement structural features, hidden
beneath the limestone layers, we processed aeromagnetic data from a regional survey.
The data comprised 625 linear kilometers long profiles with direction N30°W, spaced
250 m apart, covering an area of 140 square kilometers in the north of Minas Gerais State
(SEME, 2000). We applied a first order vertical derivative to the anomalous magnetic field
data for the study area. The vertical derivative is commonly used to enhance the shallowest
geological sources, mainly structural lineaments. In the resulting image (Figure 2.10), we can
see NE-SW lineaments near the epicentral area, roughly parallel to the fault plane. These
magnetic lineaments are probably related to basement fractures and faults.

Sismicidade de Caraíbas-Itacarambi/MG: causas e características 40
Figure 2. 10 - First order vertical derivatives of the aeromagnetic field in the region of study. The white circles are the epicenters. Note the short-wavelength lineaments trending SW-NE near the epicentral area parallel to the fault strike.
Focal mechanisms of other events in the São Francisco Craton, two to the north of
Caraíbas (Lopes, 2008; Assumpção et al., 1990), one to the east (Veloso, 1990), and one to
the west (Lopes, 2008) are also reverse fault. Table 2.2 presents the focal mechanism
solutions for these earthquakes. Stress inversion of these four events together with the
Caraíbas-Itacarambi focal mechanism indicates an E-W compressional stress field (Lopes,
2008). Basement fractures and faults, oriented in the NE-SW direction, probably are being
reactivated under the present E-W compressional stress field.

Sismicidade de Caraíbas-Itacarambi/MG: causas e características 41
2.5. Conclusions
Detailed analysis of the hypocentral distribution of the Caraíbas-Itacarambi seismicity
and P-wave polarity data observed at local, regional and teleseismic distances, indicates that
the earthquakes occurred along one main fault rupture of about 3 km long by 2 km wide
striking N30°E and dipping 40° to the Southeast. The focal depths range from approximately
0.3 to 1.2 km.
The seismicity at Caraíbas is probably a result of the reactivation of preexisting faults
in the São Francisco Craton basement, with directions NE-SW and NNE-SSW, in response to
the present E-W compressional stress field.
Acknowledgements
We thank the staff of Peruaçu Caves National Park, especially Ivan Borba Lima and
Evandro Pereira da Silva, for logistic support during the field campaigns and the stations
operations. We also thank Sidinei S. Tomás for the cooperation during installation and
maintenance of the field equipments, and Kate T. de Souza for the support in the generation
of the macroseismic map. The authors thank Tectonophysics Editor Tom Parsons, and two
anonymous reviewers for their comments and suggestions, that greatly improved our work.

Sismicidade de Caraíbas-Itacarambi/MG: causas e características 42
References
Assumpção, M., 1983. A regional magnitude scale for Brazil. Bull. Seism. Soc. Am., 73(1):
237-246. Assumpção, M., Takeya, M., Ferreira, J.M., Costa, A., Sophia, C.M., 1989. Magnitude
calculation and frequency-magnitude relation for João Câmara events, RN. Brazilian Geophysical Journal, Vol. 7(2), 107-116.
Assumpção, M., Veloso, J.A.V., Barbosa, J.R., Blum, M.L.B., Carvalho, J.M., Neves, E.,
Bassini, A., 1990. The Manga earthquakes, MG, March of 1990. In: XXXVI Brazilian Congress of Geology, 1990, Natal-RN. Proceedings of the XXXVI Brazilian Congress of Geology. Natal-RN: SBG, 1990. v. 6. p. 2154-2159.
Assumpção, M., 1998. Seismicity and stresses in the Brazilian passive margin. Bull. Seismol.
Soc. Am. 78 (1), 160–169. Assumpção, M., Schimmel, M., Escalante, C., Barbosa, J.R., Rocha, M., Barros, L.V., 2004.
Intraplate seismicity in SE Brazil: stress concentration in lithospheric thin spot. Geophys. J. Int. 159, 390–399.
Barros, L.V., Assumpção, M., Quintero, R., Caixeta, D., 2009. The intraplate Porto dos
Gaúchos seismic zone in the Amazon craton — Brazil, Tectonophysics (2009), doi:10.1016/j.tecto.2009.01.006.
Berrocal, J., Assumpção, M., Antezana, R., Dias Neto, C., Ortega, R., França, H., Veloso,
J.A., 1984. Sismicidade do Brasil. Published by IAG/USP and Comissão Nacional de Energia Nuclear, Brazil, 320 pp.
CECAV, 2007. Base de dados geoespacializados de cavidades naturais subterrâneas do Centro
Nacional de Estudo, Proteção e Manejo de Cavernas – CECAV, IBAMA. Cordani, U.G., Sato, K., Teixeira, W., Tassinari, C., Basel, M.A., 2000. Crustal evolution of
the South America Platform. In: U.G. Cordani; A. Thomaz filho; J. Milani. (Org.). Tectonic Evolution of South America. Rio de Janeiro: CPRM, 2000, v. , p. 41-95.
CPRM, 2003. Digital atlas of geology and mineral resources of Minas Gerais State, scale
1:500.000. Cunha Filho, E.M. da, 2004. Contribution to the geology and evaluation of mineral potential
in the Januária-Itacarambi-Montalvânia region (Minas Gerais State), Master Degree Thesis (in Portuguese), Institute of Geosciences, University of Brasília, 141 pp.
Ferreira, J.M., Oliveira, R.T., Takeya, M.K., Assumpção, M., 1998. Superposition of local and
regional stresses in northeast Brazil: evidence from focal mechanisms around the Potiguar marginal basin. Geophys. J. Int. 134, 341–355.

Sismicidade de Caraíbas-Itacarambi/MG: causas e características 43
Johnston, A. C., 1989. Seismicity of “stable continental interiors”, in Earthquakes at North-Atlantic Passive Margin: Neotectonics and Postglacial Rebound, edited by S. Gregersen and P. W. Basham, pp.299-327, Kluwer Acad., Norwell, Mass.
Johnston, A.C., Kanter, L.R., 1990. Earthquakes in stable continental crust. Sci. Am. 262, 68–
75. Johnston, A.C., 1996. Seismic moment assessment of earthquakes in stable continental
regions.1. Instrumental seismicity. Geophys. J. Int. 124, 381–414. Kenner, S.J., Segal, P., 2000. A mechanical model for intraplate earthquakes: application to
the New Madrid seismic zone. Science 289 (5488), 2329–2332. Lee, W. H. K., Lahr, J.C., 1975. HYPO71: A computer program for determining hypocenter,
magnitude, and first motion pattern of local earthquakes. U.S. Geol. Surv. Open-File Rep. pp. 75-311.
Lopes, A.E.V., Assumpção, M., Barbosa, J.R., 2003. Modelagem da estrutura crustal média
em Goiás com algoritmo genético, 8th International Congress of the Brazilian Geophysical Society, Rio de Janeiro, CD-ROM.
Lopes, A.E.V., 2008. Focal mechanisms and lithospheric stresses in Brazil. PhD Thesis (in
Portuguese), IAG, University of São Paulo, 300 pp. Martínez, M.I., 2007. Stratigraphy of Bambuí Group at the north of the São Francisco River
Valley, MG. Master Degree Thesis (in Portuguese), Institute of Geosciences, Federal University of Minas Gerais, 122 pp.
Nobre-Lopes, J., 2002. Diagenesis of the dolomites hosting Zn/Ag mineral deposits in the
Bambui Group at Januaria Region-MG, PhD Thesis, University of Campinas, Campinas, São Paulo, Brazil, 183 pp.
Nuttli, O., 1983. Average seismic source-parameter relations for mid-plate earthquakes, Bull.
Seism. Soc. Am., 73 (2) 519-535. Reasenberg, P., Oppenheimer, D., 1985. FPFIT, FPPLOT and FPPAGE: Fortran computer
programs for calculating and displaying earthquake fault-plane solutions. U.S. Geol. Surv. Open-File Rep. 85-739, 109 pp.
SEME, 2000. Aerogeophysical survey in the North of Minas Gerais State. Area 5. (in
Portuguese) Secretaria Estadual de Minas e Energia (SEME), Minas Gerais, Brazil. Scholz, C.H., 1990. The Mechanics of Earhquakes and Faulting. Cambridge U.P., 439pp. Schulte, S.M., Mooney, W.D., 2005. An updated global earthquake catalogue for stable
continental regions: reassessing the correlation with ancient rifts. Geophys. J. Int. 161, 707–721.

Sismicidade de Caraíbas-Itacarambi/MG: causas e características 44
Sykes, L.R., 1978. Intraplate seismicity, reactivation of preexisting zone of weakness, alkaline magmatism, and other tectonism posdating continental fragmentation. Rev. Geophys. Space Phys. 245, 298–302.
Souza, S.M.T. de, 1995. Subsurface water availabilities of Minas Gerais State (in
Portuguese).COPASA-MG. 525 p. Talwani, P., 1989. Characteristic features of intraplate earthquakes and the models proposed
to explain them. In: Gregersen, S., Basham, P.W. (Eds.), Earthquakes at North Atlantic Passive Margins: Neotectonics and Post-Glacial Rebound. Kluwer, Dordrecht, pp. 289–297.
Talwani, P., Rajendran, K., 1991. Some seismological and geometric features of
intraplateearthquakes. Tectonophysics 186, 19–41. Tassinari, C. C. G., Bettencourt, J. S., Geraldes, M. C., Macambira, M., Lafon, J. M., 2000.
The Amazonian Craton. In: U.G. Cordani; A. Thomaz filho; J. Milani. (Org.). Tectonic Evolution of South America. Rio de Janeiro: CPRM, 2000, v. , p. 41-95.
Veloso, J.A.V., 1990. Atividade sísmica de Encruzilhada-BA, 36th Brazilian Congress of
Geology, Natal (in Portuguese). Waldhauser, F., 2001. HYPODD – A program to compute double-difference hypocenter
locations. U.S. Geol. Surv. Open-File Rep pp. 01-113. Waldhauser, F., Ellsworth, W.L., 2000. A double-difference earthquake location algorithm:
Method and application to the Hayward fault, Bull. Seism. Soc. Am., 90, 1353-1368.

Sismicidade de Caraíbas-Itacarambi/MG: causas e características 45
Capítulo 3
Moment tensor solutions for weak earthquakes at Caraíbas-
Itacarambi, São Francisco Craton, Brazil
Cristiano N. Chimpliganond1, Hossein Shomali2, Jiri Zahradnik3 & George Sand França1
1 Seismological Observatory, University of Brasilia, Brasilia, 70910-000, Brazil –
{[email protected] , [email protected]}
2 Department of Earth Sciences, Geophysics, Uppsala University, SE-752 36, Uppsala,
Sweden – [email protected]
3 Charles University in Prague, Faculty of Mathematics and Physics, Czech Republic –
Submitted to Bulletin of the Seismological Society of America

Sismicidade de Caraíbas-Itacarambi/MG: causas e características 46
ABSTRACT
We have analyzed the focal mechanism of 19 events with magnitudes between 1.0 and 4.6
which occurred very close to the village of Caraíbas, in the middle of São Francisco Craton,
Southeast of Brazil. Two different methods were used: (i) We retrieved the moment tensor for
3 events (Mw 0.9 – 1.4) by applying time-domain waveform inversion in the frequency range
1.0-2.8 Hz for a very local seismic network. (ii) A Relative Moment Tensor Inversion (RMTI)
technique was used based on amplitude spectra of direct P- and S-waves on vertical and
rotated horizontal components, respectively, for 17 events (duration magnitude 1.0 - 4.6).
Four distinct groups of spatially clustered events were studied. These clusters have previously
been relocated with high accuracy using double-difference algorithm. The focal mechanisms
obtained in this study for both methods show dominant reverse-fault planes with direction
predominantly Northeast-Southwest, with P- and T-axes suggesting E-W compression in the
region during the activity, which is in good agreement with other studies from focal
mechanisms and strain measurements in this part of South American plate.
3.1. Introduction
Low rate seismicity in Brazil is typical for an intraplate region. However, contrasting
to other intraplate regions, such as Eastern North America, Australia and India where
magnitudes larger than 7 have been reported (Johnston, 1989; Johnston and Kanter, 1990;
Johnston, 1996; Schulte and Mooney, 2005), the maximum observed magnitude in Brazil was
mb 6.2 (Barros et al., 2009). Despite the relatively low magnitudes, intensities of VII MM
(the modified Mercalli intensity scale) are not uncommon, being an important issue in seismic
risk studies.
The Caraíbas-Itacarambi seismic region is located in the middle of São Francisco
Craton (see Figure 3.1). Its activity reported in this paper started on May 24, 2007 with a mb
3.5 earthquake and culminated on December 9, 2007 with the mainshock of mb 4.6 (average).
Historical seismicity indicates that no seismic events occurred in this region since, at least, the
last century (Berrocal et al., 1984). The mainshock happened after a seismic quiescence of
about 21 days and was followed by hundred of aftershocks (Chimpliganond et al., 2010).

Sismicidade de Caraíbas-Itacarambi/MG: causas e características 47
Some foreshocks, the mainshock and aftershocks were recorded by a very local network (see
Figure 3.2), providing data with highly accurate hypocentral locations.
The hypocentral distribution of 75 well recorded (by at least 5 local stations) events
was obtained using double-difference algorithm (Waldhauser and Ellsworth, 2000;
Waldhauser, 2001), suggesting a fault plane activated in a zone about 3 by 2 kilometers along
strike and dip (Chimpliganond et al., 2010).
Focal mechanism solution using first P-wave polarities indicates a reverse faulting
striking N30°E and dipping 40° to southeast (Chimpliganond et al., 2010). This focal
mechanism is very similar to that obtained for Manga seismic area, approximately 50 km to
the north (Assumpção et al., 1990).
Therefore, the main objective of the present paper is to deeper analyze the focal
mechanisms using two existing inversion methods - the time domain waveform inversion of
selected individual events of a good signal-to-noise ratio, and relative spectral inversion of
clustered events. Although the used methods are not new, their application to weak events at
local stations and relatively high frequencies is methodically challenging.
Although the results obtained until now for the Caraíbas-Itacarambi seismic events
indicate their tectonic origin, we should also consider the presence of many caves in the area
(Figure 3.1). For this reason, the possibility of cave collapse as the seismic source of some
events was investigated in this paper. Therefore, in both used inversion methods we also
evaluated the double-couple percentage of the seismic sources in order to better understand
the genesis of the Caraíbas-Itacarambi seismicity.
3.2. Geological setting and data
The village of Caraíbas is located near the city of Itacarambi, in the northern part of
Minas Gerais State, Southeast of Brazil. This area is in the middle of São Francisco Craton, an
Archean cratonic block, part of the Gondwana Neoproterozoic supercontinent (Figure 3.1).
Archean cratonic blocks and Neoproterozoic mobile belts comprise the stable region of South
American Platform.
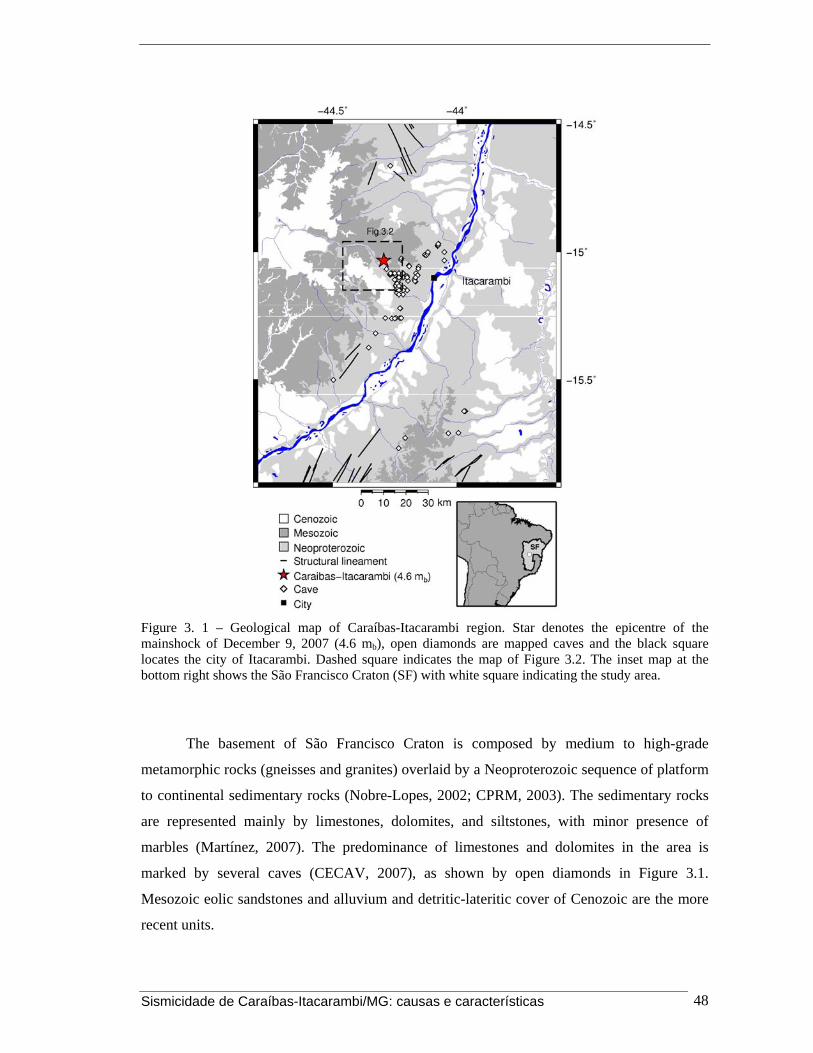
Sismicidade de Caraíbas-Itacarambi/MG: causas e características 48
Figure 3. 1 – Geological map of Caraíbas-Itacarambi region. Star denotes the epicentre of the mainshock of December 9, 2007 (4.6 mb), open diamonds are mapped caves and the black square locates the city of Itacarambi. Dashed square indicates the map of Figure 3.2. The inset map at the bottom right shows the São Francisco Craton (SF) with white square indicating the study area.
The basement of São Francisco Craton is composed by medium to high-grade
metamorphic rocks (gneisses and granites) overlaid by a Neoproterozoic sequence of platform
to continental sedimentary rocks (Nobre-Lopes, 2002; CPRM, 2003). The sedimentary rocks
are represented mainly by limestones, dolomites, and siltstones, with minor presence of
marbles (Martínez, 2007). The predominance of limestones and dolomites in the area is
marked by several caves (CECAV, 2007), as shown by open diamonds in Figure 3.1.
Mesozoic eolic sandstones and alluvium and detritic-lateritic cover of Cenozoic are the more
recent units.

Sismicidade de Caraíbas-Itacarambi/MG: causas e características 49
In Figure 3.1 structural lineaments trending NE-SW to the south of Caraíbas are also
observed, showing anti-clockwise rotation to the north to NW-SE trending (CPRM, 2003;
Nobre-Lopez, 2002). Some geomorphological features (river aligned, topographic highs) also
display NE-SW and NW-SE trends.
The seismic activity in the Caraíbas-Itacarambi area was monitored by a very local 6-
station network (maximum epicentral distance of 20 km), see Figure 3.2. All the stations were
equipped by Guralp CMG-6TD broadband seismometer with flat velocity response in the
frequency range from 0.03 to 100 Hz. The sampling frequency was 400 Hz.
The configuration of the network changed with time so, although Figure 3.2 presents
eight stations, only a maximum of six stations operated simultaneously at each configuration.
The network was installed in the end of October 2007 due to the first felt events, just 2
months before the mainshock occurrence. Until its deactivation in August 2008, the network
detected hundreds of events with magnitude above 0.5 Md (duration magnitude), including
the mainshock with mb 4.6 (average).
3.3. Methods
Moment tensors represent the most general description of the earthquake mechanism,
assuming the point source approximation. The n-th component of displacement observed at a
receiver nu is a convolution of the source contribution represented by the moment tensor ijM
with the medium response represented by Green's tensor derivatives jniG , . This linear
relationship is given by the representation theorem:
jniijn GMu ,= (3.1)
Einstein's summation convention is used over indices i,j = 1,2,3. Equation 3.1 is the
basis for both methods applied in this article, time domain waveform inversion using ISOLA
(Zahradník et al., 2005; Sokos and Zahradník, 2008 and 2013) and Relative Moment Tensor
Inversion (RMTI hereafter; Dahm, 1993; 1996).
The full moment tensor comprises a deviatoric and a volumetric part. The deviatoric
moment can be decomposed in different ways (e.g., Jost and Herrmann, 1989), the most
common being the decomposition into the double-couple (DC) and compensated linear vector
dipole (CLVD) parts, which is adopted in this article.

Sismicidade de Caraíbas-Itacarambi/MG: causas e características 50
3.3.1 – Time Domain Waveform Inversion
The waveform inversion was performed using the ISOLA computer code, built in
Fortran with a user friendly interface in Matlab (Zahradník et al., 2005; Sokos and Zahradník,
2008; 2013). It performs an iterative deconvolution of multiple point sources, based on
Kikuchi and Kanamori (1991) inverse-problem formulation, using 6 elementary moment
tensors. To adapt to regional and local data, the Green's functions are calculated using the
discrete wavenumber method of Coutant (1990) and Bouchon (2003) and a one-dimensional
crustal velocity model. A measure of the fit between observed (O) and synthetic (S)
waveforms is given by the overall variance reduction (varred): OE−= 1varred , where
( )2∑ −= ii EOE , ( )2∑= iOO , with summation over all samples, components, and stations.
Varred equals to the squared (zero-lag) correlation between the observed and synthetic
seismograms. Another important parameter indicating stability of the inversion is given by the
ratio of minimum to maximum eigenvalues of the least-squares matrix. The larger it is the
more stable is the inversion. For more details, see Krížová et al. (2013).
Although ISOLA code was used in many low-frequency moment tensor inversions of
near regional weak-earthquake waveforms (e.g., Zahradník et al., 2008a; Reinoso, 2011;
Agurto et al., 2012), its application to relatively high-frequency local data, like in the present
paper, has been so far rather rare (e.g., Fojtíková et al., 2010; Benetatos et al., 2012).

Sismicidade de Caraíbas-Itacarambi/MG: causas e características 51
Figure 3. 2 – Epicentral distribution of Caraíbas-Itacarambi seismicity (gray circles). Events used in moment tensor inversion in time domain with ISOLA are denoted by white circles, and the seismic stations used in analysis by black triangles. Color of moment tensor indicates Kagan's angle (KA) (Kagan, 1991) calculated with respect the reference composite focal mechanism (CFM), top right beachball, obtained by Chimpliganond et al. (2010). For more details see text.
3.3.1.1 – Results
We selected three best recorded events (Table 3.1) based on signal-to-noise ratio and
the available number of recordings, to invert the waveforms for deviatoric moment tensors.
The mainshock waveforms could not be inverted because their amplitudes were clipped. Thus
all the studied events are aftershocks.
The records were corrected for the instrumental response and converted to
displacements. The Green's function was calculated using two velocity models. The first one
is the same as used by Chimpliganond et al. (2010) for hypocentral determination. It consists
of two planar layers over a half-space. The first layer has P-wave velocity of 4.4 km/s and
thick of 0.1 km; the second layer is 0.5 km thick with Vp=5.5 km/s; and the half-space
Vp=5.8 km/s. The Vp/Vs ratio value is 1.72 for the whole medium. The second model
comprises only the half-space with Vp=5.8 km/s and Vp/Vs=1.72.

Sismicidade de Caraíbas-Itacarambi/MG: causas e características 52
Table 3. 1 - Events selected for waveform inversion using ISOLA.
Event Date yyyy-mm-dd
Hypocentre Origin Time
(UT)
Epicentre Lat (°)
Epicentre Long
(°)
Depth (km) Md Stations used
a 2008-02-13 17:05:52.0 -15.0377 -44.3037 0.5 2.3 2/6/7/8
b 2008-03-02 01:54:18.4 -15.0465 -44.2967 0.8 2.3 2/7/8
c 2008-04-09 02:39:09.9 -15.0307 -44.3083 0.2 3.1 2/6/7/8 UT is universal time. Md is duration magnitude. Lat and Long are latitude and longitude.
Comparing the preliminary results obtained by inverting the waveforms using both
velocity models, we decided to finally use the homogeneous half-space model for two
reasons. First because for the frequency range up to 2.8 Hz used in inversion the uppermost
layers of the first velocity model have thicknesses smaller than the shortest wavelengths used.
Second due to the fact that the inversion results for both velocity models are almost the same.
We inverted for deviatoric moment tensors of three events (a, b, and c of Table 3.1,
Figures 3.1 and 3.2). As a common procedure for all events we performed a spatial grid
search around the location-provided hypocenter position to find the centroid (center of gravity
of the faulted area) location. Naturally, for small events, centroid and hypocenter should be
close to each other. The centroid was calculated as the point with optimum waveform fit
determined during the moment tensor retrieval. The grid composed by 25 points (5x5)
centered at the epicenter, spaced by 0.2 km, was placed at 10 different depth values, from 0.2
km down to 2.0 km, at steps of 0.2 km.
Analogously, we did a temporal grid search to find the “centroid origin time”, starting
at the hypocenter origin time ± 1 second, at time steps of 0.03 seconds. The moment-tensor
inversion was performed at each grid point of a horizontal stencil, at each depth and each time
shift, thus representing a complete 4D search. We chose the optimum solution showing the
best waveform fit.
For the first event, which occurred on 13 February 2008, 17:05:52.0 UT (Md 2.3), we
used waveforms band-pass filtered with corner frequencies of 1.6 and 2.8 Hz from stations
JAN2, JAN6, JAN7 and JAN8. The second event of 02 March 2008, 01:54:18.4 UT (Md 2.3)
had records of stations JAN2, JAN7, JAN8 and JAN9 filtered at frequency band of 1.8 to 2.8
Hz. The waveforms of the third event of 09 April 2008, 02:39:09.9 UT (Md 3.1) at stations
JAN2, JAN6, JAN7, JAN8 and JAN9 were inverted at frequency band from 1.0 to 1.5 Hz.
The low-frequency limits were determined to get good signal to noise ratio. The high-
frequency limit was chosen as to make waveform modeling feasible.

Sismicidade de Caraíbas-Itacarambi/MG: causas e características 53
The inversion results are presented in Table 3.2. As seen from this table, all the
solutions have the best fitting solution characterized by overall variance reduction near 0.7.
Figure 3.2 shows the results of waveform inversion for three studied events. The same figure
presents a map with epicenter of Caraíbas-Itacarambi seismicity (open gray circles) and the
events studied with ISOLA (full circles). “Beach balls” show the solutions obtained with
ISOLA.
Table 3. 2 – Deviatoric moment tensor solutions of the studied events using ISOLA (Table 3.1).
Event NS Centroid
Origin Time (UT)
Centroid Lat (°)
Centroid Long
(°)
Centroid Depth (km)
Strike (°)
Dip (°)
Rake (°)
DC (%) Mw VR
Ratio min/m
ax
KA (°)
a 4 17:05:51.6 -15.0359 -44.3018 0.5 11 65 74 80 0.9 0.69 0.06 34
b 3 01:54:18.0 -15.0483 -44.2967 1.0 41 36 73 71 1.0 0.71 0.11 34
c 4 02:39:08.4 -15.0253 -44.3075 1.0 31 64 73 88 1.4 0.65 0.21 33 NS stands for number of stations used in inversion. Lat and Long are latitude and longitude. DC stands for double-couple. Mw is moment magnitude. VR is the variance reduction value. Ratio min/max denotes the ratio of the minimum to maximum eigenvalues of the least-squares matrix. KA is the Kagan's angle between focal mechanism solution obtained by ISOLA and reference focal mechanism given by P-wave first motion (Chimpliganond et al., 2010).
An example of the correlation plot for all points of the spatial grid placed at 1 km
depth, used for Event c (Table 3.1), is presented in Figure 3.3. Position number 14 has the
largest correlation coefficient between observed and synthetic waveforms and was chosen as
the result. Focal mechanism solution and double-couple percentage (DC%) for each point are
also displayed in Figure 3.3.

Sismicidade de Caraíbas-Itacarambi/MG: causas e características 54
Figure 3. 3 - Correlation between observed and synthetic seismograms. The plot shows all 25 trial source positions of the spatial grid of 0.2 x 0.2 km increments in the West-East and South-North direction for Event c (Tables 3.1 and 3.2) at depth of 1 km. Epicenter is in the middle of the plot (point no. 13). The temporally optimized focal mechanism for each point is colored accordingly to the double-couple (DC) percentage. Contour lines display the correlation coefficient value.
Figure 3.4 shows correlation coefficient as a function of time position of source 14 for
Event c (Table 3.1). The location-based origin time was formally shifted to time = 20 seconds
and we performed the inversion from 2 seconds prior to 1 second after. The result of inversion
at each 0.03 second of time step is presented with a beach-ball, color-coded accordingly to
DC%. Time 19.29 shows the best-fitting result (the centroid time) with the largest correlation
coefficient.
We can also observe a clear dependence of the correlation coefficient on time shift.
The periodicity marked by maxima values on correlation coefficients with opposite sign in
moment tensor is an undesired effect of inverting seismogram in a relatively narrow
frequency band (Zahradník et al., 2005). In that case, the waveforms are similar to sinusoidal
signal and if shifted by half-period and with opposite sign it can be fitted equally well. It
means that the waveform inversion can retrieve a stable mechanism but it cannot safely
retrieve its sign. This ambiguity is easily solved by checking just a few P-wave polarities.

Sismicidade de Caraíbas-Itacarambi/MG: causas e características 55
Figure 3. 4 – Plot of correlation coefficient as function of temporal source shift for source number 14 of Event c (Tables 3.1 and 3.2). Best solution (largest correlation coefficient value) is at time shift of 19.29 seconds. The location-provided origin time is formally denoted as time = 20 seconds.
Figure 3.5 shows the fit between observed and synthetic displacement waveforms at
stations and the moment tensor inversion result for Event c (Table 3.1). The seismograms
were band-pass filtered at corner frequencies of 1.0 Hz and 1.5 Hz. A very good fit is
observed for station JAN2, in both amplitude and time, at components North-South (N), East-
West (E) and Vertical (Z). Station JAN8 presents a good fit for N and Z components, and
stations JAN7 and JAN6, at Z component. No fit could be found at station JAN9, especially
for horizontal components. Station JAN9 has the largest epicentral distance, and was installed
in soft soil, whereas the other stations were placed at rock sites.

Sismicidade de Caraíbas-Itacarambi/MG: causas e características 56
Figure 3. 5 – Waveform fit between observed and synthetic displacements at stations and the moment tensor inversion result for source position number 14 of Event c (Tables 3.1 and 3.2). Observed data are in black and synthetic in red. Gray waveforms were not used in inversion procedure. Open circles in “beach-ball” denote dilatation first P-wave motion.
The waveform misfit in JAN9 is probably related to site effects missing in the
modeling because the local velocity structure has not been well known. The inversion was
performed with and without JAN9 records and the results are almost the same. The overall
variance reduction presented in Figure 3.5 and Table 3.2 correspond to the inversion without
station JAN9.
The correlation coefficient and DC% values for all trial source positions and times for
Event c (Table 3.1) are displayed by crosses in Figure 3.6. Values corresponding to the best
space position and any trial centroid time are marked by squares. Values corresponding to any
trial space positions and the optimized centroid time are marked by diamonds. A plot like this,
although so far rarely used (Zahradník et al., 2008b), provides a clear insight into the
uncertainty of DC%. We see that without temporal optimization of the source we cannot
obtain a reasonable estimate of the DC% even if we optimize the source position; indeed, as
shown by the squares, DC% attains almost any value. When optimizing the waveform fit with
respect to the temporal position of the source (diamonds) the DC% is considerably better
constrained. Nevertheless, for example, if we study the correlation ranging between 0.7 and

Sismicidade de Caraíbas-Itacarambi/MG: causas e características 57
its maximum value, the DC% varies between 60% and 100%. This is a clear demonstration
that even with the temporal optimization, the DC percentage still trades off with the source
position. As a result, although having the best-fitting solution with DC percentage of 88%, we
cannot determine DC% for Event c) better than to 60-100%. Events a) and b) of Table 3.1
have even larger uncertainty of DC%; in the correlation interval between 0.7 and its
maximum value we obtain the DC% ranges 20-90%, and 30-100%, for events a) and b),
respectively.
Figure 3. 6 - Correlation coefficient and DC% values for all trial solutions of Event c (Tables 3.1 and 3.2). Crosses denote correlations for all trial source positions and all trial source-time shifts. Squares relate to the optimized source position, but including all trial source time shifts. Diamonds correspond to all trial source positions, but only taking into account the optimized source time shifts. Spread of diamonds in a selected correlation level (e.g. for the correlation > 0.7) illustrates the uncertainty of DC% due to its tradeoff with the source position.
3.3.2 - Relative Moment Tensor Inversion
A relative moment tensor inversion (RMTI) algorithm was developed by Dahm (1993,
1996) for mutually close (i.e. collocated) seismic sources. The main advantage of this method
is that we do not need detailed information about the earth velocity structure between source
and receiver for spatial cluster of seismic events (placed no more than one wavelength apart)
recorded by a common station, the propagation path effects are assumed to be the same and
then, can be canceled out.

Sismicidade de Caraíbas-Itacarambi/MG: causas e características 58
Equation 3.1 above can be rewritten in the matrix form
mGu rrr= (3.2)
Where ur is the displacement, Gr
is the Green's functions, and mr is the moment tensor.
The Green's functions Gr
can be divided in two parts: one related to radiation pattern
(h) and other to linear wave propagation effects (I). So, Equation 3.2 becomes:
( )mhIu rr= (3.3)
h depends on takeoff and azimuth angles from stations.
For two collocated events recorded by a common station, the ray paths have almost the
same propagation effects (I), which can be canceled out when using relative amplitude
readings. So we get the RMTI main equation: 221112 mhumhu = (3.4)
Where 1 and 2 denote events 1 and 2.
In the case of RMTI with reference event, the moment tensor of one event is known
and we can estimate the moment tensor of the other event. The observations ur can be either
in time domain - peak amplitude, peak-to-peak amplitude (Dahm, 1993; 1996), or in
frequency domain - plateau value of amplitude spectrum (Dahm et al., 1999; Hagos et al.,
2008; Shomali and Roberts, 2009), both for P-, SV- and SH-waves. The takeoff and azimuth
angles are calculated using a given velocity model.
The inversion problem has 6 unknown parameters (6 moment tensor components) so
we need more than 6 observations (phases, stations) to solve an overdetermined problem by
means of weighted least-squares approach.

Sismicidade de Caraíbas-Itacarambi/MG: causas e características 59
3.3.2.1 – Results
A total of 17 events (Table 3.3) forming 4 clusters (Clusters 1, 2, 3 and 4 in Figure
3.7) were analyzed with RMTI method with reference mechanism. The events were selected
based on quality of the hypocentral determination (error smaller than 0.5 km). The reliability
of the inversion was tested both in time-domain using peak-to-peak amplitude or frequency-
domain using low-frequency asymptote (DC level) values at corner frequency (fc) and at flat
part of amplitude spectra. This procedure is illustrated by a synthetic test in Appendix I. Here
we apply the method to real data.
Figure 3. 7 – Clusters of events used for RMTI analysis.
A band-pass filter from 1 to 15 Hz was applied to the seismograms of all clusters prior
to the inversion to remove the microseismic noise and keep most of P- and S-waves energy.
We adopted the composite focal mechanism (CFM) solution obtained by Chimpliganond et al.
(2010) as the source mechanism for the reference events. Based on the results of synthetic
tests (see Appendix), the inversion was applied only for DC at flat part of spectrum for both
P- and S-waves. The P-wave first motion polarities were also used in inversion. Table 3.4
presents the solutions obtained with RMTI, as explained in the next section.

Sismicidade de Caraíbas-Itacarambi/MG: causas e características 60
Table 3. 3 – Events used for Relative Moment Tensor Inversion.
Event Date yyyy-mm-dd
Origin Time hh:mm:sss
Lat (º)
Long (º)
Depth (km) Md Azimuthal
Gap (°) Recorded stations Cluster
1 2007-10-31 04:50:59.1 -15.0371 -44.2970 1.6 1.9 149 1/2/3/5/6 1
2 2007-11-01 19:19:21.2 -15.0353 -44.2945 1.6 1.7 156 1/2/3/5/6 1
3 2007-11-02 06:46:14.4 -15.0351 -44.2948 1.8 2.2 154 1/2/3/5/6 1
4 2007-11-02 06:46:59.6 -15.0351 -44.2945 1.8 2.1 153 1/2/3/5/6 1
5 2007-11-02 07:17:31.2 -15.0355 -44.2947 1.8 2.5 154 1/2/3/5/6 1
6 2007-12-08 21:52:42.6 -15.0328 -44.2952 0.6 1.6 152 6/7/8/9 2
7 2007-12-08 22:01:29.3 -15.0328 -44.2947 0.6 1.4 151 6/7/8/9 2
8 2007-12-09 02:03:28.4 -15.0326 -44.2952 0.7 4.6* 151 6/7/8/9 2
9 2007-12-10 08:29:36.3 -15.0428 -44.3010 0.4 1.7 156 3/6/7/9 3
10 2007-12-18 05:28:46.7 -15.0428 -44.3013 0.5 1.8 160 3/6/7/9 3
11 2008-02-08 23:45:45.8 -15.0424 -44.3002 0.4 1.2 138 2/7/8/9 3
12 2008-02-10 07:30:45.3 -15.0428 -44.3002 0.4 1.0 135 2/7/8/9 3
13 2008-02-11 02:31:12.3 -15.0422 -44.3005 0.4 1.7 132 2/6/7/8/9 3
14 2008-02-11 13:13:15.4 -15.0428 -44.3006 0.3 1.0 135 2/7/8/9 3
15 2008-02-11 15:20:44.5 -15.0428 -44.3003 0.4 1.0 136 2/7/8/9 3
16 2008-04-08 23:46:34.0 -15.0317 -44.3035 0.6 1.3 108 2/6/7/8/9 4
17 2008-04-09 02:39:09.1 -15.0307 -44.3083 0.8 3.1 111 2/6/7/8/9 4 * mb body-wave magnitude. The mainshock (Event 8) is highlighted.
Cluster 1 (foreshocks)
We applied the RMTI for full and deviatoric moment tensor to a set of 5 close lying
foreshocks that compose the Cluster 1 (Events 1 to 5 of Tables 3.3 and 3.4). Figure 3.8 shows
the waveform of all events of Cluster 1 in station JAN2 at components vertical (a), radial (b)
and tangential (c). Figure 3.9a presents the deviatoric moment tensor solutions for events of
Cluster 1.
The inversion was performed twice, using Events 1 and 2 as reference events, and then
with Events 3, 4 and 5 as reference. Figure 3.9b shows deviatoric (bars) moment tensor
double-couple percentage (DC%) for both sets of reference events. The ratio of the minimum
to maximum eigenvalues of the least-squares matrix of each event is also presented (open
diamonds). As can be seen from Figure 3.9b and Table 3.4, the inversion produces solutions
with larger DC% for deviatoric moment tensors using Events 4, 5 and 6 as reference,

Sismicidade de Caraíbas-Itacarambi/MG: causas e características 61
compared to Events 1 and 2 as references. Event 4 presents DC% = 59%, the lowest value of
Cluster 1. The other events have DC% larger than 70% (Table 3.4).
Figure 3. 8 – Waveforms of all events of Cluster 1 in station JAN2 at components vertical (a), radial (b) and tangential (c).
Cluster 2
The RMTI method was applied to the mainshock and two immediate foreshocks
(Events 6, 7 and 8 of Tables 3.3 and 3.4) using only P-waves due to the fact that the S-waves
are clipped for the mainshock. Moment tensor of the mainshock was retrieved using Events 6
and 7 as reference. Due to the fact that Events 6 and 7 are too small relatively to the
mainshock, only the moment tensor for the mainshock (Event 8) could be retrieved, and the
solution is shown in Table 3.4. The result of the inversion presents a double-couple
percentage of 85% for the mainshock (Table 3.4). Even using only information from P-waves

Sismicidade de Caraíbas-Itacarambi/MG: causas e características 62
due to the fact that S-waves on mainshock waveforms are clipped (hence not used), we could
obtain a relatively high value of double-couple percentage for this event.
Figure 3. 9 – (a) Deviatoric moment tensor solutions for events of Cluster 1 based on DC at flat part of spectrum for P- and S-waves. The waveforms were band-pass filtered from 1 to 15 Hz. Deviatoric moment tensor solutions have gray color for compression area of “beach balls”. (b) Double-couple percentage (DC%) for deviatoric (vertical bar) moment tensor inversion for events of Cluster 1. Results for different set of reference events (event numbers at top of graph) using DC at flat part of spectrum for P- and S-waves. Open diamonds indicates the ratio of the minimum to maximum eigenvalues of the least-squares matrix (evmin/evmax) obtained during the inversion for each event. Horizontal axis denotes event number (Table 3.3) and vertical axis indicates DC% on the left, and ratio evmin/evmax on the right.

Sismicidade de Caraíbas-Itacarambi/MG: causas e características 63
Table 3. 4 – Deviatoric moment tensor solutions of all events studied using RMTI (Table 3.3).
P T
Event Cluster Strike (°)
Dip (°)
Rake (°)
DC (%) Az (°) Pl (°) Az (°) Pl (°)
Ratio min/max
KA (°)
1 1 22 27 74 80 303.4 18.4 146.6 70.1 0.27 27
2 1 17 26 85 92 290.5 19.0 117.0 70.9 0.27 17
3 1 44 47 94 95 131.6 1.7 11.5 86.7 0.24 24
4 1 32 37 100 59 295.0 8.4 79.8 79.7 0.24 7
5 1 39 44 93 81 307.5 1.1 70.3 87.9 0.24 20
6 2 30 40 105 - - - - - - -
7 2 30 40 105 - - - - - - -
8 2 42 21 113 85 293.4 25.2 92.8 63.3 - 20
9 3 226 47 134 100 106.3 6.0 206.3 58.7 0.11 42
10 3 47 27 110 63 301.9 18.9 93.9 68.9 0.08 18
11 3 46 39 108 88 303.9 7.4 67.3 76.8 0.06 15
12 3 63 39 124 97 308.8 10.1 63.3 66.7 0.06 21
13 3 54 48 121 98 302.4 0.9 34.4 67.5 0.10 16
14 3 48 48 119 97 297.9 0.8 30.0 68.9 0.05 15
15 3 30 40 105 - - - - - - -
16 4 19 62 75 50 119.6 15.7 257.4 69.3 - 13
17 4 37 63 83 89 132.1 17.2 291.1 71.7 - 10 Ratio min/max denotes the ratio of the minimum to maximum eigenvalues of the least-squares matrix. Az and Pl denote azimuth and plunge. KA is the Kagan's angle between focal mechanism solution obtained by RMTI and reference focal mechanism given by P-wave first motion (Chimpliganond et al., 2010). The mainshock (Event 8) is highlighted.
Cluster 3 (aftershocks)
The RMTI was performed to real data of Cluster 3. The set of events used as references
were also the same applied on synthetic tests (groups (A) to (E)). The results of inversion for
deviatoric moment tensor for events of Cluster 3 are presented in Figure 3.10. Figure 3.11
presents the double-couple percentage (DC%) for deviatoric moment tensor inversion performed
for Cluster 3 and the ratio of the minimum to maximum eigenvalues of the least-squares matrix
of each event (evmin/evmax). From this figure we can see that the set of reference events (A)
Sismicidade de Caraíbas-Itacarambi/MG: causas e características 64
presents more stable solutions. It can be related to the fact that Events 9 and 10 have larger
magnitudes than the others (Table 3.3).
Based on the values of DC%, evmin/evmax ratio and moment tensor solutions, we choose
the set (A) of reference events to retrieve the moment tensor of Events 12, 13 and 14. To recover
the moment tensors of Events 10, 11 and 9, the sets (B), (C) and (E) of reference events,
respectively, show the best results.
Table 3.4 presents the moment tensor solutions for all events of Cluster 3. We could not
retrieve the moment tensor of Event 15, even trying other set of reference events. The solution
presented in Figures 3.10 and 3.11 for Event 15 refers to the output files from RMTI codes,
which adopts the results obtained from inversion of the event immediately prior to Event 15. For
this reason, it can be clearly seen in Figure 3.10 the similarity between the moment tensor
solutions for Events 14 and 15 for set (A) and Events 12 and 15 for set (E).
In Figure 3.11 the DC% for deviatoric (vertical bar) moment tensor inversion for Events
14 and 15 at set (A) and Events 12 and 15 for set (E) are the same, indicating this feature. But,
the main indication that the moment tensor for Event 15 was not retrieved is the null value of
evmin/evmax ratio for this event in both set of reference events (Figure 3.11). The explanation
for this failure in retrieve the moment tensor is that Event 15 is too small (M=1 in Table 3.3) and
the signal-to-noise ratio for this event do not allow the inversion to converge.
Cluster 4
We analyzed one of the largest aftershock of the Caraíbas-Itacarambi seismic sequence
and a collocated event composing Cluster 4 (Events 16 and 17 of Table 3.3) using RMTI method.
Event 17 was studied with ISOLA in Section 3.1.1, and has a known focal mechanism.
Therefore, we performed RMTI of Cluster 4 using the ISOLA solution for the reference event.
Thus we obtained DC% values of 50% for Event 16 and 83% for Event 17 (Table 3.4).

Sismicidade de Caraíbas-Itacarambi/MG: causas e características 65
Figure 3. 10 – Deviatoric moment tensor solutions for events of Cluster 3 based on DC at flat part of spectrum for P- and S-waves. The waveforms were band-pass filtered from 1 to 15 Hz. Letters from (A) to (E) denote set of reference events for inversion accordingly to the text. Black color of moment tensor indicates reference mechanism, and gray color denotes inversion result.
3.4. Tectonic implications
The solutions obtained from ISOLA for events (a), (b) and (c) (see Figure 3.2) have a
general trend of strike direction, which agrees with the composite focal mechanism (CFM)
solution based on P-wave first motion polarities (Chimpliganond et al., 2010). Kagan's angle
(KA) (Kagan, 1991) can be used as a measure of the similarity between two focal mechanisms. If
KA is smaller than 60°, the mechanisms can be related to each other. In Figure 3.2 and Table 3.2
we can see that ISOLA solutions have KA of less than 35° with respect to CFM, indicating a very
good correlation between the events.

Sismicidade de Caraíbas-Itacarambi/MG: causas e características 66
Figure 3. 11 – Double-couple percentage (DC%) for deviatoric (vertical bar) moment tensor inversion for events of Cluster 3. Results for different set of reference events (event numbers at top of graph) using DC at flat part of spectrum for P- and S-waves. Open diamonds indicates the ratio of the minimum to maximum eigenvalues of the least-squares matrix (evmin/evmax) obtained during the inversion for each event. Horizontal axis denotes event number (Table 3.3) and vertical axis indicates DC% on the left, and ratio evmin/evmax on the right.
Moment tensor solutions obtained with RMTI present also a high similarity with results
from CFM and ISOLA, as shown in Figure 3.12 and Table 3.4. Event 9 (Cluster 3) presents the
worst result for KA, with a value of 42°. This relatively high KA value for Event 9 compared to
other events has two possible causes: difference in source mechanism between events or the
propagation paths. Inspecting the waveforms for all events of Cluster 3 we clearly see the
difference between waveforms of Event 9 and the remaining events. Since all events of Cluster 3
are located very close to each other, and Events 9, 10 and 13 were recorded by at least 3 common
stations, the difference observed between the results probably are not related to propagation or

Sismicidade de Caraíbas-Itacarambi/MG: causas e características 67
site effects, but associated to different source mechanisms. The other events show KA smaller
than 30° (Table 3.4), indicating good similarity with CFM and ISOLA results.
Figure 3. 12 – Final moment tensor solutions obtained with RMTI. Color of moment tensors accordingly with Kagan's angle (KA) calculated with respect the reference composite focal mechanism (CFM). ISOLA stands for focal mechanism used for reference events. (R) denotes that the moment tensor was not retrieved, but adopted as the composite focal mechanism (CFM) solution used as reference mechanism.
Studies of two seismic sequences that occurred at Manga, about 50 km to North, and at
Correntina, aproximately 150 km to Northwest of Caraíbas-Itacarambi, respectively, also present
reverse-fault focal mechanism solutions (Assumpção et al., 1990; Lopes, 2008). Lopes (2008)
interpreted the seismicity at Manga, Caraíbas-Itacarambi and Correntina, as a result of E-W
compression in the central part of São Francisco Craton, which is compatible with the results
obtained by Assumpção (1992) using focal mechanisms, mathematical models of Coblentz and
Richardson (1996) and Meijer et al. (1997), and recent studies of strain rate using geodetic
observations (Marotta et al., 2012).

Sismicidade de Caraíbas-Itacarambi/MG: causas e características 68
In Table 3.4, most events have DC% larger than e.g. 70, but a few also show low DC%
such as Events 4, 8, 12 and 16. There is no evidence of any feature at the area that can be related
to the low DC% for these events. Although Event 10 has hypocentral location very close to the
other events from Cluster 3, its waveforms show some differences, mainly on P- and S-wave
polarities in opposite sign. Probably the relatively low DC% value for this event is related to this
difference. Event 16 is located approximately 0.5 kilometer away from hypocentral position of
the Event 17. The low DC% of Event 16 can be related to the distance between both events.
Event 4 is very close located to the other events of Cluster 1, and also presents very similar
waveforms (see Fig. 3.8).
3.5. Conclusions
In this paper we obtained moment tensors of weak earthquakes from Caraíbas-Itacarambi
seismic area, Southeast of Brazil. In this area no seismicity was detected prior to 2007 when the
events started to be felt. We selected the best recorded events, with good hypocentral
determinations (error smaller than 0.5 km) to perform moment tensor inversions in time and
frequency domains.
In time domain we performed the waveform inversion using ISOLA code for three events
with good signal-to-noise ratio. The reverse-fault solutions from ISOLA of these three events are
in good agreement with composite focal mechanism (CFM) solution based on P-wave first
motion, obtained by Chimpliganond et al. (2010) for the Caraíbas-Itacarambi seismicity, with
Kagan's angle (KA) of less than 35°.
We also retrieved the moment tensors of Caraíbas-Itacarambi weak earthquakes using the
Relative Moment Tensor Inversion method of Dahm (1993, 1996) in the frequency domain.
Relative measurements of DC at flat part of amplitude spectra were performed for events of five
clusters. The RMTI results show good agreement with ISOLA and CFM solutions, with KA of
less than 30°. Only one event presents KA of 42° and probably has different source mechanism.
The waveform inversion using ISOLA (frequency range from 1.0 to 2.8 Hz) was
successfully applied to weak events of Caraíbas-Itacarambi seismic area thanks to the availability
of local network (four stations within 6 km distance). In this frequency range, small epicentral

Sismicidade de Caraíbas-Itacarambi/MG: causas e características 69
distance, and shallow source-depth, full waveforms could be fitted even with simple available
velocity models, and robust results were obtained. RMTI method has the advantage that in case
of clustered events the moment tensors can be obtained without any detailed information about
the velocity model. Both methods can be adapted to automatic routines.

Sismicidade de Caraíbas-Itacarambi/MG: causas e características 70
Appendix
Synthetic Tests
A total of 17 events (Table 3.3) forming 4 clusters (Clusters 1, 2, 3 and 4 in Fig. 3.7) were
analyzed with RMTI method with reference mechanism. The events were selected based on
quality of the hypocentral determination (error smaller than 0.5 km). We proceed with synthetic
tests for the seven events of Cluster 3 (events 9 to 15 of Table 3.3) in both time and frequency
domains for the same geometric distribution of stations of the local network. We produced
synthetic seismograms for pure DC sources using the wavenumber integration method
(Herrmann, 1996) with sampling interval of 0.05 seconds. To these synthetic seismograms we
added an amount of white noise ranging from 5% to 30% of maximum S-wave amplitude.
Deviatoric relative moment tensor inversion were performed for the synthetics assuming
focal mechanisms to the events of Cluster 3 as follow (Table A1): For the first event (event 9 of
Table 3.3) we used the composite focal mechanism (CFM) solution obtained by Chimpliganond
et al. (2010) for the Caraíbas-Itacarambi seismic area. For the remaining events we applied
variations on strike, dip and rake of this fault plane. The takeoff angles were calculated using the
same velocity model used for hypocentral determination (Chimpliganond et al., 2010) (first
velocity model described in Section 3.1.1).
The synthetic waveforms were band-pass filtered in the frequency range from 1.0 to 6.0
Hz, and we included all clear P-wave polarities to the inversion. Each time the inversion was
performed for a group of reference events: (A) reference events 9, 10, 11; (B) reference events 9,
12, 15; (C) reference events 13, 14, 15; (D) reference events 9, 15; (E) reference events 10, 13, 14
(see Fig. A1).
For RMTI method in time domain we used peak-to-peak amplitudes of P-waves on
vertical components and SV- and SH-waves on horizontal rotated components. The readings
were taken in a window around each phase. P- and S-waves arrive almost at the same time at
Station JAN8 due to its close proximity to the epicenters. For this reason we decided to remove
this station from the inversion. In frequency domain we applied the RMTI to low-frequency
asymptote (DC level) values at corner frequency (fc) and at flat part of amplitude spectra for P-
and S-waves using the same time window criteria adopted for time domain analysis.

Sismicidade de Caraíbas-Itacarambi/MG: causas e características 71
Table A 1 - Focal mechanism solution adopted to events of Cluster 3 for synthetic tests using RMTI method.
Event Strike (°)
Dip (°)
Rake (°)
9* 30 40 105
10 30 20 105
11 20 30 105
12 20 40 105
13 10 40 105
14 30 40 80
15 40 30 105 * - Composite focal mechanism solution obtained by Chimpliganond et al. (2010) for Caraíbas-Itacarambi seismic area. The RMTI results for all these cases are shown in Figure A1. The first row of each figure,
labeled by (Ref), indicates the focal mechanisms for each earthquake of the cluster based on
Table 3.3. The number above the “beach ball” corresponds to the event number according to
Table A1. The other rows labeled by (a) to (e) refers to the set of events used as references, as
explained above in the text. Also on top of each “beach ball” solution, there is the indication if
the solution was obtained (inv) or used as reference (REF) during the inversion procedure.
Comparing the results obtained from the synthetic tests presented in Figure A1a we
concluded that RMTI applied in frequency domain for DC level at flat part of amplitude spectra
is more stable (Figure A1c) than that using DC level at corner frequency (Fig. A1b) or using data
in time domain (peak-to-peak amplitudes) (Figure A1a). We analyzed the double-couple
percentage (DC%) for each event of Cluster 3 without noise and with increasing noise from 5%
to 30% of maximum S-wave amplitude.

Sismicidade de Caraíbas-Itacarambi/MG: causas e características 72
Figure A 1 – RMTI solutions for events of Cluster 3 using synthetic waveforms without noise for both P- and S-wave. (a) corresponds to the solution based on amplitude in time domain, (b) is the DC part of the spectrum close to the corner frequency, and (c) is the DC at the flat part of the spectrum. The first row of each figure (Ref) presents the focal mechanisms for each earthquake of the cluster used as the reference event accordingly to the group of events (A) to (E) (see text). Numbers above moment tensors refer to event number following Table 3.3. On top of each moment tensor solution there is indication if the solution was obtained (inv) or used as reference (REF) during the inversion procedure. Disagreement (red) and agreement (green squares) of inversion solutions with the original focal mechanism.
The presence of noise disturbs the DC%, as expected. The difference in DC% between the
lower and the higher content of noise is proportional to the amount of noise added to the synthetic
seismogram. Even with the presence of noise, the RMTI gives solutions relatively stable and in
agreement with the focal mechanisms solutions used as references, i.e., RMTI is a powerful
method and can be applied to weak events.

Sismicidade de Caraíbas-Itacarambi/MG: causas e características 73
Acknowledgments
Cristiano Chimpliganond and George Sand França are grateful to National Counsil of
Technological and Scientific Development of Brazil (CNPq) for the Grant No. 201813/2011-4
and PQ grants, respectively. The maps were produced with Generic Mapping Tools (GMT)
version 4.3.1 (Wessel and Smith, 1998; www.soest.hawaii.edu/gmt, last accessed August 2012).
We thank Department of Earth Sciences, Uppsala University, especially Professor R. Robert to
support us in this project.
References
Agurto, H., A. Rietbrock, I. Ryder, and M. Miller (2012). Seismic-afterslip characterization of
the 2010 MW 8.8 Maule, Chile, earthquake based on moment tensor inversion, Geophys. Res.
Lett., 39, L20303, doi:10.1029/2012gl053434.
Assumpção, M., J.A. Veloso, J.R. Barbosa, M.L.B. Blum, J.M. Carvalho, E. Neves and A.
Bassini (1990). The Manga earthquakes, MG, March of 1990. XXXVI Brazilian Congress of
Geology, Natal-RN. Proceedings of the XXXVI Brazilian Congress of Geology, vol. 6. SBG,
Natal-RN, pp. 2154-2159.
Assumpção, M. (1992). The regional intraplate stress field in South America. J. Geophys. Res.
97, 11889-11903.
Barros, L. V., M. Assumpção, R. Quintero, and D. Caixeta (2009). The intraplate Porto dos
Gaúchos seismic zone in the Amazon craton – Brazil. Tectonophysics, doi:
10.1016/j.tecto.2009.01.006.

Sismicidade de Caraíbas-Itacarambi/MG: causas e características 74
Benetatos, C., J. Málek, and F. Verga (2012). Moment tensor inversion for two micro-
earthquakes occurring inside the Háje gas storage facilities, Czech Republic, J. Seismol.,
doi:10.1007/s10950-012-9337-0.
Berrocal, J., M. Assumpção, R. Antezana, C. Dias Neto, R. Ortega, H. França and J.A. Veloso
(1984). Sismicidade do Brasil. Published by IAG/USP and Comissão Nacional de Energia
Nuclear, Brazil, 320 pp.
Bouchon, M. (2003). A review of the discrete wavenumber method. Pure Appl. Geophys. 160,
445-465.
CECAV (2007). Base de dados geoespecializados de cavidades naturais subterrâneas do Centro
Nacional de Estudo. Proteção e Manejo de Cavernas – CECAV. IBAMA.
Chimpliganond, C., M. Assumpção, M. Von Huelsen and G.S. França (2010). The intracratonic
Caraíbas-Itacarambi earthquake of December 09, 2007 (4.9 mb), Minas Gerais State, Brazil.
Tectonophysics 480, 48-56.
CPRM (2003). Digital atlas of geology and mineral resources of Minas Gerais State, scale
1:500.000.
Coblentz, D. D. and R. M. Richardson (1996). Analysis of the South American intraplate stress
field. J. Geophys. Res. 101, 8643-8657.
Coutant, O. (1990). Program of numerical simulation AXITRA, Laboratoire de Géophysique
Interne et Tectonophysique Report, University of Joseph Fourier (in French).
Dahm, T. (1993). Relativmethoden zur bestimmung der abstrahlcharakteristik von seismischen
quellen, Ph.D. Thesis, University of Karlsruhe.

Sismicidade de Caraíbas-Itacarambi/MG: causas e características 75
Dahm, T. (1996). Relative moment tensor inversion based on ray-theory: theory and synthetic
tests. Geophys. J. Int. 124, 245-257.
Dahm, T., G. Manthei, and J. Eisenblätter (1999). Automated moment tensor inversion to
estimate source mechanisms of hydraulically induced micro-seismicity in salt rock,
Tectonophysics 306, 1-17.
Fojtíková, L., V. Vavrycuk, A. Cipciar, and J. Madarás (2010). Focal mechanisms of micro-
earthquakes in the Dobrá Voda seismoactive area in the Malé Karpaty Mts. (Little Carpathians),
Slovakia, Tectonophysics 492, 213-229.
Hagos, L., H. Shomali, B. Lund, R. Bödvarsson, and R. Roberts (2008). An application of
relative moment tensor inversion to aftershocks of the June 1998 Hengill earthquake in southwest
Iceland, Bull. Seismol. Soc. Am. 98, 636-650.
Herrmann, R.B. (1996). Computer Programs in Seismology,
http://www.eas.slu.edu/People/RBHerrmann/CPS330.html (last accessed April 2012), Saint
Louis University.
Johnston, A. C. (1989). Seismicity of “stable continental interiors”, in Earthquakes at North-
Atlantic Passive Margin: Neotectonics and Postglacial Rebound, edited by S. Gregersen and P.
W. Basham, pp.299-327, Kluwer Acad., Norwell, Mass.
Johnston, A.C. and L.R. Kanter (1990). Earthquakes in stable continental crust. Sci. Am. 262,
68–75.
Johnston, A.C. (1996). Seismic moment assessment of earthquakes in stable continental
regions.1. Instrumental seismicity. Geophys. J. Int. 124, 381–414.
Jost, M. and R. B. Herrmann (1989). A student guide to and review of moment tensors. Seism.
Res. Letters 60, 37-57.

Sismicidade de Caraíbas-Itacarambi/MG: causas e características 76
Kagan, Y. Y. (1991). 3-D rotation of double-couple earthquake sources. Geophys. J. Int. 106,
709-716.
Kikuchi, M. and H. Kanamori (1991). Inversion of complex body waves – III. Bull. Seismol.
Soc. Am. 81, 2335-2350.
Krížová, D., J. Zahradník, and A. Kiratzi (2013). Resolvability of isotropic component in
regional seismic moment tensor inversion, Bull. Seism. Soc. Am. (submitted).
Lopes, A. E. V. (2008). Focal mechanisms and lithospheric stresses in Brazil. PhD Thesis (in
Portuguese). University of São Paulo, 177 pp.
Marotta, G. S., G. S. França, J. F. G. Monico, R. A. Fuck (2012). Strain rate of South American
Lithospheric Plate by SIRGAS-CON geodetic observations. Journal of South American Earth
Sciences (submitted).
Martínez, M.I. (2007). Stratigraphy of Bambuí Group at the north of the São Francisco River
Valley, MG. Master Degree Thesis (in Portuguese), Institute of Geosciences, Federal University
of Minas Gerais, 122 pp.
Meijer, P. T., R. Govers, and M. J. R. Wortel (1997). Forces controlling the present-day state of
stress of the Andes. Earth Planet Sci. Lett. 148, 157-170.
Nobre-Lopes, J. (2002). Diagenesis of the dolomites hosting Zn/Ag mineral deposits in the
Bambui Group at Januaria Region-MG, PhD Thesis, University of Campinas, Campinas, São
Paulo, Brazil, 183 pp.
Reinoso, P.S. (2011). The upper crustal microseismicity image from the North Chilean
subduction zone: implications for tectonics and fluid migration. PhD Thesis, Free University
Berlin.

Sismicidade de Caraíbas-Itacarambi/MG: causas e características 77
Schulte, S.M. and W.D. Mooney (2005). An updated global earthquake catalogue for stable
continental regions: reassessing the correlation with ancient rifts. Geophys. J. Int. 161, 707–721.
Shomali, H. and R. G. Roberts (2009). An application of Relative Moment Tensor Inversion to
the 26 December 2003 MW 6.6 Iran-Bam Earthquake, Bull. Seismol. Soc. Am. 99, 159-171.
Sokos, E. and J. Zahradník (2008). ISOLA – A Fortran code and Matlab GUI to perform
multiple-point source inversion of seismic data. Comput. Geosci. 34, 967-977.
Sokos, E. and J. Zahradník (2013). Evaluating centroid_moment tensor uncertainty in the new
version of ISOLA software. Seis. Res. Letters, in press.
Waldhauser, F. (2001). HYPODD – a program to compute double-difference hypocenter
locations, U.S.Geol.Surv. Open-File Rep, pp. 01-113.
Waldhauser, F. and W.L. Ellsworth (2000). A double-difference earthquake location algorithm:
method and application to the Hayward fault. Bull. Seismol. Soc. Am. 90, 1353-1368.
Wessel, P. and W. Smith (1998). New, improved version of generic mapping tools released, Eos
Trans. AGU, 79(47), 579, doi:10.1029/98EO00426.
Zahradnik, J., A. Serpetsidaki, E. Sokos, and G.-A. Tselentis (2005). Iterative deconvolution of
regional waveforms and a double-event interpretation of the 2003 Lefkada Earthquake, Greece,
Bull. Seism. Soc. Am. 95, 159-172.
Zahradnik, J., J. Jansky, and V. Plicka (2008a). Detailed waveform inversion for moment tensors
of M~4 events: examples from the Corinth Gulf, Greece, Bull. Seismol. Soc. Am. 98, 2756-2771.

Sismicidade de Caraíbas-Itacarambi/MG: causas e características 78
Zahradník, J., E. Sokos, G-A. Tselentis, and N. Martakis (2008b). Non-double-couple mechanism
of moderate earthquakes near Zakynthos, Greece, April 2006; explanation in terms of
complexity. Geophysical Prospecting 56, 341-356.

Sismicidade de Caraíbas-Itacarambi/MG: causas e características 79
Capítulo 4 - Discussão
4.1 – Introdução
Neste capítulo são discutidos os resultados obtidos nos Capítulos 2 e 3, relativos à análise
de dados sismográficos, buscando correlacioná-los com feições geológicas (fraturas/falhas) que
expliquem a sismicidade de Caraíbas-Itacarambi. Processamento de dados de levantamentos
geofísicos aéreos, imagens de satélite e dados SRTM (Shuttle Radar Topography Mission) foram
processados e interpretados no intuito de identificar estas feições.
Os resultados obtidos de análises dos sismogramas dos eventos de Caraíbas-Itacarambi
apresentados nos Capítulos 2 e 3 identificam uma falha inversa com direção aproximada N30ºE,
mergulho de 40º e rake de 105º. Os tensores momento sísmico determinados seja utilizando
inversão da forma de onda completa, seja por inversão relativa do tensor momento sísmico com
evento de referência, indicam fontes sísmicas com porcentagens double-couple superiores a 70%,
ou seja, fontes tipicamente tectônicas provenientes de movimentação ao longo de um plano de
falha.
4.2 – Dados Geológicos
Estudos geológicos realizados na região ao longo dos anos (Costa, 1978; Brandalise et al.,
1980; Campos, 2001; Nobre-Lopez, 2002; CPRM, 2003; Cunha Filho, 2004; Martínez, 2007)
mostram que as rochas do embasamento do Cráton do São Francisco, na região em estudo, foram
afetadas por estruturas tectônicas do tipo “horst” e graben” durante o ciclo Brasiliano
(Neoproterozóico). Estas estruturas se desenvolveram ao longo de falhas E-W e NW-SE, e dentre
elas, destacamos o horst-anticlinal de Itacarambi por sua localização muito próxima à área de
estudo. Esta feição possui direção do traço axial N45ºW e caimento de 10º para NW (Figura 4.1),
seccionada por sistema de falhas transversais de menor escala na direção NE-SW (Brandalise et
al., 1980).

Sismicidade de Caraíbas-Itacarambi/MG: causas e características 80
Figura 4. 1 – Esquema estrutural do horst-anticlinal de Itacarambi, na área de Itacarambi-Mina Grande. Ku: arenitos Urucuia; FSL: Formação Sete Lagoas (Brandalise et al., 1980). U e D representam blocos elevados e abatidos respectivamente.
4.3 – Dados Geofísicos
Dados geofísicos da Área 5 do Programa de Levantamentos Aerogeofísicos da
COMIG/SEME, Projeto Aerogeofísico Itacarambi-Januária-Montalvânia (LASA, 2001), foram
processados e seus produtos contribuíram para a caracterização geofísica da região. A Figura 4.2
apresenta a imagem da Amplitude do Sinal Analítico (ASA) do campo magnético a qual é útil na
demarcação da posição das fontes magnéticas. Para a região em estudo claramente são
observadas feições regionais com direções NW-SE, WNW-ESE e NE-SW também evidenciadas

Sismicidade de Caraíbas-Itacarambi/MG: causas e características 81
por Cunha Filho (2004) e Martinez (2007). Tais feições foram interpretadas por aqueles autores
como diques máficos ou como material magnético preenchendo fraturas/falhas do embasamento
(Cráton São Francisco).
Figura 4. 2 – Imagem da Amplitude do Sinal Analítico (ASA) do campo magnético para a região de Caraíbas-Itacarambi. Os epicentros (círculos) e a cidade de Itacarambi (quadrado) são mostrados. A escala de cor representa nanoTesla/metro.
Em escala mais local, foram produzidas imagens de Inclinação do Vetor do Sinal
Analítico (ISA) e da Deconvolução de Euler. A imagem ISA possibilita um estudo melhorado da
fábrica e da estrutura do campo magnético, permitindo melhor demarcação das unidades físicas e
estruturas magnéticas associadas. A Figura 4.3 apresenta a imagem ISA para a área próxima aos
epicentros, onde podem ser identificadas as feições magnéticas regionais NW-SE e WNW-ESE

Sismicidade de Caraíbas-Itacarambi/MG: causas e características 82
identificadas na imagem ASA e também uma textura magnética de direção NE-SW com boa
concordância com a direção dos epicentros.
Deconvolução de Euler para a magnetometria objetiva a interpretação quantitativa das
posições espaciais das fontes causadoras dos campos magnéticos. A Figura 4.4 mostra a imagem
da Deconvolução de Euler para a área de Caraíbas, na qual é possível identificar feições na
direção regional NW-SE (identificadas nas imagens anteriores), e também feições na direção NE-
SW em boa concordância com o alinhamento de epicentros. As feições NW-SE localizam-se a
profundidades maiores que as dispostas na direção NE-SW.
Figura 4. 3 – Imagem da Inclinação do Vetor Sinal Analítico (ISA) do campo magnético para a região de Caraíbas-Itacarambi. Os epicentros estão representados como círculos. A escala de cor representa ângulo de inclinação em radianos.

Sismicidade de Caraíbas-Itacarambi/MG: causas e características 83
Figura 4. 4 – Imagem da Deconvolução de Euler do campo magnético para a região de Caraíbas-Itacarambi. Os epicentros estão representados como círculos. A escala de cor representa a profundidade da fonte magnética em metros.
4.4 – Dados Geomorfológicos (Imagens de Satélite e SRTM)
A direção geral NE-SW do Rio São Francisco, entre as localidades de São Francisco e
Januária, foi sugerida por vários pesquisadores como sendo controlada por falha Neoproterozóica
(Falha de Januária) com rejeito vertical, responsável pela falta de correspondência entre as
sucessões litológicas da Formação Sete Lagoas observadas nas margens esquerda e direita deste
rio (Martínez, 2007).
O mapa de falhas e lineamentos Quaternários no Brasil de Saadi et al. (2002) identifica a
Falha de Manga definida entre as cidades de Januária (MG) e Paratinga (BA) quase coincidente

Sismicidade de Caraíbas-Itacarambi/MG: causas e características 84
com o Rio São Francisco, e responsável pela sismicidade observada em Manga (MG) em 1990
(Veloso et al., 1990; Assumpção et al., 1990).
A Figura 4.5 é um mapa hipsométrico construído a partir do modelo digital de elevação
(MDE) usando dados processados e refinados de sua resolução inicial de 90 metros para 30
metros (Valeriano & Albuquerque, 2010). Nesta figura são mostrados os epicentros estudados
nesta Tese, a cidade de Itacarambi e o traço da Falha de Manga (Saadi et al., 2002).
Figura 4. 5 – Mapa hipsométrico SRTM da região de Caraíbas-Itacarambi. São mostrados os epicentros, a cidade de Itacarambi, a Falha de Manga (Saadi et al., 2002) e borda de chapada entre Caraíbas e Itacarambi.

Sismicidade de Caraíbas-Itacarambi/MG: causas e características 85
Também foi delimitado neste mapa o traço aproximado demarcando a quebra negativa do
relevo nas proximidades de Caraíbas, simbolizado por linha tracejada cinza. Esta linha mostra
uma interessante feição geomorfológica na área, também com direção NE-SW, representada pela
borda da chapada à esquerda do Rio São Francisco, entre a cidade de Itacarambi e a vila de
Caraíbas.
A extração de elementos de drenagem a partir de imagens de satélite Landsat ETM+
(bandas 4,5,6 no padrão de cores RGB) e de dados SRTM são apresentadas nas Figuras 4.6 e 4.7,
respectivamente.
A partir do processamento destes dados puderam ser identificadas feições lineares com
até 1 km de extensão, aqui denominadas de lineamentos, e com até 500 metros, chamadas de
foliações (Chimpliganond et al., 2011). As Figuras 4.8 e 4.9 mostram os lineamentos e foliações
identificados a partir de imagem de satélite e dados SRTM, respectivamente. Na parte inferior
destas figuras são apresentados os diagramas de rosetas mostrando a freqüência de observação
para cada feição.
Os diagramas de rosetas para os lineamentos tanto da imagem de satélite quanto de
SRTM mostram dois picos de freqüência de observações nas direções NW-SE e
aproximadamente N30ºE. No caso das foliações, de maneira geral a direção predominante é NW-
SE, mas se considerarmos apenas foliações com até 200 metros de dimensão, dois picos (NW-SE
e NE-SW) de freqüências aparecem nas mesmas direções observadas para os lineamentos.

Sismicidade de Caraíbas-Itacarambi/MG: causas e características 86
Figura 4. 6 – Imagem de satélite Landsat 7+ETM (bandas 3,4,5) da região de Caraíbas-Itacarambi. São mostrados os epicentros, a cidade de Itacarambi e drenagens.

Sismicidade de Caraíbas-Itacarambi/MG: causas e características 87
Figura 4. 7 – Imagem SRTM – TOPODATA (resolução espacial: 30 metros) da região de Caraíbas-Itacarambi. São mostrados os epicentros, a cidade de Itacarambi e drenagens.

Sismicidade de Caraíbas-Itacarambi/MG: causas e características 88
Figura 4. 8 – Lineamentos e foliações obtidos de imagem de satélite para região de Caraíbas-Itacarambi. São mostrados os epicentros e a cidade de Itacarambi. Na porção inferior são apresentadas as rosetas para as feições identificadas.

Sismicidade de Caraíbas-Itacarambi/MG: causas e características 89
Figura 4. 9 – Lineamentos e foliações obtidos de imagem SRTM para região de Caraíbas-Itacarambi. São mostrados os epicentros e a cidade de Itacarambi. Na porção inferior são apresentadas as rosetas para as feições identificadas.

Sismicidade de Caraíbas-Itacarambi/MG: causas e características 90
4.5 – Dados Sismológicos regionais
Os resultados de estudos de mecanismos focais para 4 eventos, sendo 2 no Cráton São
Francisco e outros 2 nas faixas dobradas marginais, são discutidos juntamente com o mecanismo
de Caraíbas-Itacarambi. A Figura 4.10 mostra o mapa com estes resultados.
Uma seqüência sísmica ocorrida em 1990 na localidade de Manga/MG, localizada
aproximadamente 50 quilômetros a norte da área de Caraíbas-Itacarambi foi estudada por Veloso
et al. (1990) e Assumpção et al. (1990). Estes estudos relacionam a sismicidade de Manga/MG
como resposta a movimentação em uma falha inversa com direção aproximada N-S (Figura 4.10).
Lopes (2008) estudou a sismicidade ocorrida em Correntina/BA, cerca de 150
quilômetros a noroeste da área de Caraíbas-Itacarambi, ocorrida em 2003. O mecanismo focal
obtido para esta sismicidade também corresponde a uma falha inversa com direção aproximada
N20ºW (Figura 4.10). O sismo de Brasília/DF, ocorrido em 2000, também foi estudado por
Lopes (2008), que evidenciou falha inversa de direção N80ºW (Figura 4.10). O mecanismo focal
obtido por Veloso (1990) para a seqüência sísmica de Encruzilhada/BA (Figura 4.10) sugere
falha inversa N20ºW.
Lopes (2008) interpretou as sismicidades em Manga/MG, Caraíbas/MG e Correntina/BA
como resposta a compressão E-W na parte central do Cráton do São Francisco. Esta interpretação
concorda com resultados obtidos por Assumpção (1992) usando mecanismo focal, e com
modelos matemáticos de Coblentz & Richardson (1996) e Meijer et al. (1997) para estimativas da
distribuição dos esforços na Placa Sul-Americana. Estudos recentes de Marotta et al. (2012) para
taxa de deformação da parte mais superficial da crosta, a partir de observações geodésicas,
também estão de acordo com a interpretação de Lopes (2008).

Sismicidade de Caraíbas-Itacarambi/MG: causas e características 91
Figura 4. 10 – Mapa apresentando os mecanismos focais obtidos para as seqüências sísmicas: Correntina/BA (Lopes, 2008), Manga/MG (Assumpção et al., 1990; Veloso et al., 1990), Caraíbas/MG (Chimpliganond et al., 2010), Brasília/DF (Lopes, 2008) e Encruzilhada/BA (Veloso, 1990). Limite do Cráton São Francisco definido por linha preta contínua e dos estados em linha branca tracejada.
4.6 – Considerações Finais
Os modelos propostos para explicar a sismicidade intraplaca consideram que os
terremotos resultam de rupturas em zonas de fraquezas e/ou de concentrações de esforços (e.g.
Sykes, 1978; Talwani, 1989; Talwani & Rajendran, 1991; Kenner & Segal, 2000). Johnston
(1989) e Schute & Mooney (2005) correlacionaram zonas de fraquezas crustais, como crostas
extendidas em riftes abortados ou margens continentais, com terremotos intraplaca.
Gangopadhyay & Talwani (2005) consideram zonas de fraquezas como interseção de falhas.
Concentração de esforços na crosta superior devido a heterogeneidades estruturais também tem
sido usada para tentar explicar a sismicidade intraplaca (Sykes, 1978; Talwani, 1989; Talwani &
Rajendran, 1991; Kenner & Segal, 2000; Assumpção et al., 2004).
No entanto, a maioria dos modelos usados para explicar a sismicidade intraplaca
consideram apenas padrões regionais e não procuram explicar a sismicidade em escala local. Para

Sismicidade de Caraíbas-Itacarambi/MG: causas e características 92
isso, são necessárias localizações hipocentrais precisas e mapeamento geológico detalhado. Só
assim podem ser afirmado que a sismicidade ocorre em falhas pré-existentes mapeadas ou não.
A maioria dos terremotos no Brasil, mesmo os com focos mais rasos que 10 quilômetros e
ocorrendo em zonas sísmicas de 30 a 40 quilômetros de extensão, não apresentam clara
correlação com falhas conhecidas em superfície (Takeya et al., 1989; Ferreira et al., 1998).
Entretanto, Bezerra et al. (2007) conseguiram usar dados de alta qualidade da sismicidade
em João Câmara/RN para mostrar a coincidência espacial dos hipocentros com fábrica rúptil
composta por veios de quartzo e zonas de falha silicificadas. Esta falha, chamada Falha
Samambaia, foi descoberta por meio de estudos sismológicos de Ferreira et al. (1987) e Takeya et
al. (1989). Diversos estudos foram realizados para dimensionar a zona de falha e determinar o
mecanismo focal desta impressionante sequência sísmica (e.g., Ferreira et al., 1987; Takeya et
al., 1989; Sophia & Assumpção, 1989; Von Huelsen, 1993). Da mesma forma, Ferreira et al.
(2008) usaram registros locais de terremotos e detalhado mapeamento geológico estrutural para
mostrar a reativação cosísmica do Lineamento Pernambuco na região de Caruaru/PE.
Assim, a reativação de fraturas e falhas do embasamento do Cráton São Francisco
orientadas segundo as direções NE-SW e N-S a NW-SE poderiam explicar as sismicidades
observadas em Caraíbas-Itacarambi e nos demais casos citados, respectivamente, em virtude da
ação do campo de esforços compressivos E-W.
Para o caso de Caraíbas-Itacarambi, a presença de estruturas do tipo horsts e grabens do
embasamento podem ter contribuído para a concentração dos esforços tectônicos ao longo do
tempo. Os resultados das análises realizadas para dados geofísicos aéreos, imagens de satélite e
dados SRTM, evidenciam a presença de estruturas com orientações coincidentes com os
mecanismos focais obtidos nesta Tese para a sismicidade de Caraíbas-Itacarambi. Assim, a
presença de fraturas e falhas pré-existentes nas rochas do embasamento, orientadas
preferencialmente de maneira a permitir movimentação em resposta ao esforço E-W, podem
explicar a sismicidade em Caraíbas-Itacarambi.

Sismicidade de Caraíbas-Itacarambi/MG: causas e características 93
Referências Assumpção, M., Veloso, J.A.V., Barbosa, J.R., Blum, M.L.B., Carvalho, J.M., Neves, E., Bassini,
A., 1990. The Manga earthquakes, MG, March of 1990. In: XXXVI Brazilian Congress of Geology, 1990, Natal-RN. Proceedings of the XXXVI Brazilian Congress of Geology. Natal-RN: SBG, 1990. v. 6. p. 2154-2159.
Assumpção, M., 1992. The regional intraplate stress field in South America, J. Geophys. Res.
97(B8), 11889-11903. Assumpção, M., Schimmel, M., Escalante, C., Barbosa, J.R., Rocha, M., Barros, L.V., 2004.
Intraplate seismicity in SE Brazil: stress concentration in lithospheric thin spot. Geophys. J. Int. 159, 390–399.
Bezerra, F.H.R., Takeya, M.K., Sousa, M.O.L. & do Nascimento, A.F., 2007. Coseismic
reactivation of the Samambaia fault, Brazil, Tectonophys., 430, 27-39. Brandalise, L.A., Pimentel, G.B., Steiner, H.P., Soares, J., Mendes, J.R., Queiroz, N.F., Lima,
O.M., Pádua, W. de, 1980. Projeto Sondagens Bambuí em Minas Gerais: relatório final. Belo Horizonte, DNPM/CPRM, v.5.
Campos, J.E.G., 2001. Zoneamento Ecológico-Econômico – ZEE do Vale do São Francisco –
nota explicativa do Mapa Geológico do Vale do Rio São Francisco. CODEVASF. Chimpliganond, C., M. Assumpção, M. Von Huelsen and G.S. França (2010). The intracratonic
Caraíbas-Itacarambi earthquake of December 09, 2007 (4.9 mb), Minas Gerais State, Brazil. Tectonophysics 480, 48-56.
Chimpliganond. C., Almeida, T., Algarte, K.T.S & Martins, R., 2011. Remote sensing tools
applied to structural lineaments identification at Caraíbas-Itacarambi seismic zone, Minas Gerais, Brazil, Twelfth International Congress of the Brazilian Geophysical Society, Rio de Janeiro, Brasil, 6p.
Coblentz, D.D. & Richardson, R.M., 1996. Analysis of the South American intraplate stress field,
J. Geophys. Res., 101, 8643-8657. Costa, P.C.G., 1978. Geologia das Folhas de Januária, Mata do Jaíba, Japoré e Manga, Minas
Gerais. Memória Técnica. CETEC. Belo Horizonte. CPRM, 2003. Atlas digitral de geologia e recursos minerais do Estado de Minas Gerais, escala
1:500.000. Cunha Filho, E.M. da, 2004. Contribuição para a geologia e avaliação do potencial mineral da
região de Januária-Itacarambi-Montalvânia (MG), Dissertação de Mestrado, Instituto de Geociências, Universidade de Brasília, 141 pp.

Sismicidade de Caraíbas-Itacarambi/MG: causas e características 94
Ferreira, J.M., Takeya, M.K., Costa, J.M., Moreira, J. Assumpção, M., Veloso, J. & Pearce, R.G.,
1987. A continuing intraplate sequence near João Câmara, northestern Brazil-preliminary results, Geophys. Res. Lett., 14, 1042-1045.
Ferreira, J.M., Oliveira, R.T., Takeya, M.K. & Assumpção, M., 1998. Superposition of local and
regional stresses in NE Brazil: evidence from local mechanisms around the Potiguar marginal basin, Geophys. J. Int., 134, 341-355.
Ferreira, J.M., Bezerra, F.H.R., Sousa, M.O.L., Nascimento, A.F. & França, G.S.L.A., 2008. The
role of Precambrian mylonitic belts and present-day stress field in the coseismic reactivation of the Pernambuco lineament, Brazil, Tectonophys., 456, 111-126, doi:10.1016/j.tecto.2008.01.009.
Gangopadhyay, A. & Talwani, P., 2005. Fault intersections and intraplate seismicity in
Charleston, South Carolina: insights from a 2-D numerical model, Current Sci., 88 (10), 1609-1616.
Johnston, A. C., 1989. Seismicity of “stable continental interiors”, in Earthquakes at North-
Atlantic Passive Margin: Neotectonics and Postglacial Rebound, edited by S. Gregersen and P. W. Basham, pp.299-327, Kluwer Acad., Norwell, Mass.
Kenner, S.J. & Segal, P., 2000. A mechanical model for intraplate earthquakes: application to the
New Madrid seismic zone. Science 289 (5488), 2329–2332. LASA, 2001. Projeto Januária-Itacarambi-Montalvânia, Minas Gerais – Área 5: Brasil, Rio de
Janeiro, LASA-Engenharia e Prospecções S.A. Relatório Final do levantamento Processamento dos dados magnetométricos e gamaespectométricos, Vol. I, Texto técnico.
Lopes, A. E. V., 2008. Mecanismos focais e esforços litosféricos no Brasil, Tese de Doutorado.
Universidade de São Paulo, 177 p. Marotta, G. S., G. S. França, J. F. G. Monico, R. A. Fuck, 2012. Strain rate of South American
Lithospheric Plate by SIRGAS-CON geodetic observations. Journal of South American Earth Sciences (submetido).
Martínez, M.I., 2007. Stratigraphy of Bambuí Group at the north of the São Francisco River
Valley, MG. Master Degree Thesis (in Portuguese), Institute of Geosciences, Federal University of Minas Gerais, 122 pp.
Meijer, P. T., Govers, R., and Wortel, M. J. R. (1997). Forces controlling the present-day state of
stress of the Andes. Earth Planet Sci. Lett. 148, 157-170. Nobre-Lopes, J., 2002. Diagenesis of the dolomites hosting Zn/Ag mineral deposits in the
Bambui Group at Januaria Region-MG, PhD Thesis, University of Campinas, Campinas, São Paulo, Brazil, 183 pp.

Sismicidade de Caraíbas-Itacarambi/MG: causas e características 95
Saadi, A., Machette, M.N., Haller, K.M., Dart, R.L., Bradley, L-A & de Souza, A.M.P.D., 2002. Map and database of Quaternary faults and lineaments in Brazil, U.S. Geol. Surv. Open-File Rep. 02-230, 59 pp.
Schulte, S.M. & Mooney, W.D., 2005. An updated global earthquake catalogue for stable
contintental regions: reassessing the correlation with ancient rifts, Geophys. J. Int. 161, 707-721.
Sophia, C.M. & Assumpção, M., 1989. Padrão de ruptura da falha de Samambaia, RN, durante a
reativação de fevereiro de 1987. I Congr. Soc. Bras. Geof., 350-356, Rio de Janeiro. Sykes, L.R., 1978. Intraplate seismicity, reactivation of preexisting zone of weakness, alkaline
magmatism, and other tectonism posdating continental fragmentation. Rev. Geophys. Space Phys. 245, 298–302.
Takeya, M.K., Ferreira, J.M., Pearce, R.G., Assumpção, M., Costa, J.M. & Sophia, C.M., 1989.
The 1986-87 intraplate earthquake sequence near João Câmara, northeast Brazil – evolution of seismicity, Tectonophysics, 167, 117-131.
Talwani, P., 1989. Characteristic features of intraplate earthquakes and the models proposed to
explain them. In: Gregersen, S., Basham, P.W. (Eds.), Earthquakes at North Atlantic Passive Margins: Neotectonics and Post-Glacial Rebound. Kluwer, Dordrecht, pp. 289–297.
Talwani, P. & Rajendran, K., 1991. Some seismological and geometric features of
intraplateearthquakes. Tectonophysics 186, 19–41. Valeriano, M.M. & Albuquerque, P.C.G.A., 2010. TOPODATA: processamento dos dados
SRTM, INPE-16702-RPQ/854, São José dos Campos, 79 p. Veloso, J.A., 1990. Atividade sísmica de Encruzilhada-BA, 36º Congresso Brasileiro de
Geologia, Natal, Boletim de Resumos. Veloso, J.A., Assumpção, M., Carvalho, J., Barbosa, J.R., Fontenele, D., Bassini, A., Gomes, I.P.,
Blum, M., & Ribeiro, R.K., 1990. Sismicidade recente nos estados de Minas Gerais e Bahia, in Workshop sobre Neotectônica e Sedimentação Continental Cenozóica no Sudeste do Brasil, 1, Belo Horizonte, 1990: Boletim da Sociedade Brasileira de Geologia, Belo Horizonte-MG, N. 11, p. 57-61.
Von Huelsen, M.G., 1993. Mecanismo focal na região de João Câmara, Dissertação de Mestrado,
Departamento de Geofísica, Universidade de São Paulo, 122 p.

Sismicidade de Caraíbas-Itacarambi/MG: causas e características 96
Capítulo 5 - Conclusões
A área de Caraíbas-Itacarambi, norte do Estado de Minas Gerais, foi estudada neste
trabalho de forma detalhada, tanto do ponto de vista do zoneamento espacial e temporal da
sismicidade quanto das características das fontes sísmicas geradoras dos eventos. O entendimento
dessa sismicidade é importante principalmente devido ao baixo nível de atividade sísmica
observado na porção central do Cráton São Francisco.
O monitoramento local evidenciou uma seqüência sísmica completa, com precursores
ocorridos dias antes, quiescência sísmica de aproximadamente 21 dias, precursores iminentes
(algumas horas antes), evento principal e centenas de réplicas. O evento principal de 09 de
dezembro de 2007 gerou intensidade máxima de VII MM, causando a primeira vítima fatal de
terremoto no Brasil, e sendo sentido a até 80 quilômetros de distância do epicentro.
A instalação de uma rede sismográfica digital bem próxima à área sísmica permitiu
determinar as localizações hipocentrais dos eventos com erros baixos (menores que 50 metros).
Devido a esta precisão na localização e pelo fato de ter sido registrado por estações a distâncias
regionais e telessísmicas, o evento principal de 09 de dezembro de 2007 é o primeiro terremoto
brasileiro usado como referência em estudos mundiais de avaliação de risco/perigo sísmicos
(Anexo 1).
A distribuição espacial dos hipocentros indica uma zona de 3 quilômetros de extensão,
aproximadamente alinhada na direção NE-SW, na qual os focos mostram-se mais rasos a NW e
mais profundos a SE, não superando os 2 quilômetros.
Os mecanismos focais dos eventos da seqüência sísmica de Caraíbas-Itacarambi foram
determinados usando três metodologias distintas e independentes. Primeiramente o mecanismo
focal composto foi calculado utilizando informações das polaridades dos primeiros movimentos
da onda P no programa FPFIT. Combinando este resultado com dados de polaridades da onda P
para o evento principal detectado em estações regionais e telessísmicas, e usando a direção dos
hipocentros, resultou num mecanismo de falha inversa, com plano na direção N30ºE, mergulho
de 40º para SE e rake de 105º.

Sismicidade de Caraíbas-Itacarambi/MG: causas e características 97
Eventos bem registrados pela rede local foram estudados para obtenção de seus tensores
momento sísmico, usando dados nos domínios do tempo e da freqüência.
No domínio do tempo foi realizada inversão da forma de onda completa (ISOLA) para
três eventos. Os resultados obtidos indicam fontes sísmicas com porcentagens double-couple de
pelo menos 70%. A inversão de forma de onda foi realizada com sucesso somente porque, apesar
dos eventos serem muito fracos (pequenos), a rede sismográfica local foi disposta a distâncias
muito próximas (raio de até 6 quilômetros). Dessa forma, para a banda de freqüência utilizada
(1,0 a 2,8 Hz) e distâncias epicentrais, o ajuste das formas de ondas completas pode ser realizado
mesmo utilizando um modelo de velocidades simples, gerando resultados robustos.
No domínio da freqüência foram estudados 4 grupos de eventos com localizações
epicentrais muito próximas, o que permitiu a utilização do método de inversão relativa do tensor
momento sísmico (RMTI). Os resultados também mostram fontes com porcentagens double-
couple de pelo menos 70% em sua grande maioria.
O método RMTI possui a vantagem de, no caso de eventos agrupados, os tensores
momento sísmico podem ser obtidos sem qualquer informação detalhada do modelo de
velocidades. Assim, é útil inverter eventos maiores individualmente usando o ISOLA e depois
aplicar o método RMTI para eventos menorer localizados próximos. Ambos os métodos possuem
a vantagem de serem adaptados a rotinas automatizadas.
Apesar dos métodos de inversão utilizados não serem novos, suas aplicações para eventos
muito fracos registrados por estações locais a frequências relativamente altas são metodicamente
desafiadores.
Avaliação dos mecanismos focais calculados usando os três métodos por meio do ângulo
Kagan (KA) mostra uma forte correlação entre eles, com valores de KA, em sua grande maioria,
menores que 30°.
A presença de feições NE-SW que poderiam estar associadas com a sismicidade de
Caraíbas-Itacarambi foi identificada neste trabalho através de análises de imagens de satélite,
dados SRTM e levantamentos geofísicos. Estudos anteriores (e.g., Brandalise et al., 1980;
Campos, 2001; Saadi et al., 2002; Cunha Filho, 2004; Martinez, 2007) também sugerem a
presença de estruturas NE-SW na região de Caraíbas-Itacarambi.

Sismicidade de Caraíbas-Itacarambi/MG: causas e características 98
Os resultados de mecanismo focal e tensor momento sísmico obtidos neste trabalho estão
em conformidade com estudos de inversão de mecanismos focais realizados na região do Cráton
São Francisco por Lopes (2008), nos quais evidencia a presença de esforço compressivo
aproximadamente E-W. Lopes (2008) atribui a sismicidade na região central do Cráton São
Francisco como movimentação ao longo de fraturas/falhas pré-existentes no embasamento em
resposta a este esforço compressivo. A mesma teoria é adotada na presente Tese para explicar a
sismicidade observada em Caraíbas-Itacarambi.
Referências Brandalise, L.A., Pimentel, G.B., Steiner, H.P., Soares, J., Mendes, J.R., Queiroz, N.F., Lima,
O.M., Pádua, W. de, 1980. Projeto Sondagens Bambuí em Minas Gerais: relatório final. Belo Horizonte, DNPM/CPRM, v.5.
Campos, J.E.G., 2001. Zoneamento Ecológico-Econômico – ZEE do Vale do São Francisco –
nota explicativa do Mapa Geológico do Vale do Rio São Francisco. CODEVASF. Cunha Filho, E.M. da, 2004. Contribuição para a geologia e avaliação do potencial mineral da
região de Januária-Itacarambi-Montalvânia (MG), Dissertação de Mestrado, Instituto de Geociências, Universidade de Brasília, 141 pp.
Lopes, A. E. V., 2008. Mecanismos focais e esforços litosféricos no Brasil, Tese de Doutorado.
Universidade de São Paulo, 177 p.
Martínez, M.I., 2007. Stratigraphy of Bambuí Group at the north of the São Francisco River Valley, MG. Master Degree Thesis (in Portuguese), Institute of Geosciences, Federal University of Minas Gerais, 122 pp.
Saadi, A., Machette, M.N., Haller, K.M., Dart, R.L., Bradley, L-A & de Souza, A.M.P.D., 2002. Map and database of Quaternary faults and lineaments in Brazil, U.S. Geol. Surv. Open-File Rep. 02-230, 59 pp.

Sismicidade de Caraíbas-Itacarambi/MG: causas e características 99
Anexo 1

Sismicidade de Caraíbas-Itacarambi/MG: causas e características 100
Informações do evento de Caraíbas-Itacarambi de 09 de dezembro de 2007 no banco de dados de eventos de referência (GT5) do IASPEI Ground Thruth (GT) Event 13285572 Brazil
Date Time Err RMS Latitude Longitude Smaj Smin Az Depth Err Ndef Nsta Gap mdist Mdist Qual
Author OrigID
2007/12/09 02:03:29.72 0.22 0.945 -15.1178 -44.2814 7.5 5.519 43 10.0f 115 136 43 3.64 94.99 m i de
ISC 12684675
(#PARAM pP_DEPTH=9.62821)
2007/12/09 02:03:28.36 -15.0326 -44.2953 0.7 ke IASPEI 01417080
(#PRIME)
(Caraibas-Itacarambi, Brazil)
(GT5 from local network data)
(Chimpliganond, C., M. Asumpção, M. Von Huelsen and G.S. França, The intracratonic Caraíbas–Itacarambi
earthquake of December 09, 2007 (4.9 mb), Minas Gerais State, Brazil, Tectonophysics, 480, 48-56, 2010.)
Magnitude Err Nsta Author OrigID
MS 4.3 0.2 18 IASPEI 01417080
mb 4.7 55 IASPEI 01417080