estimation of seismic ground motions using deterministic approach
TRANSCRIPT

Nat. Hazards Earth Syst. Sci., 12, 2019–2037, 2012www.nat-hazards-earth-syst-sci.net/12/2019/2012/doi:10.5194/nhess-12-2019-2012© Author(s) 2012. CC Attribution 3.0 License.
Natural Hazardsand Earth
System Sciences
Estimation of seismic ground motions using deterministic approachfor major cities of Gujarat
J. Shukla and D. Choudhury
Department of Civil Engineering, Indian Institute of Technology Bombay, Powai, Mumbai, 400076, India
Correspondence to:D. Choudhury ([email protected])
Received: 10 January 2011 – Revised: 30 March 2011 – Accepted: 16 May 2011 – Published: 26 June 2012
Abstract. A deterministic seismic hazard analysis has beencarried out for various sites of the major cities (Ahmedabad,Surat, Bhuj, Jamnagar and Junagadh) of the Gujarat region inIndia to compute the seismic hazard exceeding a certain levelin terms of peak ground acceleration (PGA) and to estimatemaximum possible PGA at each site at bed rock level. Theseismic sources in Gujarat are very uncertain and recurrenceintervals of regional large earthquakes are not well defined.Because the instrumental records of India specifically in theGujarat region are far from being satisfactory for modelingthe seismic hazard using the probabilistic approach, an at-tempt has been made in this study to accomplish it throughthe deterministic approach. In this regard, all small and largefaults of the Gujarat region were evaluated to obtain ma-jor fault systems. The empirical relations suggested by ear-lier researchers for the estimation of maximum magnitudeof earthquake motion with various properties of faults likelength, surface area, slip rate, etc. have been applied to thosefaults to obtain the maximum earthquake magnitude. Forthe analysis, seven different ground motion attenuation rela-tions (GMARs) of strong ground motion have been utilizedto calculate the maximum horizontal ground accelerationsfor each major city of Gujarat. Epistemic uncertainties inthe hazard computations are accounted for within a logic-treeframework by considering the controlling parameters likeb-value, maximum magnitude and ground motion attenuationrelations (GMARs). The corresponding deterministic spectrahave been prepared for each major city for the 50th and 84thpercentiles of ground motion occurrence. These determin-istic spectra are further compared with the specified spectraof Indian design code IS:1893-Part I (2002) to validate themfor further practical use. Close examination of the developedspectra reveals that the expected ground motion values be-come high for the Kachchh region i.e. Bhuj city and moderatein the Mainland Gujarat, i.e. cities of Surat and Ahmedabad.The seismic ground motion level in the Saurashtra is moder-ate but marginally differs from that as presently specified in
IS:1893-Part I (2002). Based on the present study, the recom-mended PGA values for the cities studied are 0.13 g, 0.15 g,0.64 g, 0.14 g and 0.2 g for Ahmedabad city, Surat City, BhujCity, Jamnagar City and Junagadh city, respectively. The pre-pared spectra can be further used for seismic resistant designof structures within the above major city boundaries of Gu-jarat to quantify seismic loading on structures.
1 Introduction
Proper determination of the peak horizontal ground accel-eration for designing the earthquake-resistant structures inearthquake-prone regions is essential. In country like In-dia with huge populations, the utmost care must be takenfor such estimation of seismic ground motion for seismicallyactive regions like the Himalayian belt, the Kachchh region,etc. The current practice in India for assigning the earthquakeload for the design of structures is to utilize the seismic haz-ard zonation map given in the Indian standard design codeIS:1893-Part I (2002), in which India is divided into foursubclasses of seismic zones. The assigned peak ground ac-celeration (PGA) values on that map are 0.08 g, 0.16 g, 0.24 gand 0.32 g for Zones, II, III, IV and V respectively. The seis-mic zonation map for the Gujarat region is shown in Fig. 1.In the seismic zonation map, the transition from one seis-mic zone to the adjacent one is rather drastic; it is createdby either dropping or increasing the ground acceleration by0.08 g. Also, the estimation for seismic ground motions invarious major cities of Gujarat is still not consistent with thetectonic framework for Gujarat. Hence, in this paper an at-tempt has been made to estimate the seismic ground motionsfor the entire region of Gujarat including some typical majorcities representing all seismic zones.
The Gujarat region is located within the tectonic plate ofIndia, about 500 km from a transform plate boundary (Ben-dick et al., 2001) (Fig. 1). The region has also experienced
Published by Copernicus Publications on behalf of the European Geosciences Union.

2020 J. Shukla and D. Choudhury: Estimation of seismic ground motions using deterministic
several damaging moderate-sized earthquakes with momentmagnitudes between 5 and 6 (Bendick et al., 2001, Petersenet al., 2004, Choudhury and Shukla, 2011). Nine of thesemoderate earthquakes have occurred during the past 155 yrin this region with an average of about one event every 17 yr.Large and moderate earthquakes are likely to repeat in thefuture and it is essential to assess the hazard in order to aidengineers and public officials in making decisions that willinfluence economic and life safety policies for the Gujaratregion (Petersen et al., 2004). During the year 2008, 1842shocks of moment magnitude of 0.5 to 4.4 were recorded inGujarat. Figure 2 illustrates the locations of epicenters forvarious earthquakes recorded during 2008 through the Gu-jarat State Seismic Network (GS-Net), recently establishedby the Institute of Seismological Research (ISR), Gujarat.
The present study aims to carry out deterministic seismichazard analysis for a few major cities of Gujarat. Typicalfive major city locations viz. Ahmedabad, Surat, Jamnagar,Bhuj and Junagadh have been selected for the present study.The selection of these five sites is primarily based on the factthat all these sites represent all the three parts of the inves-tigated area, i.e. Kachchh, Saurashtra and the Mainland re-gion of Gujarat and within that particular area, they are alsothe hubs of commercial/administrative activities. Moreover,these locations also represent the different earthquake zona-tions given in IS: 1893 – Part I (2002) which will facilitatethe comparison of the outcome of this study with provisionsof the code. The outcome of the present study consists of de-terministic response spectra of the horizontal component ofground motion for different natural periods of structures forthe particular city for the reference 50 percentile (median)and 84 percentile of earthquake occurrence, respectively.
2 Methodology
Following Yadav et al. (2008), in the present study, the entireGujarat region is divided into three seismogenic regions onthe basis of seismicity, tectonics and geomorphology, namelySaurashtra, Mainland Gujarat and Kachchh. Available seis-motectonic and geological criteria are combined to prepare apossible fault map which is then put together with the avail-able earthquake catalogue to obtain fault recurrence relationsfrom regional earthquake recurrence relations. The max-imum magnitude associated with fault can be determinedeither from the observed maximum earthquake in a nearbyarea from the earthquake catalogue data or can be calculatedthrough empirical correlations between key fault parameters(fault rupture length, fault displacement and fault area) andmagnitude. The available relationships given by different re-searchers, such as Bonilla et al. (1984), Nowroozi (1985),Slemmons et al. (1989), and Wells and Coppersmith (1994)have been used for the present study in order to decide themaximum magnitude for particular fault. These parametersare finally combined with seven Ground Motion Attenua-
tion Relations (GMARs) within a probabilistic framework toidentify the most probable deterministic ground motion val-ues at a given site. The Epistemic uncertainty in the presentanalysis has been tackled within a logic-tree framework con-sidering a few controlling parameters like region specific b-value, maximum magnitude of earthquake, and ground mo-tion attenuation relations (GMARs).
3 Seismotectonic settings
The collision process of the Indian plate with the Eurasianplate is still underway at a rate of 45 mm year−1, induc-ing an anticlockwise rotation of the plate (Bilham, 2004).Apart from the active seismic sources at the plate bound-ary (i.e. Himalayan arc), most of Peninsular India (PI)has been considered as a low seismic zone until the oc-currence of some surprising and damaging earthquakes inthe recent past (e.g. Koyna, 1967; Latur, 1993; Jabalpur,1997, and Bhuj, 2001). From the point of view of phys-iography, the Gujarat region of India is comprised of threedistinct zones: Kachchh, Saurashtra, and Mainland Gujarat(Chopra et al., 2010). The region is a junction of three tec-tonic rifts: Kachchh, Cambay and Narmada with several ac-tive faults (Biswas 1987, 2005; Talwani and Gangopadhayay,2001). The seismicity of the Gujarat state is characterized bya relatively high frequency of large earthquakes but a rela-tively low frequency of moderate earthquakes, particuarly inthe Kachchh region. The seismic characteristics of the Gu-jarat state has been divided into three regions (e.g. Kachchh,Saurashtra and Mainland Gujarat) to study the seismicitywithin the regions.
3.1 Kachchh
The Kachchh basin is a western margin pericratonic riftbasin of India (Biswas 1987, 2005). The Kachchh region isconsidered to be bound between the two extensional faults,namely the south-dipping Nagar Parkar Fault (along the Pak-istan border) in the North and the north-dipping KathiawarFault in the South (Rastogi, 2004). Several researchers hasdescribed the seismotectonic of Kachchh mainly, Biswasand Deshpande (1970), Biswas (1987, 2005), Sukhtankar etal. (1993), Malik et al. (1999), Rastogi et al. (2001), Thakurand Wesnousky (2002), Bodin and Horton (2004), Mandalet al. (2008), Chopra et al. (2010). The Kachchh regionhas a history of active seismicity with several large dam-aging earthquakes in the magnitude of 6 to 7 ranging overthe last several hundred years (Quittmeyer and Jacob, 1979,Rajendran and Rajendran, 2001). The occurrence of theMw = 7.6 Bhuj 2001earthquake less than two centuries afterthe M ≥ 7.8 Allah Bund 1819 earthquake has been consid-ered by some investigators to represent a short recurrenceinterval for earthquakes in Peninsular India. The seismicmoments for the past earthquakes yield a strain of 10−6,
Nat. Hazards Earth Syst. Sci., 12, 2019–2037, 2012 www.nat-hazards-earth-syst-sci.net/12/2019/2012/

J. Shukla and D. Choudhury: Estimation of seismic ground motions using deterministic 2021
Fig. 1. Geographical location of the Gujarat region in India (highlighed in inset) and seismic zonation map for the Gujarat region (citiesunder consideration in present study highlighted by red enclosed region). (Ref figure from ISR web site-www.isr.gujarat.gov.in, last accessedon 10 October 2010.)
consistent with the return period of 180 yr in the region or800 yr on individual faults (Rajendran et al., 2001; Rajen-dran and Rajendran, 2001). The major faults of the Kutchregion are trending E–W that include Allah Bund Fault, Is-land Belt Fault, Kutch Mainland fault (KMF) and Katrol Hillfault. The north- dipping Allah Bund fault was associatedwith the 1819 earthquake. The Island Belt Fault, along whichthere are situated several uplifts seen as islands in the GreatRann of Kutch, is associated with some magnitude 5 earth-quakes. The KMF extending for 125 km is a reverse faultand has a structural displacement of 2–3 km. The 2001 earth-quake occurred along a hidden fault named the North Wagadfault (Rastogi, 2001), situated about 25 km north of KMFand alongside which the Banni Plains area is inferred to beuplifting. Petersen et al. (2004) tested the sensitivity of seis-mic hazard to three fault source models for the Kachchh re-gion and observed the recurrence intervals of 266–533 yr onone of these faults. Yadav et al. (2008) and Tripathi (2006)worked out a probabilistic hazard assessment for this region
based on the earthquake recurrence modeling using variousprobability distributions.
3.2 Saurashtra
The Saurashtra region of Gujarat forms a vital geodynamicpart of the western continental margin of India. Severalplaces in the Saurashtra region, for example, Junagadh,Dwarka, Rajkot, Paliyad, Ghogha and Bhavnagar have a his-tory of recurring earthquake activity (Figs. 2 and 3) (Bhat-tacharya et al., 2004; ISR report 08-09). Apart from variousstudies on a regional scale, some researchers have attemptedto look into the local structure and tectonics. Karanthand Sant (1995) gave a detailed account of post-trappeanintrusive of plugs and dykes swarms as well as faults andother lineaments in the region. In the North of Bhavnagar,Bhattacharya et. al., 2004, had identified an E–W trendingShihor fault which offsets the N–S trending western Cambayrift fault (Fig. 3). The region is bounded on all four sides
www.nat-hazards-earth-syst-sci.net/12/2019/2012/ Nat. Hazards Earth Syst. Sci., 12, 2019–2037, 2012

2022 J. Shukla and D. Choudhury: Estimation of seismic ground motions using deterministic
Fig. 2. Epicenters of earthquakes recorded by the ISR (Institute ofSeismological Research) in the year 2008. (Reference from Annualreport of ISR 08-09, available online onwww.isr.gujarat.gov.in).
Fig. 3. Location of past earthquakes of magnitude 4 and above.(Note: Dotted areas are dyke zones of swarms. Faults are shown bydashed lines. 1, South Saurashtra fault; 2, Rajula fault; 3, Saverkun-dala fault; 4, South Junagadh fault; 5, North Junagadh fault; 6, Um-rethi fault; 7, Shihor fault; 8, West Cambay basin fault; 9, Eastwardoffsetted West Cam- bay basin fault, and 10, Camay–Dabhoi fault.)(Bhattacharya et al., 2004).
by major faults namely, the North Kathiawar Fault (NKF)to the north, the extension of the Son–Narmada fault to thesouth, the WNW–ESE trending West Coast fault system tothe west in the Arabian Sea, and the extension of the WestCambay fault to the east (Biswas, 1987, 2005). However,according to past history, only the West Cambay fault inthe East near Bhavnagar accommodates moderate seismicityin the last 200 yr, while the other faults exhibit weak earth-quake activity and were inactive until the recent earthquakes
in another region have shown considerable seismicity in theSaurashtra region (Fig. 2), (Yadav et al., 2010).
One strong earthquakeMw = 5.0 occurring in 1940 inDwarka (intensity VI) was reported by several researchers(Tandon, 1959; Chandra, 1977; Guha and Basu, 1993). TheJunagadh region experienced a shock ofMw = 4.3 on 3September 1985 and recently Yadav et al. (2010) has de-scribed the recent activities in this region. An offshore earth-quake withMw = 5.0 was also reported on 24 August 1993near Rajula. On 3 August 2000, the region of Girnar Hillsnear Una experienced an earthquake ofMw = 4.3, which wasstrongly felt up to Jamnagar. This earthquake activity wasassociated with two perpendicular faults passing through theepicentral region, namely, the West Cambay and the Shihorfaults (Bhattacharya et al., 2004).
3.3 Mainland Gujarat
Mainland Gujarat has experienced moderate seismicity cov-ering two rift zones, namely the Narmada rift zone andthe Cambay rift zone (Kaila et al., 1980; Biswas, 1987).Presently, the Narmada rift zone is more active than the Cam-bay rift zone. A total of nine earthquakes ofMw ≥ 5.0 haveoccurred in this region. The important earthquakes in thisregion are Mount Abu (1848,Mw = 6.0; 1969,Mw = 5.5),Surat (1856,Mw = 5.7; 1871,Mw = 5.0 and 1935,Mw =
5.7), Ahmedabad (1864,Mw = 5.0), Satpura (1938,Mw =
6.0) and Bharuch (1970,Mw = 5.4) (Yadav et al., 2008). TheBroach Earthquake of March 23, 1970 was one of the majorintraplate earthquake associated with paleorift zones in thestable continental region of Peninsular India (Chung, 1993).The valleys of the Narmada – Son (NSL) river in India areconsidered as a major tectonic boundary – a geofracture di-viding the Indian shield into a southern peninsular block anda northern foreland block (Biswas, 1982). The NSL has ex-perienced more than 30 earthquakes in the magnitude rangeof 3.0–6.5 on the Richter scale (Gupta et al., 1997).
4 Earthquake catalogue
Various researchers have prepared the earthquake cataloguefor the Indian subcontinents (Oldham, 1983; Tandon andSrivastava, 1974; Chandra, 1977; Quittmeyer and Jacob,1979; Guha and Basu, 1993; Iyengar et al., 1999, Malik etal., 1999, Jaiswal and Sinha, 2007, Yadav et al., 2008) byconsidering historical and modern earthquakes. The Insti-tute of Seismological Research-Gujarat (ISR) has prepareda compiled earthquake catalogue of the Kachchh, Saurasthraand Mainland Gujarat, bounded by 20–25.5 N and 68–75 Efrom the earliest times to March 2008 for all magnituderanges and has made this available on their web portal (Ref.www.isr.gujarat.gov.in). In the present study, the earthquakecatalogue of magnitudeMw ≥ 4 available on the Institute ofSeismological Research’s web portal was used in order to
Nat. Hazards Earth Syst. Sci., 12, 2019–2037, 2012 www.nat-hazards-earth-syst-sci.net/12/2019/2012/

J. Shukla and D. Choudhury: Estimation of seismic ground motions using deterministic 2023
Fig. 4. Catalogue completeness by Cumulative Visual (CUVI)method for Gujarat by using the earthquake catalogue (Mw ≥ 4)available on ISR-Gujarat web site (www.isr.gujarat.gov.in)
find out three parameters: the activity rate, theb-value ofthe Gutenberg-Richter (G-R) relationship, and the observedmaximum magnitude of earthquake near the fault. The cat-alogue was further analyzed for declustering using the staticwindowing technique (constant spatiotemporal window of30 days and 30 km). After analyzing the earthquake cata-logue for declustering, an earthquake catalogue spanning atime period of 1820–2008 for earthquake magnitudeM ≥ 4was prepared for use in the present study. As seismic in-strumentation has been just been initialized in the Gujarat byGS-Net under the umbrella of the Institute of SeismologicalResearch, most of the catalogue events in the prepared cat-alogue have been taken from historic records only. Histori-cal earthquake records are usually more complete for largerearthquakes than for smaller ones. In the present analysis,the minimum threshold magnitude is assumed asMw = 4,and generally events withMw ≥ 4 may not remain unnoticedas far as historic data is concerned. Based on this argument,it is reasonable to assume that the earthquake catalogue pre-pared forMw ≥ 4 is complete for its further use for prelim-inary seismic hazard computations. For checking the com-pleteness correctly, a sufficient number of samples should beavailable at all possible magnitudes. In the present study, theavailability of the data in the Gujarat region is low (after re-moving the clustered events only ,95 events ofMw ≥ 4 wereavailable). However, the Cumulative Visual (CUVI) method(Tinti and Mulargia, 1985) was used to check the complete-ness of the catalogue with these limited data. The CUVImethod is based on the visual method for assessing cataloguecompleteness, based on the plot of the cumulative numberof events, which is very easy to apply efficiently for limitedevent data. Figure 4 represents the cumulative earthquake oc-currence in time and space for checking the catalogue com-pleteness. As per Fig. 4, the seismicity rate is uniform from
Table 1. Earthquakes recorded in the year 2008 in the three regionsof Gujarat by GS-Net (Ref. Annual Report ISR-Gujarat, 08-09,available onlinewww.isr.gujarat.gov.in).
Region Mw ≥ 4 Mw Mw Mw Total(3 to 3.9) (2 to 2.9) (1 to 3.9)
Kachchh 5 52 343 493 893Saurashtra 2 12 221 424 659Mainland – 3 17 26 46Total 7 67 581 943 1598
1820 to 1960 but from 1961 to 2008, the seismicity rate in-creased. However, the seismicity rate for larger earthquakesin the present study is assumed to be uniform and catalogue isassumed to be complete during the period 1820 to 2008. Thisis also justified for historic earthquakes where the recordedseismicity differs from the true seismicity. Furthermore, his-toric earthquake records are usually more complete for largerearthquakes than for smaller ones, which further suggeststhat the catalogue can be assumed to be complete forMw ≥ 4.
The earthquake activities are significant in Gujarat for therecent years and these may be attributed to recent activ-ity along Bhavnagar swarms (2000), Bhuj Earthquake se-quence (2001–2008), Jamnagar swarms (2006–2008) andTalala earthquakes (2006–2010) (Table 1). After 2001, seis-micity has occurred at several new places in the Saurashtraregion, specially in Jamnagar, Surendranagar, and the Ta-lala area of Junagadh which has remained stable within theSaurashtra region.
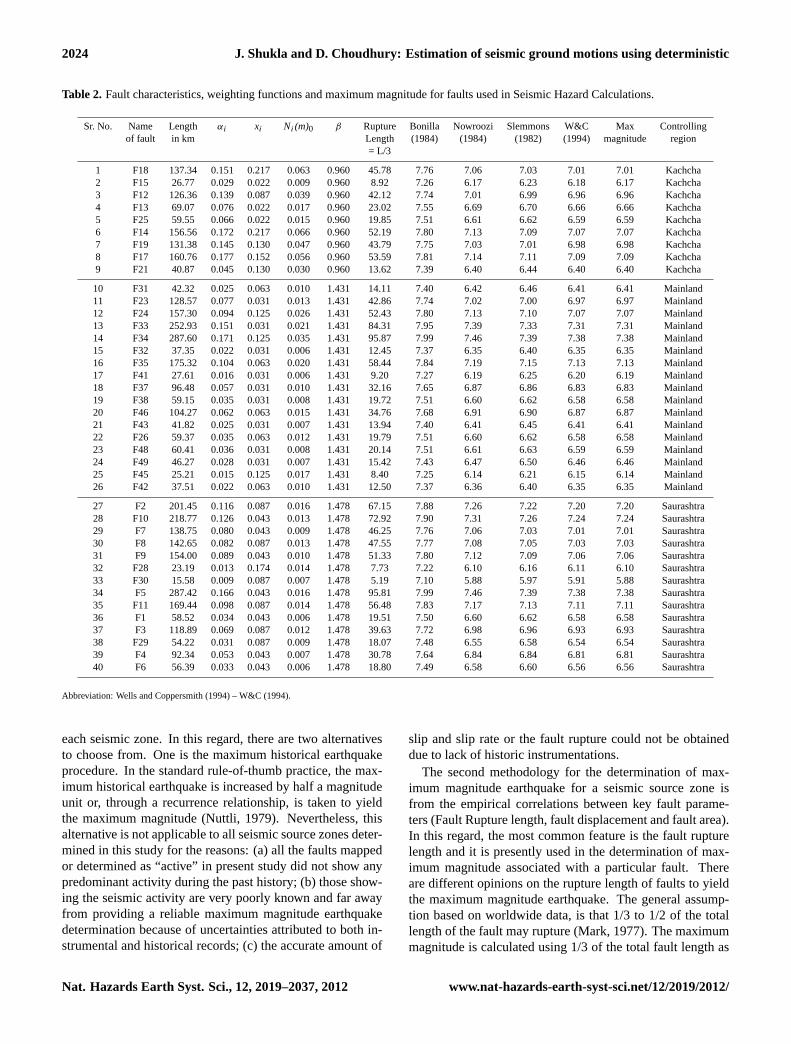
In the present study, five cities were selected as the tar-get and considering the city as centre, a control region with aradius of 250 km around the city is taken into account for fur-ther seismic hazard computations. From the seismotectonicstudy and published literature, a possible fault map of this en-tire Gujarat region has been prepared. Since earthquakes oc-curring at epicentral distances (i.e. distance between the cityand epicenter of earthquake) greater than 250 km do not gen-erally cause structural damage, the faults located at a maxi-mum distance of 250 km from a particular site have been notconsidered as the tectonic features in the present study. Atotal of 40 major faults, along with major earthquake eventswhich influence seismic hazard at Gujarat, habe been con-sidered in the present study (Fig. 5). A list of these faults isgiven in Table 2, describing the length of the faults and thecontrolling region assigned to them for seismic hazard com-putations.
5 Maximum magnitude determination
Once the seismic sources were determined for an area con-sidered for seismic hazard modeling, the next step was thedetermination of the maximum earthquake magnitude for
www.nat-hazards-earth-syst-sci.net/12/2019/2012/ Nat. Hazards Earth Syst. Sci., 12, 2019–2037, 2012
2024 J. Shukla and D. Choudhury: Estimation of seismic ground motions using deterministic
Table 2. Fault characteristics, weighting functions and maximum magnitude for faults used in Seismic Hazard Calculations.
Sr. No. Name Length αi xi Ni (m)0 β Rupture Bonilla Nowroozi Slemmons W&C Max Controllingof fault in km Length (1984) (1984) (1982) (1994) magnitude region
= L/3
1 F18 137.34 0.151 0.217 0.063 0.960 45.78 7.76 7.06 7.03 7.01 7.01 Kachcha2 F15 26.77 0.029 0.022 0.009 0.960 8.92 7.26 6.17 6.23 6.18 6.17 Kachcha3 F12 126.36 0.139 0.087 0.039 0.960 42.12 7.74 7.01 6.99 6.96 6.96 Kachcha4 F13 69.07 0.076 0.022 0.017 0.960 23.02 7.55 6.69 6.70 6.66 6.66 Kachcha5 F25 59.55 0.066 0.022 0.015 0.960 19.85 7.51 6.61 6.62 6.59 6.59 Kachcha6 F14 156.56 0.172 0.217 0.066 0.960 52.19 7.80 7.13 7.09 7.07 7.07 Kachcha7 F19 131.38 0.145 0.130 0.047 0.960 43.79 7.75 7.03 7.01 6.98 6.98 Kachcha8 F17 160.76 0.177 0.152 0.056 0.960 53.59 7.81 7.14 7.11 7.09 7.09 Kachcha9 F21 40.87 0.045 0.130 0.030 0.960 13.62 7.39 6.40 6.44 6.40 6.40 Kachcha
10 F31 42.32 0.025 0.063 0.010 1.431 14.11 7.40 6.42 6.46 6.41 6.41 Mainland11 F23 128.57 0.077 0.031 0.013 1.431 42.86 7.74 7.02 7.00 6.97 6.97 Mainland12 F24 157.30 0.094 0.125 0.026 1.431 52.43 7.80 7.13 7.10 7.07 7.07 Mainland13 F33 252.93 0.151 0.031 0.021 1.431 84.31 7.95 7.39 7.33 7.31 7.31 Mainland14 F34 287.60 0.171 0.125 0.035 1.431 95.87 7.99 7.46 7.39 7.38 7.38 Mainland15 F32 37.35 0.022 0.031 0.006 1.431 12.45 7.37 6.35 6.40 6.35 6.35 Mainland16 F35 175.32 0.104 0.063 0.020 1.431 58.44 7.84 7.19 7.15 7.13 7.13 Mainland17 F41 27.61 0.016 0.031 0.006 1.431 9.20 7.27 6.19 6.25 6.20 6.19 Mainland18 F37 96.48 0.057 0.031 0.010 1.431 32.16 7.65 6.87 6.86 6.83 6.83 Mainland19 F38 59.15 0.035 0.031 0.008 1.431 19.72 7.51 6.60 6.62 6.58 6.58 Mainland20 F46 104.27 0.062 0.063 0.015 1.431 34.76 7.68 6.91 6.90 6.87 6.87 Mainland21 F43 41.82 0.025 0.031 0.007 1.431 13.94 7.40 6.41 6.45 6.41 6.41 Mainland22 F26 59.37 0.035 0.063 0.012 1.431 19.79 7.51 6.60 6.62 6.58 6.58 Mainland23 F48 60.41 0.036 0.031 0.008 1.431 20.14 7.51 6.61 6.63 6.59 6.59 Mainland24 F49 46.27 0.028 0.031 0.007 1.431 15.42 7.43 6.47 6.50 6.46 6.46 Mainland25 F45 25.21 0.015 0.125 0.017 1.431 8.40 7.25 6.14 6.21 6.15 6.14 Mainland26 F42 37.51 0.022 0.063 0.010 1.431 12.50 7.37 6.36 6.40 6.35 6.35 Mainland
27 F2 201.45 0.116 0.087 0.016 1.478 67.15 7.88 7.26 7.22 7.20 7.20 Saurashtra28 F10 218.77 0.126 0.043 0.013 1.478 72.92 7.90 7.31 7.26 7.24 7.24 Saurashtra29 F7 138.75 0.080 0.043 0.009 1.478 46.25 7.76 7.06 7.03 7.01 7.01 Saurashtra30 F8 142.65 0.082 0.087 0.013 1.478 47.55 7.77 7.08 7.05 7.03 7.03 Saurashtra31 F9 154.00 0.089 0.043 0.010 1.478 51.33 7.80 7.12 7.09 7.06 7.06 Saurashtra32 F28 23.19 0.013 0.174 0.014 1.478 7.73 7.22 6.10 6.16 6.11 6.10 Saurashtra33 F30 15.58 0.009 0.087 0.007 1.478 5.19 7.10 5.88 5.97 5.91 5.88 Saurashtra34 F5 287.42 0.166 0.043 0.016 1.478 95.81 7.99 7.46 7.39 7.38 7.38 Saurashtra35 F11 169.44 0.098 0.087 0.014 1.478 56.48 7.83 7.17 7.13 7.11 7.11 Saurashtra36 F1 58.52 0.034 0.043 0.006 1.478 19.51 7.50 6.60 6.62 6.58 6.58 Saurashtra37 F3 118.89 0.069 0.087 0.012 1.478 39.63 7.72 6.98 6.96 6.93 6.93 Saurashtra38 F29 54.22 0.031 0.087 0.009 1.478 18.07 7.48 6.55 6.58 6.54 6.54 Saurashtra39 F4 92.34 0.053 0.043 0.007 1.478 30.78 7.64 6.84 6.84 6.81 6.81 Saurashtra40 F6 56.39 0.033 0.043 0.006 1.478 18.80 7.49 6.58 6.60 6.56 6.56 Saurashtra
Abbreviation: Wells and Coppersmith (1994) – W&C (1994).
each seismic zone. In this regard, there are two alternativesto choose from. One is the maximum historical earthquakeprocedure. In the standard rule-of-thumb practice, the max-imum historical earthquake is increased by half a magnitudeunit or, through a recurrence relationship, is taken to yieldthe maximum magnitude (Nuttli, 1979). Nevertheless, thisalternative is not applicable to all seismic source zones deter-mined in this study for the reasons: (a) all the faults mappedor determined as “active” in present study did not show anypredominant activity during the past history; (b) those show-ing the seismic activity are very poorly known and far awayfrom providing a reliable maximum magnitude earthquakedetermination because of uncertainties attributed to both in-strumental and historical records; (c) the accurate amount of
slip and slip rate or the fault rupture could not be obtaineddue to lack of historic instrumentations.
The second methodology for the determination of max-imum magnitude earthquake for a seismic source zone isfrom the empirical correlations between key fault parame-ters (Fault Rupture length, fault displacement and fault area).In this regard, the most common feature is the fault rupturelength and it is presently used in the determination of max-imum magnitude associated with a particular fault. Thereare different opinions on the rupture length of faults to yieldthe maximum magnitude earthquake. The general assump-tion based on worldwide data, is that 1/3 to 1/2 of the totallength of the fault may rupture (Mark, 1977). The maximummagnitude is calculated using 1/3 of the total fault length as
Nat. Hazards Earth Syst. Sci., 12, 2019–2037, 2012 www.nat-hazards-earth-syst-sci.net/12/2019/2012/

J. Shukla and D. Choudhury: Estimation of seismic ground motions using deterministic 2025
Fig. 5. The Fault map used in the present study.
Fig. 6. Gutenberg-Richter frequency magnitude recurrence rela-tionship for Kachchh, Saurashtra, Mainland regions and the entireregion of Gujarat.
rupture length and using the relationship given by Bonillaet al. (1984), Nowroozi (1985), Slemmons et al. (1989) andWells and Coppersmith (1984); the results are presented inTable 2. The minimum out of the estimated maximum mag-nitude is finally assigned to the particular fault as the maxi-mum magnitude for seismic hazard calculations.
6 Recurrence relations
Using the prepared earthquake catalogue, the estimatedGutenberg-Richter (G-R) magnitude-frequency recurrencerelationship for the three study areas is plotted in Fig. 6. Incomparison to other studies on the seismic hazard for theIndian Peninsular shield (Table 3), the estimatedb-value islow in the present study. There are large variations in the
b-value reported by various researchers for peninsular Indiaand the Gujarat region. It is very difficult to achieve agree-ment on one single value for the study. Tectonic earthquakesare characterized by theb-value from 0.5 to 1.5 and are morefrequently around 1.0. In the present study, earthquakes lessthan Mw = 4 are not included. Eliminating the big classof the small earthquakes while fitting the Gutenberg-Richter(G-R) line may tend to flatten the line. As a result, the actualmean rate of small earthquakes will be underestimated andthe mean rate of large earthquakes will be overestimated. Alowerb-value for Kachchh region may be due to the predom-inance of a few big earthquakes in the region and a higherb-value for other region may be due to lack of significantnumbers of big earthquakes. The uncertainty in theb-valueis dealt with in the present study using the logic tree ap-proach with the selection of correspondingb-value and itsweightage. In the present analysis, twob-values are selected,i.e. one corresponds to the study area obtained using thepresent study and the second one using the regionalb-valueas reported by Jaiswal and Sinha (2007).
Furthermore, the occurrence of an earthquake in a seismicsource is assumed to follow a Poisson’s distribution. Theprobability of the ground motion parameter (horizontal com-ponent of peak ground acceleration in present study) at agiven site,Z to exceed a specified level,z, during a speci-fied time,T , is represented by the expression:
P(Z >z) = 1−e−v(z)T≤ v(z)T (1)
Where,v(z) is the mean annual rate of exceedance of groundmotion parameter, Z with respect to z. Assuming that theNi(m0) is the frequency of an earthquake on seismic sourcei, having a magnitude higher than a minimum magnitude ofm0 (in present study it is taken as 4.0). The recurrence rela-tion for each seismic source capable of producing an earth-quake magnitude in the range of m0 (minimum magnitude) tommax (maximum magnitude assigned) was calculated usingthe truncated exponential recurrence model (McGuire andArabaz, 1990), given by the following expression
N(m0) =e−β(m−m0)
−e−β(mmax−m0)
1−e−β(mmax−m0) π
f orm0 ≤ m ≤ mmax(2)
Whereβ= Log10 (b-value) (b-value is Gutenberg–Ritcher pa-rameter, see Table 3).
6.1 Fault recurrence relations
The recurrence relation derived above (Eq. 2) is valid for theentire region and is not specific to any particular faults as-sumed in the study. Fault-level recurrence is necessary todiscriminate nearby sources from far-off sources and to dif-ferentiate the activity rate among faults. In Gujarat, faultstudies are not available presently and historical data are notsufficient to establish fault recurrence relations. In addition,PI (Peninsular India) earthquakes are associated with poor
www.nat-hazards-earth-syst-sci.net/12/2019/2012/ Nat. Hazards Earth Syst. Sci., 12, 2019–2037, 2012

2026 J. Shukla and D. Choudhury: Estimation of seismic ground motions using deterministic
Table 3. Comparison ofb-value for the Gujarat region to values reported by various researchers.
Study Application b-value Reference Periods fornumber area study taken
1 Kachchh 0.417 Present study (1820–2008)2 Saurashtra 0.64 (1872–2008)3 Mainland 0.62 (1872–2008)4 Entire Gujarat 0.51 (1820–2008)
5 Kachchh 0.43 Ashara et al. (2006) –6 Gujarat 0.72 Tripathi et al. (2005) –7 Peninsular 0.47 Gupta & Rastogi (1976) –
India (PI)8 0.81 Avadh Ram and Rathor (1970) 70 yr9 0.7 Kaila et al. (1972) (1954–1967)10 0.85 Rao and Rao (1984) (1800–1983)11 0.92 Jaiswal and Sinha (2007) (1842–2002)12 Mumbai 0.86 Raghu Kanth and Iyengar (2006) (1802–2002)13 Southern PI 1.13 Menon et al. (2010) (1507–2008)14 Bangalore 0.86 Anbazhagan et al. (2009) (1800–2004)
Note: PI – Peninsular India
surface expression of faults and hence, reliable estimation ofslip rates in order to model earthquake recurrence alterna-tively has also not been possible. In such situations, theb-value to the particular fault is empirically fixed consideringthe conservation of seismic activity in that particular region.
Followed by Iyengar and Ghosh (2004), Raghu Kanthand Iyengar (2006), Anbazhagan et al. (2009) and Vipin etal. (2009), the regional recurrence relations are scaled downto fault recurrence relations by introducing a weighting fac-tor as given below:
Ni(m0) = Fi(m0)πe−β(m−m0)
−e−β(mmax−m0)
1−e−β(mmax−m0)
f orm0 ≤ m ≤ mmax(3)
In whichFi(m0) is the weighting factor as given below:
Fi(m0) = 0.5(αi +xi) (4)
Whereαi and xi are the weighting factors for length andearthquake event, respectively, which are given as below.Considering the fact that a longer fault can produce a greaternumber of small events of magnitude m0 than a shorter fault,fault recurrence may be taken as being proportional to thelength of the fault, leading to a simple weight factorαi asgiven below:
αi =Li
6Li
(5)
WhereLi is the length of the faulti and 6Li is the totalfault length within the region under consideration. Further,the regional seismicity measured in terms of the number ofearthquakes per year with m≥ m0, should be equal to thesum of such events the sum of such events occurring on indi-vidual faults for particular area under consideration. It is also
obvious that future activity will continue at seismic sources,at least in the short run, similar to past activity. Hence, ir-respective of its length, seismic activity of a fault should berelated to the number of past events associated with it in thecatalogue and it is given by
xi=Number of earthquakes close to the fault
Total number of earthquakes in the region(6)
Since the Gujarat region is divided into three control regions,it would be appropriate to use the control region specificb-value for individual faults. The above argument provides abasis for decomposing the regional hazard into fault recur-rence relations. The weight factors and obtained fault recur-rence relation Ni(m0) are presented in Table 2. Based on thecalculated parameters from Table 2, Fig. 6 and above dis-cussion, the fault recurrence relations usingb-value calcu-lated in present study andb-value reported by Jaiswal andSinha (2007), are calculated and graphically presented inFig. 7.
7 Ground Motion Attenuation Relations (GMARs)
Once the maximum magnitudes that each fault zone can gen-erate are determined through the empirical relationship (Ta-ble 2), the next step is the selection of appropriate GroundMotion Attenuation Relation (GMAR) to estimate groundmotion parameters at site. Raghu Kanth and Iyengar (2007)proposed an empirical GMAR for Peninsular India based onthe stochastic seismological model and its comparison withinstrumented data from the Koyna (1967) and Bhuj (2001)earthquakes. In order to try different forms of attenuation
Nat. Hazards Earth Syst. Sci., 12, 2019–2037, 2012 www.nat-hazards-earth-syst-sci.net/12/2019/2012/

J. Shukla and D. Choudhury: Estimation of seismic ground motions using deterministic 2027
41
4 5 6 7 8 9 101E-5
1E-4
1E-3
0.01
Ann
ual R
ate
of E
vent
s > M
w=4
Magnitude (Mw)
F1 F10 F11 F12 F13 F15 F14 F17 F18 F19 F2 F21
F23 F24 F25A F26 F28 F29 F3 F30
F31 F32 F33 F34 F35 F37 F38 F4
F41 F42 F43 F45 F46 F48
F49
(a) using region speific b-value
1
2
4 5 6 71E-5
1E-4
1E-3
0.01
0.1
Ann
ual R
ate
of E
vent
s > M
w=4
Magnitude (Mw)
F4 ( region specific b-value, Present Study) F34 (region specific b-value, Present Study) F14 (region specific b-value, Present Study) F4 (using b=0.92, Jaiswal and Sinha (2007)) F34 (using b=0.92, Jaiswal and Sinha (2007)) F14 (using b=0.92, Jaiswal and Sinha (2007))
(b) comparison with using b-value 0.92 reported by Jaiswal and Sinha (2007)
3
Figure 7. Fault recurrence relations (a) using b-value calculated in present study (b) 4
comparison with using b-value 0.92 reported by Jaiswal and Sinha (2007) for some selected 5
faults. 6
7
Deleted: level
Fig. 7. Fault recurrence relations(a) using b-value calculated inpresent study(b) comparison with usingb-value 0.92 reported byJaiswal and Sinha (2007) for some selected faults.
relationships, several other approaches were also employedto have a chance for comparison. For shallow crustal earth-quakes, GMAR proposed by Abrahamson and Silva (1997)is applicable and used in the present study. The comparisonmade by Petersen et al. (2004) has revealed that the crustalintraplate relation of Frankel et al. (1996) yields ground mo-tions similar to the strong ground motion data recorded fromthe 2001 earthquake at large distances (Cramer and Wheeler,2001). In the present study, we have also included the crustalintraplate GMARs given by Toro et al. (1997) and Frankelet al. (1996). The equations by Boore-Joyner-Fumal (1997),Campbell (1997) and Sadigh et al. (1997) representing theGMAR were also selected for comparison.
8 Uncertainty in Seismic Hazard
Epistemic uncertainties in the hazard computations havebeen accounted for within a logic-tree framework by con-
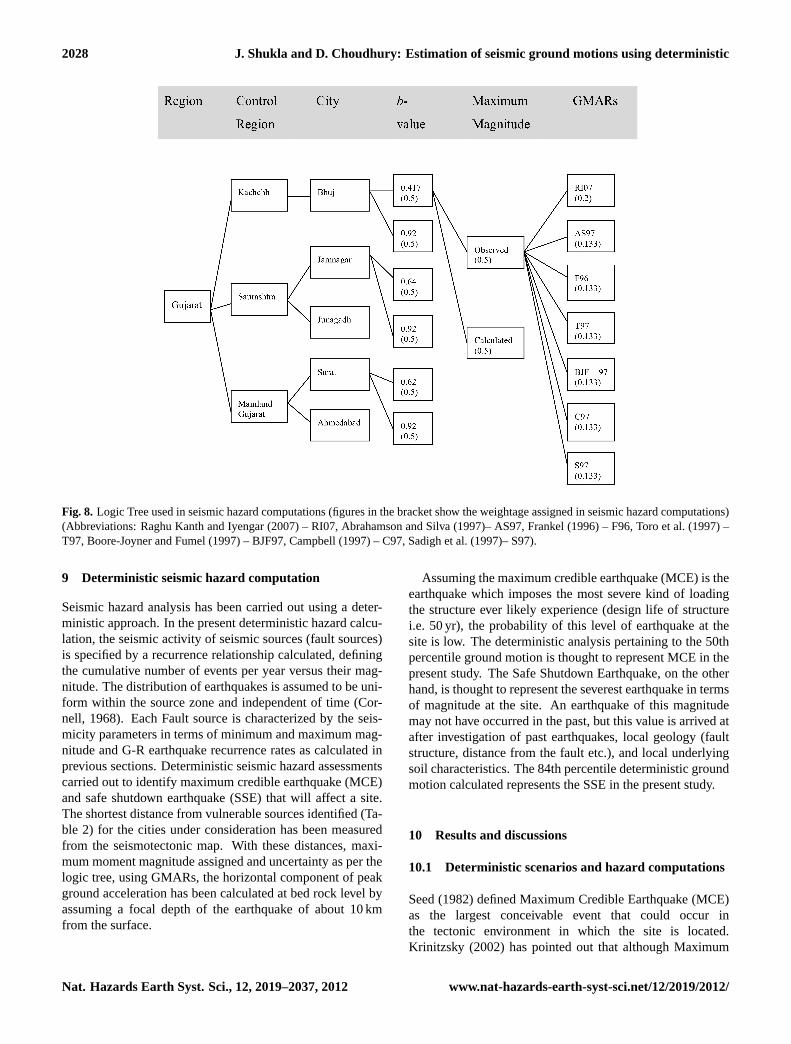
sidering the following controlling parameters: (1) assign-ing region specific theb-value based on the present studyand based on reported by researchers, (2) the maximum cut-off magnitude in hazard computations, and (3) the GMARs.Within the hazard analysis, assignedb-value maximum cut-off magnitudes and GMARs have been assigned differentweights, which are presented in logic tree form in Fig. 8.
The b-value assigned in hazard computation is selectedbased on the present study and the value reported by Jaiswaland Sinha (2007) with equal weightage. Owing to the recentstudy made and the time period used in the study carried out,b-value = 0.92 given by Jaiswal and Sinha (2007) has beenselected for the hazard computations. There are significantvariations in reportedb-value (Table 3) and it is very difficultto assign different weightage for one over the other. Hence,equal weightage has been assigned to both the hazard com-putation framework, i.e.b-value calculated in present studyandb-value = 0.92. It may be noted that the variation inb-value obtained in the present study based on the study areaof the Gujarat region only is due to the difference in studyarea asb-value reported by Jaiswal and Sinha (2007) was forthe whole of Peninsular India.
In the present study, the maximum cutoff magnitude is cal-culated based on empirical correlation using key fault param-eters (Fault length). As an alternative, each fault is assignedas the observed magnitude based on the past historic eventwithin the nearby area. Equal weights have been assignedto the two different maximum magnitudes, as there is clearlyno ground for choosing one alternative over the other. Thisis also in agreement that the present study is based on thefault map prepared, from which some of the faults may notbe active and the maximum observed magnitude may give areasonable idea about the current seismic activity in the re-gion.
In order to compute the maximum horizontal ground ac-celeration for a given point assuming a hard rock site, vari-ous GMARs have been selected as shown in Fig. 8. RaghuKanth and Iyengar (2004, 2007) have studied the attenua-tion of PGA and Spectral acceleration in Peninsular Indiafrom the considerations of engineering seismology and ob-tained the coefficients for attenuation equations from exten-sive seismological modeling and simulation. As this domes-tic GMAR given by Raghu Kanth and Iyengar (2007), is re-lated specifically to Peninsular India, slightly higher weight(0.2) is assigned to it compared to other imported GMARs.However, it is notable that this relation is only valid forbedrock sites with a shear wave velocity of 3.6 km s. OtherGMARs used are for comparison and owing to the fact thatit is difficult to assign a higher weight to one equation overthe other, equal weights (0.133) have been chosen for all im-ported GMARs. To avoid confusion associated with differentmagnitude scales, all magnitudes have been assumed to bemoment magnitudeMw in entire study.
www.nat-hazards-earth-syst-sci.net/12/2019/2012/ Nat. Hazards Earth Syst. Sci., 12, 2019–2037, 2012
2028 J. Shukla and D. Choudhury: Estimation of seismic ground motions using deterministic
Fig. 8. Logic Tree used in seismic hazard computations (figures in the bracket show the weightage assigned in seismic hazard computations)(Abbreviations: Raghu Kanth and Iyengar (2007) – RI07, Abrahamson and Silva (1997)– AS97, Frankel (1996) – F96, Toro et al. (1997) –T97, Boore-Joyner and Fumel (1997) – BJF97, Campbell (1997) – C97, Sadigh et al. (1997)– S97).
9 Deterministic seismic hazard computation
Seismic hazard analysis has been carried out using a deter-ministic approach. In the present deterministic hazard calcu-lation, the seismic activity of seismic sources (fault sources)is specified by a recurrence relationship calculated, definingthe cumulative number of events per year versus their mag-nitude. The distribution of earthquakes is assumed to be uni-form within the source zone and independent of time (Cor-nell, 1968). Each Fault source is characterized by the seis-micity parameters in terms of minimum and maximum mag-nitude and G-R earthquake recurrence rates as calculated inprevious sections. Deterministic seismic hazard assessmentscarried out to identify maximum credible earthquake (MCE)and safe shutdown earthquake (SSE) that will affect a site.The shortest distance from vulnerable sources identified (Ta-ble 2) for the cities under consideration has been measuredfrom the seismotectonic map. With these distances, maxi-mum moment magnitude assigned and uncertainty as per thelogic tree, using GMARs, the horizontal component of peakground acceleration has been calculated at bed rock level byassuming a focal depth of the earthquake of about 10 kmfrom the surface.
Assuming the maximum credible earthquake (MCE) is theearthquake which imposes the most severe kind of loadingthe structure ever likely experience (design life of structurei.e. 50 yr), the probability of this level of earthquake at thesite is low. The deterministic analysis pertaining to the 50thpercentile ground motion is thought to represent MCE in thepresent study. The Safe Shutdown Earthquake, on the otherhand, is thought to represent the severest earthquake in termsof magnitude at the site. An earthquake of this magnitudemay not have occurred in the past, but this value is arrived atafter investigation of past earthquakes, local geology (faultstructure, distance from the fault etc.), and local underlyingsoil characteristics. The 84th percentile deterministic groundmotion calculated represents the SSE in the present study.
10 Results and discussions
10.1 Deterministic scenarios and hazard computations
Seed (1982) defined Maximum Credible Earthquake (MCE)as the largest conceivable event that could occur inthe tectonic environment in which the site is located.Krinitzsky (2002) has pointed out that although Maximum
Nat. Hazards Earth Syst. Sci., 12, 2019–2037, 2012 www.nat-hazards-earth-syst-sci.net/12/2019/2012/

J. Shukla and D. Choudhury: Estimation of seismic ground motions using deterministic 2029
43
1E-4 1E-3 0.01 0.1 1 10 1001E-13
1E-12
1E-11
1E-10
1E-9
1E-8
1E-7
1E-6
1E-5
1E-4
1E-3
0.01
0.1
1
10
Ann
ual F
requ
ency
of E
xcee
denc
e
Peak Ground Acceleration (g)
Total Hazard F12 F13 F14 F17 F18 F19 F21 F23 F24 F26 F28 F31 F32 F33 F34 F35 F49 All Other Sources
Spectral Response @ 5% Damping - Average Horizontal Component
Period = PGA
1
2
Figure 9. Total hazard for Ahmedabad city obtained from contribution of fault sources. 3
4
5
6
7
8
9
10
11
12
13
Fig. 9. Total hazard for the city of Ahmedabad obtained from thecontribution of fault sources.
44
1
1E-3 0.01 0.1 1 101E-13
1E-12
1E-11
1E-10
1E-9
1E-8
1E-7
1E-6
1E-5
1E-4
1E-3
0.01
0.1
1
Ann
ual F
requ
ency
of E
xcee
denc
e
Peak Ground Acceleration (g)
Total of mean hazard for each source Sources using Abra.-Silva (1997) Rock Sources using Boore-Joyner-Fumal (1997) Sources using Campbell (1997) Sources using Sadigh (1997) Rock Sources using Frankel (1996) Sources using Toro (1997) Sources using Raghu Kanth & Iyengar (2007)
Period = PGA, Ahmedabad
2
3
Figure 10. Comparison of ground motion attenuation relations (GMARs) computed using 4
various models for total hazard for Ahmedabad city 5
6
7
8
9
10
11
12
13
14
Fig. 10. Comparison of ground motion attenuation relations(GMARs) computed using various models for total hazard for thecity of Ahmedabad.
Credible Earthquake (MCE) is the largest earthquake thatcan be reasonably expected to occur with in the design lifeof a structure (based on geological evidence and earthquakehistory), this does not necessarily imply that it would alsobe the worst. The maximum earthquake magnitude calcu-lated and assigned earthquake to the faults as observed in thepast history are also mentioned in Table 1. From Table 4it is easy to pick the MCE and SSE for each site consider-ing the nearest fault producing the largest ground motions.From the deterministic analysis it is found that for the citiesof Surat, Ahmedabad, Bhuj, Jamnagar and Junagadh, faultnumbers F34, F24, F12, F5 and F7 are the controlling faults,
respectively, owing to the shortest distance criteria. Howeverin practice, structures are designed for ground motions, notearthquakes, so obtained deterministic scenario earthquakesshould be obtained in the form of worst-case ground motionand not just a maximum magnitude-distance pair. In order toestimate reliable ground motions, a probabilistic frameworkis further used to compute the hazard contribution exceedinga certain level offered by each fault due to all possible futureactivities on the faults as visualized by the typical hazard sce-nario presented for Ahmedabad city in Fig. 9. From Fig. 9,it is clear that hazard contributions from fault numbers F26,F24 and F13 are maximum compared to the other faults forAhmedabad city. In order to compare all the GMARs usedin estimating the ground motions at site, a typical compari-son for the city of Ahmedabad is presented in Fig. 10. FromFig. 10 it can be observed that the GMAR given by Camp-bell (1997) gives the highest hazard for Ahmedabad com-pared to all other GMARs used. However, all the GMARsare comparable and no significant variations in the estimatedhazard have been observed as shown in Fig. 10.
The total hazard obtained from all the sources for a par-ticular site is typically presented in Fig. 11. It is quite clearthat out of the five cities studied, Bhuj has the highest hazardcompared to all the others. Surat has higher hazard com-pared to Ahmedabad, being very close to the Narmada SonLineaments. Although the hazard for the cities of Jamna-gar and Junagadh are more or less the same, Jamnagar cityhas the lowest seismic hazard compared to all other cities.The finally-computed deterministic seismic scenarios for thecities are presented in terms of magnitude and distance pairsin Table 5. It is notable that these deterministic scenarios arenot fact or do not belong to any particular fault, but groundmotion computed using these scenarios can produce the samelevel of ground motion which can be expected at a given site.
10.2 Development of deterministic hazard spectra
As expressed earlier, in practice design engineers are gen-erally more interested in specifying the ground motions interms of PGA or in terms of spectra as specified by provi-sions made by code. In deterministic analysis for a givenprobability of exceedance, the probability distribution for thehazard value can be determined from which the specifiedfractiles (usually 50th percentile i.e. median and 84th per-centile) are computed. However, the deterministic groundmotions should not just be called the median and 84th per-centile ground motions but rather they should be called theground motions with 50 % chance and 84 % chance of notbeing exceeded for the design earthquake (the 84th percentiledeterministic ground motion has a 16 % chance of being ex-ceeded if the scenario earthquake occurs). In the presentanalysis, 50th percentile (representing MCE) and 84th per-centile (representing SSE) deterministic spectra for spectralresponse for 5 % damping at the bed rock level, have beendeveloped varyingb-value as given in logic tree. The 5 %
www.nat-hazards-earth-syst-sci.net/12/2019/2012/ Nat. Hazards Earth Syst. Sci., 12, 2019–2037, 2012

2030 J. Shukla and D. Choudhury: Estimation of seismic ground motions using deterministic
Table 4. Deterministic scenarios for various cities under consideration in the present study.
Name of Maximum Maximum Surat Ahmedabad Bhuj Jamnagar Junagadhfault Magnitude Magnitude City City City City City
(Calculated) (Observed)
Hypocentral Distance (km),h =10 km
F1 6.58 5.5 315.63 381.32 231.23 169.01 107.63F10 7.24 5.5 93.67 238.18 231.23 225.62 231.23F11 7.11 5 118.57 279.47 320.36 239.02 133.93F12 6.96 6.66 357.46 249.08 6.22 84.05 191.24F13 6.66 6.96 336.68 245.07 35.56 48.23 158.72F14 7.07 7.07 342.65 225.42 23.37 89.93 194.18F15 6.17 6.17 407.04 286.03 45.51 126.3 236.5F17 7.09 7.09 359.46 189.8 86.8 164 267.69F18 7.01 7.01 416.47 264.78 98.43 173.81 280.67F19 6.98 6.98 450.28 286.78 137 216.08 322.31F2 7.2 5.5 248.25 337 144.18 110.97 62.91F21 6.4 6.4 328.27 184.95 73.96 115.21 213.84F23 6.97 5.5 142.3 63.02 206.85 198.34 195.09F24 7.07 5.5 81.57 14.11 279.7 274.83 272.97F25A 6.59 6.59 336.68 245.07 35.56 48.23 158.72F26 6.58 5.5 149.1 22.42 270.99 228.35 217.82F28 6.1 6 125.43 96.05 219.95 177.66 160.79F29 6.54 5.5 101.47 138.83 242.29 176.47 131.87F3 6.93 5.5 227.14 306.38 153.06 88.82 32.75F30 5.88 5.5 77.37 142.09 275.58 214.54 170.89F31 6.41 5.5 118.08 91.33 284.48 235.29 212.1F32 6.35 5.5 84.22 93.7 321.18 274.8 250.49F33 7.31 5.7 61.57 145.22 340.64 282.66 236F34 7.38 5.7 11.59 213.35 369.19 296.41 216.51F35 7.13 5.5 72.36 157.9 380.96 326.48 282.18F37 6.83 5.5 39.99 235.66 409.59 338.23 259.25F38 6.58 5.5 118.57 262.32 487.65 427.58 366.92F4 6.81 5.5 235.63 236.49 162.32 79.07 31.15F41 6.19 5.5 221.3 249.15 522.38 480.08 447.11F42 6.35 5.5 189.26 296.67 544.85 489.96 436F43 6.41 5.5 47.87 232.04 364.41 292.05 213.45F45 6.14 5.5 73.4 282.56 439.96 367.59 285.13F46 6.87 5.5 128.97 330.03 504.45 432.64 349.31F48 6.59 5.5 340.68 145.66 196.41 222.02 294.46F49 6.46 5.5 286.96 85.79 223.6 227.49 278.52F5 7.38 5 280.64 115.91 49.68 33.97 143.98F6 6.56 5.5 188.44 212.61 203.94 120.55 15.52F7 7.01 5.5 120.31 200.5 206.86 123.33 13.6F8 7.03 5 92.55 203.69 271.84 188.16 77.68F9 7.06 5 64.74 210.5 298.37 214.71 104.4
damping is specifically selected to compare the results ofthe present study with the provisions made in IS:1893- PartI (2002). The comparison of the obtained spectra forb-value obtained from the present study andb-value reportedby Jaiswal and Sinha (2007), are presented in Fig. 12. Thecomparisons confirm that the higher ground motions are pro-duced for theb-value = 0.92 whereas spectra corresponds totheb-value from the present study gives comparatively lesserground motions. The difference is very less for Bhuj city and
observed to be highest for Ahmedabad city compared to allother cities studied. A significant difference is observed inthe PGA value obtained by both theb-value approach. Thecalculated ground motions in terms of the horizontal compo-nent for spectral response at 5 % damping for the few periodsare tabulated in Table 6.
The cities of Junagadh and Jamnagar belong to the sametectonic control region, i.e. Saurashtra but the expected seis-mic ground motion for both of them is different, i.e. for
Nat. Hazards Earth Syst. Sci., 12, 2019–2037, 2012 www.nat-hazards-earth-syst-sci.net/12/2019/2012/

J. Shukla and D. Choudhury: Estimation of seismic ground motions using deterministic 2031
45
1
1E-4 1E-3 0.01 0.1 1 101E-7
1E-6
1E-5
1E-4
1E-3
0.01
0.1
1Spectral response @ 5% damping-average horizontal component
Ann
ual F
requ
ency
of E
xcee
denc
e
Peak Ground Acceleration (g)
Ahmedabad Surat Bhuj Jamnagar Junagadh
2
3
Figure 11. Total Hazard calculated for various cities at zero spectral period i.e. PGA 4
5
6
7
8
9
10
11
12
13
14
Fig. 11. Total Hazard calculated for various cities at zero spectralperiod i.e. PGA.
Junagadh being higher than Jamnagar. This is also consis-tent with recent activities as described by Yadav et al. (2010)in the Talala region very close to Junagadh. In the same way,Surat and Ahmedabad cities are sharing same tectonic con-trol region as per the present study, but the calculated PGAfor Surat city is slightly higher than for Ahmedabad. This ispossibly due to the proximity of Surat city to the NarmadaSon lineaments, considered to be a controlling fault for thecity of Surat.
It is interesting to note that for the Bhuj region, the esti-mated PGA are in order of 0.64 to 1.04 g corresponding tob-value studied. Parvez et al. (2003) and Hough et al. (2002)has predicted near field ground motion of approximately0.8 g for the Kachchh areas for the Bhuj 2001 earthquakewhich compared well with our present results. During the re-cent excavations at Bet Dwarka, in the Gulf of Kachchh, Ra-jendran et al. (2003) identified a seismically generated sandblow that has disrupted an ancient cultural horizon. The agedata suggested that the causative earthquake may have oc-curred about 2000 years ago. While the source of this earth-quake remains constrained, its timing seems to be singular;studies elsewhere in Kachchh have not disclosed any featureof a comparable age as yet. Their study opens the possibilityfor another surprise source, and may be adding a new dimen-sion to the seismic hazard of the entire Gujarat region.
10.3 Comparison with IS: 1893 – Part I (2002) spectra
Several researchers had carried out studies on seismic zoningof India even before the publication of the first zoning mapby the Bureau of Indian Standards in 1962. The early seis-mic maps were qualitative in nature and demarcated the ar-eas of severe, moderate, light etc. damages (Krishna, 1959).The later studies quantified the seismic zones on the basis of
Modified Mercalli Intensity levels, similar to the IS code zon-ing (Guha, 1962). Updating has been marginally done onlyafter the occurrence of large and damaging earthquakes (e.g.,Mw = 6.3 Koyna;Mw = 7.7 Bhuj, 2001). It is observed thatthe zoning prescribes a lower hazard for the regions withoutsignificant records of historical earthquakes and revisiting af-ter the occurrence of damaging earthquakes. In addition, thismap does not portray the seismic hazard at different loca-tions and suffers from the weakness of assessing the returnperiods of postulated design seismic coefficients for variouszones. Large magnitude earthquake may be expected in theregion where not many earthquakes have occurred and seis-mic hazard at a site is controlled by all earthquakes expectedto occur (including future) during the life of a structure in thearea surrounding the site, and not only by the largest magni-tude earthquake. In this paper, a comparison has been madebetween the compared spectra obtained in the present studywith the IS: 1893-Part I (2002)-specified spectra for the citiesstudied. The PGA specified by IS:1893-Part I (2002) is com-pared with the obtained PGA value for the 50th percentileand 84th percentile as shown in Fig. 13.
The estimated PGAs for the cities of Ahmedabad andSurat are in agreement with that specified by IS:1893-PartI (2002) i.e. for Ahmedabad and Surat 0.13 g and 0.15 g re-spectively whereas the specified PGA is 0.16 g. Though theestimated PGAs are at bed rock level, site specific correc-tions are required to be done for exact comparison. ForBhuj city, the estimated PGA (0.64g) are high compared to0.36 g specified by IS:1893-Part I (2002). As expressed ear-lier by Parvez et al. (2003) and Hough et al. (2002), the pre-dicted near- field ground motion of approximately 0.8 g forthe Kachchh areas for the Bhuj 2001 earthquake also showsthat the estimated PGAs are higher than the IS:1893-PartI (2002). Being in zone III, IS:1893-Part I (2002), speci-fies that the expected PGA for Jamnagar city is in order of0.24 g whereas the observed PGA as per the present study isaround 0.16 g. The PGA around Jamnagar city is also ob-served in the order of 0.18 to 0.2 g as per the seismic hazardmap compiled by the Jaiswal and Sinha (2007). This showsthat presently, the specified hazard is higher (30 % approxi-mately) than the required as per the present study. Similarly,for the city of Junagadh, the specified PGA is of the 0.16 glevel whereas in the present study it is observed of the or-der of 0.2 g, higher than that specified by the IS:1893-PartI (2002) code. Jaiswal and Sinha (2007) have also shownthat the seismic hazard in the region around Junagadh city isof the order of 0.12 to 0.18 g for the return period of 475 yr.The recent earthquake activities around Talala as describedby Yadav et al. (2010) also indicate that the Junagadh regionpresently has a higher seismic hazard and when estimatingfuture earthquakes, the level of PGA may be higher than thatspecified by code and should be increased without waitingfor a big event to occur via a surprising source.
www.nat-hazards-earth-syst-sci.net/12/2019/2012/ Nat. Hazards Earth Syst. Sci., 12, 2019–2037, 2012

2032 J. Shukla and D. Choudhury: Estimation of seismic ground motions using deterministic
Table 5. Deterministic magnitude-distance pair for hazard-producing ground motion exceeding 0.2 g.
City Model Hazard (producing Mean magnitude Distanceground motion (Mw) (km)exceeding 0.2 g)
Ahmedabad b-value (present study) 0.00164 5.11 15.88b-value = 0.92 0.00152 5.29 15.70
Surat b-value (present study) 0.00356 5.05 11.81b-value = 0.92 0.00293 5.04 12.45
Bhuj b-value (present study) 0.02230 5.52 12.56b-value = 0.92 0.01240 4.81 8.33
Jamnagar b-value (present study) 0.00069 6.57 69.27b-value = 0.92 0.000173 6.17 51.83
Junagadh b-value (present study) 0.00075 5.04 22.87b-value = 0.92 0.00088 5.33 18.89
Table 6. Deterministic seismic 1 spectral ordinates for few reference periods.
Location b-value Deterministic Period (s)Percentile
PGA 0.20 0.50 1.00
Ahm
edab
ad 0.62* (50-percentile) 0.13 0.22 0.09 0.040.92# 0.48 0.86 0.58 0.36
0.62* (84-percentile) 0.23 0.39 0.17 0.070.92 0.78 1.41 0.96 0.58
Sur
at
0.62* (50-percentile) 0.15 0.26 0.11 0.040.92 0.35 0.61 0.35 0.18
0.62* (84-percentile) 0.26 0.45 0.20 0.080.92 0.57 1.02 0.59 0.31
Bhu
j
0.417* (50-percentile) 0.64 1.09 0.61 0.310.92 0.75 1.46 1.02 0.61
0.417* (84-percentile) 1.08 1.85 1.04 0.540.92 1.26 2.44 1.69 1.00
Jam
naga
r 0.64* (50-percentile) 0.14 0.26 0.18 0.110.92 0.27 0.52 0.40 0.28
0.64* (84-percentile) 0.24 0.45 0.31 0.190.92 0.45 0.88 0.66 0.46
Juna
gadh 0.64* (50-percentile) 0.20 0.34 0.17 0.08
0.92 0.45 0.81 0.54 0.33
0.64* (84-percentile) 0.34 0.59 0.30 0.140.92 0.73 1.32 0.89 0.53
Note: ∗present study,# adopted from Jaiswal and Sinha (2007).
Nat. Hazards Earth Syst. Sci., 12, 2019–2037, 2012 www.nat-hazards-earth-syst-sci.net/12/2019/2012/

J. Shukla and D. Choudhury: Estimation of seismic ground motions using deterministic 2033
46
0.01
0.1
1
10
Sepe
ctra
l Acc
eler
atio
n (g
)
(50-percentile) -b-value present study (84-percentile) -b-value present study (50-percentile) -b-value=0.92 (84-percentile) -b-value=0.92
Ahmedabad
Spectral response @ 5% damping0.01
0.1
1
10
Sepe
ctra
l Acc
eler
atio
n (g
)
Spectral response @ 5% damping
Surat
0.01
0.1
1
10Bhuj
Sepe
ctra
l Acc
eler
atio
n (g
)
Spectral response @ 5% damping
0.01 0.1 1 100.01
0.1
1
10Jamnagar
Sepe
ctra
l Acc
eler
atio
n (g
)
Period (s)
Spectral response @ 5% damping
0.01
0.1
1
10Junagadh
Sepe
ctra
l Acc
eler
atio
n (g
)
Period (s)
Spectral response @ 5% damping
1
2
Figure 12. Deterministic spectra obtained for various cities with different b-values. Plotted 3
are the ground accelerations in unit of 5% damped acceleration response spectrum as a 4
function of period for different b-values at particular site location. 5
6
7
8
Fig. 12.Deterministic spectra obtained for various cities with differentb-values. The ground accelerations are plotted in unit of 5 % dampedacceleration response spectrum as a function of period for differentb-values at particular site location.
11 Conclusions
In order to be consistent with the other seismic codes world-wide and to cater to performance based seismic designapproaches, it is necessary to develop regional seismic haz-ard maps/scenarios consistent with the local seismotectonicsetting. The present study is the first step towards developinga state-of-the-art seismic hazard map for one of the most ac-tive regions of Peninsular India and forms a sound basis forfuture extension of the site-specific studies of the control-ling regions. To estimate seismic ground motions for the fewcommercial hubs of the state of Gujarat, India, the determin-
istic seismic hazard analysis is carried out using maximummagnitude earthquake associated with 40 faults. For eachcity, the hazard associated with each source is calculated us-ing the classical Cornell approach, using the seven differentGMARs including the domestic relations of India given byRaghu Kanth and Iyengar (2007). The deterministic spectraobtained using the 50th percentile (representing MCE) and84th percentile (representing SSE) have been developed us-ing the probabilistic framework and logic tree approach andcompared with the IS:1893-Part I (2002) specified spectra.The seismic hazard in the Gujarat region is quite scattered.It is much higher for the Kachchh region (i.e. Bhuj city) and
www.nat-hazards-earth-syst-sci.net/12/2019/2012/ Nat. Hazards Earth Syst. Sci., 12, 2019–2037, 2012

2034 J. Shukla and D. Choudhury: Estimation of seismic ground motions using deterministic
47
1
0.01
0.1
1
10
Sepe
ctra
l Acc
eler
atio
n (g
)
(50-percentile) (84-percentile) IS:1893 (2002)
Spectral response @ 5% damping
Ahmedabad
0.01
0.1
1
10Surat
Spectral response @ 5% damping
Sepe
ctra
l Acc
eler
atio
n (g
)
0.01
0.1
1
10
Bhuj
Spectral response @ 5% damping
Sepe
ctra
l Acc
eler
atio
n (g
)
0.01 0.1 1 100.01
0.1
1
10
Jamnagar
Spectral response @ 5% damping
Sepe
ctra
l Acc
eler
atio
n (g
)
Period (s)
0.01 0.1 1 100.01
0.1
1
10
Junagadh
Spectral response @ 5% damping
Sepe
ctra
l Acc
eler
atio
n (g
)
Period (s) 2
3
Figure 13. 50th percentile deterministic hazard spectra for five cities in Gujarat, India. Plotted 4
are the ground accelerations in unit of 5% damped acceleration response spectrum as a 5
function of period and its comparison with IS:1893-Part I (2002) specified spectra for seismic 6
design of structures at particular site location. 7
8
Fig. 13. 50th percentile deterministic hazard spectra for five cities in Gujarat, India. The ground accelerations are plotted in unit of 5 %damped acceleration response spectrum as a function of period and its comparison with IS:1893-Part I (2002) specified spectra for seismicdesign of structures at particular site location.
comparatively lower for the Saurashtra and Mainland regionsof Gujarat State. The most vulnerable site is Bhuj city as it isvery close to the most active faults in the state of Gujarat. Ithas also been observed that the calculated hazard is sensitiveto theb-value. The variation in hazard computed with respectto b-value is highest for Ahmedabad city and lowest for Bhujcity. Based on the present study, the recommended PGA val-ues for the cities studied are 0.13 g, 0.15 g, 0.64 g, 0.14 g and0.2 g for Ahmedabad city, Surat city, Bhuj city, Jamnagarcity and Junagadh city, respectively. Deterministic spectrahave been prepared for each major city for the 50th and 84thpercentiles of ground motion occurrence in order to aid the
performance-based designs. Close examination of the de-veloped spectra has revealed that the expected ground mo-tion values become high for the Kachchh region i.e. Bhujcity and moderate in the Mainland Gujarat, i.e. the cities ofSurat and Ahmedabad. The seismic ground motion level inSaurashtra is moderate but differs only marginally from thatpresently specified in IS:1893-Part I (2002), i.e. for the cityof Jamnagar the hazard presently specified is overestimatedwhereas it is underestimated for Junagadh city by IS:1893-Part I (2002). The present provisions in code IS:1893-PartI (2002) are intensity based observations and do not addressthe probabilistic estimation of seismic hazard.
Nat. Hazards Earth Syst. Sci., 12, 2019–2037, 2012 www.nat-hazards-earth-syst-sci.net/12/2019/2012/

J. Shukla and D. Choudhury: Estimation of seismic ground motions using deterministic 2035
The proposed spectra for the various major cities offerpractical value to the engineers for seismic design of struc-tures. The users of the proposed spectra should be cau-tious that the spectra presented in the present study are forthe bedrock level. It is necessary to carry out site responseanalysis for the sites underlain by soil to compute the maxi-mum horizontal ground acceleration required for the designof earthquake- resistant structures. It is also noteworthy thatearthquake return periods are not presently addressed in thisstudy and that the fault recurrence relations are obtained em-pirically from the regional recurrence further calculated fromthe earthquake catalogue forMw ≥ 4. Furthermore, it isplanned to develop probabilistic seismic hazard maps for theGujarat region and site-specific spectra for a few critical lo-cations to help safe and economical planning.
Acknowledgements.Authors are grateful to two anonymousreviewers for the constructive comments that enhanced the qualityof the paper.
Edited by: M. E. ContadakisReviewed by: two anonymous referees
References
Abrahamson N. A. and Silva W. J.: Empirical Response SpectralAttenuation Relations for Shallow Crustal Earthquakes, Seismol.Res. Lett., 68, 1, 94–127, 1997.
Anbazhagan P., Vinod, J. S., and Sitharam, T. G.: Probabilistic seis-mic hazard analysis for Bangalore, Nat. Hazards, 48, 2, 145–166,2009.
Ashara L. V., Patel J. N., Abdul Hamid, Srivastava, S., and Ku-mar, S.: Broadband seismic network for Gujarat, Proc. of 13thSymposium on Earthquake Engineering, IIT Roorkee, 1, 52–57,2006.
Avadh Ram and Rathor, H. S.: On Frequency Magnitude and En-ergy of Significant Indian Earthquakes, Pure Appl. Geophys., 79,26–32, 1970.
Bapat, A., Deshpande N. V., Das P. B., and Bhavnarayana, V.:Pre-impoundment seismicity studies around Sardar Sarovar Site,CBIP 55, R&D Session, 1989.
Bendick, R., Bilham, R., Fielding, E., Gaur, V.K., Hough, S.E.,Kier,G., Kulkarni, M.N., Martin, S., Mueller, K., and Mukul, M.: TheJanuary 26, 2001 Republic Day Earthquake, India, Seismol. Res.Lett., 72, 328–335, 2001.
Bhatia, S. C., Kumar, R., and Gupta, H. K.: A probabilistic seis-mic hazard map of India and adjoining regions, Ann. Geofis., 42,1153–1164, 1999.
Bhattacharya, S. N., Karanth, R. V., Dattatryam, R. S., and Sohoni,P. S.: Earthquake sequence in and around Bhavnagar, Saurash-tra, western India during August-December 2000 and associatedtectonic features, Curr. Sci. India, 86, 25, 2004.
Bilham R., Gaur V. K., and Molnar, P.: Himalayan seismic risk,Science, 293, 1442–1444, 2001.
Bilham, R.: Earthquakes in India and the Himalaya: tectonics,geodesy and history, Ann. Geophys., 47, 2/3, 2004,http://www.ann-geophys.net/47/2/2004/.
Biswas, S. K. and Deshpande, S. V. :Geological and tectonic mapsof Kutch, ONGC Bull., 1970, 7, 115–116, 1970.
Biswas, S. K.: Rift basins in western margin of India and their hy-drocarbon prospects with special reference to Kutch basin, Am.Assoc. Petr. Geol. B., 66, 1, 497–1,513, 1982.
Biswas S. K.: Regional tectonic framework, structure and evolutionof the western marginal basins of India, Tectonophysics, 135,307–327, 1987.
Biswas, S. K.: A review of structure and tectonics of Kutch basin,western India, with special reference to earthquakes, CurrentSince, 88, 10 1592–1600, 2005.
Bonilla, M. G., Mark, R. K., and Lienkaemper, J. J.: Statisticalrelations among earthquake magnitude, surface rupture lengthand surface fault displacement, Bull. Seism. Soc. Am, 74, 2379–2411, 1984.
Boore, D. M., Joyner, W. B. and Fumal, T. E.: Equations from esti-mating horizontal response spectra and peak acceleration fromWestern North American earthquakes: a summary of recentwork, Seismol. Res. Lett., 68, 128–153, 1997.
Campbell, K. W.: Empirical Near-Source Attenuation Relation-ships for Horizontal and Vertical Components of Peak GroundAcceleration, Peak Ground Velocity, and Pseudo-Absolute Ac-celeration Response Spectra, Seismol. Res. Lett., 68, 1, 154–179,1997.
Cramer, C. H. and Wheeler, R. L.: The 2001 Gujarat, India earth-quake and seismic hazard in Central and Eastern North America,Abstr. Seismol. Res. Lett., 72, 396, 2001.
Chandra, U.: Earthquakes of peninsular India-A seismotectonicstudy, Bull. Seismol. Soc. Am., 67, 1387–1413, 1977.
Chopra Sumer, Dinesh Kumar., and Rastogi, B. K. : Estimation ofstrong ground motions for 2001 Bhuj (Mw = 7.6), India earth-quake, Pure Appl. Geophys. Earth and Env. Sci., 167, 1317–1330, 2010.
Choudhury, D. and Shukla, J.: Probability of occurrence and studyof earthquake recurrence models for Gujarat state in India, Dis.Adv., 4, 47–59, 2011.
Chung, W. Y.: Source parameters of two rif-associated intraplateearthquakes in peninsular India: the Bhadrachalam earthuake ofApril 13, 1969 and the Broach earthquake of March 23, 1970,Tectonophysics, 225, 219–230, 1993.
Chung, W. Y. and Gao, H.: Source parameter of the Anjar earth-quake of July 21, 1956, India, and its seismotectonic implicationsfor the Kutch rift basin, Tectonophysics, 242, 281–292, 1995.
Cornell, C. A.: Engineering Seismic Risk Analysis, Bull. Seism.Soc. Am., 58, 5, 1583–1606, 1968.
Frankel, A., Mueller, C., Barnhard, T., Perkins, D., Leyendecker, E.V., Dickman, N., Hanson, S., Hopper, M., :National seismic haz-ard maps: documentation June 1996,. Open-File Report (UnitedStates Geological Survey), 96-532, 41, 1996.
Gaur, V. K. and Chauhan, R. K. S.: Quantitative measures of seis-micity applied to Indian regions, Bull Indian, Soc. Earth. Tech.,5, 63–78, 1968.
Guha S. K. and Basu, P. C.: Catalogue of earthquake (M>3) inPeninsular India, Atomic Energy Regaulatory Board, Tech Doc-ument No. TD/CES-1, 1–70, 1993.
Gupta, H. K. and Rastogi, B. K.: Dams and Earthquakes, Elsevier,Amsterdam, 229, 1976.
Gupta, I. D.: The of the art in seismic hazard analysis, ISET Journalof Earthquake Technology, 39, 331–346, 2002.
www.nat-hazards-earth-syst-sci.net/12/2019/2012/ Nat. Hazards Earth Syst. Sci., 12, 2019–2037, 2012

2036 J. Shukla and D. Choudhury: Estimation of seismic ground motions using deterministic
Gutenberg B. and Richter, C. F.: Frequency of earthquakes in Cali-fornia, Bull. Seism. Soc. Am., 34, 185–188, 1944.
GSI: Seismotectonic Atlas of India and its Environs, GeologicalSurvey of India, Spec. Publ. No., 59, Kolkatta, 2000.
Hough, S. E., Martin, S., Bilham, R., and Atkinson, G. M.: The 26January 2001, M 7.6 Bhuj, India, earthquake: observed and pre-dicted ground motions, Bull. Seism. Soc. Am., 92, 2061–2079,2002.
IS:1893-Part-I, Criteria for Earthquake Resistant Design of Struc-tures, Bureau of Indian Standard, New Delhi, India, 2002.
Iyengar, R. N., Sharma, D., and Siddiqui, J. M.: Earthquake historyof India in medieval times, Indian J. Hist. Sci., 3, 181–237, 1999.
Iyengar, R. N. and Ghosh, S.: Microzonation of earthquake hazardin greater Delhi area, Current Sci. India, 87, 1193–1202, 2004.
Iyengar, R. N. and Rghu Kanth, S. T. G.:Attenuation of ground mo-tion in Peninsular India, Seismol. Res. Lett., 79, 67–81, 2004.
Jaiswal, K. and Sinha, R.: Probabilistic seismic-hazard estimationfor peninsular India, Bull. Seismol. Soc. Am., 1, 318–330, 2007.
Johnston, A. C. and Kanter, L. R.: Earthquakes in stable continentalcrust, Sci. Am., 262, 69–75, 1990.
Johnston, A. C.: Compression tectonics in failed continental rifts:the India Republic Day and 7 February 1812 New Madrid earth-quakes, Abstr. Seismol. Res. Lett., 72, 398, 2001.
Kaila, K. L., Gaur, V. K., and Hari Narain: Quantitative seismicitymaps of India, B. Seismol. Soc. Am., 62(5), 1119–1132, 1972.
Kaila, K. L., Krishna V. G., and Mall, D. M.:Crustal structuresalong Mehmadabad – Billimora profile in the Cambay basin, In-dia, from deep seismic soundings, Tectonophysics, 76, 99–130,1980.
Karanth ,R. V. and Sant, D. A.: Lineaments and dyke swarms oflower Narmada Valley and southern Saurashtra, western India, J.Geol. Soc. India, 33, 425–434, 1995.
Khattri, K. N., Rogers, A. M., Perkins, D. M., and Algermissen, S.T.: A Seismic Hazard Map of India and Adjacent Areas, Tectoni-physics, 108, 93–134, 1984.
Krinitzsky, E. L.: How to obtain earthquake ground motions forengineering design, Engrg. Geol., 65, 1–16, 2002.
Krinitzsky, E. L.: Deterministic versus probabilistic seismic hazardanalysis for critical structures, Internat. J. Eng. Geol., 40, 1–7,1995.
Lettis, W. R. and Hengesh, J. V.: Preliminary observation on the ori-gin and effects of the January 26, 2001 Republic Day earthquake,India 2001, Seismol. Res. Lett. 72, 396, 2001.
Malik, J. N., Sohoni, P. S., Karanth, R. V., and Merh, S. S.:Modernand Historic Seismicity of KachchhPeninsula, Western India, J.Geol. Soc. India, 54 545–550, 1999.
Mark, R. K.: Application of linear statistical model of earthquakemagnitude versus fault length in estimating maximum expectableearthquakes, Geology, 5, 464–466, 1977.
Menon, A., Ornthammarath, T., Corigliano, M., and Lai, C. G. :Probabilistic seismic hazard macrozonation of Tamil Nadu inSouthern India,BSSA, 100, 3, 1320–1341, 2010.
Nowroozi, A. A.: Emperical relations between magnitudes and faultparameters for earthquakes in Iran,Bull. Seism. Soc. Amer., 75,1327–1338, 1985.
Nuttli, O. W.: Seismicity of the central United States, GeologicalSociety of America, Rev. Eng. Geol., 4, 67–93, 1979.
Oldham, T. :A catalogue of Indian earthquakes from the earliesttime to the end of A.D. 1869, Mem Geol. Surv. India 19, 53,
1883.Parvez, A. I., Franco Vaccari, and Panza, G. F.: A deterministic
seismic hazard map of India and adjacent areas, Geophys. J. In-ternat., 155, 489–508, 2003.
Petersen, M. D., Rastogi, B. K., Schweig, G. E.S., Harmsen, S. C.,and Gomberg, J. S.: Sensitivity analysis of seismic hazard forthe northwestern portion of the state of Gujarat, India, Tectono-physics, 390, 105–115, 2004.
Quittmeyer, R. C. and Jacob, K. H.: Historical and modern seismic-ity of Pakistan, Afghanistan, northwestern India, and southeast-ern Iran, Bull. Seismol. Soc. Am. 69 (3), 773–823, 1979.
Rajendran, C. P. and Rajendran, K.: Characteristics of deforma-tion and past seismicity associated with the 1819 Kutch earth-quake, Northwestern India, Bull. Seismol. Soc. Am., 91, 407–426, 2001.
Rajendran, K., Rajendran, C. P., Thakkar, M., and Tuttle, M.: The2001 Kutch (Bhuj) earthquake: Coseis- mic surface features andtheir significance, Curr. Sci. India, 80, 1397–1405, 2001.
Rajendran, C. P., Rajendran, K., Vora, K. H., and Gaur, A. S.: Theodds of a seismic source near Dwarka, NW Gujarat: An evalua-tion based on proxies, Current Sci. India, 84, 5, 695–701, 2003.
Rao, B. R. and Rao, P. S.: Historical seismicity of peninsular India,B. Seismol. Soc. Am., 74, 2519–2533, 1984.
Rastogi, B. K.: Ground deformation study of Mw 7.7 Bhuj earth-quake of 2001, Episode, 24 (3), 160–165, 2001.
Rastogi, B. K.: Damage due to the Mw 7.7 Kutch, India earthquakeof 2001, Tectonophysics, 390, 85–103, 2004.
Raghu Kanth, S. T. G., and Iyengar, R. N.: Seismic hazard estima-tion for Mumbai city, Curr. Sci. India, 11, 1486–1494, 2006.
Raghu Kanth, S. T. G. and Iyengar, R. N.: Estimation of seismicspectral acceleration in peninsular India, J. Earth Sys. Sci., 3,199–214, 2007.
Rao, Buddha Ramalineswara: Historical seismicity and deforma-tion rates in the Indian Peninsular Shild, J. Seismology, 4, 247–258, 2000.
Ravi Kumar, M. and Bhatia, S. C.: A new seismic hazard map forthe Indian plate region under the global seismic hazard assess-ment programme, Current Sci. India, 77 (3), 447–453, 1999.
Schweig, III, E., Gomberg, J., Petersen, M., Ellis, M., Bodin, P.,Mayrose, L., and Rastogi, B. K.: The M 7.7 Bhuj earthquake:global lessons for earthquake hazard in intra-plate regions, J.Geol. Soc. India, 61, 277–282, 2003.
Sadigh, K., Chang, C. Y., Egan, J. A., Makdisi, F., and Youngs, R.R.: Attenuation relations for shallow crustal earthquakes basedon California strong motion data, Sesmol. Res. Lett. I(68), 180–189, 1997.
Seed, H. B.: The selection of design earthquake for critical struc-tures, Bull. Seism. Soc. Am., 72, 74–89, 1982.
Sitharam, T. G. and Anbazhagan, P.: Seismic Hazard Analysis forthe Bangalore Region, Nat. Hazards, 40, 261–278, 2007.
Slemmon, D. B.: Determination of earthquake size from surfacefaulting events, Proc. Inter. Seminar on Seismic Zoning, China,1989.
Sukhtankar, R. K., Pandian, R. S., and Guha, S. K.: Seismotec-tonic studies of coastal areas of Inida, Pakistan, Bangladesh andBurma, Nat. Hazards, 7, 201–210, 1993.
Talwani, P. and Abhijit Gangopadhyay: Tectonic Framework of theKachchh Earthquake of 26 January 2001, Seism. Res. Lett., 72,336–345, 2001.
Nat. Hazards Earth Syst. Sci., 12, 2019–2037, 2012 www.nat-hazards-earth-syst-sci.net/12/2019/2012/

J. Shukla and D. Choudhury: Estimation of seismic ground motions using deterministic 2037
Tandon, A. N. and Srivasta, H. N.: Earthquake occurrences in India,Earthquake Engineering, Jai Krishna Volume, Sarita Prakashan(publ.), 1–48, 1974.
Tandon, A. N.: The rann of Kutch earthquake of 21st July 1956,Indian J. Met. Geophys., 10, 137–146, 1959.
Thakur, V. C. and Wesnousky, S. G.: Seismotectonics of 26 January2001 Bhuj earthquake affected region, Current Sci. India, 82, 4,396–399, 2002.
Tripathi, J. N.: Probabilistic assessment of earthquake recurrencein the January 26, 2001 earthquake region of Gujarat, India, J.Seismol., 10, 119–130, 2006.
Toro, G. R. Abrahamson, N. A., and Schneider, J. F.: Model ofstrong ground motions from earthquakes in central and easternNorth America: best estimates and uncertainties, Seismol. Res.Lett., 68, 41–58, 1997.
Tinti, S. and Mulargia, F.: Completeness analysis of a seismic cata-log, Ann. Geophys., 407–414, 1985.
Vipin, K. S., Anbazhagan, P., and Sitharam, T. G.: Estimation ofpeak ground acceleration and spectral acceleration for South In-dia with local site effects: probabilistic approach, Nat. HazardsEarth Syst. Sci., 9, 865–878, 2009,http://www.nat-hazards-earth-syst-sci.net/9/865/2009/.
Yadav, R. B. S., Tripathi, J. N., Rastogi, B. K., and Chopra, S.:Probabilistic Assessment of Earthquake Hazard in Gujarat andAdjoining Regions of India, Pure Appl. Geophys., 165, 1813–1833, 2008.
Yadav, R. B. S., Papadimitriou, E. E., Karakostas, V. G., Shanker,D., Rastogi, B. K., Chopra, S., Singh, A. P., and Kumar, Santosh:The 2007 Talala, Saurashtra, western India earthquake sequence:Tectonic implications and seismicity triggering”, J. Asian EarthSci., 2010.
Wells, D. L. and Coppersmith, K. J.: Updated empirical relation-ships among magnitude, rupture length, rupture area and surfacedisplacement”, B. Seism. Soc. Am., 84, 4–43,http://www.isr.gujarat.gov.in, 1994.
www.nat-hazards-earth-syst-sci.net/12/2019/2012/ Nat. Hazards Earth Syst. Sci., 12, 2019–2037, 2012