estimation of rain drop analysis using image processing · pdf filehelp of image processing...
TRANSCRIPT

International Journal of Science and Research (IJSR) ISSN (Online): 2319-7064
Index Copernicus Value (2013): 6.14 | Impact Factor (2013): 4.438
Volume 4 Issue 1, January 2015
www.ijsr.net Licensed Under Creative Commons Attribution CC BY
Estimation of Rain Drop Analysis Using Image
Processing
Sameer Sawant1, P.A.Ghonge
2
1, 2Electronics And Telecommunication, Mumbai University / YTIET / Bhivpuri Road Karjat, India
Abstract: This paper deals with simple algorithm for detection of raindrop size and measuring the total rainfall. In the ERAUIP we are
using image and video database from advance slow motion camera for detection of raindrop and measuring the no. of raindrops present
in particular frame.in this system image and video database are processed by using image processing and different algorithm are used to
extract useful information form the database.in existing methods most of the methods only measure amount of water that reached at the
ground .they didn’t concern about the drop size and the graphical representation. With the help of ERAUIP method it is possible to
count drop size as well as the amount of water reached at the ground. Human appearance would be neglected in this system due to
which errors are minimized. The result which we are getting from this system will take very less time with the help of matlab.
Keywords: image processing, raindrop measurement, raindrop analysis, thresholding, rainfall measurement
1. Introduction
The rain is critical not only to weather, but to life on earth.
Rain is necessary for the survival of plants and humans. The
need to measure this rainfall becauseprolonged or heavy
rainfall is often the main cause of debris flows and flash
floods in rivers and urban areas, and can be a key factor for
dam breaks and other types of flash flood. The most widely
used monitoring techniques are raingauges, weather radar
and satellites. Weather radar networks are typically operated
by national meteorological services (nms) together with a
core national network of raingauges and other
meteorological instrumentation additional raingauges are
often operated by river basin management, hydropower,
water supply, flood warning and other authorities and as part
of community-based flood warning schemes. THERE Are
some disadvantages of the existing system to overcome this
we introduce a new method for measuring rainfall with the
help of image processing for prior rainfall analysis. With the
help of this methos we can sindout the raindrop size as well
as total rainfall in particular area.Image processing is often
viewed as arbitrarily manipulating an image to achieve an
aesthetic standard or to support a preferred reality. However,
image processing is more accurately defined as a means of
translation between the human visual system and digital
imaging devices.
There are 3 types of images used in Digital Image
Processing. They are
1. Binary Image
2. Gray Scale Image
3. Colour Image
1) Binary Image
A binary image is a digital image that has only two possible
values for each pixel. Typically the two colors used for a
binary image are black and white though any two colors can
be used. The color used for the object(s) in the image is the
foreground color while the rest of the image is the
background color. Binary images are also called bi-level or
two-level. This means that each pixel is stored as a single bit
(0 or 1).This name black and white, monochrome or
monochromatic are often used for this concept, but may also
designate any images that have only one sample per pixel,
such as grayscale images Binary images often arise in digital
image processing as masks or as the result of certain
operations such as segmentation, thresholding, and
dithering. Some input/output devices, such as laser printers,
fax machines, and bi-level computer displays,
can only handle bi-level images
2) Gray Scale Image
A grayscale Image is digital image is an image in which the
value of each pixel is a single sample, that is, it carries only
intensity information. Images of this sort,also known as
black-and-white, are composedexclusively of shades of gray
(0-255), varying from black(0) at the weakest intensity to
white(255) at the strongest. Grayscale images are distinct
from one-bit black-andwhite images, which in the context of
computer imaging are images with only the two colors,
black, and white (also called bi-level or binary images).
Grayscale images have many shades of gray in between.
Grayscale images are also called monochromatic, denoting
the absence of any chromatic variation.
3) Colour image
A (digital) color image is a digital image that includes color
information for each pixel. Each pixel has a particular value
which determines it’s appearing color. This value is
qualified by three numbers giving the decomposition of the
color in the three primary colors Red, Green and Blue. Any
color visible to human eye can be represented this way. The
decomposition of a colour in the three primary colors is
quantified by a number between 0 and 255. For example,
white will be coded as R = 255, G = 255, B = 255; black
will beknown as (R,G,B) = (0,0,0); and say, bright pink will
be :(255,0,255)
2. Rainfall Analysis Methods
Most rain gauges generally measure the precipitation in
millimeters. The level of rainfall is sometimes reported as
inches or centimeters. Rain gauge amounts are read either
manually or by automatic weather station (AWS). The
frequency of readings will depend on the requirements of the
collection agency. Some countries will supplement the paid
Paper ID: SUB15661 1981

International Journal of Science and Research (IJSR) ISSN (Online): 2319-7064
Index Copernicus Value (2013): 6.14 | Impact Factor (2013): 4.438
Volume 4 Issue 1, January 2015
www.ijsr.net Licensed Under Creative Commons Attribution CC BY
weather observer with a network of volunteers to obtain
precipitation data (and other types of weather) for sparsely
populated areas. In most cases the precipitation is not
retained, however some stations do submit rainfall (and
snowfall) for testing, which is done to obtain levels of
pollutants. Rain gauges have their limitations. Attempting to
collect rain data in a hurricane can be nearly impossible and
unreliable (even if the equipment survives) due to wind
extremes. Also, rain gauges only indicate rainfall in a
localized area. For virtually any gauge, drops will stick to
the sides or funnel of the collecting device, such that
amounts are very slightly underestimated, and those of .01
inches or .25 mm may be recorded as a trace. Another
problem encountered is when the temperature is close to or
below freezing. Rain may fall on the funnel and ice or snow
may collect in the gauge and not permit any subsequent rain
to pass through. Rain gauges should be placed in an open
area where there are no obstacles, such as buildings or trees,
to block the rain. This is also to prevent the water collected
on the roofs of buildings or the leaves of trees from dripping
into the rain gauge after a rain, resulting in inaccurate
readings.
Types of gauges
1) Standard gauge
2) Tipping bucket gauge
3) Weighing rain gauge
4) Optical rain gauge
5) Parsivel-efdisdrometer
Disadvantages of exiting methods :
Wind-induced errors
Since most rain gauges are elevated above the ground, wind
eddies form around their orifices which reduces the catch of
small rain drops. This problem is known the calculated
correction factors are multiplied by the measured daily
rainfall values
.
Evaporation and Wetting Losses
These losses are encountered in storage-type non-recording
gauges, gauges with small orifices, and gauges recording at
long intervals (several days). The magnitude of these losses
depends on temperature, humidity, and time between rain
and collection of the measurement. Convenience of the
modern gauge is a big plus, as is accuracy. Timeliness and
added features, such as thermometers and wireless
transmission, also make the modern rain gauge particularly
useful. The convenience of a modern rain gauge is a clear
advantage over a traditional rainwater measuring device.
Calibration Errors
This error is encountered in tipping-bucket rain gauges.
These gauges require calibration and adjustment of the
tipping mechanism which is mostly done at a fixed small or
intermediate rain rate (usually referred to as static
calibration)
Instrument Errors A well-adjusted siphon rain gauge has an accuracy of 0.2
mm for precipitation of up to 20 mm Per hour. A tipping
bucket rain gauge has an accuracy of 0.5 mm for
precipitation of up to 20 mm per hour, but may have errors
of up to 3% for stronger precipitation. In Japan, the
minimum Observation unit is 0.5 mm, and precipitation less
than this amount is not measured. Errors increase with
higher precipitation intensity, and exceed 3% for
precipitation of more than 150 mm per hour
.
Errors from the Lack of a Windshield
As the amount of weak precipitation entering the receptacle
is reduced by wind, the lack of a windshield causes
significant errors.
3. Advance Method For Rain Drop Analysis
Adigital image differs from a photo in that the values are all
discrete. Usually they take on only integer values. A digital
image can be considered as a large array of discrete dots,
each of which has a brightness associated with it. These dots
are called picture elements, or more simply pixels. The
pixels surrounding a given pixel constitute its neighborhood
a neighborhood can be characterized by its shape in the same
way as a matrix: we can speak of a 3x3 neighborhood, or of
a 5x7 neighborhood.
The ERAUIP system is having maximum accuracy then the
existing methods where the first stage is the image
acquisition stage in which we are capturing image/video of
rainfall by using a slow motion camera.if the image is colour
image we have to convert into the gray scale image. This
image/video is used as database for further processing. The
image/video which we are capturing may containing some
sort of noise which can effect in system processing to avoid
this we are using image enhancement by using image
clustering technique we are discarding noise present in an
image .Biclustering mean we are arrange the similar content
from image in this case we are divide image in columns and
rows. These columns and rows are further divided into the
odd and even content. After which the maximum intensity of
pixel is counted. This intensity value use to decide the
threshold value for the further processing.
Thresholding use to convert gray scale image into binary
image. By using thresholding we are differentiating
background content with foreground content. With this we
are get drops from the background. Now there is need to
measure the size of raindrop for which we are using the
morphological filtering.in some drops due to noise unfilled
areas which filled by using dilation. Now drops are
measured and based on this measuring we found maximum
and minimum size of drop.
Paper ID: SUB15661 1982

International Journal of Science and Research (IJSR) ISSN (Online): 2319-7064
Index Copernicus Value (2013): 6.14 | Impact Factor (2013): 4.438
Volume 4 Issue 1, January 2015
www.ijsr.net Licensed Under Creative Commons Attribution CC BY
4. Application of Image Processing For Drop
Analysis
Figure 3.1: Block Diagram of Proposed System
Fig shows the block dia. Of proposed ERAUIP system
which containing different stages in which different
operations are done on data provided by the camera for
analysis of rainfall. There are many factors of the rainfall is
measured and represented in the graphical form. The
dropsize distribution measurement is the biggest advantage
of this system. This system having following stages
Live Rainfall Data:
Rainfall data is captured in the form of image or video and
then this transferred to the system. for the proper analysis we
suggest it should be captured with black background so the
amount of external noise is limited and the exact analysis is
possible. the camera should have minimum 1200 fps speed
so proper image or video can be taken.
System
The system is a computer with minimum 500 GB storage
place where all the data is processed and the analysis is done
on the data provided by the camera. Analysis is done with
the help of MATLAB software in which we can find out the
raindrop size and the total rainfall in the particular area in
mm2. With the help of graphical analysis the proper
comparison is possible between rainfalls at different time
span.
Operational Analysis On Data
With the help of MATLAB different operations are done on
data for analysis of rainfall these operations are explained in
details in methodology. The operations are as follow:
1. Image resizing
2. RGB image to gray image conversion
3. Biclustering
4. Thresholding
5. Morphological filtering
6. Raindrop counting
Significant Data Extraction:
Rainfall is deals with size of drops and amount of water
precipitated from cloud in particular time. so we have to
count the total amount of rainfall and the size distribution of
the raindrops.
Rainfall Nature
The analysis which we have done on image or video
depending on this we have to decide whether the rainfall is
heavy moderate or light.
5. Methodology
Figure 4.1: Block Diagram of Methodology
Fig shows the block diagram of ERAUIP systems there are
different operations are done on image/video to get result.
Image resizing
After converting image sequence from video. We have to
resize our image for further operation. For the further
operation we required image with Colum and row size
512*512. we are resizing our image from 2094*1944 to
512*512 it had an advantage that we require less time for
analysis and the noise get reduced due to resizing.
Conversion of colour image into gray scale image
The next step of the process is conversion of colour image
into gray scale image. Sometimes we have a coloured
background so in this case we have to convert it to a grey-
level image for further processing.
Biclustering
Biclustering algorithms synchronously cluster both rows and
columns. These types of algorithms are applied to gene
expression data analysis to find a subset of genes that shows
similar behavioral-pattern under a subset of conditions. We
used the concept of Gene Expression Data Matrix to detect
cancer. It will be working with a R x C data matrix, where
each element aij will be a replaced with a real value. In the
case of gene expression matrices, aij represents the
expression level of gene i under condition j.
Paper ID: SUB15661 1983

International Journal of Science and Research (IJSR) ISSN (Online): 2319-7064
Index Copernicus Value (2013): 6.14 | Impact Factor (2013): 4.438
Volume 4 Issue 1, January 2015
www.ijsr.net Licensed Under Creative Commons Attribution CC BY
Steps Involve in Biclustering
Step one:
Initially we divide image into rows and columns say (r1,c1).
Step two:
We are creating an array of all zeros and then we divide
image into even columns and odd columns
Even columns =s1ce
Odd columns = s1co
Then we found mean of these columns.
Output = (s1ce + s1co) / 2
Initially our image having 512 columns by doing
biclustering we divide it into 256 even and 256 odd columns
so in the output we get mean of this 256 columns.
Step three:
We are creating an array of all zeros and then we divide
image into even row and odd row
Even row =s1re
Odd row = s1ro
Then we found mean of this
Output = (s1re + s1ro) / 2
Initially our image having 512 rows by doing biclustering
we divide it into 256 even and 256 odd row so in the output
we get mean of this 256 row.
Step four:
Now the output images are ready for the further processing
Thresholding
Threshold is one of the widely methods used for image
segmentation. It is useful in discriminating foreground from
the background. By selecting an adequate threshold value t,
the gray level image can be converted to binary image.
The thresholding operation is a grey value remapping
operation g defined by:
g(v) = 255 if y > t
0 if y < t
As the input imae is grey scale image we having the pixel
values ranging from 0-255 but as in the case binary image
we have pixel values 0 and 1(255) so for this we have to
apply thresholding . So the procedure for converting grey
scale image into binary image is as follows.
Step 1:
Decide fixed threshold value as T he re we take as 25.
Step 2:
Compare each pixel of image with threshold value.
F (m,n) = 255 if f (m,n) > T,
0 IF f (m,n) < T;
Step 3:
Depending upon the result we get black and white
distribution of pixels. This way grey scale image converted
into binary image. Which is further passed for analysis
Morphological Filtering Binary images may contain numerous imperfections. In
particular, the binary regions produced by simple
thresholding are distorted by noise and texture.
Morphological image processing pursues the goals of
removing these imperfections by accounting for the form
and structure of the image.For this system we are using
dilation for region filling. Dilation is the dual of erosion i.e.
dilating foreground pixels is equivalent to eroding the
background pixels Most implementations of this operator
expect the input image to be binary, usually with foreground
pixels at pixel value 255, and background pixels at pixel
value 0. In our system due to less light some part of drops is
not converted into white region so to fill this we use dilation
As the dilation fills the area of the drop this will help us to
find the proper size of an drops.
Raindrop Detection and Size Measurement
After thresholding and dilation we get the separate
background and foreground objects in this case the raindrops
are separated from the background .so the next stage is to
detection and measuring the size of raindrops so for this we
use binarization in which we count the no. of white pixel to
measure the size of raindrops. As we have 256*256 JPEG
image which can be represented by the summation of white
pixels and black pixels.
Image I = (𝑓 0 + 𝑓 255 )255𝐻=0
255𝑊=0
Pixels =Width (W) X Height (H) = 256 X 256
f (255) = white pixel (digit 255)
f(0) = black pixel (digit 0)
To calculate no. of white pixels we have another formula.
no. of white pixels p= (𝑓 0 )255𝐻=0
255𝑊=0
Where,
P = number of white pixels (width*height)
1 Pixel = 0.264 mm
After getting no. of white pixel for the particular white drop
we have to calculate the actual size of raindrop by using the
formula
Size of raindrop = ( 𝑝) * 0.264 mm2
Where
P= no. of white pixels
Implementation
Technical Requirement
Software Requirements
Platform: Windows 7
Programming Language: MATLAB Version 7.9.0.529
(R2009b)
Hardware Requirements:
Main processor: Intel Core i3 processor 2.30GHz.
RAM: 4 GB
Hard Disk: 160 GB
6. Result and Conclusion
Rainfall measurement is the global need to get accurate
information of the amount of rain is fallen in a particular
area for the safety purpose of the people as well as the crop
management for the farmers. In ERAUIP we mainly were
dealing with two parameter (1) Amount of rainfall and (2)
Raindrop size both the parameter is important to get accurate
rainfall measurement. This system use image processing as
processing tool and having numerous amounts of advantages
over the rain gauge and other measuring instruments also the
errors due to human interpretation is get nullified due to
very less amount of human interference. This method may
Paper ID: SUB15661 1984
International Journal of Science and Research (IJSR) ISSN (Online): 2319-7064
Index Copernicus Value (2013): 6.14 | Impact Factor (2013): 4.438
Volume 4 Issue 1, January 2015
www.ijsr.net Licensed Under Creative Commons Attribution CC BY
be the future of the rainfall measurement techniques with
80-90 % accuracy. The costing of this system is very low
only we required a high definition camera which having the
ability to captured perfect images and video as these images
and videos are the base of this system. So the accuracy of
this system is totally depend upon the quality of images and
videos.by getting 3d image we can find out the volume of
each drop and which helpful to get total rainfall in particular
area.
At the end we can conclude that disadvantages of the rain
gauge are overcome with the help of this system. This
system is having less cost as well as the accuracy of this
system is maximum as it have less effect of other climatic
condition. The only factor it might be effect is the quality of
the image and video which are the base of the system. If we
improve the input images accuracy will be maximum Of the
system.
7. Future Scope As we are dealing with 2D image there is certain amount of
limitations to get total rainfall in mm. so by using the 3d
image this can be possible. Using of slow motion camera we
can get 95-99% accurate result from this system. The
movement of the rain can be determined but for this more
research will be requires. As this system is not tested in
storm that type of testing can be done and improvement can
be done to get accurate result in storm and tornados.
8. Performance
Figure 7.1: Input Data
Figure 7.2: Thresholding
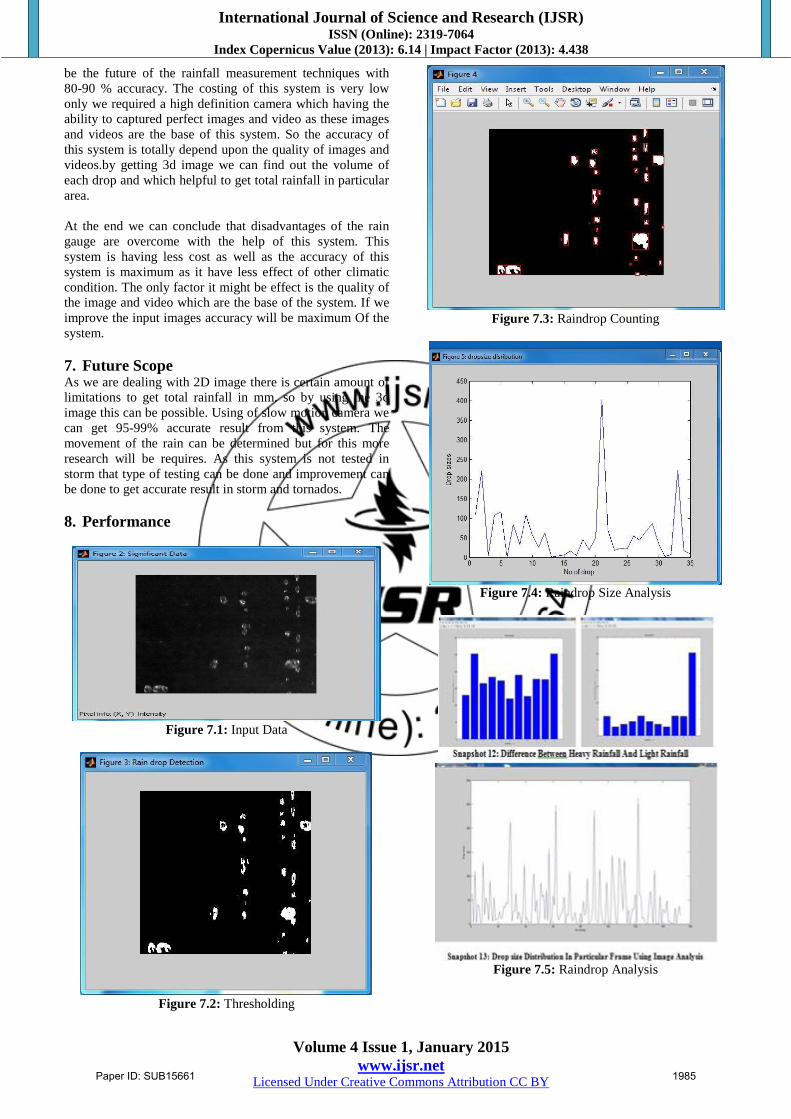
Figure 7.3: Raindrop Counting
Figure 7.4: Raindrop Size Analysis
Figure 7.5: Raindrop Analysis
Paper ID: SUB15661 1985

International Journal of Science and Research (IJSR) ISSN (Online): 2319-7064
Index Copernicus Value (2013): 6.14 | Impact Factor (2013): 4.438
Volume 4 Issue 1, January 2015
www.ijsr.net Licensed Under Creative Commons Attribution CC BY
Reference
[1] “Droplet size measurement for liquid spray using digital
image analysis technique” by N.LAD A.AROUSSI
AND M.F.MUHAMAD SAID
[2] “Brain Tumor Segmentation and Its Area Calculation in
Brain MR Images using K-Mean Clustering and Fuzzy
C-Mean Algorithm” by J.selvakumar, A.Lakshmi,
T.Arivoli IEEE-International Conference On Advances
In Engineering, Science And Management (ICAESM -
2012) March 30, 31, 2012
[3] “Mammographic Cancer Detection and Classification
Using Bi Clustering and Supervised Classifier” by
R.Pavitha, MsT.JoyceSelvaHephzibah .International
Conference on Engineering Technology and Science-
(ICETS’14) on 10th & 11th February 2014
[4] “An Automatic Method Based on Image Processing for
Measurements of Drop Size Distribution from
Agricultural Sprinklers” By Paulo EstevãoCruvinel
,Edson Roberto Minatel ,Marcos LuizMucheroni
,Sidney Rosa Vieira ,Silvio Crestana
[5] “Sizing of spray particles using Image Processing
Technique” by SANG YONG LEE AND YU DONG
KIM
[6] “A Comprehensive Review of Image Enhancement
Techniques” by Raman Maini and
HimanshuAggarwalJournal Of Computing, Volume 2,
Issue 3, March 2010, Issn 2151-9617
[7] “Automatic crystal size distribution using image
processing “ Argaw A G Alport M G And Malinga S B
Proc S AfrSugTechnol Asses (2006).
[8] “Image Processing Basics” by Steven Seitz,
AleoshaEfros, David Forsyth, and Gonzalez & Woods
[9] “An Image Processing Algorithm for Detection and
Tracking of Aerial Vehicles” Sungwook Cho, Sungsik
Huh, HyongSik Choi and David Hyunchul Shim,
Member, IEEE
[10] Wikipedia (http://en.wikipedia.org/wiki/Rain_gauge)
[11] “Analysis of Raindrop Size Distribution Characteristics
in Malaysia for Rain Attenuation Prediction “ H.Y. Lam
, Din.J, L Luini , A. D.Panagopoulos , C.Capsoni
[12] “Improving Rainfall Measurement Accuracy in
Spaceborne Rain Radar over Sea” F.Capolino, G.
BiffiGentili, L.Facheris, M.Gherardelli, D. Giuli IEEE-
International Conference On Advances In Engineering,
1995 0-7803-2567-2195
[13] “Analysis And Synthesis Of Raindrop Size Distribution
Time Series From Disdrometer Data” Mario Montopoli,
Frank Silvio Marzano, Senior Member, IEEE, And
Gianfranco Vulpiani, IEEE TRANSACTIONS ON
GEOSCIENCE AND REMOTE SENSING, VOL. 46,
NO. 2, FEBRUARY 2008
[14] “Raindrop Size Distribution Parameters OfDistrometer
Data With Different Bin Sizes” M. Marzuki, Member,
IEEE, Walter L. Randeu, Michael Schönhuber, V. N.
Bringi, Toshiaki Kozu, , And ToyoshiShimomai IEEE
TRANSACTIONS ON GEOSCIENCE AND REMOTE
SENSING, VOL. 48, NO. 8, AUGUST 2010.
Author Profile
Sameer R. Sawant is pursuing M.E (EXTC), B.E (EXTC)
Lecturer YTIET India
Prof. P. A Ghonge, ME (EXTC). HOD Electronics Department,
YTIET, India. Prof. P.A Ghonge is having 15 years teching
experience
Paper ID: SUB15661 1986