estimation of large-scale network synchronization and ... · synchronization ”task condition,...
TRANSCRIPT

Satu Palva
Neuroscience Center, University of Helsinki, Helsinki, Finland
Estimation of large-scale network synchronization and cross-frequency
interactions from electrophysiological data

Overview and learning objectives:
The objectives are to understand:
1. The effects of signal mixing on connectivity
2. What are the different forms of Cross-Frequency
couplings (CFC)
3. How changes in SNR affect connectivity estimates
4. How stimulus-locking affects estimation of CFC
5. How non-sinusoidal signals create CFC
6. How graph analysis can be used in the connectivity
analysis

Understanding the effects of signal mixing on
connectivity
So
urc
e P
atch
True phase correlations among ongoing cortical
activity
Uncorrelated
Activity
”Control
Condition, C”
True Phase
Synchronization
”Task Condition,
T”C T
True Phase Synchronization
Network
”Task Condition, T”
Source Patch Source Patch
Palva & Palva 2012 TICS

Forward modeling ~ M/EEG recording
Uncorrelated
Activity
”Control
Condition, C”
True Phase
Synchronization
”Task Condition,
T”
Observed Phase
Synchronization Network
T-C
0.4
0.15
0
-0.15
-0.4
0.8
0.4
0
Left Right
Anterior
Posterior
MEG Sensor
ME
G S
enso
r
MEG Sensor
T-C
Im(T)
T-C
C T
Task-Control
T-C
Palva & Palva 2012 TICS
Sensor-level connectivity is confounded by artificial
synchronization

Inverse modeling ~ reconstruction of sources of
M/EEG recording
T-C
C T
T-C
Im(T)
Uncorrelated
Activity
”Control
Condition, C”
True Phase
Synchronization
”Task Condition,
T”
Observed Phase
Synchronization Network
T-C
Task-Control
T-C
T-C
So
urc
e P
atch
Source Patch Source Patch
Palva & Palva 2012 TICS
Inverse modelling alleviates artificial synchronization
and reconstructs the “true” network

Inverse modeling ~ reconstruction of sources of M/EEG
recording
T-C
C T
T-C
Im(T)
Uncorrelated
Activity
”Control
Condition, C”
True Phase
Synchronization
”Task Condition,
T”
True Phase Synchronization
Network
Observed Phase
Synchronization Network
T-C
Task-Control
T-C
T-C
So
urc
e P
atch
Source Patch Source Patch
..but some artificial connectivity remains also after the
source-reconstruction
The extent of artificial connectivity is dependent on
the accuracy of the source reconstruction approach

1
0
0.2
0.4
0.6
0.8
Inter-areal artificial synchrony
10 0.2 0.4 0.6 0.8
MNE
MEG a-gr.
MEG mag.
EEG
Original
Cum
ulat
ive
prob
abili
ty
Noise
Palva & Palva 2012 TICS
The extent of artificial connectivity is dependent on the accuracy of the source
reconstruction approach

Different connectivity metrics
Metrics sensitive to 0-phase lagged interactions (linear mixing)
PLV
Coherence
Correlation coefficient
Metrics insensitive to 0-phase lagged interactions
Imaginary PLV (iPLV)
Phase-locking index (PLI)
Weighted phase-locking index (wPLI)
Imaginary coherence
Orthogonalized correlation coefficient

PLV iPLV
Artificial
c =
0
Metrics insensitive to 0-phase lagged interactionsremove direct artefactual synchronization
Palva, Wang, Palva, Zhigalov, Monto, Schoffelen, Jerbi provisionally accepted

Spurious connectivity
Spurious Artefactual
True
”Denied”
MFG
MTG
MFS

ArtificialSpurious
True
Spurious
True
c =
0.4
PLV iPLV
Spurious interactions are NOT removed by thesemetrics
Palva, Wang, Palva, Zhigalov, Monto, Schoffelen, Jerbi provisionally accepted

Area A
LFP
Spik
es
Area B
No synchrony No communication Communication!
Inter-areal phase synchronization
Coincident spikes
Spik
es
Coincidences
Area A
Area B
Synchronized assembly
Long-range 1:1 phase synchronizationcoordinates inter-areal processing
Theories:
Singer, 1999, Neuron
Fries, 2015, Neuron
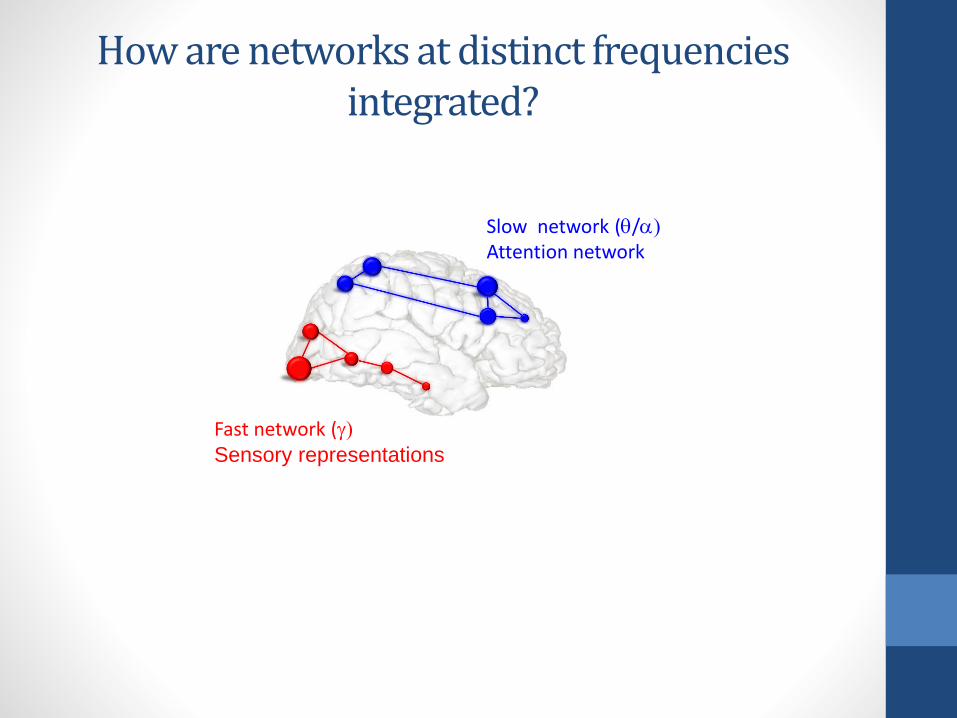
How are networks at distinct frequenciesintegrated?
Slow network (q/a)Attention network
Fast network (g)Sensory representations

Cross-frequency phase synchrony (CFS) canbind networks at distinct frequencies
Spik
esSp
ikes
Coincidences
Coincident spikes
Cross-frequency phase synchrony!
Fastoscillation
Slowoscillation
CFS
Slow assembly
Fast assembly
Siebenhühner et al. 2016 Elife

Forms of cross-frequency coupling (CFC) among
oscillations
Phase-amplitude coupling
(PAC) / Nested oscillations
n:m cross-frequency phase
synchrony (n:m CFS)
1:1 phase synchrony

How to compute 1:1 synchrony
Within frequency synchronization is CFS where fx:fy ratio (n:m) = 1:1
1. Extract the phase of the signal
2. Use PLV, iPLV, PLI, wPLI etc. to estimate phase-consistency
between two signals

How to estimate cross-frequency synchrony (CFS)
Two oscillations at distinct frequencies fx and fy
1. Estimate the ratio nfhigh : mflow. In the example n:m = 4:1
2. Extract the phase of the signal
3. Multiply the signal m by the m:n ratio (here 4)
4. Use PLV to estimate phase-consistency between two signals either
locally or between brain areas
Siebenhühner et al. 2016 Elife

How to estimate phase-amplitude coupling (PAC)
1) Extract the phase of the signal (flow)
2) Compute the amplitude envelope of the signal fhigh
3) Extract the phase of the amplitude envelope of the signal fhigh
4) Use PLV to estimate phase-consistency between flow and fhigh
Many alternative options to compute PACSiebenhühner et al. 2016 Elife
Vanhatalo et al, 2004 PNAS
Two oscillations at distinct frequencies flow and fhigh

Pitfalls in the CFC analyses
Changes in CFC between conditions may be caused by changes in SNR caused by changes in signal power.
CFC may be caused by neuronal activity phase-locked to stimulus onset.
CFS may be caused by non-sinusoidal signals.

Low SNR affects the estimation of connectivity
C = true couplingO
bserv
ed
couplin
g
SNR
Low SNR

Increase in SNR in the low-SNR condition increase
observed PLVO
bse
rve
dP
LV
ch
an
ge
vs. S
NR
ch
an
ge
SNR
Low SNR

CFC with stimulus-locked activities
Ongoing activity is phase-locked to sensory stimulus onset over a wide range of frequencies.
If CFS is computed for such phase-locked signal, it is observed, but it is NOT true CFS caused by intrinsic dynamics coupling between two signals.
Solutions: Use data where such problem does not exist.
Always check the presence of phase-locking of ongoing oscillationsto stimulus onset.
Use surrogate analysis to remove the stimulus-locked component. Note that several difficulties are present because also stimulus-locked component have phase-jitter and because of signal mixing.

Signal sinusoidality and CFC

Signal harmonics and CFS

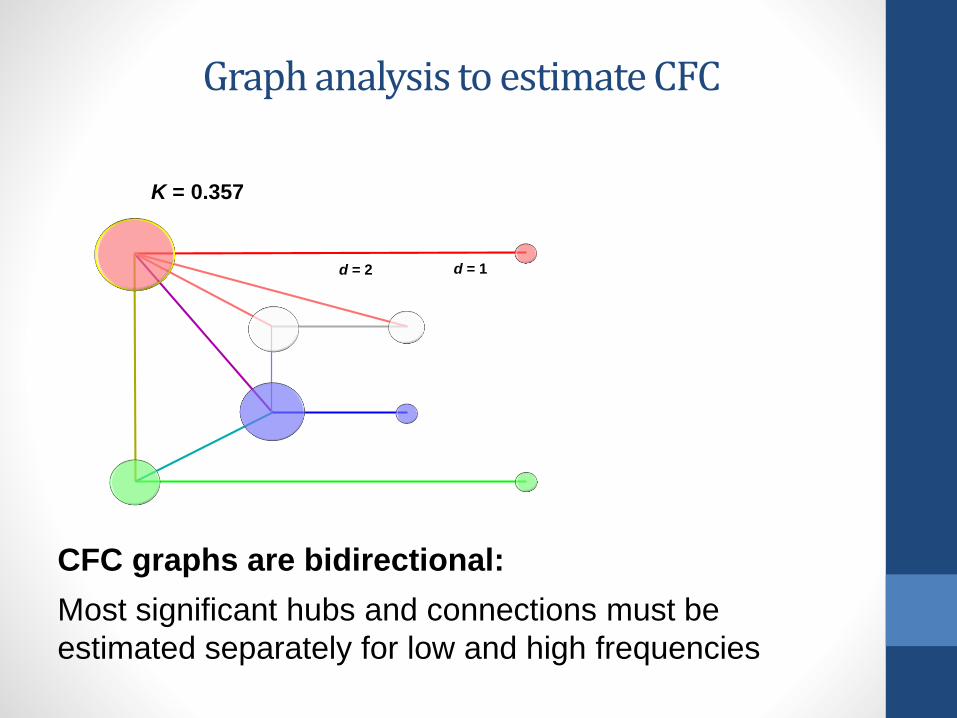
Graph analysis to estimate synchrony
d = 2 d = 1
K = 0.357
Graph analysis can be used estimate the graph / network properties
K = connection density =
proportion of connections from all
possible connections
Node = brain region
Edge = connection
Degree Hub = Node with many
connections
Centrality hub = Central for
communication
Hub
Node
Edge

Graph representation of a network
Visualize the most central or strongest connections and nodes
Node strenght = the strenght of synchronization in a given node.
Node degree = The centrality of a node. Hubs have high degree
and hence many connections.
Other centrality metrics for node centrality such eigen vector
centrality (EVC), betweennes centrality (BWC) etc.
Hub node
Non-hub node
Edge = significant connections
Lobier et al provisionally accepted

Graph representation of a network
Visualize the most central or strongest connections and nodes
Display them in an inflated (and flattened) cortical surface.
Co-localization and color coding with the fMRI based FC network aids
interpretability
Lobier et al provisionally accepted

One solution for spurious connectivity…
Spurious connectivity
Bundling of artefactual interactions
Spurious connectivity

Bundling artefactual connections
1 13
V1
V3
V2
V4
Signal mixing
neighbourhood of V1
Signal mixing
neighbourhood of V2
0.09
0.13
0.18
0.23
iPLV
1
13
Wang et al.,provisionally accepted
Linear signal mixing space Bundling according to signal mixing
Graph analysis to estimate CFC
d = 2 d = 1
K = 0.357
CFC graphs are bidirectional:
Most significant hubs and connections must be
estimated separately for low and high frequencies

CFS between alpha and gamma
Siebenhühner et al. 2016 Elife
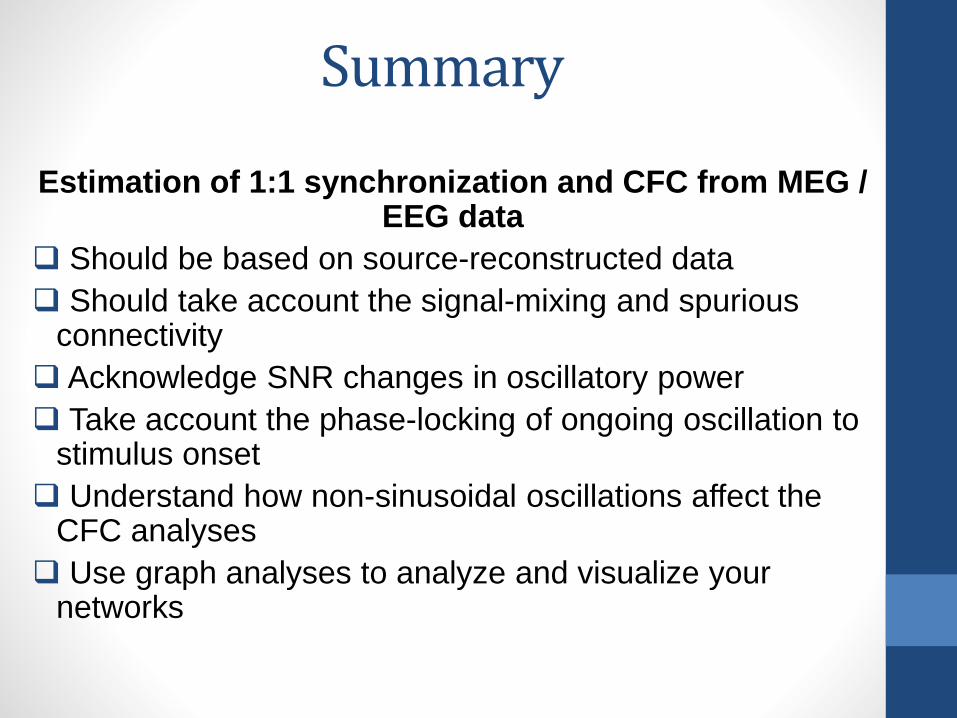
Summary
Estimation of 1:1 synchronization and CFC from MEG / EEG data
Should be based on source-reconstructed data
Should take account the signal-mixing and spurious connectivity
Acknowledge SNR changes in oscillatory power
Take account the phase-locking of ongoing oscillation to stimulus onset
Understand how non-sinusoidal oscillations affect the CFC analyses
Use graph analyses to analyze and visualize your networks