estimation of inelastic deformation demands in multistorey rc frame buildings
TRANSCRIPT

*Correspondence to: M. N. Fardis, Department of Civil Engineering, University of Patras, P.O. Box 1424, UniversityCampus, GR 26500 Patras, Greece. E-mail: [email protected]
Contract/grant sponsor: European Commission; Contract/grant numbers: ENV4-CT97-0548 (DG12-ESCY), FMRX-CT96-0022 (DG12-RSRF)
CCC 0098—8847/99/050501—28$17)50 Received 4 September 1998Copyright ( 1999 John Wiley & Sons, Ltd. Revised 12 November 1998
EARTHQUAKE ENGINEERING AND STRUCTURAL DYNAMICS
Earthquake Engng. Struct. Dyn. 28, 501—528 (1999)
ESTIMATION OF INELASTIC DEFORMATION DEMANDSIN MULTISTOREY RC FRAME BUILDINGS
T. B. PANAGIOTAKOS AND M. N. FARDIS*
Department of Civil Engineering, University of Patras, P.O. Box 1424, 26500 Patras, Greece
SUMMARY
Estimation of peak inelastic deformation demands is a key component of any displacement-based procedurefor earthquake-resistant design of new structures or for seismic evaluation of existing structures. On thebasis of the results of over a thousand non-linear dynamic analyses, rules are developed for the estimation ofmean and upper-characteristic peak inelastic interstorey drifts and member chord rotations in multistoreyRC frame buildings, either bare or infilled in all storeys but the first. For bare frame structures, meaninelastic deformation demands can be estimated from a linear, equivalent static, or preferably multimodalresponse spectrum analysis with 5 per cent damping and with the RC members considered with their secantstiffness at yielding. 95 per cent characteristic values can be estimated as multiples of the mean deformations.For open-first-storey buildings, the linear analysis can be equivalent static, with the infills modelled as rigidbidiagonal struts and all RC members considered with their secant stiffness to yielding. Copyright ( 1999John Wiley & Sons, Ltd.
KEY WORDS: displacement-based design; inelastic dynamic analysis; inelastic seismic response; multistoreybuildings; open-ground-storey buildings; RC frame buildings
1. INTRODUCTION
Structural displacements and member deformations do not enjoy a primary role in currentforce-based earthquake-resistant design. Their absolute magnitude is of interest only for aspectsconsidered of secondary importance for seismic performance and safety: for the limitation ofnon-structural damage, through the control of interstorey drifts, for the calculation of P—* effects,for the control of pounding between adjacent structures, etc. In the main phase of currentforce-based design, namely that of member proportioning for given strength demands and ofmember detailing, structural displacements and member deformations enter in an average senseand indirectly, through their ratio to the corresponding value at yield (i.e. through the displace-ment ductility ratio, global or local, which determines, respectively, the force reduction factor orthe member detailing requirements). Recent years have seen, however, an increased interest in the

absolute magnitude of peak displacements and deformation demands. The main reason for this isthe recent recognition that displacement- and deformation-, rather than strength-, demands andcapacities, is what determines seismic performance and safety. Moreover, ductility factors,although convenient for the determination of strength demands, are poor descriptors of deforma-tion capacity, as the introduction of another, sometimes ill-defined variable, i.e. the yielddisplacement or deformation, often increases rather than reduces the uncertainty. Recent dis-placement-based proposals for seismic design of new1—8, or for the evaluation of existingstructures9—11, define the seismic input in terms of displacement demands. They also use, directlyor indirectly, member deformations for the proportioning and detailing of new members or forthe evaluation of existing ones. Implementation of these new proposals requires development ofprocedures for simple, yet relatively accurate, estimation of inelastic displacement and deforma-tion demands throughout the structure.
Previous work on inelastic displacement demands has focused mainly on SDOF sys-tems.1,12—14 It has essentially confirmed the validity of the equal displacement approximation forsystems with natural period ¹ greater than the ‘predominant period’ of the site or of the groundmotion, ¹
#, i.e. the corner period at which the elastic acceleration and pseudovelocity response
spectra both exhibit a local maximum. For ¹(¹#
inelastic displacement demands exceed theelastic. The shorter the period ¹ and the lower the yield strength of the SDOF system, the largeris the peak inelastic displacement of such a short-period system relative to the elastic value.14 Onthe contrary, if ¹
#is clearly predominant in the motion, as, e.g. in records on soft soil, the equal
displacement approximation overestimates inelastic displacement demands in the vicinity of¹
#.12,13,15,16According to several recent proposals,15—17 in multistorey buildings inelastic demands for
interstorey drifts and other important local deformation measures are estimated through multi-stage procedures. In these procedures an equivalent SDOF system is first established, its inelasticdisplacement demands are estimated as in SDOF systems1,12—14 and are translated then into localdeformation demands, either through multiplicative conversion factors derived from a largenumber of non-linear analyses of representative types of structural systems,15—17 or throughbuilding- and member-specific relationships between global displacements and local deforma-tions, developed through an incremental non-linear static (‘pushover’) analysis of the building.15
The recent NEHRP guidelines for the seismic evaluation and retrofit of existing buildings11accept various levels of analysis of increasing complexity for the estimation of inelastic deforma-tion demands in ‘deformation-controlled’ (i.e. ductile) regions of the building: ‘linear static’, underequivalent lateral forces with a heightwise distribution simulating first-mode response; ‘lineardynamic’, i.e. multimodal response spectrum analysis; ‘non-linear static’, or ‘pushover’ analysis,with two different heightwise distributions of lateral forces; and ‘non-linear dynamic’, i.e. inelastictime-historey analysis. In the first three types of analyses the equal displacement approximation isadopted for ¹'¹
#, while for ¹(¹
#a multiplicative factor is applied to elastic displacements,
which is a function of ¹ and of the expected level of non-linearity. For buildings in which morethan 30 per cent of the base shear capacity is provided by elements which degrade under cyclicloads (e.g. ‘ordinary’ moment frames with no special provisions for local and global ductility, orshear-critical walls), the so-estimated displacement demands are increased to account for theeffect of degradation and pinching of the hysteresis loops on inelastic energy dissipation.11A further semi-empirical amplification of displacements for P—* effects is typically relevant onlyfor very flexible structures. Finally, the rehabilitation guidelines developed in parallel by ATCspecifically for RC buildings,18 advocate estimation of local and global inelastic deformation
502 T. B. PANAGIOTAKOS AND M. N. FARDIS
Copyright ( 1999 John Wiley & Sons, Ltd. Earthquake Engng. Struct. Dyn. 28, 501—528 (1999)

demands by combining a Composite Spectrum (which determines the force and displacementdemands as a function of the global displacement ductility factor) with a ‘pushover’ analysis(which determines the global force—displacement relationship up to ultimate). This, in principle,iterative technique accounts for the effects of period lengthening and energy dissipation oninelastic seismic demands, as such effects are reflected by the Composite Spectrum. However,unlike the ‘linear dynamic’ and the ‘non-linear dynamic’ procedures of the NEHRP guidelines,11it does not capture higher mode effects.
In References 3, 6, 9, global forces and displacements are also related as in the CompositeSpectrum approach, i.e. through the secant stiffness to peak displacement and the ductility-dependent damping ratio. A displacement profile is postulated, depending on the structuralconfiguration and the likely or desired plastic mechanism. This is done only to relate the ultimatedeformation in critical regions to the equivalent displacement of the SDOF system and not forapportioning global displacement demands to individual members.
In this paper results of several hundreds of non-linear dynamic analyses are utilized for thedevelopment of procedures for the estimation of member inelastic deformation demands in bareor partially infilled multistorey RC buildings. In an effort to stay close to everyday earthquake-resistant design practice, the proposed procedures are linear elastic, equivalent static or multi-modal dynamic. The appeal of the proposed approach is reduced, though, by the fact that, similarto non-linear analysis procedures, it requires knowledge of member longitudinal reinforcement.The reason is that member elastic rigidities are computed from yield moments and deformations.For existing buildings this is not a problem, if as-built drawings are available. For new buildings,though, application of the proposed procedures requires preliminary proportioning of memberlongitudinal reinforcement, for the ultimate-limit-state against factored gravity loads, for damagecontrol under a serviceability earthquake and to meet capacity-design requirements.7,8 Thiscomplication of the computational procedure seems, though, unavoidable, because estimation ofinelastic displacement and deformation demands in RC structures is much more sensitive to theelastic rigidities of cracked members than to the details and sophistication of the analysis and themodelling. Moreover, it is now widely recognized that the elastic stiffness of cracked RC membersis approximately proportional to yield strength and hence is not a function of cross-sectionaldimensions alone, but of the quantity of longitudinal reinforcement as well.6
2. DESCRIPTION OF THE RC FRAME BUILDINGS
2.1. Bare frame structures
Rules for the estimation of inelastic deformation demands are derived from analyses of thethree types of RC frame buildings shown in Figure 1. Four versions of each building type areconsidered, which differ in their seismic design parameters: in two of them the design PGA is0)15g and in the other two it is 0)3g. All of them are designed according to Eurocode 8, Parts 1—1to 1—3,19 which provides for three ‘Ductility Classes’ (DC): High (H), Medium (M) and Low (L),with corresponding behaviour factors q (i.e. force reduction factors R) equal to 5)0, 3)75 and 2)5,respectively. Member detailing becomes less stringent as the DC and the value of q decrease, andso do capacity design requirements: in DC L no capacity design rule applies, in DC M capacitydesign in shear is required only for columns, while the overstrength factors for capacity design ofcolumns in bending and in shear are higher in DC H than in DC M.
DEFORMATION DEMANDS IN MULTISTOREY RC FRAME BUILDINGS 503
Copyright ( 1999 John Wiley & Sons, Ltd. Earthquake Engng. Struct. Dyn. 28, 501—528 (1999)

Figure 1. Plane and vertical section of buildings: (a) four-storey and 12-storey buildings; (b) three-storey buildings
504T
.B.P
AN
AG
IOT
AK
OS
AN
DM
.N.F
AR
DIS
Copyrigh
t(
1999Jo
hn
Wiley
&Sons,L
td.
Earthquake
Engng.S
truct.Dyn.28,501
—528
(1999)

The Eurocode 8 acceleration design spectrum for Soil B (intermediate) is used. It falls linearlyfrom the PGA to a value of 2)5]PGA/q at ¹
#/4, remains flat up to the corner period ¹
#("0)6 for
Soil B) and falls thereafter as ¹~2@3. A multimodal response spectrum analysis was applied for thedesign. Following Eurocode 8, the design spectrum was entered with periods computed on thebasis of gross uncracked sections.
Member cross-sectional dimensions for the four designs (denoted L15, M15, M30 and H30) ineach type of building are listed in Table I. They are the same in all storeys, resulting in a veryregular configuration, not only in plan but also in elevation (with the exception of the three-storeybuildings, in which the top storey differs significantly from the lower two). Except for theapplication of minimum reinforcement provisions, member reinforcement was proportionedexactly to meet the requirements from the analyses.
To consider the effect of the beam—column strength ratio on the response, versions M15, M30and H30, which are subject to column capacity design, are designed either with conventional fullcapacity design (i.e. enforcing +M
R#'c+M
R"at beam—column joints, with subscript b: beams
and c: columns, MR"flexural capacity and c equal to 1.2 for DC M or 1.35 for DC H), or to the
relaxed capacity design allowed by Eurocode 8 (i.e. with +MR#*(1#c!d)d+M
R", with
d"+MS"
/+MR"
and +MS"
denoting the sum of beam seismic moments at the joint according tothe analysis). Accordingly, seven different building designs were produced for each structuralconfiguration, i.e. a total of 3]7"21 building designs. Conventional or relaxed capacity designis signaled by adding a C or R, respectively, to the basic designation of the building (e.g. as M15Cvs. M15R). Finally, although the contribution of slab reinforcement to the top flange of the beamsin tension was neglected in design, in the non-linear analyses two cases are considered for eachbuilding design, one with ‘zero’ participation of the slab to the tension flange, and another with‘full’ participation, meaning that all slab bars parallel to the beam and up to a distance equal toone-quarter of the beam span from it or mid-distance to the next beam, are considered fullyeffective as beam top flange reinforcement. ‘Zero’ or ‘full’ slab participation to the beam tensionflange is denoted by adding the ending 0 or F, respectively, to the designation of the buildingdesign. The ‘zero’ slab case reflects how the building is considered in design, e.g. during theapplication of column capacity design. The ‘full’ slab case, on the contrary, reflects better theas-built reality. The combination of conventional capacity design and ‘zero’ slab, i.e. cases C0,correspond to the lowest beam—column strength ratio for the same building geometry and seismicdesign parameters, whereas the RF combination of relaxed capacity design and ‘full’ slabcorresponds to the highest. The storey-average beam—column strength ratio, +M
R"/+M
R#, is
about 0)3 to 0)5 in the C0 cases of the low-rise buildings or around 0)25 in those of the 12-storeyones. In the RF low-rise buildings the storey-average +M
R"/+M
R#ratio is nearly double (between
0)6 and 1)0) and that of the 12-storey buildings is around 0.35.20 So finally the seven differentdesigns for each building configuration are translated into 14 different frame structures for thenon-linear analyses, i.e. a total of 3]14"42 different RC structures.
2.2. Open-ground-storey infilled structures
The relaxed-capacity-design full-slab-participation version of each building (i.e. buildingsL15F, M15RF, M30RF and H30RF) is considered with all bays of the external frames in the twohorizontal directions X and ½ infilled in all storeys except the ground one. The masonry infills areconsidered to have a cracking strength q
#3of 0)26 MPa, a shear modulus G of 1)25 GPa and an
Elastic Modulus of 2)5 and 8)2 GPa in the horizontal and vertical direction, respectively.
DEFORMATION DEMANDS IN MULTISTOREY RC FRAME BUILDINGS 505
Copyright ( 1999 John Wiley & Sons, Ltd. Earthquake Engng. Struct. Dyn. 28, 501—528 (1999)

Table I. Member cross-sectional dimensions (m) of 12 buildings
No. of Design Columns Beams b/h Slabstoreys thickness
DC PGA (g) Internal External Corner X-dir/Exts X-dir/Ints ½-dir.
4 L 0)15 0)50]0)50 0)45]0)45 0)40]0)40 0)25/0)45 0)30/0)60 0)25/0)45 0)144 M 0)15 0)50]0)50 0)45]0)45 0)40]0)40 0)25/0)45 0)30/0)60 0)25/0)45 0)144 M 0)30 0)50]0)50 0)45]0)45 0)40]0)40 0)30/0)50 0)30/0)60 0)30/0)50 0)144 H 0)30 0)50]0)50 0)45]0)45 0)40]0)40 0)30/0)50 0)30/0)60 0)30/0)50 0)14
12 L 0)15 0)80]0)80 0)70]0)70 0)70]0)70 0)30]0)60 0)30]0)60 0)30]0)60 0)1412 M 0)15 0)80]0)80 0)70]0)70 0)70]0)70 0)30]0)60 0)30]0)60 0)30]0)60 0)1412 M 0)30 0)80]0)80 0)70]0)70 0)70]0)70 0)35]0)60 0)35]0)60 0)35]0)60 0)1412 H 0)30 0)80]0)80 0)70]0)70 0)70]0)70 0)35]0)65 0)35]0)65 0)35]0)65 0)14
3 L 0)15 0)50]0)80 0)50]0)60 0)50]0)60 0)30/0)80 0)30/0)80 0)40/1)20 0)163 M 0)15 0)50]0)80 0)50]0)60 0)50]0)60 0)30/0)80 0)30/0)80 0)40/1)20 0)163 M 0)30 0)60]1)00 0)60]0)80 0)60]0)80 d d 0)40/1)20 0)163 H 0)30 0)60]1)00 0)60]0)80 0)60]0)80 d d 0)40/1)20 0)16
sThe two columns for the beams in the X-direction refer to the external and the internal frames in this direction.dFor strength reasons, the cross-sectional dimensions of the X-direction beams need to vary from 0)35/1)00 in the first to 0)30/0)9 in the secondand to 0)30/0)80 in the third storey.
506T
.B.P
AN
AG
IOT
AK
OS
AN
DM
.N.F
AR
DIS
Copyrigh
t(
1999Jo
hn
Wiley
&Sons,L
td.
Earthquake
Engng.S
truct.Dyn.28,501
—528
(1999)
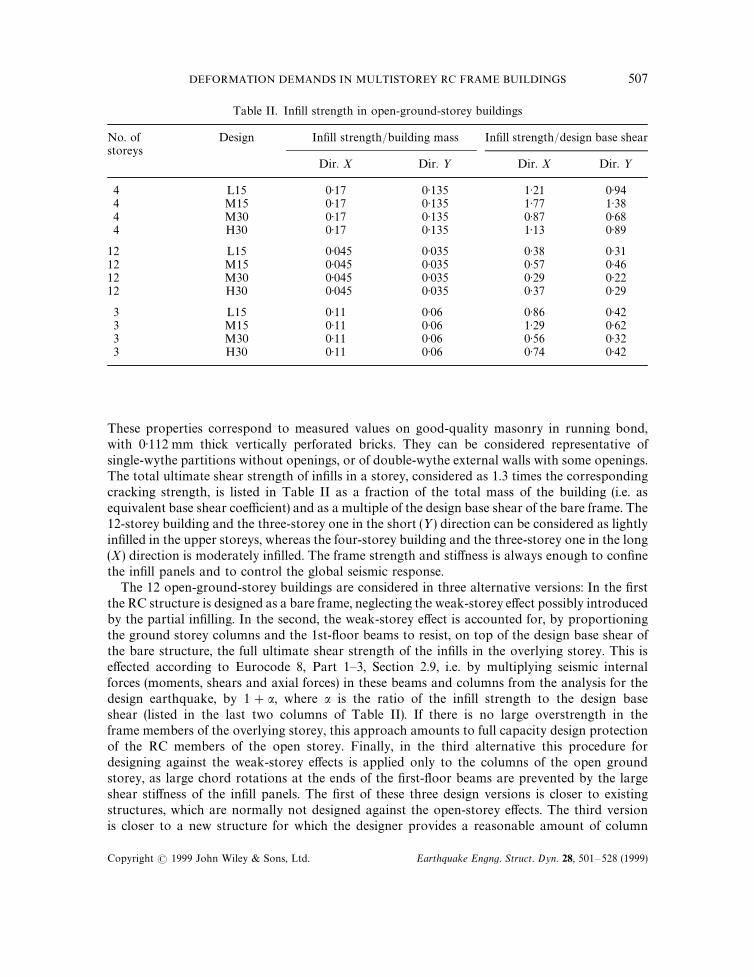
Table II. Infill strength in open-ground-storey buildings
No. of Design Infill strength/building mass Infill strength/design base shearstoreys
Dir. X Dir. ½ Dir. X Dir. ½
4 L15 0)17 0)135 1)21 0)944 M15 0)17 0)135 1)77 1)384 M30 0)17 0)135 0)87 0)684 H30 0)17 0)135 1)13 0)89
12 L15 0)045 0)035 0)38 0)3112 M15 0)045 0)035 0)57 0)4612 M30 0)045 0)035 0)29 0)2212 H30 0)045 0)035 0)37 0)29
3 L15 0)11 0)06 0)86 0)423 M15 0)11 0)06 1)29 0)623 M30 0)11 0)06 0)56 0)323 H30 0)11 0)06 0)74 0)42
These properties correspond to measured values on good-quality masonry in running bond,with 0)112 mm thick vertically perforated bricks. They can be considered representative ofsingle-wythe partitions without openings, or of double-wythe external walls with some openings.The total ultimate shear strength of infills in a storey, considered as 1.3 times the correspondingcracking strength, is listed in Table II as a fraction of the total mass of the building (i.e. asequivalent base shear coefficient) and as a multiple of the design base shear of the bare frame. The12-storey building and the three-storey one in the short (½) direction can be considered as lightlyinfilled in the upper storeys, whereas the four-storey building and the three-storey one in the long(X) direction is moderately infilled. The frame strength and stiffness is always enough to confinethe infill panels and to control the global seismic response.
The 12 open-ground-storey buildings are considered in three alternative versions: In the firstthe RC structure is designed as a bare frame, neglecting the weak-storey effect possibly introducedby the partial infilling. In the second, the weak-storey effect is accounted for, by proportioningthe ground storey columns and the 1st-floor beams to resist, on top of the design base shear ofthe bare structure, the full ultimate shear strength of the infills in the overlying storey. This iseffected according to Eurocode 8, Part 1—3, Section 2.9, i.e. by multiplying seismic internalforces (moments, shears and axial forces) in these beams and columns from the analysis for thedesign earthquake, by 1#a, where a is the ratio of the infill strength to the design baseshear (listed in the last two columns of Table II). If there is no large overstrength in theframe members of the overlying storey, this approach amounts to full capacity design protectionof the RC members of the open storey. Finally, in the third alternative this procedure fordesigning against the weak-storey effects is applied only to the columns of the open groundstorey, as large chord rotations at the ends of the first-floor beams are prevented by the largeshear stiffness of the infill panels. The first of these three design versions is closer to existingstructures, which are normally not designed against the open-storey effects. The third versionis closer to a new structure for which the designer provides a reasonable amount of column
DEFORMATION DEMANDS IN MULTISTOREY RC FRAME BUILDINGS 507
Copyright ( 1999 John Wiley & Sons, Ltd. Earthquake Engng. Struct. Dyn. 28, 501—528 (1999)

Figure 2. Acceleration and displacement spectra of four synthetic motions and target Eurocode 8 spectra for PGA"0)3g
overstrength against the weak storey effect. Finally, the second version is a strict application ofa current code.
3. NON-LINEAR DYNAMIC RESPONSE ANALYSES
3.1. Introduction
The 42 different bare frame structures and the 36 open-ground-storey infilled ones, aresubjected to non-linear dynamic analysis of their response to unidirectional ground motionsapplied separately in horizontal directions X and ½. The input motions consist of four synthetic
508 T. B. PANAGIOTAKOS AND M. N. FARDIS
Copyright ( 1999 John Wiley & Sons, Ltd. Earthquake Engng. Struct. Dyn. 28, 501—528 (1999)

10 sec-long accelerograms, with rise and fall times of 1)5 sec. The motions are compatibleto the elastic Eurocode 8 spectrum for soil B, which increases linearly from PGA to 2)5 PGAat ¹
#/4, remains constant up to ¹
#("0)6 sec) and falls then with 1/¹. The elastic accel-
eration and displacement spectra of the four motions are compared to the target spectra inFigure 2. Their rms (root-mean-square) deviation from the EC8 spectrum within the velocity-controlled period range of 0)6 to 3)0 sec is 7)5 per cent of the corresponding spectralvalue.
The input motions are applied to the bare frames after scaling to an effective PGA (defined as inATC and NEHRP documents) of 1)0x, 1)5x or 2)0x the design PGA of 0)15 or 0)3g, and to theopen-ground-storey structures after scaling to 1)0x and 2)0x the design PGA. So each barestructure is subjected to 4]3"12 non-linear analyses in each horizontal direction, giving a totalof 42]12]2"1008 analyses, and each partially infilled one to 4]2"8 analyses in X or ½,amounting to a total of 36]8]2"576 non-linear analyses.
3.2. Non-linear modelling
One-component, point-hinge macromodels are used for the RC members, to relate theend-moment to the chord rotation at member ends within each plane of bending. Inelasticcoupling between the two ends of the member is not considered, i.e. the plastic component of thechord rotation at one end is taken independent of the current value and of the history of themoment at the other end. Although coupling between the two ends is considered in the elasticrange, the elastic rigidity, EI, and the parameters of the post-yield moment chord rotationrelationship are computed assuming that the point of inflection is fixed at element mid-length, i.e.considering antisymmetric bending. Then if M
:is the yield moment at the end-section, computed
at first yielding of the tension steel assuming plane sections remain plane, and h:
is the chordrotation at the same end at yielding, for a shear span equal to half the member length ¸, then theelastic rigidity EI is computed as EI"(M
:/h
:)¸/6. The value of h
:can be estimated as the sum of
three components: a flexural one, equal to h:¸/6 (h
:is the curvature at yield, computed with the
same assumptions as the yield moment M:), a second one due to shear deformations and inclined
cracking along the shear span, and a third one, s/z, due to the pull-out, s, of the tension steel fromits anchorage zone beyond the end-section (z is the lever arm of internal forces). Semi-empiricalexpressions for the shear contribution to h
:and for the bar slippage, s, have been fitted to test
results in References 7, 21 or 22. These expressions provide roughly similar results and can beused almost equivalently for the calculation of h
:. So, although joints are modelled as rigid zones
at member ends, bar slippage in them is included in the member model, albeit in an indirect andcrude way.
In beams, each end corresponds to two values of EI"(M:/h
:)¸/6, one for positive and another
for negative bending. These values are averaged at both ends to provide a single EI-value for themember. For columns with symmetric reinforcement and cross-section, the two single values ateach end are averaged; these values are computed on the basis of the column axial force due to theacting gravity loads alone.
The M—h relation in monotonic loading is taken bilinear, with a post-yield hardening ratiop computed assuming antisymmetric bending and using empirical expressions in References 6, 21or 23. The ultimate moment M
6is computed on the basis of first principles. The hysteresis rules
supplementing the bilinear monotonic M—h curve are of the modified-Takeda type,24 with reload-ing parameter b"0 (reloading to the extreme previous point of the monotonic curve) and
DEFORMATION DEMANDS IN MULTISTOREY RC FRAME BUILDINGS 509
Copyright ( 1999 John Wiley & Sons, Ltd. Earthquake Engng. Struct. Dyn. 28, 501—528 (1999)

with unloading parameter a"0)3 (unloading to a residual deformation (1!a) times thatfor elastic unloading). This choice of parameters produces hysteretic damping in cycles ata displacement ductility factor k equivalent to a damping ratio f"(1!p) (1!a) (1!1/k)/n+0)22(1!1/k), in addition to the 5 per cent viscous damping considered to be associated with theelastic regime.26
P—* effects are included, through the linearized geometric stiffness matrix of columns.In the partially infilled structures infill panels are modelled as bidiagonal struts effective only
in compression. Their axial force—deformation law reproduces a phenomenological modelfitted to test results on the panel shear stress—shear deformation (i.e. storey drift ratio) relation.In monotonic loading the model is multilinear, with the first corner, q
#3, c
#3at cracking,
the second, q6, c
6, at ultimate strength and the third at a residual strength at the end of
the post-ultimate falling branch. The ultimate strength, q6, is taken equal to 1)3q
#3, the cracking
strain equal to q#3/G and the strain at ultimate, c
6, is established considering that the panel
secant stiffness of the equivalent strut to ultimate strength can be computed from the equivalentstrut width formula in Reference 25 using the elastic modulus of the masonry in the horizontal(weak) direction. These simple rules depend on masonry properties which can be measuredon standard wallette tests in diagonal compression (for q
#3and G) and in compression parallel
and normal to the bed joints (for E), and have been found27 to provide good fit to test resultson simple infilled frames.
Unloading from the envelope curve is linear at the elastic slope G, down to about 10 per cent ofthe ultimate strength, q
6, followed by a more shallow linear unloading—reloading branch up to
a point in the opposite direction at a stress level of &0)1q6, and at a shear strain exceeding the
elastic value 0.1q6/G by 80 per cent of the maximum previous post-cracking shear strain (c!c
#3),
in the direction of reloading. Further reloading heads to the envelope curve, through a pointwhich is 15 per cent below the most extreme previous point on the envelope. These rules providegood overall fit to cyclic test results. In the first post-cracking cycle they give hysteretic dampingequivalent to a viscous damping ratio of 20—30 per cent or of 5—6 per cent in subsequent fullcycles.27
Viscous damping is of the Rayleigh type,28 with a modal damping ratio specified equal to 5 percent at the fundamental elastic period of the cracked structure, ¹
#3, and at half that period.
The modelling approach and assumptions in this study were found to be in satisfactoryagreement with cyclic, pseudodynamic or shake table tests on full- or large-scale subassembliesand structures, bare or partially infilled. Further validation was provided through comparisonswith non-linear dynamic analyses of configurations L150, M15R0, M30R0 and H30R0 of the12-storey structure in direction X using a very detailed fibre model for the RC members. Detailsof the validation can be found in References 20, 29, 30.
Mean values of material strengths are used in the non-linear analyses instead of thecorresponding design values. This difference corresponds to an overstrength factor of approxim-ately 1)5. Further overstrengths on the supply side due to minimum reinforcement, the controlof some sections by factored gravity loads, the coverage of both beam or column sectionson opposite sides of a joint by the same steel bars, the consideration of accidental torsion andof motion multidirectionality (SRSS or 1 : 0)3 combination of the effects of the two horizontalcomponents), etc., increase the value of the overstrength factor to more than 2)0. Overstrengthis further increased to an aggregate value of 2)5—3)0, because calculation of natural periods onthe basis of gross uncracked sections leads to significant overestimation of seismic designforces.
510 T. B. PANAGIOTAKOS AND M. N. FARDIS
Copyright ( 1999 John Wiley & Sons, Ltd. Earthquake Engng. Struct. Dyn. 28, 501—528 (1999)

Figure 3. Fundamental period of elastic cracked structure and predominant period of inelastic response to 1)0x, 1)5x or 2x the design ground motion (mean valuesfor the four synthetic motions)
DE
FO
RM
AT
ION
DE
MA
ND
SIN
MU
LT
IST
OR
EY
RC
FR
AM
EB
UIL
DIN
GS
511
Copyrigh
t(
1999Jo
hn
Wiley
&Sons,L
td.
Earthquake
Engng.S
truct.Dyn.28,501
—528
(1999)

Figure 3. (Continued)
512T
.B.P
AN
AG
IOT
AK
OS
AN
DM
.N.F
AR
DIS
Copyrigh
t(
1999Jo
hn
Wiley
&Sons,L
td.
Earthquake
Engng.S
truct.Dyn.28,501
—528
(1999)

Figure 3. (Continued)
DE
FO
RM
AT
ION
DE
MA
ND
SIN
MU
LT
IST
OR
EY
RC
FR
AM
EB
UIL
DIN
GS
513
Copyrigh
t(
1999Jo
hn
Wiley
&Sons,L
td.
Earthquake
Engng.S
truct.Dyn.28,501
—528
(1999)

3.3. Predominant period of non-linear response
The predominant period of the non-linear displacement response, ¹/-
, has been determinedfrom a Fourier analysis of the calculated top displacement time-history. Its (average over the4 input motions) value at the three excitation levels, 1)0x, 1)5x and 2)0x, is presented in Figure 3 forthe bare structures in the form of bar-charts and compared to the fundamental period of theelastic structure, ¹
#3. As expected ¹
/-always exceeds ¹
#3, but not very much, and increases with
the level of excitation. Both ¹#3
and ¹/-
are significantly affected and in the same direction by thetype of capacity design (C or R) and by the slab width included in the beam tension flange in theanalysis (0 or F). It is interesting to note that the values of ¹
#3are well above the corner period
¹#of the excitation and that the values of ¹
#3and ¹
/-range over the entire velocity-controlled
part of the spectrum, in which the ‘equal displacement rule’ applies well on the average for SDOFsystems.
In an effort to be on the conservative side as far as the acceleration and force demands areconcerned, the rules of current force-based seismic design codes for the calculation of thefundamental elastic period of RC structures on the basis of gross uncracked sections (througheigenvalue analysis or the Rayleigh quotient) underpredict these periods by almost a factor of 2)0.Full-scale pseudodynamic or shake table tests and sophisticated models alike, show that thefundamental period of even low-rise bare RC structures, under motions which cause full crackingof the concrete and bring several members to incipient yielding, is normally longer than thepredominant or corner period ¹
#of the excitation. This increases the magnitude and the
importance of seismic displacements, but facilitates their estimation on the basis of the equaldisplacement rule.
3.4. Inelastic deformation demands of bare structures
The deformation measures of interest here are the chord rotations at member ends and theinterstorey drift ratios. Computed chord rotations reflect, in part, the effects of bond slippagewithin beam column joints and are the most useful deformation measure for evaluation of thedeformation capacity of a member or for its detailed design to meet the seismic deformationdemands. Interstorey drift ratios are equal to the sum of the average chord rotation of the beamsand the average chord rotation of the columns in the storey (plus the average shear strain inbeam—column joints, which is neglected though in the present analyses). They are not directlyuseful for member evaluation or proportioning, but they provide a good picture of the distribu-tion of inelastic deformation demands among the storeys.
Computed inelastic interstorey drift ratios and chord rotations at member ends are pre-sented in the form of ratios to the corresponding deformation measures from a linear elasticanalysis of the structure. Two types of elastic analyses are considered: Equivalent staticunder storey lateral forces proportional to the product of mass and elevation (inverted tri-angular distribution), or multimodal response spectrum analysis, with the CQC rule for combina-tion of peak modal responses.30 Both types of analysis use the 5 per cent-damped smoothelastic spectrum of Eurocode 8 for Soil B, from which the four synthetic motions were generated.They both use the same elastic rigidities EI"(M
:/h
:)¸/6 for the members as the non-linear
analyses.A detailed examination of the results shows that within each class of buildings with the same
number of storeys, differences in the member dimensions and reinforcement and in the
514 T. B. PANAGIOTAKOS AND M. N. FARDIS
Copyright ( 1999 John Wiley & Sons, Ltd. Earthquake Engng. Struct. Dyn. 28, 501—528 (1999)

beam—column strength ratio are not statistically important. In other words, the differencesbetween cases L15, M15, M30 and H30, and between cases C and R or 0 and F affect similarly theelastic global and the inelastic deformation demands and their distribution in the structure. Thisconclusion extends to the two different horizontal directions (which correspond to two differentstructural configurations) and to the three intensities of the input motion (implying that thedistribution of inelasticity within the structure does not change much with motion intensity).Examples of this insensitivity are shown later in Figures 7 and 8. For this reason inelastic-to-elastic ratios for interstorey drifts are lumped together in a single database with 336 data pointsfor each type of building (4-, 12- or 3-storey) and presented in Figure 4, separately for eachmethod of elastic analysis. The scatter represented by the standard deviation and by the differencebetween the mean and the 95 per cent-characteristic values in Figure 4 reflect variability due tothe above-mentioned differences in the structural configuration and the member dimensions andreinforcement, and due to the intensity and the details of the input motion. According to Figure 4,the multimodal response spectrum elastic analysis provides better overall agreement in the mean(esp. in the top third of the building, see, in particular, the slightly irregular three-storey case) andsmaller dispersion than the equivalent static procedure.
Figure 5 refers to member chord rotations, shown separately for beams and columns of eachfloor. For the ground-storey columns, results are shown separately for the connection to thefoundation at ‘gr’ and for the top, at floor ‘1’. For the other floors no distinction is made in Figure5 between top and bottom of columns. The mean $ one standard deviation range reflects now inaddition, the member-to-member variability within each storey (there are 20 different columnends in each storey of the 4- or 12-storey structures or 36 in the three-storey ones and there are 16different beam ends in X or 12 in ½ in the first two types of structures or 32 and 20, respectively, inthe third). Accordingly the dispersion, expressed by the standard deviation and by the differencebetween the mean and the 95 per cent-characteristic values, is now larger than for the interstoreydrifts. The mean value is also larger, however, especially when the elastic analysis is equivalentstatic. The reason seems to be that for given interstorey drift ratio the non-linear analysisproduces more balanced chord rotations at the two ends of the same member, whereas the elasticanalysis and especially the equivalent static, gives larger imbalances between the two ends, whichare translated at the end, due to effect of the division by the smaller of the two end chordrotations, to a bias of the mean towards values greater than 1)0. This effect has been also observedin Reference 31. The multimodal response spectrum analysis gives again overall better agreementin the mean, smaller dispersion and lower 95 per cent-characteristic values than the equivalentlateral force procedure, especially for beams. Finally, mean and upper-characteristic values of theinelastic-to-elastic chord rotation ratio are, on the average, lower in columns than in beams,especially when the elastic analysis is of the multimodal response spectrum type. This may implythat, although capacity design of columns and, in general, the low beam-to-column strength ratiodo not limit inelasticity and plastic hinge formation to the beams alone,20,28 the inelastic chordrotation demands in columns are still smaller than in beams and hence they are better predictedby an elastic analysis, especially a multimodal one.
Table III summarizes the results in Figures 4 and 5, in terms of the heightwise variation and thebuilding average of the mean and of the 95 per cent-characteristic inelastic-to-elastic deformationratio. The values listed at the base and roof levels provide good linear fit to the storey values inFigures 4 and 5 and can be used for linear interpolations. It is encouraging that the large scatterand the large deviations of the mean and of the 95 per cent-characteristic values from 1)0 takeplace in the upper storeys, which are less critical, as the absolute magnitude of inelastic
DEFORMATION DEMANDS IN MULTISTOREY RC FRAME BUILDINGS 515
Copyright ( 1999 John Wiley & Sons, Ltd. Earthquake Engng. Struct. Dyn. 28, 501—528 (1999)

Figure 4. Mean$standard deviation range and 95 per cent-characteristic value of inelastic-to-elastic interstorey and top drifts (horizontal axis), for elastic driftscomputed from: (a) static analysis with equivalent lateral loads; (b) multimodal response spectrum analysis
516T
.B.P
AN
AG
IOT
AK
OS
AN
DM
.N.F
AR
DIS
Copyrigh
t(
1999Jo
hn
Wiley
&Sons,L
td.
Earthquake
Engng.S
truct.Dyn.28,501
—528
(1999)

Figure 5. Mean $ standard deviation range and 95 per cent-characteristic value of inelastic-to-elastic chord-rotation (horizontal axis), for elastic chord rotationscomputed from: (a) static analysis with equivalent lateral loads; (b) multimodal response spectrum analysis
DE
FO
RM
AT
ION
DE
MA
ND
SIN
MU
LT
IST
OR
EY
RC
FR
AM
EB
UIL
DIN
GS
517
Copyrigh
t(
1999Jo
hn
Wiley
&Sons,L
td.
Earthquake
Engng.S
truct.Dyn.28,501
—528
(1999)

Table III. Heightwise variation and building average of inelastic-to-elastic interstorey drift or chord rotation ratio (mean and 95 per cent-characteristic values)
No. of Interstorey drift Beam chord rotation Column chord rotationstoreys
Mean 95 per cent-char. Mean 95 per cent-char. Mean 95 per cent-char.
Stat. Dyn. Stat. Dyn. Stat. Dyn. Stat. Dyn. Stat. Dyn. Stat. Dyn.
4 Roof 1)15 1)1 1)45 1)4 1)25 1)2 2)0 1)95 1)15 1)0 2)0 1)55Base 0)9 0)9 1)0 1)0 1)0 1)1 1)3 1)4 0)85 0)85 1)0 0)95Avg. 0)99 1)01 1)24 1)17 1)12 1)15 1)64 1)67 0)99 0)93 1)51 1)24
12 Roof 1)25 1)35 1)75 1)7 1)6 1)6 2)25 2)15 1)6 1)2 2)65 1)75Base 1)0 1)05 1)25 1)35 1)1 1)2 1)5 1)7 1)0 1)0 1)25 1)3Avg. 1)13 1)20 1)45 1)51 1)35 1)41 1)87 1)93 1)30 1)09 1)96 1)53
3 Roof 0)6 0)8 0)8 1)0 0)8 0)9 1)2 1)05 0)75 0)85 1)05 1)65Base 1)2 1)0 1)3 1)3 0)9 1)3 1)3 1)8 0)9 0)65 1)1 0)9Avg. 0)87 0)91 1)10 1)12 0)85 1)11 1)26 1)42 0)82 0)74 1)07 1)29
All Roof 1)0 1)1 1)35 1)35 1)2 1)25 1)85 1)7 1)15 1)0 1)9 1)65Base 1)05 1)0 1)2 1)2 1)0 1)2 1)35 1)65 0)9 0)85 1)1 1)05Avg. 1)00 1)05 1)26 1)27 1)11 1)22 1)59 1)67 1)04 0)92 1)51 1)35
518T
.B.P
AN
AG
IOT
AK
OS
AN
DM
.N.F
AR
DIS
Copyrigh
t(
1999Jo
hn
Wiley
&Sons,L
td.
Earthquake
Engng.S
truct.Dyn.28,501
—528
(1999)

Figure 6. Mean$standard deviation range of inelastic-to-elastic ratio of interstorey and top drifts in individual four-storey buildings, with ‘full’ (F) or ‘zero’(0) slab participation to beam tension flange and with conventional (C) or relaxed (R) column capacity design. (Upper three or lower three ranges: X or
½ direction. Top or bottom range in the triplet: design motion x2 or x1; intermediate: x1)5)
DE
FO
RM
AT
ION
DE
MA
ND
SIN
MU
LT
IST
OR
EY
RC
FR
AM
EB
UIL
DIN
GS
519
Copyrigh
t(
1999Jo
hn
Wiley
&Sons,L
td.
Earthquake
Engng.S
truct.Dyn.28,501
—528
(1999)

Figure 7. Mean$standard deviation range of inelastic-to-elastic ratio of chord rotations in individual four-storey buildings, with either ‘full’ (F) or ‘zero’ (0)slab participation to beam tension flange and with conventional (C) or relaxed (R) column capacity design. (Upper three or lower three ranges: X or
Y direction. Top or bottom range in the triplet: design motion x2 or x1; intermediate: x1)5)
520T
.B.P
AN
AG
IOT
AK
OS
AN
DM
.N.F
AR
DIS
Copyrigh
t(
1999Jo
hn
Wiley
&Sons,L
td.
Earthquake
Engng.S
truct.Dyn.28,501
—528
(1999)
deformation demands is smaller there. The overall mean and the average upper characteristicvalue are about 1)0 and 1)5, respectively.
Representative examples of the more detailed variation of the results within a single buildingtype are presented in Figure 6 for the interstorey drifts and Figure 7 for chord rotations. Bothfigures refer to the four-storey structures and to multimodal response spectrum elastic analysis.They present separately the results for versions C0 (conventional capacity design and ‘zero’ slabcontribution to the beams) and RF (relaxed capacity design and ‘full’ slab contribution to beams)of buildings L15, M15, M30 and H30. Six m$p ranges are shown at each floor level instead ofthe one in Figures 4 and 5: the top three refer to horizontal direction X and the three at thebottom to ½. The bottom one of the three ranges refers to motion intensity 1)0x, the top to 2)0xand the middle one to 1)5x. The scatter in the individual plots in Figure 6 reflects only variabilitydue to the input motion (cf. the coefficient of variation of 7)5 per cent computed in Section 3.1 forthe scatter of the individual spectral values with respect to the target spectrum), whereas that inthe individual plots of Figure 7 reflects mainly member-to-member variability, which is essential-ly model uncertainty. It is clear from these two figures that there is no systematic effect of motionintensity, horizontal direction, or seismic design parameters (L15 v. M15, etc.) on the results.Figure 7 shows a small but persistent effect of the beam-to-column strength ratio, as reflected inthe extreme cases C0 and RF, but is opposite to what is expected. Cases C0 with the lowbeam—column strength ratio have lower inelastic-to-elastic chord rotation ratios in the beams, incomparison to cases RF which have higher beam—column strength ratio. The opposite isobserved in the columns. It seems that the elastic analysis tends to overpredict, on the basis ofmember stiffnesses, any concentration of inelasticity to the beams.
To give an idea of the order of magnitude of the deformation demands encountered in thecomputed non-linear response, Figure 8 presents the (average for the four input motions)interstorey drift ratios of the three DC H buildings subjected to an intensity of 2x the designmotion. These are the cases with the largest deformation demands. The building versions shownin Figure 8 correspond to full capacity design and full slab width (cases C and F). To get an idea ofthe member inelasticity implied by the values in Figure 8, it should be kept in mind thatinterstorey drift ratios are equal to the sum of the average chord rotation in the beams and thecolumns of the storey and that chord rotations at yield for RC frame members (including theeffect of bar slippage in the joints) range from 0)5 per cent to 1)5 per cent. It is noteworthy that themaximum discrepancy between elastic and inelastic chord rotation demands (Figures 4 and 5)occurs where these demands are the lowest, i.e. in the upper storeys.
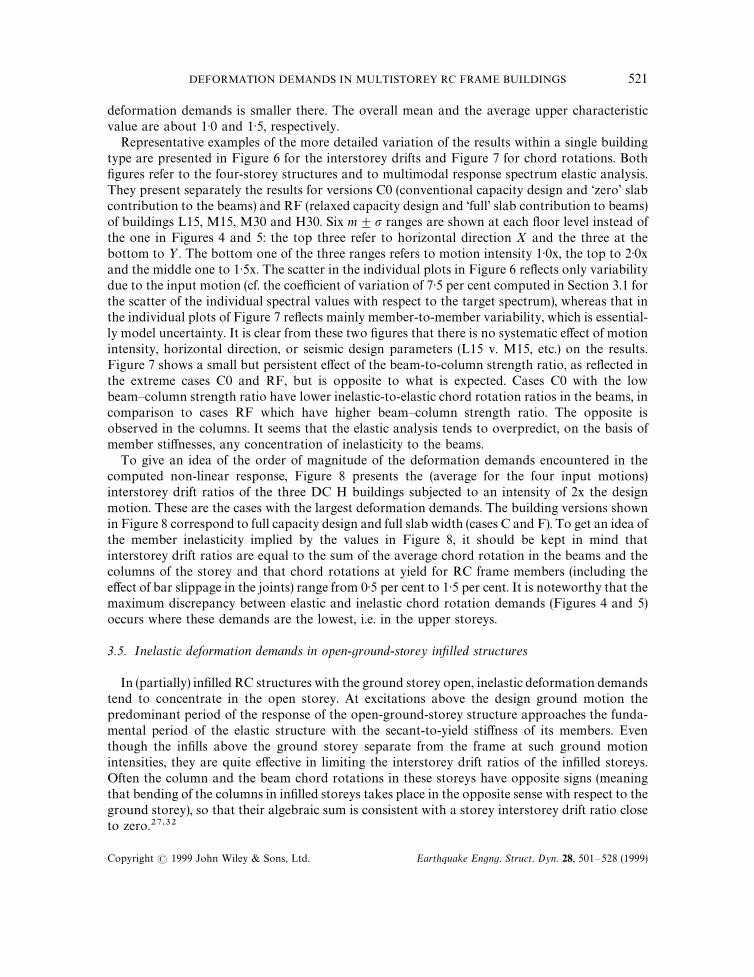
3.5. Inelastic deformation demands in open-ground-storey infilled structures
In (partially) infilled RC structures with the ground storey open, inelastic deformation demandstend to concentrate in the open storey. At excitations above the design ground motion thepredominant period of the response of the open-ground-storey structure approaches the funda-mental period of the elastic structure with the secant-to-yield stiffness of its members. Eventhough the infills above the ground storey separate from the frame at such ground motionintensities, they are quite effective in limiting the interstorey drift ratios of the infilled storeys.Often the column and the beam chord rotations in these storeys have opposite signs (meaningthat bending of the columns in infilled storeys takes place in the opposite sense with respect to theground storey), so that their algebraic sum is consistent with a storey interstorey drift ratio closeto zero.27,32
DEFORMATION DEMANDS IN MULTISTOREY RC FRAME BUILDINGS 521
Copyright ( 1999 John Wiley & Sons, Ltd. Earthquake Engng. Struct. Dyn. 28, 501—528 (1999)

Figure 8. Computed inelastic interstorey drift ratios for DCH buildings designed with full capacity design and full slabwidth (average for four motions at twice the design intensity)
522 T. B. PANAGIOTAKOS AND M. N. FARDIS
Copyright ( 1999 John Wiley & Sons, Ltd. Earthquake Engng. Struct. Dyn. 28, 501—528 (1999)

On the basis of these observations, the elastic model proposed herein for the estimation ofinelastic member deformation demands in open-ground-storey RC structures assumes that theelastic rigidity EI of all RC members is the secant-to-yielding in antisymmetric bending,EI"(M
:/h
:)¸/6, and considers the infills as rigid bidiagonal struts in the corresponding bays of
the frame. An attractive feature of such a model is that it does not require knowledge of in-situstrength or stiffness properties of the masonry and of the infill panels (for new structures suchproperties are difficult to estimate a-priori during design or to control during construction, whilefor existing structures they are hard to quantify through in-situ testing). The effect of theoverestimation of infill stiffness in the model is at least partly compensated by the use of thesecant-to-yield as the effective elastic rigidity of RC members. The assumption of rigid infills andelastic frame with secant-to-yield EI-value captures well the predominant period of the non-linearresponse and the drift and member deformation demands in the open ground storey. Theaccuracy of this model for the member inelastic deformation demands in the infilled storeys is notof much interest, as these members remain essentially elastic and any damage to them is morelikely to be due to local effects of the infills than to their own chord rotations demands.
For the rigid-infill elastic model and with the focus on the ground-storey deformations, highermode effects are not of interest and an equivalent static elastic analysis under lateral loads with aninverted triangular distribution suffices. The ratio of inelastic chord rotation demands in theopen-storey members to the corresponding chord rotations from the proposed elastic model andanalysis procedure are presented in Figure 9. No significant effect of the seismic design para-meters (L15, M15, M30 or H30) or of the horizontal direction were detected in the results, so theirinfluence is lumped together with that of the input excitation (the four synthetic motions) and ofthe member-to-member variability, into the mean $ standard deviation ranges, etc., of Figure 9.However, the effect motion intensity is considered worth showing separately, as often theinelastic-to-elastic chord-rotation ratio at 2x the design motion intensity (the top among the tworanges shown) is higher than at 1x the design motion (the bottom one of the two ranges) for theopen-storey columns and lower for the open-storey beams. Another factor with a significant effectis the design and not the open-storey elements for a concentration of demands in that storey.Upgrading the resistance of the beams of the first floor (Figure 9(b)) or of the columns of theground storey (Figure 9(b) and 9(c)) against such a concentration of demands, reduces theinelastic chord rotation in the upgraded elements relative to the elastic ones predicted by theproposed model.
Despite the fact that it represents the Eurocode 8, Part 1—3 approach, case (b) of Figure 9 is notexpected to be encountered often in practice. Case (a) is representative of existing buildings, inwhich the presence of infills above the ground storey has been neglected in the design of theopen-storey elements. Case (c), on the other hand, can be considered close to new buildings inwhich the designer takes reasonable measures to protect the open ground storey from unaccept-able concentration of damage. Table IV summarizes the results of Figure 9(a) and 9(c), aftereliminating the effect of motion intensity.
It is worth mentioning that, even at a motion intensity of 2x, the interstorey drift ratio in theopen ground storey is, on the average for the three cases (a)— (c), about the same as in the barestructure with RC elements proportioned as in case (a).27,32 It is reminded, though, that this driftratio is equal to the sum of the average chord rotations of the columns and beams of the groundstorey. As in the open ground storey the beam chord rotations are very small, for approximatelythe same interstorey drift ratio chord rotation demands in the open-storey columns are signifi-cantly larger than in the bare structure.
DEFORMATION DEMANDS IN MULTISTOREY RC FRAME BUILDINGS 523
Copyright ( 1999 John Wiley & Sons, Ltd. Earthquake Engng. Struct. Dyn. 28, 501—528 (1999)

Table IV. Inelastic-to-elastic chord rotation ratio in open-ground-storey elements (mean and 95 per cent-characteristic value)
No. of Beams Columnsstoreys Not-proportioned for open-storey effect Proportioned for open-storey effect
Mean 95 percent-characteristic Bottom Top Bottom Top
Mean 95 per cent-characteristic
Mean 95 per cent-characteristic
Mean 95 per cent-characteristic
Mean 95 per cent-characteristic
4 0.65 0.9 0.95 1.3 1.2 1.75 0.65 0.8 0.55 0.912 0.8 1.1 0.85 1.0 1.15 1.85 0.7 0.95 1.1 1.853 0.65 1.0 1.0 1.35 1.25 1.75 0.7 0.95 0.8 1.3
All 0.7 1.0 0.95 1.2 1.2 1.8 0.7 0.9 0.8 1.35
524T
.B.P
AN
AG
IOT
AK
OS
AN
DM
.N.F
AR
DIS
Copyrigh
t(
1999Jo
hn
Wiley
&Sons,L
td.
Earthquake
Engng.S
truct.Dyn.28,501
—528
(1999)

The other extreme case of an elastic analysis which is independent of the exact properties of theinfills is one in which the infills above the ground storey are neglected and the structure isconsidered as bare. The fundamental period and, with it, the spectral displacement representativeof the equivalent SDOF system increase in such a model, compared to those resulting from theelastic model with rigid infills. However, this larger global displacement is distributed to the otherstoreys more uniformly and deformations in the ground storey are underestimated. Detailedresults exhibit larger scatter and are on the average higher than those of Figure 9. Finalconversion factors, to be compared with those at the bottom line in Table IV, are closer to 1)0 forthe mean but significantly exceed 1)0 for the upper-characteristic value.
4. CONCLUSIONS
A simple linear-elastic analysis procedure has been developed for the estimation of the mean and95 per cent-characteristic values of inelastic chord rotation demands in the individual members ofmultistorey RC frame buildings. For bare structures a multimodal response spectrum elasticanalysis should preferably be used, although an equivalent static analysis under lateral loads withan inverted triangular distribution is acceptable. For partially infilled structures with the groundstorey open, the infills should be included in the elastic model as rigid bidiagonal struts. In bothcases the 5 per cent-elastic spectrum is employed and the elastic rigidities of RC members aretaken equal to their secant stiffness at yielding of both ends in antisymmetric bending, i.e. asEI"(M
:/h
:)¸/6. Conversion factors listed at the bottom of Tables III and IV can be used to
convert elastic chord rotation demands to mean or 95 per cent-characteristic values of inelasticchord rotations (see Figure 9). For bare structures linear interpolation between the conversionfactors for the base and the roof levels of the building can be applied. Conversion factors for themean value are around 1)0, while those for the upper-characteristic values are around 1)3 at thebase (including open ground storeys) and increase in bare structures to values around 1)75 at thetop, with a heightwise average value of about 1)5.
The present proposal is essentially a generalization and elaboration of the well-known equal-displacement rule of SDOF systems. Its success herein is due to the fact that the fundamentalperiod of the cracked elastic structures considered is indeed beyond the ‘corner’ or ‘predominant’period ¹
#of the input motion. As the vast majority of RC frame buildings are expected to have,
after extensive cracking, fundamental periods above the ‘predominant’ one of the ground motion,the present conclusions can be extended to the entire class of ordinary RC buildings, existing ornew. So these conclusions can be applied either for displacement-based design of new, or for thedisplacement-based assessment of existing buildings.
Although it has been developed on the basis of non-linear analyses of frame structures whichare completely regular and symmetric in plan and (with one exception out of three) very regular inelevation as well, the proposed procedure with the multimodal response spectrum analysis in 3Dis expected to be applicable to structures which are fairly irregular in elevation and/or in plan, atleast to the same extent as multimodal response spectrum analysis in 3D is considered applicablefor such structures for calculation of seismic internal forces for proportioning purposes. This is anadvantage of the proposed procedure over other alternatives based in part on a non-linear static(pushover) analysis, as this latter—unfamiliar to most practitioners—analysis procedure doesnot account for higher mode effects and its extension to torsionally unbalanced structures hasonly recently been attempted. The generality of the proposed procedure is also an advantage over
DEFORMATION DEMANDS IN MULTISTOREY RC FRAME BUILDINGS 525
Copyright ( 1999 John Wiley & Sons, Ltd. Earthquake Engng. Struct. Dyn. 28, 501—528 (1999)

Figure 9. Mean $ standard deviation range and 95 per cent-characteristic value of inelastic-to-elastic chord rotationratio in open storey of partially infilled buildings: with (a) open-storey members designed as in bare frame; (b) open-storeybeams and columns designed against soft-storey effect according to EC8; (c) open-storey columns designed for soft-storey
effect according to EC8
other alternatives which, at certain stages, employ conversion factors empirically fitted to theanalyses of specific structural configurations. (Herein the conversion factor for the mean value isessentially 1.0, while that for the upper characteristic is for—mainly model—uncertainties whichare not covered by alternative procedures.) A final advantage of the proposed procedure is that itgoes directly to member chord rotations, which are a most meaningful deformation measure forthe assessment or proportioning of RC members. The most serious disadvantage of the proposed
526 T. B. PANAGIOTAKOS AND M. N. FARDIS
Copyright ( 1999 John Wiley & Sons, Ltd. Earthquake Engng. Struct. Dyn. 28, 501—528 (1999)

procedure, namely its dependence on a-priori knowledge or estimation of member longitudinalreinforcement, is only apparent, as it is commonplace now that it is impossible to estimate withsome degree of accuracy displacement and deformation demands in RC structures on the basis ofcross-sectional dimensions alone, without some knowledge of the amount and distribution of thelongitudinal reinforcement.
ACKNOWLEDGEMENTS
This work was supported by Directorate General XII of the European Commission, undercontract No. ENV4-CT97-0548 (DG 12 - ESCY) of its ‘Environment’ program (‘NODISASTR’project) and contract No. FMRX-CT96-0022 (DG12-RSRF) of its TMR (Training and Mobilityof Researchers) program (‘ICONS’ Research Network).
REFERENCES
1. X. Qi and J. P. Moelhe, ‘Displacement design approach for reinforced concrete structures subjected to earthquakes’,EERC Report No. ºCB/EERC-91/02, Earthquake Engineering Research Center, University of California at Berkeley,CA, 1991.
2. J. P. Moehle, ‘Displacement-based design of R/C structures subjected to earthquakes’, Earthquake Spectra 8(3),403—428 (1992).
3. M. J. N. Priestley, ‘Myths and fallacies in earthquake engineering—conflicts between design and reality’, Proc. ¹.Paulay Symp. Recent Developments in ¸ateral Force ¹ransfer in Buildings, La Jolla, California, 1993.
4. J. W. Wallace, ‘New methodology for seismic design of R/C shear walls’, J. Struct. Engng. ASCE, 120(3), 863—884(1994).
5. G. M. Calvi and G. R. Kingsley, ‘Displacement based seismic design of multi-degree-of-freedom bridge structures’,Earthquake Engng. Struct. Dyn. 24, 1247—1266 (1995).
6. M. J. N. Priestley, ‘Displacement-based approaches to rational limit states design of new structures’, Closing Lecture,11th European Earthquake Engineering Conf., Paris, 1998.
7. M. N. Fardis and T. B. Panagiotakos, ‘Displacement-based design of RC buildings’, in P. Fajfar and H. Krawinkler(eds), Seismic Design Methodologies for the Next Generation of Codes, Balkema, Rotterdam, 1997, pp. 195—206.
8. T. B. Panagiotakos and M. N. Fardis, ‘Deformation-controlled seismic design of RC structures’, 11th European Conf.Earthquake Engineering, Paris, 1998.
9. M. J. N. Priestley, ‘Displacement-based seismic assessment of reinforced concrete buildings’, J. Earthquake Engng,1(1), 157—192 (1997).
10. M. N. Fardis, ‘Seismic assessment and retrofit of RC structures’, 11th European Conf. Earthquake Engineering, Paris,1998.
11. Applied Technology Council, ‘NEHRP Guidelines for the seismic rehabilitation of buildings’, FEMA Report No. 273,Washington, DC, 1997.
12. E. Miranda, ‘Evaluation of site-dependent inelastic seismic design spectra’, J. Struct. Engng. ASCE, 119(5), 1319—1338(1993).
13. E. Miranda, ‘Site-dependent strength reduction factors’, J. Struct. Engng. ASCE, 119(12), 3505—3519 (1993).14. N. Lam, J. Wilson and G. Hutchinson, ‘The ductility factor in the seismic design of buildings’, Earthquake Engng.
Struct. Dyn. 27, 749—769 (1998).15. J. Alonso, E. Miranda and P. Santa-Ana, ‘Inelastic displacement demands for structures built on soft soils’, Proc. 11th
¼orld Conf. on Earthquake Engineering, Paper No. 40, Acapulco, 1996.16. G. D. P. K. Seneviratna and H. Krawinkler, ‘Modifications of seismic demands for MDOF systems’, Proc. 11th ¼orld
Conf. on Earthquake Engineering, Paper No. 2129, Acapulco, 1996.17. E. Miranda, ‘Estimation of maximum interstorey drift demands in displacement-based design’, in P. Fajfar and H.
Krawinkler (eds), Proc. ¼orkshop on ‘Seismic Design Methodologies for the Next Generation of Codes’, Balkema,Rotterdam, 1997, pp. 253—264.
18. Applied Technology Council, ‘Seismic evaluation and retrofit of concrete buildings’, Report No. A¹C-40, RedwoodCity, CA, 1996.
19. Comite Europeen de Normalisation, European Pre-standard ENV 1998-1—3: ‘Eurocode 8—Design provisions forearthquake resistance of structures—Part 1—3: General rules—Specific rules for various materials and elements’,Bruxelles, November, 1994.
DEFORMATION DEMANDS IN MULTISTOREY RC FRAME BUILDINGS 527
Copyright ( 1999 John Wiley & Sons, Ltd. Earthquake Engng. Struct. Dyn. 28, 501—528 (1999)

20. T. B. Panagiotakos and M. N. Fardis, ‘Effect of column capacity design on earthquake response of reinforced concretebuildings’, J. Earthquake Engng, 2(1), 113—145 (1998).
21. T. B. Panagiotakos, ‘Displacement-based seismic design of RC buildings’, Doctoral ¹hesis, Department of CivilEngineering, University of Patras, Patras (in Greek), 1998.
22. Y. J. Park and A. M. S. Ang, ‘Mechanistic seismic damage model of reinforced concrete’, J. Struct. Engng. ASCE,111(4), 722—739 (1985).
23. Y. J. Park, A. M. S. Ang and Y. K. Wen, ‘Damage-limiting aseismic design of buildings’, Earthquake Spectra 3(1), 1—26(1987).
24. S. Otani, ‘Inelastic analysis of R/C frame structures’, J. Struct. Div. ASCE 100(ST7), 1433—1449 (1974).25. R. J. Mainstone, ‘On the stiffnesses and strengths of infilled frames’, Proc. Inst. Civil Engrs. iv, 7360s (1971).26. M. N. Fardis and T. B. Panagiotakos, ‘Hysteretic damping of reinforced concrete elements’, Proc. 11th ¼orld Conf. on
Earthquake Engineering, 1996, Paper P-5(464), Acapulco.27. M. N. Fardis, (Ed.) ‘Experimental and numerical investigation on the seismic response of RC infilled frames and
recommendations for code provisions’, ECOES¹/PREC8 Report No. 6, Laboratorio Nacional de Engenharia Civil,Lisbon, 199p., 1996.
28. A. K. Chopra, Dynamics of Structures, Prentice-Hall, New York, 1995.29. M. N. Fardis and T. B. Panagiotakos, ‘Seismic design and response of bare and masonry-infilled reinforced concrete
buildings. Part I: Bare structures’, J. Earthquake Engng. 1(1), 219—256 (1997).30. M. N. Fardis, S. N. Bousias, G. Franchioni and T. B. Panagiotakos, ‘Seismic response and design of RC structures
with plan-eccentric masonry infills’, Earthquake Engng. Struct. Dyn., 1999, to appear.31. S. N. Economou, M. N. Fardis and A. Harisis, ‘Linear elastic v non-linear dynamic seismic response analysis of RC
buildings’, in Moan et al. (eds.), EURODYN ’93, 2nd European Conf. on Structural Dynamics, ¹rondheim, Balkema,Rotterdam, pp. 1993, 63—70.
32. M. N. Fardis and T. B. Panagiotakos, ‘Seismic design and response of bare and masonry-infilled reinforced concretebuildings. Part II: Infilled structures’, J. Earthquake Engng. 1(3), 475—504 (1997).
528 T. B. PANAGIOTAKOS AND M. N. FARDIS
Copyright ( 1999 John Wiley & Sons, Ltd. Earthquake Engng. Struct. Dyn. 28, 501—528 (1999)