estimating the value of mobile telephony in mobile network not-spots
TRANSCRIPT

Estimating the value of mobile telephony in mobile network not-spotsHui Lu, Charlene Rohr, Peter Burge, Alison Grant
Estimating the value of mobile telephony in mobile network not-spots
Hui Lu, Charlene Rohr, Peter Burge, Alison Grant
Prepared for DEFRA

v
RAND Europe, in collaboration with Accent, was commissioned by the UK Department for Environment, Food & Rural Affairs (Defra) and The Department for Culture Media & Sport (DCMS) to estimate the social and economic impacts associated with the elimination of rural not-spot areas for residents and businesses in these areas and for tourists and other local visitors to these areas. At the core of the study is a survey conducted with people in these population groups. The survey questionnaire collected information on the characteristics of the respondents and their communication practices. It also included a stated preference discrete choice experiment in which respondents were asked to make choices between hypothetical mobile phone services, described by service characteristics and cost. From the data collected, discrete choice models were developed to quantify the importance of the mobile phone service characteristics and price. The outputs from these models were used to estimate the value respondents place on mobile phone services (their willingness to pay). Qualitative interviews were conducted with residents and local visitors to not-spot areas, providing further information on people’s mobile phone needs.
RAND Europe led the study, designed the choice experiments and the surveys, and developed the models to analyse the survey results. Accent undertook the qualitative research and managed the data collection. The study was conducted between August 2013 and March 2014.
This report describes the key aspects of the study: survey methodology, design of the choice experiments, model analysis and findings, and the qualitative research findings. It may be of use to policymakers or researchers who are interested in consumers’ willingness to pay for mobile phone services and the employment of stated preference discrete choice models and choice modelling methods.
RAND Europe is an independent not-for-profit policy research organisation that aims to improve policy- and decisionmaking in the public interest, through research and analysis. RAND Europe’s clients include European governments, institutions, NGOs and firms with a need for rigorous, independent, multidisciplinary analysis.
For more information about RAND Europe or this document, please contact:
Charlene Rohr RAND Europe Westbrook Centre, Milton Road Cambridge CB4 1YG, United Kingdom Tel. +44 (1223) 353 329 [email protected]
Preface
For more information on this publication, visit www.rand.org/t/rr641
Published by the RAND Corporation, Santa Monica, Calif., and Cambridge, UK
R® is a registered trademark.
© Crown Copyright 2014
RAND Europe is an independent, not-for-profit policy research organisation that aims to improve policy and decisionmaking in the public interest through research and analysis. RAND’s publications do not necessarily reflect the opinions of its research clients and sponsors.
All rights reserved. No part of this book may be reproduced in any form by any electronic or mechanical means (including photocopying, recording, or information storage and retrieval) without permission in writing from the sponsor.
Support RANDMake a tax-deductible charitable contribution at
www.rand.org/giving/contribute
www.rand.orgwww.randeurope.org

vii
Table of contents
Preface v
Table of Contents vii
Figures viii
Tables ix
Summary xiThe quality of the quantitative survey results is believed to be high xiiKey findings xiiiPolicy implications xvi
Acknowledgements xix
Abbreviations xxi
Chapter One. Introduction 1Policy background 2Objective of this research 5Structure of this report 5
Chapter Two. Our approach to measure the value of eliminating not-spots 7Valuation methodologies 8Designing the stated preference discrete choice experiments 9Survey methodology 15
Chapter Three. Qualitative research methodology and findings 23Qualitative research methodology 24Summary of findings from the qualitative research 26
Chapter Four. Findings from the quantitative research 31Survey sample characteristics 32Engagement in the choice experiment 40Model results and WTP valuations 45Findings from other key background questions 52
Chapter Five. Summary of findings 61Key Findings 62Policy implications 67Concluding remarks 68
References 71

ixviii Estimating The Value Of Mobile Telephony In Mobile Network Not-Spots
TablesFigures
Table 2.1: Summary of attributes and levels in the discrete choice experiment 11
Table 2.2: Background questions 14
Table 2.3: Respondent types 15
Table 2.4: Number of interviews by segment 16
Table 2.5: Distribution of premises within not-spot postcodes 18
Table 2.6: Urban-rural classification of not-spot postcodes 18
Table 3.1: Qualitative research sample: respondents’ life stages 25
Table 4.1: Sample size breakdown 32
Table 4.2: Distribution of main survey respondents by rurality code 33
Table 4.3: Distance from the house / business premise to the nearest house 35
Table 4.4: Self-reported access to communication devices, by segment 36
Table 4.5: Business mobile phone provision 37
Table 4.6: Resident’s and local visitor’s age distribution 37
Table 4.7: Residents’ and local visitors’ working status 38
Table 4.8: Influence of searching distances on choices 44
Table 4.9: WTP for a mobile phone signal at home/business, by distance saved, for all segments 47
Table 4.10: WTP for service type, by segment 48
Table 4.11: Willingness to pay for residents in not-spots for mobile phone services (£/month) 49
Table 4.12: Willingness to pay for local visitors to not-spots for mobile phone services (£/month) 50
Table 4.13: Willingness to pay for businesses in not-spots for mobile phone services (£/month/phone) 51
Figure 1.1: UK premises with 2G coverage (March 2014) 3
Figure 2.1: Example choice from the SPDCE 13
Figure 4.1: Survey respondents’ locations 34
Figure 4.2: Level of trading by each segment 41
Figure 4.3: Influence of price levels on choices 43
Figure 4.4: Mobile phone signal searching distance in current situation 53
Figure 4.5: Alternative communication methods in not-spot areas 54
Figure 4.6: Non-business segments reasons for needing a mobile phone 55
Figure 4.7: Businesses reasons for needing a mobile phone 55
Figure 4.8: Impact on businesses of being in a not-spot 56
Figure 4.9: Quantification of the negative impact of not-spots on businesses (in £ per month) 57
Figure 4.10: Attitudes towards mobile phones – residents, local visitors and tourists 58
Figure 4.11: Attitudes towards mobile phones – businesses 58
Figure 5.1: Average WTP for local 2G services, for same quality and improved quality services, by population segment (with 90% confidence intervals) 66
xix Estimating The Value Of Mobile Telephony In Mobile Network Not-Spots
Table 4.14: Willingness to pay for tourists to not-spots for mobile phone services (£/day) 51
Table 4.15: Responses to ‘No signal/reception on phone’ by segment 52
Table 4.16: Perceived importance of mobile phone services in not-spot areas and respondents’ stated satisfaction with the service provided 54
Table 5.1: WTP for local 2G services with the same quality as current mobile service alternatives, by distance saved for travelling to get current services, by population segment 65
Table 5.2: WTP for local 2G services with improved quality compared to current service alternatives, by distance saved for travelling to get current services, by population segment 66
Second-generation mobile coverage in the UK is high. Figures from the Ofcom 2013 Infrastructure Report1 show that 99.6 per cent of UK premises and 87 per cent of the UK land mass have 2G coverage for one or more operator. Despite this apparently high level of coverage, areas without signal, referred to as ‘not-spots’, remain. Moreover, despite substantial efforts by the government and regulators to enhance mobile coverage it is likely that not-spots will continue to persist, in particular in rural areas, to some degree. This research was commissioned to increase understanding of the range of costs and benefits to different population segments, arising from provision of mobile coverage in complete not-spot areas in rural locations within England.
A research approach was designed using a mix of qualitative and quantitative methods to provide an understanding and estimates of the value of providing mobile services in not-spots to residents and businesses located in these areas, and also local visitors and tourists to these areas. At the core of the project was a survey, containing a stated preference discrete choice experiment in which respondents were presented with a series of scenarios with two hypothetical mobile phone service options, described by three service characteristics:
• Access to mobile phone services, described by the distance (travel time) that the respondent would have to travel to get a signal2
• Strength of signal, described qualitatively as weak or strong
• Type of service: voice and basic data only (2G), voice and Internet data (3G) and voice and high-speed Internet data (4G).
Each service option also included a price associated with provision of the services. For residents, businesses and local visitors the price reflected the monthly cost that would have to be paid in addition to existing subscription fees to be able to receive mobile phone services. For visiting tourists, the prices were presented as the additional price per day that would have to be paid to obtain mobile phone services (similar to the idea of paying roaming charges for a short period, something that people are perhaps familiar with when travelling abroad). It is emphasised that the inclusion of price in the experiments was to gain an understanding of the value placed on coverage, and not to suggest that consumers are charged more, which would in any case be impractical.
From the data collected from the choice experiments, discrete choice models were developed to quantify the importance of the service characteristics and price in respondents’ choices, thus providing estimates of respondents’ willingness to pay (WTP) for provision of mobile phone services.
1 Ofcom (2013b).2 On the basis that the value of having a signal within the home or business may depend on the ease of getting the
current service.
Summary

xii Estimating The Value Of Mobile Telephony In Mobile Network Not-Spots xiii
We found that businesses located in not-spot regions were relatively small in scale and mostly in the agriculture and accommodation industries.
Caveats
We emphasise a couple of caveats to the study findings. First, even with careful design stated preference experiments may over-estimate willingness-to-pay valuations, and this should be considered when quantifying the benefits of proposed schemes. Second, the qualitative research is based on a small sample of in-depth interviews, and as a result the findings from this component of the study should be treated with some caution. Finally, the valuations are relevant for those who live, work and travel to not-spot areas and cannot be used to calculate the value to society as whole for the elimination of all not-spot areas.
Key findingsBelow we summarise the key findings from the study, starting with general observations and culminating in presentation of the willingness-to-pay valuations for provision of mobile services in not-spot areas.
Most people living in not-spot areas own mobile phones
Despite living in rural areas without mobile phone reception, the majority of respondents in the survey owned a mobile telephone (over 97 per cent of residents and local visitors to not-spot areas owned a mobile phone for personal use). A slightly lower percentage of those who ran businesses from home owned mobile phones, but the figures were still high, with ownership levels over 85 per cent.
The main reason for owning a personal mobile telephone appears to be for peace of mind, to offer the possibility of communicating with others should the need arise, which is most relevant when plans change or problems occur. Respondents in the qualitative research said that even though they were not always able to use their mobile phones (because of a lack of signal), they felt it was worth owning one to at least have the possibility of doing so, on the occasions when they were able to obtain a signal.
Somewhat surprisingly, mobile phone ownership was much lower for respondents from the business sample: about half indicated that they had a mobile phone for personal use, and between 35 and 40 per cent had a mobile phone for business purposes. We found no significant relationship between mobile phone ownership and usage and the scale of business or type of industry. However, we did observe that the businesses in the survey tended to be located in more remote areas compared to residents and local visitors, as measured by the average distance to the next house, which may have an impact on mobile phone ownership.
More than two-thirds of residents of local visitors and 80 per cent of businesses felt that it was important to be able to make and receive mobile phone calls. About a third of residents and local visitors thought it was important to be able to get Internet services on their phone; far more business respondents (48 per cent) and tourists (42 per cent) thought that this was important.
Qualitative research, through in-depth interviews, was also conducted with residents in not-spot areas and local visitors to these areas to provide more detailed information on people’s mobile phone needs in not-spot areas.
Below we discuss key aspects of the methodology followed by discussion of the key findings from the study.
The quality of the quantitative survey results is believed to be highWe believe the quality of the results to be high, because of the robustness of the survey sample and level of engagement of respondents in the stated preference discrete choice experiments.
A robust sampling method was employed, providing a description of those living in not-spot areas
The sampling method employed provided an accurate picture of residents and businesses in not-spot areas, and local visitors and tourists to these areas. In total over 700 interviews were collected.
Residents and local visitors were sampled from a database of not-spot areas provided by the Department for Culture, Media & Sport (DCMS). The resulting survey responses were geographically diverse, reflecting a wide range of not-spot areas as well as rurality types, closely matching the distribution in the DCMS database.
However, we found that the sample of residents contained a much higher proportion of 60–74 year olds than is observed in the 2011 Census for England for rural hamlets or spare settings (and a lower number of young people under 25 years of age). Both the resident and local visitor samples also contained higher proportions of retired people, although the proportion of employed people among local visitors was very close to the 2011 Census data for rural hamlet or sparse settings. In addition, the proportions of self-employed residents and local visitors (20 per cent) were close to that expected for remote areas.
We see two possible explanations for the higher proportion of older and retired people in the resident sample: either older people were more likely to participate in the survey and therefore were over-represented or else more elderly people live in the particular not-spot locations that were sampled for the survey than in rural locations in general. With regard to the first possibility, substantial effort was made to reduce potential sampling bias caused by the telephone interviewing method (by calling during evenings and weekends as well as during the day, and undertaking multiple call-backs to try to maximise response from households where no answer was received at first contact). Moreover, the fact that both the resident and local visitor samples were obtained in the same way and that this characteristic is not present in the local visitors’ sample suggests that older or retired people may well be more likely to live in not-spot areas. This hypothesis is evidenced to some degree by the qualitative work where we found indications that young people were reluctant to live in not-spot areas and tended to move away, although it is emphasised that the sample sizes from the qualitative research are very small. However, if the sample is biased towards older people then the resulting valuations will be underestimated (because we find that older people provide lower valuations for some aspects of mobile phone services), but this impact will not be large.

xiv Estimating The Value Of Mobile Telephony In Mobile Network Not-Spots xv
and control over contactability, the overall advantages of improved connectivity were felt to outweigh any disadvantage.
The potential visual impact of additional mobile phone masts was not a major concern
The reaction to the potential arrival of telephone masts in the local area was fairly muted. While some regard telephone masts as an eyesore it was more typically believed that masts would be constructed and placed in the community in a sympathetic manner in keeping with the local area and to blend in rather than stand out. Should this happen then respondents would be more likely to accept it. Consultation with local residents about the physical location of telephone masts would also be important.
People who live and work in, and travel to, not-spot areas are willing to pay for provision of mobile services
Our study found that respondents in all segments were willing to pay for local mobile phone services. Residents and businesses in not-spot areas were willing to pay the highest amounts for having a signal at their house or business premises; local visitors and tourists were willing to pay less for services in the not-spot areas they travelled to. Perhaps this is not surprising, since people living or working on a daily basis within not-spots may be most affected by not having mobile phone coverage.
In general, our research shows that willingness to pay for services is influenced by a number of factors that will vary between different not-spot areas, and should be taken into account in quantifying the benefits of local services.
One key factor influencing WTP is proximity of access to a mobile signal. Specifically, we found that the further that people had to travel to get a signal, the greater their willingness to pay for local services. This suggests that people in more remote or cut-off areas are therefore likely to be willing to pay more for the provision of mobile services.
The WTP valuations also depend on the quality of the signal. It is suggested that higher value can be placed on providing connectivity with high signal quality compared to low signal quality.
We find WTP valuations to be influenced by the type of service available, with some respondents willing to pay more for 3G and 4G services. Somewhat unexpectedly, we did not find 4G services to be valued more highly than 3G services, except for tourists aged less than 45 years. This may be because most people have not yet experienced 4G services and have yet to see the value of such services. Thus we would expect these valuations to change if people start to experience the benefits of 4G, and perhaps 3G services, and would recommend that WTP valuations be revisited periodically.
We find that the average willingness to pay for residents in not-spot areas for local 2G services of the same quality of those available nearby is £12/month (+/- £4.103). It
3 All confidence limits for these results are given at the 90% level of confidence.
Among both residents and businesses, a key reason for having a mobile phone is to deal with emergencies
The most important reason cited by resident and local visitor survey participants for owning a mobile phone was for dealing with potential emergencies – with almost 80 per cent of residents stating this to be the case, alongside over 60 per cent of local visitors. This was also one of the most important reasons cited by businesses, with over 60 per cent of large businesses and 50 per cent of small businesses reporting that ownership of mobile phones was important to manage the safety of staff.
Improved mobile phone services would benefit local businesses
Despite the lower proportion of mobile phone ownership in our business sample, a substantial proportion of business respondents saw being located in a not-spot area as a drawback. For large businesses this arose from the inability to communicate effectively with colleagues or suppliers/business partners and the lack of flexibility in decisionmaking. For smaller businesses, key issues were hindrances in building contacts, contacting suppliers/business partners, and loss of profit.
About half of the respondents from both large and small businesses indicated that being located in a not-spot area had a negative impact on their profit, turnover and productivity. However, respondents found it difficult to estimate the size of this impact. Of those who were able to make an estimate (47 per cent of businesses and 41 per cent of home-run businesses), almost 65 per cent reported losses between £100/month and £250/month. The remaining 35 per cent reported monthly losses in excess of this value, with 1 per cent (large businesses) indicating monthly losses greater than £50,000/month. It is observed that there seems to be a relationship between the size of the impact and the size of the businesses, with larger impacts being reported by larger businesses.
Lack of mobile services may affect the long-term sustainability of rural communities
Although respondents felt that the benefits of rural life outweigh the disadvantages, including lack of mobile services, some felt it was unfair that their areas were being left behind as telecommunications technology advances. There was some evidence from the qualitative research that, for some younger people, rural areas without a mobile signal are less desirable to live in. Those who said they had less need for mobile phone reception were most likely to be middle aged and older respondents who had grown up without relying on a mobile telephone and felt content to live without a reliable signal.
Almost all respondents who participated in the qualitative research felt that having improved mobile telephone reception in their area would be positive for the whole community. For some there was a perception that those who would benefit most were businesses and younger people. For others having a reliable mobile telephone signal would mean less wasted time, reduced anxiety about being out of contact when needed, and enhanced flexibility in how they spend their day. The provision of a mobile phone signal also would have additional benefits for those seeking employment, in terms of enhanced communication, as well as reduced costs for those who did not wish to finance both a landline and a mobile phone. Though a few respondents could see positive aspects to a lack of mobile signal, to do with privacy

xvi Estimating The Value Of Mobile Telephony In Mobile Network Not-Spots xvii
is emphasised that this is in addition to the amount that they would pay for a service contract. If the quality of signal is improved, relative to a weak signal nearby, residents would be willing to pay £23.40/month (+/- £5.10). The value of mobile phone services for local visitors to not-spot areas is £6.30/month (+/- £3.80), for the same quality of service, and £15.10/month (+/- £4.10), for improved services. The values for businesses are £20.90/phone/month (+/- £11.50) and £24.50/phone/month (+/- £14.00), for the same or improved services, respectively. We found that the values for tourists over 65 years old are higher than for those under 65, with tourists over 65 being willing to pay 40 pence per day (+/- £0.35) and those under 65 being willing to pay 20 pence per day (+/- £0.10) for mobile services of the same quality at their tourist destination, and £3.00/day (+/- £0.80) and £2.70 per day (+/- £0.70) for improved services, by age category respectively.
Policy implicationsThe willingness-to-pay valuations obtained from this study help us to understand the value that residents and businesses located in not-spot areas, and local visitors and tourists to these areas place on being able to access a mobile service locally. They can be used to help quantify the social benefits of programmes aimed at providing or improving signal strength (quality) in not-spot areas. These benefits can then be compared to the costs of these investments to provide an assessment of the overall value of these investments. Environmental costs, including the visual impact of masts, should also be taken into account, although these were not quantified in our research. However, evidence from the small in-depth samples of this study suggest that the visual impact of phone masts was not a major concern to local residents in not-spot areas and local visitors, this is an area where further research is required.
We present 90% confidence intervals for the estimates, and we recommend that sensitivity tests are undertaken when comparing the WTP benefits with costs, using the lower-bound values.
Finally, we also found some evidence, from the qualitative research, that young people find rural areas without a mobile phone signal less desirable to live in. This might suggest that the provision of mobile phone coverage may influence the future structure and sustainability of communities affected by not-spots. The impact of availability of mobile services on the structure of the economy may also be an important factor. This study found that even though local businesses had lower mobile phone ownership than not-spot residents, they too were willing to pay for local mobile phone services (£20.90/phone/month for 2G services of the same quality as current services and £24.50/phone/month for 2G services with improved signal quality). The study has not directly examined the extent to which availability of mobile services might affect both business performance and the types of businesses which can operate in remote and rural areas. However, this is potentially significant, and it is proposed that the availability of mobile services could be an important factor in the diversity of rural economies, and long-term sustainability of rural communities. This is an area that could both be further investigated in future research, and be monitored as a possible impact of new and improved mobile infrastructure services (such as 4G deployment, or resulting from the Government’s £150million investment in the Mobile Infrastructure Project).
THE
OB
JEC
TIVE
S O
F TH
IS S
TUD
YTh
e ob
ject
ive
of th
e m
obile
pho
ne n
ot-s
pots
stu
dy is
to e
stim
ate
the
soci
al a
nd e
cono
mic
impa
cts
asso
ciat
ed w
ith e
limin
atin
g m
obile
no
t-spo
t are
as.
OU
R S
TUD
YO
ur s
tudy
aim
s to
pro
vide
an
estim
ate
of th
e va
lue
of m
obile
tele
phon
y in
mob
ile n
etw
ork
not-s
pots
.
CO
NC
LUSI
ON
S
In th
is s
tudy
the
soci
al a
nd e
cono
mic
impa
cts
asso
ciat
ed w
ith e
limin
atin
g m
obile
not
-spo
t are
as a
re e
xam
ined
usi
ng a
mix
of q
ualit
ativ
e an
d qu
antit
ativ
e m
etho
ds, i
nclu
ding
a s
urve
y in
corp
orat
ing
a st
ated
pre
fere
nce
disc
rete
cho
ice
expe
rimen
t. A
high
-qua
lity
repr
esen
tativ
e sa
mpl
e of
resp
onse
s is
col
lect
ed, w
hich
form
s th
e ba
sis
for t
he c
hoic
e m
odel
ling
anal
ysis
. The
resu
lting
mod
els
quan
tify
the
valu
e th
at re
side
nts
and
busi
ness
es in
not
-spo
t are
as a
nd lo
cal v
isito
rs a
nd to
uris
ts to
not
-spo
t are
as a
re w
illin
g to
pay
for m
obile
pho
ne c
over
age.
We
find
that
in
divi
dual
s ar
e w
illin
g to
pay
to re
duce
the
dist
ance
s th
at th
ey h
ave
to tr
avel
to o
btai
n m
obile
pho
ne c
over
age,
and
that
they
are
will
ing
to p
ay
for a
hig
h-qu
ality
and
relia
ble
sign
al. T
hese
ben
efits
can
then
be
com
pare
d to
the
cost
s of
pro
vidi
ng th
ese
serv
ices
to p
rovi
de a
n as
sess
men
t of
the
soci
al b
enefi
t of t
hese
inve
stm
ents
. We
did
not fi
nd s
ubst
antia
l evi
denc
e fo
r will
ingn
ess
to p
ay fo
r bet
ter s
ervi
ces
(3G
/4G
), al
thou
gh th
is
may
em
erge
as
thes
e se
rvic
es b
ecom
e m
ore
mai
nstre
am. M
oreo
ver,
not-s
pots
wer
e fo
und
to h
ave
a ne
gativ
e im
pact
on
loca
l bus
ines
ses
loca
ted
in th
ese
area
s an
d m
ay im
pact
the
long
-term
sus
tain
abili
ty o
f rur
al c
omm
uniti
es.
OU
R E
VID
ENC
E(S
ee m
ain
text
fo
r det
ails
)
The
maj
ority
of
peop
le li
ving
in
not-s
pot a
reas
ow
n m
obile
pho
nes:
• O
ver 9
7% o
f re
side
nts,
loca
l vi
sito
rs a
nd to
uris
ts
have
mob
ile
phon
es.
• B
usin
esse
s in
th
e sa
mpl
e ar
e le
ss li
kely
to h
ave
a m
obile
pho
ne
than
oth
er g
roup
s sa
mpl
ed.
Peo
ple
who
live
and
w
ork
in n
ot-s
pot a
reas
ar
e w
illin
g to
pay
for
loca
l mob
ile s
ervi
ces:
•
The
furth
er th
ey
have
to tr
avel
to g
et
a si
gnal
, the
mor
e th
ey a
re w
illin
g to
pa
y.•
They
are
will
ing
to
pay
for a
stro
ng
sign
al, t
here
fore
gi
ving
a g
ood
serv
ice.
A ke
y re
ason
for
havi
ng a
mob
ile
phon
e fo
r bot
h re
side
nts
and
busi
ness
es is
to d
eal
with
em
erge
ncie
s:•
80%
of r
esid
ents
&
loca
l vis
itors
sta
te
this
to b
e th
e ca
se.
• A
s w
ell a
s ov
er
half
of b
usin
esse
s,
who
se c
once
rn w
as
heal
th a
nd s
afet
y of
st
aff.
Impr
oved
mob
ile
phon
e se
rvic
es
wou
ld b
enefi
t loc
al
busi
ness
es:
• M
ost b
usin
esse
s sa
id b
eing
loca
ted
in a
not
-spo
t had
a
nega
tive
impa
ct o
n pr
ofit &
pro
duct
ivity
.•
Alth
ough
they
fo
und
this
har
d to
qua
ntify
in th
e su
rvey
.
The
lack
of a
mob
ile
phon
e si
gnal
may
af
fect
the
long
-term
su
stai
nabi
lity
of ru
ral
com
mun
ities
:•
Impa
ctin
g th
e pr
ofita
bilit
y an
d di
vers
ity o
f loc
al
busi
ness
es a
nd ru
ral
econ
omie
s.•
Pote
ntia
lly im
pact
ing
the
mak
e-up
of t
hese
ar
eas,
as
youn
g pe
ople
may
cho
ose
not t
o liv
e in
not
-spo
ts.
Qua
ntita
tive
surv
ey: w
ith a
dis
cret
e ch
oice
exp
erim
ent
embe
dded
in th
e su
rvey
, to
quan
tify
the
valu
e of
elim
inat
ing
not-
spot
s to
key
pop
ulat
ion
segm
ents
.
Qua
litat
ive
rese
arch
: to
gain
insi
ghts
into
som
e of
the
not-s
pot-
rela
ted
issu
es a
nd to
und
erst
and
the
soci
al a
nd c
omm
unity
be
nefit
s th
at m
ay a
rise
as a
resu
lt of
impr
oved
mob
ile
conn
ectiv
ity.
OU
R R
ESEA
RC
H
MET
HO
DO
LOG
Y

xix
We would like to acknowledge the input of the many people who have contributed to this study. The valuable advice from the project Steering Group helped to improve the quality of the survey and the study. We are also grateful to Jonathan Cave and Salil Gunashekar from RAND Europe for their very insightful suggestions and comments on an earlier draft of this report during the quality assurance process. However, we emphasise that any errors or omissions herein remain the responsibility of project team.
Acknowledgements

xxi
2G/3G/4G
Second-, third- and fourth-generation wireless telecommunication technology. Each successive generation can support greater speed compared to the previous generation:• 2G includes voice services and data services such as text, picture and
multimedia messages• 3G enables wireless voice telephony, mobile Internet access, fixed wireless
Internet access, video calls and mobile TV• 4G enables amended mobile web access, IP telephony, gaming services,
high-definition mobile TV, video conferencing, 3D television and cloud computing
CATI Computer-assisted telephone interviewing
CI Confidence interval
CV Contingent valuation
DCE Discrete choice experiments
DCMS Department for Culture, Media & Sport
MIP Mobile Infrastructure Project
MNO Mobile network operator
RP Revealed preference
SE Standard error
SP Stated preference
SPDCE Stated preference discrete choice experiment
VoIP Voice over Internet Protocol
WTP Willingness to pay
Abbreviations

Chapter One.Introduction

2 Estimating The Value Of Mobile Telephony In Mobile Network Not-Spots 3
Figure 1.1: UK premises with 2G coverage (March 2014) SOURCE: http://maps.ofcom.org.uk/mobile-services/
1.1 Policy backgroundOver the past decade mobile phone usage has increased, accompanied by a rise in the number of mobile-only households.4 A recent Ofcom report shows that household take-up of mobile phones now stands at 94 per cent and exceeds fixed telephony, which has fallen from 91 per cent take-up in 2005 to 84 per cent in 2013. Thus some 15 per cent of UK adults now live in mobile-only homes. Amongst businesses, mobile usage (measured in call minutes) has now overtaken that of fixed lines.5 Allied to this, development of ‘smart’ phones with new capabilities, and broader cultural changes, has meant mobile access is often regarded by users as a necessity rather than a premium service. In this context, the UK government has recognised the value of mobile network connectivity and effective use of mobile services has become part of the wider digital inclusion agenda.
In general, 2G (voice and basic data) mobile coverage is high in the UK. Figures from the Ofcom 2013 Infrastructure Report6 show that 99.6 per cent of UK premises and 87 per cent of the UK land mass have 2G coverage. But areas without coverage, referred to as ‘not-spots’, persist. Research has suggested that in a number of cases it has not been a commercial priority for mobile operators to extend their coverage to these areas, due to low forecast levels of traffic discouraging investment.7 Furthermore, planning and technical issues have been barriers to mobile network deployment. Mobile network not-spots are often highly localised and they generally, though not exclusively, affect geographically isolated rural communities.8
Figure 1.1 opposite shows the latest estimates of levels of outdoor mobile coverage by administrative authority. A 2013 Department for Culture, Media & Sport (DCMS) publication indicates that there are approximately 80,000 premises in not-spot locations,9 affecting around 3 per cent of the population of the UK.
The impacts of being in a mobile network not-spot are varied, ranging from the inconvenience of a missed call, to loss of business opportunities for rural enterprises, to limiting immediate access to emergency responses. Lack of mobile phone connectivity thus affects different aspects of life, but the impact is most acutely felt in particularly isolated rural communities and by those rural businesses that require a degree of mobility for their activities.10
The need for better mobile network connectivity can also be set in the wider public debate concerning the importance of investment in communications infrastructure.11 This debate is taking place across Europe,12 and is a key policy issue for the UK government and local authorities. There has been much recent focus within the UK on the availability of high-speed services such as superfast broadband or deployment of 4G broadband networks
4 Ofcom (2010).5 Ofcom (2013a).6 Ofcom (2013b).7 PA Consulting Group (2010).8 Ofcom (2012).9 HM Government (2013a).10 Illuminas (2010).11 Ofcom (2013b).12 See, for example, European Commission (2014).
80% – less than 90%
60% – less than 80%
Less than 60%
90% – less than 95%
95% or more

4 Estimating The Value Of Mobile Telephony In Mobile Network Not-Spots 5
of Defra’s commitment to grow the rural economy, that further research has been commissioned to understand the range of costs and benefits to different groups, and society as a whole, from the provision of mobile coverage in complete not-spots in rural locations within England. This research project therefore seeks new insights into the value placed by citizens on the provision of mobile telephony services in mobile network not-spots.
1.2 Objective of this researchThe key objective of this research is to estimate the social and economic impacts associated with the elimination of rural mobile not-spot areas.
We have designed a research approach using a mix of qualitative and quantitative methods to estimate the value of providing mobile telephony in not-spot areas. We believe that this approach is both desirable, and necessary, to provide evidence on:
• The value to residents and businesses of obtaining coverage on existing networks
• The benefits to tourists and other visitors who visit current not-spot areas
• The value to individuals regarding ability to respond to emergencies
• Improvements to business productivity and/or profitability
• Social or community benefits resulting from improved mobile connectivity.
1.3 Structure of this reportThis report is structured as follows: Chapter 2 describes our approach to measuring the value of eliminating not-spots; Chapter 3 presents findings from the qualitative research; and Chapter 4 focuses on findings from the quantitative research. The concluding Chapter 5 summarises the key findings from the study as a whole, and includes a discussion of caveats and policy implications. Technical appendices, containing frequency tables from the quantitative survey and the detailed choice model results are published as a separate document, as is the detailed report summarising the findings from the qualitative research.
– with the Government expecting that competition is driving the fastest 4G network rollout in Europe. Meanwhile it should also be recognised that apparently high levels of 2G coverage in the UK may disguise the fact that a lack of universal mobile connectivity remains a serious issue for those living in, or visiting, not-spot areas.
Ofcom has commissioned a range of reports on the nature of the mobile not-spot problem and the reasons not-spots exist, as well as qualitative research across the UK to understand the impacts of not-spot areas.13 This emerging body of work has identified five distinct types of problem – complete not-spots (no coverage at all and the focus of this research), 3G not-spots (no mobile broadband coverage), partial (operator-specific) not-spots, interrupted coverage on the move, and indoor coverage.3 To tackle the issue there has been a concerted effort from government to map not-spots, to understand the impacts not-spots have on different communities and to enhance mobile network coverage.
To date, government and regulator efforts to enhance coverage have focused on a range of approaches. Firstly, the government has pledged £150m to improve mobile coverage and remove mobile not-spots, in what is known as the Mobile Infrastructure Project (MIP). This is intended to improve mobile phone coverage through the building of additional mobile phone masts in uncovered areas, whilst ensuring that technical solutions are compatible with future technological developments. The first of these masts went live in mid-September 2013, when services were provided to 200 premises in Weaverthorpe in North Yorkshire, in what was previously a complete not-spot. This marked the start of the MIP programme, which will see hundreds of communities benefit across the country.14
Secondly, the MIP programme and mobile infrastructure deployment generally has benefited from changes to the planning laws in place since August 2013. A streamlined planning process now supports rural mobile connectivity through faster deployment of 4G whilst providing additional capacity and connectivity for 2G and 3G.
Thirdly, Ofcom has, and continues to look at areas where provision of further information may help consumers (and which also helps promote effective competition by better facilitating consumer choices). Ofcom provides information on how consumers can maximise their mobile coverage, and it is currently exploring whether there is a need for more information. It should also be noted that there are a number of third parties who now also publish useful information. Such remedies have to be seen in the context of wider regulatory and market developments, such as the introduction of a 4G coverage obligation which applies to O2 to provide 98% 4G indoor population coverage by 2017), and network sharing agreements within the industry.
Finally it should also be noted that the Government has been working with the rail industry to significantly improve mobile coverage for rail passengers. The rail industry are delivering a five-year project which will focus on key routes covering about 70% of the travelling public, with the first route expected to be ‘live’ by the end of 2014.
Despite these various measures to improve coverage it is likely that some complete not-spots will persist in isolated rural areas. It is in this context, and against the backdrop
13 Illuminas (2010).14 See HM Government (2013c).

Chapter Two.Our approach to measure the value of eliminating not-spots

8 Estimating The Value Of Mobile Telephony In Mobile Network Not-Spots 9
Box 2.1: Using stated preferences for quantifying the value of service characteristics
Within the stated preference discrete choice experiments (SPDCE) framework, it is possible to investigate and quantify the importance of specific drivers of consumers’ choices (for example, how much they are willing to pay for mobile phone services).
In an SPDCE, hypothetical choice situations – in which each alternative is described by a set of attributes (for example, quality of mobile phone services, cost of these services, etc.) – are presented to each individual. Each of the attributes in the experiment is described by a number of levels. The attribute levels are combined using principles of experimental design to define different service packages, which respondents evaluate in surveys by choosing one of the alternatives within the choice set. When cost is included as an attribute, as in this study, values can be provided for each characteristic in terms of ‘willingness to pay’, which provides a quantification of the user benefits.
Stated preference data have many useful statistical properties. For example, because the researcher controls the choices that are presented to respondents, correlation between explanatory variables, such as quality and price, can be reduced or limited. Also, a greater range of explanatory variables can be tested, which may not be possible in the real world. For example, we were able to test a wider range of costs than might be provided by technical solutions available to people who live in not-spot areas. The technique is also data efficient: more than one choice scenario can be presented to each respondent within one interview. Its main drawback, however, is that such data are based around what individuals say they would do in hypothetical situations, not real world choices. Thus the results may be subject to the criticism that they may overestimate willingness-to-pay benefits because individuals do not actually have to make real payments. Careful design, ensuring that realistic choices are offered to respondents, can help reduce such biases.
The UK Treasury recommends the use of SPDCEs for valuing public sector services.
The choice experiments formed part of a broader questionnaire, undertaken with residents and businesses located in not-spot areas and local visitors and tourists who had travelled to not-spot areas. The questionnaire also collected information on respondents’ general communication needs, their use of mobile phones, their attitudes to mobile phones, and their personal characteristics. Business respondents were also asked questions about their use of mobile phones and the impact of coverage on their productivity.
2.2 Designing the stated preference discrete choice experiments The choice experiments were designed to explore respondents’ WTP for a mobile signal in not-spot areas. At the most basic level, respondents could have been given one option of paying for a mobile signal versus one where the not-spot remains, with the cost associated with the service provision being varied across different scenarios to identify the point at which they judged that the benefits of the service outweighed the costs. However, in order to improve the realism of the choice experiments, and because WTP is likely to depend on the quality of the services provided, it was considered to be important to include service quality attributes explicitly in the choice experiments. A number of issues were identified in defining these service quality attributes, and these are discussed below.
Our approach to estimate the value of eliminating not-spots includes a mix of qualitative and quantitative methods to cover the range of research questions identified in Chapter 1. At the core of the methodology is a discrete choice experiment to quantify the value of eliminating not-spots for key population groups. The resulting information is supplemented with other background information collected in a survey and with qualitative research conducted with key population groups impacted by not-spots. The details of the methodology including the design of the choice experiments are described in this chapter.
2.1 Valuation methodologies The HM Treasury Green Book recognises a number of different approaches for the valuation of non-market goods.15 Mobile signal provision is such a good: while consumers pay for mobile phone services, they do not pay for the provision of the signal directly. Moreover, there is no market for these goods in not-spot areas, because providing these services is not commercially viable. As a consequence, demand from people living in not-spot areas cannot be revealed except indirectly, and we cannot directly observe consumes’ willingness to pay for them. In such cases, preferred valuation methods rely on estimates of people’s ‘willingness to pay’ (WTP) for a new good or service, inferred from their behaviour in a similar or related market. WTP is the amount individuals would be willing to pay for a good or service.
The market-based approaches consist of revealed preference (RP) or stated preference (SP) methods. Revealed preference approaches infer WTP from observed market choices, for example how much people are observed to pay for other products, such as femtocell products16 to obtain mobile phone services in a not-spot. Stated preference approaches describe a hypothetical choice in a hypothetical market to infer WTP. Two approaches generally used under the banner of stated preference approaches are contingent valuation (CV) methods and discrete choice experiments (DCE). CV studies elicit WTP via direct questions such as ‘What is the maximum amount you would be willing to pay for mobile phone services in your home location?’ DCEs elicit values by presenting respondents with a series of alternatives and then asking which is most preferred.
For this study, the use of stated preference discrete choice experiments (SPDCEs) was recommended for two reasons. Firstly, SPDCEs allow us to value different levels of mobile phone service provision, for example 2G, 3G and 4G services, which would be more awkward using CV approaches. Secondly, the construct of a choice experiment is less open to manipulation by respondents, and may therefore produce less-biased estimates of WTP than CV methods.
Box 2.1 sets out the key characteristics of SPDCEs.
15 See HM Government (2014).16 Femtocell is a low-power cellular base station providing enhanced domestic mobile coverage indoors.

10 Estimating The Value Of Mobile Telephony In Mobile Network Not-Spots 11
Having a signal as a call maker is only one half of the issue. A call will not be connected through to the intended recipient, should they also happen to be using a mobile device, unless they also have a signal. We felt that it was beyond the capability of a simple choice experiment to incorporate information on whether an individuals’ usual contacts will have a signal or not (particularly those beyond the ‘local area’). Thus we have presented information on the strength of the signal for the individual, and also asked direct questions about whether individual respondents considered themselves to be predominantly a caller or receiver of mobile communications.
Finally, our focus is on quantifying the value of mobile service provision to individuals within not-spot areas. It is beyond the scope of this study to consider how individuals outside not-spots (who are not local visitors or tourists to the not-spot area) would value the provision of services in a not-spot area (for example if they were trying to contact someone who lived in the area by mobile).
The three attributes used to describe the quality of the hypothetical mobile service alternatives and the levels for each of these attributes are presented in the first three rows of Table 2.1, i.e. ‘Distance to get mobile signal’, ‘Quality’ and ‘Services’. In the next section we will discuss the presentation of prices for provision of a mobile signal to individuals. These are also summarised in the last row of Table 2.1.
Table 2.1: Summary of attributes and levels in the discrete choice experiment
Attributes and levels
Dis
tanc
e to
get
mob
ile p
hone
sig
nal
There are parts of your local area that do not have a mobile phone signal. On average, you and others in the area need to travel 5 miles or more (more than 60 minutes walking or 15 minutes driving each way) to get a signal to make or receive calls.There are parts of your local area that do not have a mobile phone signal. On average, you and others in the area need to travel 1 mile (around 25 minutes walking or 5 minutes driving each way) to get a signal to make or receive calls.There are parts of your local area that do not have a mobile phone signal. On average, you and others in the area need to travel 1/2 mile (around 15 minutes walking each way) to get a signal to make or receive calls.There are parts of your local area that do not have a mobile phone signal. On average, you and others in the area need to travel 1/4 mile (around 8 minutes walking each way) to get a signal to make or receive calls.There are parts of your local area that do not have a mobile phone signal. On average, you and others in the area have to go outside the building, approximately 2 minutes walking, to get a signal to make or receive calls.There is a mobile phone signal in your local area, and people can make and receive phone calls and texts anywhere in the local area.
Qua
lity Weak signal, with occasional loss of service
Strong signal
Serv
ices
You can make and receive calls and send texts, but do not have access to Internet services (voice-only 2G)
You can make and receive calls and send texts, and get Internet access (Voice and data – 2G and 3G)
You can make and receive calls and texts, and have access to FAST Internet access, allowing you to watch TV, films, etc. (Voice and high-speed data – 2G and 4G)
Pric
es
Price/month (residents, visitors (and home-run businesses who are visitors)): £50, £30, £20, £10, £5, £0
Price/month (small businesses/resident home-run businesses): £80, £50, £35, £20, £10, £0
Price/month (large businesses): £150, £80, £50, £25, £10, £0
Price/day (tourists): £10, £7, £5, £2, £1, £0
2.2.1 Incorporating service quality in the experiments
First, it was judged that the quality of the signal could be a concern for some respondents, and therefore that signal quality should be explicitly incorporated in the experiments. Thus the choice alternatives were described by a signal quality attribute including two levels: a weak signal, with occasional loss of service, and a strong signal.
In designing the experiments we also considered how to describe the geographical scope of the improved signal. While one option would be to focus on delivering an improved signal to one discrete named location (e.g. the respondent’s home or their place of work), given the nature of mobile services it was considered that the realism of the choice experiments (and the related valuation) would be improved if it were possible to explain the impact of any service improvements on the individual’s wider pattern of mobile phone usage. This could, for example, be based on the ability to communicate with others in the local region covered by the not-spot. Thus the experiments focused on mobile phone signal provision for what the respondents were asked to conceive as their ‘local area’.
The value of having a signal within the home or business could also depend on the ease of getting that service; specifically, people who have to travel a longer distance to get a signal may value the provision of a signal in their local area more highly. Therefore, the attribute describing the presence of a mobile phone signal reflects a range of options, described by the distance (with travel time used as a proxy for this measure) that an individual would have to travel to get the signal. Levels were set describing how far an individual would have to travel to get a signal, for example having to walk 20 minutes, 10 minutes, 2 to 5 minutes or having a signal in their home/business (see Table 2.1 for the specific levels considered in the experiment). Respondents were asked to consider the average distance that individuals in the ‘local area’ would have to travel to get a signal. This meant that all distance levels could be tested with all individuals, maximising the information extracted from the relatively small sample size. While this may have reduced the realism of the choices for some, the object of the exercise was to estimate the average value to individuals in a not-spot area of improving mobile coverage there. Additionally, it was stressed that the average distance travelled was for all people in the local area, not just for the respondent.
However, it was also emphasised to respondents that they should concentrate on the value of the mobile phone service for themselves or their business only, and not try to estimate the value others in the local area might put on it (to avoid double-counting.)
Another quality issue was around the type of the service that would be provided. Given that the expected market demand in not-spot areas has thus far failed to initiate commercial provision of services, it remains uncertain whether operators would freely make market-based decisions to provide such services. This could include perhaps, the provision of high-speed data services on masts provided through the government’s £150m MIP. It was judged that it would therefore be informative to investigate the extent to which WTP for service provision is contingent upon the level of services provided. We therefore included an explicit attribute to describe the type of services that would be obtained, whether voice and basic data only (2G), voice and data (3G), or voice and high-speed data (4G).
A further complicating aspect is the fact that individuals both make and receive calls.

12 Estimating The Value Of Mobile Telephony In Mobile Network Not-Spots 13
significant is that respondents may focus primarily on the stark choice of something against nothing, and ignore some of the more subtle detail within the choices, particularly the quality of service, which is a key aspect of the valuation. Moreover, this approach could attribute high values to doing ‘something’ but relatively low values to ‘how much’ was done. Another concern is that the ‘status quo’ option may be very different across respondents; for example some people will only have to walk a short distance to get a signal, while others will have access to voice only, and still others to voice and data. Hence, the valuation given by a respondent to a service level in the choice experiment would depend on that individual’s particular circumstances. However, the sample sizes in our study were too small to be able to examine specific influences that might vary across individuals and therefore we wanted respondents to consider explicitly each condition in order to obtain valuations for each.
An ‘unlabelled’ (within-product) experiment presents two alternatives, each described explicitly by the varying quality and price levels. Thus, respondent’s choices and WTP are described only by the attributes that are presented. Moreover, in an ‘unlabelled’ experiment the attributes can be defined to ensure that all respondents are asked to value the same service levels (not relative to their own existing situation, for example). However, this approach forces respondents to make a choice between alternatives, neither of which may be acceptable. Thus it is important to include a ‘neither’ option.
Given the above arguments, and the objective of producing WTP estimates, we judged that an ‘unlabelled’ design was best.
An example of the choice presentation for a respondent is shown below (Figure 2.1).
Service Quality where signal is
availableStrong signal Weak signal, with occasional loss of
service
Mobile phone Service where
signal is available
You can make and receive calls and texts, and get internet access (Voice
and data - 2G and 3G)
You can make and receive calls and send texts, but do not have access to
internet services (voice only 2G)
Payment for mobile phone
services (on top of the mobile
phone service charges)
Extra £50 per month No extra cost
Mobile phone coverage
There is a mobile phone signal in the parts of the local area that you are visiting or travelling through, and
people can make and receive phone calls anywhere in the local area
There are parts of the local area you are visiting or travelling through that do not have mobile phone signal. On average, you and others in the area need to travel 1/2 mile (around 15
minutes walking each way) to get a signal to make or receive calls.
OPTION A OPTION B
I would choose: Option A Option B Neither
Figure 2.1: Example choice from the SPDCE
2.2.2 Incorporating service prices in the experiment
In order to elicit WTP, it was necessary to include a price component in the experiments. It is emphasised that the inclusion of price in the experiments was simply to facilitate computation of willingness to pay and that it would be impractical for Mobile Network Operators to charge more in rural not-spot areas. Consideration was given to how best to do this, given that consumers of mobile services do not pay directly to be provided with a mobile signal, and that instead they make payments to receive a mobile service.
In the business case for the MIP, WTP assumptions are based on the additional monthly price that individuals would be willing to pay for mobile services. Currently, these are approximated by the additional travel costs individuals incur to access mobile phone services, or more specifically the average time spent walking per month multiplied by assumed values of time (£5/hour; the value of leisure time from the Transport Projects Guidance Webtag17). For consistency, we proposed to measure WTP in terms of an additional monthly price on top of current subscription fees. For respondents classified for the purposes of this research as residents,18 who did not have a mobile phone, we provided information on the average subscription prices for having a mobile phone (£15/month19).
For those classified as tourists, we presented the price on the basis of an additional cost per day, which is likely to be more realistic to tourists, and is conceptually similar to the idea of paying roaming charges for a short period when travelling.
As part of the pilot survey, undertaken prior to the main survey to test and refine the proposed experimental design, we tested a variety of price levels in order to ensure that we covered a wide range of possible values of WTP. We also tested a zero price level to avoid introducing bias, and to provide scenarios where individuals could indicate that they were not willing to pay. In analysing the pilot survey data, we examined the stated choices that respondents made at different price levels, and as a result reduced the highest price levels tested for the main survey. A detailed description of the pilot analysis can be found in Section 2.3.5. The final price levels used in the main survey are presented in Table 2.1.
2.2.3 Presentation of choices to survey respondents
Choice experiments can generally be considered as ‘labelled’ (choosing between labelled or named options, e.g. bus versus train) or ‘unlabelled’ (e.g. option A versus option B). These are sometimes described as ‘between-product’ or ‘within-product’ experiments.
A ‘labelled’ (between-product) experiment is in many ways simpler to design. One of the alternatives could be held constant as retaining the status quo (at no cost), whilst the other could be described as an improved offering, for which the level of service and associated cost may be varied. This most realistically reflects the making of consumer choices in the real world, though it does have some technical complications. The most
17 See HM Government (2013d).18 See Section 2.3.1 for a discussion of the population groups used in the survey.19 The real price of a basket of mobile phone services, based on average use in 2012 (in 2012 prices), was £14.10
(Ofcom 2013a).

14 Estimating The Value Of Mobile Telephony In Mobile Network Not-Spots 15
The questionnaire was structured so that the respondents were asked about their mobile phone use, their experience of not-spots, and their strategies for dealing with these prior to participating in the choice experiments. This helped to introduce the context of the task, and also placed the respondent in a situation where they were thinking about mobile phone use when they were presented with the choice scenarios. As a result, it is hoped that the valuations obtained are more considered than those that would be obtained by asking individuals about these issues cold.
2.3 Survey methodology
2.3.1 Key segments and sample sizes
The survey was undertaken with four key population segments affected by not-spot areas in England: (i) residents and (ii) businesses whose homes and premises were in not-spot areas; (iii) ‘local visitors’, i.e. those who live near, but not in the not-spot area, and who may be affected by the not-spots; and (iv) tourists and out-of-area visitors making journeys to not-spot areas. The specific definitions for each of these segments are provided in Table 2.3 below.
Table 2.3: Respondent types
Segment Detail about respondent
Residents Homes are located within not-spot areas in EnglandCannot obtain a mobile network signal when inside their home (self-reported)May run a business from home
Sub-segments: • Residents – respondent does not run a business from the home• Home-run businesses – respondent runs a business from the home
Businesses Business premises are located within not-spot areas in EnglandCannot obtain a mobile network signal when inside business premises (self-reported)
Sub-segments: • Small businesses (4 or fewer full- or part-time staff)• Large businesses (5 or more full- or part-time staff)
Local visitors Live near, but not in, a not-spot area in EnglandRegularly/occasionally travels through or visits places in their local area where there is no mobile phone signal Can obtain a mobile network signal when inside their home (self-reported)May run a business from home
Sub-segments: • Local visitors – respondent does not run a business from the home• Local visitors business – respondent runs a business from the home
Tourists/out-of-area visitors
Have travelled to a not-spot area in England, outside of their local area, within the past 12 months either for business or leisure purposesCan obtain a mobile network signal when inside their home (self-reported)
A total of 712 interviews were conducted amongst the four key population groups. The target and achieved number of interviews for each segment are shown in Table 2.4 overleaf. For all segments, we exceeded the target number of interviews.
We emphasise that this is an example choice scenario only and that the attribute levels were varied across the eight choice scenarios presented to each individual according to an underlying experimental design. The design describing the attribute levels used for each of the choice options in a choice scenario was specified to be orthogonal,20 with orthogonal blocking to split the number of scenarios into blocks for presentation to different respondents. This ensured that each respondent was presented with choices with variation in each of the attributes. Each respondent was asked to consider eight different choice scenarios, and nine different blocks were used, resulting in 72 different combinations of attribute levels being considered across the sample.21
2.2.4 Other components of the questionnaire
In addition to the choice experiments, the questionnaire contained a series of background questions, as shown in Table 2.2, in order to provide a greater understanding of the communication needs of residents and businesses, local visitors and tourists in not-spot areas, as well as to support the analysis of WTP for elimination of not-spots.
Table 2.2: Background questions
Types of question Detailed questions
Demographic data AgeGenderEmployment/working statusHousehold structure, including presence of childrenHousehold incomeLength of residenceCar ownership
Business information Size of business (employees and turnover)Number of employees with mobile phonesType of business
Tourist data Did the respondent know/plan to visit a not-spot areaLength of stayImportance of being contactable
Telephony alternatives Mobile phone ownership/usageComputer/Skype ownership/usageBroadband/Wi-Fi ownership/usageLandline ownership/usage (not relevant to tourists)Femtocell/Sure signal/O2 ownership/usage (not relevant to tourists)
Not-spots How far people travel to get a signalKey concerns regarding not-spotsStrategies for dealing with not-spotsImpacts on productivity, for businesses
Attitudes Mobile phone usage and coverage
20 In orthogonal experiment design, the difference in levels of each attribute varies independently over choice sets, indi-cating that the levels of the attributes are independent of each other. For more details, refer to Louviere et al (2000)
21 The same design was used for residents, businesses, local tourists and visitors. However, the levels of attributes for each segment are different.

16 Estimating The Value Of Mobile Telephony In Mobile Network Not-Spots 17
respondent group, and then sent the show material for the choice exercise by post or email. Recruits were then re-contacted by phone to continue with the survey.
Efforts were made to reduce the sampling bias potentially caused by the telephone interviewing method (which might over-represent older and unemployed residents), by calling during evenings and weekends as well as during the day and undertaking multiple call-backs to maximise the response from households where no answer was received at first contact.
An online survey was used to target tourists who in the past year had made a leisure and/or business trip outside their local area to a not-spot area. These respondents completed and submitted the questionnaire online.
2.3.3 Sampling methodology for the CATI surveys
A database of not-spot areas, for which no mobile phone signal was predicted to be available, was provided by DCMS. The database detailed coordinates that marked the bottom-left hand corner of 200 x 200-m squares across the UK where there are premises, but none of the 2G operators predicts a signal strength of -86dBm or more. Each record also specified the estimated number of properties in each square. The database comprised 9,396 records covering approximately 39,000 properties.
In order to use this database to target households in and near not-spots the following steps were followed:
• The coordinates of the not-spot locations were converted into postcodes
• A list was built of addresses falling into these postcodes and phone numbers were attached to these addresses.
The list of households produced by this means does not exactly match the properties in the not-spots for two reasons: (i) since postcodes do not align with national grid references, the postcodes are not exactly mapped to the locations and only approximate the location of the 200m x 200m square, and (ii) since all addresses in the postcode were included in the list, if the whole postcode does not lie within a not-spot some properties on the list may be outside the not-spot.
Screening was therefore used to make sure respondents were within the scope of the research. Households were contacted by telephone and screening questions were asked to determine whether they were either unable to obtain a mobile signal inside their home (residents) or able to receive a mobile signal inside their home but regularly/occasionally travel through or visit places in their local area where there is no mobile phone signal (local visitors).
3,681 unique postcodes were generated from the database, with many not-spot locations associated with the same postcode. The distribution of properties across the postcodes is uneven. As shown in Table 2.5, approximately half of the postcodes were found to contain four or more not-spot premises (which we categorised as ‘more dense’ postcodes) and contained the majority of not-spot premises, while the remaining half of the postcodes (which we categorised as ‘less dense’) contained only 8 per cent of premises in total.
Table 2.4: Number of interviews by segment
Segment Target number of interviews Achieved interviews
Residents in not-spot areas 300 302Businesses in not-spot areas 100 102
Local visitors to not-spot areas 150 153Tourists and out-of-area visitors
to not-spot areas 150 155
Total 700 712
Both residents and business respondents who did not own a mobile phone were included in the survey, on the basis that their decision not to have one may have been influenced by the lack of a signal in their local area. In the choice experiments, respondents without a mobile phone could select an option to pay for a certain level of service rather than continue without a mobile phone.
Residents who ran businesses from home were incorporated in the resident and local visitor samples. In the pilot survey, these were treated as business users, because we expected these respondents to value mobile phone services similarly to other business users. However, during the pilot survey we found that with this approach, overall employment levels in the resident sample were very low. It appears that self-employment and working from home (or being based at home) are both more common in rural areas than urban areas, and thus that respondents who run their own business from home also account for a significant proportion of rural workers. A recent Office for National Statistics (ONS) report provides evidence of this, indicating that nearly 20 per cent of people in employment in rural areas work from home or run a business from home, rising to 25 per cent for both categories amongst people who live in sparsely populated areas.22 Thus, for the main surveys we decided to include respondents who ran businesses from their home in the resident and local visitor samples, to ensure that these samples appropriately reflected employment levels in rural areas. In the resident and local visitor samples, 66 of 302 individual resident surveys (22 per cent), and 33 of the 120 local visitors (28 per cent), were sole traders. These figures are broadly consistent with national figures reported by the ONS.
It should also be noted that the tourist sample included people travelling for both business and leisure purposes.
2.3.2 Survey methodology
Computer-assisted telephone interviewing (CATI) was used to target households and businesses residing in not-spot areas and local visitors to these areas. Telephone interviewing is a very efficient means of interviewing such geographically disparate population of households and businesses across England.
As a part of the CATI approach, a phone-post/email-phone method was adopted whereby respondents were contacted by phone, recruited and assigned to the appropriate
22 Pateman (2011).

18 Estimating The Value Of Mobile Telephony In Mobile Network Not-Spots 19
Quotas were not applied due to lack of information regarding the demographic characteristics of those residing in or near not-spot areas. Instead, random sampling was adopted to obtain a sample of households representative of the demographic characteristics of people found within not-spot areas. We adopted a methodology based on selecting households at random from the sample list, and then selecting an adult within each household by asking to speak to the adult in the household whose birthday was next. By this means we aimed to be able to randomly select the respondent in each household.
Businesses were randomly selected from the list and, once contacted, screened to ensure they were within the scope of the research (being unable to receive a mobile phone signal at their business premises). For businesses, the target respondent was the person within the company or organisation responsible for making decisions about procurement of telecommunications for the company – in this case the critical factor being purchase of mobile phone services.
2.3.4 Sampling methodology for the online surveys
Accent’s commercial panel partner, Toluna, provided the sample for the survey of tourists, which was done online. A sample of panellists, representative of the UK population in terms of region, age and gender, was sent a link to the online survey and, if in scope, completed and submitted it online. The target respondents were those panellists who in the past year had made a trip outside of their local area, either for leisure or business purposes, to a place in England where there was no mobile signal. Other panellists other were excluded.
2.3.5 Piloting of the surveys
A pilot survey of 90 interviews was conducted involving 30 households and 30 businesses located in not-spot areas as well as 30 local visitors. Similarly, the online survey was soft launched with 30 tourists. The purpose of the pilot was to test the design of the questionnaire and respondents’ understanding of the choice experiment task. Piloting the choice experiments allowed initial models to be developed and the effectiveness of the experiments to be assessed. The pilot also provided an opportunity to test the sampling approach, recruitment method, hit rate, routing, flow and clarity of the questionnaire.
The key findings from the pilot surveys were:
• In general the survey worked as intended, producing a dataset that allowed estimation of discrete choice models to quantify the relative importance of mobile phone monthly payments, network access, quality of signal and type of mobile phone services in not-spot areas.
• A number of sampling approaches were tested, and it was found that the procedure that sampled from (‘more dense’) postcodes with more not-spot premises resulted in a sample of respondents with a similar distribution across rurality codes as the other approaches that were tested, but it was much more efficient at targeting residents in not-spots areas.
• Employment levels for local residents were found to be very low, because of the initial treatment of sole traders (then allocated to the business segments).
Table 2.5: Distribution of premises within not-spot postcodes
Presumed number of not-spot premises in postcode % of total unique postcodes % of total premises in database
1 21.9% 2.1%2 15.7% 3.0%3 9.7% 2.8%
4 or more 52.7% 92.2%Base: total number of unique postcodes within database = 3,681; total number of premises within database = 39,186.
To reduce the required screening of residents and to ensure efficient sampling, the sample was limited to the ‘more dense’ postcodes that were likely to contain more not-spot premises. It should be noted that a ‘less dense’ location may not necessarily be in a more rural location than a ‘more dense’ location, as it may, for example, be located on the edge of a village immediately adjacent to a ‘more dense’ location. As we were concerned initially about the possibility of introducing bias in the sampling methodology, we sought to identify whether excluding the ‘less dense’ postcodes would skew the results in any way. To check whether this would be the case, we compared the urban-rural mix23 (using ONS data) of the not-spot properties in the entire list with those on the ‘more dense’ list. From this it was found that the distribution of properties in the ‘more dense’ sample was similar to that of the entire list (see Table 2.6 below). It was therefore concluded from the pilot surveys (see Section 2.3.5 for details) that excluding the ‘less dense’ postcodes should not significantly affect the type of property sampled or skew the sample.
Table 2.6: Urban-rural classification of not-spot postcodes
Urban-rural code of postcodes % not-spot properties – ‘more dense’ postcodes only
% not-spot properties – all postcodes
C1: Urban city and town 0.2% 0.2%D1: Rural town and fringe 4.8% 4.4%
D2: Rural town and fringe in a sparse setting 1.0% 0.9%E1: Rural village 39.9% 38.0%
E2: Rural village in a sparse setting 10.5% 10.0%F1: Hamlet and isolated dwelling 27.9% 29.9%
F2: Hamlet and isolated dwelling in a sparse setting 15.6% 16.4%Base: total number of premises within database = 39,186. Please note that totals may not equal 100 per cent due to rounding.
Lists of phone numbers from the selected postcodes were provided by ADMAR, a company providing list building services. For targeting businesses, a commercially available list was purchased. For residential addresses, the Experian Consumer View database was used to identify names and addresses within the postcodes. Phone numbers were then appended using OSIS (Operator Service Information System), a comprehensive and accurate central telephone number database managed by BT that aggregates telephone number information from all Communication Providers.
23 See: http://www.ons.gov.uk/ons/guide-method/geography/products/area-classifications/rural-urban-definition-and-la/rural-urban-definition--england-and-wales-/index.html

20 Estimating The Value Of Mobile Telephony In Mobile Network Not-Spots
• In terms of the design of the choice experiments, we found that the majority of respondents understood and engaged in the exercises; however, a significant minority of business respondents chose the ‘neither’ alternative in each scenario. Furthermore, a larger number of respondents than would have ideally been the case (approximately 40 per cent) indicated that they felt that the choice experiments were unrealistic.
These findings led to a number of recommendations and changes that were put into effect for the main survey:
• We sampled from the ‘more dense’ post codes, randomly sampling households and businesses within these locations and screening to ensure they are within the scope of the study.
• Sole traders were included in the local resident (and visitor) segments to ensure that employment levels were adequately reflected for these population segments.
• To improve respondents’ engagement with the survey questions, two amendments to the experiments were made for the main survey: (i) the highest price levels for business respondents and tourists were reduced, and (ii) the highest distance levels for service access (and included walking time equivalents for all distances) were reduced. The introductions and text in the choice exercises were amended to emphasise to all respondents that the distances to mobile services were averages across the not-spot region.
The findings from the main survey are presented in Chapter 4.

Chapter Three.Qualitative research
methodology and findings

24 Estimating The Value Of Mobile Telephony In Mobile Network Not-Spots 25
Table 3.1: Qualitative research sample: respondents’ life stages
Life stage Number of interviews
Older / no children 5Older families 4
Teen 4Older single 3
Young single 4Young families 4
Total 24
3.1.1 Topic Guide
The topic guide developed for the qualitative interview covered the following:
• Respondent background
• Mobile signal
• Mobile phone use
• Coping without a signal
• Benefits of being connected to the mobile network
• Behaviour change if mobile connection improved
• Concerns about improving mobile connection.
The guide was reviewed and approved by Defra and the study steering group prior to use.
3.1.2 Qualitative research methodology
Twenty-four in-depth telephone interviews were conducted with residents who live in not-spot areas and local visitors. The interviews were conducted between 21 October and 7 November 2013. They were designed to take 45 minutes and all respondents were provided with an incentive of £20 to thank them for their participation in this research.
All interviews were audio recorded and transcripts were made to aid analysis. All interviewers also made top-line notes as soon as possible after each interview, and the interviewers were brought together in a virtual workshop to assist in identifying emerging findings.
This chapter sets out the methodology and key findings from qualitative research undertaken with residents in not-spots and local visitors to those areas.
Qualitative research aims to gather in-depth information on attitudes, experiences and reasons for decisions. It is typically conducted using a smaller number of interviews than in a quantitative survey and the sample is not necessarily representative. It uses discursive techniques rather than a formal questionnaire. It results in narrative, descriptive data rather than numerical data. Qualitative research does not, therefore, support the reporting of formal counts or percentages.
This research is intended to complement the quantitative research, specifically by providing a context for the quantitative choice experiment results presented in Chapter 4, as well as examining the broader benefits of improved mobile connectivity. It is emphasised, however, that these findings are based on a sample of 24 respondents and therefore the results should be treated with caution.
3.1 Qualitative research methodology The primary objective of the qualitative research was to gain insight into impacts upon people who experience not-spots and to understand the social and community benefits of improved mobile connectivity. More specifically, the objectives were to:
• Establish the impact of living in or near a not-spot on residents, local visitors and businesses
• Establish the strategies people employ when they do not have access to reliable mobile services.
A sub-sample of respondents for the qualitative survey was recruited by telephone from the same list developed for the quantitative survey (see Chapter 2). This part of the research focused on residents and local visitors only. All respondents recruited, lived or worked in an area with no mobile network coverage or regularly travelled through or visited such areas.
The recruitment aimed to ensure coverage of a range of life stages (including teens, young singles, young families, older families, older singles and retired/empty nesters) and genders. Additionally, we sought to include those with mobile phones and those without, in order to explore their experience of living with limited or no mobile signal, or indeed without a mobile telephone. However it quickly became apparent that the majority of people even in not-spots have a mobile phone, so the requirement to obtain a mix was dropped.
Table 3.1 gives a breakdown of the interviews conducted by respondents’ life stage.

26 Estimating The Value Of Mobile Telephony In Mobile Network Not-Spots 27
could not be sure of using their mobile phones if an emergency arose, such as a car accident or breakdown. There were a variety of financial impacts noted by respondents linked to the lack of a consistent mobile telephone signal including the need to pay for a landline as well as a mobile telephone, in order to ensure communication at all times; several respondents said they would not have a landline if reliable mobile phone signals were available.
3.2.4 The lack of mobile phone signal may affect the long-term sustainability of rural communities
There was some (limited) evidence that, for some younger people, rural areas without a mobile signal are less desirable to live in; some respondents, for example, said that young people moved away from not-spots to parts of the village or area where there was a signal. Most of those who said they had less need for mobile phone reception were middle-aged and older respondents who had grown up without relying on this technology and felt content to live without a reliable signal.
3.2.5 Additional difficulties relating to the provision of other services in rural areas exacerbates problems
There were additional difficulties mentioned of living in a rural area, which included having a poor radio signal, a poor television signal, poor transport links, intermittent electricity supply and a poor or intermittent Internet supply. In terms of priorities for improvement, for older respondents, the lack of strong and consistent Internet and radio signals was regarded as being more problematic than the lack of a reliable mobile telephone signal. Younger people typically placed an equally high priority on a better mobile telephone signal and either a speedier broadband connection or better transport connectivity if they were still reliant on parents for lifts.
3.2.6 Alternative means of communication help respondents to manage without a mobile phone signal
Skype, Facebook, texting and WhatsApp were commonly mentioned as alternative communication mechanisms by respondents of all ages. Alternative strategies for older respondents typically included using the landline or the Internet, whilst younger respondent predominantly used Internet-based methods. Several young people mentioned that they rarely knew friends’ landline numbers and tended to feel less comfortable contacting their friends by landline unless they also knew the parents well. Some households had purchased, or been given by a mobile telephone provider, additional equipment to boost the mobile signal in their home in order to help improve reception. However, the results of such additional technology were mixed.
3.2.7 The majority of respondents felt that having improved mobile phone reception would be positive for their community
Almost all respondents felt that having improved mobile telephone reception in their area would be a positive thing for the whole community. Some felt there was a perception that those who would benefit most were businesses and younger people. For others, having a reliable mobile telephone signal would mean less wasted time, reduced anxiety about
3.2 Summary of findings from the qualitative researchBelow we provide a summary of the findings from the qualitative research.24
3.2.1 Most people from not-spot areas owned mobile phones
Despite their living (and some also working) in a rural area with a limited or non-existent mobile reception, the majority of respondents (all but two in the sample) still owned a mobile telephone. Respondents said the main reason for owning a mobile phone was to be able to communicate with others when the need arises, which is most relevant when plans change or problems occur. Even though they were not always able to do this due to lack of signal, most respondents said it was worth owning a phone to at least have the possibility of doing so, on the occasions when they were able to obtain a signal. For example, a few respondents mentioned that when children go to secondary school they get a mobile telephone so that they can (hopefully) stay in contact with parents and friends while travelling. Another reason cited for mobile phone ownership was to support relationships. For example, several respondents spoke of friends and family members living far away, and using their mobile telephone to help them keep in contact, irrespective of where they are throughout the day. Younger people more typically cited using their mobile phone for sending text messages, whilst older people said they used it for both sending text messages and holding conversations.
3.2.2 Patchy and unreliable mobile signals were a cause of major frustration
All respondents had patchy and unreliable mobile phone signals in their home and also in the wider local area. Most were aware of where they could and could not get a reliable mobile telephone signal. Several respondents spoke of the need to leave their home in order to make calls, send texts or access their accumulated messages. Some were able to get a mobile phone signal at their home but it was unpredictable and transient – ‘here one minute and gone the next’. For some this unreliable signal could be even more of a frustration than not having one at all, since it was not possible to rely upon it working. Yet many respondents exhibited a pragmatic acceptance that in their area this is the price they must pay for living where they do; it may not be how it should be but they have learned to live with it.
3.2.3 The lack of mobile phone signal can affect individuals’ ability to use time effectively, their feelings of safety and social connectedness, and their finances
A lack of mobile phone signal has a number of impacts upon individuals living in and around not-spots. An inability to get in contact with others when situations change and arrangements need to be altered means a lack of flexibility, and can lead to frustration and anxiety for some. Younger people felt the biggest negative impact of a lack of a mobile telephone signal, particularly in terms of their social lives since they were unable to make spontaneous arrangements or else missed out on social opportunities because their friends could not contact them. A number of respondents were concerned that they
24 More detailed information is available upon request.

28 Estimating The Value Of Mobile Telephony In Mobile Network Not-Spots
being out of contact when needed and enhanced flexibility in how they spend their day. It would also have an additional benefit for those seeking employment in terms of enhanced communication, and lead to reduced costs for those who did not wish to finance both a landline and a mobile phone. Though a few respondents could see positive aspects to a lack of mobile signal, to do with privacy and control over their ability to be contacted, the overall advantages of improved connectivity were felt to outweigh any disadvantage.
3.2.8 Improved mobile phone services would benefit local businesses
Some respondents felt that local businesses and those businesses either delivering products to or collaborating with companies in the local area, would benefit from a good mobile telephone signal, since many businesses rely on being contactable at all times. Several respondents stated that there is an expectation that business people should be able to seamlessly communicate by mobile telephone. One respondent who was currently looking for work felt that a reliable mobile phone signal would support his search for work by encouraging more employers to come into the local area, as well as keeping him in contact with potential employers.
3.2.9 The potential visual impact of additional mobile phone masts was not a major concern
The reaction to the potential arrival of telephone masts in the local area was fairly muted. Whilst some regard telephone masts as an eyesore it was more typically believed that masts would be constructed and placed in the community in a sympathetic manner in keeping with the local area and to blend in rather than stand out. Should this happen then respondents would be more likely to accept it. Consultation with local residents about the physical location of telephone masts would also be important.

Chapter Four.Findings from the
quantitative research

32 Estimating The Value Of Mobile Telephony In Mobile Network Not-Spots 33
sample covers a broad range of rurality codes and reasonably closely matches the urban-rurality codes of not-spot properties in the database. However, there are areas with small differences. Specifically, in the sample, a higher proportion of not-spot residents and businesses are found within hamlets and isolated dwellings (36 per cent of residents, 41 per cent of businesses) than the estimated proportion of properties (29.9 per cent) in these areas in the original database. One explanation for this could be that not all the properties in the database used to make the estimates were in fact in a not-spot, and that ‘true’ not-spot properties are actually more concentrated in hamlets and isolated dwellings. Alternatively, this could be a result of oversampling of more remote properties, which means that the sample may slightly over-represent these areas. The proportion of residents and businesses within rural villages is also slightly lower than would be expected (32 per cent of residents and 22 per cent of businesses compared with 38 per cent in the original database), and the proportion of residents within rural villages in a sparse setting are also lower than estimated (5 per cent compared to 10 per cent in the original database). The majority of local visitors in the sample reside within rural villages (41 per cent).
Table 4.2: Distribution of main survey respondents by rurality code
% not-spot properties % achieved interviews
Urban-rurality code of postcode
‘more dense’ postcodes
only
All postcodes Residents Local
visitors Businesses
C1: Urban city and town 0.2 0.2 2D1: Rural town and fringe 4.8 4.4 2 3
D2: Rural town and fringe in a sparse setting 1.0 0.9 0 1
E1: Rural village 39.9 38.0 32 41 22E2: Rural village in a sparse
setting 10.5 10.0 5 10 13
F1: Hamlet and isolated dwelling 27.9 29.9 36 26 41F2: Hamlet and isolated dwelling
in a sparse setting 15.6 16.4 20 12 19
Refused / no postcode given 4 5 6
Figure 4.1 presents the location of the respondents in each segment. For our purposes, location is the home address for residents and local visitors the business address for businesses, and the travel destination for tourists. Higher concentrations of respondents were located in Cumbria, North Yorkshire and Cornwall, although properties in other locations, from the Welsh borders to East Anglia are also represented. The sampling was designed to be representative of more- and less-populated not-spot areas in England and, comparing Figure 4.1 with Figure 1.1, which maps the level of the 2G service coverage, it appears that, encouragingly, the survey location distribution is geographically diverse, reflecting a wide range of not-spot areas.
This chapter sets out findings from the quantitative research, starting with a description of the survey sample characteristics, including information on the geographic distribution of respondents, their mobile phone usage and socio-economic characteristics. This is followed by an analysis of respondents’ understanding of and engagement in the choice experiments. Finally the results from the discrete choice models are presented, including the implied values of respondents’ willingness to pay for improved mobile phone services, and by extension the elimination of not-spots.
4.1 Survey sample characteristics
4.1.1 Sample sizes
The main survey was undertaken between late November 2013 and early January 2014, using both telephone interviews and online panel surveys. As noted in Chapter 2, 712 interviews were conducted amongst four key respondent groups: residents, businesses, local visitors and tourists. Three of these four groups were broken down further into sub-segments: residents were divided into residents and those with home-run businesses; businesses were split into small businesses and large businesses; and local visitors were split into visitors and those who ran home-run businesses. Table 4.1 details the breakdown of respondent groups and the number of interviews achieved.
Table 4.1: Sample size breakdown
Respondent Type Target number of interviews Survey method Achieved number of
interviews
Residents (total) 300 Telephone interview 302Residents n/a 236
Home-run businesses n/a 66Businesses (total) 100 Telephone interview 102
Small businesses (< 5 employees) n/a 56Large businesses (≥ 5 employees) n/a 46
Local Visitors (total) 150 Telephone interview 153Residents n/a 120
Home-run businesses n/a 33Tourists 150 Online panel 155
Total 700 712
4.1.2 Rurality distribution of the sample
As discussed in Section 2.3.3, a key concern in the sampling procedure was to ensure that the sample adequately reflected the rurality of the population of not-spot residents. Table 4.2 shows the percentage of not-spot properties estimated to be in different rural categories as derived from the government’s official rural/urban definition,25 compared to the proportion of interviews achieved in these categories. This shows that the survey
25 Office for National Statistics (2013).

34 Estimating The Value Of Mobile Telephony In Mobile Network Not-Spots 35
Table 4.3: Distance from the house / business premise to the nearest house
<100 m 100–499 m 500–999 m 1–10 km
Residents 82% 12% 5% 2%Local visitors 83% 10% 7% 1%
Businesses 58% 21% 14% 8%
4.1.3 Current mobile phone usage by survey segment
As part of the survey, respondents were asked about the communication devices they currently had access to, for personal or business use, and their usage levels. Table 4.4 summarises the findings for the different segments. Detailed analysis of communication access and usage can be found in Appendix A. The key findings for residents, local visitors and tourists are summarised below:
• Landline telephones and mobile phones are the most common communication methods for non-business respondents. By design, all residents and local visitors needed a landline to participate in the research, and we see that most residents (98 per cent) and local visitors (99 per cent) reported this to be the case.26
• Over 97 per cent of residents, local visitors and tourists have access to mobile phones for personal use (not dissimilar to the UK average of 94 per cent). This percentage is slightly lower for those who run businesses from home (92 per cent of home-run businesses who are resident in not-spot areas and 85 per cent of home-run businesses who are visitors to not-spot areas), although it is noted that the numbers in these segments are small and therefore the differences are not statistically significant.
• In terms of usage per day, over 70 per cent of residents and local visitors use their landline for more than 10 minutes on average in a day (see Table A.1 in Appendix A). For residents, the majority of personal calls by mobile phone account for less than 10 minutes per day (70–80 per cent), although those who run businesses from home use their mobile phones more. Tourists also reported using their mobile phones more than their landline, with business travellers using their mobile for 47 minutes per day and those travelling for leisure 27 minutes per day, on average, compared to an average of 15 minutes on their landline.
• In terms of the monthly payment for mobile phones, more than 70 per cent of residents and local visitors pay less than £20 per month for their mobile phone. Those who run businesses from their home pay more for their mobile phone, on average.
• Around half of residents, local visitors and tourists have access to fixed-line broadband, and therefore also have access to Voice over Internet Protocol (VoIP) services.
• Very few respondents across the three segments cited the use femtocell or VoIP phones for communication.
26 All respondents required a landline to participate in the survey (which was undertaken by telephone interviewing). However, responses from five respondents suggested that they did not have a landline. In these cases, either the respondent has misunderstood the question or their answer was miscoded by interviewers.
Local visitors
Businesses
Tourists (journey location)
Residents
Figure 4.1: Survey respondents’ locations
As part of the survey, respondents were also asked to state the distance to the nearest house, as another measure of remoteness. Table 4.3 presents the distribution across stated distances. Compared to the resident and local visitors segments, the sample of businesses was located in relatively less-populated regions, with greater distances to the nearest house.

36 Estimating The Value Of Mobile Telephony In Mobile Network Not-Spots 37
Table 4.5: Business mobile phone provision
Small businesses (n=56) Large businesses (n=46)
Access to personal mobile phone 30 54% 25 54%Access to business mobile phone 19 34% 19 41%
Provide staff with business mobile phone 8 14% 14 33%Staff use personal phone for business purposes 5 9% 6 13%
4.1.4 Socio-economic characteristics of the residents and local visitors segments
A key challenge in this study is that statistics of the population in the not-spot regions are not available. Therefore, the sample characteristics have been compared to 2011 census data27 in ‘rural areas’ and ‘rural hamlet, sparse setting’, which we believe are the best data available for comparison.
Table 4.6 shows the age distribution for the sample of residents and local visitors. The local visitors have an age profile only slightly older than the 2011 Census data for England; however, the residents segment has a higher proportion of 60–74 year olds and low number of young people. We note that the qualitative work indicated that young people are particularly reluctant to live in not-spot areas and tend to move away when they can; this appears to be reflected in the age profile of the sample.
Table 4.6: Resident’s and local visitor’s age distribution
Sample (%) 2011 Census (%)
Residents Local visitors All rural areas Rural hamlet, sparse setting
18–24 0 3 8 725–44 9 18 27 2245–59 31 33 28 3160–74 50 35 24 29
75+ 9 11 12 11
Although the sample contains a higher proportion of retired people than expected from census figures for rural areas (as shown in Table 4.7), in general this does not seem to be a result of under-sampling working people. In the local visitors segment, where the same sampling methodology was used, the proportion of employed people is very close to the 2011 Census data for rural areas. In addition, the proportion of self-employed people sampled in both residents and local visitors segments is close to that expected for remote areas. Thus, we conclude that there are two possible explanations for the proportion of older people in the sample. The first is that older people were more likely to participate in the survey and that older people are therefore over-represented in the sample. The second is that more elderly people may live in the particular not-spot locations that were sampled for the survey than in rural locations in general, and that this is accurately
27 Office for National Statistics 2011 Census.
Business respondents demonstrate a similar pattern of access to and use of communication devices, but with some variations:
• Noticeably, mobile phone access for business respondents is much lower compared to the other segments for both personal and business usage; they also have higher landline bills compared to their bills for mobile phone usage, which implies a high level of dependence on landline communication.
• We found that (as shown in Table 4.5) 14 per cent of small businesses and 33 per cent of large businesses provided a mobile phone to their staff. This was supplemented by 9 per cent of staff in small businesses and 13 per cent of staff in large businesses who use their personal mobile phones for business purposes (with the cost being reimbursed by the employer).
• We examined the survey data to see whether there is any relationship between mobile phone access and usage and the scale of businesses and type of industry, but we did not observe any clear trends. This may be a result of the relatively small number of respondents for each industry type. The tabulation of this analysis is included in Appendix B (Figures B.5 and B.6). However, we also noted that the businesses tend to be located in more remote areas (as shown in Table 4.3) than the residents and local visitors, and it is possible that this could have impacts on patterns of mobile phone ownership and use.
• In terms of monthly payments, most businesses pay less than £100 per month for their combined landline and mobile phone usage. Large-scale businesses have higher monthly payments, on average.
• Businesses report less access to fixed-line broadband and VoIP services than residents, local visitors and tourists.
• Very few businesses use femtocell or VoIP phones (7 per cent of small businesses and nearly 1 per cent of large businesses use femtocells; 2 per cent of small businesses and 11 per cent of large businesses use VoIP phones).
Table 4.4: Self-reported access to communication devices, by segment
Residents(n=302)
Local visitors (n=153)
Businesses (n=102) Tourists
(n=155) Residents Home-run
businessLocal
visitorsHome-run business Small Large
Landline telephone 99% 98% 99% 100% 96% 100% 90%Mobile phone (personal
use) 97% 92% 99% 85% 54% 54% 97%
Mobile phone (business) 14% 45% 18% 58% 34% 41% 19%Computer broadband for
VoIP service 52% 52% 50% 42% 32% 28% 57%
Femtocell 6% 5% 7% 0% 7% 0% 0%VoIP phone 1% 5% 1% 0% 2% 11% 9%
Satellite phone 0% 0% 0% 0% 0% 0% 0%Others 0% 2% 3% 12% 0% 0% 0%

38 Estimating The Value Of Mobile Telephony In Mobile Network Not-Spots 39
As noted earlier, respondents in the residents and local visitor segments who ran businesses from home were included in those segments in order to better represent their employment profile. However, we still examined the characteristics of these businesses in terms of annual turnover and type of industry (see detailed analysis in Appendix B (Figure B.3)). Nearly 40 per cent of respondents with home-run businesses in these segments had an annual turnover of less than £49,000. Also, nearly 40 per cent are in an agriculture-related industry, and 15 per cent of local visitor businesses operate in the area of wholesale, retail and repair of motor vehicles. The rest are scattered across various types of industries.
In summary, the businesses sampled in not-spot areas are relatively small in scale and mostly in the agriculture and accommodation industries. Their mobile phone access (as shown in Table 4.4) is relatively low compared to residents, although this is not the case when it comes to reliance on fixed telephony. For those who have access to a mobile phone, however, their usage and monthly payments also appear to be higher than those of other segments.
4.1.6 Characteristics of the tourists segment
Some 90 per cent of the tourists in the sample stated they travelled for leisure. Most of them had a short stay in the not-spot regions: 35 per cent stayed for less than one day; whilst another 35 per cent stayed for one to three days. Some 64 per cent were not aware that they were travelling to a not-spot area, prior to making their journey. Only 1 per cent actively sought to find a place without a mobile phone signal. A more detailed analysis is included in Appendix B (Table B.3 and Table B.4).
reflected in the sample. With regard to the first possibility we emphasise that substantial effort was made to reduce the sampling bias potentially caused by the telephone interviewing method by calling during evenings and weekends as well as during the day, and undertaking multiple call-backs to try to maximise response from households where no answer was received at first contact. Moreover, the fact that both the resident and local visitor samples were obtained in the same way and that the same characteristic is not present in the local visitors sample suggests that older people may well be more likely to live in not-spot areas. However, if the sample is biased towards older people then the resulting average valuations will be underestimated (because we find that older people provide lower valuations for getting a signal in their home if they currently can get a signal outside their house). But this impact will not be large (because we do not find differences in valuations for other distances to be travelled to get a signal).
Table 4.7: Residents’ and local visitors’ working status
Sample (%) 2011 Census (%)
Residents Local visitors All rural areas Rural hamlet, sparse setting
In employment/self-employed 51 63 64.7 65.9Self-employed 22 22 13.9 25.2
Retired 43 30 18.1 19.6Other 6 9 17.1 14.5
4.1.5 Characteristics of the businesses segment
As noted earlier, business interviewees were recruited from a list of businesses in relevant postcodes. For the purpose of this study, businesses with five or more staff are categorised as large businesses, and the rest are categorised as small businesses. The scale of business is also reflected by the annual turnover stated by respondents, with most showing a turnover less than £5m. The details of this analysis are included in Appendix B (Figure B.2). We observe that nearly a third of businesses did not answer the question on their annual turnover and that most are in the agriculture, accommodation and food service, and arts and entertainment sectors.
In terms of staff numbers, 25 per cent of small businesses are sole traders (with only one member of staff) and 75 per cent have two to four staff members. 48 per cent of the large businesses have five to nine staff members; whilst 43 per cent have between 10 and 49 staff members. The remaining large businesses (9 per cent) have 50 or more staff.

40 Estimating The Value Of Mobile Telephony In Mobile Network Not-Spots 41
Always“Neither”
(9%)
AlwaysB (0%)
AlwaysA (0%)
6% 11%
30%
30%
RESIDENTS
Always“Neither”
(4%)
AlwaysB (1%)
AlwaysA (0%)
9% 9%
26%
51%
LOCAL VISITORS
Always“Neither”
(8%)
AlwaysB (1%)
AlwaysA (1%)
3% 7%
34%
47%
BUSINESSES
Always“Neither”
(10%)
AlwaysB (0%)
AlwaysA (0%)
4% 16%
50%
19%
TOURISTS
Figure 4.2: Level of trading by each segment
4.2.3 Influence of attribute levels on choices
Another area of interest is respondents’ sensitivities to changing attribute levels in the choices they made. Figure 4.3 presents the proportion of respondents that chose an alternative at a specific price level. We emphasise that in the choices the other service attributes will also be varying, and this is not taken into account in the diagram. The vertical axes of the charts are the proportion of respondents choosing an alternative; the horizontal axes are the price levels included in the SP experiment for each segment. The impact of price is as expected: as the price increases, the percentage of the respondents that selected the option decreases. This pattern occurs across all four segments.
In addition, this analysis indicates the overall level of acceptance of increased prices. For instance, in the tourist segment, over 70 per cent of the responses were for choice
4.2 Engagement in the choice experiment Prior to the discrete choice modelling analysis of the preference observations, we examined the responses to the diagnostic questions that formed part of the SP survey questionnaire. These enabled us to analyse the respondents’ levels of engagement and perceived difficulties in understanding the choice exercises, and provided us with a better understanding of the quality of choice data.
4.2.1 Average time spent completing the survey
On average, residents and local visitors took 27 minutes to complete the telephone surveys. Businesses spent slightly less time (23 minutes) on the survey; businesses tended to have lower mobile phone ownership and those who did not have access to mobile phones were not asked questions about usage and mobile coverage. Respondents to the tourist survey took the least amount of time (on average 16 minutes) to complete their online questionnaires. Detailed information on completion times is included in Appendix C (Table C.1).
4.2.2 Trading behaviour
One way of examining whether people have engaged in the exercises, and therefore informing our judgement as to the reliability of the outputs, is to investigate the level of trading between the alternatives in the choice exercises – in other words whether respondents chose between the hypothetical alternatives (A and B) or ‘Neither of these’ across the scenarios. Because the attributes levels are randomly assigned to alternatives, there is no reason to assume a preference for Alternative A relative to Alternative B: so we would assume that they would be chosen equally across respondents. It is possible to imagine that some respondents may always choose the ‘Neither of these’ alternatives, for example if they do not have a mobile phone, and we are interested in the frequency of these responses.
The Venn diagrams in Figure 4.2 present the trading behaviour observed in the SP responses across these three alternatives (A, B and Neither) for the four segments. The overlap area indicates the proportion of respondents who switch between the options, which provides us with the most information on the key parameters contributing to the WTP valuations. For instance, in the residents segment, 9 per cent of the respondents always selected the ‘Neither of these’ option in the SP exercises; 44 per cent either opted for ‘Option A’ or ‘Option B’; and 30 per cent switched across the three options, indicating a high level of trading behaviour. On the whole, the level of trading is high, suggesting a good level of engagement in the experiment.
A relatively small proportion of respondents always chose the ‘Neither’ alternative, but this is not excessive for any segment. At the conclusion of the choice experiment, respondents who selected the ‘Neither of these’ option for all eight choices were asked the reason for their choices. Most of the respondents stated that they did not want to pay extra for a mobile phone service that might be worse than their current service. A few stated that they were used to other communication methods such as a landline and did not need a mobile phone.

42 Estimating The Value Of Mobile Telephony In Mobile Network Not-Spots 43
£00%
10%
20%
30%
40%
50%
60%
70%
80%
£1
Price levels in the SP experiment
% o
f res
pond
ents
cho
osin
g al
tern
ativ
e
£2 £5 £7 £10
Tourists
£00%
10%
20%
30%
40%
50%
60%
70%
£10
% o
f res
pond
ents
cho
osin
g al
tern
ativ
e
£25 £50 £80 £150
Large businesses
Figure 4.3: Influence of price levels on choices
We also examined the influence of the distance required to find a signal on respondents’ choices (Table 4.8). Generally, respondents were less likely to choose alternatives with longer searching distances. However, tourists had similar levels of preferences towards the options with distances equal to or less than 1 mile, but disinclination towards distances of 5 miles or more.
options with no extra cost compared to 30 per cent of responses for options that are £1 per day. A very small proportion of tourist respondents chose options of £5 or more per day.
£00%
10%
20%
30%
40%
50%
60%
70%
80%
£5
Price levels in the SP experiment
% o
f res
pond
ents
cho
osin
g al
tern
ativ
e
£10 £20 £30 £50
Residents
Local visitors
Local visitor businesses
£00%
10%
20%
30%
40%
50%
60%
70%
£10
Price levels in the SP experiment
% o
f res
pond
ents
cho
osin
g al
tern
ativ
e
£20 £35 £50 £80
Home-run businesses (residents)
Small businesses

44 Estimating The Value Of Mobile Telephony In Mobile Network Not-Spots 45
the choice experiment was high, leading to a high level of confidence in the survey data, which were then used in the quantitative analysis to obtain WTP valuations.
4.3 Model results and WTP valuations
4.3.1 Discrete choice models
Discrete choice models were developed using the choices that respondents made in the experiments (see Appendix D for the theoretical background on discrete choice modelling and the detailed model results). The models developed from the choice data are multinomial logit models, with three choice alternatives (Option A, Option B, and neither), described by attributes and levels as presented in Table 2.1.
The estimation procedure assumes that respondents chose the alternatives with the highest utility (the highest overall value to themselves). The outputs from the estimation procedure are attribute coefficients that reflect the weight that respondents placed on price and the service-related attributes (distance travelled to obtain a signal, signal strength and the type of service available), and best represent the (stated) choices made by the respondents. Both the values and statistical significance30 of the coefficients are calculated and reported in Appendix D.
The ratio of the model coefficients quantifies the marginal rate of substitution between attributes, or in other words the trade-off rate between one attribute and another. Moreover, the ratios of the service and price coefficients estimate consumers’ willingness to pay for service improvements, measured in £/month for residents, local visitors and businesses and £/day for tourists. Hence WTP can be estimated for each of the three service attributes: decreased distance to signal, improved signal strength and type of service.
Separate models were developed for each population segment: within each segment, data from sub-segments (for example those who ran businesses from home and others) were pooled, taking account of differences in error variation among different datasets using scale parameters.31
A key part of the model analysis was to investigate how choices and preferences regarding mobile phone services were influenced by the demographic characteristics of the respondents. Tests were undertaken to examine the impact of socio-demographic and other factors on the importance of service characteristics in the stated choices. However, the relatively small sample size in each population segment prevented us from being able to identify many significant effects. The characteristics that were examined in this investigation included: respondent’s age, car ownership, gender, household size and structure, tourist’s length of stay and size of business.
We also examined variations in price sensitivity by sub-segment. We found that residents
30 In this context significance refers to whether a coefficient can be assumed with a certain level of confidence, usually 95 per cent, to be different from zero. The standard errors determine a confidence interval for the coefficient, which is deemed significant if the interval does not contain zero.
31 See Bradley & Daly (1991) for details.
Table 4.8: Influence of searching distances on choices
Searching distance (miles) Residents Local visitors Businesses Tourists
Signal in local area 40% 43% 38% 25%Go outside 38% 39% 43% 26%
0.25 33% 38% 36% 27%0.5 30% 31% 37% 27%
1 28% 32% 32% 27%5 or more 24% 25% 29% 22%
4.2.4 Reported understanding of the choice experiments
After completion of the choice experiment, respondents were asked a series of diagnostic questions to explore their understanding of the experiment and their perception of how realistic the choices were.
A summary of the findings from our analysis of the answers to these questions is presented below (detailed responses are presented in Table C.2 in Appendix C):
• Over 93 per cent of the residents, local visitors and tourist respondents said that they were able to understand the choice experiment. Business respondents had a lower level of understanding (over 83 per cent indicated that they were able to understand the experiments). Based upon our previous experience,28 this is judged to be a reasonably high level of understanding for a complex choice experiment.
• Over 71 per cent of respondents considered the choices easy or moderately easy to make.
• About one third of respondents indicated that some of the choices presented to them were not realistic, especially for respondents in the local visitors and businesses segments. This is not surprising, given that the attributes, particularly price attributes, were specified to capture the full range of WTP valuation, and thus included some deliberately high prices levels. In addition, some respondents indicated that they were unwilling to travel longer distances to get a signal than the distances that they currently have to travel, even though the information in the experiment made clear to the respondent that the distances travelled reflected the average for people in the area.29
We therefore conclude that most of the respondents understood the choice experiment and were able to choose between alternatives. In the choice model analysis, we removed the observations from respondents who stated they could not understand the choices. We accept that some of the choice scenarios may have been perceived to be unrealistic, particularly in terms of prices. However, analysis of trading behaviour (Section 4.2.2) does not suggest that this distorted respondent’s engagement in the exercise. Overall, few observations had to be discarded and the remaining respondents’ understanding of
28 For example, in a study recently conducted for HMRC using stated preference choice experiments, about 3 per cent of respondents found the choices to be too difficult or confusing (Rohr et al., 2013).
29 This issue is discussed in more detail in Section 2.2.1.
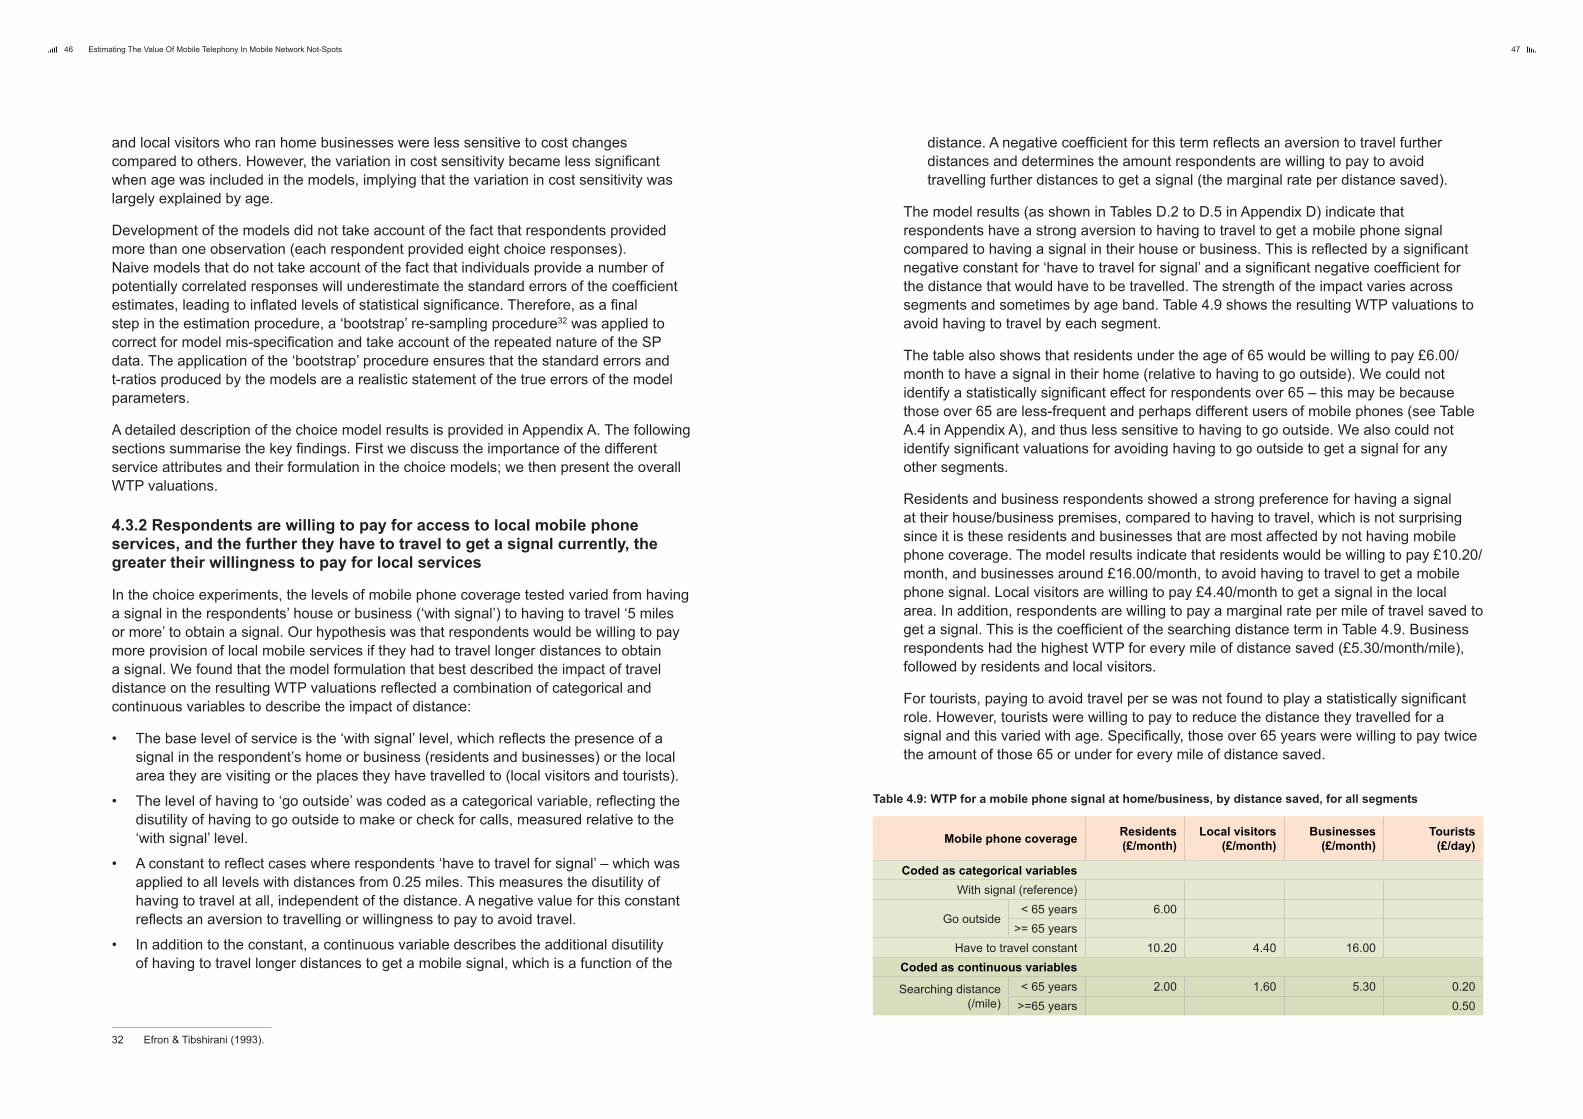
46 Estimating The Value Of Mobile Telephony In Mobile Network Not-Spots 47
distance. A negative coefficient for this term reflects an aversion to travel further distances and determines the amount respondents are willing to pay to avoid travelling further distances to get a signal (the marginal rate per distance saved).
The model results (as shown in Tables D.2 to D.5 in Appendix D) indicate that respondents have a strong aversion to having to travel to get a mobile phone signal compared to having a signal in their house or business. This is reflected by a significant negative constant for ‘have to travel for signal’ and a significant negative coefficient for the distance that would have to be travelled. The strength of the impact varies across segments and sometimes by age band. Table 4.9 shows the resulting WTP valuations to avoid having to travel by each segment.
The table also shows that residents under the age of 65 would be willing to pay £6.00/month to have a signal in their home (relative to having to go outside). We could not identify a statistically significant effect for respondents over 65 – this may be because those over 65 are less-frequent and perhaps different users of mobile phones (see Table A.4 in Appendix A), and thus less sensitive to having to go outside. We also could not identify significant valuations for avoiding having to go outside to get a signal for any other segments.
Residents and business respondents showed a strong preference for having a signal at their house/business premises, compared to having to travel, which is not surprising since it is these residents and businesses that are most affected by not having mobile phone coverage. The model results indicate that residents would be willing to pay £10.20/month, and businesses around £16.00/month, to avoid having to travel to get a mobile phone signal. Local visitors are willing to pay £4.40/month to get a signal in the local area. In addition, respondents are willing to pay a marginal rate per mile of travel saved to get a signal. This is the coefficient of the searching distance term in Table 4.9. Business respondents had the highest WTP for every mile of distance saved (£5.30/month/mile), followed by residents and local visitors.
For tourists, paying to avoid travel per se was not found to play a statistically significant role. However, tourists were willing to pay to reduce the distance they travelled for a signal and this varied with age. Specifically, those over 65 years were willing to pay twice the amount of those 65 or under for every mile of distance saved.
Table 4.9: WTP for a mobile phone signal at home/business, by distance saved, for all segments
Mobile phone coverage Residents (£/month)
Local visitors (£/month)
Businesses (£/month)
Tourists (£/day)
Coded as categorical variablesWith signal (reference)
Go outside< 65 years 6.00
>= 65 years Have to travel constant 10.20 4.40 16.00
Coded as continuous variables
Searching distance (/mile)
< 65 years 2.00 1.60 5.30 0.20>=65 years 0.50
and local visitors who ran home businesses were less sensitive to cost changes compared to others. However, the variation in cost sensitivity became less significant when age was included in the models, implying that the variation in cost sensitivity was largely explained by age.
Development of the models did not take account of the fact that respondents provided more than one observation (each respondent provided eight choice responses). Naive models that do not take account of the fact that individuals provide a number of potentially correlated responses will underestimate the standard errors of the coefficient estimates, leading to inflated levels of statistical significance. Therefore, as a final step in the estimation procedure, a ‘bootstrap’ re-sampling procedure32 was applied to correct for model mis-specification and take account of the repeated nature of the SP data. The application of the ‘bootstrap’ procedure ensures that the standard errors and t-ratios produced by the models are a realistic statement of the true errors of the model parameters.
A detailed description of the choice model results is provided in Appendix A. The following sections summarise the key findings. First we discuss the importance of the different service attributes and their formulation in the choice models; we then present the overall WTP valuations.
4.3.2 Respondents are willing to pay for access to local mobile phone services, and the further they have to travel to get a signal currently, the greater their willingness to pay for local services
In the choice experiments, the levels of mobile phone coverage tested varied from having a signal in the respondents’ house or business (‘with signal’) to having to travel ‘5 miles or more’ to obtain a signal. Our hypothesis was that respondents would be willing to pay more provision of local mobile services if they had to travel longer distances to obtain a signal. We found that the model formulation that best described the impact of travel distance on the resulting WTP valuations reflected a combination of categorical and continuous variables to describe the impact of distance:
• The base level of service is the ‘with signal’ level, which reflects the presence of a signal in the respondent’s home or business (residents and businesses) or the local area they are visiting or the places they have travelled to (local visitors and tourists).
• The level of having to ‘go outside’ was coded as a categorical variable, reflecting the disutility of having to go outside to make or check for calls, measured relative to the ‘with signal’ level.
• A constant to reflect cases where respondents ‘have to travel for signal’ – which was applied to all levels with distances from 0.25 miles. This measures the disutility of having to travel at all, independent of the distance. A negative value for this constant reflects an aversion to travelling or willingness to pay to avoid travel.
• In addition to the constant, a continuous variable describes the additional disutility of having to travel longer distances to get a mobile signal, which is a function of the
32 Efron & Tibshirani (1993).

48 Estimating The Value Of Mobile Telephony In Mobile Network Not-Spots 49
In the following tables we present the average WTP for mobile signal provision in rural not-spot areas for the different population segments across the service improvement options. When using these valuations for assessment of benefits, it is important that they are computed relative to current mobile signal provision levels, in terms of the distance that individuals currently need to travel to get a signal, the quality of that signal and the type of services provided (or some average representation thereof). If this information is not available, then average valuations derived from the distance information collected in our sample are provided. It is emphasised that the valuations represent willingness to pay over and existing subscription fees to be able to receive mobile phone services. In addition to the WTP estimates, we present information on the reliability of the estimates, measured by their 90% confidence intervals. The approach for calculating the confidence intervals is detailed in Appendix D.
Table 4.11 presents the WTP valuations for residents in not-spot areas. Below we present some examples of how to use these values to compute WTP valuations for residents in different situations:
• Residents in not-spot areas who currently have to travel 5 miles to get an improved mobile phone signal and 2G services have a WTP of £20.10/month for provision of a strong mobile phone signal at their home with 2G services.
• Residents in not-spot areas who currently have to travel 1 mile for a weak mobile phone signal and 2G services have a WTP of £23.50/month for provision of an improved mobile phone signal at their home for 2G services.
• Residents who have to travel 2 miles to get a 2G service have a WTP of £15.50 and £26.90 for 3G or 4G services at their home, depending on whether they also get an improvement in their signal strength.
Table 4.11: Willingness to pay for residents in not-spots for mobile phone services (£/month)
Not-spot residents
2G 3G/4G
Distance to travel (miles) Same signal quality
Better signal quality
Same signal quality
Better signal quality
Outside – Age < 65 years 6.00 17.30 7.30 18.70– Age > 65 years 0.00 11.40 1.40 12.70
0.25 10.70 22.00 12.00 23.400.5 11.20 22.50 12.50 23.90
1 12.20 23.50 13.50 24.902 14.20 25.50 15.50 26.905 20.10 31.50 21.50 32.90
Average valuationsWTP (avg distance = 0.92) 12.00 23.40 13.40 24.70
90% Confidence Interval +/-4.10 +/-5.10 +/-3.00 +/-6.50
4.3.3 Respondents are willing to pay for a good-quality mobile phone signal
The model results reveal a significant preference for a ‘strong signal’ over a ‘weak signal’, although the strength of preference varies by segment. Residents show the highest WTP for mobile phone signal improvement at £11.40/month, followed by local visitors at £8.80/month, and business at £3.60/month. Tourists also show a substantial willingness to pay for a strong signal and are willing to pay £2.50/day for local mobile services at their destination with a strong signal.
4.3.4 Some respondents are willing to pay more for 3G and 4G services, but this is less important overall than access to mobile phone services and quality of signal
The choice experiments also tested the impact of different services levels, particularly 2G, 3G and 4G services. The service valuations are summarised in Table 4.10; the values reflect the willingness to pay for 3G and 4G services, relative to 2G services.
Overall, WTP for different service levels is lower than for the other attributes, and we conclude that respondents are less sensitive to the type of service relative to other mobile phone characteristics. In general, we find that 3G services are preferred to 2G services, although we are not able to identify significant valuations for those 45 years of age or older among local visitors or tourists. Somewhat unexpectedly, we do not find 4G services to be valued more highly than 3G services, except by tourists aged less than 45 years. For local visitors and tourists who are over 45 years, we do not observe any significant preference for 4G services compared to 2G services. This could potentially results from both a low awareness amongst respondents of the benefits of what are in effect very new 4G services possibly compounded by the fact that 4G services are relatively unavailable at this time in rural areas, as well as a perception that 4G services entail high subscription costs. These factors could possibly have led to lower valuations for 4G services being provided by respondents.
Table 4.10: WTP for service type, by segment
Type of service provided Age Residents (£/month)
Local visitors (£/month)
Businesses (£/month)
Tourists (£/day)
2G (reference)
3G <45 years 1.40 6.90 8.70 1.70
>=45 years (same as 2G) (same as 2G)
4G <45 years 1.40 (same as 2G) 8.70 2.20
>=45 years (same as 2G) (same as 2G)
4.3.5 Interpreting the WTP valuations
In the previous sections we have presented WTP valuations derived from the choice models for the different aspects of mobile phone services, by distance (saved), quality (strength) and type of service. This section describes how these can be used to provide overall valuations for provision of mobile services in not-spot areas.

50 Estimating The Value Of Mobile Telephony In Mobile Network Not-Spots 51
Table 4.13: Willingness to pay for businesses in not-spots for mobile phone services (£/month/phone)
Not-spot businesses
2G 3G/4G
Distance to travel (miles) Same signal quality
Better signal quality
Same signal quality
Better signal quality
With signal/outside (reference) 0.25 17.30 20.90 26.00 29.60
0.5 18.60 22.20 27.30 30.901 21.20 24.80 29.90 33.502 26.50 30.20 35.20 38.805 42.40 46.00 51.10 54.70
Average valuesWTP (avg distance = 0.94 miles) 21.00 24.50 29.60 33.20
90% Confidence Interval +/-11.50 +/-14.00 +/-16.60 +/-24.60
The confidence intervals for the business WTP valuations are much wider than for the residents and local visitors, both absolutely and in percentage terms, reflecting the smaller sample sizes for this segment (and that there may be more heterogeneity in the business valuations).
For tourists, we present valuations for 2G services (separately for those less than 65 year and those over 65 years of age), and 3G and 4G services for those less than 45 years of age. For those 45 years of age and older, the values for 2G services should be used. We note that tourists place a relatively high value on better signal quality. We also see relatively large confidence interval for the tourist valuations for provision of values with similar service quality, particularly relative to the WTP valuation.
Table 4.14: Willingness to pay for tourists to not-spots for mobile phone services (£/day)
Not-spot tourists
2G (<65 years) 2G (>65 years) 3G (<45 years) 4G (<45years)
Distance to travel (miles)
Same signal
quality
Better signal
quality
Same signal
quality
Better signal
quality
Same signal
quality
Better signal
quality
Same signal
quality
Better signal
quality
With signal/outside (reference)
0.25 0.10 2.60 0.20 2.70 1.80 4.30 2.20 4.800.5 0.10 2.60 0.30 2.80 1.80 4.30 2.30 4.80
1 0.20 2.70 0.50 3.00 1.90 4.40 2.40 4.902 0.40 2.90 1.00 3.50 2.10 4.60 2.50 5.105 0.90 3.50 2.50 5.00 2.60 5.20 3.10 5.60
Average valuesWTP (distance=0.85 mi) 0.20 2.70 0.40 3.00 1.90 4.40 2.30 4.9090% Confidence Interval +/-0.10 +/-0.70 +/-0.35 +/-0.80 +/-1.20 +/-1.40 +/-1.30 +/-1.50
Note: Valuations for 3G and 4G services for those aged 45 years and older were not significantly different for 2G services (thus the valuations for 2G services should be used for these individuals).
Based on the average searching distance reported by residents in our sample (0.92 miles), we calculate an average WTP of £12/month (+/- £4.10) for residents to obtain mobile services at their home. The WTP would be increased to £23.40 (+/- £5.10) if residents get a stronger signal than the alternative that is currently available and £24.70 (+/- £6.50) for a stronger signal together with service upgrades from 2G to 3G or 4G, relative to the current alternatives.
For local visitors, we present valuations for 2G and 3G services for those under 45 years of age. The value of 3G services for those over 45 years of age, and the value of 4G services were not found to be significantly different for those for 2G services. In these cases the valuation for 2G services should be used.
Table 4.12: Willingness to pay for local visitors to not-spots for mobile phone services (£/month)
Not-spot local visitors
2G 3G (Age <45)
Distance to travel (miles) Same signal quality
Better signal quality
Same signal quality
Better signal quality
With signal/outside (reference)0.25 4.90 13.60 11.80 20.50
0.5 5.30 14.00 12.20 20.901 6.10 14.80 13.00 21.702 7.70 16.50 14.60 23.405 12.60 21.40 19.50 28.30
Average valuesWTP (avg distance =1.16 miles) 6.30 15.10 13.20 22.00
90% Confidence Interval +/-3.80 +/-4.10 +/-5.10 +/-8.30Note: Valuations for 3G services for those aged 45 years and older and for 4G services were not significantly different for 2G services (thus the valuations for 2G services should be used).
Theoretically, the business valuations are in units of £/month per mobile phone, but the numbers of businesses who supplied staff with phones was small, with 14 per cent of small businesses and 33 per cent of the large businesses doing so (although the proportion of respondents who had access to business mobile phones was much larger, with 34% of small businesses and 41% of large businesses). Given the small sample sizes, particularly for the business segment, we recommend that the average values are applied to businesses more generally, and no specific account is taken for the number of mobile phone provided.

52 Estimating The Value Of Mobile Telephony In Mobile Network Not-Spots 53
Tourists
0% 10% 20% 30% 40%% of the respondents
50% 60% 70% 80% 90% 100%
Businesses
Local visitors
Residents
Go to the window
Between 1/4 mile and 1/2 mile
Over 5 miles
Between 1/2 mile and 1 mile Between 1 and 5 miles
Go outside Less than 1/4 mile
Figure 4.4: Mobile phone signal searching distance in current situation
More than two-thirds of residents and 80 per cent of local visitors and businesses felt that it was important to be able to make and receive mobile phone calls; the proportion who felt that it is important to be able to send and receive text messages was slightly lower (see Table 4.16), but it is still high. About a third of residents and local visitors thought it was important to be able to get Internet services on their phone; far more business respondents and tourists thought that this was important.
This contrasts with respondents’ satisfaction levels with their mobile phone services: less than 15 per cent of respondents were satisfied with their mobile phone service. The proportion of those satisfied with their service is slightly better among local visitors and tourists, presumably because they experience poor signal conditions less often and may be less reliant on continuous mobile connectivity.
4.4 Findings from other key background questions
4.4.1 Current mobile phone coverage in not-spot areas
As shown in Table 4.15, 80 per cent of residents and 65 per cent of businesses in our sample reported that they never had a mobile phone signal or reception at their home or business (‘always no signal/reception on phone’). Over 90 per cent of residents and businesses indicated that they frequently did not have a mobile phone signal at their home or business premises. Over 80 per cent of the local visitors and over 45 per cent of the tourists stated that they frequently had no mobile phone signal in the local area or tourist destination travelled to.
Table 4.15: Responses to ‘No signal/reception on phone’ by segment
Always Frequently Sometimes Rarely Never
Residents 82% 12% 3% 1% 2%Local visitors 32% 48% 14% 5% 1%
Businesses 65% 27% 4% 3% 1%Tourists 17% 28% 34% 20% 1%
It is noteworthy that resident and business respondents were only eligible to participate in the survey if they reported that they did not receive a mobile phone signal in their home (for residents) or businesses (for business respondents) when recruited for the survey. The responses to the self-reported levels of mobile phone reception reported above, which were collected later in the questionnaire, indicate that some individuals may have occasionally been able to get a mobile phone signal in their home or business and thus that the individuals may not have been located in a not-spot area. However, it is assumed that their valuations for obtaining a signal are as relevant as those who are officially located in not-spot areas, given the distance that they have to travel to access mobile phone services. For tourists, although it was emphasised in the survey that the question about mobile phone coverage was for the tourist destination location, it is assumed that some respondents interpreted this to mean their home location.33
In our sample, over 20 per cent of the residents, businesses and tourists could acquire a mobile phone signal by just ‘Going outside’ (as shown in Figure 4.4). Generally, around 50 per cent of respondents would need to travel less than ¼ mile (around 5–10 minutes’ walking) to get a signal. The vast majority of respondents in each segment needed to travel less than 5 miles to get a mobile phone signal.
33 Tourists were only eligible for the survey if they respondents positively to the screening statement ‘In the past year, I have made a leisure / business trip outside my local area to a place in England where there was no mobile phone service’.

54 Estimating The Value Of Mobile Telephony In Mobile Network Not-Spots 55
4.4.2 Reasons for needing mobile phone
The most important reasons for needing mobile phones in not-spot areas were investigated for both the businesses segment and non-business segments. Respondents’ responses are shown in Figure 4.6 and Figure 4.7.
Among residents and local visitors, the most important reasons to have a mobile phone were to deal with emergencies and for contacting family and friends when plans change.
Other reasons
For using the Internet
For work-activities (meetings, business calls)
For casual conversations
To let somebody know you are going to be late
To arrange to meet somebody
To call home when you are out
For emergencies
% of respondents
Rea
sons
that
resp
onde
nts
use
a m
obile
pho
ne
0% 20% 40% 60% 80%
Local visitors
Residents
Figure 4.6: Non-business segments reasons for needing a mobile phone
The reported reasons businesses needed mobile phones varied by the size of the company. For large businesses, the most common reasons were to communicate with colleagues and partners, and to monitor the safety of staff working. For small businesses, communication with customers/potential customers and marketing were rated as the most common reasons for needing a mobile phone.
Business promotion/marketing activities
Communicating with business partner
Communicating with customers
Communicating with suppliers
Building contact with potential customers
Communicating with colleagues within your organisation
Safety of staff working in high risk jobs
% of respondents
Rea
sons
that
bus
ines
ses
use
a m
obile
pho
ne0% 20% 40% 60% 80%
Small businesses Large businesses
Figure 4.7: Businesses reasons for needing a mobile phone
Table 4.16: Perceived importance of mobile phone services in not-spot areas and respondents’ stated satisfaction with the service provided
Segment Importance of service (%) Satisfaction with service (%)
Important Neutral Not important Satisfied Neutral Not
satisfied
ResidentsMaking and receiving calls 68% 13% 19% 4% 5% 91%
Text message sent\delivered with-out delay 67% 14% 19% 4% 12% 84%
Ability to use the Internet on phone 32% 14% 54% 7% 12% 81%Local Visitors
Making and receiving calls 81% 13% 6% 18% 22% 60%Text message sent\delivered with-
out delay 72% 16% 13% 15% 32% 53%
Ability to use the Internet on phone 32% 17% 51% 14% 25% 61%Businesses
Making and receiving calls 80% 10% 10% 8% 6% 86%Text message sent\delivered with-
out delay 68% 17% 15% 4% 14% 82%
Ability to use the Internet on phone 48% 23% 30% 8% 17% 75%Tourists
Making and receiving calls 77% 14% 9% 21% 33% 46%Text message sent\delivered with-
out delay 71% 16% 14% 24% 29% 47%
Ability to use the Internet on phone 42% 13% 45% 20% 34% 46%
We also investigated alternative communication methods used by respondents in the survey. A high proportion of residents, local visitors and businesses stated that they use landlines for their communication needs, followed by the options of ‘making arrangements and sticking to them’ and ‘phone chains/leaving messages with others’. Other solutions, such as the use of satellite phones, or femtocells, were less frequently used. Tourists were much less likely to use alternative means of communication during their stays in not-spot areas.
Use landline
Phone chains/leaving messages with others
Satellite phone
Use instant messaging/Skype on broadband
Make arrangements and stick to them
Femtocell
Residents
Residents Local visitors Businesses
% o
f res
pond
ents
0%
20%
40%
60%
80%
100%
Home-runbusinesses
Local visitors Local visitorbusinesses
Smallbusinesses
Largebusinesses
Tourists
Tourists
Figure 4.5: Alternative communication methods in not-spot areas

56 Estimating The Value Of Mobile Telephony In Mobile Network Not-Spots 57
Home-run business
0% 10% 20% 30% 40%% of the respondents
50% 60% 70% 80% 90% 100%
Local visitor business
Small business
Large business
More than £50,000
£500 – £1,000
Less than £100
£251 – £500 £101 – £250
£25,000 – £50,000 £1,000 – £5,000
Figure 4.9: Quantification of the negative impact of not-spots on businesses (in £ per month)
In summary, we found that being located in a not-spot area can have a number of negative influences on businesses, mainly in terms of effective communication with business partners, customers and colleagues, as well as promotion and marketing activities. Safety of staff was an issue also raised by respondents. Over half the business respondents indicated that being located in a not-spot area had a negative impact on their businesses profit (53 per cent), turnover (52 per cent) and productivity (53 per cent). However, they found it difficult to quantify the size of this impact, with nearly 40 per cent of those who were able to make an estimate indicating the cost to be less than £100/month, although the size of the impact did seem to be related to the size of the business.
4.4.4 Respondents’ attitudes towards mobile phone service in not-spots
As part of the survey (after the choice experiments) respondents were asked four questions in order to better understand their general attitudes towards mobile phone usage, signal coverage and willingness to pay. Figure 4.10 and Figure 4.11 illustrate the findings for each segment. These results provide a general reference for the quantitative analysis.
In summary:
• 23 per cent of residents, 18 per cent of local visitors, 28 per cent of tourists and 18 per cent of businesses felt that mobile phones could be replaced by fixed lines.
• 83 per cent of residents, 85 per cent of local visitors and 83 per cent of businesses confirmed that mobile phone coverage is important when selecting a mobile phone operator. The proportion is slightly lower for tourists, at 74 per cent.
• 75 per cent of residents, 72 per cent of local visitors and 65 per cent of tourists stated that good mobile phone coverage would improve their connection with their family; 79 per cent of businesses believed that good mobile coverage would improve their connection with business partners/clients and 64 per cent believed that good mobile phone coverage would improve business productivity.
• 39 per cent of residents, 40 per cent of local visitors and 48 per cent of businesses
4.4.3 Impact of not-spots on businesses
Despite the relatively lower proportion of mobile phone ownership in the businesses segment, a substantial percentage of business respondents identified drawbacks to being located in a not-spot area. For large businesses these included the inability to communicate effectively with colleagues, contact suppliers/business partners, and a lack of flexibility in decisionmaking (as shown in Figure 4.8). For smaller businesses, key issues were hindrances in building contacts, contacting suppliers/business partners and loss of profit. About half of the respondents from both large and small businesses indicated that being located in a not-spot area adversely affected their profit, turnover and productivity.
Flexible decision making (e.g. response to marketchange in short period of time
Effectively communicate with colleagues(e.g. allocation of resources)
Ability to contact suppliers and business partners
Recruitment of staff
Ability to identify business opportunities
Ability to build contact with potential customers
Business productivity
Business turnover
Business profit
% of respondents
Impa
ct o
n bu
sine
sses
of b
eing
in a
not
-spo
t
0% 20% 40% 60% 80%
Small businesses Large businesses
Figure 4.8: Impact on businesses of being in a not-spot
Respondents who identified that there were negative impacts on their businesses were then asked to estimate the scale of impacts. Figure 4.9 summarises reported cost levels by business segment. Many business respondents found it difficult to quantify the impacts, but of those who were able to make estimations (47 per cent of businesses and 41 per cent of home-run businesses), almost 65 per cent reported losses between £100/month and £250/month. The remaining 35 per cent reported monthly losses in excess of this value, with 1 per cent (large businesses) indicating monthly losses greater than £50,000/month. It is observed that there seems to be a relationship between the size of the impact and the size of the business, with larger impacts being reported by larger businesses.
Business segments (large and small) and resident home-run businesses returned estimated slightly higher costs than local visitor businesses (Figure 4.9). This is consistent with earlier findings (see Section 4.3.5), where those located in the not-spot area were found to be willing to pay more for mobile phone services than local visitors or tourists.

58 Estimating The Value Of Mobile Telephony In Mobile Network Not-Spots
(63 per cent of the large businesses) stated that they would spend a small amount of money to improve mobile phone coverage. Only 19 per cent of tourists agreed with this statement.
% of respondents
0% 20% 40% 60% 80% 100%
Mobile phone can be replaced by fixed line phone
The mobile phone coverage in an important element whenI choose the mobile phone network/operator company
Good mobile phone coverage will improve myconnection with friends and family
I would like to spend a small amount of extra moneyto have or improve mobile phone coverageA
ttitu
des
tow
ards
mob
ile p
hone
s
Residents Local visitors Tourists
Figure 4.10: Attitudes towards mobile phones – residents, local visitors and tourists
% of respondents
0% 20% 40% 60% 80% 100%
Mobile phone can be replaced by fixed line phone
The mobile phone coverage in an important element whenI choose the mobile phone network/operator company
Good mobile phone coverage will improve mybusiness productivity
Good mobile phone coverage will improve myconnection with business partners and clients
I would like to spend a small amount of extra moneyto have or improve mobile phone coverage
Atti
tude
s to
war
ds m
obile
pho
nes
Local vistor businesses Small businessesHome-run businesses Large businesses
Figure 4.11: Attitudes towards mobile phones – businesses

Chapter Five.Summary of findings

62 Estimating The Value Of Mobile Telephony In Mobile Network Not-Spots 63
of residents stating this to be the case, alongside over 60 per cent of local visitors. This was also one of the most important factors cited by businesses, with over 60 per cent of large businesses and 50 per cent of small businesses reporting that ownership of mobile phones was important to manage the safety of staff.
5.1.3 Improved mobile phone services would benefit local businesses
Despite the lower proportion of mobile phone ownership in our business sample, compared with the other population groups (see Table 4.4), a substantial percentage of business respondents identified drawbacks associated with being located in a not-spot area. For large businesses these included the inability to communicate effectively with colleagues, contact suppliers/business partners and lack of flexibility in decisionmaking. For smaller businesses, key issues were hindrances in building contacts, contacting suppliers/business partners, and loss of profit.
About half of the respondents from both large and small businesses indicated that being located in a not-spot area had a negative impact on business profits, turnover and productivity (Figure 4.8). However, respondents found it difficult to estimate the size of this impact. Of those who were able to make an estimate (47 per cent of businesses and 41 per cent of home-run businesses), almost 65 per cent reported losses between £100/month and £250/month (see Figure 4.8). The remaining 35 per cent reported monthly losses in excess of this value, with 1 per cent (large businesses) indicating monthly losses greater than £50,000/month. It is observed that there seems to be a relationship between the size of the impact and the size of the businesses, with larger impacts being reported by larger businesses.
5.1.4 Lack of mobile phone services may affect the long-term sustainability of rural communities
Although respondents felt that the benefits of rural life outweighed the disadvantages, including lack of mobile services, some felt it was unfair that their areas were being left behind as telecommunications technology advances. There was some evidence from the qualitative research undertaken for this study that, for some younger people, rural areas without a mobile signal are less desirable to live in. Those who said they had less need for mobile phone reception were most likely to be middle aged and older respondents who had grown up without relying on a mobile telephone and felt content to live without a reliable signal.
Moreover, difficulties in the provision of other services in rural areas were felt to exacerbate the problem. Many respondents who participated in the qualitative research mentioned additional difficulties of living in a rural area which included having a poor radio signal, a poor television signal, poor transport links, intermittent electricity supply and a poor or intermittent Internet service. In terms of priorities for improvement, for older respondents the lack of a strong and consistent broadband and radio signal was regarded as being more problematic than the lack of a reliable mobile telephone signal. Younger people were more typically torn between wanting a better mobile telephone signal and either a speedier broadband connection or better transport connectivity if they were still reliant on parents for lifts.
5.1 Key FindingsBelow we summarise the key findings from the study, starting with general observations and culminating in presentation of WTP valuations for provision of mobile services in not-spot areas. We also highlight important caveats to the work.
5.1.1 Most people living in not-spot areas own mobile phones
Despite living in rural areas without mobile phone reception, the majority of respondents in the survey owned a mobile telephone. Specifically, over 97 per cent of residents and local visitors to not-spot areas owned a mobile phone for personal use. A slightly lower percentage of those running businesses from home owned mobile phones, but the figures were still high, with ownership levels over 85 per cent. By design, all residents and local visitors in our sample also had a landline, and they used their landline more, per day, than their mobile phone.
The main reason for owning a personal mobile phone appears to be for peace of mind, to offer the possibility of communicating with others should the need arise, which is most relevant when plans change or problems occur. In the qualitative research respondents said that even though they were not always able to use their mobile phones (because of a lack of signal), it was worth owning one to at least have the possibility of doing so, on the occasions when they were able to obtain a signal. For example, a few respondents mentioned that when children go to secondary school they get a mobile telephone so that they can (hopefully) stay in contact with parents and friends while travelling. Another reported reason for mobile phone ownership was to support relationships. For example, several respondents spoke of friends and family members living far away and their using a mobile telephone to help them keep in contact irrespective of where they are throughout the day.
Mobile phone ownership was much lower for business respondents: 54 per cent indicated that they had a mobile phone for personal use, and 34 per cent of small businesses and 41 per cent of large businesses had a mobile phone for business purposes. We found no significant relationship between mobile phone ownership and usage and the scale of business or type of industry (see Section 4.1.3). This may be a result of the relatively small number of business observations for each industry type in the sample. However, we did find that the businesses in the survey tended to be located in more remote areas compared to residents and local visitors, as measured by the average distance to the next house, which may have an impact on mobile phone ownership.
More than two-thirds of residents and 80 per cent of local visitors and businesses felt that it was important to be able to make and receive mobile phone calls. About a third of residents and local visitors thought it was important to be able to get Internet services on their phone; far more business respondents (48 per cent) and tourists (42 per cent) thought that this was important.
5.1.2 Among both residents and businesses, a key reason for having a mobile phone is to deal with emergencies
The most important reason cited by resident and local visitor survey participants for owning a mobile phone was dealing with potential emergencies – with almost 80 per cent

64 Estimating The Value Of Mobile Telephony In Mobile Network Not-Spots 65
The first (Table 5.1) presents WTP valuations assuming that the quality of mobile phone signal provided to the not-spot areas would be the same as current alternatives nearby; the second (Table 5.2) presents valuations assuming that the quality of the local signal would be better. The valuations vary depending on the distance that individuals currently have to travel to get a signal. Average valuations are also presented for the average reported distanced travelled by the respondents in our survey to get a signal.
The average willingness to pay for residents in not-spot areas for local 2G services of the same quality of those available nearby is £12/month (+/- £4.10). It is emphasised that this is in addition to the amount that they would pay for a service contract. If the quality of signal is improved, relative to a weak signal nearby, residents would be willing to pay £23.40/month (+/- £5.10). The value of mobile phone services for local visitors to not-spot areas is £6.30/month (+/- £3.80), for the same quality of service, and £15.10/month (+/- £4.10), for improved services. The values for businesses are £20.90/phone/month (+/- £11.50) and £24.50/phone/month (+/- £14.00), for the same or improved services, respectively. We found that the values for tourists over 65 years old are higher than for those under 65, with tourists over 65 being willing to pay 40 pence per day (+/- £0.35) and those under 65 being willing to pay 20 pence per day (+/- £0.10) for mobile services of the same quality at their tourist destination, and £3.00/day (+/- £0.80) and £2.70 per day (+/- £0.70) for improved services, by age category respectively.
Table 5.1: WTP for local 2G services with the same quality as current mobile service alternatives, by distance saved for travelling to get current services, by population segment
Distance saved (miles) Residents(£/month)
Local visitors
(£/month)
Businesses(£/month/
phone)
Tourists (<65)
(£/day)
Tourists (>65)
(£/day)Can get a signal outside
– Age <65 years 6.00– Age >65 years
Current distance travelled (miles)0.25 10.70 4.80 17.30 0.10 0.10
0.5 11.20 5.30 18.60 0.10 0.301 12.20 6.10 21.20 0.20 0.502 14.20 7.70 26.50 0.40 1.005 20.10 12.60 42.40 0.90 2.50
Average valuations:Average distance travelled (miles) 0.92 1.16 0.94 0.85 0.85
Average WTP (for average distance) 12.00 6.30 20.90 0.20 0.4090% Confidence Interval +/-4.10 +/-3.80 +/-11.50 +/-0.10 +/-0.35
* All valuations have been rounded to the nearest 10p
Almost all respondents who participated in the qualitative research felt that having improved mobile telephone reception in their area would be a positive thing for the whole community. For some there was a perception that those who would benefit most were businesses and younger people. For others, having a reliable mobile telephone signal would mean less wasted time, reduced anxiety about being out of contact when needed, and enhanced flexibility in how they spend their day. There would also be benefits for those seeking employment and reduced costs for those who did not wish to finance both a landline and a mobile phone. Though a few could see positive aspects to a lack of mobile signal (relating to privacy and control over contactability), the overall advantages of improved connectivity were felt to outweigh any disadvantage.
5.1.5 The potential visual impact of additional mobile phone masts was not a major concern
The reaction to the potential arrival of telephone masts in the local area was fairly muted. Whilst some regard telephone masts as an eyesore it was more typically believed that masts would be constructed and placed in the community in a sympathetic manner in keeping with the local area and to blend in rather than stand out. Should this happen then respondents would be more likely to accept it. Consultation with local residents about the physical location of telephone masts would also be important.
5.1.6 People who live and work in, and travel to, not-spot areas are willing to pay for provision of mobile services
Respondents in all segments were willing to pay for local mobile phone services, and the further they had to travel to get a signal, the greater their willingness to pay for local services. Residents and businesses in not-spot areas were willing to pay the highest amounts for having a signal at their house or business premises. Perhaps this is not be surprising, since people actually living or working on a daily basis within not-spots may be most affected by not having mobile phone coverage. Our analysis suggested that local visitors and tourists were willing to pay less to receive a mobile phone signal.
Respondents were also willing to pay for what they perceived to be a good-quality signal (measured relative to a ‘weak’ signal), and the provision of a high-quality signal is valuable to residents, businesses, local visitors and tourists.
Respondents were willing to pay more for 3G and 4G services, but this was less important than access to a mobile phone signal per se and the quality of the signal. In general, 3G services were preferred to 2G services, although not by local visitors or tourists aged 45 years or older. Somewhat unexpectedly, we did not find 4G services to be valued more highly than 3G services, except among tourists aged less than 45 years. This may be because most people have not yet experienced 4G services and have yet to see the value of them. Thus we would expect these valuations to change in the future.
Below we present two tables summarising the WTP valuations for 2G services for each population segment, and their 90% confidence intervals. Valuations for 3G and 4G services are presented in the main body of the report.
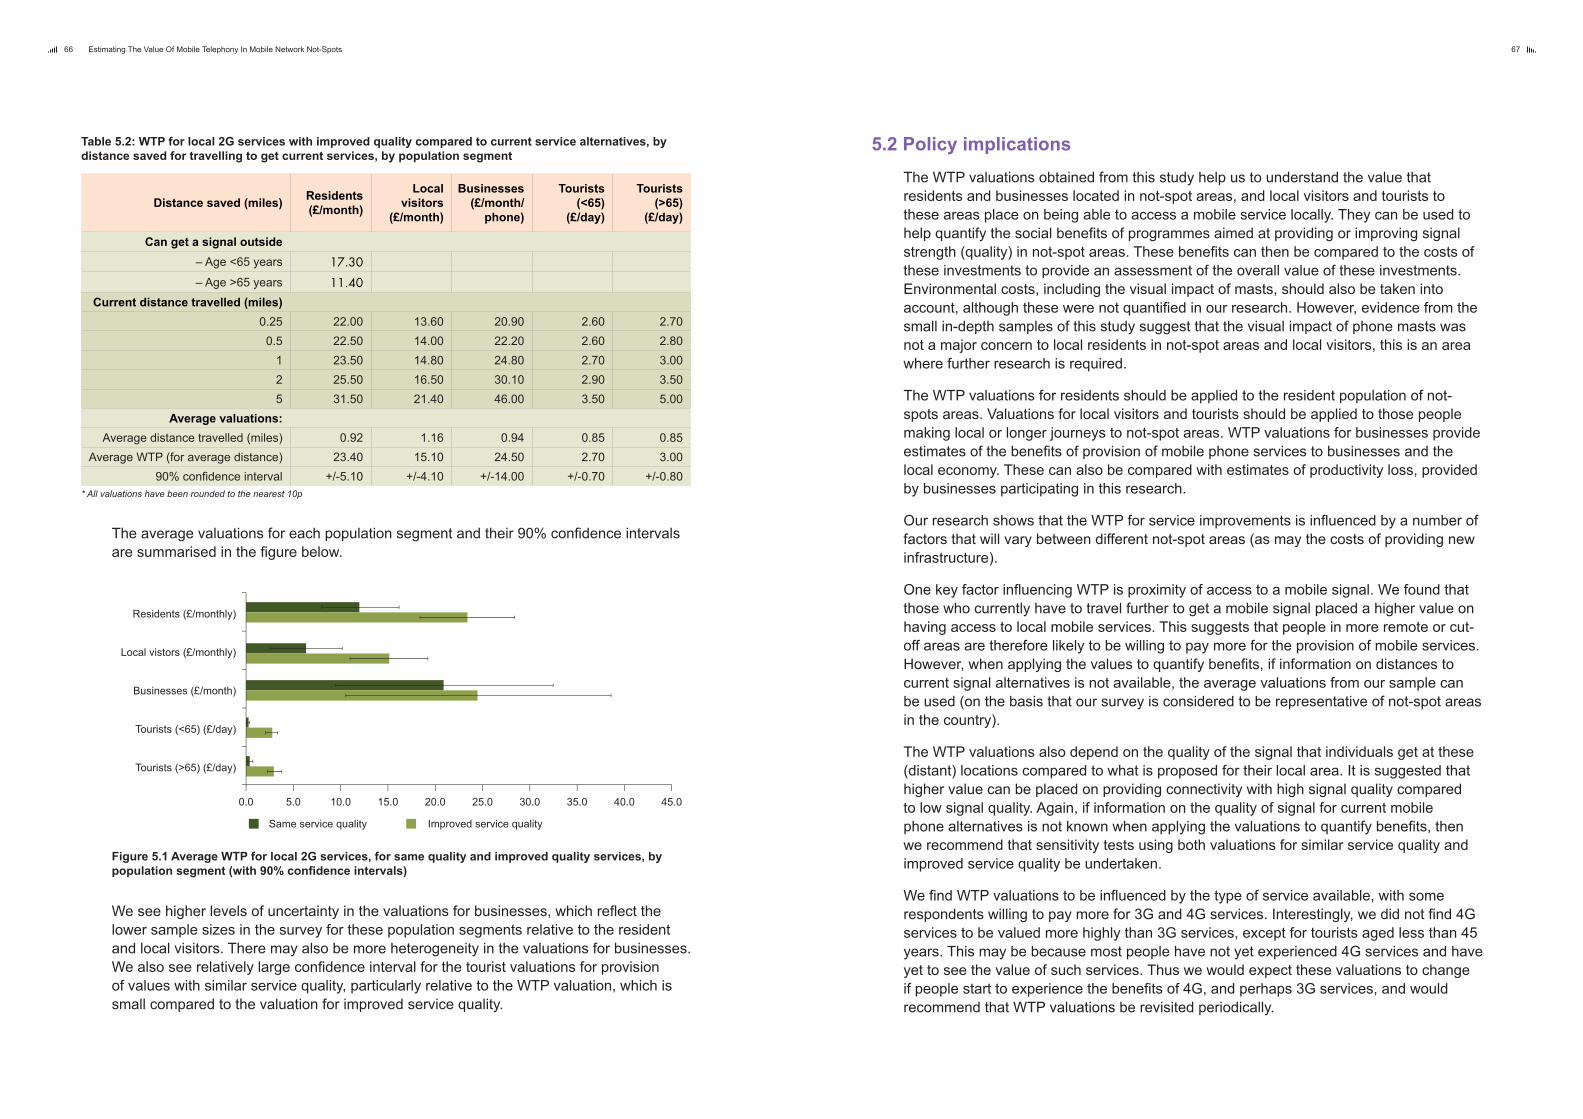
66 Estimating The Value Of Mobile Telephony In Mobile Network Not-Spots 67
5.2 Policy implicationsThe WTP valuations obtained from this study help us to understand the value that residents and businesses located in not-spot areas, and local visitors and tourists to these areas place on being able to access a mobile service locally. They can be used to help quantify the social benefits of programmes aimed at providing or improving signal strength (quality) in not-spot areas. These benefits can then be compared to the costs of these investments to provide an assessment of the overall value of these investments. Environmental costs, including the visual impact of masts, should also be taken into account, although these were not quantified in our research. However, evidence from the small in-depth samples of this study suggest that the visual impact of phone masts was not a major concern to local residents in not-spot areas and local visitors, this is an area where further research is required.
The WTP valuations for residents should be applied to the resident population of not-spots areas. Valuations for local visitors and tourists should be applied to those people making local or longer journeys to not-spot areas. WTP valuations for businesses provide estimates of the benefits of provision of mobile phone services to businesses and the local economy. These can also be compared with estimates of productivity loss, provided by businesses participating in this research.
Our research shows that the WTP for service improvements is influenced by a number of factors that will vary between different not-spot areas (as may the costs of providing new infrastructure).
One key factor influencing WTP is proximity of access to a mobile signal. We found that those who currently have to travel further to get a mobile signal placed a higher value on having access to local mobile services. This suggests that people in more remote or cut-off areas are therefore likely to be willing to pay more for the provision of mobile services. However, when applying the values to quantify benefits, if information on distances to current signal alternatives is not available, the average valuations from our sample can be used (on the basis that our survey is considered to be representative of not-spot areas in the country).
The WTP valuations also depend on the quality of the signal that individuals get at these (distant) locations compared to what is proposed for their local area. It is suggested that higher value can be placed on providing connectivity with high signal quality compared to low signal quality. Again, if information on the quality of signal for current mobile phone alternatives is not known when applying the valuations to quantify benefits, then we recommend that sensitivity tests using both valuations for similar service quality and improved service quality be undertaken.
We find WTP valuations to be influenced by the type of service available, with some respondents willing to pay more for 3G and 4G services. Interestingly, we did not find 4G services to be valued more highly than 3G services, except for tourists aged less than 45 years. This may be because most people have not yet experienced 4G services and have yet to see the value of such services. Thus we would expect these valuations to change if people start to experience the benefits of 4G, and perhaps 3G services, and would recommend that WTP valuations be revisited periodically.
Table 5.2: WTP for local 2G services with improved quality compared to current service alternatives, by distance saved for travelling to get current services, by population segment
Distance saved (miles) Residents(£/month)
Local visitors
(£/month)
Businesses(£/month/
phone)
Tourists (<65)
(£/day)
Tourists (>65)
(£/day)
Can get a signal outside– Age <65 years 17.30
– Age >65 years 11.40Current distance travelled (miles)
0.25 22.00 13.60 20.90 2.60 2.700.5 22.50 14.00 22.20 2.60 2.80
1 23.50 14.80 24.80 2.70 3.002 25.50 16.50 30.10 2.90 3.505 31.50 21.40 46.00 3.50 5.00
Average valuations:Average distance travelled (miles) 0.92 1.16 0.94 0.85 0.85
Average WTP (for average distance) 23.40 15.10 24.50 2.70 3.0090% confidence interval +/-5.10 +/-4.10 +/-14.00 +/-0.70 +/-0.80
* All valuations have been rounded to the nearest 10p
The average valuations for each population segment and their 90% confidence intervals are summarised in the figure below.
0.0 5.0 10.0 15.0 20.0 25.0 30.0 35.0 40.0 45.0
Tourists (>65) (£/day)
Tourists (<65) (£/day)
Businesses (£/month)
Local vistors (£/monthly)
Residents (£/monthly)
Same service quality Improved service quality
Figure 5.1 Average WTP for local 2G services, for same quality and improved quality services, by population segment (with 90% confidence intervals)
We see higher levels of uncertainty in the valuations for businesses, which reflect the lower sample sizes in the survey for these population segments relative to the resident and local visitors. There may also be more heterogeneity in the valuations for businesses. We also see relatively large confidence interval for the tourist valuations for provision of values with similar service quality, particularly relative to the WTP valuation, which is small compared to the valuation for improved service quality.

68 Estimating The Value Of Mobile Telephony In Mobile Network Not-Spots 69
businesses, local visitors, and tourists. Three different service attributes were considered and it was found that all groups were willing to pay to avoid having to travel to obtain a signal. They were also prepared to pay a similar amount to have a strong signal but were less interested in having a better type of mobile phone service (3G/4G instead of 2G). In general businesses were willing to pay the most and tourists the least. Overall, using the average distance currently travelled by respondents in this survey, it was possible to calculate average willingness to pay for a set of combined improvements (for example a strong signal at home with 2G service). These values could then be used more generally to determine the benefits to not-spot users of a particular policy intervention.
Overall, the qualitative research supported the quantitative results, as well as informing opinion on the social and economic benefits resulting from improved connectivity. We found that the lack of a mobile phone signal may affect the long-term sustainability of rural communities by limiting employment opportunities. There was also limited evidence that, for some younger people, rural areas without a mobile signal were less desirable to live in. The visual impact of mobile phone masts was not found to be unimportant.
We emphasise several caveats to the study findings: first, stated preference experiments may over-estimate willingness-to-pay valuations, and this should be recognised in quantifying the benefits of proposed schemes; second, the valuations are relevant for those who live, work and travel to not-spot areas and cannot be used to calculate the value to society as whole of elimination all not-spot areas; and third, the qualitative research is based on a small sample, and the results should be treated with some caution.
5.3.1 Potential future work
Below we set out potential future work that could further inform the issues investigated in this study.
Examination of socio-economic variation of WTP valuations within population segmentsWhilst the sample sizes used for this study provide robust WTP estimates for the resident and local visitor segments, they were not large enough to identify differences in valuations across different sub-populations, for example by family structure, gender, etc. This was also an issue for the business surveys, where the sample sizes were smaller. Should such information be required, it would be useful to repeat the study with larger sample sizes.
Further research on the environmental costs of mobile phone infrastructureA key aspect of this study was to quantify the value of obtaining mobile coverage to residents and businesses located in not-spot areas and local visitors and tourists to not-spot areas. Through in-depth surveys we also explored some of the issues and costs of living and having businesses in not-spot areas, as well as environmental concerns with the provision of mobile phone infrastructure. However, the sample sizes for these surveys were small and the results should therefore be treated with caution. To obtain a more robust assessment of these costs further research targeted on these specific issues would be required.
We present 90% confidence intervals for the estimates, and we recommend that sensitivity tests are undertaken when comparing the WTP benefits with costs, using the lower-bound estimates.
Finally, we also found some evidence, albeit from small samples, that young people find rural areas without a mobile phone signal less desirable to live in. This might suggest that the provision of mobile phone coverage may influence the future structure and sustainability of communities affected by not-spots The impact of availability of mobile services on the structure of the economy may also an important factor. This study found that even though local businesses had lower mobile phone ownership than not-spot residents, they too were willing to pay for local mobile phone services (£20.90/phone/month for 2G services of the same quality as current services and £24.50/phone/month for 2G services with improved signal quality). The study has not directly examined the extent to which availability of mobile services might affect both business performance and the types of businesses which can operate in remote and rural areas. However, this is potentially significant, and it is proposed that the availability of mobile services could be an important factor in ensuring diverse rural economies, and long-term sustainability of rural communities. This is an area that could both be further investigated in future research, and be monitored as a possible impact of new and improved mobile infrastructure services (such as 4G deployment, or resulting from the Government’s £150million investment in the Mobile Infrastructure Project).
5.3 Concluding remarksThe objective of the study presented in this report was to estimate the social and economic impacts associated with eliminating mobile not-spot areas. This arose from a concern that, despite measures to widen coverage, it is likely that complete not-spots will persist in isolated rural areas. Given the increasing use of mobile phones throughout the population and particularly by businesses, it was considered important to understand the range of costs and benefits to different groups, and society as a whole, from provision of mobile coverage in complete not-spot areas in rural locations within England.
A research approach was designed to address these issues using a mix of qualitative and quantitative methods to provide an estimate of the value of mobile telephony in mobile network not-spots. The specific questions that were examined quantitatively were the value to residents and businesses of obtaining coverage on existing networks, and the benefits to tourists and other local visitors who visit current not-spot areas. We found that the majority of people living in not-spot areas owned a mobile phone, the key reason being to deal with emergencies, both for residents and businesses. Businesses also cited communication with business partners, customers and colleagues as important reasons for using a mobile phone and also the main impact of not being able to use one. About half of the respondents from our survey, both from large and small businesses, indicated that being in a not-spot area had a negative impact on their profit, turnover and productivity. Although many found it difficult to estimate the size of this impact, there did seem to be a relationship between the size of the impact and the size of the business.
The stated preference discrete choice experiment that was carried out enabled the average willingness to pay for an improved mobile phone service to be calculated for the four different groups of interest: residents (including those with run home-run businesses,

7170 Estimating The Value Of Mobile Telephony In Mobile Network Not-Spots
Ben-Akiva, M., & S.R. Lerman. 1985. Discrete Choice Analysis: Theory and Application Travel Demand. Cambridge: The MIT Press.
Bradley, M.A., & A.J. Daly. 1991. ‘Estimation of Logit Choice Models using Mixed Stated Preference and Revealed Preference Information.’ Presented to the 6th International Conference on Travel Behaviour, Québec; revised version presented to the Duke International Symposium on Choice Modelling and Behaviour, 1993. In Understanding Travel Behaviour in an Era of Change, edited by P. Stopher & M. Lee-Gosselin, 209–31. Oxford: Pergamon.
Daly, A., Hess, S. and G. de Jong. 2012. ‘Calculating errors for measures derived from choice modelling estimates’, Transportation Research Part B, 46 (2), pp. 333–341.
Efron, B., & R.J. Tibshirani. 1993. An Introduction to the Bootstrap. New York: Chapman & Hall.
European Commission. 2014. Connected Continent: A Single Telecom Market for Growth & Jobs. As of 9 May 2014: http://ec.europa.eu/digital-agenda/en/connected-continent-single-telecom-market-growth-jobs
HM Government. 2013a. Connectivity, Content and Consumers: Britain’s Digital Platform for Growth. Department for Culture, Media & Sport. As of 9 May 2014: https://www.gov.uk/government/publications/connectivity-content-and-consumers-britains-digital-platform-for-growth
HM Government. 2013b. Making it Easier for the Communications and Telecoms Industries to Grow, While Protecting the Interests of Citizens. Department for Culture, Media & Sport. As of 9 May 2014: https://www.gov.uk/government/policies/making-it-easier-for-the-communications-and-telecoms-industries-to-grow-while-protecting-the-interests-of-citizens/supporting-pages/improving-mobile-coverage
HM Government. 2013c. First Homes Benefit After Government Investment to Improve Mobile Coverage Nationwide. Department for Culture, Media & Sport. As of 9 May 2014: https://www.gov.uk/government/news/first-homes-benefit-after-government-investment-to-improve-mobile-coverage-nationwide
HM Government. 2013d. Transport analysis guidance: WebTAG. As of 9 May 2014: https://www.gov.uk/transport-analysis-guidance-webtag
ReferencesExamination of values for those experiencing not-spots whilst travellingThe current study focuses on providing valuations for the provision of mobile services in current not-spot locations. However, many people experience a lack of mobile phone service in other situations, for example while travelling. Stated preference methods could also be used to provide willingness-to-pay valuations for mobile phone services in these instances.
Further monitoring of valuations for 4G servicesSomewhat unexpectedly, the current study did not find 4G services to be valued more highly than 3G services, except among tourists aged less than 45 years. This may be because most people have not yet experienced 4G services and have yet to see the value of such services. We would therefore recommend that this study be repeated in future as more individuals experience the benefits of 3G and 4G services.
Wider benefits of provision of mobile phone servicesThe current study focuses on the value of mobile phone services as assessed by current residents and visitors to not-spot areas. However, provision of these services could have wider benefits, enticing businesses and residents, and could affect the structure of rural economies. Availability of mobile coverage is therefore potentially critical in ensuring future sustainability of areas that are currently affected by not-spots. Whilst these benefits were not directly investigated in this study, this is something that could be investigated further, and should be monitored with the roll out of the Mobile Infrastructure Project (MIP).

72 Estimating The Value Of Mobile Telephony In Mobile Network Not-Spots 73
HM Government. 2014. The Green Book: Appraisal and Evaluation in Central Government. As of 9 May 2014: https://www.gov.uk/government/publications/the-green-book-appraisal-and-evaluation-in-central-governent
Illuminas. 2010. Not Spots Research: Qualitative Research Report. Prepared for Ofcom.
Louviere, J.J., Hensher, D.A., & J.D. Swait. 2000. Stated Choice Methods: Analysis and Applications. Cambridge: Cambridge University Press.
Ofcom. 2010. Mobile Not-spots: An Update on our Research. As of 9 May 2014: http://stakeholders.ofcom.org.uk/binaries/research/telecoms-research/not-spots/not-spots.pdf
Ofcom. 2012. Infrastructure Report. As of 9 May 2014: http://stakeholders.ofcom.org.uk/binaries/research/telecoms-research/infrastructure-report/Infrastructure-report2012.pdf
Ofcom. 2013a. Communications Market Report. As of 9 May 2014: http://stakeholders.ofcom.org.uk/binaries/research/cmr/cmr13/2013_UK_CMR.pdf
Ofcom. 2013b. Infrastructure Report. As of 9 May 2014: http://stakeholders.ofcom.org.uk/binaries/research/telecoms-research/infrastructure-report/IRU_2013.pdf
Office for National Statistics. 2013. Urban and Rural Area Definitions for Policy Purposes in England and Wales: Methodology (v1.0). As of 9 May 2014: https://www.gov.uk/government/uploads/system/uploads/attachment_data/file/239477/RUC11methodologypaperaug_28_Aug.pdf
PA Consulting Group. 2010. Not-spots Research: Impacts, Causes and Potential Solutions for Areas of Poor Coverage, Not-spots. Prepared for Ofcom.
Pateman, T. 2011. ‘Rural and Urban Areas: Comparing Lives Using Rural/Urban Classifications.’ Regional Trends 43. Office of National Statistics.
Rohr, C., Rubin, J., Winpenny, E., Daly, A., Lu, H., Hess, S. and P. Burge. 2013. Consumers’ Responsiveness to Alcohol Multi-Buy Sales Promotions: Results from a Stated Preference Choice Experiment, RAND Technical Report, available on http://www.hmrc.gov.uk/research/report263.pdf.
Train, K. 2003. Discrete Choice Methods with Simulation. Cambridge: Cambridge University Press.