estimating the value of medal success at the 2010 winter ...econwps/2011/wp2011-20.pdf ·...
TRANSCRIPT

Working Paper No. 2011-20
Estimating the Value of Medal Success at the 2010 Winter
Olympic Games
Brad R. Humphreys University of Alberta
Bruce K. Johnson
Centre College
Daniel S. Mason University of Alberta
John C. Whitehead
Appalachian State University
November 2011 Copyright to papers in this working paper series rests with the authors and their assignees. Papers may be downloaded for personal use. Downloading of papers for any other activity may not be done without the written consent of the authors. Short excerpts of these working papers may be quoted without explicit permission provided that full credit is given to the source. The Department of Economics, The Institute for Public Economics, and the University of Alberta accept no responsibility for the accuracy or point of view represented in this work in progress.

P a g e | 1
Estimating the Value of Medal Success at the 2010 Winter Olympic Games
Brad R. Humphreys
University of Alberta
Bruce K. Johnson
Centre College
Daniel S. Mason
University of Alberta
John C. Whitehead
Appalachian State University
November 2011
Abstract: We estimate Canadians’ willingness to pay (WTP) for success by Team Canada in the
2010 Winter Olympic Games. The Canadian government subsidized elite athletes in the run up
to the 2010 Games through the Own the Podium program, which was designed to increase
Canada’s medal count. WTP estimates from a contingent valuation method study using data
from nationally representative surveys before and after the Vancouver Games suggest that Own
the Podium generated intangible benefits equal to 2 to 4 times its cost. The aggregate value of the
intangible benefits generated by the program was between $251 million and $3.4 billion.
Key words: Olympic Games, willingness to pay, elite athletics, CVM
JEL Codes: H49, H59, L83
Humphreys: Department of Economics, Edmonton, Alberta, T6G 2H4, phone: 780-492-5143,
fax: 780-492-3300, email: [email protected]. Johnson: Department of Economics,
Danville, KY 40422, phone: (859) 238-5255, email: [email protected]. Mason: Faculty
of Physical Education and Recreation, Edmonton, Alberta T6G 2H9, phone: 780-492-6822,
email: [email protected]. Whitehead: Department of Economics, Boone, NC 28608, phone:
(828) 262-6121, e-mail: [email protected]. This research was funded by the Social
Sciences and Humanities Research Council of Canada, Award #410-2009-0920. We thank
Christine Young of Consumer Contact for her help with the survey and data collection.

P a g e | 2
Introduction
Many national governments subsidize elite athletes to make them more competitive in
international competition, especially the Olympic Games. For example, Germany has spent
hundreds of millions of dollars on schools developed to identify and train elite athletes. China
subsidizes talent identification and coaching, especially in sports that Western nations neglect.
Australia began a similar strategy after failing to win a gold medal in the 1976 Summer Olympic
Games. Japan in 2000 spent $185 million on a National Training Center and in 2003 began spending
about $5 million per year in subsidies to athletes judged to be potential medal winners. (I. Johnson,
2008, p.A1). Swiss federal and cantonal governments directly and indirectly provide about $35
million per year to Swiss Olympic, the Swiss National Olympic Committee, with medium-term goals
to place in the top 8 Winter and top 25 Summer medal counts (Swiss Olympic, 2010, pp. 6, 10).
The Canadian government, through Sport Canada, operates three programs designed to
develop and support elite athletes: the Sport Support Program, the Hosting Event Program, and the
Athlete Assistance Program. In 2007-08, Sport Canada provided these programs a total of $119.6
million in support. In addition, Canada spent $110 million on its Own the Podium program, geared
specifically toward enhancing Canadian performance in the 2010 Vancouver Winter Olympics. To
that point, Canada was one of only two host nations not to win a gold medal at its own Olympics,
and had the dubious distinction of being the only host to be shut out twice at home, at both the
1976 Summer Games in Montreal and the 1988 Winter Games in Calgary. Created in 2005, Own the
Podium was intended to help Canada achieve a best-ever finish in the medal count in Vancouver.
Whether due to Own the Podium or not, Canada did extremely well in the Vancouver Games, winning
an all-time, all-nation, Winter Olympics record 14 gold medals, and finishing third behind the United
States and Germany in the overall medal count with 26.
Before the Vancouver Games, many Canadians approved of government spending to
support elite athletes. In July of 2006, a survey by NRG Research Group found that 73 percent of
Canadians approved of the Own the Podium program’s goal of making Canada win the medal count
and place in the top three countries in gold medals in 2010. In addition, 69 percent of Canadians
reported that it was important for Canada to be the top medal finisher in 2010 (NRG Research
Group, 2006). While Canadians and others clearly approve of the use of public funds to support
their nations’ elite athletes, to this point there has been no attempt to compare this support to the
actual level of spending on elite athletics by national governments. In other words, do the benefits
exceed the costs in this case?

P a g e | 3
The economic benefits of Olympic success for a nation’s athletes would come primarily
from public goods such as national pride.a In this paper, we undertake a Contingent Valuation
Method (CVM) study of the intangible benefits generated by the performance of Canadian athletes
in the 2010 Vancouver Winter Olympic Games. This project represents an important extension of
sports CVM research into a previously unexamined area. Based on data from two nationwide
surveys, estimates suggest that the benefits of Canadian spending on elite athletes far exceed the
costs. This finding stands in stark contrast to those in nearly every other published CVM analysis of
the benefits of sports-related public goods, which almost invariably find that costs exceed benefits.b
CVM and willingness to pay for sport
The contingent valuation method (CVM) is a survey technique widely used by economists to
measure the value of public goods, first adapted to sports by Johnson and Whitehead (2000). The
idea behind CVM research is straightforward. Respondents are presented with a hypothetical market
in which they can pay for a specified increase in a public good or pay to avoid a specified loss of a
public good. Their willingness to pay is contingent upon the hypothetical scenarios and markets
described to them in the survey, hence the name “contingent valuation method" (Mitchell and
Carson, 1989). An example would be a scenario suggesting that a professional sports team might
relocate unless the team is purchased by the host city; to buy the team, a yearly tax on local
households would be required (see, for example, Johnson, Mondello & Whitehead, 2007).
Sports CVM research covering a diverse set of scenarios have been conducted, analyzing
willingness to pay for public goods produced by the National Hockey League’s Pittsburgh Penguins
(Johnson, Groothuis, and Whitehead, 2001), the National Football League’s Jacksonville Jaguars
(Johnson, Mondello, and Whitehead, 2007), a hypothetical National Basketball Association team in
Jacksonville, Florida (Johnson, Mondello, and Whitehead, 2007), a hypothetical Major League
Baseball team in Portland, Oregon (Santo, 2007), the NFL’s Minnesota Vikings (Fenn and Crooker,
2009), a college basketball arena and a minor league baseball team in Lexington, Kentucky (Johnson
and Whitehead, 2000), and amateur sports and recreation programs in Alberta, Canada (Johnson,
Whitehead, Mason, and Walker, 2007).
a Other benefits include reduced health care costs associated with Canadians becoming inspired to become more
physically active by the athletic performances of elite athletes. b A notable exception is Fenn and Crooker, (2009), who found that the benefits of keeping the Minnesota Vikings in
the state roughly equaled the cost of a new stadium.

P a g e | 4
The CVM has recently been used to value the intangibles of hosting major world sporting
events. Atkinson, Mourato, Szymanski, and Ozdemiroglu (2008) surveyed residents in London,
Glasgow, and Manchester, UK, and estimated that Britons were willing to pay in excess of $3 billion
for the intangible benefits generated by hosting the 2012 Summer Olympics in London. Walton,
Longo, and Dawson (2008) surveyed people from Bath and southwest England and also found
substantial willingness to pay for the intangible benefits generated by the London Olympics.
Süssmuth , Heyne and Maennig, (2010) surveyed Germans’ willingness to pay to host the 2006 FIFA
World Cup football tournament. Their survey conducted before the Cup found a willingness to pay
of $467 million for the feel-good factor of hosting the World Cup. A follow-up survey conducted
after the Cup found willingness to pay had risen to $1.1 billion.
To date, no CVM study has estimated the value of national pride and unity generated by
watching fellow citizens win Olympic medals. Certainly, much anecdotal evidence suggests that
people value their nation’s elite athletic success. For example, the 1972 Summit Series hockey games
between Canada and the Soviet Union are regarded as a defining moment in Canadian history. In
the Olympics, a similar response was engendered by the gold medal success of both the Canadian
men’s and women’s ice hockey teams at the 2002 Games in Salt Lake City. Many people consider
the 1980 Olympic hockey victory of the United States over the Soviet Union one of America’s
greatest sporting triumphs. Fans around the world follow the daily medal counts during the
Olympics to see where their nations stand. People seem pleased when their nation does better than
expected and displeased when it underperforms. Television ratings spike if a nation’s athletes are
contending for the gold medal. This obvious interest is invoked to justify the subsidies governments
provide to aspiring Olympians who will represent their countries. The CVM analysis in this study
will allow comparison of the costs of Canada’s subsidies to the benefits, as measured by the
estimated willingness to pay for national pride and unity generated by Olympic gold.
The Theoretical Basis for CVM Analysis
Suppose survey respondents possess a utility function u = u(x,h,z) where u is increasing in x,
h, and z; x measures consumption of sporting events, h captures the existence of sports public
goods, which is increasing in the Olympic medal count, and z is a composite commodity of market
goods. Sport produces both public and private goods. The budget constraint is y = z + px where y is
income and p is the money cost of sports consumption, including ticket prices and costs of travel to

P a g e | 5
sporting events. The price of the composite commodity is normalized to one and the existence of
sports public goods is an unpriced non-market good.
Solving the utility maximization problem yields the indirect utility function, u = v(p,h,y),
which is decreasing in p and increasing in h and y. If respondents minimize expenditures, z + px,
subject to the utility constraint, the resulting expenditure function is e = e(p,h,u). The expenditure
function is increasing in p and u and decreasing in h. With the elimination of sports (h = 0), the
expenditures necessary to reach the reference utility level increase. The difference between
expenditure functions is the willingness to pay for sports
(1) WTP = e(p’,0,u) – e(p,h,u)
where WTP is willingness to pay and p’ is the price at which no sports are consumed. Substitution of
v(p,h,y) into (1) for u yields the compensating variation (CV) function
(2) CV = e(p’,0,v(p,h,y)) – y
where CV(p,h,y) is the variation function and y = e(p,h,v(p,h,y)). The effect of changes in income on
the compensating variation can be found from
(3) CV/y = (e’/v)(v/y) – 1 = (e’/v)/(e/v) – 1
where e’ = e(p’,0,v(p,h,y)). If h is a normal good, the marginal cost of utility is lower with the existence
and availability of sports, (e’/v)/(e/v) > 1, and the income effect is positive, CV/y > 0. If h is
an inferior good the income effect is negative.
The valuation function can be decomposed into use and nonuse values. Nonuse value
(NUV) is the amount of money people are willing to pay when they attend zero games
(4) NUV = e(p’,0,v(p,h,y)) – e(p’,h,v(p,h,y)).
Note that the choke price is invoked in each expenditure function. Use value is the willingness to
pay for attendance at a sporting event. Use value (UV) is the difference between equations (2) and
(4)
(5) UV = e(p’,h,v(p,h,y)) – y.
Use value is the willingness to pay to avoid the choke price with sports remaining available.
By correlating the willingness to pay responses with responses about sports public goods
consumption, the relationship between household willingness to pay and consumption of such
public goods as civic or national pride and consumption of Olympic media coverage can be

P a g e | 6
determined. Willingness to pay can also be correlated to such personal and demographic
characteristics as sex, age, race, income and education.
Methodology
To assess Canadian households’ willingness to pay for Olympic medal success, we conducted
two nationally representative surveys, one before the Games, in October and early November 2009,
and the other after Games, in April and May 2010. The random digit dial telephone surveys
contacted samples stratified by region and gender, including a large subsample of respondents
contacted in both surveys.
The survey began with a series of 17 questions to get respondents thinking about the 2010
Winter Olympic Games and ended with the usual questions about respondents’ socio-economic and
demographic characteristics.
The heart of the survey revolved around the hypothetical scenarios and questions eliciting
willingness to pay for Olympic success. Before the Games, the survey informed respondents that
Canadians ranked third in total medals the 2006 Winter Olympic Games and asked how satisfied
they were with that performance. After the Games, it informed respondents about Canada’s 2010
performance. It then informed them that the federal government spends about C$120 million per
year, or about C$10 per household to support athletes participating in both the Summer and Winter
Olympic Games. Respondents were asked whether they supported such spending. Then they were
told that the Own the Podium program accounts for $3 of annual spending per Canadian household
and were asked whether they thought the Own the Podium program could increase the number of
Olympic medals won by Canadians in Vancouver. Those responding yes were led through a series of
questions to determine how many more gold and total medals Canadians might be expected to win
as a result of the Own the Podium program.
These questions set up the following hypothetical scenario:
Suppose that continuing to use federal money to fund the training of elite athletes for the Olympic Games were put to a vote. If more than half of all voters were in favour of the proposal then it would pass. Remember, if the proposal passed a typical household would continue to pay about $13 per year. If the proposal does not pass, the typical household would have about $13 more to spend on other things each year. Do you think that you would vote for or against the proposal?
This scenario allows us to estimate willingness to pay for success in the Vancouver Games and
conduct a simple cost-benefit analysis of the Own the Podium program.

P a g e | 7
Next the respondents were presented with a hypothetical scenario about expanded funding
of Own the Podium for the 2014 Winter Olympic Games. They were told that the extended program
would be financed by an annual income tax surcharge for three years of one of the following
amounts: $10, $25, $35, $50 or $65. They were asked if they thought this could increase the number
of medals won by Canadians in the 2014 Winter Games. If they said yes, they were asked a series of
follow-up questions to determine how many more total and gold medals Canadians might win, and
whether they would be satisfied with these increases.
Then the respondents were asked if they would vote in a referendum on the income tax
surcharge in one of various amounts. If they said yes, they were asked whether they would be
willing to pay more and, if yes, “How high would it be before you voted against the proposal?” If
their initial answer was no, they were asked if they would vote yes for a lower surcharge, and if so,
“How low would it need to go before you voted for the proposal?”
The survey responses allow estimation of willingness to pay for Canadian medal success and
to what extent it varies with personal and regional characteristics. The panel nature of these data will
allow a test of the temporal reliability of willingness to pay. In other words, is willingness to pay
stable over time? Temporal reliability is not an expected CVM result when a significant intervening
variable such as the 2010 Winter Games arises. The only other test of temporal reliability in a sport
CVM analysis, Süssmuth , Heyne and Maennig, (2010), found that Germans’ willingness to pay to
host the 2006 FIFA World Cup Championship more than doubled after the tournament.
Results
1,540 Canadians answered the pre-Olympic Games survey. After the Olympics, 1,660
answered, including 758 who responded to the first survey. The sample was stratified by region and
gender to represent the Canadian population. Residents of British Columbia were oversampled to
gain additional information about the use value of the Olympic Games.
Table 1 summarizes responses to several questions about pride in Canada’s success at, and
hosting of, the Olympic Games. Before the Games, 88 percent of respondents were proud to host
the Games. Nearly as many expected to feel proud if Canadians won more gold medals than US
athletes, nearly 92 percent if Canadians won more gold than any other country’s athletes, and more
than 94 percent whenever a Canadian won gold. The answers were not much different after the
Games, with the percentage changes in proud responses ranging from -3.9 percent to +6.3 percent.

P a g e | 8
Not only are Canadians proud of their Olympic success, they also think it is important. Table
2 summarizes the responses, before and after the Olympics, to three questions about the importance
of winning Olympic medals. Before the Games, about 59 percent of respondents agreed that it was
important for Canadians to win the most gold medals. The percentage rose to nearly 68 percent after
the Games. The responses to whether it was important to win more gold than Americans were
similar, at about 53 percent before and about 65 percent after the Olympics. As to whether Canada’s
medal count was important to its standing in the world, the percentage agreeing rose from 67.3 to
84.0, an increase of 24.8 percent.
Clearly, respondents thought Olympic medals are important to Canada, especially after
experiencing such great success in Vancouver. But it costs respondents nothing to say they think
medals are important. Would they put their money where their mouths were?
To determine whether the benefits of Canadian medal success exceed the costs of existing
subsidies, including Own the Podium, respondents were asked if they would vote in favor of a
referendum to continue paying taxes of $13 per household per year, the current level of federal
spending on elite athletes. Adjusting for certainty to mitigate hypothetical biasa, 54.3 percent said
before the Games that they would vote yes. After the Games, support for Own the Podium increased
significantly, with 80.9 percentb, adjusted for certainty, willing to vote yes.
The large increase in the percentage of people willing to continue funding at the current level
suggests that the feel-good effects detected by Süssmuth, et al. (2010) after the 2006 FIFA World
Cup in Germany appear to be operating in Canada, as well. It also suggests an increase in the
willingness to pay for Olympic success. To quantify the willingness to pay beyond the current level,
before the Olympics, respondents were also asked whether they would support increased funding of
Own the Podium for the 2014 Winter Olympics at levels of $5, $10, $20, $30, $35, $50 or $65 per year
over three years through an income tax surcharge. After the Olympics the tax surcharge amounts
were adjusted upward to $15, $25, $35, $50, $65, $75, $100, and $150 because early responses
indicated an apparently much higher willingness to pay than before the Olympics.
a Fifty-nine percent said they would vote in favor of the referendum. They were asked to rate, on a scale of 1 to 10,
how certain they were that they would really vote yes in a referendum. After recoding as no the yes votes of the
uncertain responders (those indicating certainty less than 7), 54.3 percent would vote yes. Recoding for certainty
mitigates hypothetical bias, the tendency of survey respondents to overstate their willingness to pay in hypothetical
situations. b 87.7 percent were in favor before adjusting for certainty.

P a g e | 9
Table 3 summarizes the responses, both before and after the Games, and before and after
adjusting for certainty. The percentage of those voting yes drops as the bid amount increases,
consistent with economic theory. Even after adjusting for certainty, more than half the respondents
in the pre-Olympics survey said they would vote for higher taxes to extend Own the Podium for the
2014 Winter Olympics. Adjusted for certainty, the percentage of respondents who said they would
vote for higher taxes rose from 52 percent before the Games to 58 percent after. The percentage in
favor rose despite the fact that hypothetical tax increases rose after the Olympics, with bid amounts
ranging from $15 to $150 in the spring as opposed to the autumn range of $5 to $65. While most
bid amounts from the first survey were not used again in the second, three were: $35, $50, and $65.
The percent voting yes at each of these bid levels rose substantially after the Games. For instance, 39
percent were certain they would vote yes at $65 before the Games, while 55 percent would have
voted yes after the Games.
Average household willingness to pay for Own the Podium can be estimated from probit
model estimates of the referendum decision, where an indicator variable identifying individuals who
reported they were certain they would vote in favor of a referendum for higher taxes is regressed on
the amount of the proposed tax:
(6) VOTESURE = f(TAX, e)
Where e is a mean zero, constant variance, random variable capturing other factors that affect a
respondent’s confidence in voting, and the variables are
VOTESURE = 1 if respondent is certain she would vote in favor of referendum for higher taxes, 0 otherwise and,
TAX = the dollar amount by which respondent’s annual household tax bill would rise if referendum passed.
This probit model was estimated with data from two samples, one using all responses to the
pre-Olympic survey and the other using all responses to the post-Olympic survey. Because of item
non-response to some important demographic questions asked later in the survey, the sample for
the pre-Olympic survey dropped from 1,540 to 1,253 while the sample for the post-Olympic survey
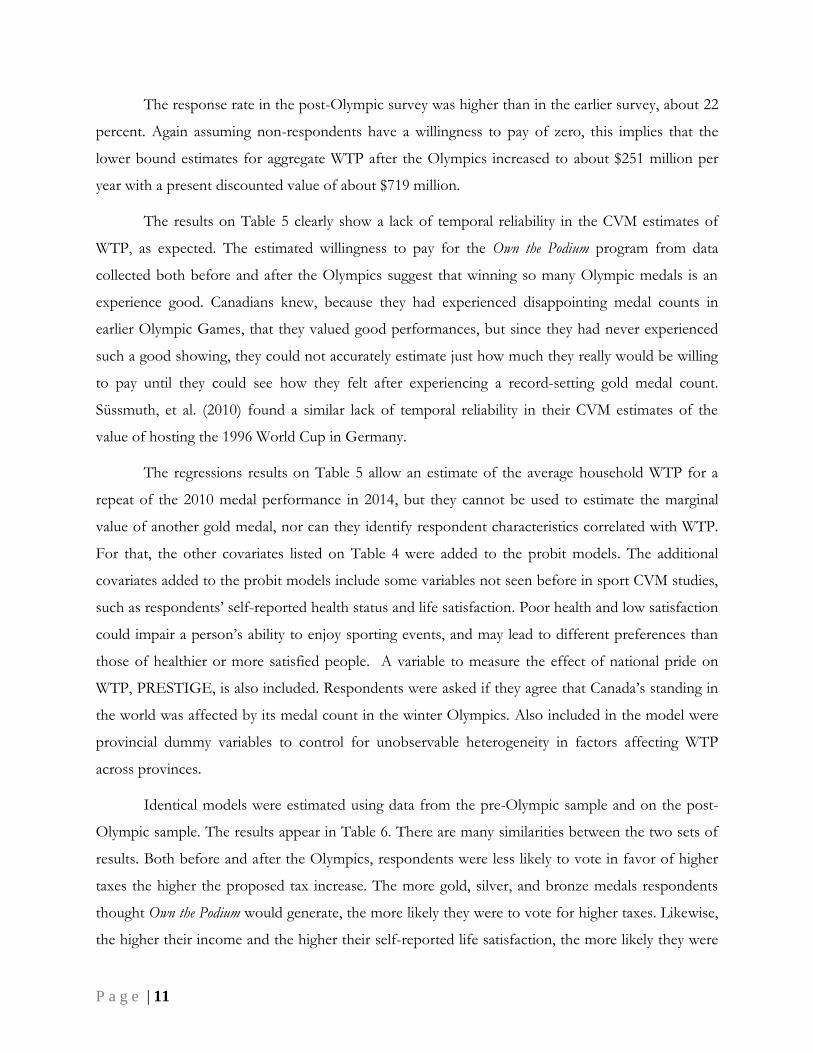
dropped from 1,660 to 1,514. Table 4A lists variable names, definitions, and expected signs of all
variables used in the estimation of willingness to pay to support Own the Podium for the 2014 Winter

P a g e | 10
Olympics. Table 4B shows the summary statistics for those variables for respondents to the pre-
Olympic survey while Table 4C shows the same for respondents to the post-Olympic survey.
The estimates of average household WTP appear in Table 5. As the bid amount increases,
the probability of voting yes falls, as suggested by the summary statistics reported in Table 3. The
average willingness to pay rose dramatically after the Olympics, from about $45 per household to
about $91. Even before the Olympics, Canadians’ willingness to pay for Olympic medals far
exceeded federal government spending to promote Canadian elite athletic success. Based on about
12.5 million householdsa, aggregate ex ante willingness to pay has an upper bound of about $562
million, using data from the pre-Olympic survey. Because the hypothetical called for a three-year
surcharge, the undiscounted total willingness to pay based on the preliminary results from the
pretest is roughly $1.68 billion. Discounting at 5 percent, the present discounted value of ex ante
WTP is not much different, about $562m + $535m + $510m, or about $1.6 billion, which is shown
on the next to last line of Table 5.
The response rate to the survey, calculated as the percentage of eligible phone numbers
contacted who completed the interview, was 19.6 percent. Assuming non-respondents have a
willingness to pay of zero, a highly conservative estimate of aggregate willingness to pay would be
19.6 percent of the estimates above, or $110 million per year with a present discounted value of
about $315 million. This can be interpreted as a lower bound on total WTP. Even the lower bound
estimates would be large enough to justify continuing the Own the Podium program at present
levels of government funding, since $110 million was spent on the program in the run up to the
Vancouver Games.
The ex post average WTP leads to much larger aggregate WTP figures. After the Olympics,
the average WTP of about $91 per household leads to an ex post annual aggregate WTP of about
$1,143 million, and a three-year undiscounted WTP of $3,429 million. Discounting at 5 percent for
three years yields a present value of about $3,268 million. This estimated willingness to pay is slightly
larger than the estimated WTP found by Atkinson, et al. (2008) in the UK associated with hosting
the 2012 Olympic Games in London, 2 billion Pounds Sterling, which is about $3.25 billion
Canadian dollars at current exchange rates. However, the Atkinson, et al. (2008) WTP estimate is
for hosting, while this estimate is for success in the Games, which could be valued more, since
Olympic success represents a more tangible, visceral event.
a According to Statistics Canada,, based on the 2006 census.
P a g e | 11
The response rate in the post-Olympic survey was higher than in the earlier survey, about 22
percent. Again assuming non-respondents have a willingness to pay of zero, this implies that the
lower bound estimates for aggregate WTP after the Olympics increased to about $251 million per
year with a present discounted value of about $719 million.
The results on Table 5 clearly show a lack of temporal reliability in the CVM estimates of
WTP, as expected. The estimated willingness to pay for the Own the Podium program from data
collected both before and after the Olympics suggest that winning so many Olympic medals is an
experience good. Canadians knew, because they had experienced disappointing medal counts in
earlier Olympic Games, that they valued good performances, but since they had never experienced
such a good showing, they could not accurately estimate just how much they really would be willing
to pay until they could see how they felt after experiencing a record-setting gold medal count.
Süssmuth, et al. (2010) found a similar lack of temporal reliability in their CVM estimates of the
value of hosting the 1996 World Cup in Germany.
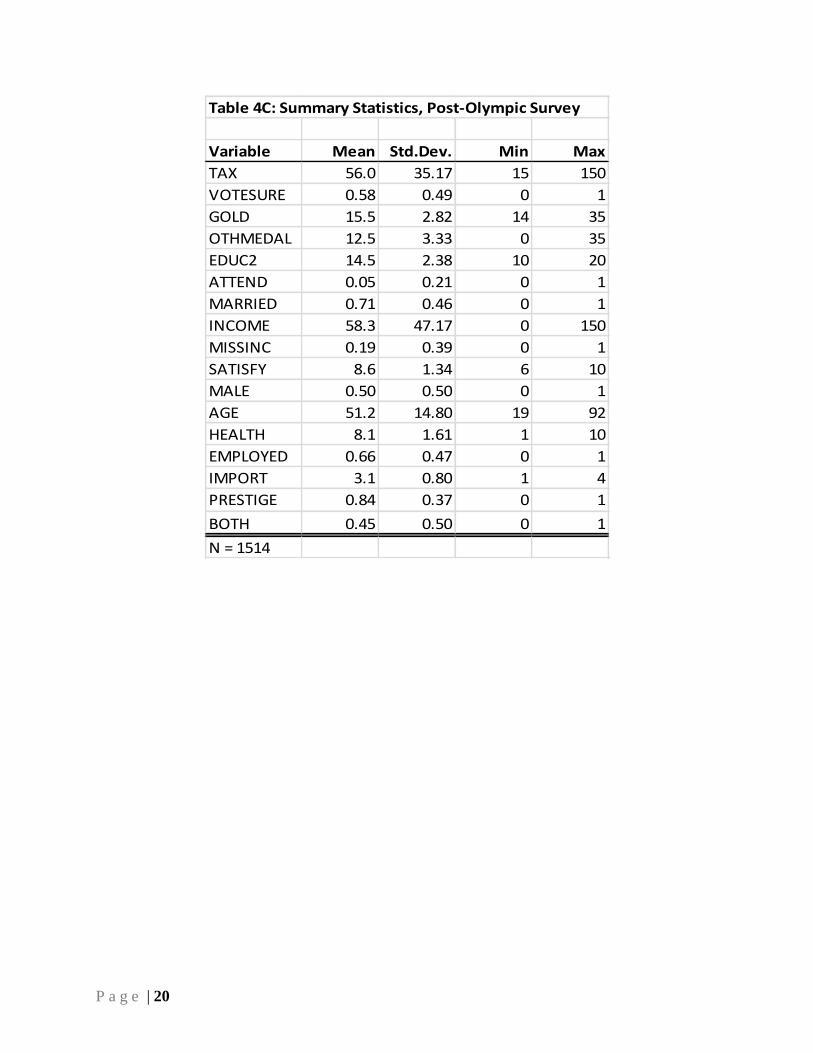
The regressions results on Table 5 allow an estimate of the average household WTP for a
repeat of the 2010 medal performance in 2014, but they cannot be used to estimate the marginal
value of another gold medal, nor can they identify respondent characteristics correlated with WTP.
For that, the other covariates listed on Table 4 were added to the probit models. The additional
covariates added to the probit models include some variables not seen before in sport CVM studies,
such as respondents’ self-reported health status and life satisfaction. Poor health and low satisfaction
could impair a person’s ability to enjoy sporting events, and may lead to different preferences than
those of healthier or more satisfied people. A variable to measure the effect of national pride on
WTP, PRESTIGE, is also included. Respondents were asked if they agree that Canada’s standing in
the world was affected by its medal count in the winter Olympics. Also included in the model were
provincial dummy variables to control for unobservable heterogeneity in factors affecting WTP
across provinces.
Identical models were estimated using data from the pre-Olympic sample and on the post-
Olympic sample. The results appear in Table 6. There are many similarities between the two sets of
results. Both before and after the Olympics, respondents were less likely to vote in favor of higher
taxes the higher the proposed tax increase. The more gold, silver, and bronze medals respondents
thought Own the Podium would generate, the more likely they were to vote for higher taxes. Likewise,
the higher their income and the higher their self-reported life satisfaction, the more likely they were

P a g e | 12
to support the referendum. Older respondents were more likely to vote in favor of higher taxes, as
were people who agreed that Canada’s world standing is affected by their Olympic medal count.
Some variables were insignificant both before and after the Olympics. Respondents’ self-
reported state of health, their employment status, and education level had no statistically significant
relationship to their willingness to vote for higher taxes. Nor was planned or actual attendance at the
Olympics, implying that enjoyment of Canadian medal success is in no way diminished or enhanced
by viewing it in person.
There were a few notable differences in the results before and after the Olympics. While
being married had a negative impact on probability of voting for higher taxes both before and after,
it was statistically significant only after the Olympics, but only at the 10 percent level. In cases where
respondents refused to divulge their household incomes, we imputed income using a regression of
income on demographic variables. We included a dummy variable, MISSINC, in the probit models
to account for the possibility that some systematic error in our income imputation might affect the
results. That dummy was insignificant before the Games, but significant after, with a much larger
coefficient.
One of the public goods produced by success at the Olympic Games is national unity. The
differing effect of gender on willingness to support the referendum may indicate the greater sense of
unity produced by Canada’s success. Before the Games, males were much more likely to vote for
higher taxes than females, and the result was significant at nearly the 1 percent level if the prior is
that males are more likely to support spending on sports. But after the Games, males and females
were equally likely to support higher taxes for OTP. The parameter estimate on MALE is
indistinguishable from zero with a P-value of 0.98.
The pre- and post-Olympic probit regression results estimates in Table 6 allow estimation of
the marginal values of gold, silver, and bronze medals won by the Canadian Olympic Team. Before
the Olympics, respondents’ marginal value of an additional gold medal was about $13.26, while the
marginal value of an additional silver or bronze medal was about $6.10. After the Games, the
marginal values rose to $25.91 for a gold and $22.78 for a silver and bronze medal. Not only did
marginal values rise substantially, but the relative values of gold and other medals changed. Before
the Games, respondents valued an additional gold medal more than twice as much as another silver
or bronze. After the Games, gold medals were valued at about 13 percent more than silver and
bronze. This could be due to the fact that Canada had the highest gold medal count, but not the
highest overall medal count at the Vancouver Games. After the Games, silver and bronze medals

P a g e | 13
became relatively more valuable because Canadians felt that if they had won more silver and bronze
medals, they would have had the highest overall medal count as well.
Before the Olympics, an increase of one point on the ten point life satisfaction scale
increased estimated willingness to pay to support Own the Podium by about $10. After the Olympics,
it increased WTP by about $17. While the Olympic experience increased the willingness to pay at
any given level of satisfaction, however, it seems to have had no discernible effect on life
satisfaction. The mean level of self-reported life satisfaction remained virtually unchanged, at about
8.54 before the Games and about 8.59 after. It is impossible to say whether that difference, if it is
even statistically significant, has anything to do with the outcome of the Vancouver Games. Even if
it did, it would add less than a dollar to mean WTP.
Conclusions
We performed a CVM analysis of a sports mega-event in a novel context. Previous CVM
studies of sporting events estimated the WTP for the presence of a team, or the presence of a mega-
event like the Olympic Games or the FIFA World Cup in a country. We focused on WTP for
success, in terms of the host national team winning gold medals in the Olympic Games. Canada
experienced little success when hosting previous Olympic Games in 1976 and 1988. In response to
this lack of success, funding for elite athletes was increased in the run up to the 2010 Games in
Vancouver, and the rationale for this increased expenditure was to foster improved performance by
Canadian athletes in those Games. In this sense, we analyzed the effects of a successful government
sponsored subsidization program, where the program has the ability to affect national pride and
identity. Own the Podium appears to have generated substantial intangible benefits among Canadians.
Our results confirm that CVM estimated of the intangible benefits generated by a sports
mega-event show a lack of temporal reliability. Süssmuth, et al. (2010) found that the WTP
estimates from hosting the FIFA World Cup increased substantially after the Cup. We find that the
WTP estimates from medal success increased substantially after the Games. CVM studies are an
increasingly important tool for assessing subsidies for professional sports, and for sports mega-
events. Temporal reliability problems suggest that CVM estimates of WTP should be assessed
carefully, since the estimates generate will change depending on the time frame.
Our results suggest that Canadians believed, even before the 2010 Vancouver Olympics, that
the intangible benefits generated by the Own the Podium program far exceeded the costs of operating

P a g e | 14
the program. Their experience with the 2010 Winter Olympics caused them to reassess and conclude
that the benefits were even higher than they previously expected. In the small but growing CVM
sports literature, no other example of the willingness to pay for sports public goods unambiguously
exceeding the cost of the subsidies granted have been found, and certainly no case of the benefits
being a multiple of 3 to 8 times the subsidy cost has ever been found. No previous study analyzed
outcomes of sporting events. Seeing the national team succeed, where others had not, clearly has
the potential to generate significant intangible benefits relative to winning the rights to host a mega-
event and then seeing it take place.
Do the results mean that the policies aimed at improving the performance of elite athletes
pursued by the Canadian government are economically efficient? Not necessarily. Respondents were
not asked whether they value alternative uses of their tax dollars by more than they value Olympic
medals. Furthermore, there is no evidence that the Canadian medal performance was affected by
Own the Podium. Concluding that Own the Podium led to a higher medal count risks the post hoc ergo
propter hoc fallacy. Even if Own the Podium led to more medals in the 2010 Games, that program is
Canada’s response to an international arms race in elite athletic performance. As such, it is the
outcome of a prisoner’s dilemma type game where countries compete for a fixed number of gold
medals by spending increasing amounts on elite athletes. The results here should not be used to
justify additional spending to enhance the performance of elite athletes in other countries. All
parties would be better off ending the race, since returns to this type of spending will diminish
quickly if other countries adopt a similar policy.

P a g e | 15
References
Arrow, Kenneth, et al., Report of the NOAA Panel on Contingent Valuation, Washington, DC, 1993.
Atkinson, Giles, Susana Mourato, Stefan Szymanski and Ece Ozdemiroglu, “Are We Willing to Pay
Enough to ‘Back the Bid’?: Valuing the Intangible Impacts of London’s Bid to Host the
2012 Summer Olympic Games,” Urban Studies 45(2):419-444, 2008.
Fenn, Aju J. and John R. Crooker, “Estimating Local Welfare Generated By an NFL Team Under
Credible Threat of Relocation,” Southern Economic Journal, 76 (1), 198-223, 2009.
Hanemann, W. Michael, “Valuing the Environment Through Contingent Valuation,” Journal of
Economic Perspectives, 8(4), 19-43, 1994.
Johnson, Bruce K, Whitehead, John C., Mason, Daniel S., & Walker, Gordon J., “Willingness to pay
for amateur sports and recreation programs,” Contemporary Economic Policy, 25(4), 553-564,
2007.
Johnson, Bruce K., Michael Mondello, and John C. Whitehead, “What is the Value of Public Goods
Generated by a National Football League Team: A CVM Approach,” Journal of Sport
Management, 21(1), 123-136, 2007.
Johnson, Bruce K., and John C. Whitehead, "Value of Public Goods from Sport Stadiums: The
CVM Approach," Contemporary Economic Policy, 18, 48-58, 2000.
Johnson, Bruce K., Peter A. Groothuis, and John C. Whitehead “The Value of Public Goods Generated
by a Major League Sports Team: The CVM Approach,” Journal of Sports Economics, 2, 6-21, 2001.
Johnson, Ian, “The New Gold War: Germany Revives Its Communist-Era Athlete Schools as the Global
Race for Olympic Glory Heats Up,” Wall Street Journal, August 2, 2008, p. A1+.
Mitchell, R.C. and R. T. Carson, Using Surveys to Value Public Goods: The Contingent Valuation Method
(Washington, DC: Resources for the Future, 1989): 2-3.
NRG Research Group, “Canadians want to Own the Podium at the 2010 Olympic & Paralympic
Games,” retrieved September 30 2007 from
http://www.nrgresearchgroup.com/media/documents/mr_research_results_final_july_13_
06-e.pdf, 2006
Santo, Charles A., “Beyond the economic catalyst debate: Can public consumption benefits justify a
municipal stadium investment?” Journal of Urban Affairs, 29, 455-479, 2007.
Süssmuth, Bernd, Malte Heyne, and Wolfgang Maennig, “Induced Civic Pride and Integration.”
Oxford Bulletin of Economics and Statistics, 72, 202-220, 2010.
Swiss Olympic. 2010. “For the Spirit of Sport,” accessed at
http://www.swissolympic.ch/Portaldata/41/Resources/01_ueber_uns/organisation/SOA_I
magebroschuere_e_low.pdf, March 18, 2011.
Whitehead, John C., “A Practitioner’s Primer on Contingent Valuation,” Chapter 4 in Handbook on
Contingent Valuation, ed by Anna Alberini and James R. Kahn, Cheltenham, U.K.: Edward
Elgar Publishing, pp 92-115, 2006.

P a g e | 16
TABLE 1: Pride in the Vancouver Games and Canadian Performance
QUESTION
Percent Answering Yes
Pre-Olympics
Percent Answering
Yes Post Olympics
Percentage
Change Pre to
Post Olympics
Are you proud that
Vancouver is host to the
2010 Winter Olympics?
88.3% 93.9% +6.3%
Do you feel proud when a
Canadian wins a gold
medal?
94.3% 95.6% +1.4%
Proud if/that Canada won
more gold medals than
any other country?
91.6% 88.0% -3.9%
Will/Did you feel proud
if Canadians win more
gold medals than U.S.
athletes?
86.7% 83.4% -3.8%
Note: The wording of the questions in Table 1 have been edited to fit the available space.
TABLE 2: Attitudes About the Importance of the Vancouver Games
QUESTION
Percent Agree or
Strongly Agree Pre
Olympics
Percent Agree or
Strongly Agree Post
Olympics
Percentage
Change Pre and
Post Olympics
It is important that
Canadians win the most
gold medals.
59.3% 67.8% +14.3%
It is important that
Canadians win more gold
medals than Americans
do.
53.2% 64.7% +21.6%
Canada’s medal count is
important to Canada’s
standing in the world.
67.3% 84.0% +24.8%

P a g e | 17
Table 3: Response to Tax Increase Question
Bid Amount N Yes Vote % % Certain Bid Amount N Yes Vote % % Certain
$5 334 67% 59% $15 180 77% 73%
$10 12 67% 67% $25 255 73% 67%
$20 333 62% 57% $35 249 66% 61%
$30 11 64% 55% $50 251 56% 51%
$35 332 59% 54% $65 22 55% 55%
$50 322 49% 44% $75 244 59% 54%
$65 206 44% 39% $100 232 53% 47%
$150 75 52% 47%
Total 1,540 57% 52% Total 1508 63% 58%
Pre-Olympic Games Survey Post-Olympic Games Survey

P a g e | 18
TABLE 4A
VARIABLE DEFINITIONS
TAX Dollar amount by which respondent’s annual household tax bill would rise if referendum
passes.
GOLD The number of gold medals respondent thinks Canada can win in 2014 if Own the
Podium is continued.
OTHMEDAL The number of gold medals respondent thinks Canada can win in 2014 if Own
the Podium is continued.
BOTH2 Equal to 1 if respondent participated in both pre- and post-Olympic surveys, 0
otherwise.
EDUC2 Respondent’s number of years of formal education
ATTEND Equal to 1 if pre-Olympic respondent expects to attend the Games or if post-
Olympic respondent did attend the Games, 0 otherwise.
MARRIED Equal to 1 if respondent is married, 0 otherwise.
INCOME Respondent’s income in thousands of dollars. If respondent did not answer, income
was imputed from a regression of income on economic and demographic variables.
MISSINC Equal to 1 if respondent’s income was imputed, 0 otherwise.
SATISFY Respondent’s overall life satisfaction, reported on scale of 1(low) to 10(high)
MALE Equal to 1 if respondent is male, 0 otherwise.
AGE Respondent’s age in years
HEALTH Respondent’s state of health, reported on a scale of 1(bad) to 10(excellent)
EMPLOYED Equal to 1 if respondent is employed, 0 otherwise
PRESTIGE Equal to1 if respondent agrees or strongly agrees that Canada’s Olympic medal
count is important to Canada’s standing in the world.

P a g e | 19
Table 4B: Summary Statistics, Pre-Olympic Survey
Variable Mean Std.Dev. Min Max
TAX 31.8 20.00 5 65
VOTESURE 0.54 0.50 0 1
GOLD 11.4 6.10 7 50
OTHMEDAL 18.1 5.86 0 78
EDUC2 14.5 2.39 10 20
ATTEND 0.05 0.21 0 1
MARRIED 0.65 0.48 0 1
INCOME 51.3 47.47 0 150
MISSINC 0.26 0.44 0 1
SATISFY 8.5 1.34 6 10
MALE 0.51 0.50 0 1
AGE 50.1 15.53 19 89
HEALTH 8.1 1.65 1 10
EMPLOYED 0.66 0.47 0 1
IMPORT 2.8 0.85 1 4
PRESTIGE 0.68 0.47 0 1
N = 1253
P a g e | 20
Table 4C: Summary Statistics, Post-Olympic Survey
Variable Mean Std.Dev. Min Max
TAX 56.0 35.17 15 150
VOTESURE 0.58 0.49 0 1
GOLD 15.5 2.82 14 35
OTHMEDAL 12.5 3.33 0 35
EDUC2 14.5 2.38 10 20
ATTEND 0.05 0.21 0 1
MARRIED 0.71 0.46 0 1
INCOME 58.3 47.17 0 150
MISSINC 0.19 0.39 0 1
SATISFY 8.6 1.34 6 10
MALE 0.50 0.50 0 1
AGE 51.2 14.80 19 92
HEALTH 8.1 1.61 1 10
EMPLOYED 0.66 0.47 0 1
IMPORT 3.1 0.80 1 4
PRESTIGE 0.84 0.37 0 1
BOTH 0.45 0.50 0 1
N = 1514

P a g e | 21
Variable Parameter St. Err. P-value Parameter St. Err. P-value
Intercept 0.377 0.067 <0.001 0.503 0.066 <0.001
BID -0.008 0.002 <0.001 -0.006 0.001 <0.001
Household WTP $44.96 5.073 <0.001 $91.42 8.346 <0.001
N 1,253 1,514
National WTP Upper Bound $562 Upper Bound $3,429
(Millions) Lower Bound $110 Lower Bound $251
Discounted WTP Upper Bound $1,607 Upper Bound $3,268
(Millions) Lower Bound $315 Lower Bound $719
Table 5: Probit Model Results and WTP Estimates
Pre-Olypmics Post-Olympics
P a g e | 22
Table 6: Probit Estimates, Equation (6)
Pre-Olympic Games Sample
Variable Parameter Std. Err. P-Value
TAX -0.008 0.002 <0.001
GOLD 0.110 0.009 <0.001 OTHMEDAL 0.051 0.009 <0.001 EDUC2 0.008 0.018 0.655 ATTEND 0.167 0.198 0.400
MARRIED -0.113 0.088 0.200
INCOME 0.006 0.001 <0.001 MISSINC 0.053 0.126 0.673 SATISFY 0.085 0.032 0.008
MALE 0.185 0.080 0.021 AGE 0.015 0.003 <0.001
HEALTH 0.016 0.027 0.552 EMPLOYED 0.133 0.099 0.181 PRESTIGE 0.403 0.087 <0.001 Constant -4.107 0.476 <0.001
N/Psuedo-R2
1253 0.211
Post-Olympic Games Sample
Variable Parameter Std. Err. P-Value
TAX -0.006 0.001 <0.001
GOLD 0.149 0.015 <0.001
OTHMEDAL 0.139 0.012 <0.001
EDUC2 -0.015 0.016 0.355 ATTEND 0.037 0.178 0.833 MARRIED -0.159 0.085 0.062 INCOME 0.007 0.001 <0.001 MISSINC 0.251 0.122 0.039
SATISFY 0.100 0.029 0.001 MALE -0.001 0.073 0.984
AGE 0.011 0.003 <0.001 HEALTH -0.034 0.025 0.168 EMPLOYED 0.055 0.089 0.538
PRESTIGE 0.561 0.099 <0.001 Constant -5.223 0.487 <0.001
N/Psuedo-R2 1514 0.213
Department of Economics, University of Alberta Working Paper Series
http://www.economics.ualberta.ca/en/WorkingPapers.aspx
2011-19: Riding the Yield Curve: A Spanning Analysis – Galvani, Landon
2011-18: The Effect of Gambling on Health: Evidence from Canada – Humphreys, Nyman, Ruseski
2011-17: Lottery Participants and Revenues: An International Survey of Economic Research on Lotteries – Perez, Humphreys
2011-16: The Belief in the “Hot Hand” in the NFL: Evidence from Betting Volume Data – Paul, Weinbach, Humphreys
2011-15: From Housing Bust to Credit Crunch: Evidence from Small Business Loans – Huang, Stephens
2011-14: CEO Turnover: More Evidence on the Role of Performance Expectations – Humphreys, Paul, Weinbach
2011-13: External Balance Adjustment: An Intra-National and International Comparison - Smith
2011-12: Prize Structure and Performance: Evidence from NASCAR – Frick, Humphreys
2011-11: Spatial Efficiency of Genetically Modified and Organic Crops – Ambec, Langinier, Marcoul
2011-10: Unit Root Testing with Stationary Covariates and a Structural Break in the Trend Function - Fossati
2011-09: CDS as Insurance: Leaky Lifeboats in Stormy Seas – Stephens, Thompson
2011-08: Game Attendance and Competitive Balance in the National Hockey League – Coates, Humphreys
2011-07: Rationalization in the Canadian Retail Gasoline Industry: The Role of Environmental Regulations – Eckert, H; Eckert, A
2011-06: Physical Activity and Health Outcome: Evidence from Canada – Humphreys, McLeod, Ruseski
2011-05: Dating U.S. Business Cycles with Macro Factors – Fossati
2011-04: Covariate Unit Root Tests with Good Size Power – Fossati
2011-03: New measures of the costs of unemployment: Evidence from the subjective well-being of 2.3 million Americans – Helliwell, Huang
2011-02: Childhood Determinants of Risk Aversion: The Long Shadow of Compulsory Education – Hryshko, Luengo-Prado,
2011-01: Will Biofuel Mandates Raise Food Prices? – Chakravorty, Hubert, Moreaux, Nostbakken
2010-20: Does the Retirement Consumption Puzzle Differ Across the Distribution: - Fisher, Marchand
2010-19: A Test of Monopoly Price Dispersion Under Demand Uncertainty – Humphreys, Soebbing
2010-18: Split Incentives and Energy Efficiency in Canadian Multi-Family Dwellings – Maruejols, Young
2010-17: Local Labor Market Impacts of Energy Boom-Bust-Boom in Western Canada - Marchand
2010-16: House Prices and Risk Sharing – Hryshko, Luengo-Prado, Sørensen
Please see above working papers link for earlier papers
www.economics.ualberta.ca