estimating the size of the fiji islands agricultural sector · pdf fileestimating the size of...
TRANSCRIPT

Faculty of Business and Law
SCHOOL OF ACCOUNTING, ECONOMICS AND FINANCE
School Working Paper - Economic Series 2006
SWP 2006/08
Estimating the Size of the Fiji Islands Agricultural Sector
Phillip Hone and Henry Haszler
The working papers are a series of manuscripts in their draft form. Please do not quote without obtaining the author’s consent as these works are in their draft form. The views expressed in this paper are those of the author and not necessarily endorsed by the School.

This research was supported by a grant from the Australian Centre for International Agricultural Research and1
represents a component output from ACIAR Project SFS 2003/069. The views expressed in the paper are theviews of the authors and do not necessarily represent the position of the organisations where they are employed.
Hone, Haszler, Tuicakau
Contributed Paper to The Fifth IIDS International Conference on Governance and Development,
December 1-4, University of the South Pacific, Suva, Fiji Islands
Estimating the Size of the Fiji Islands Agricultural Sector1
Phillip Hone , Henry Haszler and Apenisa Tuicakau* * **
School of Accounting, Economics and Finance, Deakin University, Melbourne*
Ministry of Agriculture, Sugar and Land Resettlement, Suva**
Abstract
Food and agricultural production account for a substantial share of economic activity in developing
countries like Fiji. The relatively large size of the agricultural sector makes it all the more important to
base agricultural policy decisions on reliable data. Moreover, improvements in farm sector productivity
are an important driver of economic growth in developing countries. Good data provide governments
– and citizens and taxpayers – with a more reliable basis for identifying policy issues and for assessing
the aggregate and distributional impacts of policy initiatives. Good data help to improve the quality of
both ex ante and ex post analyses and so help to make governments more accountable for their
decisions. In democratic settings, such improved accountability will help to ensure that to the extent
possible public policy does indeed promote high economic growth and development.
Despite the conceptual limitations of gross domestic product as a measure of economic activity, levels
of and changes in a country’s GDP do provide valuable information for government decision making.
However, there is some largely anecdotal evidence that the official GDP estimates for the Fiji Islands are
not sufficiently accurate. The potential errors reflect misreporting associated with the black economy and
problems in measuring agricultural activity in the informal sector. These informal sector problems come
from both sampling and non-sampling sources. To gain some insight into the size of the informal part
of the agriculture sector we estimate a model to explain the dependence of households on home
produced food. Based on this model, and other data sources, we conclude that official estimates of the
relative size of the agricultural sector in Fiji probably underestimate the true size of the sector and
underestimate its growth.
This paper is a draft
Please do not quote without consulting the authors
Author Contacts:
• Associate Professor Phillip Hone Ph: +61-3-9244-6530 [email protected]
• Mr Henry Haszler, Senior Research Fellow, Ph: +61-3-9439-4352 [email protected]
• Mr Apenisa Tuicakau, Economist, Ph: (679) 338-4233 [email protected]

Estimating the Size of the Fiji Islands Agricultural Sector
Hone, Haszler, Tuicakau Page 2 of 20
1. Introduction
These days government is everywhere and follows us from the cradle to the grave. Governments
register both our births and deaths, both of which might occur in a public hospital. On our path through
life they insist we attend school, certify our school results, restrict our access to alcohol before a specified
age, issue our driver’s licences, register our marriages – and divorces – and nominate the currency we
shall use. Governments also legislate shopping hours, tell us how to label our foods, subsidise the
production of some goods, impose tariffs on imports, and – depending on where in place and time we
are – may conscript us to miserable, painful deaths in battle on foreign soil against people against whom
we may have no personal grudge at all.
All the while, government’s tax us so that they can pay for all the ways they impinge on our lives.
Citizens and taxpayers tolerate government involvement in their lives because of the common judgement
that – in democratic societies at least – governments generally intervene to promote the “common good.”.
Pursuit of the common good makes it sensible for at least some things to be done or organised or
overseen by government.
However, there is no clear consensus – even within any single country or community – on the acceptable
or proper role of government. At a perhaps cynical extreme, government has been defined “… as that
group of individuals which has, for the time being, usurped the power of ultimate punishment – death.”
An ignoble definition if ever there was one. A less extreme attitude to government might be summarised
in the observation that “One person’s tax is their own and/or another person’s Medicare rebate, or yet
another person’s farm adjustment assistance, or yet again the newly sealed road to “my” village.” Clearly,
there are good reasons to consider criteria under which government intervention in the economic and other
dimensions of our lives might be justified. That consideration must be broad ranging.
In addition to having criteria that are accepted as justifying intervention, it is essential for good governance
that government actions are monitored and evaluated. For the purpose of this paper at least, it is
convenient to consider government activity in two broad dimensions. First, there is what we would
describe as the “political” dimension which in our taxonomy covers voting systems or other mechanisms
for choosing the form of legislature(s) and the politicians who will sit in the legislature(s) and those
politicians who will make up the government for the time being, In our classification the political dimension
of government also includes the rules that govern the legislature(s) and the legislators and the system of
laws they introduce and support.
Our second dimension of government is the economic dimension which we define as concerned with the
particular economic decisions of government. That is, matters related to taxes, tariffs, subsidies, social
security payments, etc.

Estimating the Size of the Fiji Islands Agricultural Sector
Hone, Haszler, Tuicakau Page 3 of 20
In both cases the achievement of good governance requires that taxpayers and citizens have access to
good information by which to judge government actions and their outcomes. For the political dimension
of government activity the information might be of a rather qualitative or descriptive type. But for the
economic dimension the information needs to be much more quantitative and of the kind we normally
define as economic statistics,
Moreover, the regular publication of reliable data on the performance of the economy tends to add to the
accountability of public decision makers. Repeated poor economic management decisions show up in the
long run as reduced national income and an unduly low rate of economic growth. The publication of reliable
data on these measures provides some basis for both indicating the nature of problems and assessing
the performance of government decision makers in responding to these issues. Therefore, to the extent
to which reliable economic data makes decision makers accountable, it also tends to improve governance
in the public sector.
2. Relevance to Agricultural GDP in Fiji
W hy are the preceding comments relevant to agricultural GDP in Fiji? The Fiji Islands are relatively
resource rich. The environment is attractive to tourists, there are extensive fishing grounds and, relative
to population, there is considerable arable land with soil types and a climate suited to many agricultural
and forestry pursuits. And by developing country standards, Fiji’s workforce has a wide range of skills.
Despite these advantages, Fiji’s growth potential does not seem to have been realised and the prospects
for a sustained improvement in the standard of living are not as strong as they might be. This poor
performance results partly from problems in agriculture, which accounts for around 16 per cent of official
GDP, probably a larger proportion of the actual economy, and for 44 per cent of Fiji’s merchandise
exports. (including sugar and food processing).
The disappointing growth in the agricultural sector itself has been due at least partly to the slow growth in
the commercial agricultural sector. The sugar industry is under severe market pressure, copra production
has declined, and other more recently introduced tree crops such as cocoa – once seen to offer great
potential – have virtually disappeared. Also, the outlook for horticultural exports has not met earlier
optim istic forecasts. For example, exports of kava have suffered recently because of “health scares” in
Europe and the USA.
In the case of sugar, proposed policy changes in the EU will effectively withdraw output price support for
Fiji’s sugar. The high prices previously paid for sugar in Fiji have sustained a relatively large industry,
accounting for 45 per cent of the value of official farm output and around 25 per cent of the nation’s
exports. Recent disruptions to land tenure arrangements in the sugar industry are likely to aggravate the
disruption from the change in EU policy.
The potential outcome of these problems is an increase in poverty. Indeed, concerns about poverty have
been highlighted by Fiji’s recent drop from 81 to 92 place in the UNDP Human Development Indexst nd

Estimating the Size of the Fiji Islands Agricultural Sector
Hone, Haszler, Tuicakau Page 4 of 20
(UNDP 2005.) Poverty is widespread with claims that about 25 per cent of the population lived below the
poverty line in 1990-91 (ADP MFNP 2003). All major elements of the population are affected but,
significantly, 60 per cent of the heads of poor households are employed in agriculture. The differential
increases in the CPI and wages since 1990-91 suggest the extent of poverty has increased.
The development literature makes it clear that a key determinant of the ability of countries to shift to rapid
development and poverty alleviation has been increasing productivity in the agricultural sector. As the
British Department for International Development says:
“All recorded rapid reductions in widespread poverty started with livelihoods being enhanced
through agricultural transformation.” (DFID 2005 p 6)
Fiji is a middle ranking developing country and already has a sizeable commercial agricultural sector. But
Fiji also still has a substantial subsistence agriculture which can be described as “traditional” in the sense
used by Schultz (1964) to categorise the Guatemalan Panajachel Indians described by Tax in his Penny
Capitalism (1953). The Panajachel Indians were capitalist and economically very efficient, but also poor.
They were efficient but poor because they had reached an equilibrium based on traditional agricultural
methods undisturbed by new ways of doing things. This may be a reasonable approximation of
subsistence agriculture in Fiji and other Pacific Island countries. The relevance of this ancient history for
the Fiji Islands today is that Schultz describes the transformation of traditional agriculture as “a relatively
cheap source of economic growth”. (Schultz, p 102).
So it is important to improve the efficiency of the policy process and get agricultural policy right.
Unfortunately, The chances of developing and implementing an appropriate agricultural policy regime in
Fiji to deal with these problems are currently constrained by a lack of the fundamental economic
information required for making informed policy decisions.
3. Data Availability
A number of organisations collect agricultural and food sector data for Fiji linked to the national accounts.
The Fiji Islands Bureau of Statistics (FIBoS) publishes annual national accounts data on the contribution
of agriculture to GDP (see Table 2 below), and data on employment, trade, etc. The Bureau also conducts
Fiji’s Household Income and Expenditure Surveys (HIES) covering both urban and rural residents. The
rural sector national accounts rely partly on data provided by the Ministry of Agriculture Sugar and Land
Resettlement (MASLR). The Ministry conducts the national agricultural census and also collects quarterly
production data. The National Food and Nutrition Centre (NFNC) compiles Fiji’s food balance sheets
which are effectively annual supply – utilisation tables based on production and trade data by commodity
from FIBoS and MASLR. The NFNC also conducts national nutrition surveys.

Estimating the Size of the Fiji Islands Agricultural Sector
Hone, Haszler, Tuicakau Page 5 of 20
Table 1: Comparisons of Selected Agricultural Statistics by Source
Item Production Consumption
1999 2002 2002
FAO Agriculture
Survey
FAO NFNC FAO NFNC
– ‘000 tonnes –
Cereals 12.3 18.1 9.7 13.5 123.6 91.2a
Rice (Milled) 11.5 9.7 8.6 12.9 35.4 40.6
Maize 0.7 8.4 1.1 0.6 0.8 0.1
Starchy Roots 63.4 409.7 86.2 89.9 82.7 91.7
Cassava 26.9 307.8 33.0 41.4 23.2 38.3
Sweet Potatoes 5.1 15.0 6.2 7.2 6.0 6.9
Yams 2.2 11.3 5.2 4.5 5.0 4.3
Sugar & Sweeteners 364.1 na 317.1 333.0 29.6 32.1
Pulses 1.2 0.4 1.2 0.7 8.1 7.6
Oilcrops 170.8 392.5 160.2 113.6 50.1 29.8b
Vegetable Oils 8.3 na 9.1 11.3 8.6 0.0
Coconut Oil 8.3 na 9.1 11.3 1.0 0.0
Vegetables 20.0 59.3 21.2 15.7 35.3 27.9
Fruits 18.2 44.4 22.8 9.4 27.6 11.3c
Bananas & Plantains 4.0 12.4 6.5 3.6 5.6 3.2
Pineapples 2.4 na 3.7 1.9 3.6 1.7
Alcoholic Beverages 18.5 na 20.0 21.6 20.8 21.3
Meat 22.0 na 22.3 14.7 32.4 27.6
Bovine Meat 8.6 na 8.6 2.4 9.3 3.7
Pigmeat 4.1 na 3.9 0.7 4.1 0.7
Poultry Meat 8.4 na 8.8 10.6 9.1 10.9
Animal Fats 2.5 na 2.5 1.8 4.6 4.4
Eggs 3.1 na 2.7 2.7 4.7 3.0
Fish, Seafood 37.5 na 43.8 56.9 27.6 41.3
a) Excluding beer. b) Mostly coconuts. c) Excluding wine. na not applicable.
Sources: FAOStat, 2005 accessed 12 October 2005; Otanez et al (2000); Vatucawaqa (2002).
Unfortunately there are limitations to the basic agricultural data that do exist – such as seemingly
significant discrepancies between alternative sources for some data as shown in Table 1. The Table is
based on the 1999 agricultural survey by the now Ministry of Agriculture, Sugar and Land Resettlement
(MASLR,) and on food balance sheets produced by FAO and Fiji’s National Food and Nutrition Centre.

Estimating the Size of the Fiji Islands Agricultural Sector
Hone, Haszler, Tuicakau Page 6 of 20
Some of the discrepancies shown in the Table will be due to differences in reporting units – for example
carcase and dressed weight for meat – and so will be more apparent than real. The significant differences
that do exist – production of starchy roots in 1999 – are likely to arise at least partly from the lack of
reliable information on the production, sales and consumption of smallholder-subsistence farmers and
fishermen (W alton, 2002). Given the apparent importance of the smallholder sector in Fiji, this means
there is no basis for reliably estimating either the present size of the agriculture, fishing and forestry sectors
as a whole, or the impact that policy changes will have on them. This lack of information on the informal
components of the “rural” sector in turn reduces the reliability – and hence policy relevance – of any
estimates of levels of, or trends in, national household incomes and of food consumption and the nutrition
status of the population.
Therefore, there is no reliable basis for estimating either the true magnitude of the problems in the
agriculture, fishing and forestry sectors, or the impact of policy changes on them. This reduces the scope
for designing appropriate poverty alleviation strategies and other policies.
2. Economic Policy and the Need for Information
The demand for national economic statistics has been government driven from the beginning. Indeed the
word “statistics” is ultimately derived from the Latin phrase for “council of state” and the Italian for
“statesman” or “politician”. Its first use in German (1749) described the analysis of information about the
state (W ikipedia, November 2005). There is little doubt the Roman Emperors – to take just one example
from earlier times – took a keen interest in statistics on grain harvests and trade because these influenced
their income and so their capacity for world conquest, etc.
The word statistics has moved well beyond its original definitions, but a primary reason for collecting
economic statistics is still to help determine – and judge – government activities.
There is considerable debate on where government intervention is appropriate and on its degree and
form(s). For its part, economics proposes clear rules based on the proposition that – in the absence of
market failures and given the distribution of income – free competitive markets will deliver Pareto efficient
outcomes. The case for intervention then rests on market failure. The practical value of this well-known
and elegant edifice of primary theory and its derived rules for intervention rests on there being good
information on which to judge market outcomes. And as Sachs (2005, p 80) says:
"... good development practice requires monitoring and evaluation, and especially a rigorous
comparison of goals and outcomes.”
These requirements cannot be met without reliable statistics which, paradoxically, are probably more
important in developing countries where the stakes are higher than elsewhere.
While there are any number of potentially policy relevant pieces of information, this paper focuses on

Estimating the Size of the Fiji Islands Agricultural Sector
Hone, Haszler, Tuicakau Page 7 of 20
estimates of Gross Domestic Product (GDP) for agriculture, fishing and forestry and particularly on the
estimates of subsistence production from these sectors. As is well-known, GDP represents the total
market value of production of all final goods and services in the economy in a specific period. In
principle, this total includes all marketed output – reported, unreported and illegal – plus production used
for home consumption.
We recognise that, even within its definition, GDP is essentially an indicator rather than a precise
measure of the economic or even the market sales value of what is produced. Reported values can be
distorted through evasion and survey error. The difference between the size of the actual economy and
the measured economy at any point in time will be determined by the size of the “black economy” and
the extent of the informal economy. The former represents evasion of public regulations and controls.
Empirical evidence suggests that it is growing over time and is positively related to rising taxes, increased
regulation and a decline in respect for the public sector. The black economy is a significant element in
all countries but tends to be more substantial in lesser developed economies. For example, Schneider
and Enste (2000) estimate that the black economy could represent 12 per cent of GDP in OECD
countries, 23 per cent in transition economies and on average 39 per cent for developing countries – the
percentage will obviously exceed even this high average in some countries..
GDP estimates that do not include measures of non-marketed agricultural, fisheries and forest production
in an economy like Fiji’s will underestimate the true size of the “rural” sector and provide a misleading
impression of the nature and extent of economic changes in the sector over time. However, actual
practice on what home produced consumption is included and whether it is specifically identified seems
to be based at least partly on the pragmatic issue of just how important subsistence production is in the
national scheme of things.
These days the Australian accounts incorporate estimates of farm production consumed on farm (ABS
1990 p 6) but these estimates are not separately identified in the published data. By contrast, estimates
of backyard or home or subsistence egg production by all households were included along with
commercial output in the egg production statistics for many years. The estimates were based on a
consumer survey conducted in 1949 which showed that backyard egg production was quite a large
proportion of total supply. The same backyard quantity in absolute terms was included in the egg data
for twenty years or thereabouts. And because backyard or subsistence production was included in the
output series it was also included in the national accounts. The backyard egg series was eventually
abandoned after commercial output had expanded considerably.
In Fiji, home produced foods, etc are more significant than in more developed countries and are identified
as separate line aggregates in the national accounts.
The issue in this paper is how well subsistence rural sector GDP is currently measured.

Estimating the Size of the Fiji Islands Agricultural Sector
Hone, Haszler, Tuicakau Page 8 of 20
• Absolute Contribution of Agriculture to the Economy
GDP and its growth rate are amongst the most common headline statistics used to describe national
economic performance and wellbeing. Like so many newspaper headlines, GDP does not tell the full
story. The conventional national accounting approach to the contribution of agriculture and other sectors
to the economy measures the size of a sector effectively in terms of the level of its gross market value
of production adjusted, of course, as appropriate.
The concepts involved here can be clarified from an examination of the very familiar hypothetical market
shown in Figure 1. From a welfare economics perspective, the total economic value of production is
reflected in the value consumers are willing and able to pay. The total gross economic value of the sector
2 4is equivalent to the area OQ EP . This area can be further decomposed into three parts:
2 1• The area OQ EP represents the opportunity cost of the resources used in production;
1 2• The net surplus to the owners of these resources is the area P EP ; and
2 4• The surplus from the sector flowing to domestic consumers is the area P EP .
Figure 1: Standard Hypothetical Market
The overall net contribution of the production process is given by the sum of the producer surplus
1 2 2 4(P EP ) plus the local consumer surplus (P EP ). That is, the economic contribution of the sector is
equal to the gain that producers get over and above their returns in other enterprises plus the residual
value domestic consumers derive from the consumption of the product after they have paid for it.
Now consider the case where some part of production is exported, either directly or indirectly in the form

Estimating the Size of the Fiji Islands Agricultural Sector
Hone, Haszler, Tuicakau Page 9 of 20
of being consumed by overseas tourists and visitors . The more overseas visitors there are, the greater
will be the gains to producers – at least to the extent to which greater demand for output drives up food
prices. Of course, if overseas demand advantages producers through higher prices it disadvantages
domestic consumers. The net impact of overseas demand can be illustrated in Figure 2.
2The demand from overseas consumers is such as to increase the quantity produced and sold from Q
3 2 3to Q . This has the impact of driving up food prices from P to P and as a result domestic sales fall to
1 3 1Q . Overseas sales are assumed to be Q -Q . The gain to producers from overseas sales is then equal
2 3 2to the value of the area P EFP . That is, they gain from a higher price on the original Q sold plus they
3 2get some gain on the additional Q -Q output sold due to overseas demand. However, there is a loss
to domestic consumers from reduced consumption equal to the area HEG and higher prices on the
2 3residual consumption given by P HGP . The net gain to Fiji from overseas sales is equivalent to the
value of the area GEF.
Figure 2: Impact of Exports
• Relative Size of Agriculture in the Economy
If the objective of the exercise is to compare the size of the agricultural sector with the overall economy
the situation is different. The calculation of producer and consumer surplus values is not undertaken as
part of the national accounts system so national aggregates are not available in this form. In this context,
comparison of the GDP from agriculture with national GDP may be relevant. That is, GDP is still useful
as a broad-brush indicator partly because it is based on a systematic framework for collecting economic

Estimating the Size of the Fiji Islands Agricultural Sector
Hone, Haszler, Tuicakau Page 10 of 20
Table 2: Agriculture Related Components of Real GDP at Factor Cost: Fiji Islands
Item 1995 2000 2001 2002 Percentage
Change
2001 2002
– $F million at 1995 prices – – per cent –
Total Agriculture, Fishing & Forestry 476 462 436 454 - 5.8 4.3
Agriculture
Sugar
Fishing
Forestry
371
179
66
39
341
132
85
36
329
122
71
35
343
125
81
31
- 3.6
- 7.5
-16.1
-2.7
4.1
2.4
14.0
- 13.2
Of which Subsistence Production 155 163 164 166 0.6 1.3
Agriculture
Fishing
Forestry
113
26
16
119
27
17
120
28
17
122
28
17
0.6
0.6
0.6
1.3
1.3
1.3
Total Gross National Product 2,373 2,610 2,680 2,795 2.7 4.3
– per cent –
Total Agriculture, Etc Share of
National GDP
20 18 16 16
Subsistence Share of Total
Agriculture, Etc
32 35 38 37
Agriculture
Fishing
Forestry
30
39
40
35
32
45
36
39
47
36
34
55
Subsistence Food Share of Total Food 54 50 53 50
Note: Data for agriculture include public sector production from experiment stations etc. Food equals total
agriculture less sugar and forestry. Source: FBS (2005), Key Statistics, March – from www.statsfiji.gov.fj
statistics known as the System of National Accounts (SNA) developed under United Nations auspices
(UN, 2003). Fiji’s national accounts are based on the first SNA issued in 1968. A revised SNA was
issued in 1993. Another revision is underway. In terms of the case portrayed in Figure 2, GDP would
3 3be measured by the area OQ FP .
Estimating the Size of the Fiji Islands Agricultural Sector
Hone, Haszler, Tuicakau Page 11 of 20
Agriculture, fishing and forestry clearly account for a significant slice of Fiji’s GDP, and subsistence
production is an important component of these sectors (Table 2). The official data indicate the
agricultural, fish and forests sectors together contribute around 16 per cent of total GDP while
subsistence activities produce approximately 37 per cent of the total output in the combined sectors.
Consequently about 50 per cent of the food (fish plus agriculture excluding sugarcane) produced in Fiji
is produced and consumed within the same household.
This conclusion is based on the results of Fiji’s Household Income and Expenditure Surveys (HIES) and
supported by the national nutrition surveys (NFNC 1995) and a survey by Owen et al (2002). However,
the subsistence data in the Table are derived from a population based extrapolation of survey estimates
from the 1990 HIES. That explains why the growth rates of subsistence production are identical and
equal the rate of population growth. The implication of the extrapolation method is that an important part
of the latest official estimates of aggregate agricultural GDP are benchmarked on data from 15 years
ago.
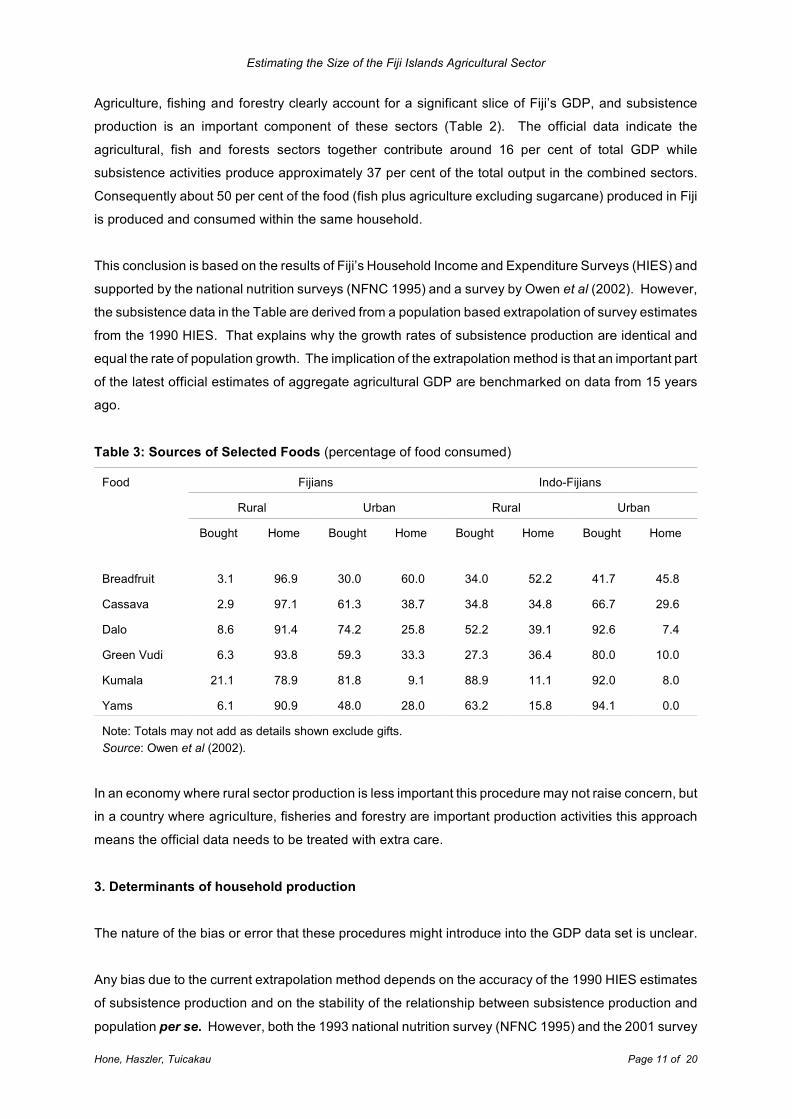
Table 3: Sources of Selected Foods (percentage of food consumed)
Food Fijians Indo-Fijians
Rural Urban Rural Urban
Bought Home Bought Home Bought Home Bought Home
Breadfruit 3.1 96.9 30.0 60.0 34.0 52.2 41.7 45.8
Cassava 2.9 97.1 61.3 38.7 34.8 34.8 66.7 29.6
Dalo 8.6 91.4 74.2 25.8 52.2 39.1 92.6 7.4
Green Vudi 6.3 93.8 59.3 33.3 27.3 36.4 80.0 10.0
Kumala 21.1 78.9 81.8 9.1 88.9 11.1 92.0 8.0
Yams 6.1 90.9 48.0 28.0 63.2 15.8 94.1 0.0
Note: Totals may not add as details shown exclude gifts.
Source: Owen et al (2002).
In an economy where rural sector production is less important this procedure may not raise concern, but
in a country where agriculture, fisheries and forestry are important production activities this approach
means the official data needs to be treated with extra care.
3. Determinants of household production
The nature of the bias or error that these procedures might introduce into the GDP data set is unclear.
Any bias due to the current extrapolation method depends on the accuracy of the 1990 HIES estimates
of subsistence production and on the stability of the relationship between subsistence production and
population per se. However, both the 1993 national nutrition survey (NFNC 1995) and the 2001 survey

(116 households) by Owen et al show (Table 3 above) that the extent of home produced consumption
varies widely according to the household’s ethnicity and whether it is a rural or urban household. For
example, on average Fijian and rural households are more reliant on home production than urban or
Indo-Fijian households.
Therefore the marked urbanisation of Fiji’s population since 1986 and the decline in the Indo-Fijian
population are potentially significant developments in the context of Fiji’s subsistence GDP. The
importance of these types of changes is examined through a regression analysis of the 2001 household
survey. The estimated models test the hypothesis that the importance of household production in total
consumption in Fiji depends on cultural factors, income levels, and production opportunities – all of which
are changing. The variables used are defined in Table 4.
Table 4: Definition of Regression Variables
Variable Labels Definitions
Dependent Variables
All Crops Proportion of value of all fruit, vegetables and cereals consumed in and
produced by the household.
Root Crops Proportion of value of all root crops (eg dalo, cassava) consumed in and
produced by the household.
Greenleaf
Vegetables
Proportion of value of all greenleaf vegetables (eg cabbage and rou rou)
consumed in and produced by the household
Explanatory Variables
Urban Dummy variable – 1 for households in urban areas.
Fijian Dummy variable – 1 for ethnic Fijian households
Employment Proportion of adults in the household who are not unemployed.
Age Average age of adults in the household.
Div1 Dummy variable – 1 for households in Division 1.
Div2 Dummy variable – 1 for households in Division 2.
Div3 Dummy variable – 1 for households in Division 3.
Unemployment The number of unemployed people in the household
Prof Dummy variable – 1 for households with at least one member in a
professional or administrative job.
Trade Dummy variable – 1 for households with at least one member in a trades job.
Manual Dummy variable – 1 for households with at least one member in a manual
labouring job.
House Dummy variable – 1 for households with at least one member in household
duties.

Table 5 Determinants of Home Production Dependence
Variable All Crops Root Crops Greenleaf Vegetables
Base Final Base Final Base Final
Constant 0.34 (0.05) 0.08 (0.08) 0.65 (0.06) 0.37 (0.03) 0.76 (0.07) 0.53 (0.00)
Urban -0.07 (0.36) -0.37 (0.07) -0.14 (0.43)
Fijian 0.54 (0.00) 0.62 (0.00) 0.76 (0.00) 0.94 (0.00) 0.40 (0.01) 0.62 (0.00)
Urban*Fijian -0.37 (0.00) -0.49 (0.00) 10.12 (0.60) -0.52 (0.00) -0.47 (0.05) -0.80 (0.00)
Div1 -0.12 (0.12) -0.45 (0.00) -0.39 (0.01) -0.38 (0.04)
Div2 -0.09 (0.32) -0.28 (0.12) -0.32 (0.06) -0.63 (0.00) -0.35 (0.03)
Div3 -0.05 (0.47) -0.46 (0.00) -0.46 (0.00) -0.60 (0.00) -0.38 (0.00)
Prof -0.09 (0.33) -0.14 (0.05) -0.28 (0.22) -0.34 (0.03) -0.23 (0.26)
Trade 0.09 (0.36) 0.00 (0.99) -0.07 (0.79)
Manual 0.04 (0.64) 0.11 (0.61) 0.25 (0.25)
House -0.03 (0.69) -0.07 (0.61 0.25 (0.12)
Employment -1.11 (0.00) -0.79 (0.00) -1.75 (0.06) -1.57 (0.00) -2.41 (0.01) -1.70 (0.00)
Employment 0.79 (0.02) 0.64 (0.02) 1.39 (0.09) 1.42 (0.02) 2.33 (0.01) 1.54 (0.03)2
Unemployment -0.03 (0.22) -0.06 (0.30) -0.01 (0.91)
Age -0.00 (0.55) 0.00 (0.97) 0.00 (0.97)
AdjR 0.76 0.78 0.64 0.67 0.51 0.502
Akaike IC 0.52 0.40 1.19 1.11 1.55 1.50
Dep Var Mean 0.24 0.40 0.47
Values in parenthesis are p-values. Values less than 0.05 indicate the coefficient is significant at the 5 per cent level. Regression coefficients derived from Tobit estimations.
The basic estimation model is:

Estimating the Size of the Fiji Islands Agricultural Sector
Hone, Haszler, Tuicakau Page 14 of 20
Dependence = f(Urban, Fijian, Div1, Div2, Div3, Employment, Unemployment,
Prof, Trade, Manual, House, Age).
The equation was estimated separately for three food groups All Crops (excluding sugar), Root Crops
and Greenleaf Vegetables. The base for the regression is an Indo-Fijian family living in a rural location
in Division 4 that has at least one farmer in the family. The coefficients on the dummy variables
represent the departures from this base case.
The regressions were estimated using a Tobit approximation given the substantial number of
respondents who reported zero values for the dependent variables. The data are effectively truncated
at zero on the lower bounds so OLS estimations are probably unreliable. The final models were derived
from the base models by deleting variables that were clearly insignificant.
The results in Table 5 are fairly consistent across all three models and support the initial hypothesis. The
Adjusted R values show a substantial extent of the variation in dependence on home production can2
be explained by cultural differences (the significant positive coefficient on Fijian), income (negative
coefficients on Employment and Prof) and opportunity to produce food at home (negative coefficient on
Urban). These are promising results because the survey was not designed for this particular application.
For example, it would have been useful to have direct income data as well as the occupational data that
were collected.
The final All Crops equation explains nearly 80 per cent of the variation in dependence on home
production. While coming from an ethnically Fijian family tended to increase the consumption of home
produced food relative to purchased food, this influence was moderated in urban areas as urban Fijians
depended less on home produced crops than Indo-Fijians. After adjusting for all other factors, there was
no statistical difference between rural and urban Indo-Fijians. Incomes – proxied by job category –
appear to be a significant explanator of dependence as the coefficients for the proportion employed
within the household and the presence of a household member with a relatively highly paid job in a
professional or administrative role were all clearly significant. However, the impact of income on
dependence may not be a simple linear one as the coefficient on Employment is negative while the
coefficient on the squared term is highly significant and positive. This is consistent with increasing
incomes reducing the consumption of home grown food but with the size of the negative impact falling
as incomes rise.
The picture is similar for Root Crops and Greenleaf Vegetables, except that regional differences were
evident – residence in Division 3 reduced dependency relative to residency in Division 4 by 115 per cent
for Root Crops and 81 per cent for Greenleaf Vegetables. Also, note that Fijian ethnicity had less impact
on Greenleaf Vegetable home dependency than was the case for either All Crops or Root Crops. In the
urban context, the average ethnic Fijian household had a nearly 40 per cent lower dependence on home
produced Greenleaf Vegetables than Indo-Fijians of similar occupational and employment status.

Estimating the Size of the Fiji Islands Agricultural Sector
Hone, Haszler, Tuicakau Page 15 of 20
The significance of these results can be interpreted through the relevant impact measures or
“elasticities” (Table 6). Fijian ethnicity increases dependence on home production by 260 per cent in
rural areas and 54 per cent in urban areas. A 10 per cent increase in the proportion of adult family
members in employment reduces home production dependence by around 8 per cent while the presence
of a family member in a relatively highly paid professional job reduced dependency by nearly 60 per cent.
Table 6: Impact Estimates
Variables All Crops Root Crops Greenleaf
Vegetables
– elasticity of column with respect to row –
Fijian – Urban 0.54 1.05 -0.38
– Rural 2.58 2.35 1.13
Employment -0.76 -0.88 -0.8
Div1 -0.98
Div2 -0.8 -0.74
Div3 -1.15 -0.81
Prof -0.58 -0.85
Estimates derived with dummy variables equal to 1 and with Employment, All Crops,
Root Crops and Greenleaf Vegetables all at data means.
4. Application
The results outlined above (Table 5) can be combined with guesstimated time series values for the
explanatory variables (see Figure 3 and 4) to generate estimates of the value of subsistence production
that are more information-rich than the population based extrapolations. In the pilot example below it
is assumed for illustrative purposes that the final All Crops model results are applicable to all subsistence
agricultural, fisheries and forest production and that sugar is not a subsistence crop.
Given that assumption and annual data for the explanatory variables, preparing alternative estimates of
subsistence agricultural, fisheries and forest GDP is a relatively straightforward three step arithmetic task:
• Calibrate the estimated equation to base year data – 1992 when the current published data put
the dependence ratio for agricultural, fisheries and forest GDP at 0.56;
• Calculate annual values of the ratio using annual values of the explanatory variables;
• Derive the estimates of subsistence agricultural, fisheries and forest GDP using identities based
on the ratio and the value of marketed rural production.

Estimating the Size of the Fiji Islands Agricultural Sector
2 www.statsfiji.fj.
Hone, Haszler, Tuicakau Page 16 of 20
Figure 3: Extrapolated and Interpolated Fijian Variables
The revised subsistence estimates (Figure 5 below) are based on interpolations between, and
extrapolations from, available data that reasonably approximate the definitions of the explanatory
variables Fijian, Fijian*Urban and Prof. Due to difficulties in constructing a proxy variable, the published
subsistence estimates are not adjusted for variations in the Employment variable.
Due to the 0 – 1 specification of household attributes, the explanatory variables (as identified in the All
Crops home dependency equation) are expressed in a probabilistic sense. So the Fijian variable is given
by the ratios of ethnic Fijians to the total population and indicates the chance of a randomly chosen
person being an ethnic Fijian. The ratio of ethnic Fijians is used as a proxy for the ratio of Fijian
households in all households. The hard available data – indicated by the markers in Figure 3 – are
limited to census information for 1986 and 1996 and estimates for 2004 from the FIBoS website . The2
equations shown in the body of Figures 3 and 4 are the time trend functions (where x = 1,2, 3, ...n) used to generate
the time series values of the explanators applicable to the estimated home dependence function for All Crops. In the
equations “y” represents the dependent variables, Fijian, Fijian*Urban and Prof.
The Prof variable (Figure 4) is defined as the ratio of the numbers of Salaried Personnel to the total of
employed Wage Earners and Salaried Personnel and so does not account for self-employed people.
However, with the calibration of the All Crops equation to the base year, it is the variations in the
explanators, not their levels that matter

Estimating the Size of the Fiji Islands Agricultural Sector
Hone, Haszler, Tuicakau Page 17 of 20
The results of the procedures outlined above (Figure 5), indicate that the current population based
extrapolations understate the value of subsistence agricultural, fishery and forest GDP in 2002 by about
thirty percent, equal to an eleven percent understatement of total rural GDP.
Figure 4: The Prof Variable
Overall, the dependency ratio is projected to increase only marginally because a substantial increase in
the proportion of ethnic Fijians in the population offsets the effects of their increasing urbanisation and
some decline in the relative numbers of professionals. The understatement of subsistence and total
agricultural GDP in 1996 is about the same as in 2002. Since the 1996 estimates are based on census
data, they strengthen the overall conclusions of the analysis.
Based on the adjusted values of subsistence GDP, the subsistence sector expanded on average at
around 3.5 per cent per year compound over 1992 to 2002 compared with an annual growth rate under
1 per cent according to the population based extrapolations. The adjustments to subsistence production
lift the annual growth of total rural GDP between 1992 and 2002 from under 0.5 per cent to 1.4 per cent.
Even with the adjustments made here, subsistence and total rural GDP may still be understated for two
reasons. First, the published value for the 1992 base year may be too low because it includes two years
of population based subsistence extrapolations. Second, the rural – urban movement of Fijians may
have contributed to some unemployment. So inclusion of proxies for the Employment variable would
likely have caused some increase in the adjusted value of agricultural, fisheries and forestry subsistence
GDP.

Estimating the Size of the Fiji Islands Agricultural Sector
Hone, Haszler, Tuicakau Page 18 of 20
Figure 5: Base and Adjusted Subsistence and Total Rural GDP (Real 1995 $F)
5. Conclusions
Clearly, this pilot study has its limitations. After all, the underpinning econometric model is based on the
serendipitous application of data collected for a survey with different aims. Furthermore, the annual
values of the explanatory variables used to derive the alternative estimates of subsistence GDP rely on
very few firm data points. That said, the key points to note are:
• It should be obvious even to casual observers that subsistence rural production in Fiji is
substantial and represents an appreciable component of total rural production;
• This casual observation is supported by a number of more analytically formal surveys;
• Therefore, marketed rural GDP alone will considerably understate rural and national GDP – so
it is necessary to allow for subsistence production in the annual national accounts;
• Given the results presented here, it seems the currently used population based extrapolations
considerably understate the economic contribution of the subsistence sector.
Compared with the population based extrapolations, the estimation method outlined here is more
analytically grounded and information-rich and so should in principle be the better performer. The full
results of the latest HIES will provide a near term test of the two methods. The new HIES will also
provide a very much richer data set for analysis. Therefore, it should be possible to improve significantly
on the present results, for example through more robust results for the constituent components of
aggregate subsistence production.
Ultimately, the indirect method outlined here should be supplemented, or even replaced, by the use of

Estimating the Size of the Fiji Islands Agricultural Sector
Hone, Haszler, Tuicakau Page 19 of 20
formal economic models of the subsistence sector. Such modelling is one of the components of the
project for which this paper represents a start.
Meanwhile, we believe the present analysis is sufficiently robust to support the maintained hypothesis
that the current population based extrapolations of subsistence rural GDP understate the true size of the
subsistence sector in Fiji. These conclusions have potentially important policy implications related to
assessing the resilience and capacity of subsistence producers, for judging the nutritional status of the
population and in relation to poverty assessments, especially in relation to rural poverty, just to name a
few issues.
References
(ABS) Australian Bureau of Statistics, (1990), Australian National Accounts: Concepts, Sources and
Methods, ABS Catalogue No 5216.0, May.
(ADB, MFNP) Asian Development Bank and Ministry of Finance and National Planning (2003), Fiji:
Poverty Status Discussion Paper: Final Report as Presented to Government, ADB TA 6047-
REG, 4 June.
(DFID), Department for International Development (2005), Productivity Growth for Poverty Reduction:
An Approach to Agriculture: Draft for External Feedback, July.
Owen, K, P. Vatucawaqa and J. Chand (2002), “Understanding Protein Choices in Fiji”. Paper presented
to the Fiji Food Choice Workshop, Suva, 4-6 June 2002.
Otanez, G., J. Ratuvuki and M. Ledua, (2000), Fiji National Agricultural Survey – 1999, Ministry of
Agriculture, Fisheries and Forests, Suva, April.
Sachs, J. (2005), The End of Poverty: How We Can Make it Happen in Our Lifetime, Penguin, London.
Schneider, F and Enste, D.H. (2000), “Shadow Economies: Size, Causes and Consequences”, Journal
of Economic Literature, 38(1), 77-114.
Schultz, T.W. (1964), Transforming Traditional Agriculture, Yale University Press.
Tax, S. (1953), Penny Capitalism A Guatemalan Indian Economy, Smithsonian Institution Institute of
Social Anthropology Publication No. 16, USGPO, Washington.
UN (2003), National Accounts: A Practical Introduction, ST/ESA/SER.F/85, UN, New York.
UNDP (2005), Human Development Report 2005: International Cooperation at the Crossroads: Aid,

Estimating the Size of the Fiji Islands Agricultural Sector
Hone, Haszler, Tuicakau Page 20 of 20
Trade and Security in an Unequal World, http://hdr.undp.org,
Vatucawaqa, P. (2002), Food Balance Sheet Fiji 2002, National Food and Nutrition Centre, Suva, May.
Walton, P. (2002), Collection, Access and Use of Agricultural Statistics in the Pacific Islands: Report of
Study, Working Paper IAP – WP45, ACIAR, Canberra.