estimating the seakeeping qualities of … · seakeeping performance in the early stages of ship...
TRANSCRIPT
AD-A139 089
UNCLASSIFIED
ESTIMATING THE SEAKEEPING QUALITIES OF DESTROYER TYPE 1/1 HULLS(U) DAVID W TAYLOR NAVAL SHIP RESEARCH AND DEVELOPMENT CENTER BET.. W R MCCREIGHT JAN 84 DTNSRDC/SPD-1074-01 F/G 20/4 NL
"H
END DATE
riLNCD
DTIC
K
1 ^ •••
1.0 ,_
i- m m •
• 36
|40
|25
IIP
I.I, HIM 11 8
• -I
k
:
L25 HU HIIII.6
MICROCOPY RESOLUTION TEST CHART
NATIONAL BUREAU 01 STANDARDS 1963-A
• "
o I
O
I Q a- CO
DAVID W. TAYLOR NAVAL SHIP RESEARCH AND DEVELOPMENT CENTER
Bethasda. Maryland 20084 ^^^
CO i a
oo
CO ESTIMATING THE SEAKEEPING
QUALITIES OF DESTROYER TYPE HULLS
co
w 0-
BY
W.R. McCREIGHT
on w >< o as H CO w Q
d, O
CO w
=3
O Z
a. w
CO
2 M
1 M H CO Ci)
APPROVED FOR PUBLIC RELEASE: DISTRIBUTION UNLIMITED
SHIP PERFORMANCE DEPARTMENT
January 1984
s DTIC ELECTE MAR 1 9 1984
P B D
D'::NSRDC/SPD-1074-01
DTIC FILE COPY NDW OTNSRDC 5602/30 12*»
laupwwdM 3960(461 84 03 13 ^>51 •-.,V
MAJOR DTNSRDC ORGANIZATIONAL COMPONENTS
DTNSRDC
COMMANDER
TECHNICAL DIRECTOR 01
OFFICER IN-CHARGE CARDEROCK
05
OFFICER IN CHARGE ANNAPOLIS
04
SYSTEMS DEVELOPMENT DEPARTMENT
11
-
SHIP PERFORMANCE DF.-AKTMENT
lb
AVIATION AND SURFACE FFFECTS
DEPARTMENT 16
STRUCTURES DEPARTMENT
17
COMPUTATION. MATHEMATICS AND
LOGISTICS DEPARTMENT 18
SHIP ACOUSTICS DEPARTMENT
19
PROPULSION AND AUXILIARY SYSTEMS
DEPARTMENT 27
SHIP MATERIALS CENTRAL
DEPARTMENT 28
DEPARTMENT 29
SPO 866 90 J NOW DTNSHDC 3960/43 l«tv 7 80)
—
" "mMMP<
V
^CLASSIFIED SECURITY CLASSIFICATION OF THIS PAGE (When Dele Entered)
REPORT DOCUMENTATION PAGE 1 REPORT NUMBER
DTNSRDC/SPD-1074-01 2 GOVT ACCESSION NO
4 TITLE (end Subtitle) \Ab,4/35 oft
ESTIMATING THE SEAKEEPING QUALITIES OF DESTROYER TYPE HULLS
7 AIJTHOR/JJ
W.R. McCREIGHT
9. PERFORMING ORGANIZATION NAME AND ADDRESS
DAVID W. TAYLOR NAVAL SHIP R&D CENTER BETHESDA, MARYLAND 2008A
II CONTROLLING OFFICE NAME AND ADDRESS
NAVAL SEA SYSTEMS COMMAND (SEA 05R14) WASHINGTON, D.C. 20362
I« MONITORING AGENCY NAME « ADORESSC/1 different Irom Controlling Office)
NAVAL SEA SYSTEMS COMMAND (SEA 55W3) WASHINGTON, D.C. 20362
READ INSTRUCTIONS BEFORE COMPLETING FORM
3 RECIPIENT'S CATALOG NUMBER
5 TYPE OF REPORT 4 PERIOD COVERED
FINAL
6 PERFORMING ORG. REPORT NUMBER
8 CONTRACT OR GRANT NUMBERfJj
10 PROGRAM ELEMENT. PROJECT, TASK AREA « WORK UNIT NUMBERS
Work Unit No. 1-1561-866, Task No. T2A/-Q01
12 REPORT DATE
January 1984 13 NUMBER OF PAGES
44 15 SECURITY CLASS fo/ thle report)
Unclassified 15«. DECLASSIF1CATION DOWNGRADING
SCHEDULE
16 DISTRIBUTION STATEMENT fo/ this Report)
APPROVED FOR PUBLIC RELEASE: DISTRIBUTION UNLIMITED
17. DISTRIBUTION STATEMENT (of the ebetren entered In Block 20, II different Irom Report)
18 SUPPLEMENTARY NOTES
19 KEY WORDS (Continue on reverie tide II neceeemry ltd Identity by block number)
Ship Motion Seakeeping Destroyer Ranking Performance
20 ABSTRACT (Continue on reveree elde II neceeemry end Identity by block number)
•"' -^>A procedure for estimating the relative seakeeping ability of destroyers in head seas has been developed. Several alternate methods of ranking sea- keeping performance are considered. The data base of ship hull forms was greatly expanded beyond that of previous similar work. An improved analysis of seakeeping performance data was carried out considering a large number of parameters describing the hull geometry, including the effect of displacement. 4/
DO , :°NRM
7J 1473 EDITION OF I NOV «5 IS OBSOLETE
S 'N OI02-LF-014.6601 UNCLASSIFIED
SECUHITV CLASSIFICATION OF THIS PACE (When Oar* tnlmrmd)

TABLE OF CONTENTS
Page
LIST OF FIGURES
LIST OF TABLES.
NOTATION. . . .
ABSTRACT
ADMINISTRATIVE INFORMATION. . .
INTRODUCTION
SEAKEEPING PERFORMANCE MEASURES
HULL FORM AND MOTION DATA BASE.
HULL FORM COEFFICIENTS
REGRESSION ANALYSIS
COMPUTATIONAL PROCEDURE ....
RESULTS
CONCLUSIONS AND RECOMMENDATIONS
REFERENCES
2
5
6
8
10
10
12
U
LIST OF FIGURES
1 - Predicted Versus Computed Rank R for 180 Ship Data Base 15
LIST OF TABLES
1 - Ship Characteristics for Hull Form Data Base
2 - Independent Variables Used in Regression Analysis
3 - Ranks of 20 Ship Data Base Calculated By Five Methods. . . .
A - Sorted Ranks of 20 Ship Data Base Calculated By Five Methods
5 - Constants for Calculating Rank R1
6 Ranks R, for 180 Ship Data Base
Sorted Ranks R. For 180 Ship Data Base
8 - Regression Coefficients For Rank R.
9 - Ranges and Effects of Variables In Regression Equation .
10 - Ranges of Major Coefficients Not In Regression Equation.
16
17
19
20
21
22
23
24
25
26
>*u r- J

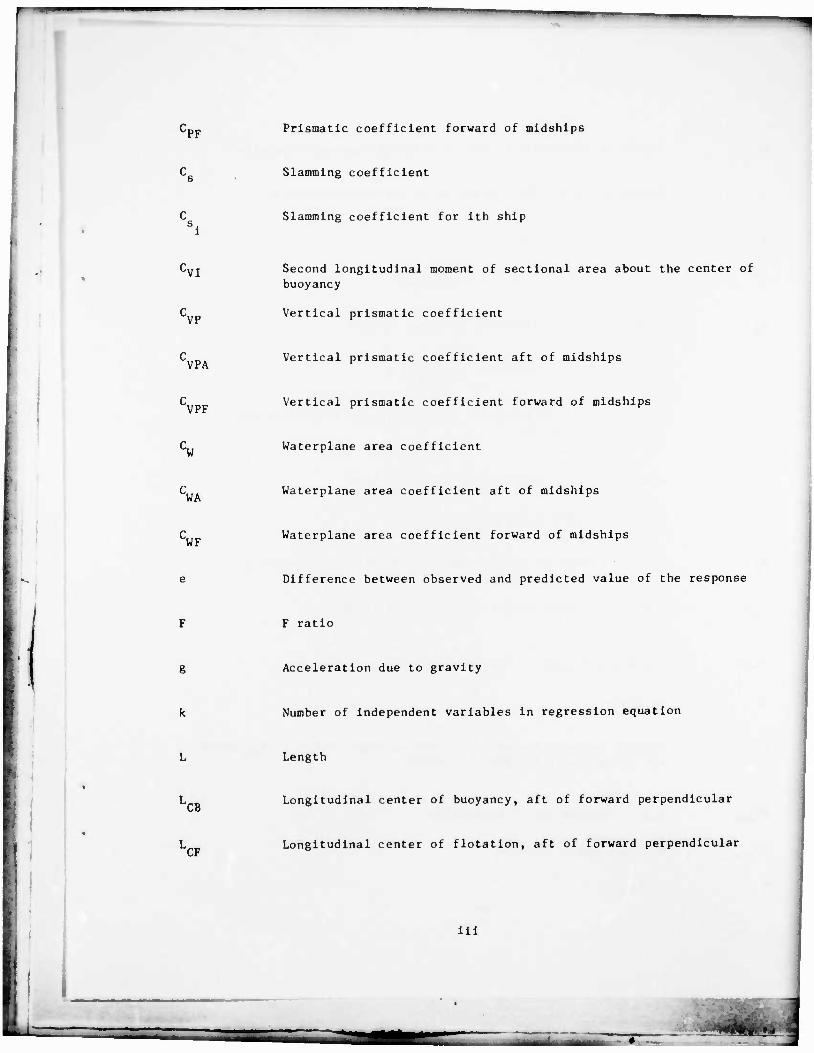
NOTATION
a(x)
Coefficients in regression equation for seakeeping rank
Sectional area at longitudinal position x
V
Waterplane area
Waterplane area aft of midships
Waterplane area forward of midships
Midship area
Beam
BM7
!
Vertical distance of longitudinal metacenter above center of buoyancy
Coefficient of variate X in general regression equation
Longitudinal location of cutup, aft of forward perpedicular
Block coefficient
"BA Block coefficient aft of midships
'BF Block coefficient forward of midships
BM V/BL'
Prismatic coefficient
'PA Prismatic coefficient aft of midships
ii
¥ mm .—-
-PF Prismatic coefficient forward of midships
Slamming coefficient
Slamming coefficient for ith ship
-VI
•'VP
Second longitudinal moment of sectional area about the center of buoyancy
Vertical prismatic coefficient
VPA Vertical prismatic coefficient aft of midships
VPF Vertical prismatic coefficient forward of midships
CW
CWA
CWF
Waterplane area coefficient
Waterplane area coefficient aft of midships
Waterplane area coefficient forward of midships
Difference between observed and predicted value of the response
/ F ratio
8
k
Acceleration due to gravity
Number of independent variables in regression equation
Length
XB Longitudinal center of buoyancy, aft of forward perpendicular
JCF Longitudinal center of flotation, aft of forward perpendicular
ill
T7T^^»W>-, •• I

r~"~^
Number of observations used in deriving regression equation
Number of independent variables in regression equation
Probability of slamming
Square of the correlation coefficient
Seakeeping rank calculated by Bales' method
Seakeeping rank calculated by method i
rij Response for ship i in mode j averaged over ship speed and seaway modal period
r, . Average of r. . taken over 20 ship data base
Threshold slamming velocity
Predicted value of seakeeping rank calculated by method 1
rl/3 Significant relative vertical motion at station 3
1/3 Significant relative vertical velocity at station 3
Variance
5lj Largest response for ship i in mode j taken over all ship speeds and seaway modal periods considered.
SS reg
SS res
Sum of squares due to regression
Residual sum of squares
Draft
iv
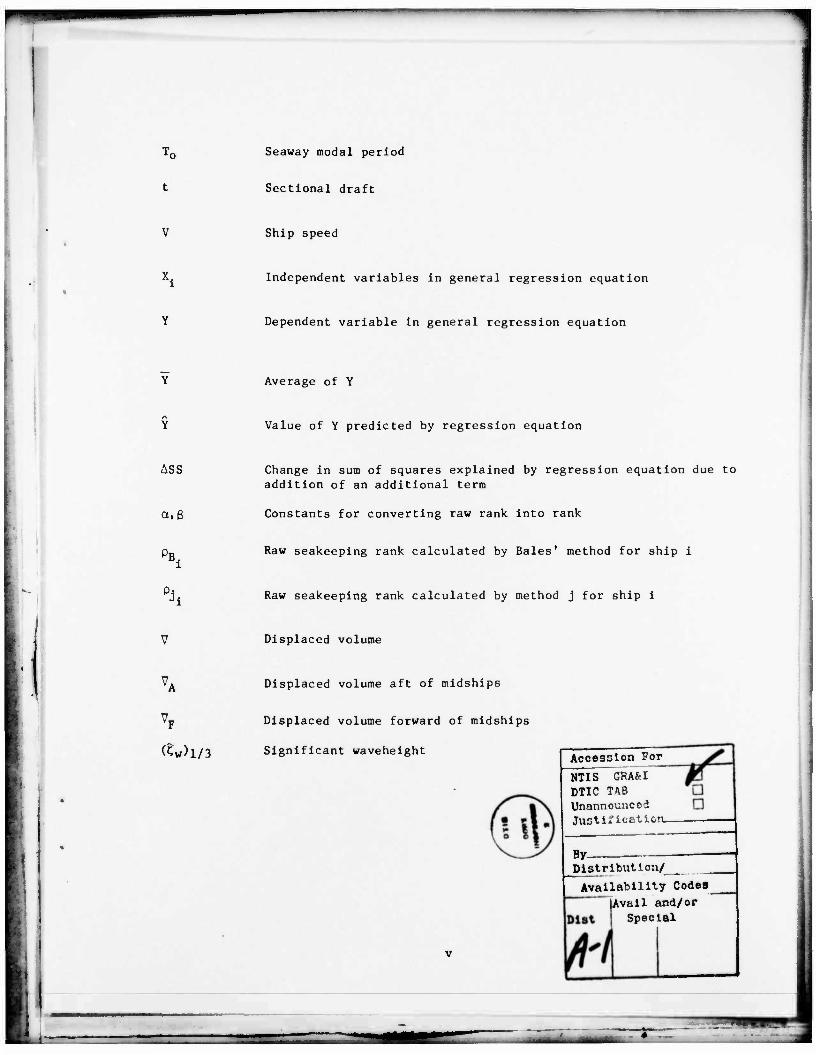
Seaway modal period
Sectional draft
Ship speed
Independent variables in general regression equation
Dependent variable in general regression equation
Average of Y
Value of Y predicted by regression equation
ASS
a, ß
\
Change in sum of squares explained by regression equation due to addition of an additional term
Constants for converting raw rank into rank
Raw seakeeping rank calculated by Bales' method for ship i
Raw seakeeping rank calculated by method j for ship i
Displaced volume
Displaced volume aft of midships
"p Displaced volume forward of midships
(£w)l/3 Significant waveheight Accession For
NTIS GRA&I DTIC TAB Unannounced Justification.
By Distribution/
Availability Codes
Avail and/or Special
hi-

"•—i
ABSTRACT
A procedure for estimating the relative seakeeping ability of
destroyers in head seas has been developed. Several alternate methods of
ranking seakeeping performance are considered. The data base of ship hull
forms was greatly expanded beyond that of previous similar work. An improved
analysis of seakeeping performance data was carried out considering a large
number of parameters describing the hull geometry, including the effect of
displacement.
ADMINISTRATIVE INFORMATION
This work was funded by the Naval Sea Systems Command under the
Surface Ship Continuing Concept Formulation Program, Task No. T2A/001.
The work, identified under Work Unit Number 1-1561-866, was performed at the
David W. Taylor Naval Ship Research and Development Center.
INTRODUCTION
For many years a need has been felt for including consideration of
seakeeping performance in the early stages of ship design, as opposed to
simply evaluating the performance of the final design. Only with the
appearance of the pioneering work of Bales on optimum seakeeping
performance of destroyer hull forms was there an attempt to give the designer
a simple tool suitable for estimating seakeeping performance on the basis of a
few hull form coefficients. However, Bales' study had several limitations,
most notably the small number of hull coefficients considered, the limited
data base, and the restriction to head seas and to a single displacement. In
this report the effects and relative importance of an increased number of hull
form coefficients are examined, the hull form data base is expanded, and the
effects of varying displacement are included. Alternate figures of merit for
rating seakeeping performance are considered. Recommendations for further
improvements, such as considering sea conditions other than longcrested head
seas and Including the effect of roll, are presented.
~x
r-w»
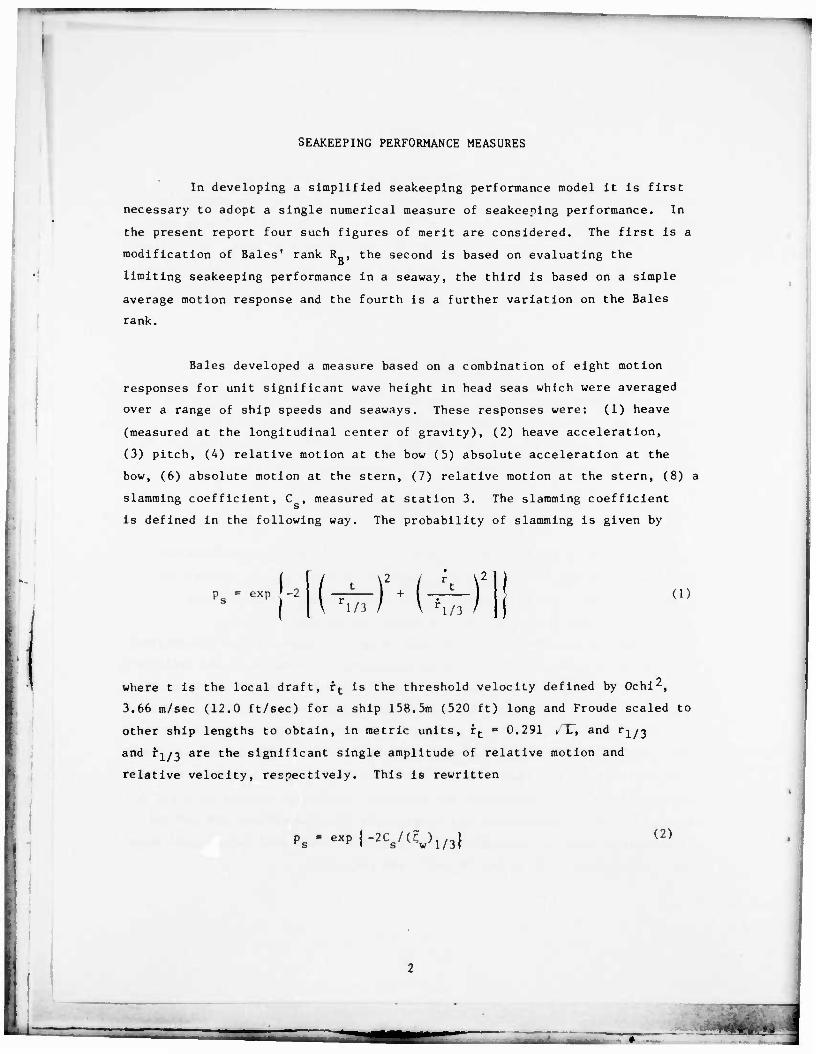
SEAKEEPING PERFORMANCE MEASURES
In developing a simplified seakeeplng performance model it is first
necessary to adopt a single numerical measure of seakeeplng performance. In
the present report four such figures of merit are considered. The first is a
modification of Bales' rank R„, the second is based on evaluating the
limiting seakeeping performance in a seaway, the third is based on a simple
average motion response and the fourth is a further variation on the Bales
rank.
Bales developed a measure based on a combination of eight motion
responses for unit significant wave height in head seas which were averaged
over a range of ship speeds and seaways. These responses were: (1) heave
(measured at the longitudinal center of gravity), (2) heave acceleration,
(3) pitch, (4) relative motion at the bow (5) absolute acceleration at the
bow, (6) absolute motion at the stern, (7) relative motion at the stern, (8) a
slamming coefficient, C , measured at station 3. The slamming coefficient
is defined in the following way. The probability of slamming is given by
XPf" ( Cl/3 ) + \ h/3 ) (1)
where t is the local draft, ft is the threshold velocity defined by OchiS
3.66 m/sec (12.0 ft/sec) for a ship 158.5m (520 ft) long and Froude scaled to
other ship lengths to obtain, in metric units, ft = 0.291 . T", and r^/^
and rw-j are the significant single amplitude of relative motion and
relative velocity, respectively. This is rewritten
ps = expj-2Cs/(Cw)1/3| (2)
]

and thus
/—L—y + u_-— (3)
Each of these responses was averaged over a range of Froude numbers,
(V/.gL = 0.05, 0.15, 0.25, 0.35 and 0.45), and modal periods, (T = 6.0, 8.0,
10.0, 12.0 and 14.0 sec.). Then these average responses were combined for each
ship into a raw rank p ,
B
7
E j = l
mint r k=l , 20 ( kj
C s. l
max C , k=l, 20. sk
where r ij
ij
is the jth average response, as enummerated above, for the ith
(A)
of 20 ships and C is slamming coefficient for the ith ship. Summing
the inverse of the averaged responses, except for the slamming coefficient,
yields a measure which is larger for ships with better performance. As can be
seen from Equation 2, a larger C results in a Lower probability of slamming
and consequently each of the averaged responses is normalized with respect to
the best value of that response among the set of 20 ships considered.
Finally, these raw ranks, ,R, are scaled linearly so that they range from
1.0 to 10.0. The resulting Bales rank, R„, considerably exaggerates the
differences between ships since the raw ranks, p_, range from 0.799 to
0.953. This procedure can be justified because interest is in the variations
in performance and the raw rank tends to be dominated by contributions from
responses which do not vary by a large percentage over the data base.
Four alternative figures of merit for rating seakeeping performance
were examined. All are based on the first seven of the responses per unit
wave height described above together with a modified slamming coefficient
18 1
\ri/3/ rri/3/
•1/2
«w>i?3 (5)
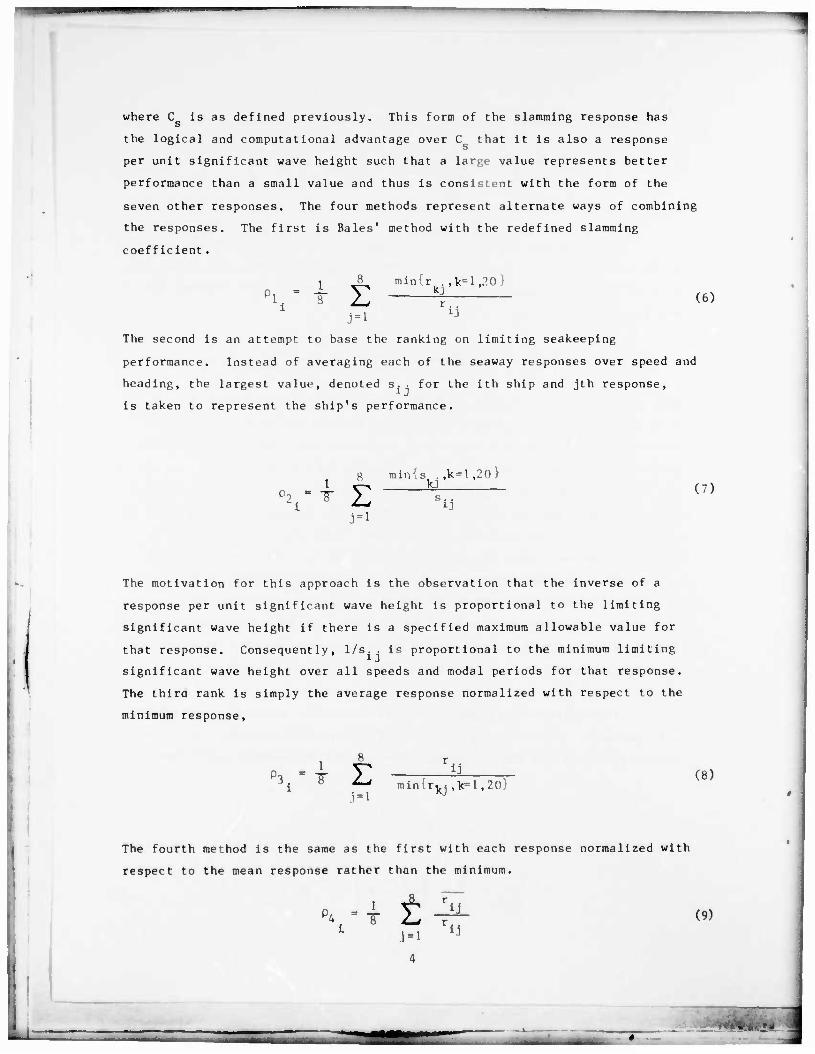
where C is as defined previously. This form of the slamming response has
the logical and computational advantage over C that it is also a response
per unit significant wave height such that a large value represents better
performance than a small value and thus is consistent with the form of the
seven other responses. The four methods represent alternate ways of combining
the responses. The first is Bales' method with the redefined slamming
coefficient.
•T Z min{r . , k= 1 ,20} kj
(6)
The second is an attempt to base the ranking on limiting seakeeping
performance. Instead of averaging each of the seaway responses over speed and
heading, the largest value, denoted s. . for the ith ship and jth response,
is taken to represent the ship's performance.
1=1
minis ,,k=l,20} kj
s. . (7)
The motivation for this approach is the observation that the inverse of a
response per unit significant wave height is proportional to the limiting
significant wave height if there is a specified maximum allowable value for
that response. Consequently, 1/s. . is proportional to the minimum limiting
significant wave height over all speeds and modal periods for that response.
The thira rank is simply the average response normalized with respect to the
minimum response,
1 T
8 r . .
iin(rkj ,k=l,20) (8)
The fourth method is the same as the first with each response normalized with
respect to the mean response rather than the minimum.
h = -r t U (9) ij
•i

f"~ "-'Mi
where
20
iJ 20 2^, kj (10)
k=l
These were tried to examine the effects of these alternate normalization
procedures. In all cases the resulting raw ranks are scaled from 1 to 10 for
the worst to the best.
In the evaluation of Equations (6) through (9) the required minimum
and mean responses are evaluated for the 20 hull forms of the original Bales
data base at a displacement of 4300 tons only. These values are then retained
while ranking other hull forms at this displacement and all hull forms at
other displacements so that the ranks will be consistent. Similarly, in
scaling the raw ranks the scaling constants are calculated using only raw
ranks from the original 20 hull form data base at 4300 tons displacement and
are retained for the remainder of the computations.
HULL FORM AND MOTION DATA BASE
A data base consisting of motions data for 45 destroyer-type hull
forms was computed. The characteristics of these hulls are listed in Table
1. The first 20 hulls are the 20 hulls of the Bales data base.1 Hulls 21
through 27 are from various sources, including proposed ships and one
constructed ship. In particular, ships 21 and 22 are Bales optimum and
anti-optimum hulls respectively, ship 25 is the U.S. Coast Guard HAMILTON
Class High Endurance Cutter and ship 26 is ship 6, the best of the original 20
hulls, modified to increase the length to beam ratio 15 percent while holding
the beam to draft ratio constant. The remainder of the hulls are taken from
two systematic series of hulls which have been tested for seakeeping ability,
ships 28 through 31 from a recent unpublished series and ships 33 through 45 are 3
from Schmitke and Murdey .
' *Documented in a NSMB report by Blok with a restricted distribution.
5
~—•
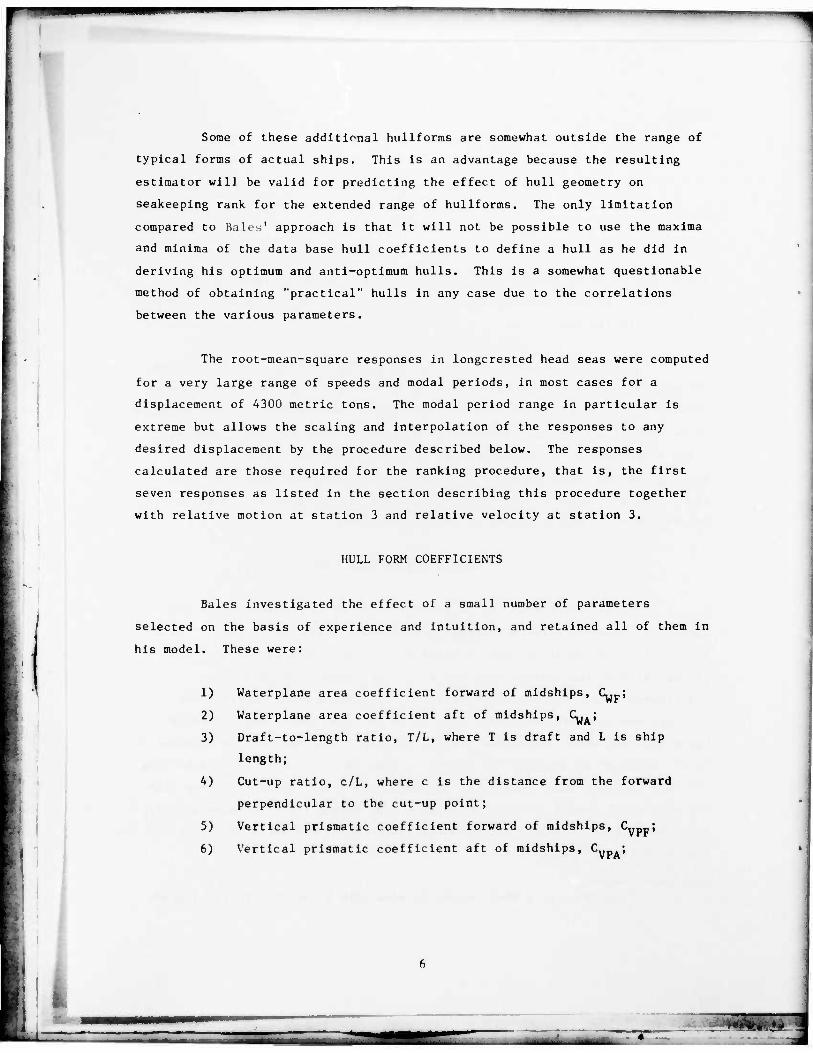
Some of these additional hullforras are somewhat outside the range of
typical forms of actual ships. This is an advantage because the resulting
estimator will be valid for predicting the effect of hull geometry on
seakeeping rank for the extended range of hullforms. The only limitation
compared to Raits' approach is that it will not be possible to use the maxima
and minima of the data base hull coefficients to define a hull as he did in
deriving his optimum and anti-optimum hulls. This Is a somewhat questionable
method of obtaining "practical" hulls in any case due to the correlations
between the various parameters.
The root-mean-square responses in longcrested head seas were computed
for a very large range of speeds and modal periods, in most cases for a
displacement of 4300 metric tons. The modal period range in particular is
extreme but allows the scaling and interpolation of the responses to any
desired displacement by the procedure described below. The responses
calculated are those required for the ranking procedure, that is, the first
seven responses as listed in the section describing this procedure together
with relative motion at station 3 and relative velocity at station 3.
HULL FORM COEFFICIENTS
Bales investigated the effect of a small number of parameters
selected on the basis of experience and intuition, and retained all of them in
his model. These were:
1) Waterplane area coefficient forward of midships, Cy.,;
2) Waterplane area coefficient aft of midships, C,,;
3) Draft-to-length ratio, T/L, where T is draft and L is ship
length;
4) Cut-up ratio, c/L, where c is the distance from the forward
perpendicular to the cut-up point;
5) Vertical prismatic coefficient forward of midships, C„pF;
6) Vertical prismatic coefficient aft of midships, C ;
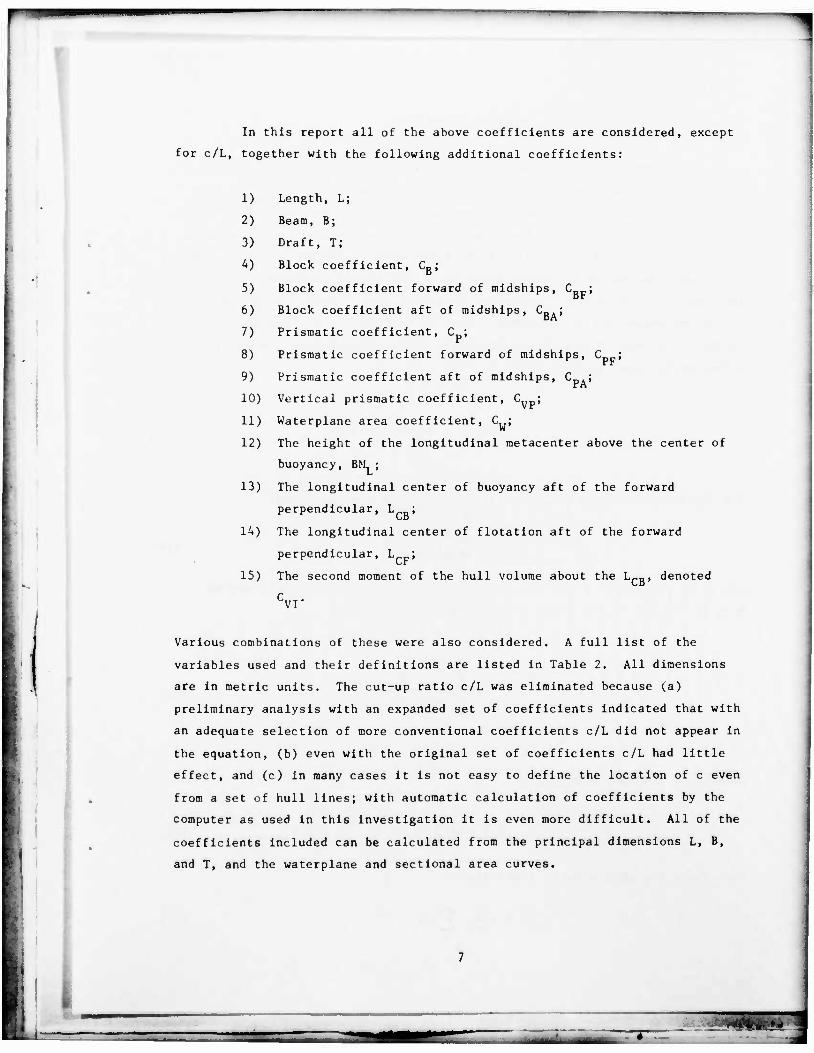
In this report all of the above coefficients are considered, except
for c/L, together with the following additional coefficients:
i
1)
2)
3)
A)
5)
6)
7)
8)
9)
10)
11)
12)
Length, L;
Beam, B;
Draft, T;
Block coefficient, Cß;
Block coefficient forward of midships, C ;
Block coefficient aft of midships, C_ ;
Prismatic coefficient, C ;
Prismatic coefficient forward of midships, C ; r r
Prismatic coefficient aft of midships, C ;
Vertical prismatic coefficient, Cup;
Waterplane area coefficient, C„;
The height of the longitudinal metacenter above the center of
buoyancy, BMT ;
13) The longitudinal center of buoyancy aft of the forward
perpendicular, L ; CB
14) The longitudinal center of flotation aft of the forward
perpendicular, L ;
15) The second moment of the hull volume about the L„„, denoted
cvr
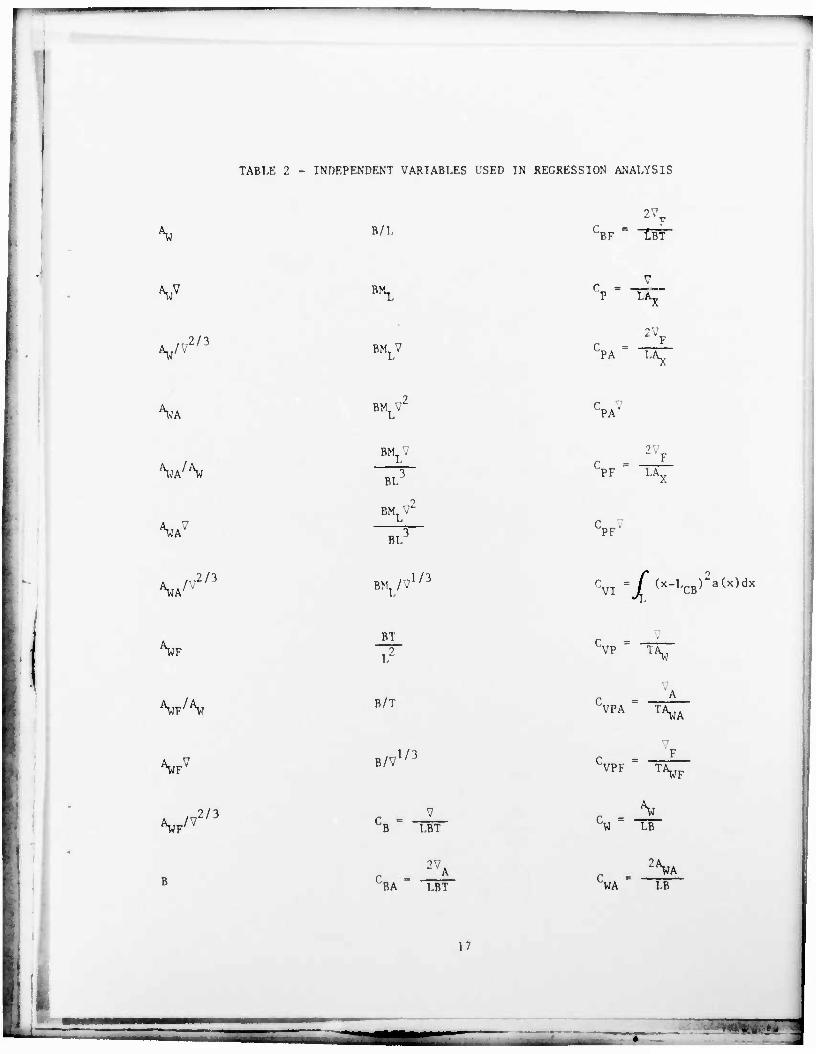
Various combinations of these were also considered. A full list of the
variables used and their definitions are listed in Table 2. All dimensions
are in metric units. The cut-up ratio c/L was eliminated because (a)
preliminary analysis with an expanded set of coefficients indicated that with
an adequate selection of more conventional coefficients c/L did not appear in
the equation, (b) even with the original set of coefficients c/L had little
effect, and (c) in many cases it is not easy to define the location of c even
from a set of hull lines; with automatic calculation of coefficients by the
computer as used in this investigation it is even more difficult. All of the
coefficients included can be calculated from the principal dimensions L, B,
and T, and the waterplane and sectional area curves.
»-
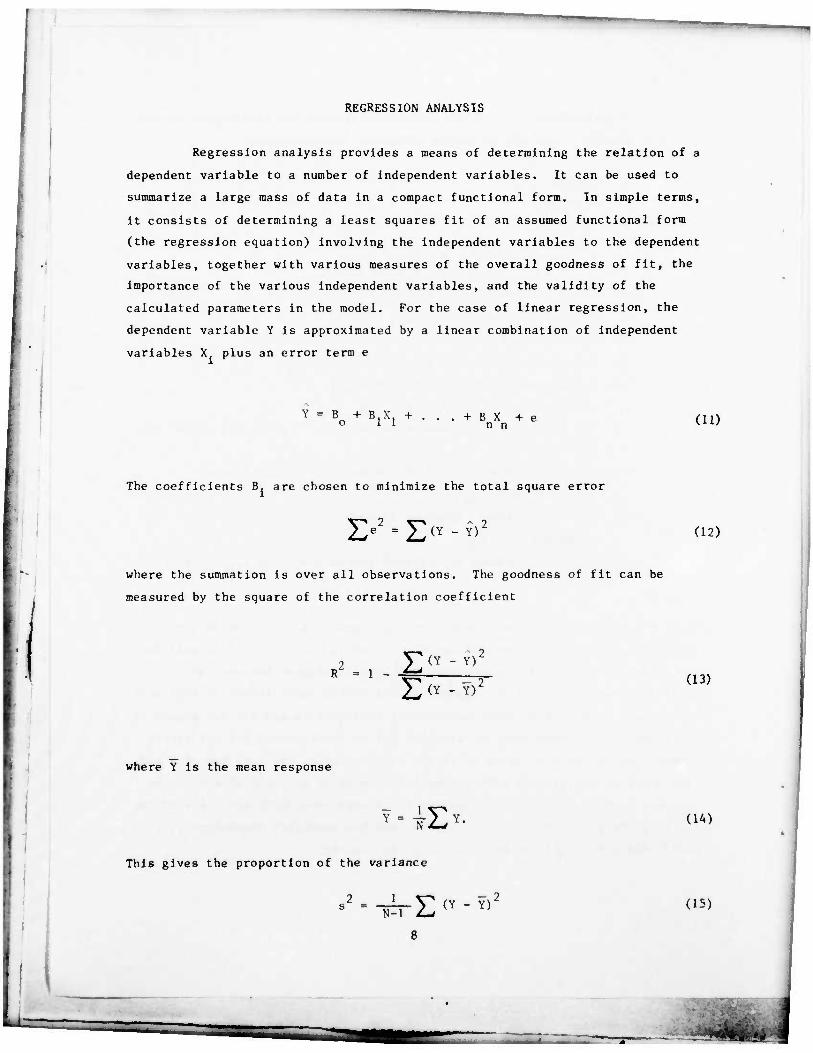
REGRESSION ANALYSIS
Regression analysis provides a means of determining the relation of a
dependent variable to a number of independent variables. It can be used to
summarize a large mass of data in a compact functional form. In simple terms,
it consists of determining a least squares fit of an assumed functional form
(the regression equation) involving the independent variables to the dependent
variables, together with various measures of the overall goodness of fit, the
importance of the various independent variables, and the validity of the
calculated parameters in the model. For the case of linear regression, the
dependent variable Y is approximated by a linear combination of independent
variables X, plus an error term e
Y = 3 + B.X. + o 1 1 . + B X + e
n n (11)
The coefficients B. are chosen to minimize the total square error
I>2 = E (Y - Y)' (12)
where the summation Is over all observations. The goodness of fit can be
measured by the square of the correlation coefficient
2 1T(Y " Y>' r - l - -** £<Y - Y)2 (13)
where Y is the mean response
-T2> (U)
This gives the proportion of the variance
77,2
8
(15)
•**m» :•

which is explained by the regression equation and clearly a larger value of 2
R is better. The magnitude of the standard deviation, s, is another
indication of the goodness of fit. The significance of each coefficient B.
can be judged using the statistic
F = SS
res
ASS/1
m -1 TT (16)
where
SS = Y* (Y - Y)' res <*—'
(17)
and ASS is the change in the quantity
^2 SS - Y] (Y - Y)
reg £~i (18)
I
due to the addition of the X. term to the regression equation, N is the
number of observations and k. is the number of independent variables in the
equation. This ratio follows an F distribution with 1 and N-k-1 degrees of
freedom. If the computed F ratio exceeds the critical F ratio obtained from a
table for a given significance level the variable is said to be significant at
this level. See, for example, Draper and Smith for a detailed discussion.
The computations were carried out using an available set of computer
programs, the Statistical Package for the Social Sciences . Except where
noted, a stepwise procedure was used in which terms are entered into the
regression equation one at a time, at each step selecting the variable which
gives the greatest reduction in the error subject to the condition that the
tolerance, or proportion of the variance of that variable which is not
explained by the variables already in the equation, is greater than a
specified amount. If at any step a variable in the equation fails a
significance test, it is removed from the equation.
• •

r •"
COMPUTATIONAL PROCEDURE
The ship motion reponses for the range of conditions described above
are computed for each ship in the hull data base using the strip theory ship
motion computer program PHM* and then merged onto a single file. This file is
then used as Input by a ranking program which reads the ship motion data base,
scales the responses for each ship to a specified displacement, interpolates
the data to obtain responses at specified speeds and modal periods, calculates
the seakeeplng ranks as described previously, calculates the hull coefficients
described previously, and generates a data file containing the ranks and hull
coefficients in a format suitable for the regression analysis program. The
scaling and interpolation procedure is based on the fact that for a specific
Froude number VA gL and nondimenslonal modal period T • g/L, linear
displacements per unit waveheight are independent of ship length L. Angular
displacements per unit waveslope are also independent of L, thus angular
displacements per unit waveheight are inversely proportional to L. The -1/2 -1
velocities and accelerations are proportional to L and L
respectively times the shiplength dependence of the displacements. Thus it is
easy to scale the responses appropriately to a new displacement and
interpolate to obtain the responses at the required speed and modal period.
This program has an option for reading in previously generated minimum or
averaged responses and rank scaling factors as described above. The program
also has an option for weighting the responses for different speeds and modal
periods. This option was not used in the current investigation. This
procedure was carried out at displacements of A300, 5800, 7300 and 8800 tons
and the resulting data files were merged. Finally, the regression analysis c
was performed using the SPSS package.
RESULTS
U I
!
The rankings R., R?, R-, and R as defined by Equations (6)
through (9), for ships 1 through 20 at a displacement of 4300 tons are
presented in Table 3, together with the Bales rank R as computed from the
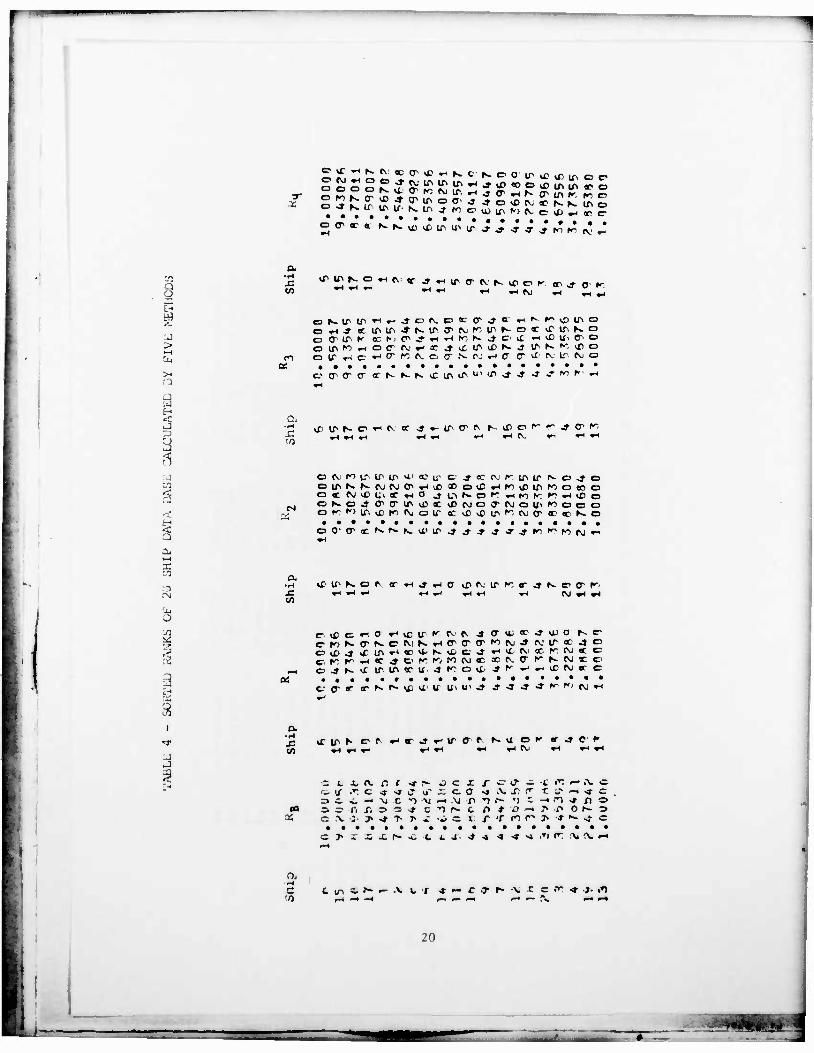
data in his paper. Table 4 presents the same data with the ships sorted by
rank. It can be readily seen that the various ranking methods give nearly the
same results.
*Docuraented by Hubble in a report with a restricted distribution.
10
TTZT

I
Table 5 lists the values of mln{r. ., k-1, 20} required to calculate
the raw ranks p. using Equation (6) for an arbitrary ship and the linear
scaling constants a and ß required to convert this raw rank to the rank R
using the formula
Rj = IP. + ß (19)
The rank R.. , as obtained using raw ranks defined by Equation (6),
calculated at displacements of 4300, 5800, 7300, and 8800 tons are presented
in Table 6. The same data with ships sorted by rank is presented in Table 7.
It Is readily seen from Table 7 that while increasing displacement
increases the ranks of the hull forms, the relative position of the hulls at a
given displacement is not much affected for most hull forms. It is also of
interest to note that the best hull, ship 29, performs better at 4300 tons
displacement than the 20 worst hulls at 8800 tons. However, considering only
the original Bales 20 hull data base, this is no longer the case.
Lon ships with full waterplanes perform best in head seas. The
four best hulls, ships 28 to 31, have the lowest block coefficients in the
series, which results in increased waterplane area for a given displacement.
A stepwise regression analysis was performed on the 180 ship data
base consisting of the 45 hull forms each evaluated at displacements of 4300,
5800, 7300 and 8800 tons. The specified F ratio for entering of variables was
3.89 and for removing variables, 3.889, corresponding to a 5% confidence
level, and the specified tolerance was 0.10. The resulting regression
equation is
!1 = a0 + alBV + a2CVPF + a!CVPA + V'l + '5L
+ a6T/B + a^ /V 2/3
+ VLCB " LCF)V (20)
1/3 + a9072 - LCB)/V"
J + a10LVBT
where Cj = BMj /BL3
11
'
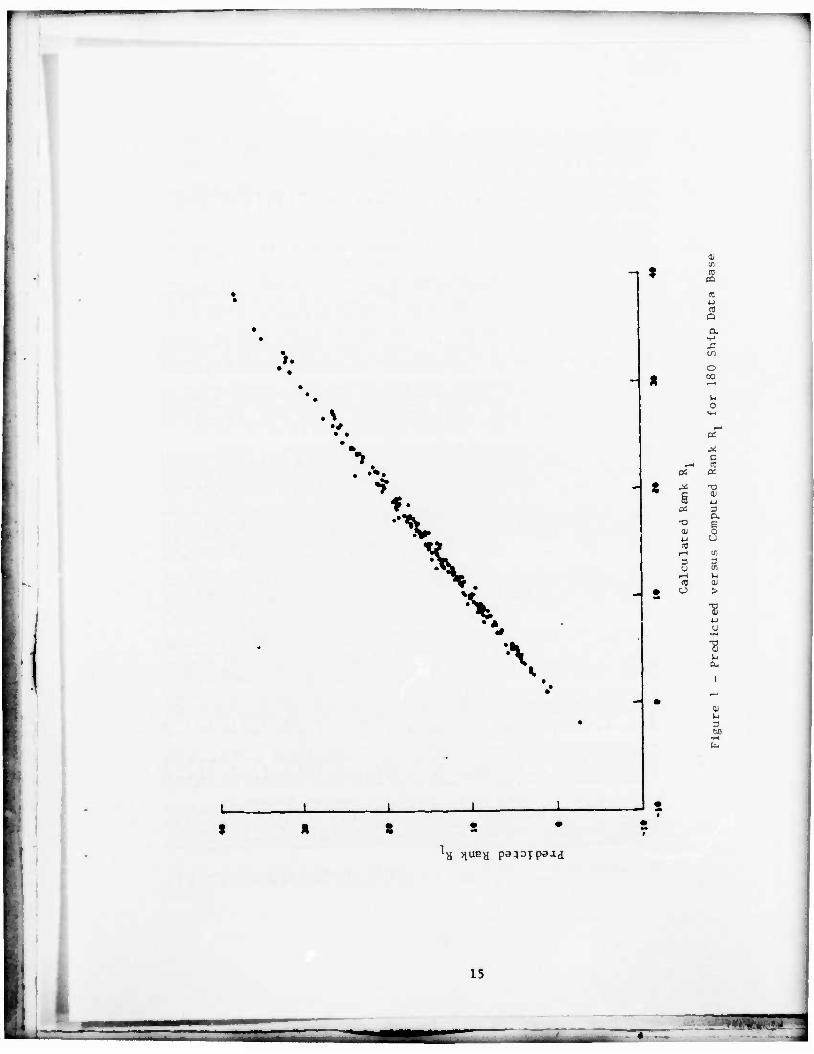
The coefficients a. are listed in Table 8. The standard deviation is 21
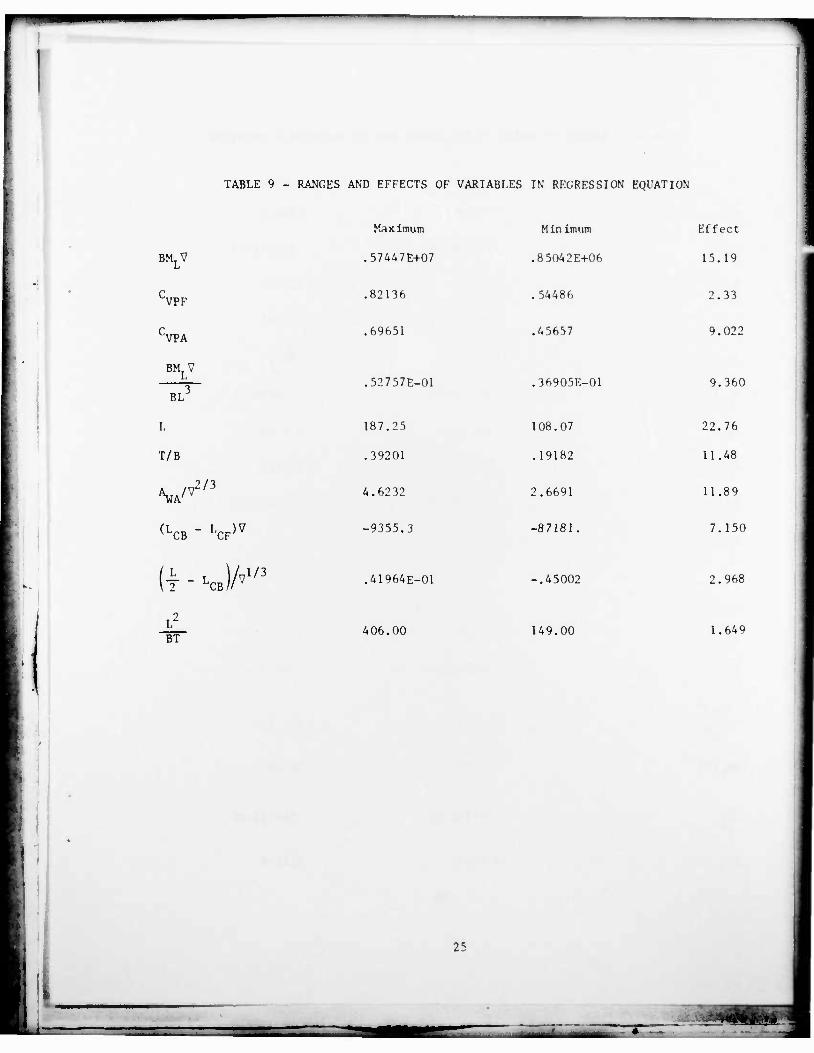
0.55975 and the K is 0.99533. Figure 1 presents a plot of R versus R.
for the 180 ship data base. The minimum and maximum values of the variables
are listed in Table 9. The effect, or difference of maximum and minimum
values times the corresponding coefficient, is also presented in Table 9. The
effect, or difference of maximum and minimum values times the corresponding
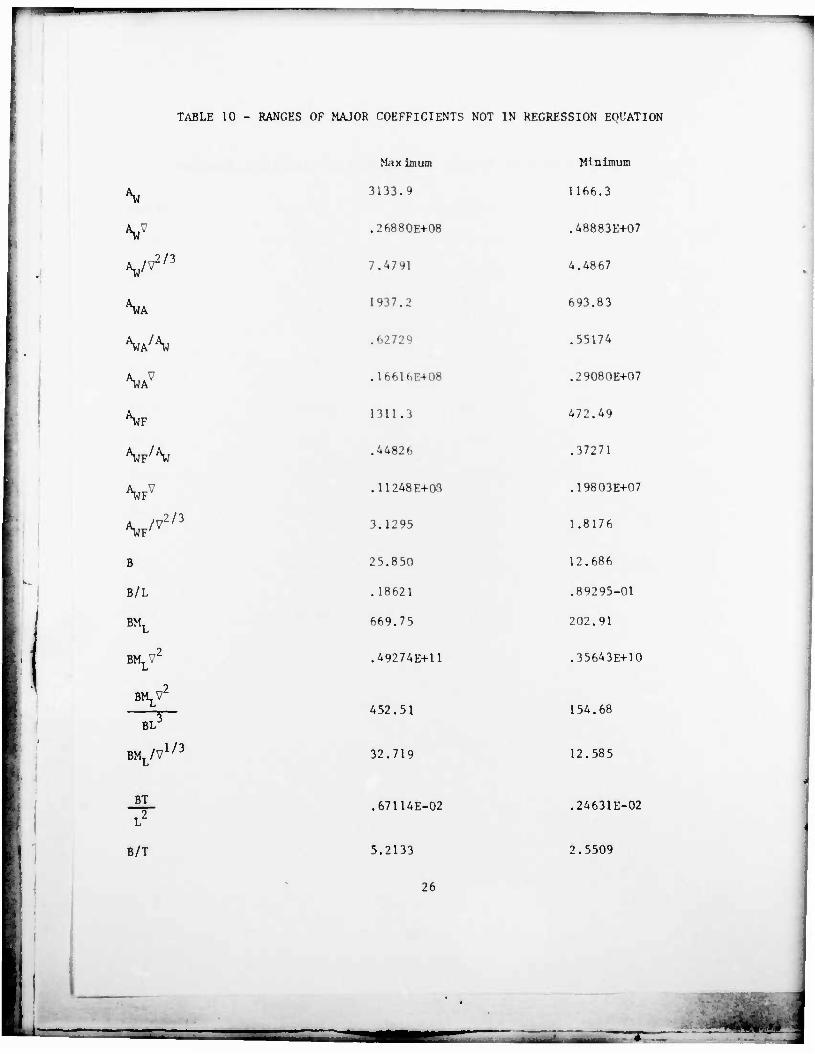
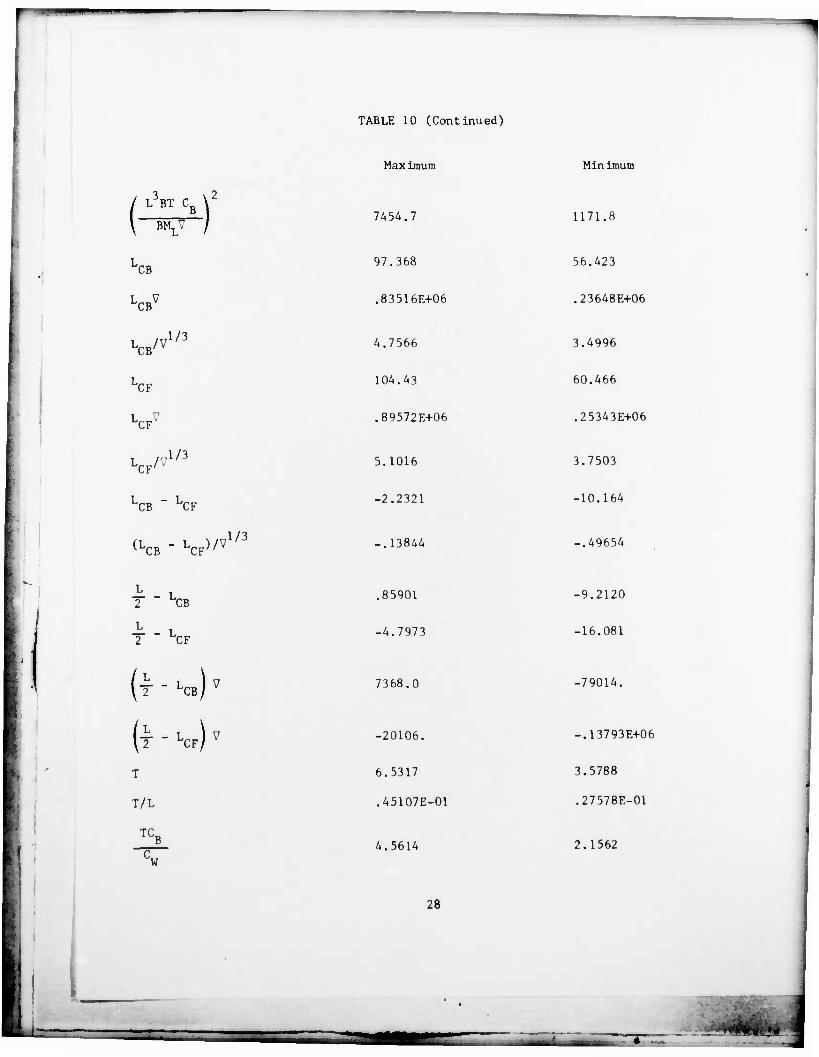
coefficient, is also presented in Table 9. In applying Equation (20) the
variables should, strictly speaking, lie within these ranges for the equation
to be valid. Other nondimensional variables should also lie within the ranges
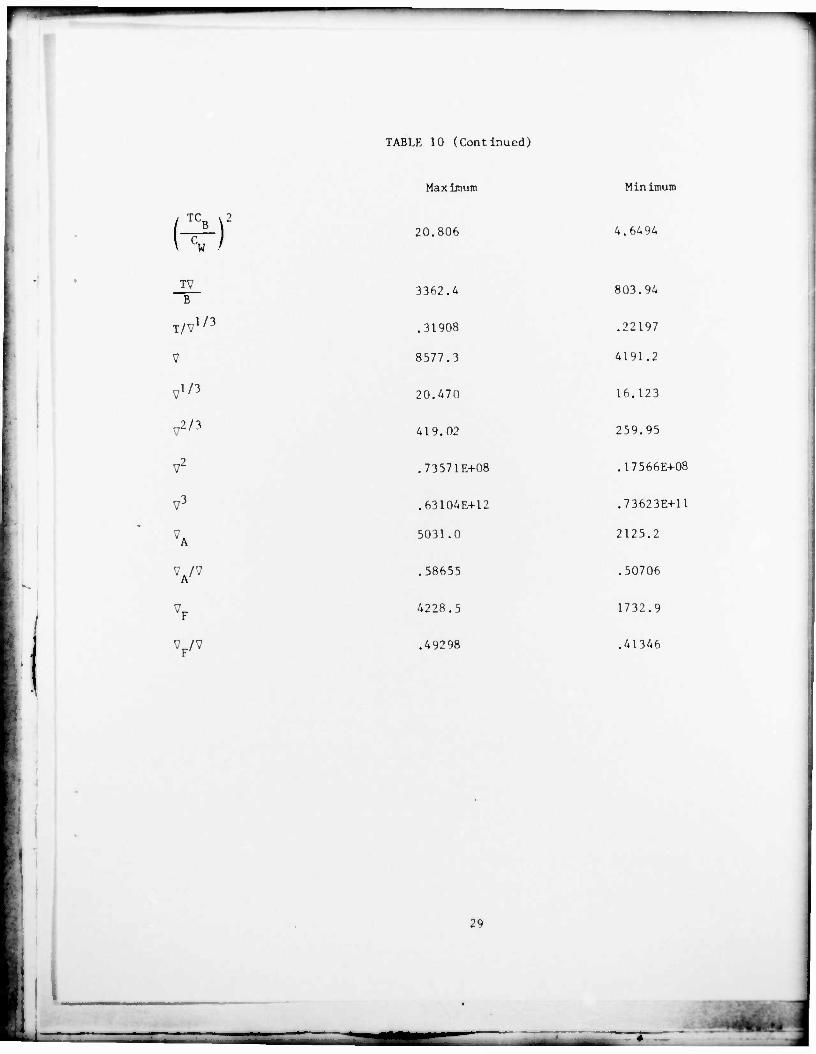
for the data base. These limits are listed in Table 10. Note that because of
the correlation of the various hull form parameters it is not possible to
simply regard each coefficient in the regression equation as indicating the
relative importance of that variable independently of the others.
CONCLUSIONS AND RECOMMENDATIONS
A procedure for quickly estimating the relative seakeeping
performance of a destroyer-type ship in head seas has been developed. This
method, which is a considerably improved version of one developed earlier by
Bales , requires only quantities easily calculated from the length, beam,
draft and sectional area and waterplane curves. In applying this method it
should be noted that small differences in predicted rank should not be
considered significant, due to the small errors in fitting the equation to the
data base. Some evidence was also found that the interpolation procedure used
in scaling the motion data base responses to a specific displacement also
introduced some variation in the calculated ranks.
The exact form of the raw performance rank calculation does
not greatly alter the relative ranking of the ships. Variation of hull
displacement also has a relatively small affect on the relative ranking.
Generally for a given displacement, long ships with large waterplane area
perform the best.
12
rrr

r-mm
Extension of the procedure to include the effects of roll is clearly
desirable. However, there will be some difficulty in carrying this out. A
much more extensive data base must be generated. Meaningful measures of roll
response must be selected for inclusion in the rank. The principal
difficulty, however, will be choosing parameters to be included in the
regression equation. It will not be possible to use only overall geometric
quantities of the hull. Mass distribution properties such as the vertical
center of gravity and the roll radius of gyration are obviously important.
Many small details of the hull such as rudder, skeg, and bilge keels will also
be quite important. One possible approach would be to use roll natural period
and roll damping, perhaps as estimated by some simple procedure, as
independent variables in the regression analysis.
Another useful development of the present work would be to derive
regression equations for criteria-based rankings for specific design projects
based on a (pre-computed) hull and motion data base together with the
seakeeping criteria for the specific design.
Finally, extension of even the present approach to other hull forms
would also be of considerable value to the Navy.
1 I

REFERENCES
1. Bales, N.K., Optimizing the Seakeeping Performance of Destroyer-Type
Hulls, Thirteenth Symposium on Naval Hydrodynamics, Tokyo, Japan,
October, 1980.
2. Ochi, M.K., Extreme Behavior of a Ship in Rough Seas, Trans. Society
of Naval Architects and Marine Engineers, Vol. 79 (1964).
3. Schmitke, R.T., and D.C. Murdey, Seakeeping and Resistance Trade-Offs
in Frigate Hull Form Design, Thirteenth Symposium on Naval
Hydrodynamics, Tokyo, Japan, October, 1980.
4. Draper, N.R., and H. Smith, Applied Regression Analysis, John Wiley
and Sons, New York, 1966.
5. Nie, N.H., C.H. Hull, J.G. Jenkins, K. Steinbrenner and D.H. Brent,
Statistical Package for the Social Sciences, 2nd. Ed., McGraw-Hill,
New York, 1975.
6. Hohlen, Mina, SPSS-6000 Release 8.0 Update Manual, Document 457,
Vogelback Computer Center, Northwestern University, Evanston, 111.,
July 1979.
14
r
1
cu to
~ 9 re aq
• CO • Q
• a • • 1.
• • •
ft* • •
ft
• •
- *
a:
s 05
•H
o 00
o
c fl a: -a 1 u 3 f-
.
I -O 01 ftj ra
r-l 3
C E q
3 •»a u in
rH U ^ . a! <u
^
• u >
0)
• 4 u
*
1 1 1
•
1
• 1 •
•
•
•
T3 CD
D-,
1
CD
3 50
hi
s ft 8 2 • •
»1 HUBa pa^oj pa »a
15

I <
«
H ')
X) 4P- J-iTi-n or-rvironronj X) ,/">>> xi —1./1 or-4; .Vj4.fi'r>r-,'-.nX)'-<-^'-«—•—• -^^•4-tf444.n4 J^JIj^-* ritnxsiiT-nrnrr>#s^~t *Jixixixu^rnryixix 4** -tTUT.nxjixixuinxuiinnjiji
ßf>- niC^£-i*0>-.rt1ji')'n»l>Crfi3>«.£-• ^ "VJ > M VJ VI vj \j VI •* * * •* 4 4\i O —x v/crcc-v/r\.(\i"-tf-air-»»-f~-*f--«fw»/o xu cp-rr -».— -a J^^^JUUKUKUO" U JJJUK -4 If -4 -*-*-»•»«» 1/ M»-*-rf-»^-4-9-4-H-*ir-*rrT 444>14N140<*<1.444<1<}
n^cr^^r irT1 o—•*- 4-r- -? x v r —••»%Tocr-,»''"xT—<T —<—< —•—•—.—..-«—.—i —«,-*—.3—1 1 "v - o :. r 0*1 0 r vj \j r ? r> — — r }- o x X Xr- -*l .r x x. •r-"V"VjV"\ivj-v-v.'-\j\.'\i.'\j'v'\j\j^
o 3 :30ooo-;:prr 3 c o ooc-r>-3oooD<T:oo^:poa©oooo~-:r>0300o.-3 0
•J
PC
< 3
•4 4 ox ox X3~iCVf-cV.xoj-X"-«i"r'. X fcc-nlvf M/irciirC'"'Xst^ •4ea.l--'\.4Cvroir rvo^*xxxircvrr-<T:xi^:r.CX'<\.4-r'-4£7«r-44xr'--j". x r- rv—c o J ^.^.«J-^J 4-_r>iTirr- x
tf' c^ft ji] rvrvr-crvftftr- —iinnc- stirx. J LT > — CX M^^-cr.rH^.ccocccnr; xr- r-p-xr-XXr-r-r-f-r-r-r-x<r-xr-r-r-xxxx"r-r-Tr--xr-xX)xr-r-r-x'XX'r-r-r-xr-
tv.-* j-r- c x x j ficr >A j> x iNi/i x x r-fv.j' <v.x cj »~rvcrr--44c.:jr-^r<- — ifl 4 rv.~rv,^x o soif iMf JJ rt f .iT^'-JJfvfviXxnx —-O j.m xr- «. 4 r- xt- x x—-.——«4.*.»xixxr-r-
4 or- i\,_x>ri 4r-r- r-j-, j- x x <\jf--Hr- x>cr <\.*?- ~rvj~ x X«t-r. cicüfüj^iifXiufi'H X*»" OX X) X)X X)X XX X?X XA"XX)X>XSXXXvr)XXr- Xr-r-r-r-JMT 'X. X,X f Jlirxti XXX
^— VJ4--«^4 4r~4XXl-3X1^X^r'X}-*'4Xr-oro£XX^X^«~^^~^ror)1<inr^'V, 4^4 ** 4 cnox,-* 4/fti<->r^r. ONOT4*- £r- 4 i x v;"!.-«-J* ~«.-«--.^.-.^oxxxxX4r- c;c roij- XN-JC^ Xr-oxrrN'-4f-r- xxo—<a —•^if-iTT-Lf .VJ—-r- r-r-r-r-r---.-«.~i.-i^^-.c-, .4 .— iTj ox —•'-•">4 —-ox J ~*x' ^mx lNrti»!» xr- x J X'->.7,r-r-r-r-r-r-''-xx xx xxx cv,
< ;>
x r- ~• tv <\ x cv x. •— r* f» ^-c x 4 x jjccircu r-^xxc-r-f-r- 44 4-3 4 4- x x ex a ax 4 •-< 4 4 r- r. cc,i\.r*,cjjr.fnp.li ,j j or-c-cx irx.r.i'KT' rv^<V44>j44^axTX"rxxr- «^'XMh-j.'jL-jr^Ktr^; —.cxc* J c^eC.«?«TOr;i» f m,-,,-. —^ ,-i~- j. j j-*"ic_ax4'-xx—• **f» — r'^-rmx^jvxr«- r. 4 x x o ~ x X fv. n. \.\i\a?(7 iff j-jrva
x X ? o / c —3 ' '—• X c '"V X 4 tcTrvrvo^-of-- — x—<<Xxr-of*"r'rr,. "",(»•. ")^.r-—.^i—.^7r>- cr — 1 x — j r-~x ci;\i J',)r»•«r^^-^r »rif ; ü J/'r^•^^rv^^^•cc>l t«;4\ ^"i.'xj "if- ^irfo.iijjiViTOio x>r-r-ir x "".if >tfl X1 -J rv.V/i'vrv.tv.fvrofi -Ofjm-ni^-i 4->^N-.r-ij jHisojj'rxo-rnriX'J co(vnvM;-<,ocj>j>jjvj' j- x>x X> X x>x 4C xxx .r «.xxx* rj ». x xirx.i^ijiificf/.-jjuxx. XLr.j">j-.x>Lr>J">inj">inx>xr.
i? tv J r\ rv, rv «a- f x>fj> 4 .T (v. o — a. o xi x x ^* a* x ei rv x x x x. J-XXXXXXXX X X X X X X U. \«X1(\.'J-•^(\X"n^cmr--fV4(v,r>ccrvinx mr-cr- X) u X X i«-#» r-1» I»» f- r- X X J" X XX —<LT. ft. (T-x' rvtr c x1^ rvx^f^oar r- —«r--<r x j" i->ir^r j-ir--'X>x;c r -* CNJ c7-vr a^a-a1 x XJX^X-X- £r- -» > «jrr)Cv7-r-rrirv.r~-r\jcv.o—x ft -»sjs-^x(vjr~^-<nrvi—«rno^^ <ttccfticOGOGOiDtOiTiriDincC.O' ' ^^a^^^^^^^^^^-^^^ x^^^^ta^cc^^-^tJ"'lrl^^£^^^^^^^c»Oü^XN«
to
5
(V—.ro^-r-x >cX5rrir--f>-jM-nX)XJ-fVT)Oir«x-3-XJ«» oXTnLTr-in 3s (\X) J" nf m> > xii^c »-<XJf*~^-.r^ij-)x 4^»(v,rv'f.—j^aro-txtvjxi^fVjn^ r-^r.r-rvj^p-- xiirrv,4-tf'0(\,f- X)-->J- —>I\IX
(v—«0 4- x.» c —iro.r '^XJ J- rv^jxrv.lr)iT4'(Vif\;x,^-J'oa-t)-*p- —-r- oa.nniMiroovti) x> .n« 3- x ox x; x. J «cn^-ox' tvjxxr^.a-u-r-ncr-j <j cs^-->J'C\:r'i x^'—Oir"'— xu.x— x)r-(\. rv."Of*l(\,(\ifrfVirr'i,irr<ri<\.r\.(»io"fv.r,fVjivJrv-* fvifV.'v.fV.-jc.ir^ji ^cvirva.'nronroojfv -t jmr^m
\oi\zCPiHiri;iN (v.^noix.rv.rncv.r--—'J-P--C. vtdNn.onxVvtxi^-<<\jj~ix>x;^oj^i/irvr)4 »xc/'jicN/ifu-•ir^4oxTJ*r~x-JvfVi«tx(\1xi'---irrri-*vi^j.'n,xr,ixxor>-f--a'-'tnr~- x'.vrvir^-j' -vjxcjj"Xtr»x)^<xojr-vTX/i/X'ivn.t^ jovfiYinTioj'flj,x/oirx(,)Xi/>^ir.-jji
—«x 4-—<j- OIVI/IJ-J x<c\j—"or-om^nj^—•xi(vjf-r---<xJOo J4OMXM'. XXXJIOCVJO or^j-rvxixxi ccx •\J*— »—«J>r- j^ xr~- xjxir- .\JX> X--H—inline o^ri-x J> J- -cj x-f- XJXo
m-4 -j 4 (K,r~,m4jf. 4 4-n-».^4 44»*1-»» 4 -* 4iT>» (^.^-r-r-f-xca. xxixjsjox-trxx»-» 4J~ ^^^^^^^^^^^^^r-^^^.,-.r-.^^-.^---<«^-^r-.-.~--r^(V.^-t^^,--.«(V^-l^-l«««^--.
r>-c.'\iOXX)rw'vi--.xx-<OTC7'-«X03'="V.Orni)-»OJ-'~4r- ^P~ XfVi(VjX)',riAjO">-4'X!-*ox -*x V'-«ornx)Xt7>—•«* OX—'^VDIM^X;-*-»-* o-Hft)4^iO'<r-',,i,i,i^j,iOf-iooocNk-
4XxN.\ivti*jJ,oj xx/ft. 4f,-nr>-i->Lrx/f-x oj>Mii*j'fJ j-a^r-r-h- rxxxxX/f^r-- AjfO.vjrv. Vjfrl-"iV(\i',irvj(Vfv,nrofv,rn — rr..'vim—««(Vj— «•M'nf^f»!(Vc:co>'\l\j!\jooo.'v,fv.(\jfv,>v
^.VJC", jjxr-xJ- c^-rV' 14 j^X/S- 1 j o—•.v.."', 4X Xf~- x 7 o-^A^r,-« xxMTc«(v,»,4tu
I If)
u
'
TABLE 2 - INDEPENDENT VARIABLES USED IN REGRESSION ANALYSIS
2/3
V
\'A
\'A/AW
V
AWF7
2/3
!/3
B/L
iML
BM,
BMLV"
BM V
BL3
BMJ2
BL3
B\/?l/3
BT
B/T
B/V 1/3
CB ' LBT
c .&. BA LBT
C 2V,
TOT
cp X
2V_ JPA L. s JPA'
JPF LAV
CPF-
n =j^(x-LCB)2a(x)dx
VP TAw
A VPA TAWA
F VPF TAwf
\ JW LB
!AW "WA LB
I 17
-~r:~ g
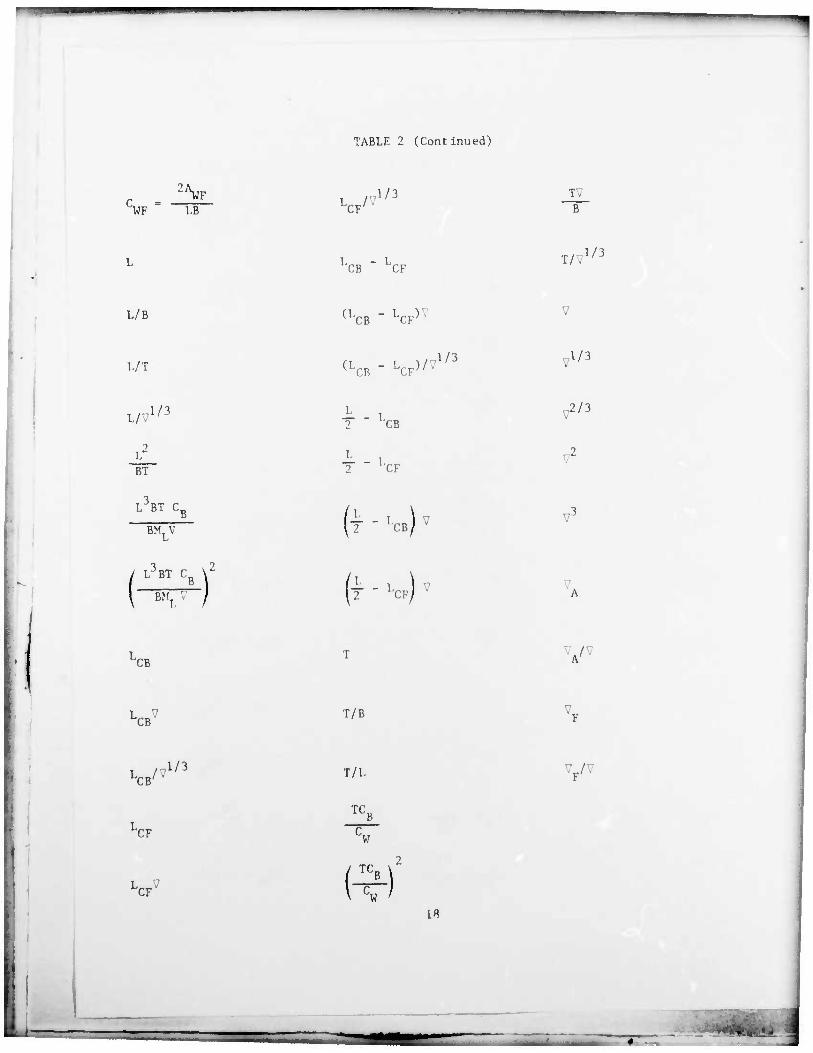
TABLE 2 (Continued)
1111 —
"WF LB
L/B
L/T
L/71/3
L2
BT
LCF^ .'/ J
LCB" •LCF
(LCB " LCF^
(LCB " V 1.
~2~ LCB
L 2 1 •(•!••
1/3
T.
B
T/'. 1/3
1/3
,2/3
L3BT Cr
BMtV (T - '•<,)
ft*)' (T - K»)
"CB A/
LCB7 T/B
W ,1/3 T/L Y/v
JCF
LCF-
TC.
R) i«

!
!
if in o ^ p^ t> y, K<=»if'">r»cc'ir. *'*'K«Cflrfl>.
LT\ tf\ «0 lf\ CT O lf\ -J CV CC If. K O N. ,-) fv- J-XN-O ^ rWrtlfirl04ff''MKT<NO*ff'ClM.9>>C
^^a,'Clfffo'4^'Noa^o^JU>(^',l^J^0,
»-j if H ^ ^. o i^ t tf i0 j o c c t r« n ^ j) H
cosc'^cru,'accro<rifitn(i;cc<roa)rr:rcr>-!r K K .» ro J- o s j t ir j Hirtrj^jNK)
t<? 40 (v.C'<T«i,fv.»-N:^oifa.-vt.c.-»cr^«e- os!\,rircirrjO(7»<acswfi,Mf1jj *~u<Cf\.<£o^ocevi Kjc: if if n J f~ «c fv.
KSjrifojicirtif.jr'ifo-jc^Nj
nni'HNSsi n is c T- ~z> o c o v 3 x c
# T <r r- C - r > n T a *i = t. v r J« *! * r
5> 1\ » u r. -t — c• r -t ~ * "Vi
c -0
«i cv, f- ju OJNOCO C^N^ j u it s «r o c ,j -J «-< ** »•> »-I r-
i
19
n o ir ri c «-< <T M c\. o a ."^ r*- «-< O cr ^ tv• ir rj o as *• . . . .
Q, vrivrNC1»-1^ or ,j»-irc,r. sice''? Jf^
a
w * if S o r a- « j ^ o ip Mf K r * K c (TK'
«H «H »-I »-I.-I »-I »-< »H fVJ v>4 v-4
e-iCc«-o *-• vc IT f «^ ^ i ff * * •> W o K C
o^Kittfi^eKfo**'1'»'»1**"*
c-tror r SP> wv ii'ii1 •> #*#**'' w ftj *•«
to \r ir. h- e- r- »< «r .y «- ir •r j- e- f
i pa
as
9 L x. <v r. r •*• c- ^»cxy^iT"— -t IT ^- x o o if r c 4 •* J u' ~ t O >* A* Jf> C C 'J* —• < c
» =? t\ r, z> -5 .* c *i r- c O»J-'M,ON3 c x •: • > >* > r * ••> =: i f T A r j » N ^ c
= 7« S X r» 4 <6 i. a •» •» -a •* » •*' <"" X X »i
a t m • N •- X t, I * m c & t- X x C « .» J. .»)
20
A** i
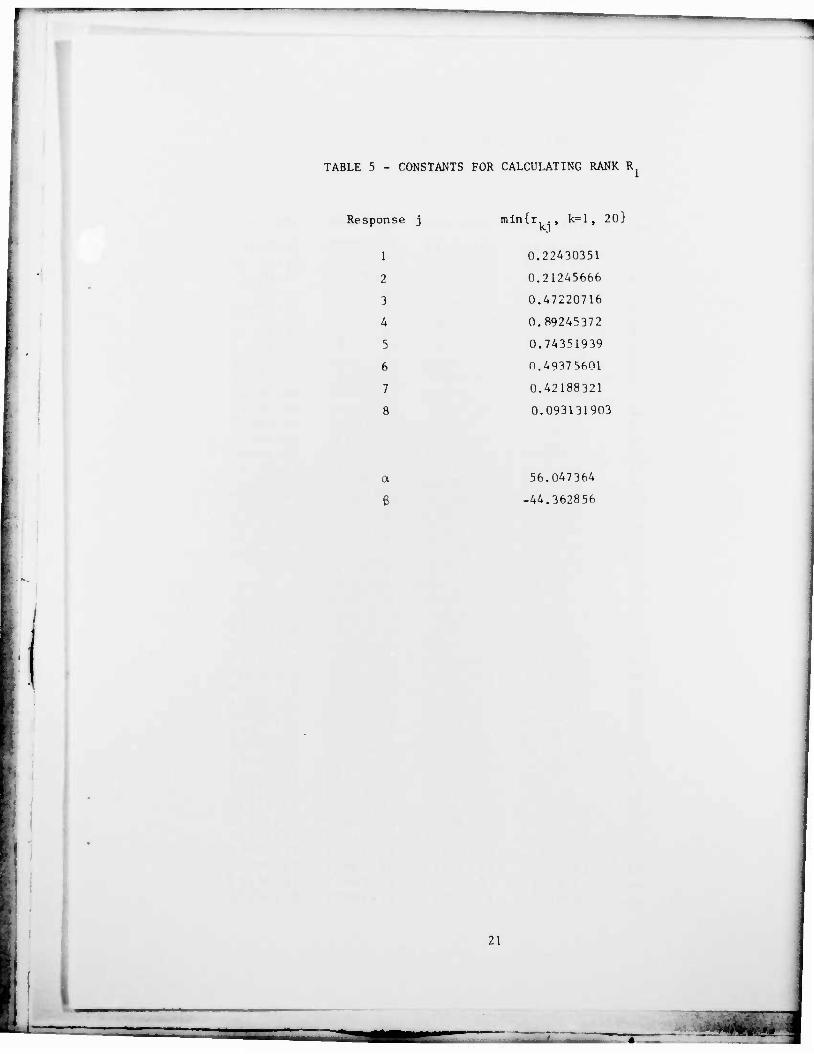
TABLE 5 - CONSTANTS FOR CALCULATING RANK
Response j minir, ., k= 1, 20}
1 0.22430351
2 0.21245666
3 0.47220716
4 0.89245372
5 0.74351939
6 0.49375601
7 0.42188321
8 0.093131903
56.047364
-44.362856
21
T77
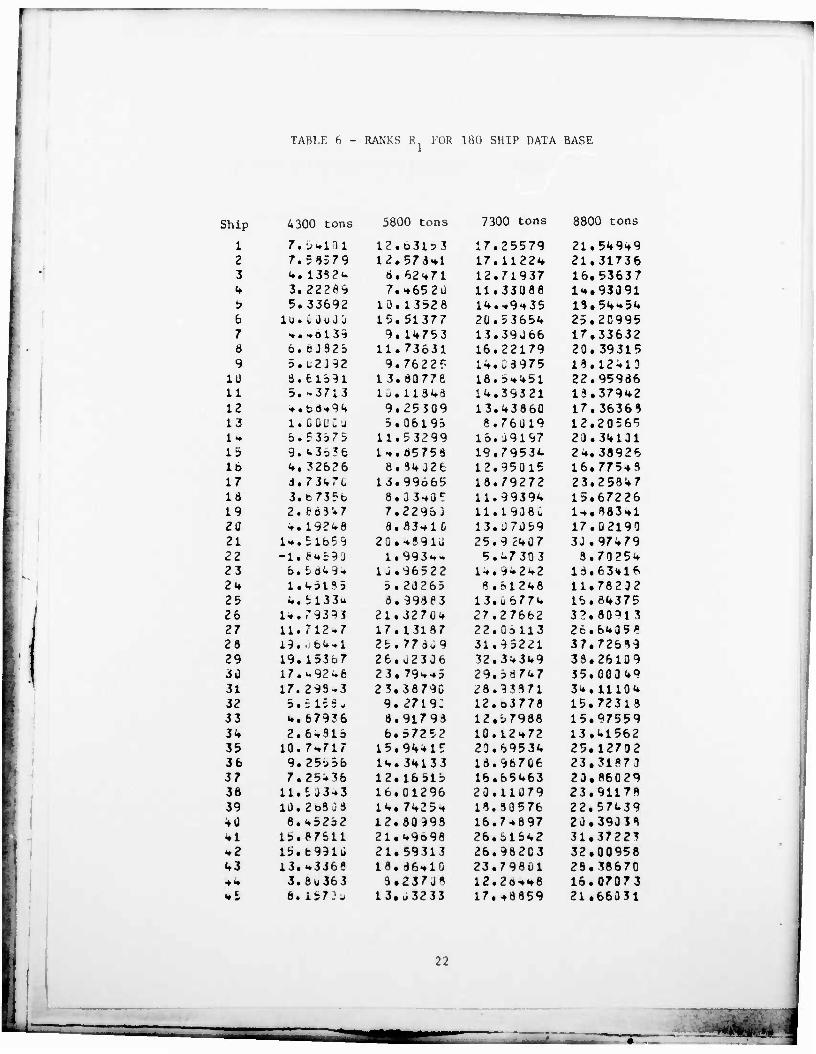
TABLE 6 - RANKS R, FOR 180 SHIP DATA BASF.
Ship
1 2 3 •» 5 6 7 a 9
1Ü
11 12 13 1- 15 lb 17 16 19 2 0 21 22 23 2* 25 26 27 28 29 30 31 32 33 3* 35 3b 37 38 39 ki *1 -•2 *3 ** 1.1
4300 tons 5800 tons
7. &moi 7.58579 *. 133?«. 3.22289 5.33692
i J.bOuJ J ••.•»0139 b.e3325 5.C2392 3.61591 5.-3713 *.b6*9* 1. 0 0 0 C d b.?3b7S 9.t3b?b *, 32626 3. 731.7c 3.fc735b 2. E 3 3 !» 7 t. 19?«.8
7300 tons 8800 tons
1*.5lb59 -1. 8*t9J
&,&ä*9* l.*5H3 *.5l33*
1*.793^3 11.712-7 19. 06**1 19.15367 I7.w92w6 17.293-3 5.5 155 - *. 67936 2.6,31b
10.7*717 9.25b3b 7.25*36
li.50343 1Ü.2o333 8. *52b2
1>.87611 l5.t991o 13. ».3368 3. 8u363 8. 1573«
12 12
a 7
ID 15
9 11
9 13 1.,
9 5
11 It
8 13
8 7 8
2Q 1
1 J 5 3
21 17 25 26 23 23
9 8 6
15 1«. 12 16 1«. 12 21 21 18
3 13
o 315 3 573*1 62*71 *652u 13528 51377 1*753 73631 7622? 60778 113*3 25 509 06195 53299 65753 3*326 99o&5 33*0C
22963 33* 10 *S91J 993*» 96522 20265 99383 3270«» 13187 773*9 u230b 79**5 38790 2719: 91793 57252 9**15 3*133 16515 01296 7*25* 30993 *9o98 59313 d6*10 237J8 o3233
17.2 17.1 12.7 11.3 1*.* 20.5 13.3 16.2 1*. C 18.5 1*.3 13.* 8.7
16. J 19.7 12.9 18.7 11.9 11.1 13. i) 25.9 5.*
1*. 9 3.5
13. 27 22. 31 32. 29. 28 12. 12.5 10.1 23.6 16.9 16.6 23.1 13. 3 16.7 26.b 26.9 23.7 12.2 17.*
5579 122* 1937 3088 9*35 365* 9J66 2179 3975 *!»5 1 9321 3860 6019 9197 953*. 5015 9272 939* 938C 7059 2*07 7303 ±2*2 12*8 677* 7662 all3 5221 *3*9 67U7 3371 3778 7988 2*72 953* 67Q6 5*63 1079 0 5 76 -.897 lb*2 82C3 98Ü1 o**8 8859
21.5*9*9 21.31736 16.53637 1*.93391 13.5**5U 25.2C995 17.3363? 20.39315 13.12*13 22.95986 13.379*2 17.36363 12.20565 23.3*131 2*.38926 16.775*3 23.258*7 15.67??6 1*.383*1 17.02190 3J.97*79 3.7025*
13.63*1* 11.78232 16.3*375 32.80913 26.6W05P 37.72539 33.26109 35.003*9 3-*. 1113«. 15.72313 15.97559 13.U1562 25.12702 23.31873 23.86029 23.91178 22.57L39 20.39333 31.37223 32.00958 23.38670 16.07073 21.66331
22
TT^
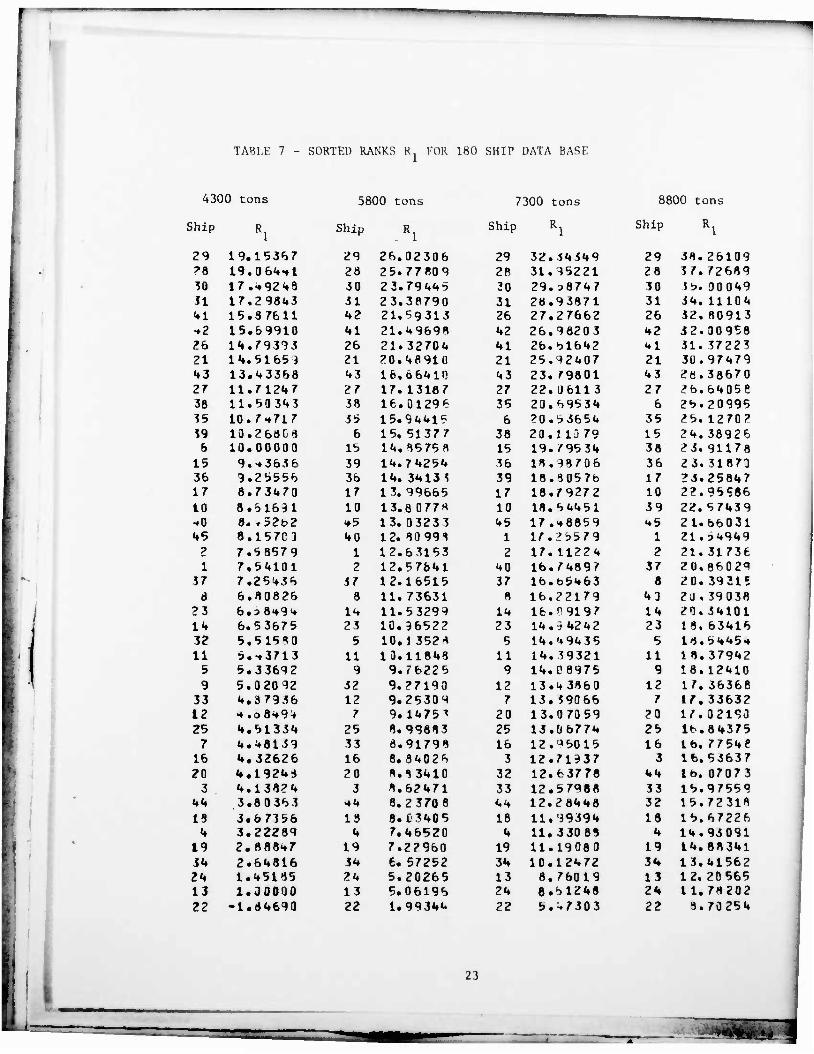
TABLE 7 - SORTED RANKS R FOR 180 SHIP DATA BASE
4300 tons
Ship
29 19.15367 ?8 19.064tl 30 17.*9218 11 17.29843
«•1 15.37611 *2 15.69910 26 l«i.79393 21 1*». 51659 43 13.'•3368 2? 11.71247 38 11.60313 35 10.7*717 39 10.26808
& 10.00000 15 9.-*3636 36 9.25556 17 8.73470 10 8.61691 «0 8. r52b2 15 8.157CJ
? 7.58579 1 7,54101
3 7 7.25t»36 8 6.80826
23 6.:>8<*9* 14 6.53675 32 5.51580 11 5.t3713
5 5.33692 9 5.02092
33 4.37936 12 •• .o 8«*94 25 «•.5133««
7 4.48139 16 «».32626 20 4.192U4
3 «•.1382«« <•*• 3.80363 19 J.67356
(* 3.22289 19 2.888*7 34 2.64816 24 1.45185 13 1.00000 22 -1.84690
5800 tons 7300 tons 8800 tons
hip Rl Ship 1 s Ship Rl
29 26. 02306 29 32, 34349 29 38. 26109 28 25. 7 7 809 28 31. 9 5221 28 37. 72689 30 23. 79 44 5 30 29. :>87W 30 3b. 30019 31 23. 38790 31 2». 93871 31 34. 11101 42 21, 59313 26 27. 27662 26 32. 80913 41 21. 49698 k2 26. 9 8203 42 32. 30958 26 21. 32704 11 26, bl642 41 31. 37223 21 20. «•8910 21 25. 92407 21 30. 97479 (•3 16. 66411] <i3 23. 79801 43 2e. 38670 27 17. 13187 27 22. 0 611 3 27 2b. 6405e 38 16. 01296 35 20. 69531 6 2b. 20995 55 15. 94415 6 ?0. 53654 35 25. 1270?
6 15. 51377 38 20. 11J 79 15 2k. 38926 15 11, 85 75 8 15 19. 79534 38 25. 91178 39 14, 74254 36 18. .98706 36 25. 31870 36 11. 34133 39 18 ,8057b 17 23. 25847 17 13. 99665 17 18. 79272 10 22. 95S86 10 13. 8 0 77« 10 18, 5 4451 39 22. 57439 *5 13. 0 323 3 15 17. ,*8859 45 21. 66031 40 12. 80998 1 17. 2 5579 1 21. ?4949
1 12. 63153 2 17. 11224 2 21. 31736 2 12. 57641 40 lb, 74897 37 20. 8602<»
57 12. 16515 37 16. b&463 8 20. 39315 8 11. 73631 8 16. 22179 kl 2J , 39038
14 11. 5 3299 14 16. P9197 14 20. 34101 23 10. 96522 23 14, i k2k2 23 18. 63416
5 10. 1 352 H 5 1«*. '4 94 35 5 14. 5445* 11 10, 11849 11 14. 39321 11 18, 37942
9 9. 76225 9 14. 08975 9 16. 12410 52 9. 27190 12 13. 43860 12 17. 36368 12 9. 25309 7 13. 39066 7 17. 3363?
7 9. 1475^ 20 13. .07059 20 17. 02193 25 8. 99883 25 13 ,0677* 26 lb, 84375 33 8. 91798 16 12 ^6015 16 lb. 77548 16 8. 8*4026 3 12. .71937 3 16. 53637 20 «. 8 3410 32 12. fc3778 44 lb. 07073
3 8. 62471 33 12. .57988 33 16. 97559 44 8. 2 370 8 44 12. 28448 32 15. 72318 19 8. 0 3405 18 11, 99394 18 16. 67226
4 7. «•6520 4 11. 33089 4 14, 93091 19 7. 22960 19 11. 19080 19 14. 88311 14 6. 57252 34 10. 12472 34 13. 41562 24 5. 20265 13 8, 76019 13 12. 20 565 13 5. 06196 24 8. bl248 24 11. 78202 22 1. 9934«* 22 6, ^7303 22 8. 70254
23
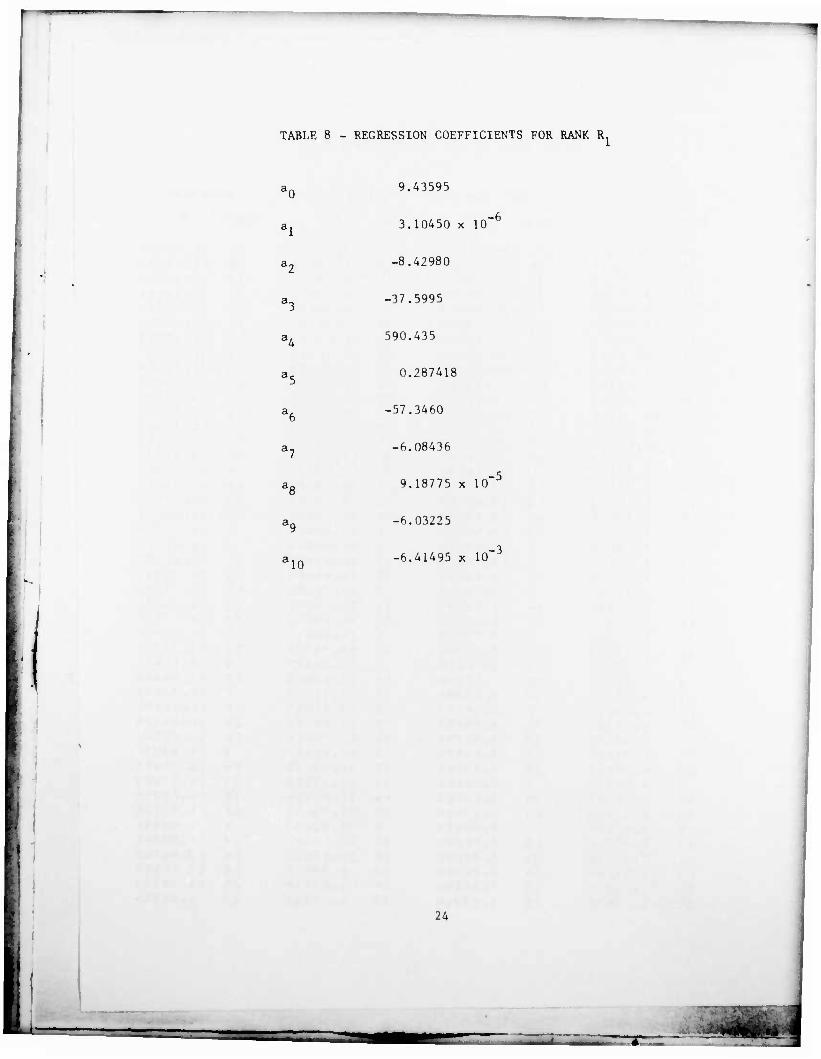
TABLE 8 - REGRESSION COEFFICIENTS FOR RANK R 1
9.43595
3.10450 x 10"
-8.42980
-37.5995
590.435
0.287418
-57.3460
'10
-6.08436
9.18775 x 10
-6.03225
-6.41495 x 10
-5
-3
I '
24
j
m
TABLE 9 - RANGES AND EFFECTS OF VARIABLES IN REGRESSION EQUATION
BMLV
CVPF
CVPA
BM 7
BL"
L
T/B
2/3
(LCB " LCF)V
(* - LCB)A
1/3
V_ BT
Maximum
.57447E+07
.82136
.69651
.52757E-01
187.25
.39201
4.6232
-9355.3
.41964E-01
406.00
Min imum
.85042E+06
.54486
.45657
.36905E-01
108.07
.19182
2.6691
-87181.
-.45002
149.00
Effect
15. 19
2.33
9.022
9.360
22.76
11.48
11 .89
7.150
2.968
1.649
25
r^^ ....
TABLE 10 - RANGES OF MAJOR COEFFICIENTS NOT IN REGRESSION EQUATION
2/3
V Vv'
^A
\A/AW
B
B/L
BML
BML72
BV2
73
BLJ
BM^V
BT
L2
B/T
1/3
Max imum
3133.9
.2 6880E+08
7.4791
1937.2
.62729
.16616E+08
1311.3
.44826
.11248E+0D
3.1295
25.850
.18621
669.7 5
.49274E+11
452.51
32.719
.67114E-02
5.2133
Minimum
1166.3
.48883F.+07
4.4867
693.83
.55174
.2 9080E+07
472.49
.37271
.19803E+07
1.8176
12.686
.89295-01
202.91
.35643E+10
154.68
1 2 . 58 5
.24631E-02
2.5509
26

—————
TABLE 10 (Continued)
B/V
CB
CBA
CBF
""PA
CPA7
'PF
C 7 LPF
VI
CVP
r SlA
CWF
L/B
L/T
1/3
1/3 L/V
L IT C B BM, V
Max imum
1.2628
.55266
.60320
.53763
.68714
.75355
6463.4
.66037
5664.2
1692.9
.74431
.82675
.99277
.69802
11.199
36.000
9.1473
86.341
Minimum
.78682
.39786
.45327
.33129
.57263
.60989
2556.2
.52162
2186.2
518.39
.50278
.69857
.83004
.55957
5.3702
22.000
6.7027
34.231
••
27
' —.-:
, LCB
LCBV
1
1 LCFV
1 /J/3 LCF/v
l. LCB " LCF
1 <LCB " VV
1 -. j T - LCB
1
T LCF
B i
• (T - LCB) '
,
(T - g' f T
I r/L
i TCB
1/3
TABLE 10 (Continued)
Maximum
7454.7
97.368
.83516E+06
4.7566
104.43
.89572E+06
5.1016
-2.2321
-.13844
.85901
-4.7973
7368.0
-20106.
6.5317
.45107E-01
4.5614
Minimum
1171.8
56.423
.23648E+06
3.4996
60.466
.25343E+06
3.7503
-10.164
-.49654
-9.2120
-16.081
-79014.
-.13793E+06
3.5788
.27578E-01
2.1562
28
"^
1
TABLE 10 (Continued)
TC„ v2
R) TV B
T/V
V
vl/3
„2/3
1/3
V"
7.
V./V A
VF/7
Maximum
20.806
3362.4
.31908
8577.3
20.470
419.02
.73571E+08
.63104E+12
5031.0
.58655
4228.5
.49298
Minimum
4.6494
803.94
.22197
4191.2
16.123
259.95
.17566E+08
.73623E+11
2125.2
.50706
1732.9
.41346
29
_.
DTNSRDC ISSUES THREE TYPES OF REPORTS
t. DTNSRDC REPORTS. A FORMAL SERIES. CONTAIN INFORMATION OF PERMANENT TECH NICAL VALUE. THEY CARRY A CONSECUTIVE NUMERICAL IDENTIFICATION REGARDLESS OF THEIR CLASSIFICATION OR THE ORIGINATING DEPARTMENT.
2. DEPARTMENTAL REPORTS, A SEMIFORMAL SERIES. CONTAIN INFORMATION OF A PRELIM- INARY. TEMPORARY, OR PROPRIETARY NATURE OR OF LIMITED INTEREST OR SIGNIFICANCE. THEY CARRY A DEPARTMENTAL ALPHANUMERICAL IDENTIFICATION.
3. TECHNICAL MEMORANDA. AN INFORMAL SERIES, CONTAIN TECHNICAL DOCUMENTATION OF LIMITED USE AND INTEREST THEY ARE PRIMARILY WORKING PAPERS INTENDED FOR IN TERNAL USE. THEY CARRY AN IDENTIFYING NUMBER WHICH INDICATES THEIR TYPE AND THE NUMERICAL CODE OF THE ORIGINATING DEPARTMENT. ANY DISTRIBUTION OUTSIDE DTNSRDC MUST BE APPROVED BY THE HEAD OF THE ORIGINATING DEPARTMENT ON A CASE-BY-CASE BASIS.