estimating the range shift and harvesting intensity of
TRANSCRIPT

University of Missouri, St. LouisIRL @ UMSL
Theses UMSL Graduate Works
11-27-2017
Estimating the range shift and harvesting intensityof Junipers in Bhutan (Eastern Himalaya)Rinchen NamgayUniversity of Misosuri, St Louis, [email protected]
Follow this and additional works at: https://irl.umsl.edu/thesis
Part of the Forest Management Commons
This Thesis is brought to you for free and open access by the UMSL Graduate Works at IRL @ UMSL. It has been accepted for inclusion in Theses byan authorized administrator of IRL @ UMSL. For more information, please contact [email protected].
Recommended CitationNamgay, Rinchen, "Estimating the range shift and harvesting intensity of Junipers in Bhutan (Eastern Himalaya)" (2017). Theses. 315.https://irl.umsl.edu/thesis/315

Estimating the Range Shift and Harvesting Intensity of Junipers in Bhutan (Eastern Himalaya)
Rinchen Namgay
B.Sc. Forestry
College of Natural Resources, Royal University of Bhutan, 2013
A thesis submitted to the Graduate School of the University of Missouri - St. Louis
in partial fulfillment of the requirements for the degree of
Master of Science in Biology (Ecology, Evolution and Systematics)
December 2017
Advisory Committee
Robert J. Marquis, Ph.D. (Chairperson)
Peter F. Stevens, Ph.D.
Robbie Hart, Ph.D.

i
Table of Contents
List of Figures ................................................................................................................................... ii
List of Tables ................................................................................................................................... iii
ABSTRACT ......................................................................................................................................... 1
ACKNOWLEDGMENTS ...................................................................................................................... 2
CHAPTER ONE: LITERATURE REVIEW ............................................................................................... 3
Abstract ............................................................................................................................................ 3
1. Climate change and range shift ............................................................................................... 4
1.1. Introduction ..................................................................................................................... 4
1.2. Global climate change scenario ....................................................................................... 5
1.3. Climate change and biodiversity ...................................................................................... 5
1.4. Climate change and range shift ....................................................................................... 6
1.5. Recent studies of climate change-induced range shift in trees ....................................... 8
2. Junipers-the study plant species ............................................................................................ 10
2.1. Introduction ................................................................................................................... 10
2.2. Phylogeny and Evolution................................................................................................ 10
2.3. Ecology ........................................................................................................................... 13
2.4. Uses of Junipers ............................................................................................................. 13
2.5. Junipers in Bhutan.......................................................................................................... 13
3. Harvesting intensity of Juniper in Bhutan .............................................................................. 14
4. References ............................................................................................................................. 16
CHAPTER TWO: ESTIMATING CURRENT DISTRIBUTION AND HARVESTING INTENSITY OF
JUNIPERUS IN BHUTAN .................................................................................................................. 20
Abstract .......................................................................................................................................... 20
1. Introduction ........................................................................................................................... 21
2. Methodology .......................................................................................................................... 23
2.1. Study area ...................................................................................................................... 23
2.2. Data Collection ............................................................................................................... 25
3. Analysis .................................................................................................................................. 27
4. Results .................................................................................................................................... 27
4.1. General patterns ............................................................................................................ 27
4.2. Range shift of J. recurva ................................................................................................. 30
4.3. Range shift of J. squamata ............................................................................................. 31

ii
4.4. Harvesting intensity of Junipers ..................................................................................... 31
5. Discussion............................................................................................................................... 33
6. Conclusion and recommendation .......................................................................................... 34
7. References ............................................................................................................................. 36
List of Figures
Figure 1: “The global average annual temperatures since 1880-2016 compared to the long-term
average (1901-2000)”. Source: National Centers for Environmental Information, 2017. .............. 5
Figure 2: Types of leaves in Juniperus spp. Adapted from (https://gobotany.newenglandwild.org)
....................................................................................................................................................... 11
Figure 3: Bayesian phylogeny tree for Juniperus. Adapted from Adams and Schwarzbach.
(2013). ............................................................................................................................................ 12
Figure 4: Junipers harvested for construction purposes ................................................................. 14
Figure 5: Annual deviation from mean annual temperature and precipitation 1901-2015 in
Bhutan. (World Bank, 2017) .......................................................................................................... 21
Figure 6: Map of the study area (source: http://www.asia-atlas.com/bhutan.htm) ........................ 24
Figure 7: Study area in west ........................................................................................................... 25
Figure 8: Study area in east ............................................................................................................ 25
Figure 9: Lay out of sample plots and the transect in the center study area .................................. 26
Figure 10: Juniper species in the study area (Top-J. squamata, middle- J. recurva and bottom-J.
indica) ............................................................................................................................................ 28
Figure 11: Seedlings of junipers (right- J. squamata and left- J. recurva) ..................................... 28
Figure 12: Standard error line graph showing the current distribution of Junipers with elevation.
A. J. recurva. B. J. squamata. Orange lines show seedlings, blue lines the juveniles and the green
lines the adults. J. recurva was not found in the West region. ....................................................... 29
Figure 13: Median elevation at which a given proportion of individuals was encountered
(triangle: 10th percentile; square: 50th percentile; circle: 90th percentile, based on the lower limit of
the distribution for each life stage). Comparisons were made across life stages but within the
specified distribution cutoff. Medians not sharing the same letter are significantly different at P <
0.05 (Wilcoxon signed rank test). .................................................................................................. 30
Figure 14: Scatter plot for J. recurva showing the relationship between the percentage of total
harvested trees (y-axis) with the distance of road to sampling point (x-axis)................................ 32
Figure 15: Scatter plot for J. recurva showing the relationship between the percentage of total
basal area harvested (y-axis) with distance of road to sampling points (x-axis)............................ 32
Figure 16: Scatter plot for J. squamata showing the relationship between the percentage of total
harvested trees (y-axis) with the distance of road to sampling point (x-axis)................................ 33
Figure 17: Scatter plot for J. squamata showing the relationship between the percentage of total
basal area harvested (y-axis) with distance of road to sampling points (x-axis)............................ 33

iii
List of Tables
Table 1. Global climate-related range shift studies segregated by ecosystem, kingdom, and range
shift parameters. (LON=Longitudinal, LAT=latitudinal, E/D=Elevational/Depth, LE=Leading
edge, TE=Trailing edge, O=Optimum (central), A=Abundance (uniform increased throughout the
range). Source: Lenoir & Svenning, (2015) ..................................................................................... 8
Table 2: Wilcoxon signed rank test results for J. recurva .............................................................. 30
Table 3: Wilcoxon signed rank test results for J. squamata ........................................................... 31
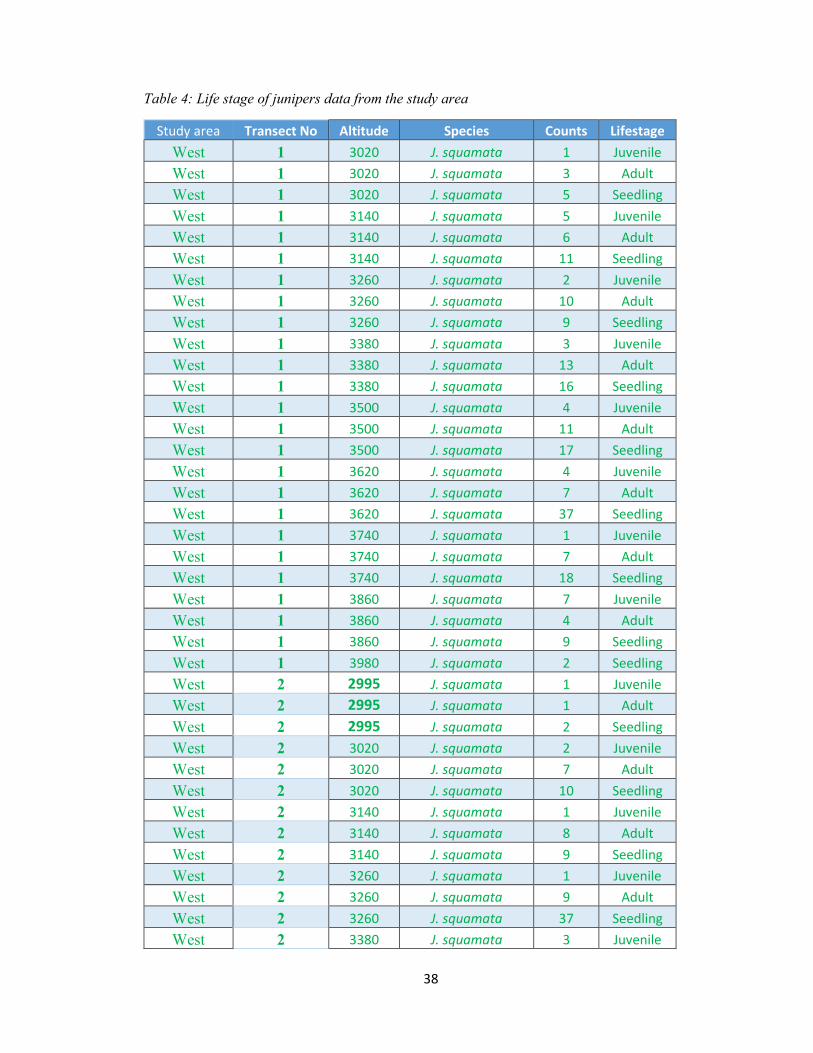
Table 4: Life stage of junipers data from the study area ................................................................ 38
Table 5: Wilcoxon signed rank test ............................................................................................... 43
Table 6: Spearman rho correlation test for harvesting intensity .................................................... 43
Table 7: Percentile calculation data ............................................................................................... 44
Table 8: Percentage of harvested and basal area of junipers and road distance to sample points . 45
1
ABSTRACT
The authors of more than 97% of the scientific publications on climate change
agree that global temperature has increased in the last six decades and is
caused by human beings via emission of greenhouse gases in the atmosphere.
This phenomenon has altered natural ecosystem functions, causing many
species to shift to a more suitable habitat. Throughout the world, because of
recent climate warming, many forms of range shift associated with climate
warming have occurred. While animals can move as warming happens,
plants, being stationary organisms, cannot move, so the difference in the
distribution of different plant life stages is an indication that plants are
responding to climate change effects. The genus Juniperus is the most diverse
genus in the Cupressaceae, the cypress family. Species of Juniperus are found
in many varied climatic conditions throughout the world. Junipers in Bhutan
are high altitude plant species and extensively harvested for incense
manufacturing and construction purposes. The current study analyzed the
elevational distribution of J. recurva and J. squamata in Bhutan along six
transects, two in each of the eastern, central and western portions of Bhutan.
The range of J. squamata is found to be shifting at the leading edge (upper
elevation). The distribution of seedlings is on overage 83 m higher than that
of adults at these high elevations. No differences were found in distributions
at lower elevations or in the middle. J. recurva, in contrast, does not show
comparable evidence of a range shift. The harvesting of J. recurva was found
to be greater than that for J. squamata, and the intensity of harvest is
positively linked to the proximity of the nearest road from sampling points.
Thus, humans appear to be having an indirect effect on the distribution of J.
squamata, via changes in climate, and a direct effect on the abundance of J.
recurva, via harvesting of adults.
KEYWORDS: Global warming, range shift, J. recurva, J. squamata, harvesting intensity

2
ACKNOWLEDGMENTS
At the very outset, I would like to thank my advisor Dr. Robert J. Marquis for his
constant supports, advice and feedback. Without his support, this research would not have
come this far. I will forever remain grateful for his supervision. I owe my thanks to all
the students in Dr. Marquis’ lab for their feedback, suggestions and comments. Thank you
all so much!
I would also like to thank Dr. Peter Steven and Dr. Robbie Hart for being on my
thesis committee, and for all the comments, suggestion and support till date. I remain
always grateful for the support.
I am extremely grateful for the logistics and financial support of Ugyen Wangchuck
Institute for Conservation and Environmental Research, Bhutan and Whitney R. Harris
World Ecology Center. This study would not have been materialized without these
organizations support. Thank you very much!
I am deeply grateful to Sangay Wangchuk, Kinga Thinley, Sangay and Tshewang
Dorji for all your supporting and assisting me in the field works in Bhutan. Kadren-chey-
la! (Thank you in my language).
I will always remain grateful to my family (parents, wife, daughter and son) for
their endless encouragement, support and humor at every stage of this thesis. They are the
pillars of my happiness and successes in my life. Many, many thanks to you all.
Lastly, to all the people living and dead, beings and non-beings associated in some
way or the other with my thesis. If I have forgotten to name anyone, I offer my sincerest
apologies, and my deepest gratitude and thanks.

3
CHAPTER ONE: LITERATURE REVIEW
Abstract
The world is experiencing an increase in both land and ocean surface temperature
caused by human beings via emission of greenhouse gases to the atmosphere.
This phenomenon has caused many species to shift in their distribution to areas
more favorable in climate. This range shift can be multi-dimensional in direction:
toward the poles or equator (latitudinal), higher or lower elevation (altitudinal),
and east or west (longitudinal). Most commonly, range shifts are detected at the
leading edge of the range or the trailing edge of the range of the organism, but
not east or west.
Juniper plants (Juniperus) are one of the most diverse group in the conifers, and
are found in various climatic conditions throughout the world. The junipers found
in Bhutan are high altitude species and some species of junipers in Bhutan are
very local e.g., J. recurva, J. rushforthinia and J. pseudosabina, while J.
squamata is widely distributed. Junipers in Bhutan have multiple uses, and thus
are under serious threat from unregulated harvesting. Although the plant is
protected under Forest and Nature Conservation Rule of Bhutan-2006 (FANCR),
the harvesting is rampant and unregulated in the wild. As elsewhere, population
growth in human and increasing use of resources is the biggest threat to organism
survival. Thus, the fate of junipers in Bhutan looks ambiguous, unless due
importance is given in understanding the factors affecting the harvesting
intensity.
Key word: climate change, range shift, junipers, Bhutan, harvesting intensity

4
1. Climate change and range shift
1.1. Introduction
Four leading global scientific institutes (the NOAA National Climatic Data Center,
the NASA Goddard Institute for Space Studies, the Japanese Meteorological Agency, and
the Met Office Hadley Centre/Climatic Research Unit) have all agreed that the average
global temperature in the last six decades has increased and is caused by human activities
( Cook et al., 2016 & Buis, 2017) figure 1. In addition, the global organization responsible
for the study of climate change, the Intergovernmental Panel on Climate Change (IPPC),
has reported that climate change is real and is occurring across the globe (IPCC, 2014b).
Multiple lines of evidence support these claims, including detailed observations of
variability and changes in temperature of the land surface, the atmosphere, the ocean and
the cryosphere. The last decade (2001 to 2010) has been the warmest of all decades
(Johnson, 2014) as seen in figure 1. The authors of over 90% of all peer-reviewed science
journal articles who have discussed the causes of climate change agree that current climate
change is caused by human activities (Cook et al., 2016).
At the current rate of global warming, Urban 2015, predicts that one and six species
will go extinct by the end of this century as a result of global climate change. There is much
evidence that plant and animal range are shifting towards more suitable habitats, both
altitudinally and latitudinally. While animals can move in response to climate warming,
plants are stationary organisms. Phenotypic plasticity in plants may be more important than
in animals as a response to climate change. Nicotra et al. (2010) reviewed the likelihood
that plants might express plasticity in the face of increases in CO2 and temperature.
The study of the effects of climate change on plant distribution and range shifts
have focused on analyzing differences in the distribution of different life stages,
particularly seedlings versus adults, across time and space. These studies generally assume
that seedling distribution represents the current climate, juvenile distribution represents the
climate of the most recent past, and adult distribution represents the past climate (Malis et
al. 2016). Any differences in the distribution among life stages represent the effects of
climate change.

5
1.2. Global climate change scenario
Current climate change is primarily caused by global warming, which in turn is
caused by increased greenhouse gas (GHG) concentrations in the atmosphere. GHGs
include carbon dioxide, water vapor, ozone, nitrous oxide and methane that are emitted by
human activities like farming, burning fossil fuels, production of industrial wastes, and
changing land use, particularly from increased timber harvest and logging (IPCC, 2014b).
Nitrous oxide (N2O), methane (CH4), and carbon dioxide (CO2) constitute a major portion
of GHG concentration in the atmosphere that is causing the warming of both land and
ocean surface temperature (IPCC, 2014a). The consequences are diminishing snow cover
and ice volumes, rising sea levels, destruction of coral reefs, and the shift of suitable
habitats distributions for plants and animals on the Earth.
The IPCC 2014 fifth assessment report projected that there will be an increase in
global temperatures between 1.4°C and 5.8°C by the end of 2100 at the current rate of
global warming. Plotting the earth’s temperature for both ocean and land surface (Figure
1) shows a warming trend of 0.07°C per decade between 1850 and 2016, compared to
average means for the period 1901 - 2000. The increase is greater in Asia at + 0.13°C per
decade (National Centers For Environmental Information 2017).
Figure 1: “The global average annual temperatures since 1880-2016 compared to the long-
term average (1901-2000)”. Source: National Centers for Environmental Information, 2017.
1.3. Climate change and biodiversity
The Biodiversity and Climate Change (2007) has published a report to commemorate the
international day for biological diversity, which explicitly mentioned the impacts of

6
climate change on biodiversity as a major concern facing the Earth now. The Millenium
Ecosystem Assessment (2007) also stated that nearly 60% of ecosystems have been
changed in the last 50 years so rapidly due to developmental activities taking place around
the world, thereby increasing the atmospheric concentration of greenhouse gases. Of
course, global biodiversity has been affected by climate change and development since the
beginning of life, but the current rate of climate change boosted by human-induced
activities is happening so fast that organisms are being challenged to adapt to the changed
conditions where they grow now or shift their ranges to the places where environmental
conditions are like those they have previously experienced.
1.4. Climate change and range shift
Grace et al. (2002) listed increasing carbon dioxide concentrations, increasing
temperature, and deposition of nitrogen as the main atmospheric factors of climate change
to which plants respond. Lenoir et al. (2008) and Solr (2013) stated that a small
fluctuations in such variables alter an organism’s range more than any changes in other set
of factors combined. Other factors (secondary factors) which are less studied, and therefore
less well-understood, like seed dispersal, soil type, aspect, fire, and ontogeny, are likely
important and probably contribute to climate change effects and range shifts of organisms.
Climate change directly affects an individual plant’s growth, alters populations and
affects ecosystem structure and function (IPCC, 2014a). The joint action of many climate
change effects will eventually cause a shift in the geographic and ecological ranges of
plants. The shift could be toward higher or lower elevations (altitudinal), towards the pole
or equator (latitudinal) or east or west (longitudinal). Woodall et al. (2008), Bell et al.
(2014), and Monleon & Lintz (2015) have found that some plant species in the United
States are currently moving latitudinally toward the poles at rates nearing 100 km/century.
These studies were confirmed through analysis of mean changes in distribution of plant
life stages along latitudinal gradients. A meta-analysis of latitudinal and elevational
changes in plant distribution in Europe and North America has also found that both plants
and animals are moving to higher elevations at a median rate of 11 meters/decade and to
higher latitudes at a median rate of 16.9 kilometers/decade as a consequence of global
climate change (Chen et al. 2011).

7
A plant range shift can be defined as a distributional change in one or more life
stages (seedling, juvenile and adult) across latitudes, longitudes or elevations over time,
aided by biotic and abiotic factors, and eventually leading to a change in the distribution
of the entire species. The effect of climate change is most likely to be manifested first at
the margins of species’ ranges because they are very sensitive to changing climatic
conditions (Cavender-Bares & Bazzaz 2000). As climate warms, it will drive seedling
recruitment to a previously colder location when compared to the distribution of adult trees
which represent past climates. This method of comparing the distribution of plant life
stages across one or more censuses has been used by many researchers to document
responses of plants to climate change (Woodall et al. 2008, Lenoir et al. 2009, Telwala et
al. 2013, Bell et al. 2014, Monleon & Lintz 2015).
A literature review as of April 2014 by Lenoir & Svenning (2015) found 212 studies
related to climate and range shift. They reported a range shift in at least one of the seven
parameters that they studied, covering the period from 1885 onward (Table 1). Of the 212
studies, 123 were conducted on terrestrial plants and animals. Seventy-two percent (N =
89) of these terrestrial studies focused on animal range shift, while 28% (N = 34) were on
plants. In marine ecosystems, 91% (N = 81) of the studies focused on animals, and 9%
(N=8) on plants (Lenoir & Svenning 2015).
As shown in Table 1, most studies of terrestrial plants reported an elevational range
shift (N = 24 out of 34 studies), and next most frequent (N = 19) was a range shift at the
leading edge, and just one study showeda longitudinal range shift. Overall, studies
conducted so far have been very limited geographically: 90% (N = 140 total) of all studies,
aquatic and territorial, have focused on Europe and North America (Lenoir & Svenning
2015).

8
1.5. Recent studies of climate change-induced range shift in trees
A study of elevational range shift by Telwala et al. (2013) for 124 endemic alpine
(4000-5500 m) plant species (that include Juniuperus recurva and J. indica, the focal
species of the current study) in Sikkim, India, showed that 87% of plant species have
moved to a higher elevation. Historical (1849-1850) and current (2007-2010) data on
climate and plant ranges, specifically those of adults, were used in a correlative analysis
between the two time periods. Species migration in their study was attributed to recent
climate warming. The average winter temperature in the last two centuries in the study area
had increased by 0.76 (± 0. 25)°C in the study area. The range of J. indica range changed
by -178 m at the lower and +28 m at the higher edges, and that of J. recurva moved by +5
m at lower and +77 m at the higher edges.
Lenoir et al. (2009) studied the 17 most common tree taxa found in the French
mountain ranges (“the northern Pyrenees, the Vosges, the western Alps, the western Jura,
the Corsican and the Massif central ranges”) using a vegetation data bank for the period
1986-2006. The study area includes species growing in northern temperate to southern
Mediterranean forest types and at elevationsfrom lowland to sub-alpine (50 – 2250 masl).
Using the frequency distribution of each life stage along the elevational gradient, the
differences between the life stages of plant were calculated at the 1st, 5th and 9th deciles.
They found that for 13 of the 17 species, the mean occurrence of seedlings at the 1st decile
Table 1. Global climate-related range shift studies segregated by ecosystem, kingdom, and range
shift parameters. (LON=Longitudinal, LAT=latitudinal, E/D=Elevational/Depth, LE=Leading
edge, TE=Trailing edge, O=Optimum (central), A=Abundance (uniform increased throughout
the range). Source: Lenoir & Svenning, (2015)
Plants Animals Plants Animal
LON 1 8 2 9
LAT 3 44 5 43
E/D 24 26 1 6
LE 19 57 2 35
TE 11 41 4 25
O 12 27 0 16
A 15 44 5 64
TOTAL 34 89 81 8
Terrestrial Marine

9
was 29 meters higher compared with that of adults along the same elevation gradient. At
the 5th decile (optimum) the occurrence of seedlings was 69 m higher than that of adults,
and at the 9th decile, it was not significant. They attributed this phenomenon to climate
change as a primary driver coupled with secondary drivers like land abandonment, hunting
of vertebrate grazers, nitrogen deposition and ontogenetic shifts (changes in the habitat that
an organism needs as it develops and grows).
Bell et al. (2014) used data from forest inventories to quantify whether the climate
envelope (climatic conditions suitable for growth) of six conifer tree species at two life
stages (seedling and adult) showed a range shift due to recent global warming and if it
differed between montane (warm climate) and subalpine (cold climate) forest types in the
western United States. The species selected for the study were the most common and
widely distributed tree species in western United States. They found that the distribution
of life stages differed significantly between montane and subalpine species, and
temperature and precipitation as climate envelope affects this variation between the species
and the location. In a similar study, Monleon and Lintz (2015) examined the mean
temperature ranges for seedlings and adults of 46 tree species in the three U.S. states of
Washington, Oregon and California. They found that the mean temperature in areas
inhabited by seedlings was 0.12°C colder than that of adults, suggesting that seedlings
colonize colder areas than adults are currently living in. Thus, they concluded that seedlings
have moved to significantly higher and colder areas relative to the adult life stage.
Gehrig-Fasel et al. (2007) found a significant increase in forest coverage at the tree
line in the Swiss Alps, using a data set “GEOSTAT”. They compared the forest coverage
using GIS data between the periods (1979-1985) and (1992-1997). They found that forest
cover has increased with elevation at 3% at the lowest elevation to 86% at the tree line and
beyond. The increase in forest cover at tree-line was attributed to the effect of land
abandonment, and the increases of forest coverage beyond tree line was attributed to recent
climate warming in Swiss Alps of 2.5°C above the mean temperature since 1980.

10
2. Junipers-the study plant species
2.1. Introduction
Juniperus (juniper) is the largest and most diverse genus in the Cupressaceae
(Adams, 2014). The genus is concentrated in the Northern Hemisphere, ranging from the
deserts of Mexico, north and east to deciduous and boreal forests, and from the
Mediterranean to east-central Asia (Adams, 2014). Juniperus species are found from sea
level to above the tree line, and range in growth form from a few centimeter-high shrubs
to 20-25 m tall trees. Junipers, like most conifers, are evergreens. The species can be either
monoecious or dioecious. The leaves are awl-shaped or scale-like. Juniperus has a fleshy
female cone, the cone itself called a “berry”. The berries vary in color from red-brown or
orange to blue-black depending on the species, and have 1 to 13 hard-shelled seeds between
4-27 mm long (Adams, 2014). These berries are consumed by birds and mammals, which
help in long-distance dispersal.
2.2. Phylogeny and Evolution
The genus Juniperus has 75 species in 3 sections: Caryocedrus, Juniperus and
Sabina (Adams, 2014). These sections are characterized by the morphology of seeds and
cones, leaves, and their distribution. Section Caryocedrus has blue, woody three-seeded
cones. This section has one species, J. drupacea, growing in the Mediterranean region
(Adams, 2014). Section Juniperus includes 14 species growing in the Eastern Hemisphere.
These species have blue or red cones with three seeds (Adams, 2014). Finally, section
Sabina has 60 species equally distributed in both the Eastern and Western Hemispheres.
They have black-blue, red-copper, rose and brown cones that have 1-13 seeds (Adams,
2014).
Leaf structure differs among the sections. The sections Caryocedrus and Juniperus
have acicular leaves (awl or needle-like) as shown in Figures 2A and 2B, while species of
the section Sabina have decurrent and scale-like leaves (Figure 2C). Section Sabina is
further divided into three clades based on morphological characteristics and supported by
molecular analyses (Mao et al., 2010). These include: Clade 1. Serrate leaf margin, mostly
in Northern America (Adams & Schwarzbach, 2013), Clade 2. Entire leaf margin with
turbinate seed cones, single seed, mostly in Eastern Hemisphere (Adams & Schwarzbach,

11
2013), and Clade 3. Entire leaf margin with multiple seeds, found in both Western and
Eastern Hemispheres (Adams & Schwarzbach, 2013).
Figure 2: Types of leaves in Juniperus spp. Adapted from (https://gobotany.newenglandwild.org)
A phylogeny of the Juniperus was generated using nuclear ribosomal DNA and
chloroplast DNA (Adams & Morris, 2008) and is shown in Figure 3. The colored boxes
stand for the sections and the clades. The blue rectangular boxes are the Caryocedrus and
Juniperus sections, and the green for clade 1, red for clade 2 and purple for clade 3 under
section Sabina.
A: J. drupacea,
acicular leaves, 1-3
seed cones
B: J. squamata, acicular
leaves
C: J. sabina, deccurent &
scale leaves, seed 1-
many

12
Figure 3: Bayesian phylogeny tree for Juniperus. Adapted from Adams and Schwarzbach. (2013).
* Smooth leaves =
Entire leaves
*gp = group

13
2.3. Ecology
Junipers are one of the most diverse genera of conifers and are found at sea level,
e.g., Juniperus lutchuensis, and at and above the tree line, e.g., J. monticola. Most species
prefer to grow on limestone, e.g., J. thurifera. However, there are species that grow in sand
dunes, e.g., J. macrocarpa, sphagnum moss bogs, e.g., J. communis, glaciated granites,
e.g., J. communis, or at the desert edge, e.g., J. californica (Adams, 2014).
Juniperus species are pioneer and opportunistic colonizers. A key element in the
evolution of Juniperus is its fleshy seed cones, which are eaten by birds and mammals that
may help in long distance dispersal (Farjon, 2005).
2.4. Uses of Junipers
The major commercial products from Juniperus are cedar wood oil and gin. The
oils are commonly applied to strengthen gums, improve hair growth, reduce skin irritation,
relieve spasms, cure toothaches and fungal infections, and as anti-inflammatory agents
(Karchesy, 1998). The berries of junipers, especially of J. communis, are used to brew gin.
Junipers, especially in Asian Buddhist countries, are used in the manufacture of incense
sticks. In Bhutan, juniper is used to make furniture and construct Dzong (fortresses) due to
its durability and resistance to fungal and insect attack.
2.5. Junipers in Bhutan
Six species of Juniperus are recorded from Bhutan all in section sabina: J. recurva,
J. squamata, J. pseudosabina, J. communis, J. rushforthinia and J. indica. They are found
from 2900 masl to 4800 masl (Grierson& Long, 1983). Of the six species, J. communis
records in Bhutan seem to be unlikely, given the known geographic distribution of this
juniper in the western Himalayas(Adams,2014).
Juniperus recurva is a monoecious or rarely dioecious shrub or tree and can grow
up to 20 m tall. It has decurrent drooping needle-like leaves usually 5-7 mm long appressed
to the stem in whorls of three. Seed cones are bluish-black with a solitary hard seed. This
species grows in open spaces as a pioneer and can be found mixed with other conifers
(Adams, 2014). Its elevational range is 2900 to 4200 masl (Grierson & Long, 1983).

14
According to Adams (2014), its distribution range includes Afghanistan, the Himalayas
(Nepal and Bhutan), China and Tibet.
Juniperus squamata is a dioecious and occasionally monoecious shrub or tree,
growing up to 12 m tall. It has both needle-like and scale-like decurrent spreading leaves
6-7 mm long in whorls of three. The seed cone is black or bluish black with a solitary seed
(Adams, 2014). It grows mixed with other alpine conifer species and has an elevational
range of 3200 to 4700 masl (Grierson& Long, 1983).
Juniperus indica var. caesptosa is a dioecious or monoecious shrub, rarely a small
tree, from 0.5 to 1 m tall height. Leaves are scale-like, and closely appressed to the stem,
3-8 mm long and borne in whorls of three. It grows near tree-line and in rocky habitats
from 3600 to 4800 masl (Adams, 2014).
3. Harvesting intensity of Juniper in Bhutan
Juniperus plays an important social, cultural and religious role in Bhutan. The
entire tree, including the leaves, is used for the manufacturing of incense sticks. The leaves
and branches are burnt on
hilltops as a smoke offering to
the local deities to bless
sentient beings (Buddhist
concept of all living beings on
the earth that are not
enlightened) so that they
achieve happiness, good luck
and accumulate merit. Juniper
wood is considered good
because of its aromatic
properties, thus preventing it
from insect and fungal attacks, and it is used for making altars, expensive furniture and
Dzongs (Buddhist temples and administrative buildings). Juniper wood is also required as
fuel wood to burn the corpse during Bhutanese funerals.
Figure 4: Junipers harvested for construction purposes

15
As juniper, especially Juniperus recurva and J. squamata, have many uses in
Bhutan, they are seriously under threat from unregulated over-harvesting across the
country. This overharvesting is occurring despite the fact that junipers are classified as
class A plant species under the Forest and Nature Conservation Rules of Bhutan (2006),
which in theory restricts their harvest. The IUCN red list of threatened species has listed J.
recurva as a species of least concern in its home range (IUCN, 2017), but in Bhutan, over-
harvesting of the species is of major concern. (Figure 4). The Department of Forest and
Parks Services is the sole authority responsible for managing forestry resources in Bhutan,
but at present, the department has no record of how many junipers are harvested annually
in the country nor does the Department have specific guidelines for the sustainable
management of juniper forest. The most important information needed to ensure that the
current stock of junipers in Bhutan are managed sustainably would be to know the
immediate threat areas and the factors affecting the harvesting intensity.

16
4. References
Adams, R. P. (2014). Junipers of the World: the genus Juniperus (4th ed.). Texas:
Trafford Publishing Co., Bloomington, IN.
Adams, R. P., & Morris, J. A. (2008). Taxonomic affinity of Rushforth’s Bhutan Juniper
and Juniperus indica using SNPs from nrDNA and cp trnC-trnD, terpenoids and
RAPD data. Phytologia, 90(August), 233–245.
Adams, R. P., & Schwarzbach, A. E. (2013). Phylogeny of Juniperus using nrDNA and
four cpDNA regions. Phytologia, 95(May), 179–187.
Bell, D. M., Bradford, J. B., & Lauenroth, W. K. (2014). Early indicators of change:
Divergent climate envelopes between tree life stages imply range shifts in the
western United States. Global Ecology and Biogeography, 23(2), 168–180.
Biodiversity and Climate Change. (2007). Retrieved July 3, 2017, from
https://www.cbd.int/doc/bioday/2007/ibd-2007-booklet-01-en.pdf
Buis, A. (2017). Climate Change: Vital Signs of the Planet: Climate change may bring
big ecosystem changes. Retrieved July 6, 2017, from
https://climate.nasa.gov/news/645/climate-change-may-bring-big-ecosystem-
changes
Cavender-Bares, J., & Bazzaz, F. A. (2000). Changes in drought response strategies with
ontogeny in Quercus rubra: implications for scaling from seedlings to mature
trees. Oecologia, 124(1), 8–18.
Chen, I.-C., Hill, J. K., Ohlemuller, R., Roy, D. B., & Thomas, C. D. (2011). Rapid range
shifts of species associated with high levels of climate warming. Science,
333(6045), 1024–1026.
Cook, J., Oreskes, N., Doran, P. T., Anderegg, W. R. L., Verheggen, B., Maibach, E. W.,
… Rice, K. (2016). Consensus on consensus: a synthesis of consensus estimates
on human-caused global warming. Environmental Research Letters, 11(4), 48002.
17
Farjon, A. (2005). A monograph of Cupressaceae and Sciadopitys. Royal Botanic
Gardens, Kew.
Gehrig-Fasel, A. J., Guisan, A., Zimmermann, N. E., & Niklau, E. (2007). Tree line shifts
in the Swiss Alps : Climate change or land abandonment. Journal of Vegetation
Science, 18(4), 571–582.
Grace, J., Berninger, F., & Nagy, L. (2002). Impacts of climate change on the tree line.
Annals of Botany, 90(4), 537–544. https://doi.org/10.1093/aob/mcf222
Grierson, A. J. C., and Long, D. G. (1983). Flora of Bhutan. Royal Botanic Gardens,
Edinburgh.
IPCC, (2014a). Climate change 2014: Impacts, adaptation, and vulnerability. Part A:
Global and sectoral aspects. Contribution of working group II to the fifth
assessment report of the Intergovernmental Panel on climate change. Cambridge
University Press, Cambridge, 688.
IPCC, (2014b). Climate change 2014: Impacts, adaptation, and vulnerability. Part B:
Regional aspects. Contribution of working group II to the fifth assessment report
of the Intergovernmental Panel on Climate Change. Cambridge University Press,
Cambridge, 1132.
IUCN. (2016). The IUCN Red List of Threatened Species. Retrieved December 6, 2017,
from http://www.iucnredlist.org/details/42247
Johnson, T. (2014). 13 of 14 Hottest years on record all occurred in 21st century. The
weather channels. Retrieved October 8, 2017, from
https://weather.com/science/environment/news/13-14-hottest-years-record-
occurred-21st-century-wmo-20140324.
Karchesy, J. (1998). The Literature of Juniper utilization for oils and specialty products.
Corvallis, Oregon.
Lenoir, J., Gégout, J. C., Marquet, P. A., de Ruffray, P., & Brisse, H. (2008). A

18
significant upward shift in plant species optimum elevation during the 20th
century. Science, 320(5884), 1768–71.
Lenoir, J., Gégout, J. C., Pierrat, J. C., Bontemps, J. D., & Dhôte, J. F. (2009).
Differences between tree species seedling and adult altitudinal distribution in
mountain forests during the recent warm period (1986-2006). Ecography, 32(5),
765–777.
Lenoir, J., & Svenning, J. C. (2015). Climate-related range shifts - a global
multidimensional synthesis and new research directions. Ecography, 38(1), 15–
28.
Malis, F., Kopeckey, M., Mergani, J., & Vida, T. (2016). Life stage, not climate change,
explains observed tree range shifts. Global Change Biology, 22(5), 1904–1914.
Mao, K., Hao, G., Liu, J., Adams, R. P., & Milne, R. I. (2010). Diversification and
biogeography of Juniperus ( Cupressaceae ): variable diversification rates and
multiple intercontinental dispersals, 254–272.
Millenium Ecosystem Assessment. (2007). Human Well-Being. (M. McGillivray, Ed.),
Ecosystems. London: Palgrave Macmillan UK.
Monleon, V. J., & Lintz, H. E. (2015). Evidence of tree species’ range shifts in a complex
landscape. PLoS ONE, 10(1), 1–17.
National Centers For Environmental Information. (2017). Climate at a Glance.. Retrieved
June 28, 2017, from https://www.ncdc.noaa.gov/cag/
Nicotra, A. B., Atkin, O. K., Bonser, S. P., Davidson, A. M., Finnegan, E. J., Mathesius,
U., van Kleunen, M. (2010). Plant phenotypic plasticity in a changing climate.
Trends in Plant Science, 15(12), 684–692.
Solr, J. (2013). Effect of climate change on mountain pine distribution in western Tatra
mountains. In Climate Change - Realities, Impacts over Ice Cap, Sea Level and
Risks.
Telwala, Y., Brook, B. W., Manish, K., & Pandit, M. K. (2013). Climate-induced

19
elevational range shifts and increase in plant species richness in a Himalayan
biodiversity epicentre. PLoS ONE, 8(2).
Urban, M. C. (2015). Accelerating extinction risk from climate change. Science,
348(6234), 571–573.
Woodall, C., Oswalt, C., & Westfall, J. (2008). Tree migration detection through
comparisons of historic and current forest inventories. USDA Forest Service, 1–9.

20
CHAPTER TWO: ESTIMATING CURRENT
DISTRIBUTION AND HARVESTING INTENSITY OF
JUNIPERUS IN BHUTAN
Abstract
There is much evidence that global warming is affecting the habitats of organisms
throughout the world. While animals can migrate easily when warming happens,
plants being stationary organisms cannot move. Differences in plant life stage
distributions with altitude, latitude and longitude give an indication that plant
ranges are responding to the effects of climate change. In this study, three species
of Juniperus, J. indica, J. recurva and J. squamata, were sampled along six
elevational transects, two transect each in the eastern, central, and western
portions of Bhutan. The elevational ranges for all three species along these
transects is smaller than previously reported in the literature. The range of J.
squamata was has shifted by an average 83 m towards higher elevations, as the
distribution of seedling life stage was significantly higher than that of adult life
stage at the leading edge (90 percentile). There was no evidence for a range shift
in J. recurva, and J. indica was too rare to determine whether its range is
changing or not. Regarding harvesting intensity of junipers, both the percentage
of J. recurva harvested and the percentage of basal area harvested in a plot
increased as the distance of the nearest road to the sampling point decreased.
Together, these results suggest that humans are having indirect effects on junipers
in Bhutan via climate change and direct effects through harvesting.
KEYWORDS: Global warming, range shift, Juniperus indica, Juniperus recurva,
Juniperus squamata, harvesting intensity

21
1. Introduction
The Intergovernmental Panel for Climate Change (IPCC, 2014b) predicts that at
the current rate of warming, global temperature will increase between 1.4°C to 5.8°C by
the end of this century. The warming is expected to be felt more in the Asian continent, the
change being + 0.13°C/decade (National Centers For Environmental Information, 2017),
including the study area in Bhutan. The effects of climate change are impartial when it
comes to country and environment. Bhutan, although a carbon negative country, will not
be able to escape these impacts even though it is carbon negative (Dorji, 2016). Climate
data for Bhutan, although not extensive, show both an increasing trend of warming and
increasing precipitation over the last century, and continuing into the 21st century (Figure
5).
Figure 5: Annual deviation from mean annual temperature and precipitation 1901-2015 in Bhutan.
(World Bank, 2017)
There is mounting evidence that plant species are shifting to higher elevations and
higher latitudes, inhabiting locations previously unoccupied (Chen et al., 2011, Lenoir &
Svenning, 2015). Often these shifts are associated with local climate warming (Stenseth
et al., 2002, Van Bogaert et al., 2011, Rabasa et al., 2013, & Benavides et al., 2013),
however shifts to higher elevations in particular might be due to changes in land use
(Gehrig-Fasel et al., 2007), decreased air pollution (Koo et al., 2014), or changes in climate
associated with post-Pleistocene glaciation (Davis & Shaw, 2001). Lenoir et al. (2008)

22
stated that distribution changes for stationary species like plants that have a long lifespan,
trees in particular, are more difficult to detect compared to mobile organisms like animals.
One common method used to study distributional changes in trees is to document
differences in range between adults and established juveniles, either at a single point in
time or across multiple censuses. The assumption of this approach is that adult distribution
reflects past local climate, while the established seedling distribution, if different from that
of adults, reflects a change in space in the distribution of microclimates that allow
establishment. If these differences are caused by climate warming, the predictions are that
established seedling distributions should be further poleward latitudinally, then that of
adults at both the northern and southern boundaries of the species, and higher altitudinally
at the lower and higher edges along an elevational boundary. Repeated censuses, depending
on the time span between censuses and the lifespan of the tree species, should show a shift
in the distribution of adult trees as well.
Compared to the number of studies conducted in Europe and North America about
climate effects on range shifts of terrestrial plants, only a few have been conducted in Asia
(Telwala, et al., 2013, Lenoir & Svenning, 2015 & Schickhoff et al., 2015). There are no
records of such studies in Bhutan despite that fact that the geography of the country lends
itself to such studies. There is a steep elevational gradient from south to north, going from
100 m to more than 7000 m in some locations (DoFPS, 2016). Many of the mountain
regions are covered by conifer forests, reaching to almost 5400 m in elevation in some
areas (DoFPS, 2016).
Species of the genus Juniperus dominate a number of these conifer forests. Both J.
recurva and J. indica have moved to higher elevations in Sikkim, India (Telwala, et al.,
2013). This change in distribution of Juniperus can be considered as an indirect
consequence of human-induced climate change. In contrast, humans can also have a more
direct effect on the abundance of plant species in general and Juniperus in particular by
harvesting plants. The uses of juniper plants in Bhutan are varied. The plant is used in
manufacture of incense, construction of monumental buildings, and in funerals as fuel
wood. Harvesting is normally restricted, however, as this species is categorized as a class
A timber in Bhutan Forest and Nature Conservation Rule-2016. Despite this, unregulated
harvesting of juniper plants appears to be rampant and increasing in the forests of Bhutan.

23
Now is the right time to develop base line data on the current status of junipers in Bhutan,
and learn the factors causing more harvesting of junipers, so that some form of regulation
can be implemented to ensure sustainable harvesting in the future. Understanding the
current distribution of junipers in Bhutan is very important given that we are at a cross
roads both of global warming on one hand and conservation of species on other hand.
The main objectives of this study were to answer the following two questions. First,
has the distribution of junipers in Bhutan been affected by recent climate change, and if so,
in which direction? To answer this question, I sampled the distribution of various life stages
(seedling, juvenile, and adult) of Juniperus recurva, J. squamata, and J. indica in the areas
spanning the geographic range of Bhutan. I hypothesized that because plant distribution is
influenced by climate, changes in climate may trigger a change in plant distribution. To
test this hypothesis, I estimated the current distribution of seedlings, juveniles and adults
of each juniper species along an elevational gradient in three study areas. I predicted that
seedlings and juveniles would be found at higher elevation than adults, since current adult
distribution would reflect the past climate and current seedling and juvenile distributions
would reflect the present and recent past climate. The differences among each life stage of
species distributions would reflect the shift that has occurred over time.
Second, what is the intensity of juniper harvest, and is it related to the proximity of
roads to the harvested sites? To answer these questions, I estimated the basal area of trees
harvested and total number of trees harvested, and correlated each with estimated proximity
to the nearest road. The prediction is that the intensity of harvesting (percentage of harvest
and basal area) increases as the proximity to the road increases.
2. Methodology
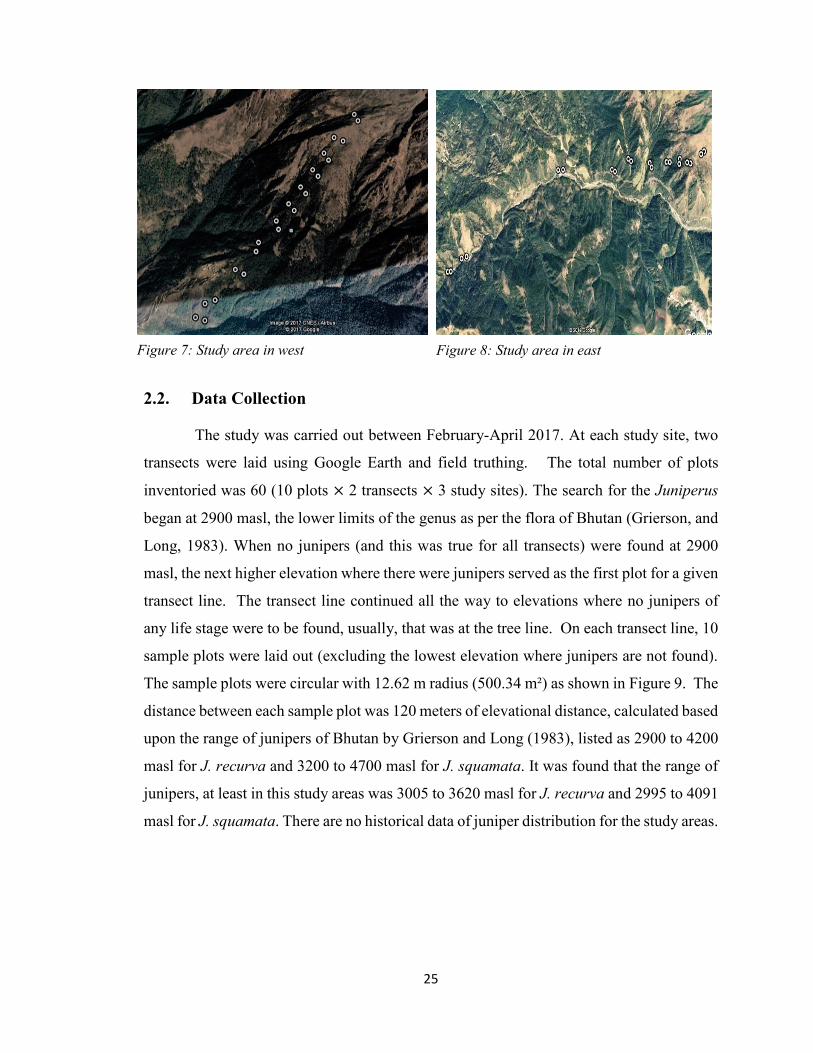
2.1. Study area
The study was conducted in Bhutan (27.41688° N, 90.43476° E), a small land-
locked mountainous country in Asia (Figure 6). The study sites were three, representing
three regions of the country, western, central and eastern, in order to sample the full range
of climatic conditions where Juniperus species are known to occur in Bhutan. The southern
region of Bhutan, where there is no record of juniper species occurring, was not sampled.

24
The criteria used for the selection of sites in all the three regions were: 1. All sites were on
south-facing slopes as far as possible, 2. All sites were inside the mixed conifer forest type,
and 3. All study sites have similar disturbance levels. These criteria were used to help
ensure uniformity in environmental conditions. As the study focused on high altitude plant
species, the timing of the data collection coincided with winter months in Bhutan, thus
accessibility to one of the juniper growing areas in western Bhutan is restricted due to
heavy snow fall. The study sites are Lamchey in the west (Figure 7), Merek in the east
(Figure 8) and Yotongla in the center Bhutan (Figure 9).
C
E
W
Figure 6: Map of the study area (source: http://www.asia-atlas.com/bhutan.htm)
25
2.2. Data Collection
The study was carried out between February-April 2017. At each study site, two
transects were laid using Google Earth and field truthing. The total number of plots
inventoried was 60 (10 plots × 2 transects × 3 study sites). The search for the Juniperus
began at 2900 masl, the lower limits of the genus as per the flora of Bhutan (Grierson, and
Long, 1983). When no junipers (and this was true for all transects) were found at 2900
masl, the next higher elevation where there were junipers served as the first plot for a given
transect line. The transect line continued all the way to elevations where no junipers of
any life stage were to be found, usually, that was at the tree line. On each transect line, 10
sample plots were laid out (excluding the lowest elevation where junipers are not found).
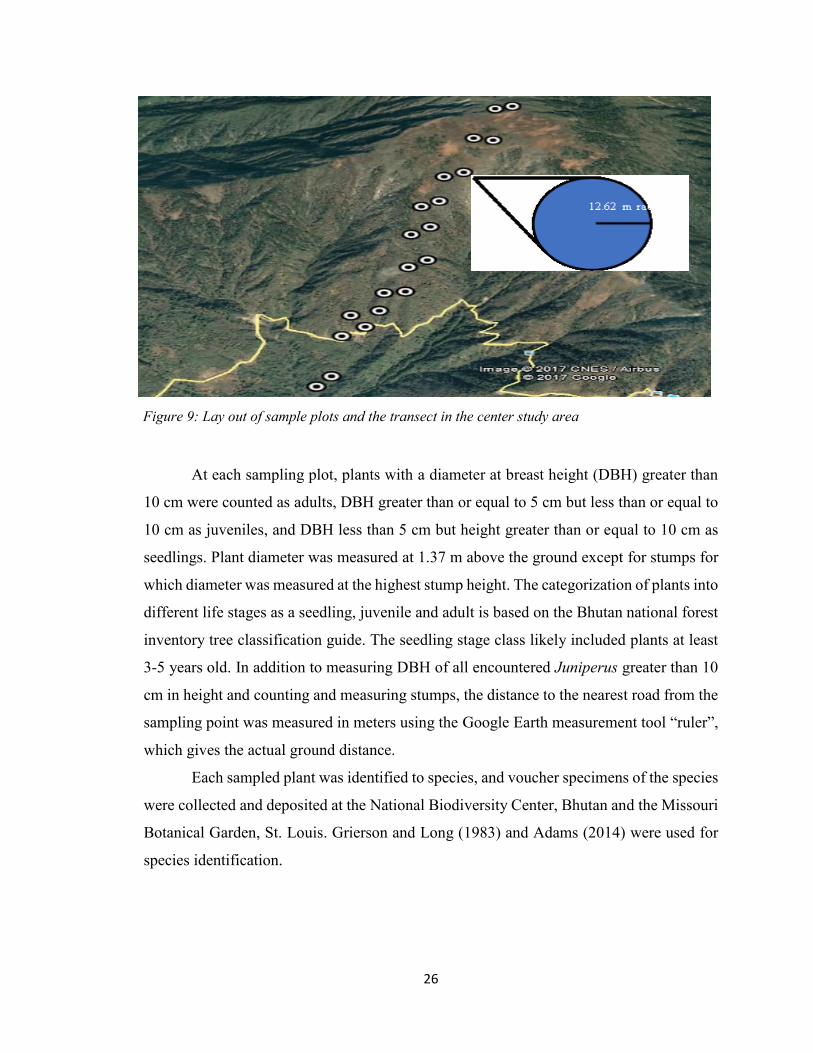
The sample plots were circular with 12.62 m radius (500.34 m²) as shown in Figure 9. The
distance between each sample plot was 120 meters of elevational distance, calculated based
upon the range of junipers of Bhutan by Grierson and Long (1983), listed as 2900 to 4200
masl for J. recurva and 3200 to 4700 masl for J. squamata. It was found that the range of
junipers, at least in this study areas was 3005 to 3620 masl for J. recurva and 2995 to 4091
masl for J. squamata. There are no historical data of juniper distribution for the study areas.
Figure 7: Study area in west Figure 8: Study area in east
26
At each sampling plot, plants with a diameter at breast height (DBH) greater than
10 cm were counted as adults, DBH greater than or equal to 5 cm but less than or equal to
10 cm as juveniles, and DBH less than 5 cm but height greater than or equal to 10 cm as
seedlings. Plant diameter was measured at 1.37 m above the ground except for stumps for
which diameter was measured at the highest stump height. The categorization of plants into
different life stages as a seedling, juvenile and adult is based on the Bhutan national forest
inventory tree classification guide. The seedling stage class likely included plants at least
3-5 years old. In addition to measuring DBH of all encountered Juniperus greater than 10
cm in height and counting and measuring stumps, the distance to the nearest road from the
sampling point was measured in meters using the Google Earth measurement tool “ruler”,
which gives the actual ground distance.
Each sampled plant was identified to species, and voucher specimens of the species
were collected and deposited at the National Biodiversity Center, Bhutan and the Missouri
Botanical Garden, St. Louis. Grierson and Long (1983) and Adams (2014) were used for
species identification.
Figure 9: Lay out of sample plots and the transect in the center study area

27
3. Analysis
IBM SPSS statistics 24 and SAS 9.2 were used for the data analysis. To understand
the current distribution of junipers in the study area, and to estimate the range shift of
junipers, the data for life stages of junipers were analyzed as cumulative frequencies and
percentages (relative abundance) from the raw count data. This computation was done to
calculate the percentile of each life stage’s current distribution with elevation. The
cumulative percentages and the frequencies are used to calculate the elevation of each life
stage’s 10th, 50th and 90th percentile for the current distribution of the species.
𝐹𝑟𝑒𝑞𝑁𝑜𝐻−𝑃𝑒𝑟𝑐𝑒𝑛𝑡𝑖𝑙𝑒𝑣𝑎𝑙𝑢𝑒
𝐹𝑟𝑒𝑞𝑁𝑜𝐻−𝐹𝑟𝑒𝑞𝑁𝑜𝐿 =
𝐸𝑙𝑣𝐻−𝐸𝑙𝑣𝑋
𝐸𝑙𝑣𝐻−𝐸𝑙𝑣𝐿
where the FreqNoH and FreqNoL are the highest and the lowest frequency number
corresponding to the elevation X. ElvX is the elevation that is required to calculate.
Percentile value is the percentage of the total frequency number. ElvH and ElvL are the
highest and lowest elevation of the corresponding frequency number. Using the formula
above, the elevation of a 10th, 50th and 90th percentile of each life stage was calculated,
indicating whether there is a difference between life stages at the lower, middle and upper
edge.
Wilcoxon signed rank test was used to test the hypothesis whether there is a
difference between the life stages of junipers with elevation. Spearman’s rho was used to
test the relationship between the percentage of total harvested junipers and the percentage
of total basal area harvested with the distance of sampling point to the nearest road.
4. Results
4.1. General patterns
We found three species of Juniperus, J. recurva, J. squamata, and J. indica, but
only two species (J. recurva and J. squamata) are considered here as J. indica was found
only in one sample plot in the study area (Figure 10). Seedlings of J. recurva and J.
squamata were easily distinguished (Figure 11). The basic identification key used in the
field for seedlings are; 1. Presence of parent tree species 2. Leaf and branches (color and
shape)-leaves light green and branches drooping/ weeping, and leaves appressed (closed)-

28
J. recurva. Leaves dark green, branches upright/erect, leaves open when compared to J.
recurva- J. squamata.
Figure 10: Juniper species in the study area (Top-J. squamata, middle- J. recurva and bottom-J.
indica)
Figure 11: Seedlings of junipers (right- J. squamata and left- J. recurva)

29
A. West Center East
Figure 12: Standard error line graph showing the current distribution of Junipers with
elevation. A. J. recurva. B. J. squamata. Orange lines show seedlings, blue lines the juveniles
and the green lines the adults. J. recurva was not found in the West region.
B
.

30
Figure 13: Median elevation at which a given proportion of individuals was encountered
(triangle: 10th percentile; square: 50th percentile; circle: 90th percentile, based on the lower limit
of the distribution for each life stage). Comparisons were made across life stages but within the
specified distribution cutoff. Medians not sharing the same letter are significantly different at P
< 0.05 (Wilcoxon signed rank test).
4.2. Range shift of J. recurva
There was broad elevational variation in the mean number of individuals per plot
among seedlings (x̅ ± SE = 8.7 ± 1.2), juveniles (x̅ ± SE = 2.5 ± 0.6) and adults (x̅ ± SE =
4.0 ± 1.23) of J. recurva (Figure 12). The analysis using the Wilcoxon signed rank test at
the 10th, 50th and 90th percentiles for each life stage showed no significance differences
between the life stages across elevations (Figure 13 and Table 2). Therefore, there is no
evidence suggesting an ongoing range shift in J. recurva in the study areas. Based on the
sampling, J. recurva is restricted to the central and eastern portions of the country (it was
not found in any of the plots of the western transects) and has a lower elevation limit than
that of J. squamata (Figure 12).
Table 2: Wilcoxon signed rank test results for J. recurva
Life stage 10th Percentile 50th Percentile 90th Percentile
Seedling vs. Juvenile Z = -0.45, P = 1.00 Z = -1.00, P = 0.38 Z = -1.10, P = 0.38
Juvenile vs. Adult Z = -1.00, P = 1.00 Z = -1.60, P = 0.25 Z = -0.73, P = 0.63
Adult vs. Seedling Z = -1.34, P = 0.50 Z = -1.83, P = 0.13 Z = -1.83, P = 0.13
a
a
a a a
a
a
a
a
a
a ab
a a a
a
a
b

31
4.3. Range shift of J. squamata
Juniperus squamata also varied greatly in the number of seedlings per plot (x̅ ± SE
= 17.0 ± 2.2), juveniles (x̅ ± SE = 4.9 ± 1.4) and adults (x̅ ± SE = 5.7 ± 1.1) with
elevation (Figure 12). Based on the results generated by Wilcoxon signed rank test, there
were no significance differences between life stages at 10th percentile and 50th percentile
elevation and even at the 90th percentile elevation for juvenile vs. adult and juvenile vs.
seedling life stages (Table 3). But there was a significance difference for seedlings vs. the
adult life stage at 90th percentile elevation. Seedlings of J. squamata are on average 33 m
higher in elevation in the western transects, 35 m higher in center transects and 182 m
higher in eastern transects than adults at the leading edge (mean elevation of seedling –
mean elevation of adult at 90th percentile), which shows that the range of J. squamata is
moving towards higher elevations (Figure 13).
Table 3: Wilcoxon signed rank test results for J. squamata
Life stage 10th Percentile 50th Percentile 90th Percentile
Seedling vs. Juvenile Z = -0.86, P = 0.63 Z = -0.73, P = 0.56 Z = -1.15, P = 0.31
Juvenile vs. Adult Z = -0.73, P = 0.56 Z = -1.57, P = 0.57 Z = -0.73, P = 0.56
Adult vs. Seedling Z = -0.11, P = 1.00 Z = -1.79, P = 0.94 Z = -2.20, P = 0.03
4.4. Harvesting intensity of Junipers
Among the three study areas, the center has the highest numbers of juniper trees
harvested at 43.2%. The comparable figures for the eastern and western regions were
40.5% and 16.2%, respectively. Based on my sampled plots, Juniperus recurva is harvested
more than J. squamata (69% vs. 31% of all harvested trees, respectively). Thus, a perceived
preference by the Bhutanese for J. recurva for incense manufacturing, timbers for fortress
construction and as firewood in funerals is apparent in the higher harvesting rate seen in
this study.
The harvesting intensity of junipers as shown in Figures 14 and 15 supported the
hypothesis for J. recurva that the proximity of roads increases the amount of harvesting.

32
The two-tail test of significance shows that there is a negative correlation between distance
to road and percentage of total trees harvested in a plot (rs (40) = -0.50, p < 0.05) (Figure
14) and percentage of total basal area harvested in a plot (rs (40) = - 0.52, p < 0.05) for J.
recurva (Figure 15).
Regarding J. squamata, there was a positive, but not significant correlation (rs (60)
= 0.03, p > 0.05, and r s (60) = 0.02, p > 0.05) (Fig. 16 and 17) for proximity of road
affecting the percentage of total trees harvested and percentage of total basal area harvested
respectively. This could be because J. squamata is less preferred than J. recurva for
manufacturing of incense and constructional purposes because of its smaller size and
therefore lower timber volume.
Figure 14: Scatter plot for J. recurva showing the relationship between the percentage
of total harvested trees (y-axis) with the distance of road to sampling point (x-axis).
Figure 15: Scatter plot for J. recurva showing the relationship between the percentage of total
basal area harvested (y-axis) with distance of road to sampling points (x-axis).

33
Figure 16: Scatter plot for J. squamata showing the relationship between the percentage of total
harvested trees (y-axis) with the distance of road to sampling point (x-axis).
Figure 17: Scatter plot for J. squamata showing the relationship between the percentage of total
basal area harvested (y-axis) with distance of road to sampling points (x-axis).
5. Discussion
The elevational range of junipers in Bhutan sampled in this study is smaller than
that reported in the flora of Bhutan, i.e., 2900-4700 m (Grierson &Long, 1983). The
elevational range of Juniperus recurva is 3005 to 3685 masl, while that of J. squamata is
2995 to 4091 masl in the study areas. The elevational range of these two species in other
non-sampled parts of the country may be greater, as the current study focused only in three
areas of Bhutan. Since this study suggests that the range and abundance of J. recurva is
much more restricted in Bhutan than that of J. squamata, this is of serious concern and
suggests that the former species may be under greater threat of overharvesting, given the
apparent preference of the Bhutanese for J. recurva.

34
As hypotheses, global climate change, especially temperature warming and
increased precipitation, in conjunction with changes in other factors, like declining grazing
pressure, may have triggered the range shift of Juniperus squamata at the leading edge
(higher elevation). In contrast, J. recurva appears not to be responding to such changes.
However, in Sikkim, Telwala et al. (2013) found that J. recurva has been moving upwards
at the upper edge of its range. The reasons for different responses are unclear, but in the
east study sites in Bhutan, both seedlings and juveniles had a secondary peaks at 3620 m,
even though there are very few adults at that altitude.
As predicted, harvesting intensity of junipers is directly related to road proximity
to the sampling point. From the analysis, this holds true for Juniperus recurva, but not for
J. squamata. This in fact is very much true, as the preferences of J. recurva over J.
squamata for the incense manufacturing and construction purposes is comparatively high.
Therefore, road building is a serious threat to the sustainable use of J. recurva in Bhutan.
Juniperus squamata is harvested more at higher elevations, and usually farther away from
the road because it is used for smoke offerings at high elevations, where J. recurva is
absent, and as a fuelwood for yak herders.
6. Conclusion and recommendation
The study suggests three reasons for changes in distribution of junipers with elevation
in Bhutan 1. Human-induced climate changes is a primary driver of these changes, in
association with secondary biotic factors, especially the decline of grazing by yaks.
Although not statistically significant, the distributions of seedlings, juveniles and adults
were consistently different throughout the ranges of both species, implying that climatic
conditions are affecting the distribution of both plant species particularly at mid and high
elevations (Figure 12). 2. In addition, there is some anecdotal evidence from observations
by people residing in the area, that there have been phenological changes in most plant
species growing at higher elevations, with advanced flowering of fruit plants and successes
in the cultivation of vegetables like chilies, cucumber, maize, rice, etc. at higher elevations.
Cultivation of these species at high elevations was not possible 40 - 50 years ago. 3. Yak
grazing is proposed here as an additional factor affecting the distribution of junipers. Yak
were found grazing in high altitude grasslands of the east and there was a recently

35
abandoned yak hut near the tree line in the center study area. Although our methodologies
were not designed to collect social data, the yak herders told us that yak grazing has
drastically reduced compared to the past, as people have reduced dramatically their
nomadic lifestyle. This may have helped the plant communities, including juniper
seedlings, to thrive and colonize the higher elevations where grazing pressure has been
reduced or is now absent.
With development, many roads are being constructed in the country. It is clear from
this study that road construction is likely to increase the harvesting intensity of J. recurva.
This phenomenon is only likely to increase as the human population continues to increase
accessibility to the remote forests, putting the species under threat of over-harvesting.
As the range of Juniperus recurva is comparatively smaller than that of J.
squamata, and people prefer J. recurva over J. squamata, the species is relatively under
higher threat from over-harvesting. Therefore, while climate change mitigation for the
conservation of species must happen at both the local and global level, at the national level,
it is time to develop proper guidelines for a sustainable harvesting of junipers in the
country.

36
7. References
Adams, R. P. (2014). Juniperus of the World: the genus Juniperus (4th ed.). Texas:
Trafford Publishing Co., Bloomington, IN.
Benavides, R., Rabasa, S. G., Granda, E., Escudero, A., Hódar, J. A., Martínez-Vilalta,
J.,Valladares, F. (2013). Direct and indirect effects of climate on demography and
early growth of Pinus sylvestris at the rear edge: Changing roles of biotic and
abiotic factors. PLoS ONE, 8(3). https://doi.org/10.1371/journal.pone.0059824
Chen, I.-C., Hill, J. K., Ohlemuller, R., Roy, D. B., & Thomas, C. D. (2011). Rapid range
shifts of species associated with high levels of climate warming. Science,
333(August), 1024–1026. https://doi.org/10.1126/science.1206432
Davis, M. B., & Shaw, R. G. (2001). Range shifts and adaptive responses to Quaternary
climate change. Science, 292(April), 673–679.
https://doi.org/10.1126/science.292.5517.673
DoFPS. (2016). Atlas of Bhutan 1:250,000. MoAF, Thimphu, Bhutan
Dorji, L. (2016). Bhutan’s glaciers meltdown, threats and the need for joint response
mechanism. Socio-economic Research and Analysis Division. National Statistical
Burea, Thimphu, Bhutan
Gehrig-Fasel, A. J., Guisan, A., Zimmermann, N. E., & Niklau, E. (2007). Tree line shifts
in the Swiss Alps : Climate change or land abandonment ? Journal of Vegetation
Science, 18(4), 571–582.
Grierson, A.J.C., &d Long, D. G. (1983). Flora of Bhutan. Royal Botanic Gardens,
Edinburgh.
IPCC, (2014b). Climate change 2014: Impacts, adaptation, and vulnerability. Part B:
Regional aspects. Contribution of working group II to the fifth assessment report
of the Intergovernmental Panel on Climate Change. Cambridge University Press,
Cambridge, , 1132.
https://doi.org/10.1017/CBO9781107415324
Koo, K. A., Patten, B. C., Teskey, R. O., & Creed, I. F. (2014). Climate change effects on
red spruce decline mitigated by reduction in air pollution within its shrinking
habitat range. Ecological Modelling, 293, 81–90.
https://doi.org/10.1016/j.ecolmodel.2014.07.017
Lenoir, J., Gégout, J. C., Marquet, P. A., de Ruffray, P., & Brisse, H. (2008). A

37
significant upward shift in plant species optimum elevation during the 20th
century. Science, 320(5884), 1768–1771. https://doi.org/10.1126/science.1156831
Lenoir, J., & Svenning, J. C. (2015). Climate-related range shifts - a global
multidimensional synthesis and new research directions. Ecography, 38(1), 15–
28. https://doi.org/10.1111/ecog.00967
National Centers For Environmental Information. (2017). Climate at a Glance. National
Centers for Environmental Information (NCEI). Retrieved June 28, 2017, from
https://www.ncdc.noaa.gov/cag/
Rabasa, S. G., Granda, E., Benavides, R., Kunstler, G., Espelta, J. M., Ogaya, R.,
Valladares, F. (2013). Disparity in elevational shifts of European trees in response
to recent climate warming. Global Change Biology, 19(8), 2490–2499.
https://doi.org/10.1111/gcb.12220
Schickhoff, U., Bobrowski, M., Böhner, J., Bürzle, B., Chaudhary, R. P., Gerlitz, L.,
Wedegärtner, R. (2015). Do Himalayan treelines respond to recent climate
change? An evaluation of sensitivity indicators. Earth Syst. Dynam. 6, 245–265.
https://doi.org/10.5194/esd-6-245-2015
Stenseth, N. C., Mysterud, A., Ottersen, G., Hurrell, J. W., Chan, K. S., & Lima, M.
(2002). Ecological effects of climate fluctuations. Science, 297(5585), 1292–
1296. https://doi.org/10.1126/science.1071281
Telwala, Y., Brook, B. W., Manish, K., & Pandit, M. K. (2013). Climate-induced
elevational range shifts and increase in plant species richness in a Himalayan
biodiversity epicentre. PLoS ONE, 8(2).
https://doi.org/10.1371/journal.pone.0057103
Van Bogaert, R., Haneca, K., Hoogesteger, J., Jonasson, C., De Dapper, M., &
Callaghan, T. V. (2011). A century of tree line changes in sub-Arctic Sweden
shows local and regional variability and only a minor influence of 20th century
climate warming. Journal of Biogeography, 38(5), 907–921.
https://doi.org/10.1111/j.1365-2699.2010.02453.x
World bank. (2017). Bhutan. Data. Retrieved October 17, 2017, from
https://data.worldbank.org/country/bhutan
38
Table 4: Life stage of junipers data from the study area
Study area Transect No Altitude Species Counts Lifestage
West 1 3020 J. squamata 1 Juvenile
West 1 3020 J. squamata 3 Adult
West 1 3020 J. squamata 5 Seedling
West 1 3140 J. squamata 5 Juvenile
West 1 3140 J. squamata 6 Adult
West 1 3140 J. squamata 11 Seedling
West 1 3260 J. squamata 2 Juvenile
West 1 3260 J. squamata 10 Adult
West 1 3260 J. squamata 9 Seedling
West 1 3380 J. squamata 3 Juvenile
West 1 3380 J. squamata 13 Adult
West 1 3380 J. squamata 16 Seedling
West 1 3500 J. squamata 4 Juvenile
West 1 3500 J. squamata 11 Adult
West 1 3500 J. squamata 17 Seedling
West 1 3620 J. squamata 4 Juvenile
West 1 3620 J. squamata 7 Adult
West 1 3620 J. squamata 37 Seedling
West 1 3740 J. squamata 1 Juvenile
West 1 3740 J. squamata 7 Adult
West 1 3740 J. squamata 18 Seedling
West 1 3860 J. squamata 7 Juvenile
West 1 3860 J. squamata 4 Adult
West 1 3860 J. squamata 9 Seedling
West 1 3980 J. squamata 2 Seedling
West 2 2995 J. squamata 1 Juvenile
West 2 2995 J. squamata 1 Adult
West 2 2995 J. squamata 2 Seedling
West 2 3020 J. squamata 2 Juvenile
West 2 3020 J. squamata 7 Adult
West 2 3020 J. squamata 10 Seedling
West 2 3140 J. squamata 1 Juvenile
West 2 3140 J. squamata 8 Adult
West 2 3140 J. squamata 9 Seedling
West 2 3260 J. squamata 1 Juvenile
West 2 3260 J. squamata 9 Adult
West 2 3260 J. squamata 37 Seedling
West 2 3380 J. squamata 3 Juvenile

39
West 2 3380 J. squamata 12 Adult
West 2 3380 J. squamata 29 Seedling
West 2 3500 J. squamata 6 Juvenile
West 2 3500 J. squamata 7 Adult
West 2 3500 J. squamata 46 Seedling
West 2 3620 J. squamata 6 Juvenile
West 2 3620 J. squamata 10 Adult
West 2 3620 J. squamata 21 Seedling
West 2 3740 J. squamata 22 Juvenile
West 2 3740 J. squamata 22 Adult
West 2 3740 J. squamata 24 Seedling
West 2 3860 J. squamata 3 Juvenile
West 2 3860 J. squamata 1 Adult
West 2 3860 J. squamata 15 Seedling
West 2 3980 J. squamata 5 Seedling
Center 1 3029 J. recurva 2 Juvenile
Center 1 3029 J. recurva 6 Adult
Center 1 3029 J. recurva 1 Seedling
Center 1 3140 J. recurva 1 Juvenile
Center 1 3140 J. recurva 2 Adult
Center 1 3140 J. recurva 3 Seedling
Center 1 3260 J. recurva 3 Juvenile
Center 1 3260 J. recurva 4 Adult
Center 1 3260 J. recurva 18 Seedling
Center 1 3380 J. recurva 3 Juvenile
Center 1 3380 J. recurva 4 Adult
Center 1 3380 J. recurva 7 Seedling
Center 1 3500 J. recurva 4 Adult
Center 1 3500 J. recurva 10 Seedling
Center 1 3500 J. squamata 7 Juvenile
Center 1 3500 J. squamata 4 Adult
Center 1 3500 J. squamata 14 Seedling
Center 1 3620 J. squamata 15 Juvenile
Center 1 3620 J. squamata 33 Adult
Center 1 3620 J. squamata 26 Seedling
Center 1 3740 J. squamata 4 Adult
Center 1 3740 J. squamata 3 Seedling
Center 1 3860 J. squamata 4 Juvenile
Center 1 3860 J. squamata 19 Adult
Center 1 3860 J. squamata 31 Seedling

40
Center 1 3980 J. squamata 1 Juvenile
Center 1 3980 J. squamata 4 Adult
Center 1 3980 J. squamata 14 Seedling
Center 2 3029 J. recurva 10 Adult
Center 2 3140 J. recurva 14 Juvenile
Center 2 3140 J. recurva 53 Adult
Center 2 3140 J. recurva 17 Seedling
Center 2 3260 J. recurva 4 Juvenile
Center 2 3260 J. recurva 20 Adult
Center 2 3260 J. recurva 15 Seedling
Center 2 3380 J. recurva 6 Juvenile
Center 2 3380 J. recurva 17 Adult
Center 2 3380 J. recurva 21 Seedling
Center 2 3500 J. recurva 1 Juvenile
Center 2 3500 J. recurva 3 Adult
Center 2 3500 J. recurva 9 Seedling
Center 2 3500 J. squamata 12 Juvenile
Center 2 3500 J. squamata 9 Adult
Center 2 3500 J. squamata 37 Seedling
Center 2 3620 J. squamata 9 Juvenile
Center 2 3620 J. squamata 16 Adult
Center 2 3620 J. squamata 31 Seedling
Center 2 3740 J. squamata 82 Juvenile
Center 2 3740 J. squamata 42 Adult
Center 2 3740 J. squamata 93 Seedling
Center 2 3860 J. squamata 60 Juvenile
Center 2 3860 J. squamata 47 Adult
Center 2 3860 J. squamata 75 Seedling
Center 2 3980 J. squamata 1 Juvenile
Center 2 3980 J. squamata 4 Adult
Center 2 3980 J. squamata 14 Seedling
Center 2 4091 J. squamata 5 Seedling
East 1 3005 J. recurva 2 Juvenile
East 1 3005 J. recurva 5 Adult
East 1 3005 J. recurva 11 Seedling
East 1 3020 J. recurva 5 Juvenile
East 1 3020 J. recurva 4 Adult
East 1 3020 J. recurva 34 Seedling
East 1 3140 J. recurva 15 Juvenile
East 1 3140 J. recurva 12 Adult

41
East 1 3140 J. recurva 37 Seedling
East 1 3260 J. recurva 5 Juvenile
East 1 3260 J. recurva 6 Adult
East 1 3260 J. recurva 32 Seedling
East 1 3260 J. squamata 5 Adult
East 1 3260 J. squamata 17 Seedling
East 1 3380 J. recurva 1 Juvenile
East 1 3380 J. recurva 3 Adult
East 1 3380 J. recurva 12 Seedling
East 1 3380 J. squamata 8 Juvenile
East 1 3380 J. squamata 7 Adult
East 1 3380 J. squamata 27 Seedling
East 1 3500 J. recurva 5 Juvenile
East 1 3500 J. recurva 4 Adult
East 1 3500 J. recurva 12 Seedling
East 1 3500 J. squamata 10 Juvenile
East 1 3500 J. squamata 7 Adult
East 1 3500 J. squamata 57 Seedling
East 1 3620 J. recurva 4 Juvenile
East 1 3620 J. recurva 1 Adult
East 1 3620 J. recurva 10 Seedling
East 1 3620 J. squamata 5 Juvenile
East 1 3620 J. squamata 4 Adult
East 1 3620 J. squamata 13 Seedling
East 1 3740 J. squamata 3 Juvenile
East 1 3740 J. squamata 1 Adult
East 1 3740 J. squamata 25 Seedling
East 1 3860 J. squamata 6 Juvenile
East 1 3860 J. squamata 1 Adult
East 1 3860 J. squamata 77 Seedling
East 1 3980 J. squamata 25 Seedling
East 2 3005 J. recurva 10 Juvenile
East 2 3005 J. recurva 6 Adult
East 2 3005 J. recurva 17 Seedling
East 2 3005 J. squamata 5 Juvenile
East 2 3005 J. squamata 1 Adult
East 2 3005 J. squamata 8 Seedling
East 2 3020 J. recurva 2 Juvenile
East 2 3020 J. recurva 3 Adult
East 2 3020 J. recurva 17 Seedling

42
East 2 3020 J. squamata 2 Adult
East 2 3020 J. squamata 5 Seedling
East 2 3140 J. recurva 12 Juvenile
East 2 3140 J. recurva 20 Adult
East 2 3140 J. recurva 51 Seedling
East 2 3140 J. squamata 2 Juvenile
East 2 3140 J. squamata 3 Adult
East 2 3140 J. squamata 12 Seedling
East 2 3260 J. recurva 8 Juvenile
East 2 3260 J. recurva 2 Adult
East 2 3260 J. recurva 30 Seedling
East 2 3260 J. squamata 11 Juvenile
East 2 3260 J. squamata 11 Adult
East 2 3260 J. squamata 31 Seedling
East 2 3380 J. recurva 6 Juvenile
East 2 3380 J. recurva 2 Adult
East 2 3380 J. recurva 15 Seedling
East 2 3380 J. squamata 3 Juvenile
East 2 3380 J. squamata 7 Adult
East 2 3380 J. squamata 27 Seedling
East 2 3500 J. recurva 2 Adult
East 2 3500 J. recurva 11 Seedling
East 2 3500 J. squamata 4 Juvenile
East 2 3500 J. squamata 6 Adult
East 2 3500 J. squamata 38 Seedling
East 2 3620 J. recurva 11 Juvenile
East 2 3620 J. recurva 1 Adult
East 2 3620 J. recurva 31 Seedling
East 2 3620 J. squamata 11 Juvenile
East 2 3620 J. squamata 5 Adult
East 2 3620 J. squamata 19 Seedling
East 2 3740 J. squamata 8 Juvenile
East 2 3740 J. squamata 7 Adult
East 2 3740 J. squamata 46 Seedling
East 2 3860 J. squamata 8 Juvenile
East 2 3860 J. squamata 4 Adult
East 2 3860 J. squamata 72 Seedling
East 2 3980 J. squamata 11 Seedling
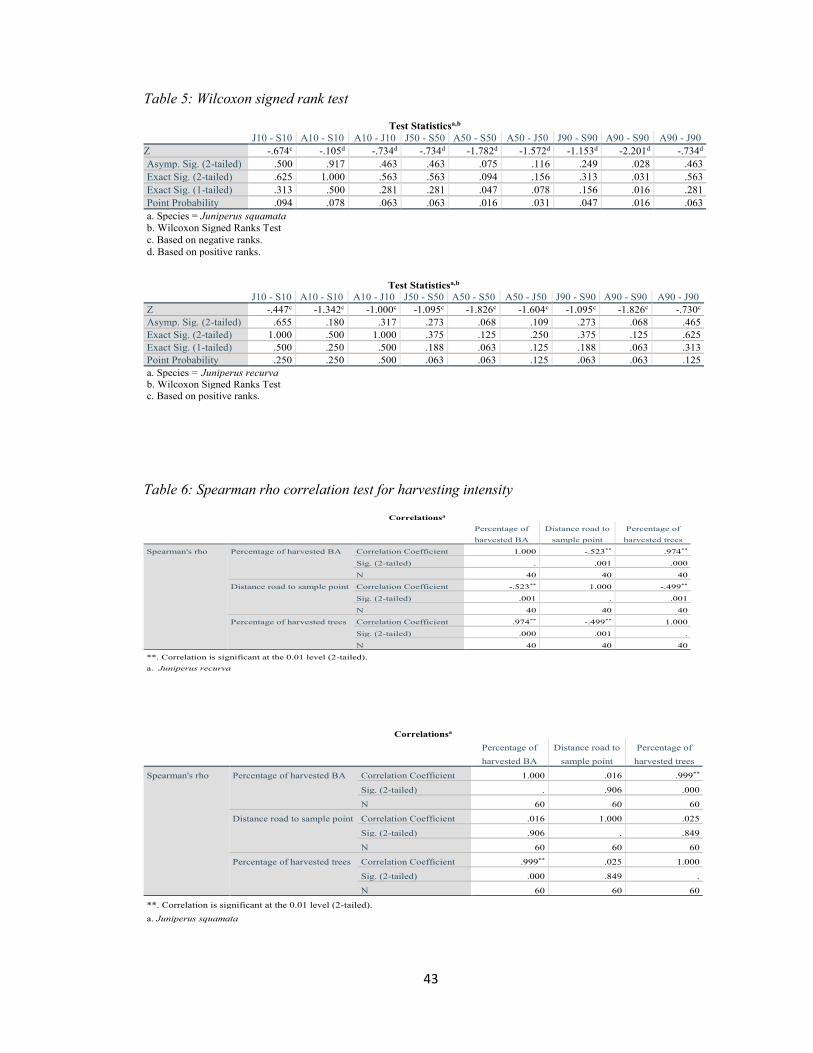
43
Table 5: Wilcoxon signed rank test
Table 6: Spearman rho correlation test for harvesting intensity
Test Statisticsa,b
J10 - S10 A10 - S10 A10 - J10 J50 - S50 A50 - S50 A50 - J50 J90 - S90 A90 - S90 A90 - J90
Z -.674c -.105d -.734d -.734d -1.782d -1.572d -1.153d -2.201d -.734d
Asymp. Sig. (2-tailed) .500 .917 .463 .463 .075 .116 .249 .028 .463
Exact Sig. (2-tailed) .625 1.000 .563 .563 .094 .156 .313 .031 .563
Exact Sig. (1-tailed) .313 .500 .281 .281 .047 .078 .156 .016 .281
Point Probability .094 .078 .063 .063 .016 .031 .047 .016 .063
a. Species = Juniperus squamata
b. Wilcoxon Signed Ranks Test
c. Based on negative ranks.
d. Based on positive ranks.
Test Statisticsa,b
J10 - S10 A10 - S10 A10 - J10 J50 - S50 A50 - S50 A50 - J50 J90 - S90 A90 - S90 A90 - J90
Z -.447c -1.342c -1.000c -1.095c -1.826c -1.604c -1.095c -1.826c -.730c
Asymp. Sig. (2-tailed) .655 .180 .317 .273 .068 .109 .273 .068 .465
Exact Sig. (2-tailed) 1.000 .500 1.000 .375 .125 .250 .375 .125 .625
Exact Sig. (1-tailed) .500 .250 .500 .188 .063 .125 .188 .063 .313
Point Probability .250 .250 .500 .063 .063 .125 .063 .063 .125
a. Species = Juniperus recurva
b. Wilcoxon Signed Ranks Test
c. Based on positive ranks.
Correlationsa
Percentage of
harvested BA
Distance road to
sample point
Percentage of
harvested trees
Spearman's rho Percentage of harvested BA Correlation Coefficient 1.000 -.523** .974**
Sig. (2-tailed) . .001 .000
N 40 40 40
Distance road to sample point Correlation Coefficient -.523** 1.000 -.499**
Sig. (2-tailed) .001 . .001
N 40 40 40
Percentage of harvested trees Correlation Coefficient .974** -.499** 1.000
Sig. (2-tailed) .000 .001 .
N 40 40 40
**. Correlation is significant at the 0.01 level (2-tailed).
a. Juniperus recurva
Correlationsa
Percentage of
harvested BA
Distance road to
sample point
Percentage of
harvested trees
Spearman's rho Percentage of harvested BA Correlation Coefficient 1.000 .016 .999**
Sig. (2-tailed) . .906 .000
N 60 60 60
Distance road to sample point Correlation Coefficient .016 1.000 .025
Sig. (2-tailed) .906 . .849
N 60 60 60
Percentage of harvested trees Correlation Coefficient .999** .025 1.000
Sig. (2-tailed) .000 .849 .
N 60 60 60
**. Correlation is significant at the 0.01 level (2-tailed).
a. Juniperus squamata

44
Table 7: Percentile calculation data
species=1 region=Center transect=1
10 50 90 lifestage species=1 region=East transect=1 3029 3200 3440 Adult Lifestage 10% 50% 90% 3029 3200 3344 Juvenile adult 3005 3105 3425 3
3136 3243 3453 Seedling juvenile 3010 3112 3509 2
seedling 3007 3114 3452 1
species=1 region=Center transect=2
Lifestage 10% 50% 90% species=1 region=East
transect=2
Adult 3030 3116 3328 life stage 10% 50% 90%
Juvenile 3140 3350 adult 3005 3074 3344 3
Seedling 3252 3417 juvenile 3005 3148 3513 2
seedling 3005 3144 3553 1 species=2 region=Center
transect=1
Lifestage 10% 50% 90% species=2 region=East
transect=1
adult 3509 3602 3845 Lifestage 10% 50% 90%
juvenile 3500 3552 3758 adult 3260 3389 3605 3
seedling 3500 3744 3905 juvenile 3380 3476 3796 2
seedling 3292 3651 3864 1
species=2 region=Center transect=2 species=2 region=East
transect=2
Lifestage 0.1 0.5 0.9 Lifestage 10% 50% 90% adult 3521 3717 3840 adult 3084 3363 3730 3
juvenile 3559 3709 3829 juvenile 3019 3511 3782 2
seedling 3500 3697 3850 seedling 3147 3585 3834 1
species=2 region=West
transect=1
species=2 region=West
transect=2 Lifestage 10% 50% 90% Lifestage 10% 50% 90%
adult 3082 3366 3704 adult 3019 3406 3703 3
juvenile 3061 3455 3814 juvenile 3200 3634 3680 2
seedling 3101 3513 3731 seedling 3124 3411 3742 1

45
Table 8: Percentage of harvested and basal area of junipers and road distance to sample points
Altitude Study area Species
Stump Juvenile
Stump Adult Total
% Basal Area
% Harvest
Road to sample point
2900 West J.recurva 0 0 0 0 0 0
2995 West J.recurva 0 0 0 0 0 0
3020 West J.recurva 0 0 0 0 0 0
3140 West J.recurva 0 0 0 0 0 0
3260 West J.recurva 0 0 0 0 0 0
3380 West J.recurva 0 0 0 0 0 0
3500 West J.recurva 0 0 0 0 0 0
3620 West J.recurva 0 0 0 0 0 0
3740 West J.recurva 0 0 0 0 0 0
3860 West J.recurva 0 0 0 0 0 0
3980 West J.recurva 0 0 0 0 0 0
4100 West J.recurva 0 0 0 0 0 0
2900 Center J.recurva 0 0 0 0 0 0
3029 Center J.recurva 0 0 0 0 0 350
3140 Center J.recurva 0 0 0 0 0 30
3260 Center J.recurva 0 0 0 0 0 149
3380 Center J.recurva 0 1 1 7 14 350
3500 Center J.recurva 0 0 0 0 0 486
3620 Center J.recurva 0 0 0 0 0 833
3740 Center J.recurva 0 0 0 0 0 1139
3860 Center J.recurva 0 0 0 0 0 1449
3980 Center J.recurva 0 0 0 0 0 1865
4091 Center J.recurva 0 0 0 0 0 2499
4100 Center J.recurva 0 0 0 0 0 0
2900 Center J.recurva 0 0 0 0 0 0
3029 Center J.recurva 0 1 1 44 10 470

46
3140 Center J.recurva 0 15 21 48 31 60
3260 Center J.recurva 0 4 4 38 17 142
3380 Center J.recurva 0 2 2 70 9 335
3500 Center J.recurva 0 0 0 0 0 348
3620 Center J.recurva 0 0 0 0 0 779
3740 Center J.recurva 0 0 0 0 0 1061
3860 Center J.recurva 0 0 0 0 0 1399
3980 Center J.recurva 0 0 0 0 0 1880
4091 Center J.recurva 0 0 0 0 0 2365
4100 Center J.recurva 0 0 0 0 0 0
2900 East J.recurva 0 0 0 0 0 0
3005 East J.recurva 0 0 0 0 0 5055
3020 East J.recurva 0 3 3 21 33 1440
3140 East J.recurva 0 2 5 10 19 154
3260 East J.recurva 0 1 1 3 9 374
3380 East J.recurva 0 0 0 0 0 943
3500 East J.recurva 0 0 0 0 0 1022
3620 East J.recurva 0 0 0 0 0 1018
3740 East J.recurva 0 0 0 0 0 1239
3860 East J.recurva 0 0 0 0 0 1266
3980 East J.recurva 0 0 0 0 0 1623
4100 East J.recurva 0 0 0 0 0 0
2900 East J.recurva 0 0 0 0 0 0
3005 East J.recurva 0 0 0 0 0 5135
3020 East J.recurva 0 0 0 0 0 1400
3140 East J.recurva 1 10 11 32 34 370
3260 East J.recurva 0 1 1 16 10 390
3380 East J.recurva 0 0 0 0 0 962
3500 East J.recurva 0 0 0 0 0 1084
3620 East J.recurva 0 0 0 0 0 972
3740 East J.recurva 0 0 0 0 0 1370
3860 East J.recurva 0 0 0 0 0 1249
3980 East J.recurva 0 0 0 0 0 1664
4100 East J.recurva 0 0 0 0 0 0
2900 West J.squamata 0 0 0 0 0 0
2995 West J.squamata 0 0 0 0 0 661
3020 West J.squamata 0 0 0 0 0 697
3140 West J.squamata 0 0 0 0 0 406
3260 West J.squamata 0 0 0 0 0 608
3380 West J.squamata 0 0 0 0 0 959
3500 West J.squamata 0 0 0 0 0 1240
3620 West J.squamata 0 0 0 0 0 1480
3740 West J.squamata 0 0 0 0 0 1719
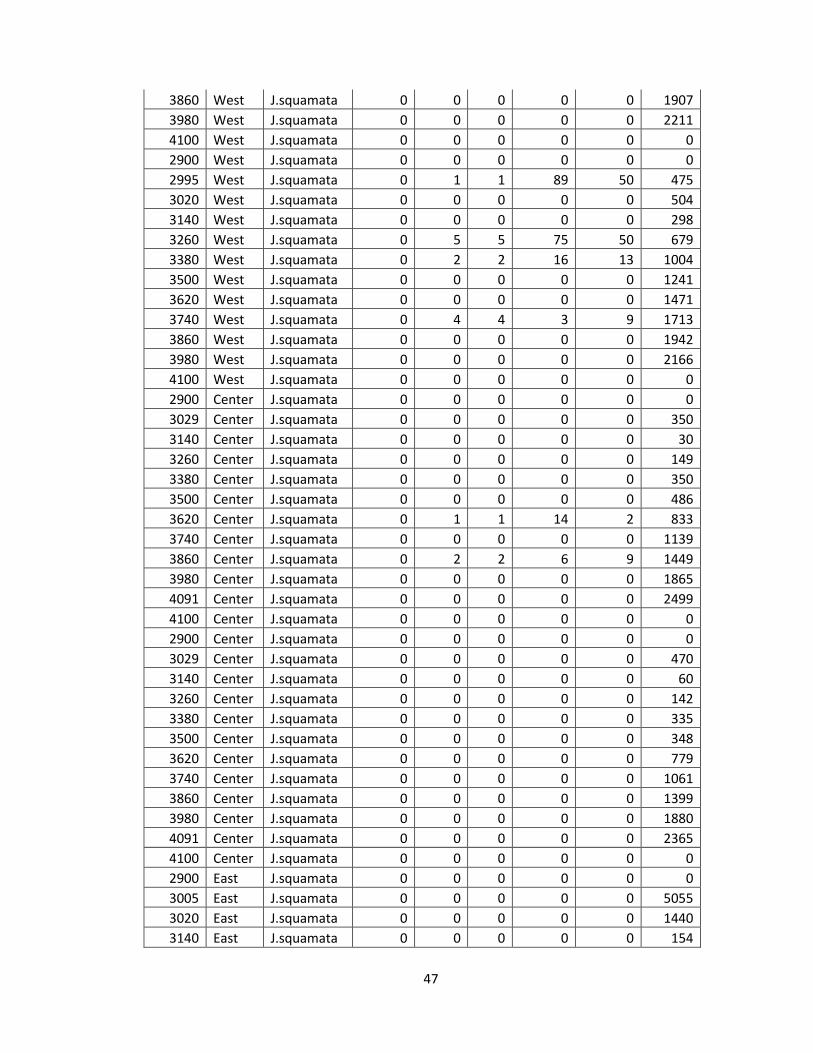
47
3860 West J.squamata 0 0 0 0 0 1907
3980 West J.squamata 0 0 0 0 0 2211
4100 West J.squamata 0 0 0 0 0 0
2900 West J.squamata 0 0 0 0 0 0
2995 West J.squamata 0 1 1 89 50 475
3020 West J.squamata 0 0 0 0 0 504
3140 West J.squamata 0 0 0 0 0 298
3260 West J.squamata 0 5 5 75 50 679
3380 West J.squamata 0 2 2 16 13 1004
3500 West J.squamata 0 0 0 0 0 1241
3620 West J.squamata 0 0 0 0 0 1471
3740 West J.squamata 0 4 4 3 9 1713
3860 West J.squamata 0 0 0 0 0 1942
3980 West J.squamata 0 0 0 0 0 2166
4100 West J.squamata 0 0 0 0 0 0
2900 Center J.squamata 0 0 0 0 0 0
3029 Center J.squamata 0 0 0 0 0 350
3140 Center J.squamata 0 0 0 0 0 30
3260 Center J.squamata 0 0 0 0 0 149
3380 Center J.squamata 0 0 0 0 0 350
3500 Center J.squamata 0 0 0 0 0 486
3620 Center J.squamata 0 1 1 14 2 833
3740 Center J.squamata 0 0 0 0 0 1139
3860 Center J.squamata 0 2 2 6 9 1449
3980 Center J.squamata 0 0 0 0 0 1865
4091 Center J.squamata 0 0 0 0 0 2499
4100 Center J.squamata 0 0 0 0 0 0
2900 Center J.squamata 0 0 0 0 0 0
3029 Center J.squamata 0 0 0 0 0 470
3140 Center J.squamata 0 0 0 0 0 60
3260 Center J.squamata 0 0 0 0 0 142
3380 Center J.squamata 0 0 0 0 0 335
3500 Center J.squamata 0 0 0 0 0 348
3620 Center J.squamata 0 0 0 0 0 779
3740 Center J.squamata 0 0 0 0 0 1061
3860 Center J.squamata 0 0 0 0 0 1399
3980 Center J.squamata 0 0 0 0 0 1880
4091 Center J.squamata 0 0 0 0 0 2365
4100 Center J.squamata 0 0 0 0 0 0
2900 East J.squamata 0 0 0 0 0 0
3005 East J.squamata 0 0 0 0 0 5055
3020 East J.squamata 0 0 0 0 0 1440
3140 East J.squamata 0 0 0 0 0 154

48
3260 East J.squamata 0 0 0 0 0 374
3380 East J.squamata 0 0 0 0 0 943
3500 East J.squamata 0 0 0 0 0 1022
3620 East J.squamata 0 0 0 0 0 1018
3740 East J.squamata 0 0 0 0 0 1239
3860 East J.squamata 0 0 0 0 0 1266
3980 East J.squamata 0 0 0 0 0 1623
4100 East J.squamata 0 0 0 0 0 0
2900 East J.squamata 0 0 0 0 0 0
3005 East J.squamata 0 0 0 0 0 5135
3020 East J.squamata 0 0 0 0 0 1400
3140 East J.squamata 0 0 0 0 0 370
3260 East J.squamata 0 0 0 0 0 390
3380 East J.squamata 0 0 0 0 0 962
3500 East J.squamata 0 0 0 0 0 1084
3620 East J.squamata 0 0 0 0 0 972
3740 East J.squamata 6 2 8 23 53 1370
3860 East J.squamata 0 0 0 0 0 1249
3980 East J.squamata 0 0 0 0 0 1664
4100 East J.squamata 0 0 0 0 0 0