estimating the environmental impact of textiles: …
TRANSCRIPT

ESTIMATING THE ENVIRONMENTAL IMPACT OF TEXTILES: MULTI-METHOD ENVIRONMENTAL ASSESSMENT
OF TEXTILE PRODUCTS AND PROCESSING.
Maddalena Ripa Silvio Viglia

Outline
1. Environmental Assessment
2. Methods: Life Cycle Assessment
3. Methods: Emergy Accounting
4. Textiles case studies

A Problem - Us All studies clearly identify human activity as a primary cause of the Earth
System Crisis
The 20th Century has seen exponential growth in human populations, made possible by the industrial-scale exploitation of natural resources and services
The globalised industrial economy is committed to continuing growth in production and consumption
Growth demands ever-increasing energy and resource inputs
Growth results in increasing levels of pollution, resource depletion, species loss and ecosystem degradation: increasing GDPs at the expenses of the Commons.

“…our economy is killing the Earth”
“This is the logic of free-market capitalism: the economy must grow continuously or face an unpalatable collapse. With the environmental situation reaching crisis point, however, it is time to stop pretending that mindlessly chasing economic growth is compatible with sustainability. Figuring out an alternative to this doomed model is now a priority..”
From Why politicians dare not limit economic growthby Tim Jackson, pp. 42-3.
New Scientist, 16 October 2008

Empty and Full World
(Herman Daly, 1973)

What Can the Earth Handle?
The physical volume of throughput, the flow of matter-energy from the environment as raw materials and back to the environment as wastes

Life is complex…

Away from unidimensional indicators:
Performance assessment based on one parameter only is never sufficient for informed and wisechoices
Trade-offs:
* not everything that is technologically feasible is also environmental friendly, but
* not everything that is environmental friendly is also economically profitable in the short term, but
* not everything that is economical is also acceptable by local populations.
Local-Global issue: improved local performances by displacing environmental burdenssomewhere else

Life cycle thinking

LCA: what is it?
S i n gl e S ta g e o r U n it O p er a t i on
E n e rg y
W a ste
P r im a ry P r o d u c t
P r o d u c t M a te ria l I n p u ts ( in c lu d in g r eu s e & re cy cl e f ro m a n o th e r s ta g e)
R e u s e / R e cy cl e
R e u s e / R e cy cl e
U s e fu l C o -p r od u ctF u g it iv e & U n tr e a te d W a s te
P r oc es s M a te ri a ls , R e a g e n ts , S o lv e n ts & C a ta ly s ts ( in c lu d in g r eu s e & re cy cl e f ro m a n o th er s ta g e )
Example of a LCA scheme (US-EPA, 1992)

LCA: what is it?LCA is a technique for assessing the environmental aspects and potentialimpacts associated with a process/product
•Started by SETAC (Society of Environmental Toxicology and Chemistry) in the 90’s;
• Standardized through International Environmental Management Standards ISO 14040/2006 and ISO 14044/2006;
• Promoted by US EPA for “application across the public and private sectors” (LCA_101, 2006);
• Accepted as European Union standard through the ILCD Handbook (International Life Cycle Database, 2010). First steps of LCSA - LifeCycle Sustainability Assessment.

Life Cycle Assessment
RemanufactureRecycle
Reuse
Material Extraction Processing Component
FabricationProduct
AssemblyPackaging & Distribution Use End of Use
Processing
WasteTreatment

What Can LCA Do?• Highlight value chain efficiency opportunities
• Promote understanding of product manufacture and delivery systems
• Identify areas in value chain that need improvement
• Ensure that changes do not “shift the burden”
• Highlights trade offs
• Compare two systems that deliver same service
• Benchmark progress
• Provide footprinting data
• Support environmental claims

What is Life Cycle Assessment?

What Makes Up LCA Goal & Scope Definition
What is the purpose of the LCA and who is the audience?
Inventory Analysis (LCI)
1. What is the function & functional unit?
2. Where are the boundaries?
3. What data do you need?
4. What assumptions are you making?
5. Are there any limitations?
Impact Assessment (LCIA)
What are the environmental, social, and economic affects?
Interpretation
Ways to reduce environmental impacts.
What conclusions can you draw from the study?
What recommendations can be made?

Step 1. Goal &Scope Definition
Define the goal:
Intended application of the study
Intended audience
Define the scope:
Identify the product system to be studied
Define the functional unit
Define the boundaries of the product system
Identify assumptions and limitations of the study
Select impact categories to be included

Step 2: Life Cycle Inventory
Inputs
What is needed to make the substance!
1. Energy
2. Materials
3. Labor
Outputs
What comes out of the system!
1. Products (electricity, materials, goods, services)
2. Waste
3. Emissions
4. Co-products

Life Cycle Inventory
NOxSOx
PesticidesHeavy metals
CO2VOCs
ParticulatesChemicals
Impact Categories
Concentration in air, water, foodConcentration
greenhouse gasesChanged pH and
nutrient availabilityChange in habitat
Fossil fuel availability
Category Indicators
Local effects on species
Climate changeOzone layer
depletionRadiation
Respiratory effectsCancer cases and
typesSurplus energy
Damage Categories
Single Score Indicator
Fate analysisExposure & effect
analysisDamage analysis
Normalization & weighting
Mineral & Fossil Resources
Ecosystem Quality
Human Health
Step 3. Life Cycle Impact Assessment
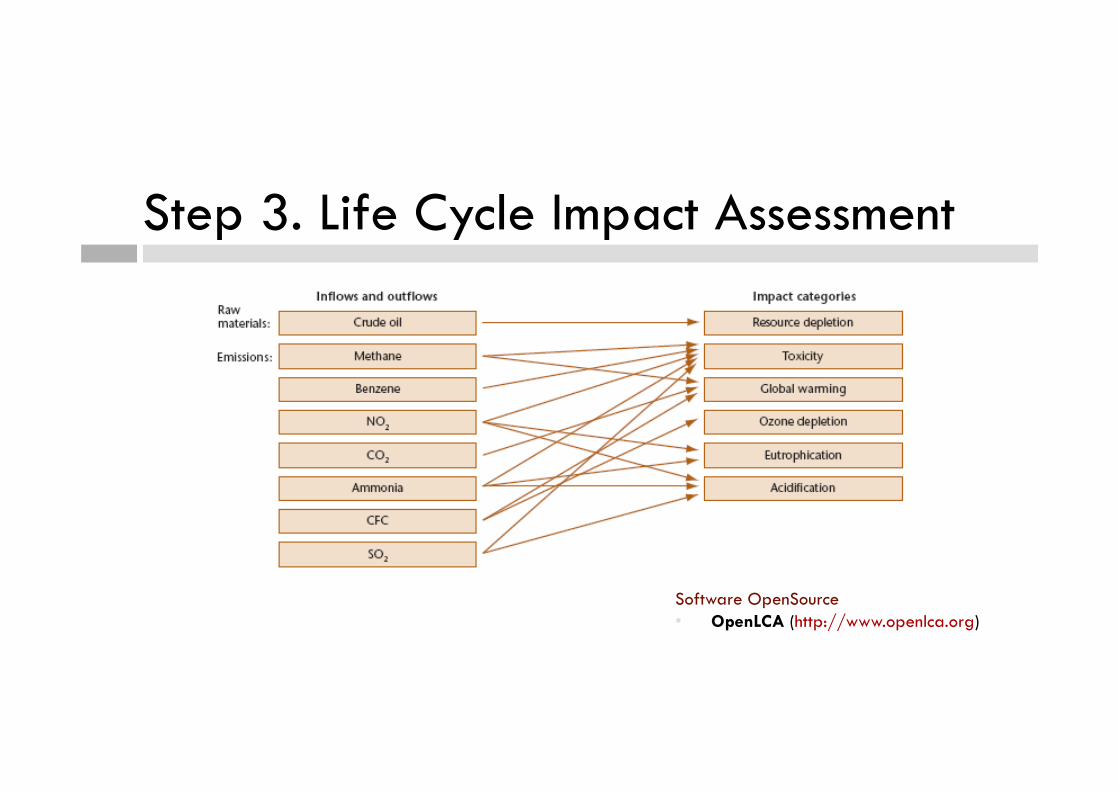
Step 3. Life Cycle Impact Assessment
Software OpenSource• OpenLCA (http://www.openlca.org)

Resource depletion
Green houseeffect
Depletion ofozone layer
• Source: Use of copper, zinc, oil etc.• Effect: Reduction of possibilities for future generations
• Source: Combustion (transport, energy etc.)• Effect: Increase in temperature, desert formation etc.
• Source: CFC and HCFC from foam and coolants• Effect: UV radiation, skin cancer etc.
Global Impact Categories
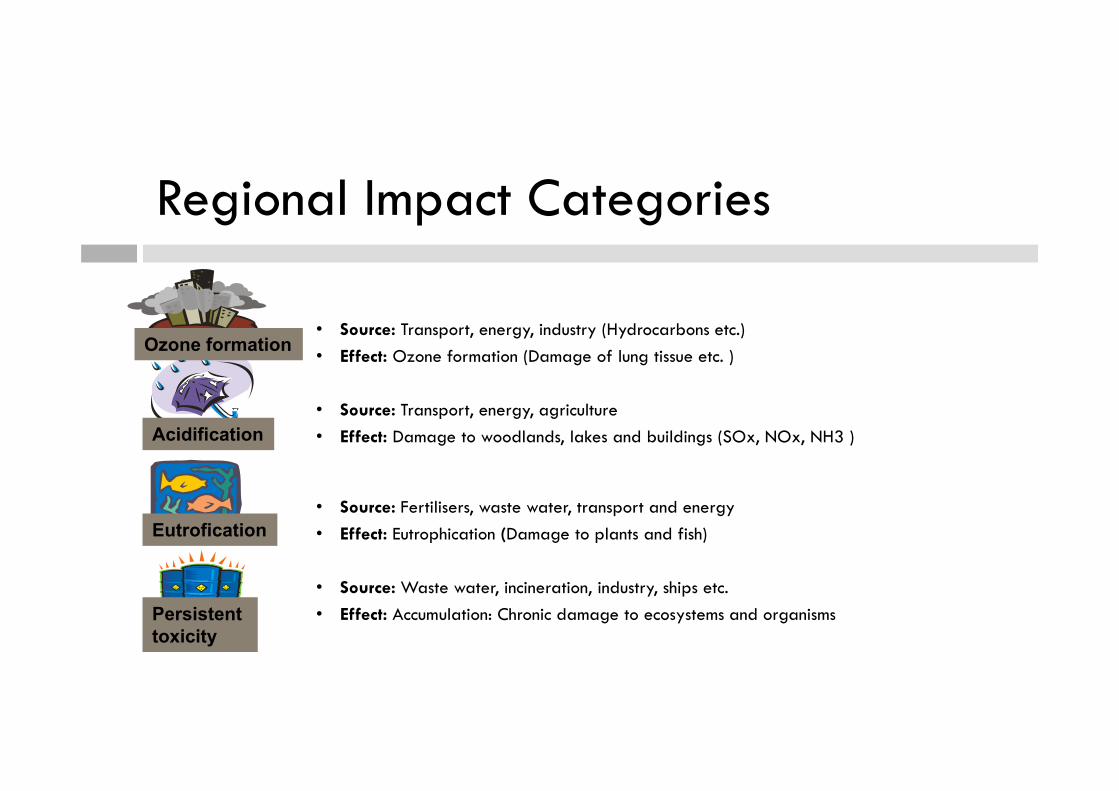
Regional Impact Categories
Persistent toxicity
Acidification
Ozone formation
Eutrofication
• Source: Transport, energy, industry (Hydrocarbons etc.)• Effect: Ozone formation (Damage of lung tissue etc. )
• Source: Transport, energy, agriculture• Effect: Damage to woodlands, lakes and buildings (SOx, NOx, NH3 )
• Source: Fertilisers, waste water, transport and energy• Effect: Eutrophication (Damage to plants and fish)
• Source: Waste water, incineration, industry, ships etc. • Effect: Accumulation: Chronic damage to ecosystems and organisms

Today’s Example: some facts about cottono It can take more than 20,000 litres of water to produce 1kg of cotton, equivalent to a single
T-shirt and pair of jeans
o 2.4% of the world’s crop land is planted with cotton
o it accounts for 24% and 11% of the global sales of insecticide and pesticides
o Unsustainable cotton farming, with massive inputs of water and pesticides, has already beenresponsible for the destruction of large-scale ecosystems such as the Aral Sea in central Asiaand the deteriorating health and livelihoods of people living there
(WWF report: The Impact of Cotton on Freshwater Resources and Ecosystems)

Today’s Example You own a store and you are curious which type of t-shirt has the lowest
environmental impact. In order to quantify and compare the t-shirt options, astreamlined LCA is performed.
Goal:
Determine which t-shirt has
the lowest environmental impact
Worldwatch Institute, Worldwatch Paper 166: Purchasing Power: Harnessing Institutional Procurement for People and the Planet, July 2003, www.worldwatch.org

Today’s Example
Worldwatch Institute, Worldwatch Paper 166: Purchasing Power: Harnessing Institutional Procurement for People and the Planet, July 2003, www.worldwatch.org
Cotton Polyester

Draw the System Boundaries
Fiberproduction
Textileproduction
Wet treatment
Disposal / Reuse
Repair / renewal
Customer
Productmanufact.
Henrik GrüttnerEnvironmental communication in the textile supply chainsDanish EPA project on environmental aspects in purchase of textiles for professional purchaserswww.emsc.ch/cost628/Bucharest_HG.ppt

Fibreproduction
Textileproduction
Productmanufact.
Disposal (or reuse)
Textile service
Cotton growing Spinning, Sizing,
Weaving …
Desizing, Bleaching,
Dyeing …
Cutting,
Sewing
Laundering
Distribution
Incineration of waste
Chemicals Pesticides,
fertilisers,
defoliants
Size, spinning oil Desizing agent, dyes
etc.
Detergents and
other chemicals
Resources Water Water Water Water
Energy Energy Energy Energy Energy recovery?
Emissions - from energy use - from energy use - from energy use - from energy use - from incineration
Wastewater Wastewater
Waste Fibre residues/
linters
Sludge, etc. Fabric waste (Used textiles) Ash
Wet treatment
Life Cycle Inventory

Cotton Textile
Carbon Footprint: 3.3 kg CO2 eq./kg cotton

Polyester Textile
Carbon Footprint: 20 kg CO2 eq./kg polyester

Polyester vs Cotton T-shirt
Carbon Footprint:
Cotton: 4 kg CO2 eq./t-shirt
Polyester: 5 kg CO2 eq./t-shirt

Cotton T-shirt Life Cycle
96% oftotal impact(277 kg CO2 eq)

What is the ‘value’ of a t-shirt?

Money as Value
The amount of money that we pay for some product is an indication of how much we valuethat product, economists say
If we buy an expensive car, then it must have great value to us
I love my car!
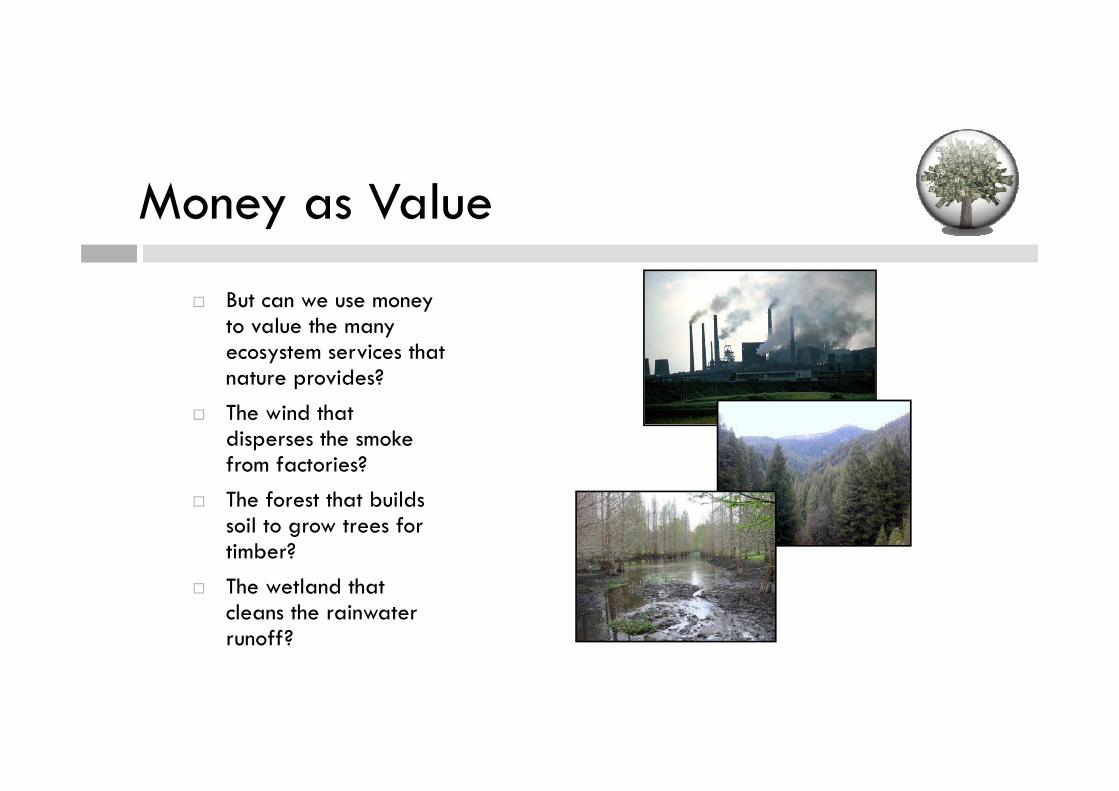
Money as Value
But can we use money to value the many ecosystem services that nature provides?
The wind that disperses the smoke from factories?
The forest that builds soil to grow trees for timber?
The wetland that cleans the rainwater runoff?

Money as Value The potential energy in
streams? For a farmer, that energy is
of great value The farmer uses that energy
to spread water on his crops Nature provides products
and services for “free” Money is NOT paid to nature
for those services
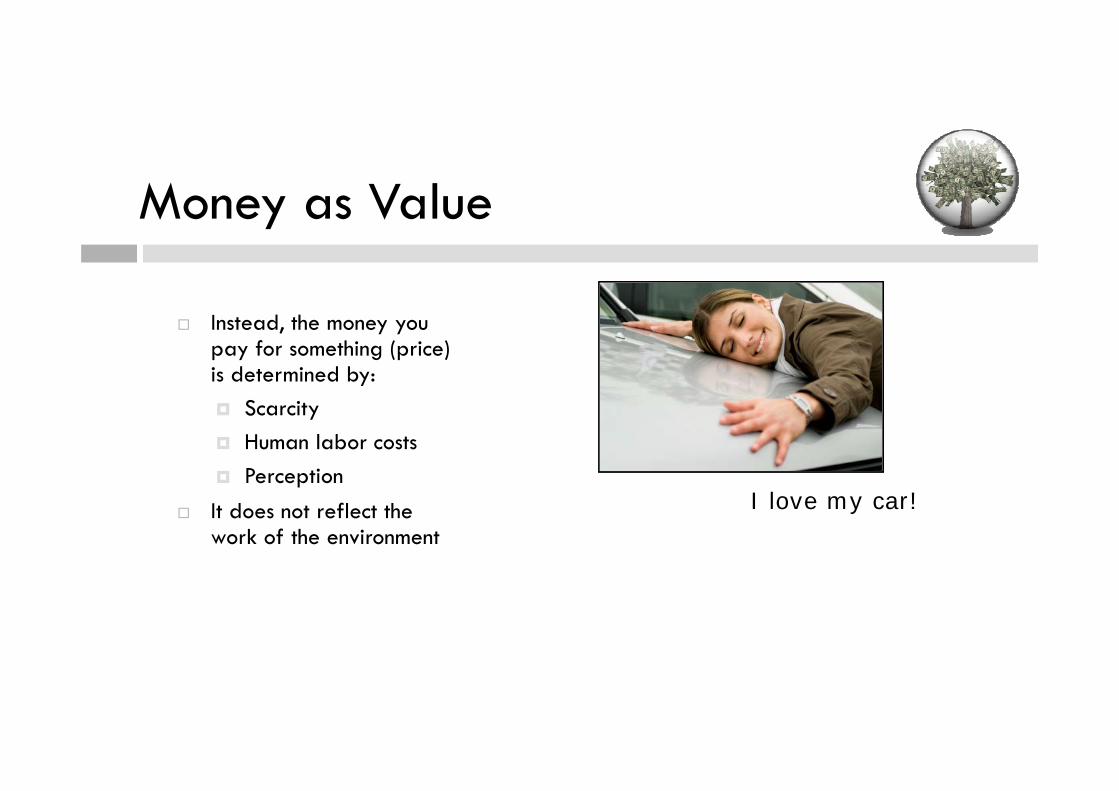
Money as Value
Instead, the money you pay for something (price) is determined by: Scarcity Human labor costs Perception
It does not reflect the work of the environment
I love my car!
Ecological-Economics
Can we find another way, besides money, to show how much we value something?
There have been several attempts to create a new kind of currency, one that can value the work of nature
Together these methods are called ecological-economics

Ecological-Economics
One popular approach is to use energy instead of money
A stream could be valued by its potential energy

Ecological-Economics
But is one joule or calorie of stream energy equal to one joule of nuclear energy?
How about one joule of sunlight energy?

Ecological-Economics
How about one joule of energy in jet fuel?
Or one joule of energy in the burning of a log?

Ecological-Economics
How about one joule of energy in the sound waves of a speech by U.S. President Obama

Ecological-Economics
Obviously a joule of sunlight can do work
But can it do as much work as a joule of electricity produced in a nuclear power plant and delivered to your house to run your computer to do your homework?

Ecological-Economics
With 1 million joules of electricity you get…
One hour of computer use, or…
One hour of sunlight on this small garden
Are they equivalent?

Energy Quality
Many researchers believe that they are not equivalent, for two reasons: They argue that energy
forms differ in their ability to cause work
Which is directly relate to the work that went into making them
Energy Quality
Different energies are different in ‘Quality’
Energy Quality is related to… Concentration
Flexibility
Ease of transportation
Convertibility
Oil is highly concentratedin the ground, it is flexible in its many uses, it is easy to transport by pipeline or ship, and it can be converted into many forms of work

Energy Quality
By this approach, ‘information’ (like the Shakespeare play) is the highest quality energy in human society
The concept of quality required a new concept of energy, it required ‘emergy’

What is Emergy Synthesis?
Methodology for environmental accounting developed by professor H.T. Odum, from University of Florida (USA).
H.T. Odum (1924-2002)

Emergy value
User-side:Monetary measure of wealth(willingness to pay)
Rain
Sun
Donor-side:Environmental cost to produce wealth
Emergy evaluation Economic evaluation

EmergyEmergy: the total energy that it took to make any other form of energy, good, or service
The name emergy comes from….ENERGY MEMORY
Emergy values ‘remember’ all the energy work that went into making a new form of energy, good, or service

Measuring ‘Quality’ In this brand of ecological-economics, energy values
are converted to ‘emergy’ values Researchers have compiled tables of conversion
factors for hundreds of important objects The conversion factors are called ‘transformities’
Energy (J) * Transformity (seJ/J) = Emergy (seJ)

Energy quality Energy transformations generate hierarchies over
production chains similar to the well-known food chain in ecosystems:
Emergy analysis is able to recognize the energy quality of the flows of biosphere. One Joule of pasture is not equal to one Joule of meat

Typical Solar Transformities
Solar emjoules per Joule
(sej/J)Sunlight 1Plant production 6,700Wood 36,000Coal 67,000Oil 90,000Electricity 300,000
Solar transformities
Measuring ‘Quality’

Measuring ‘Quality’ With these
conversion factors, any process can now be evaluated to achieve a new measure of the product’s value

Measuring ‘Quality’
Emergy inputs to a process are simply added together to get the value of the product in the emergy currency (seJ)
Unlike energy measurements (joules, calories), with emergy (seJ) any objects can be directly compared

Energy system language It is a concise way of visualizing systems and describing
them mathematically.

Agricultural System Diagram
Agricultural System
Geothermal flow
Rain
Wind
Sun
Crop Production
Soil
O.M.
Services
Goods&
MachineryElectricityFuelsPesticidesFertilizers
N, P, K
Livestock
Manure
Labor
$
Mar ket
Groud & surface
water
Waste
Assets

Today’s Example: Emergy evaluation of cotton
Total yield, dry weight 7.38E+05 gTotal yield, energy 1.25E+10 J
Emergy per mass 2.31E+10 seJ/gTransformity 1.36E+06 seJ/J
Empower density 1.71E+16 seJ/ha/yr
Note Item Inputs ha-1 yr-1 Unit Emergy value1Sun 6.35E+13 J 5.00E+13
2Evapotranspiration 5.80E+10 J 1.50E+15
3Net topsoil loss 8.23E+10 J 1.02E+16
4Fuel 9.70E+09 J 1.08E+15
5Electricity 3.15E+08 J 8.00E+13
6Potash 7.44E+04 gK 1.40E+14
7Lime 5.65E+05 g 9.50E+14
8Pesticides 4.97E+03 g 1.30E+14
9Phosphate 1.58E+04 gP 5.80E+14
10Nitrogen 1.90E+04 gN 7.72E+15
11Labor 8.90E+07 J 4.00E+14
12Services 4.07E+02 $ 1.23E+15
TOTAL EMERGY 2.40E+16
Brandt-Williams, S. 2002. Handbook of Emergy Evaluation Folio 4: Emergy of Florida Agriculture. Center for Environmental Policy, University of Florida, Gainesville. 40 pages.

Cotton vs other crops

Cotton vs other crops

Emergy indicators
Emergy Investment Ratio = F/(R+N)Environmental Loading Ratio = (F+N)/REmpower density = (R+N+F)/area

Multimethod evaluation Emergy analysis is likely to be used in parallel with other methods:
LCA; Energy analysis; Economic evaluations; Ecological footprint;
Emergy is a donor side evaluation: It evaluates the appropriate use of resources; LCA focuses on the impact of emissions;

LCA vs Emergy Accounting

LCA vs Emergy AccountingGeneral overview
Analitical user-side approach
Holistic donor-side approach
Process-scale Biosphere-scale
Biophysical dimension (‘cradle to grave’)
Biophysical, Socio-economic and Temporal
dimension
Material, energetic and emission indicators FU-
based
Performance process-based indicators (UEV,
EYR, ELR, ESI)
Renewable energies under human control
(CED)
Renewable energies driving the biosphere

LCA + EMA: the added value of integration
LCA provides:•a standardization attitude with a large set of cases already investigated;•a clear assessment of boundaries and specific goals to be achieved.
EMA provides:•an additional impact category but more comprehensive;•a value perspective linked to the supply side chain;•a non-anthropocentric perspective•inclusion of labor and services.

Thank you for your attention!
Department of Science and TechnologyParthenope University of Naples
