estimating barge transport costs for grain and fertilizer
TRANSCRIPT
RESEARCH BULLETIN 1029 JUNE, 1978
UNIVERSITY OF MISSOURI-COLUMBIA COLLEGE OF AGRICULTURE
AGRICULTURAL EXPERIMENT STATION ELMER R. KIEHL, DIRECTOR
Estimating Barge Transport Costs for Grain and Fertilizer
DAVID E. MOSER AND MICHAEL W. WOOLVERTON
NORTH CENTRAL REGIONAL RESEARCH PUBLICATION NO. 252
Agricultural Experiment Stations of Alaska, Illinois, Indiana, Iowa, Kansas, Michigan, Minnesota, Missouri , Nebraska, North Dakota, Ohio, South Dakota , and Wisconsin , and the U.S . Department of Agriculture cooperating.
(Publication authorized June, 1978)
COLU¥BIA, MISSOURI
ACKNOWLEDGMENT
Sponsored by the Agricultural Experiment Stations of the University of Illinois, Iowa State University , Kansas State University , University of Missouri, University ofNebraska, and South Dakota State University, the Upper Great Plains Transportation Institute, and the Economic Research Service and Cooperative State Research Service of the U . S. Department of Agriculture.
North Central Regional Committee for Project NC-112, "Impact of Changing Transportation Systems on Local Grain and Farm Supply Marketing Firms" .
Cooperating Agencies and Principal Leaders :
Dale G . Anderson C. Phillip Baumel Arvin R. Bunker Lowell Hill David E. Moser William F. Payne Edward Reinsel 1. D. Schnake Orlo Sorenson Robert Tosterud Lloyd Halverson Floyd W. Smith
University of Nebraska Iowa State University ERS-USDA University of Illinois University of Missouri South Dakota State University ERS-USDA ERS-USDA Kansas State University Upper Great Plains Transportation Institute CSRS USDA Kansas State University
(Administrative Advisor)
CONTENTS
Introduction . . ... . ... ... . . ..... . . .. .. ...... .. .. . . ....... ...... 4
Tariff and Negotiated Rates . .. . . . . .. ... . ... . . . . . .. .. . . ...... . . . .. 5
Rates and Cost of Services . ... .... . .. . .. .. .. . ..... . . . . . . . .... .... 9
Summary and Conclusions . ... .. . . . . .. .... . . . .... .... . .... . ..... 14
References . .. . . . ...... .. ....... . .. .... .. . .... . .... . ... . . . . . . . 15
Appendix A: Comparison of Procedures for Estimating Costs of Barging Grain on the Mississippi and Missouri Rivers .......... . . . . ....... . . ....... . .. .. . . .. . . . . 16
Appendix B: Procedures for Determining Barge Rates on Regulated Commodities . .. . . ... . . .. . ..... . . . . .. . .. . . . . ... 34
Estimating Barge Transport Costs F or Grain and Fertilizers *
DAVID E. MOSER AND MICHAEL W. WOOLVERTON
INTRODUCTION Inland waterway transportation has recently come under close scrutiny by
diverse special interest groups. Environmentalists are concerned about the impact of proposed waterway improvement projects. Legislative groups are debating waterway expenditures and sources of revenue. Competing transportation modes are examining the intermodal competitive situation. Research groups are trying to determine the role of the inland waterway transportation system in regional economic development. The barge industry itself is, with introspect, trying to present a united front to the special interest groups who would legislate against them.
Of major interest to all parties is barge cost of service . The cost information that is available is generally not detailed enough to pro,vide meaningful input for private investment and public policy decisions.
The difficulty in obtaining true cost of service information for the barge industry stems from the nature of the legislation pertaining ro the waterborne mode of transportation and the rate-setting procedure that is common practice in the industry . Barge tariffs for various commodities are published by the Waterways Freight Bureau, an organization that represents the industry before the Interstate Commerce Commission . But many dry, bulk commodities, including agricultural and energy commodities, which represent a large percentage of rotal traffic on the waterways, are exempt from rate regulation under the Interstate Commerce Act. The actual charges for these commodities are agreed upon by the shippers and barge companies in private negotiations . The only relation between actual shipping charges and published tariffs for the exempt commodities is the fact that negotiations are usually conducted in terms of percent of tariff. During periods of high demand for barge transportation services, barge space may sell for 200 percent of tariff or more. During slack periods and for special cases such as backhauls , quoted rates may be very low, since variable COStS tend ro be such a small portion of barge cost of service.
"One of rhree reporrs prepared tor publicarion under rhe responsibiliry of rhe NC 112 Publicarions Subcommicree on Transporrarion Cosrs-David E. Moser, Chairman, C. Phillip Baumel and William F. Payne. The orher rwo publicarions are Estimating Rail Transport Costs for Grain and Fertilizer. by Thomas P. Drinka , C. Phillip Baumel, and John J. Miller, and Estimating Tmrk Transport Costs for Grain and Fertilizer, by William F. Payne, C. Phillip Baumel, and David E. Moser.
RESEARCH BULLETIN 1029 5
Actual negotiated shipping charges are not systematically collected and published. Individual shippers and barge lines are reluctant to reveal what they feel is proprietary information. As a result, decision makers , public and private, have no firm basis for projecting cost of barge transportation services.
The purpose of this report is to gather into one source the available, relevant information on costs of barge movement of grain on the Mississippi and Missouri Rivers. Legislation affecting cost of service will be reviewed . Rate setting procedures used by the barge industry will be examined . The main body of the report will be devoted to a discussion of the methodologies various researchers have used in attempting to synthesize barge cost of service, and to a presentation of their results.
The report should be a useful reference for researchers analyzing various economic issues dealing with inland water transportation. It should also serve to
pinpoint areas requiring further research .
Tariff and Negotiated Rates
Conditions for Exemptions
Regulation of water freight transportation began in 1940 as pMt of the Interstate Commerce Act. Dry, bulk commodities were exempted from the provisions of the Act , provided: the commodity was being carried in bulk by waterway carriers before June 1, 19.39; and no more than three different exempt dry bulk commodities were carried in tow. l:l A third condition to qualify cargo for exemption resulted from action by the Interstate Commerce Commission and subsequent court decisions. That condition was that exempt, dry, bulk commodities were not to be mixed with regulated cargo in the same tow.
The first twO conditions presented no serious problems to waterway carriers in their day-to-day operations. The third condition which specified no mixing of unregulated and regulated cargo was suspended during World War II to conserve fuel. Despite some recent legislative eftorts to reinstate enforcement of the no-mixing rule, at this writing there are no restrictions on mixing of regulated and unregulated commodities in a single tow .
As a result of this legislative history a large portion of the total traffic moving on the inland waterway system is exempt from rate regulation under the Interstate Commerce Act. In its 1973 report to Congress titled "The Barge Mixing Rule Problem" the United States Department of Transportation estimated that exempt commodity carriage represented more than 60 percent of all tonnage moved by a large sample of carriers on the Mississippi River System and Gulf Intracoastal Waterway in 1970. 13 Grain, specifically, moves in large volume on the waterways and most of it qualifies for exempt shipment. Nearly 90 percent of the 30 million tons of grain shipped by barge yearly fulfills the conditions for exempt status.

6 MISSOURI AGRICULTURAL EXPERIMENT STATION
Tariff History
Tariffs applicable to the barge movement of regulated commodities are issued by the Waterways Freight Bureau, with headquarters in WashingtOn, D .C. Nearly all firms actively engaged in providing inland waterborne transportation services are members. The Bureau acts as agent for its member carriers and represents them in Interstate Commerce Commission proceedings. Freight Tariff 8-C of the Waterways Freight Bureau is the Tariff currently in effect, applying to non-exempt barge movement of a wide range of commodities.
For a brief review of economic theory relating co determination of transportation rates and a discussion of the procedures followed in establishing rates for barge movement of regulated commodities, the reader is referred to
Appendix B of this report . A tariff applying to the exempt barge movement of grain was also in effect
until cancelled in February, 1976. Barge Load Bulk Grain TarriffNo. 7, issued by the Waterway Freight Bureau on May 17, 1968, and its last supplement , which became effective September 30, 1974, served as the standard by which shipping rates for grain were set . Actual rates, at a premium or a discount to the rates appearing in the Tariff, were negotiated by shipper and carrier. The Waterway Freight Bureau apparently cancelled Tariff No. 7 because of a Justice Department investigation into the Bureau's authority under the Interstate Commerce Act to issue a tariff for the transportation of a commodity supposedly exempt from the jurisdiction of the Interstate Commerce Commission. 13
In addition to listing rates for barge shipment of grain, Tariff No. 7 specified other provisions of carriage such as conditions of loading, liability, and routing. Transit privileges and demurrage charges were also spelled out in the Tariff. At times some of these factors, demurrage for example, would be applied on a selective basis depending upon demand for barges and relationships with individual grain firms . However, for the most part, the conditions of carriage were adhered to by carriers, resulting in even-handed treatment of shippers and a consistent base for rate negotiation .
Even though it has officially been cancelled, Tariff No . 7 is still used by shippers and carriers as a base for rate negotiation. It is becoming less important as a base as time goes by because costs have increased since the publication of Supplement 76 in September, 1974. Individual barge lines are taking steps to
update Tariff No. 7 by distributing their own rate schedules to their customers. The rate schedules vary from firm to firm, which places an additional burden on grain shippers to compare closely before starting rate negotiations.
Rate Negotiations
Rate negotiations between shipper and carrier for exempt commodities take t~o forms : long term contract rates, and single shipment or SpOt rates . Long term contracts are becoming more common for the shipment of grain. Nearly
RESEARCH BULLETIN 1029 7
all contracts for shipment of other exempt commodities such as coal and fertilizer are made on a yearly basis.
An inquiry by a grain shipper to a particular barge line will result in a rate quoted as a discount or premium of the tariff rate for grain . The shipper will accept the rate quoted , contact another carrier to find a lower rate, or make a counter offer.
Many different factors enter into the bargaining process. Special services required by the shipper or offered by the carrier affect the negotiated rate. The availability of barges, towboats, and backhauls affect the position of the carrier . Demand for barge space by other shippers of grain, availability of alternative modes of transportation, and urgency of the need to move grain affects the shipper's bargaining position. Other factors that affect negotiated rates include time of year, water conditions on the rivers, and waiting time at locks and terminals.
Actual negotiated rates are difficult to obtain . One can understand the reluctance of both shipper and carrier to reveal negotiated rates since the rates reflect bargaining positions and skill, and may include concessions on noneconomic considerations .
Several recent studies have reported actual negotiated barge rates. None of the studies stated whether the rates reported were long term contract rates or single shipment rates . They are presumed to be single shipment rates. In two of the three studies, rates were obtained voluntarily with promise of strict anonymity. The third study was undertaken by the Department of Transportation to fulfill the provisions of an Act of Congress. Their survey was conducted with the power of subpoena but measures were taken to insure confidentiality of the carriers involved in the study. 13 Table 1 shows the actual rates compared to the published tariff rate in effect at the time the studies were conducted.
As indicated in Table 1, actual rates can fluctuate over a wide range . All of the studies were conducted in the early 1970s. Increased grain exports, erratic river conditions, increased waiting time at locks, and congestion at export terminals in the last few years have caused rates to fluctuate even more than indicated in Table 1; however, more recent data are unavailable in published form.
Compulsory reporting and publication of negotiated, actual barge rates has been proposed and has received considerable support from various shippers and railroad groups. Arguments for rate publication are based on claims that this would bring about increased economic efficiency, reduction of price discrimination, and improved intermodal and intramodal equity Y Proponents of compulsory publication maintain that public knowledge of rates would create an environment in the barge industry as close to perfect competition as possible and therefore would improve economic efficiency. Publishing rates would decrease the likelihood of anyone shipper or region being subjected to prejudice or disadvantage through unfair price discrimination. Rates which were common
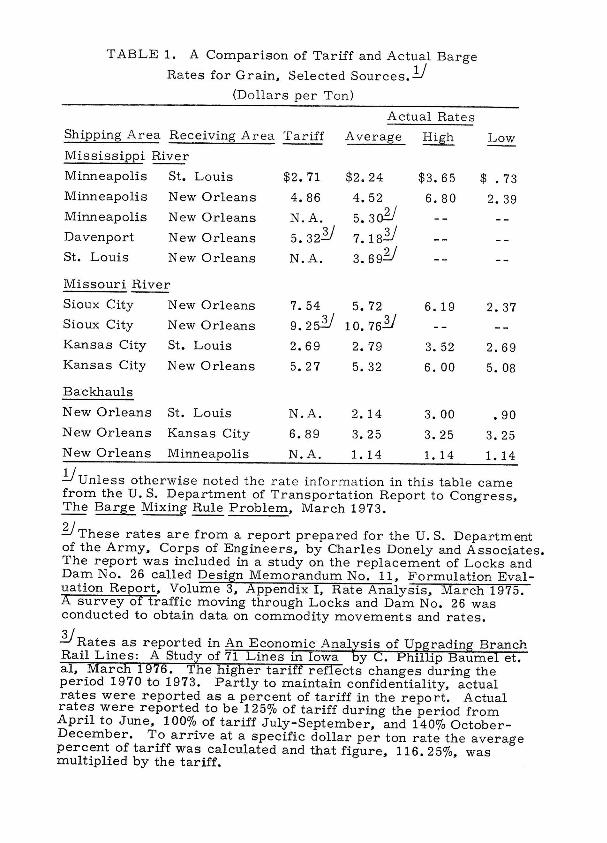
TABLE 1. A Comparison of Tariff and Actual Barge
Rates for Grain, Selected Sources. Y (Do llars per Ton)
Actual Rate s
Shipping A rea Receiving Ar ea Tariff A verage High Low
Mississippi River
Minneapolis St. Louis
Minneapolis
Minneapolis
Davenport
St. Louis
New Orleans
New Orleans
New Orleans
New Orleans
Missouri River
Sioux City New Orleans
Sioux City New Orleans
Kansas City St. Louis
Kansas City New 0 rleans
Backhauls
New Orleans St. Louis
New Orleans Kansas City
$2.71
4.86
N.A.
5. 32'2J N.A.
$2.24
4.52
5. 3 o'!:J 7. 18'2J 3.69Y
7.54 5.72
9. 25'2J 10.763.1
2.69 2.79
5.27 5.32
N.A.
6.89
2.14
3.25
$ 3.65
6.80
6.19
3.52
6.00
3.00
3.25
$ .73
2.39
2.37
2.69
5.08
.90
3.25
New Orleans Minneapolis N. A. 1. 14 1. 14 1. 14
YUnless otherwise noted the rat e informa tion in this table came from the U. S. Department of Transportation Report to Congress, The Barge Mixing Rule Problem, March 1973.
Y These rates are from a report prepared for the U. S. Department of the Army, Corps of Engineers, by Charles Donely and Associates. The report was included in a study on the replacement of Locks and Dam No. 26 called Design Memorandum No. 11, Formulation Evaluation Report, Volume 3, Appendix I, Rate Analysis, March 1975. A survey of traffic moving through Locks and Dam No. 26 was conducted to obtain data on commodity movements and rates.
3.1 Rates as reported in An Economic Anal?)SiS of Upgrading Branch Rail Lines: A Study of 71 Lines in Iowa y C. Phillip Baumel eta aI, March 1976. The higher tariff reflects changes during the period 1970 to 1973. Partly to maintain confidentiality, actual rates were reported as a percent of tariff in the report. Actual rates were reported to be 1250/0 of tariff during the period from April to June, 100% of tariff July-September, and 1400/0 OctoberDecember. To arrive at a specific dollar per ton rate the average percent of tariff was calculated and that figure, 116.250/0, was multiplied by the tariff.
RESEARCH BULLETIN 1029 9
knowledge would allow other barge firms and competitive modes, railroads in particular, to compete more effectively .
The U .S. Department of Transportation in its report to Cong ress, The Barge Mixing Rule, 13 considered these arguments and advised against requiring publication of negotiated rates in the barge transportation of grai n. Their recommendation to Congress was as follows:
" Rate publication for exempr water carriage of grain would destroy the flexibility required between grain merchandisers on the one hand, and barge operators on the other to make on-the-spor contracts and match avai lable supply with demand at mutually agreeable transportation rates . Such flexibility permits prompt and efficient response to the vagaries of farm production, weather, and market demands."13
Rates and Cost of Services
To determine the long run viability of the barge industry it is necessary to compare actual rates charged for shipments and the costs incurred by the carriers in providing the service. If barge carriers are able to negotiate rates which allow them reasonable profits the survivability of the industry seems assured on an economic basis.
Research for this publication did not reveal any studies in which actual barge costs, collected from industry sources, appeared in tabulated form . Industry contacts declined to comment on actual costs, saying costs would vary so much for particular barge lines and for specific shipments that anyone cost statement would be misleading and virtually useless for analysis.
Barred access to actual cost information, researchers have had to develop cost information on their own. Some assume shipping costs to be a certain percent of the published tariff. 11 The approach taken by most researchers was to synthesize total barge shipping costs from specific elements of investment and operating costs. These included costs for equipment, maintenance, administration, and the various other outlays associated usually with the operation of a barge line. Synthesized COSts were usually developed on an hourly basis so they could be included in a computational formula along with variables which incorporated explicit or implied assumptions concerning shipment time, tonnages per barge, utilization as a percent of capacity, loaded or empty backhaul , and operating conditions . Results were expressed as a cost per ton mile or cost per ton for a specified length of haul .
Methods of Synthesizing Costs
The approach taken here will be to briefly summarize the methods used by researchers in synthesizing costs. Basic assumptions made by researchers will be discussed . Computational formulas will be presented along with results in a form that lends itself to comparison. A condensation of each study is provided in Appendix A.
10 MISSOURI AGRICULTURAL EXPERIMENT STATION
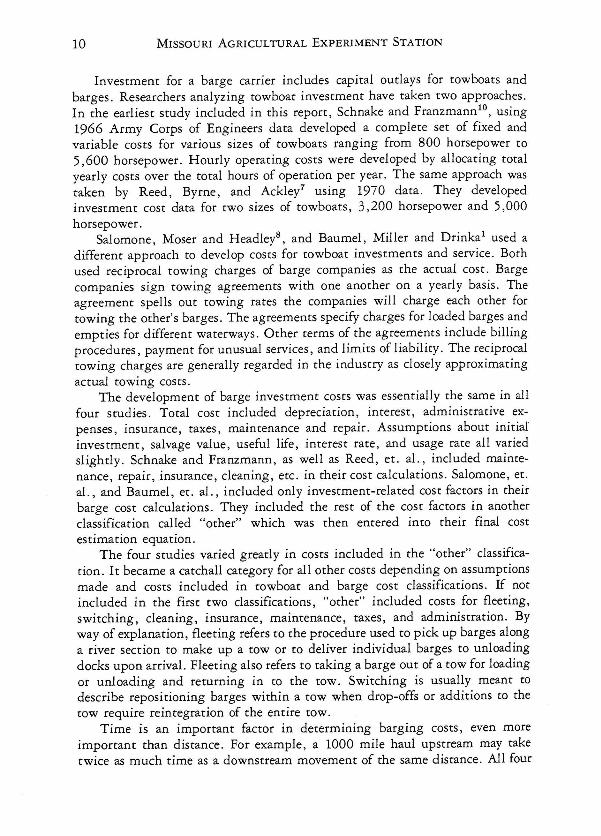
Investment for a barge carrier includes capital outlays for towboats and barges. Researchers analyzing towboat investment have taken two approaches. In the earliest study included in this report, Schnake and Franzmann10 , using 1966 Army Corps of Engineers data developed a complete set of fixed and variable costs for various sizes of towboats ranging from 800 horsepower to 5,600 horsepower. Hourly operating costS were developed by allocating total yearly costs over the total hours of operation per year. The same approach was taken by Reed, Byrne, and Ackley7 using 1970 data . They developed investment COSt data for twO sizes of towboats, 3,200 horsepower and 5,000 horsepower.
Salomone, Moser and Headley8 , and Baumel, Miller and Drinka 1 used a different approach to develop COStS for towboat investments and service. Both used reciprocal towing charges of barge companies as the actual cost. Barge companies sign towing agreements with one another on a yearly basis. The agreement spells out towing rates the companies will charge each other for towing the other's barges. The agreements specify charges for loaded barges and empties for different waterways. Other terms of the agreements include billing procedures, payment for unusual services, and limits of liability. The reciprocal towing charges are generally regarded in the industry as closely approximating actual towing costs.
The development of barge investment costs was essentially the same in all four studies . Total cost included depreciation, interest, administrative expenses, insurance, taxes, maintenance and repair. Assumptions about initial investment, salvage value, useful life, interest rate, and usage rate all varied slightly . Schnake and Franzmann, as well as Reed, et. a!., included maintenance, repair, insurance, cleaning, etc. in their cost calculations . Salomone, et. a!., and Baumel, et. al., included only investment-related cost factors in their barge COSt calculations. They included the rest of the cost factors in another classification called "other" which was then entered into their final cost estimation equation.
The four studies varied greatly in costs included in the "other" classification. It became a catchall category for all other costs depending on assumptions made and costs included in towboat and barge COSt classifications . If not included in the first twO classifications, "other" included costs for fleeting, switching, cleaning, insurance, maintenance, taxes, and administration. By way of explanation, fleeting refers to the procedure used to pick up barges along a river section to make up a tow or to deliver individual barges to unloading docks upon arrival. Fleeting also refers to taking a barge out of a tow for loading or unloading and returning in to the tow. Switching is usually meant to describe repositioning barges within a tow when drop-offs or additions to the tow require reintegration of the entire tow.
Time is an important factor in determining barging costs, even more important than distance. For example , a 1000 mile haul upstream may take twice as much time as a downstream movement of the same distance. All four
RESEARCH BULLETIN 1029 11
studies viewed all or a portion of barge COStS as a function of time. Schnake and Franzmann 10 developed the most complicated model. However, their model allowed the greatest flexibility in adjusting variables to determine the effect on barging costs . The model was as follows :
T=v+o+l where:
T = total cost per loaded barge v = voyage time cost per loaded barge o = other operating time cost per loaded barge 1 = loss and damage expense
Each of the independent variables in this model, except for one which was assigned a fixed value, was determined by another equation. Some of the factors entering into the equations included : speed of movement, backhaul percentage, number of barges in tow, waiting time, and fleeting charges. For a more complete discussion see Appendix A.
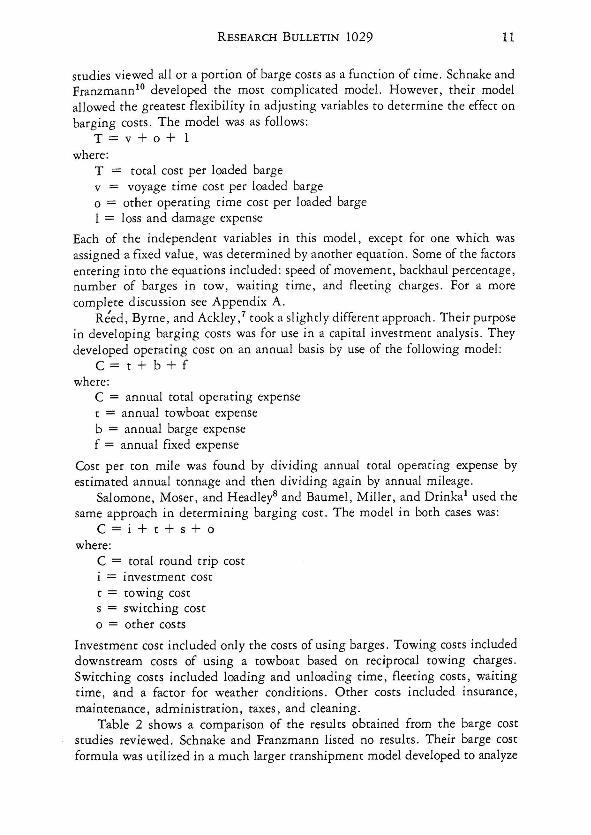
Reed, Byrne, and Ackley,1 took a slightly different approach. Their purpose in developing barging costs was for use in a capital investment analysis. They developed operating cost on an annual basis by use of the following model:
C=t+b+f where:
C = annual total operating expense t = annual towboat expense b = annual barge expense f = annual fixed expense
Cost per ton mile was found by dividing annual tOtal operating expense by estimated annual tonnage and then dividing again by annual mileage.
Salomone, Moser, and Headley8 and Baumel, Miller, and Drinka1 used the same approach in determining barging cost. The model in both cases was:
C=i+t+s+o where:
C = total round trip cost i = investment cost t = tOwing COSt s = switching cost o = other costs
Investment cOSt included only the costs of using barges . Towing costs included downstream COStS of using a tOwboat based on reciprocal tOwing charges . Switching costs included loading and unloading time, fleeting costs, waiting time, and a factor for weather conditions . Other cOSts included insurance, maintenance, administration, taxes, and cleaning.
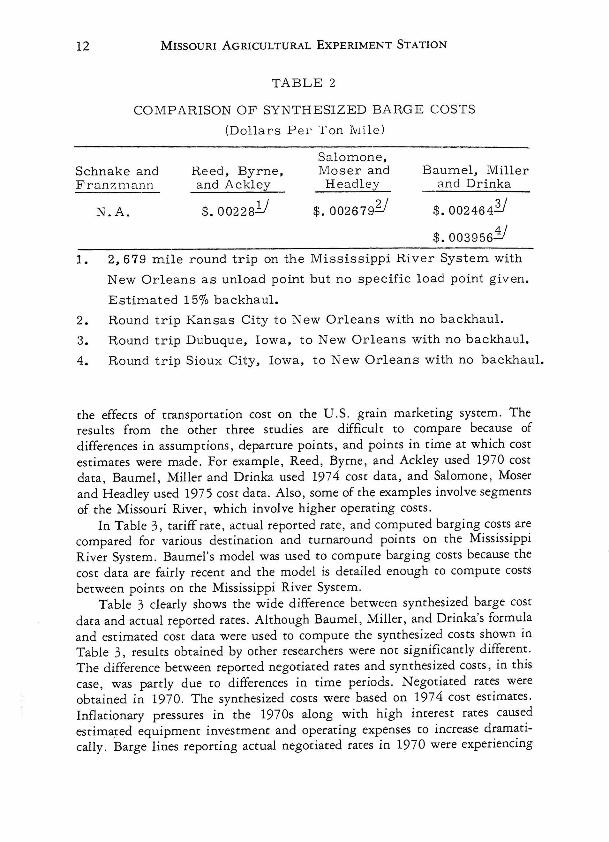
Table 2 shows a comparison of the results obtained from the barge COSt studies reviewed. Schnake and Franzmann listed no results. Their barge COSt formula was utilized in a much larger transhipment model developed to analyze
12 MISSOURI AGRICULTURAL EXPERIMENT STATION
TABLE 2
COMPARISON OF SYNTHESIZED BA RGE COSTS
(D ollars P e l' Ton lYJi l e )
Schnake and Fra n znlann
H.eed, Byrne, a nd Ackley
Sa lomone, Moser and Headl ey
Baumel, Miller a nd Drinka
N.A. $.00228.!../ $.002679?J $.002464Y $.003956.Y
1. 2,679 mile round trip on the Mississippi River System with
New Orleans as unload point but no specific load point given.
Estimated 15% backhaul.
2. Round trip Kansas City to New Orleans with no backhaul.
3. Round trip Dubuque, Iowa, to New Orleans with no backhaul.
4. Round trip Sioux City, Iowa, to New Orleans with no backhaul.
the effects of transportation cost on the U .S. grain marketing system. The results from the other three studies are difficult to compare because of differences in assumptions, departure points , and points in time at which cOSt estimates were made. For example , Reed , Byrne, and Ackley used 1970 cost data, Baumel, Miller and Drinka used 1974 cost data, and Salomone, Moser and Headley used 1975 cost data. Also, some of the examples involve segments of the Missouri River, which involve higher operating costs.
In Table 3, tariff rate, actual reported rate, and computed barging costs are compared for various destination and turnaround points on the Mississippi River System . Baumel's model was used to compute barging costs because the cost data are fairly recent and the model is detailed enough to compute costs between points on the Mississippi River System.
Table 3 clearly shows the wide difference between synthesized barge cost data and actual reported rates . Although Baumel, Miller , and Drinka's formula and estimated cost data were used to compute the synthesized COSts shown in Table 3, results obtained by other researchers were not significantly different . The difference between reported negotiated rates and synthesized costs, in this case , was pardy due to differences in time periods. Negotiated rates were obtained in 1970. The synthesized costs were based on 1974 cost estimates. Inflationary pressures in the 1970s along with high interest rates caused estimat;ed equipment investment and operating expenses to increase dramatically. Barge lines reporting actual negotiated rates in 1970 were experiencing
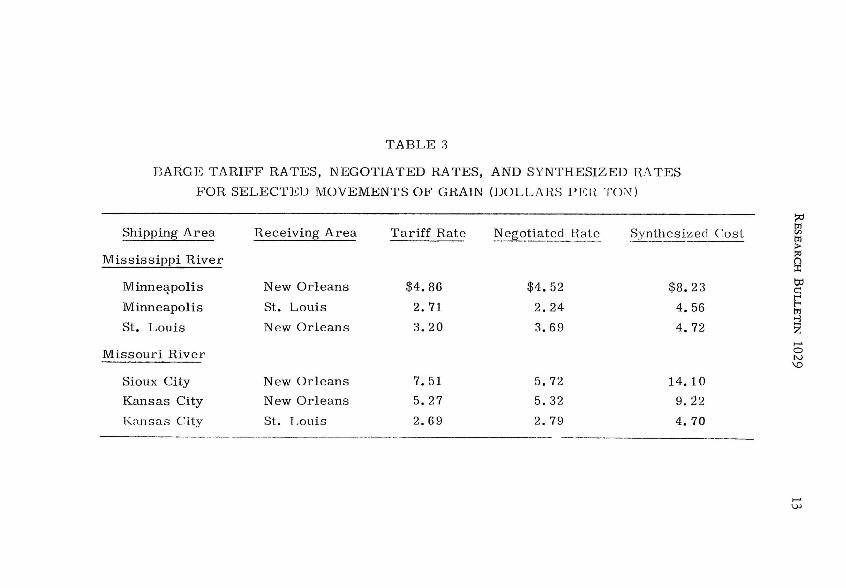
TABLE ~
BARGE TARIFF RATES, NEGOTIATED RATES, AND SYNTHESIZED R,\TES
FOR SELECTED MOVEMENTS OF GRAIN (lJOLLARS PEI~ TO;\,T)
?hipping Area Receiving Area Tariff Rate Negotiated Hat e Sy nth_esized Cost
Mississippi River
Minne~polis New Orleans $4. 86 $4. 52 $8.23
Minneapol is St . Louis 2.71 2. 24 4.56
St . Louis New Orleans 3. 20 3.69 4. 72
Missouri River
Sioux City New Orleans 7.51 5. 72 14.10
Kansas City New Orleans 5. 27 5.32 9.22
T(,lllsas City St. T ,ollis 2. 69 2. 79 4. 70 _._-.--
::0 tn V> tn > ~ () :I: tl:I c: t'"' t'"' tn >-l Z ...... 0 N \D
...... UJ
14 MISSOURI AGRICULTURAL EXPERIMENT STATION
depreciation expenses based on equipment purchased in the 1950s and 1960s . Investment and operating expenses in 1970 had not yet been affected by inflation .
Another possible cause for the difference between negotiated rates and synthesized costs can be attributed to the assumptions made by the researchers . Assumptions concerning travel time, percentage of backhauls , and costs incurred all affect synthesized cost figures . Only a person with intimate knowledge of a particular firm's cost structure could develop a set of assumptions that would lead to highly accurate cost estimates. The problem then would be in using synthesized COSt data based on one firm's experience to represent the entire barge industry .
Summary and Conclusions
The purpose of this report was to present, in one source, relevant barge cost of service information relating to the movement of grain on the Mississippi and Missouri Rivers. Legislative and procedural aspects of barge rate setting were discussed. Rates for grain, as one of the dry, bulk commodities exempt from the Interstate Commerce Act, differ from the published Tariff. Negotiated rates that could be obtained are presented in this bulletin.
Research for this report uncovered no documented cost of service data. Several studies in which attempts were made to develop barge cost of service information were reviewed to give researchers an understanding of approaches that have been taken. The resulting synthesized costs differed substantially from reported negotiated rates and the tariff for grain, which was cancelled but is still used as a basis for negotiated rate quotations. Several possible reasons for the differences are offered.
The difficulty in obtaining negotiated barge rates, the possible error in developing synthesized COSt information, and the cancellation of the Tariff all suggest a needed re-examination of the rate publication issue. Would publication of rate schedules by individual barge firms lead to more effective competition in the industry or would this reduce the flexibility of barge firms and grain merchandisers?
Another area of research needs in barge transportation of grain is the nature of rate negotiation. What are the critical factors in rate negotiation? Who has the greatest relative bargaining advantage, the barge firm or the grain shipper?
Research for this paper revealed nothing about long term contract rates for barging services. How do they compare to single movement rates? Are high long term rates the reason grain companies have purchased their own barges and have invested in barge lines?
RESEARCH BULLETIN 1029 15
References
1. Baumel , C. Phillip, John J. Miller and Thomas P. Drinka. "An Economic Analysis of Upgrading Rail Branch Lines. A Study of 71 Lines in Iowa." U.S. Department of Commerce, National Technical Information Service, Springfield, Virginia, PB-251 978 , March 1976.
2. BaumoI, William J. , and others. "The Role of Cost in the Minimum Pricing of Railroad Services," jOllrnal 0/ Bllsiness, 35 (October, 1962), 357-363.
3. Breimyer, Harold F. Econolilifs 0/ the PrOdllf! Markets of Agrimltlm. Ames: Iowa State University Press, 1976.
4. Kneafsey, James T. Transportation Econolliic Analysis. Lexingron, Mass.: lexingtOn Books, 1975 .
5. Lauth, James H. and Edward F. Heitz . "Rate Making Procedures and Rate Structures." Presentation at the National Extension Transportation Workshop. University of Missouri, Columbia , May 2 I, 1965. Paper available at Agricultural Economics Reference Library.
6. Meyer, John R., M. R. Srraszheim, and M. Wohl. Pricing ami Proja! Ewdlla!ioll. Volume I, Techniqll/!s 0/ Transport Planning. Washingron: The Brookings Institution, 1971.
7. Reed, Charles E., Robert J . Byrne, and Richard M. Ackley. Coordinatinl!, TI'(IJlSportatioli to Redllce Costs . Farmer Cooperative Service Report, No. 1.'>2. WashingtOn: Government Printing Office, 197.'1.
8. Salomone, Daniel, David E. Moser, and Joseph C. Headley. Erollolliic IlIipad 0/ Alternative Grain Trtlmportation Systcms: A Nm·thtl'c.rt MisJoliri Case Stl/dy. Research Bulletin 10 19. Columbia: Experiment Station , Jltne, 1977.
9. Smith, Gerald W. Engineerll/g EronolllY: Anet/ysis o/Capitell Expenditl/res. Ames: The Iowa State University Press, 1970.
10. Schnake, L. D. , and John R. Franzmann. Analysis o/the E//ects o/Cost-li/Service TremJplirtation Rates on the U.S. Gr({in Marketing System. Economic Research Service Technical Bulletin , NO. 1484. Washington: Government Printing Office, 197.~.
11. Schruben, Leonard W., Orlo Sorenson, and Richard Phillips. HOll ' Extending River Newig({tion into Kamas, the Mid-Arkamas River Basin , and Central Okl({hlillla WOlllcl A/foCI Tramportatilirl Costs 0/ Wheat. Manhattan, Kansas: Kansas State University Agricultural Experiment Station, 1974.
12. United States Department of the Army Corps of Engineers, Locks ({lid Dalll No. 26 Replacement Design Memorandulil No. II. Volume No .. '>. St . Louis: Sr. Louis District Engineer, 1975.
13. United Stares Department of Transportation . The Barge Mixing Rule Problelll - A Report to Congress. Washington: Government Printing Office, 197.1.
16 MISSOURI AGRICULTURAL EXPERIMENT STATION
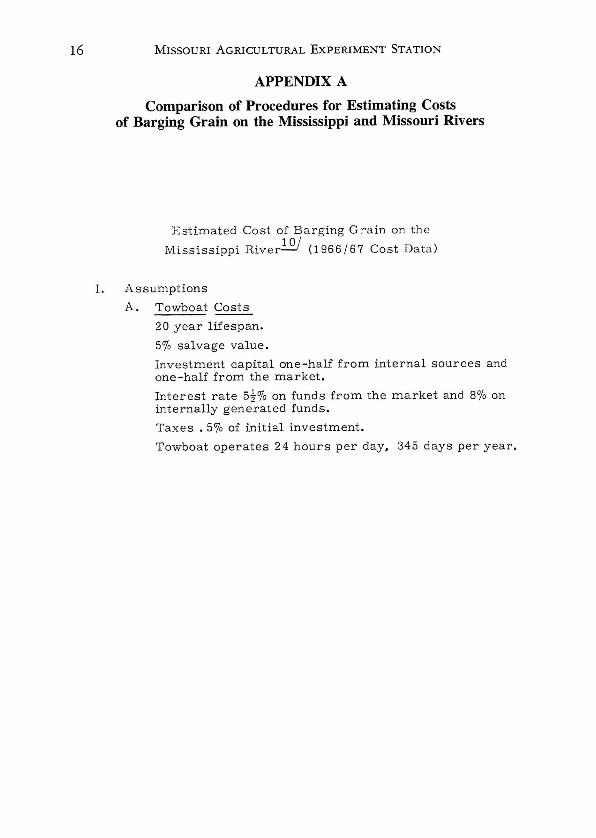
APPENDIX A
Comparison of Procedures for Estimating Costs of Barging Grain on the Mississippi and Missouri Rivers
Estimated Cost of Barging Grain on the
Mississippi River.!..QJ (1966/67 Cost Data)
1. Assumptions
A . Towboat Costs
20 year lifespan.
5'70 salvage value .
Investment capital one-half from internal sources and one-half from the market.
Interest rate 5t'70 on funds from the market and 8'70 on internally generated funds.
Taxes . 50/0 of initial investment.
Towboat operates 24 hours p er day, 345 days per year.
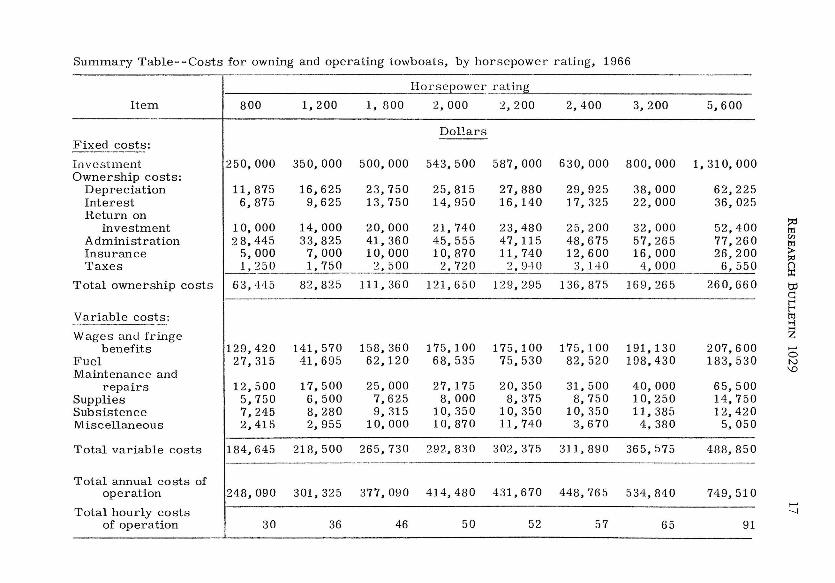
Summary Table--Costs for owning and operating towboats, by horsepower rating, 1966
Horsepower rating
Item 800 1,200 1, 800 2,000 2,200 2,400 3,200
Dollars Fixed costs:
In vestment 250,000 350, 000 500,000 543,500 587,000 630,000 800,000 Ownership costs:
Depreciation 11,875 16,625 23,750 25,815 27,880 29,925 38,000 Interest 6,875 9,625 13,750 14,950 16,140 17,325 22,000 Return on
investment 10,000 14,000 20,000 21,740 23,480 25,200 32 , 000 Administration 28,445 33,825 41,360 45,555 47,115 48,675 57,265 Insurance 5,000 7,000 10,000 10,870 11,740 12,600 16,000 Taxes 1,250 1,750 2,500 2,720 2,9.10 3,140 4,000
Total ownership costs 63,445 82,825 111,360 121,650 129,295 136,875 169,265
Variable costs:
Wages and fringe benefits 129,420 141,570 158, 360 175,100 175,100 175,100 191,130
Fuel 27,315 41,695 62,120 68,535 75,530 82,520 198,430 Maintenance and
repairs 12,500 17,500 25,000 27,175 20,350 31,500 40,000 Supplies 5,750 6,500 7,625 8,000 8,375 8,750 10,250 Subsistence 7,245 8,280 9,315 10,350 10, 35 0 10, 350 11,385 Miscellaneous 2,415 2,955 10,000 10, 870 11,740 3,670 4,380
Total variable costs 184,645 218,500 265,730 292,830 302,375 311,890 365,575 -----"
Total annual costs of operation 248,090 301 , 325 377, 090 414,480 431,670 448,765 534,840
Total hourly costs of operation 30 36 46 50 52 57 65
--_._----
5,600
1,310,00
62,22 36,02
52,40 77,26 26,20 6,55
260,66
o
o o o o o
207,600 183,530
65,500 14,750 12,420
5,050
488,850
749,510
91
:::0 tIl (fj
tIl > ~
g tJ:j c: t"" t"" tT1 ..j
Z ...... o N \0
...... --.J
18 MISSOURI AGRICULTURAL EXPERIMENT STATION
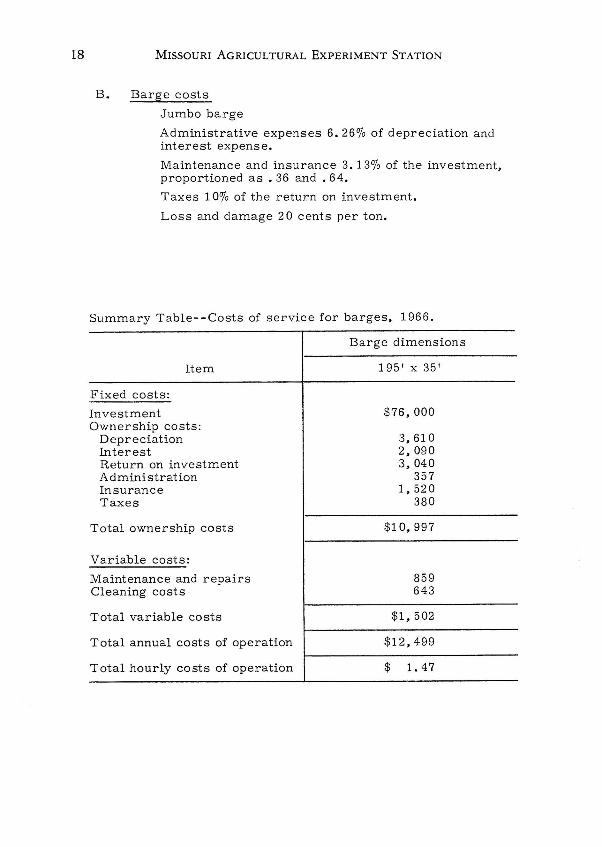
B. Barge costs
Jumbo barge
Administrative expenses 6.260/0 of depreciation and interest expense.
Maintenance and insurance 3. 130/0 of the investment, proportioned as .36 and. 64.
Taxes 100/0 of the return on investment.
Loss and damage 20 cents per ton.
Summary Table--Costs of service for barges, 1966.
Barge dimensions
Item 195' x 35'
Fixed costs:
Investment $76,000 Ownership costs:
Depreciation 3,610 Interest 2,090 Return on investment 3,040 Administration 357 Insurance 1,520 Taxes 380
Total ownership costs $1 0, 997
Variable costs:
Maintenance and repairs 859 Cleaning costs 643
Total variable costs $1,502
Total annual costs of operation $12 ,499
Total hourly costs of operation $ 1. 47
RESEARCH BULLETIN 1029 19
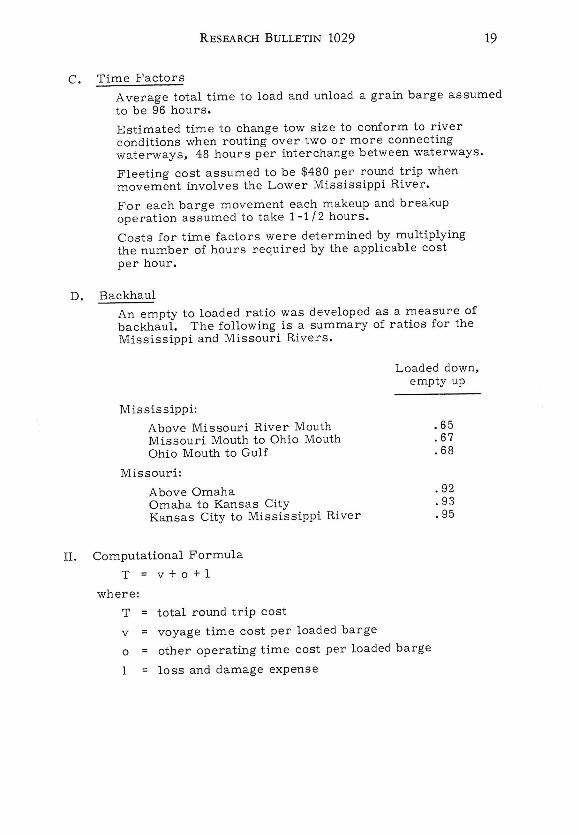
C. Time Factors
A verage total time to load and unload a grain barge assumed to be 96 hours.
Estimated time to change tow size to conform to river conditions when routing over two or more connecting waterways, 48 hours per interchange between waterways.
Fleeting cost assumed to be $480 per round trip when movement involves the Lower Mississippi River.
For each barge movement each makeup and breakup operation assumed to take 1-1/2 hours.
Costs for time factors were determined by multiplying the number of hours required by the applicabl e cost per hour.
D. Backhaul
An empty to loaded ratio was developed as a measure of backhaul. The following is a summary of ratios for the Mississippi and Missouri Rivers.
Mississ ippi :
Above Missouri River Mouth Missouri Mouth to Ohio Mouth Ohio Mouth to Gulf
Missouri:
Above Omaha Omaha to Kansas City Kansas City to Mississippi River
II. Computational Formula
T=v+o+l
where:
T total round trip cost
v voyage time cost per loaded barge
Loaded down, empty up
.65
.67
.6 8
.92
. 93
.95
o other operating time cost per loaded barge
loss and damage expense
20 MISSOURI AGRICULTURAL EXPERIMENT STATION
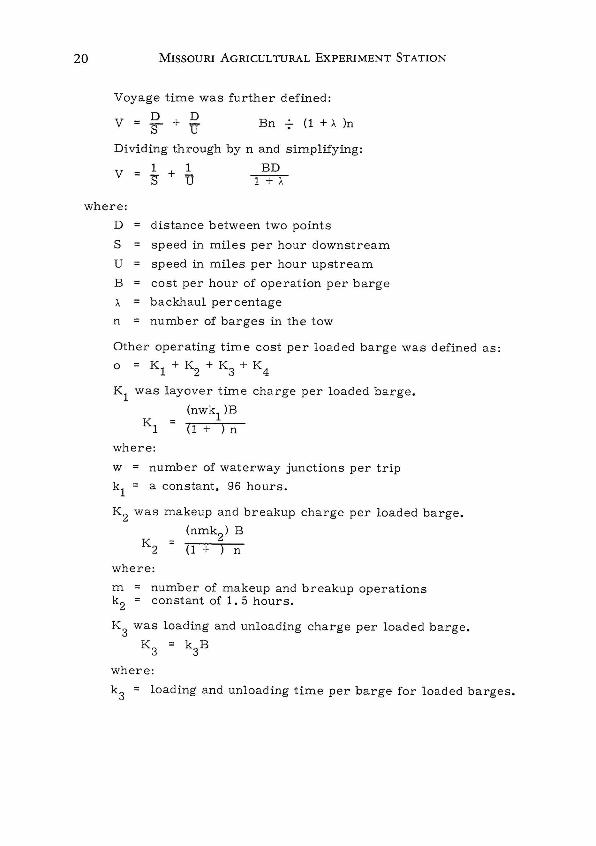
Voyage time was further defined:
D D V = S + U Bn -;- (1 + A )n
Dividing through by n and simplifying:
1 + 1 BD V S u T+T
where :
D distance between two points
S speed in miles per hour downstream
U speed in miles per hour upstream
B cost per hour of operation per barge
A backhaul percentage
n number of barges in the tow
Other operating time cost per loaded barge was defined as:
o = K1 + K2 + K3 + K4
K1 was layover time charge per loaded barge.
(nwk1
)B
K1 (1 + ) n
where:
w number of waterway junctions per trip
k1 a constant, 96 hours.
K2 was makeup and breakup charge per loaded barge.
(nmk2
) B
K2 (1 + ) n
where:
m = number of makeup and breakup operations k2 = constant of 1. 5 hours.
K3 was loading and unloading charge per loaded barge.
K3 = k3 B
where:
k3 = loading and unloading time per barge for loaded barges.
RESEARCH BULLETIN 1029 21
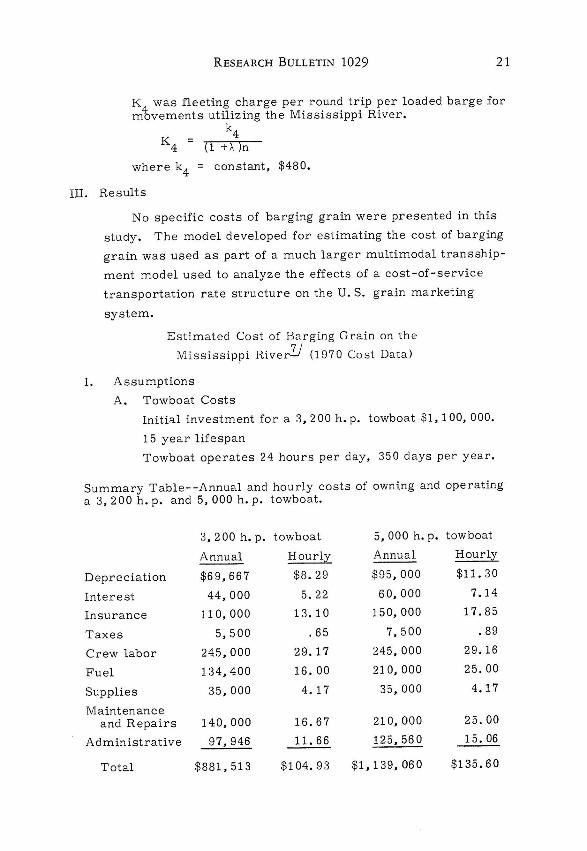
K4 was fleeting charge per round trip per loaded barge for movements utilizing the Mississippi River.
k4 K4 = (1 H )n
where k4 = constant, $48 0.
Ill. Results
No specific costs of barging grain were presented in th is
study . The model developed for estimating the cost of barging
grain was used as part of a much l arger multi modal transship
ment model used to analyze the effects of a cost-of-service
transportation r ate structure on the U. S. grain marketing
system.
Estimated Cost of Ba rg ing Grain on the
Mississ ippi Hiver'!J (1970 Cost Data)
I. Assumptions
A . Towboat Costs
Initi::tl investment for a 3,200 h. p. towboat $1, 100, 000.
15 year lifespan
Towboat operates 24 hours per day, 350 days per year.
Summary Table- - Annual and hourly costs of owning and operating a 3, 2 00 h . p . and 5,000 h. p. towboat.
3,200 h. p. towboat 5,000 h. p . towboat
Annual Hourly Annua l Hourl~
Deprec iation $69,667 $8 . 29 $95 ,000 $11. 30
Interest 44,000 5.22 60,000 7.1 4
Insurance 110, 000 1 3. 10 150, 000 17.85
Taxes 5,500 . 65 7,500 . 89
Crew labor 245,000 29.17 245, 000 29 .16
Fuel 134,400 16.00 210, 000 25 .00
Supplies 35 ,000 4.17 35,000 4 .17
Maintenance and Repairs 140,000 16.67 210,000 25 .00
Administrative 97,946 11. 66 125,560 15.06
Total $881,513 $104.93 $1 ,1 39,060 $135.60
22 MISSOURI AGRICULTURAL EXPERIMENT STATION
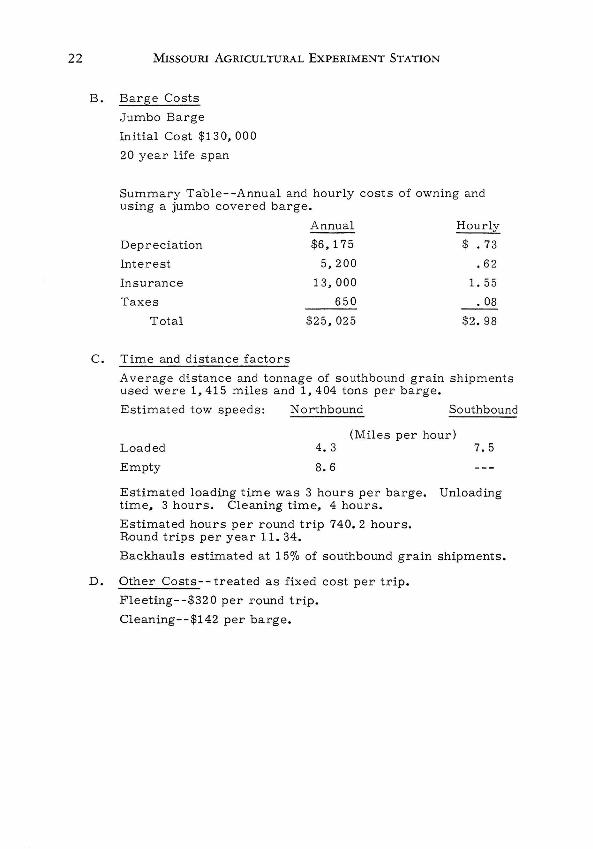
B. Barge Costs
Jumbo Barge
C.
Initial Cost $130,000
20 year life span
Summary Table--Annual and hourly costs of owning and using a jumbo covered barge .
Annual Hourly
Depreciation $6,175 $ .73
Interest 5,200 .62
Insurance 13, 000 1. 55
Taxes 650 .08
Total $25,025 $2.98
Time and distance factors
Average distance and tonnage of southbound grain shipments used were 1,415 miles and 1,404 tons per barge.
Estimated tow speeds: Northbound Southbound
Loaded
Empty
4. 3
8.6
(Miles per hour) 7.5
Estimated loading time was 3 hours per barge. Unloading time, 3 hours. Cleaning time, 4 hours.
Estimated hours per round trip 740.2 hours. Round trips per year 11. 34.
Backhauls estimated at 15% of southbound grain shipments.
D. Other Costs-- treated as fixed cost per trip.
Fleeting--$320 per round trip.
Cleaning--$142 per barge.
RESEARCH BULLETIN 1029
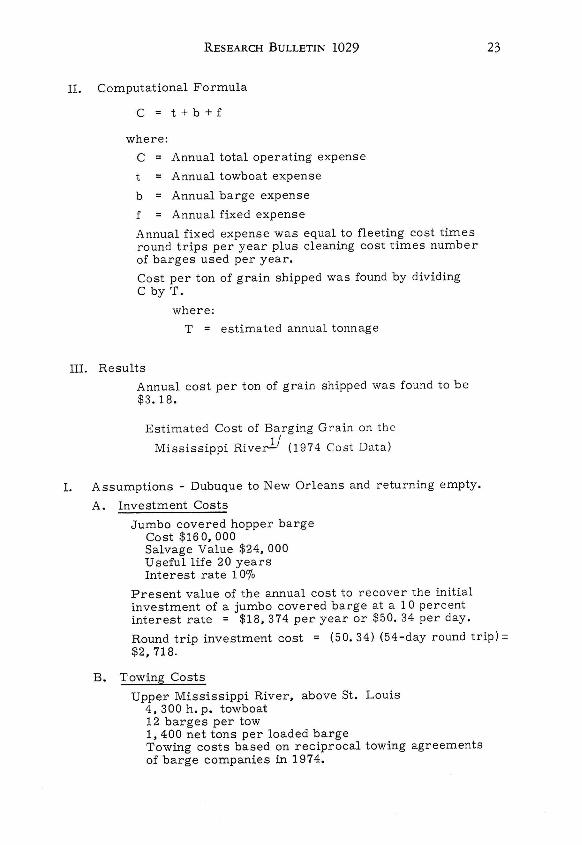
II. Computational Formula
C=t+b+f
where :
C Annual total operating expense
Annual towboat expense
b Annual barge expense
f Annual fixed expense
Annual fixed expense was equal to fleeting cost times round trips per year plus cleaning cost times number of barges used per year.
Cost per ton of grain shipped was found by dividing C by T.
where:
T = estimated annual tonnage
III. Results
Annual cost per ton of grain shipped was found to be $3 .18.
Estimated Cost of Barging Grain on th e
Mississippi Riverl/ (1974 Cost Data)
I. Assumptions - Dubuque to New Orleans and returning empty.
A. Investment Costs
Jumbo covered hopper barge Cost $16 0,000 Salvage Value $24, 000 Useful life 20 years Interest rate 10%
Present value of the annual cost to recover the initial investment of a jumbo covered barge at a 10 percent interest rate = $18,374 per year or $50. 34 per day.
23
Round trip investment cost = (50.34) (54-day round trip)::: $2,718.
B. Towing Costs
Upper Mississippi River, above St. Louis 4 , 300 h. p. towboat 12 barges per tow 1,400 net tons per loaded barge Towing costs based on reciprocal towing agreements of barge companies in 1974.
24 MISSOURI AGRICULTURAL EXPERIMENT STATION
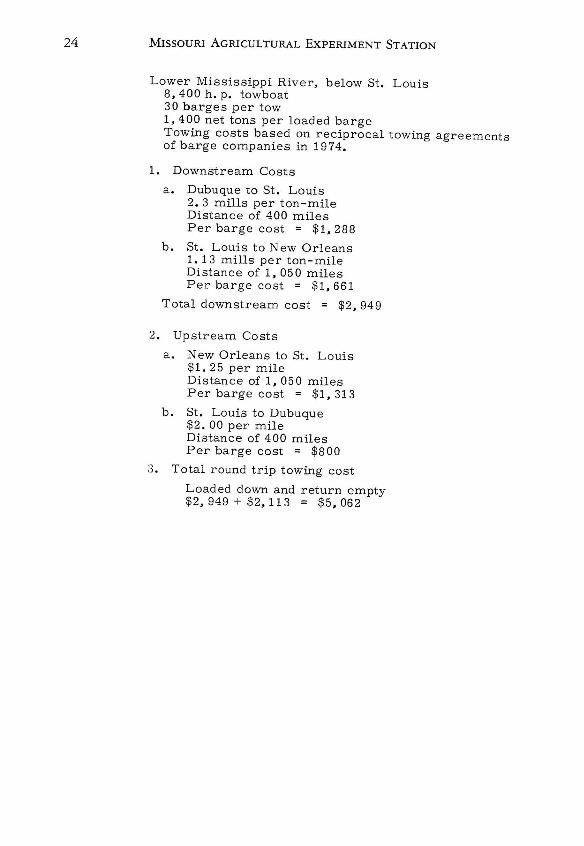
Lower Mississippi River, below St. Louis 8,400 h. p. towboat 30 barges per tow 1,400 net tons per loaded barge Towing costs based on reciprocal towing agreements of barge companies in 1974.
1. Downstream Costs
a. Dubuque to St. Louis 2.3 mills per ton-mile Distance of 400 miles Per barge cost = $1,288
b. St. Louis to New Orleans 1. 13 mills per ton-mile Distance of 1,050 miles Per barge cost = $1,661
Total downstream cost = $2,949
2. Upstream Costs
a. New Orleans to St. Louis $1. 25 per mile Distance of 1,050 miles Per barge cost = $1,313
b. St. Louis to Dubuque $2. 00 per mile Distance of 400 miles Per barge cost = $800
3. Total round trip towing cost
Load ed down and return empty $2,949 + $2,113 = $5,062
RESEARCH BULLETIN 1029
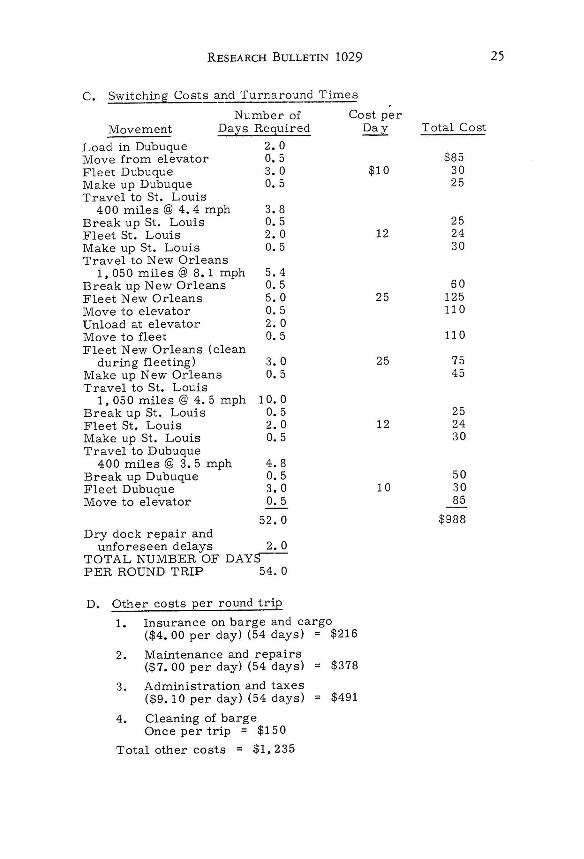
C . Switching Costs and Turnaround Times
Number of Cost per Movement Days Required
Load in Dubuque Move from elevator Fleet Dubuque Make up Dubuque Travel to St. Louis
400 miles @ 4.4 mph Break up St. Louis Fleet St. Louis Make up St. Louis Travel to New 'Orleans
1,050 miles @ 8.1 mph Break up New 'Orleans Fleet New 'Orleans Move to elevator Unload at elevator Move to fleet Fleet New 'Orleans (clean
during fleeting) Make up New 'Orleans Travel to St. Louis
1,050 miles @ 4.5 mph Break up St. Louis Fleet St. Louis Make up St. Louis Travel to D ubuque
400 miles @ 3.5 mph Break up Dubuque Fleet Dubuque Move to elevator
Dry dock repair and
2. 0 0.5 3. 0 0.5
3.8 0.5 2. 0 0.5
5.4 0.5 5.0 0.5 2. 0 0.5
3.0 0.5
10.0 0.5 2.0 0.5
4.8 0.5 3.0 0.5
52.0
unforeseen delays 2. 0 T'OTAL NUMBER 'OF DAYS-PER R'OUND TRIP 54. 0
D. 'Other costs per round trip
1. Insurance on barge and cargo ($4.00 per day) (54 days) $216
2. Maintenance and repairs ($7.00 per day) (54 days) $378
3. Administration and taxes ($9.10 per day) (54 days) $491
4. Cleaning of barge 'Once per trip = $150
Total other costs = $1,235
Da y Total Cost
$85 $10 30
25
25 12 24
30
60 25 125
110
110
25 75 45
25 12 24
30
50 10 30
85
$988
25
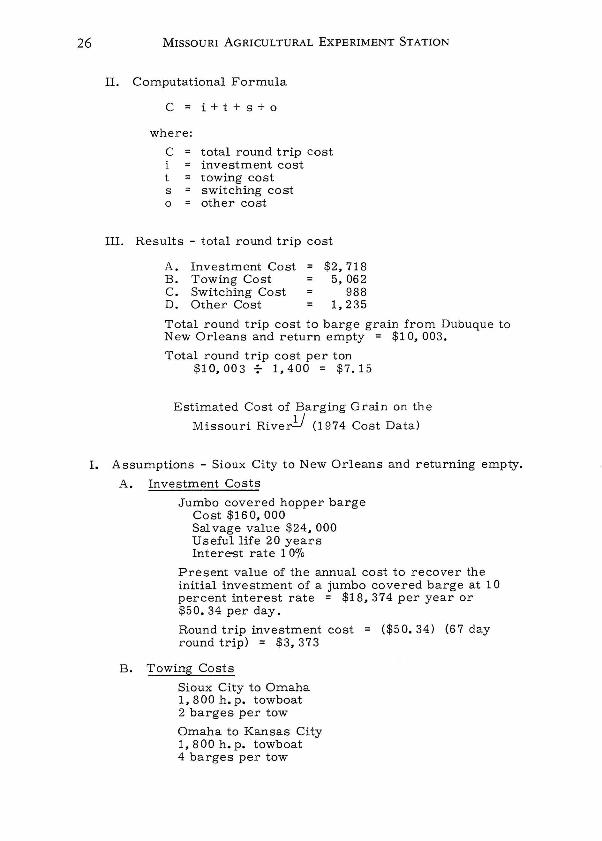
26 MISSOURI AGRICULTURAL EXPERIMENT STATION
II. Computational Formula
C = i+t + s+o
where:
C total round trip cost investment cost towing cost
s switching cost o other cost
III. Results - total round trip cost
A . Investment Cost B. Towing Cost C. Switching Cost D. Other Cost
$2,7 18 5,062
988 1,235
Total round trip cost to barge grain from Dubuque to New Orleans and return empty = $10,003.
Total round trip cost per ton $1 0,00 3 +- 1,400 = $7.15
Estimated Cost of Barging Grain on the
Missouri RiverY (1974 Cost Data)
1. Assumptions - Sioux City to New Orleans and returning empty.
A. Investment Costs
Jumbo covered hopper barge Cost $160,000 Sal vage value $24, 000 Useful life 20 years Interest rate 10%
Present value of the annual cost to recover the initial investment of a jumbo covered barge at 10 percent interest rate = $18,374 per year or $50.34 per day.
Round trip investment cost = ($50.34) (67 day round trip) = $3,373
B. Towing Costs
Sioux City to Omaha 1, 800 h. p. towboat 2 barges per tow
Omaha to Kansas City 1, 800 h. p. towboat 4 barges per tow
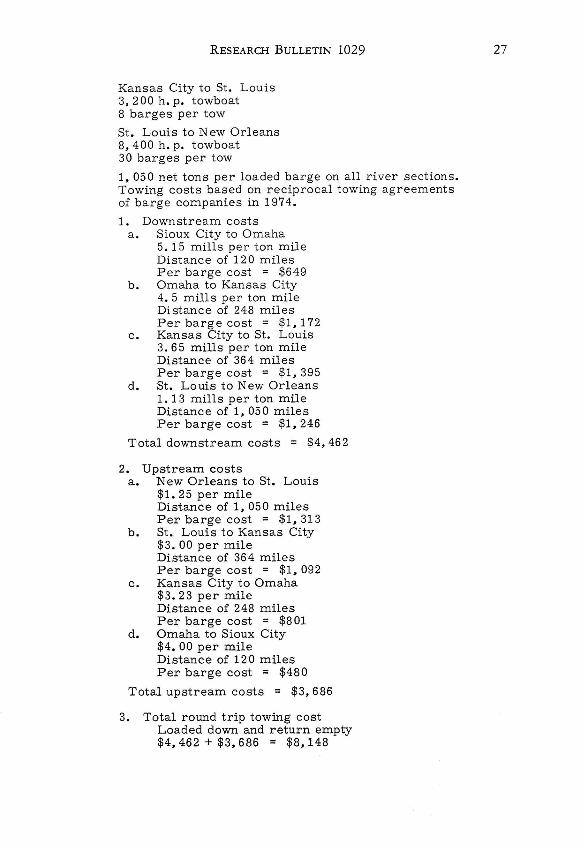
RESEARCH BULLETIN 1029
Kansas City to St. Louis 3,200 h. p. towboat 8 barges per tow
St. Louis to New Orleans 8,400 h. p. towboat 30 barges per tow
1,050 net tons per loaded barge on all river sections. Towing costs based on reciprocal towing agreements of barge companies in 1974.
1. Downstream costs a. Sioux City to Omaha
5. 15 mills per ton mile Distance of 120 miles Per barge cost = $649
b. Omaha to Kansas City 4.5 mills per ton mile Distance of 248 miles Per barge cost = $1,172
c. Kansas City to St. Louis 3.65 mills per ton mile Distance of 364 miles Per barge cost = $1,395
d. St. Louis to New Orleans 1. 13 mills per ton mile Distance of 1,050 miles Per barge cost = $1, 246
Total downstream costs = $4,462
2. Upstream costs a. New Orleans to St. Louis
$1. 25 per mile Distance of 1,050 miles Per barge cost = $1,313
b. St. Louis to Kansas City $3.00 per mile Distance of 364 miles Per barge cost = $1,092
c. Kansas City to Omaha $3.23 per mile Distance of 248 miles Per barge cost = $801
d. Omaha to Sioux City $4. 00 per mile Distance of 120 miles Per barge cost = $480
Total upstream costs = $3,686
3. Total round trip towing cost Loaded down and return empty $4,462 + $3,686 = $8,148
27
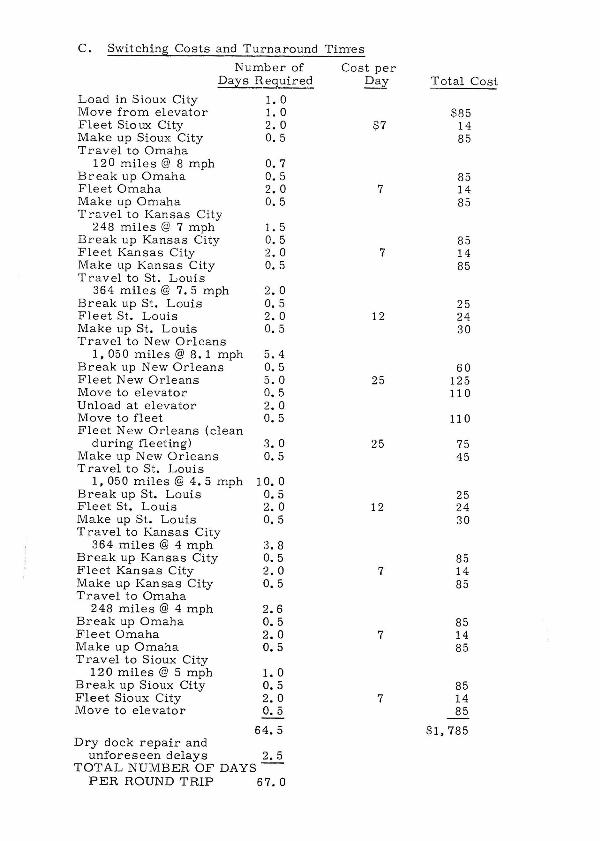
C. Switching Costs and Turnaround Timoes
Number of Cost per Days~equired Day Total Cost
Load in Sioux City 1.0 Move from elevator 1.0 $85 Fleet Sio ux City 2. 0 $7 14 Make up Sioux City 0.5 85 Travel to Omaha
120 miles @ 8 mph 0.7 Break up Omaha O. 5 85 Fleet Omaha 2. 0 7 14 Make up Omaha 0.5 85 T ravel to Kansas City
248 miles @ 7 mph 1.5 Break up Kansas City O. 5 85 Fleet Kansas City 2. 0 7 14 Make up Kansas City O. 5 85 Travel to St. Louis
364 miles @ 7. 5 mph 2.0 Break up St . Louis 0. 5 25 Fleet St. Louis 2. 0 12 24 Make up St. Louis 0. 5 30 Travel to New Orleans
1,050 miles @ 8 . 1 mph 5. 4 Break up New Orleans 0. 5 60 Fleet New Orleans 5. 0 25 125 Move to elevator 0.5 110 Unload at elevator 2.0 Move to fleet 0.5 110 Fleet New Orleans (clean
during fleeting) 3. 0 25 75 Make up New Orleans 0.5 45 T ra vel to St. Louis
1,050 miles @ 4.5 mph 10. 0 Break up St. Louis 0. 5 25 Fleet St. Louis 2. 0 12 24 Make up St . Louis 0. 5 30 Travel to Kansas City
364 miles @ 4 mph 3. 8 Break up Kansas City 0.5 85 Fleet Kansas City 2. 0 7 14 Make up Kansas City 0. 5 85 Travel to Omaha
248 miles @ 4 mph 2. 6 Break up Omaha 0. 5 85 Fleet Omaha 2. 0 7 14 Make up Omaha 0.5 85 Travel to Sioux City
120 miles @ 5 mph 1.0 Break up Sioux City 0. 5 85 Fleet Sioux City 2. 0 7 14 Move to elevator 0. 5 85
64.5 $1 , 785 Dry dock repair and
unforeseen delays 2. 5 TOTAL NUMBER OF DAYS -
PER ROUND TRIP 67 . 0
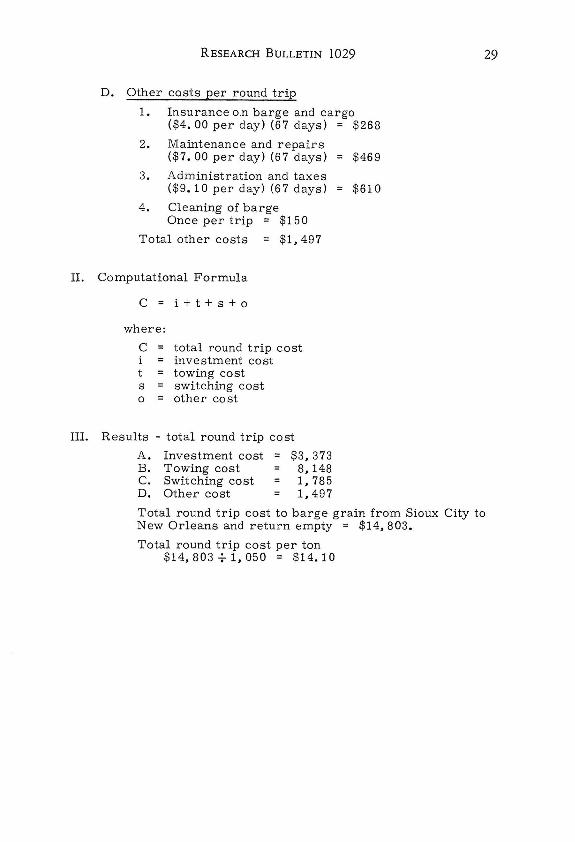
RESEARCH BULLETIN 1029
D. Other costs per round trip
1. Insurance o.n barge and cargo ($4.00 per day) (67 days) $268
2. Maintenance and repairs ($7.00 per day) (67 days) $469
3. Administration and taxes ($9.10 per day) (67 days) $610
4. Cleaning of barge Once per trip $150
Total other costs = $1,497
II. Computational Formula
C = i+t+s+o
where:
C total round trip cost i investment cost t towing cost s = switching cost o = other cost
III. Results - total round trip cost
A. Investment cost = $3,373 B. Towing cost 8,148 C. Switching cost 1,785 D. Other cost 1,497
29
Total round trip cost to barge grain from Sioux City to New Orleans and return empty = $14,803.
Total round trip cost per ton $14,803+1,050 = $14.10
30 MISSOURI AGRICULTURAL EXPERIMENT STATION
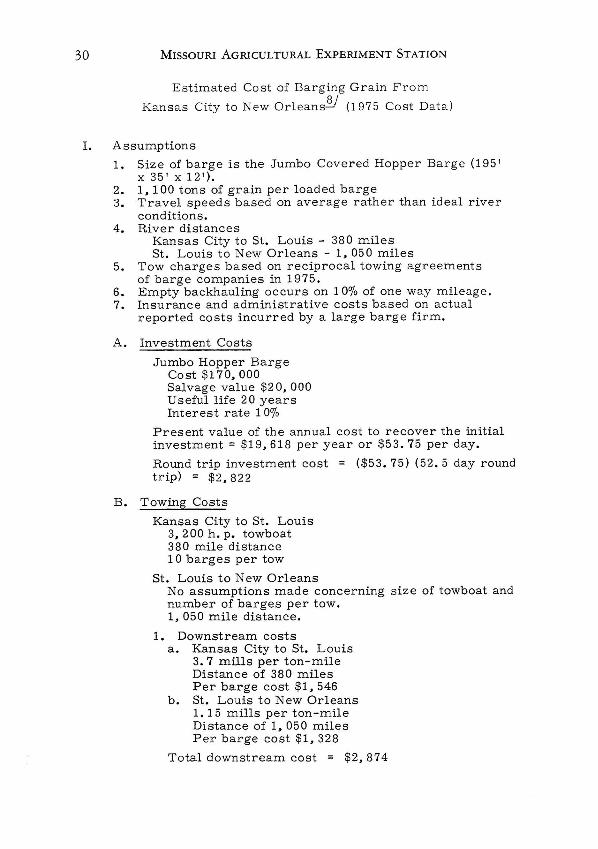
Estimated Cost of Barging Gr a in F ro m
Kansas City to New Orl eans~j (1975 Cost Da ta)
1. Assumptions
1. Size of barge is the Jumbo Covered Hopper Barge (195' x35'x12').
2. 1,100 tons of grain per loaded barge 3. Travel speeds based on average rather than ideal river
conditions. 4. River distances
Kansas City to St. Louis - 380 miles St. Louis to New Orleans - I, 050 miles
5. Tow charges based on reciprocal towing a greements of barge companies in 1975.
6. Empty backhauling occurs on 10% of one way mileage. 7. Insurance and administrative costs based on actual
reported costs incurred by a large barge firm.
A. Investment Costs
Jumbo Hopper Barge Cost $170, 000 Salvage value $20,000 Useful life 20 years Interest rate 10%
Present value of the annual cost to recover the initial investment = $19,618 per year or $53.75 per day.
Round trip investment cost = ($53.75) (52.5 day round trip) = $2,822
B. Towing Costs
Kansas City to St. Louis 3,200 h. p. towboat 380 mile distance 10 barges per tow
St. Louis to New Orleans No assumptions made concerning size of towboat and number of barges per tow. 1,050 mile distance.
1. Downstream costs a. Kansas City to St. Louis
3.7 mills per ton-mile Distance of 380 miles Per barge cost $1,546
b. St. Louis to New Orleans 1. 15 mills per ton -mile Distance of 1,050 miles Per barge cost $1,328
Total downstream cost = $2,874
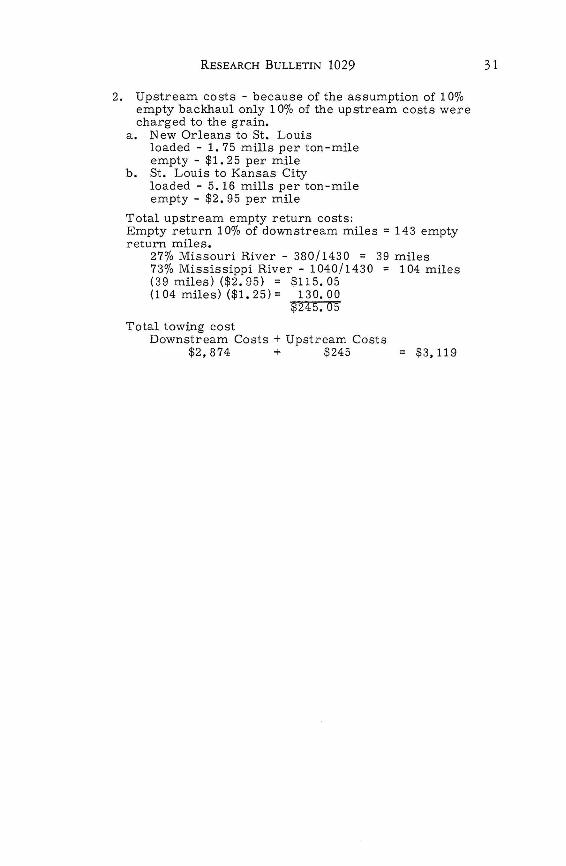
RESEARCH BULLETIN 1029
2. Upstream costs - because of the assumption of 10% empty backhaul only 10% of the upstream costs were charged to the grain.
a. New Orleans to St. Louis loaded - 1. 75 mills per ton-mile empty - $1. 25 per mile
b. St. Louis to Kansas City loaded - 5.16 mills per ton-mile empty - $2.95 per mile
Total upstream empty return costs : Empty return 10% of downstream miles = 143 empty return miles.
27% Missouri River - 380/1430 = 39 miles 73% Mississippi River - 1040/1430 = 104 miles (39 miles) ($2.95) = $115.05 (104 miles) ($1.25)= 130.00
$245.05
Total towing cost Downstream Costs + Upstream Costs
$2,874 + $245 $3,119
31
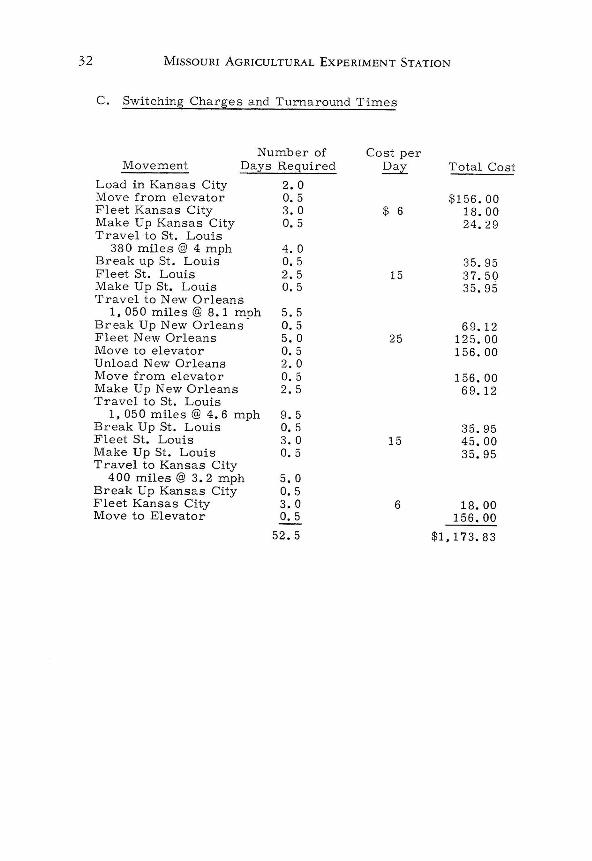
32 M ISSO URI AGRICULTURAL EXPERIMENT STATION
C . Switching Charges and Turnaround Times
Number of Cost per Movement Dazs Required Daz Total Cost
Load in Kansas City 2.0 Move from elevator 0.5 $156 . 00 Fleet Kansas City 3. 0 $ 6 18 . 00 Make Up Kansas City 0.5 24 . 29 Travel to St . Louis
380 miles @ 4 mph 4.0 Break up St. Louis O. 5 35.95 F l eet St . Louis 2. 5 15 37 . 50 Make Up St. Louis O. 5 35.95 Travel to New Orl eans
I, 050 miles @ 8.1 mph 5.5 Break Up New Orl eans 0.5 69. 12 Fleet New Orleans 5. 0 25 125 . 00 Move to elevator O. 5 156 . 00 Unload New Orleans 2. 0 Move from elevator 0. 5 156 . 00 Make Up New Orleans 2.5 69.12 Travel to St. Louis
1,050 miles @ 4.6 mph 9.5 Break Up St. Louis 0.5 35.95 Fleet St. Louis 3. 0 15 45.00 Make Up St. Louis 0.5 35.95 Travel to Kansa s City
400 miles @ 3. 2 mph 5. 0 Break Up Kansas City 0. 5 Fleet Kansas City 3. 0 6 18.00 Move to Elevator 0.5 156.00
52 . 5 $1,173.83
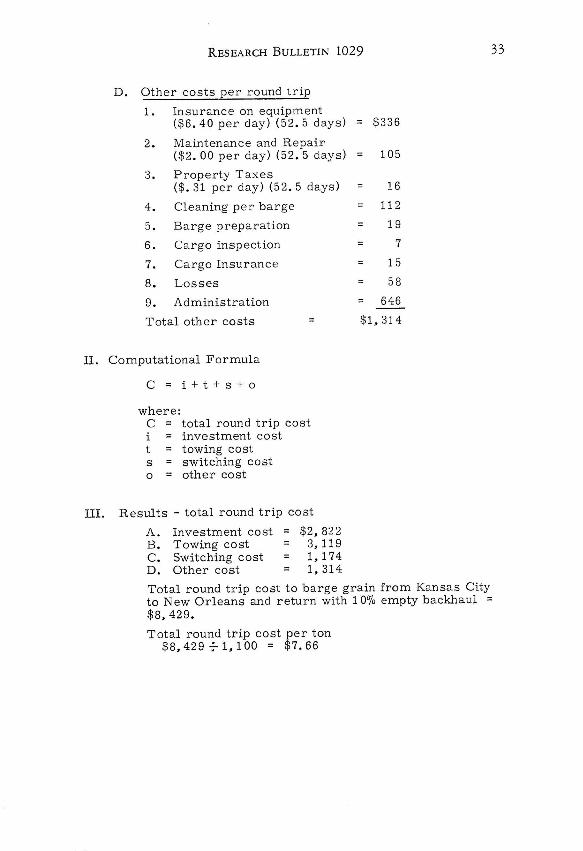
RESEARCH BULLETIN 1029
D. Other costs per round trip
l. Insurance on equipment ($6 . 40 per day) (52.5 days) $336
2. Maintenance and Repair ($2 . 00 per day) (52.5 days) 105
3. Property Taxes ($ . 31 per day) (52 . 5 days) 16
4 . Cleaning per barge 112
5. Barge preparation 19
6 . Cargo inspection 7
7 . Cargo Insurance 15
8. Losses 58
9. Administration 646
Total other costs $1,314
II. Computational Formula
C = i+t+s+o
wher e: C total round trip cost i investment cost t towing cost s switching cost o = oth er cost
III . Results - total round trip cost
A . Investment cost $2 , 822 B. Towing cost 3, 119 C. Switching cost 1,174 D . Other cost 1,314
Total round trip cost to barge grain from Kansas City to New Orleans and return with 100/0 empty backhaul $8 , 429.
Total round trip cost per ton $8,429';- 1,100 = $7.66
33
34 MISSOURI AGRICULTURAL EXPERIMENT STATION
APPENDIX B
Procedures for Determining Barge Rates on Regulated Commodities
The transportation industries are nearly always cited in basic economics textbooks as examples of industries which because of their natural tendency toward monopoly, or the vital nature of the services provided, or for technological considerations, should be subject to public regulation to protect the public interest.4 In regulated industries, interacting market forces are not allowed to determine price and quantity. This function is performed by regulatory agencies which follow federal, state, and local legislative guidelines in ruling on appropriate rates and services.
The rate making procedure followed by the particular regulatory agency responsible for waterway transportation, the Interstate Commerce Commission, is as follows: A request for a rate change may be made by any shipper, carrier, or rate bureau.5 In most cases, a request for rate change is channeled through a rate bureau or freight association-an organization of carriers providing similar services in a particular geographical area. The requested rate change is judged according to standards agreed upon by members of the organization. If approved, the rate change is filed with the Interstate Commerce Commission. The I.C .c.'s role is primarily that of an appeal board .3 Protests may be filed with the I.C.C. by a shipper affected by the rate, a carrier who feels the rate might damage his competitive position, or a third party. In the absence of protest, the rate change is published in the form of a tariff and becomes the legally applicable rate .
A very small percentage of the thousands of requests for rate change are actually protested.5 When a protest is filed, the I. C. C. is required to consider the rate change and make a ruling. The broad guidelines used by the I. C. C. in carrying out the provisions of the Interstate Commerce Act are as follows: 1) recognize and preserve the inherent advantages of each mode of transportation; and 2) promote the establishment and maintenance of just and reasonable rates.
Specific factors considered by the I.C .C. in applying these guidelines to cases requiring a ruling can be grouped into two categories. The first is cost of service factors which include quantity shipped, distance , and operating conditions. Cost of service factors are aimed at allowing an individual carrier a reasonable profit to insure the service will be continued. They are also meant to guarantee the shipper availability of transportation services at prices that are as low as practical.
The second category of rate setting elements is value of service factors. These factors are meant to maintain the advantages of each mode of transportation and take into consideration the intramodal and intermodal competitive situation. One other component is included in value of service and is referred to as the equalization factor. The equalization factor, briefly, guarantees that transportation services will continue to be available in areas and to shippers of products that do not produce enough revenue to cover costs. The deficits are subsidized by discriminatory pricing in areas and for products which produce profits for the carriers.
RESEARCH BULLETIN 1029 35
The rate setting factors, particularly the cost of service factors, used by the I.C.C. have been the subject of criticism by transportation economists. The controversy centers on costs relevant to rate setting. Neither the I. C. C. nor carriers are able to measure the cost of providing a particular transportation service accurately. 13
The problem of cost measurement in transportation industries can be traced to three sources-fixed costs, joint costs, and external costs . Fixed costs tend to make up a high proportion of total cost in the transportation industry. The usual approach is to allocate fixed costs to individual transportation services by a rigid accounting formula regardless of actual fixed costs incurred in providing that service. 3 Joint costs are costs for variable inputs used to provide transportation services where more than one service is produced. Again, the problem becomes one of apportioning costs to each service.
External costs have become a topic of central focus in the waterway transportation industry . Several proposals to internalize the costs of providing and maintaining waterways by the imposition of user charges are currently being considered. However, external costs are not unique to barge lines. Subsidies in the form of outright grants, continuing financial support, guaranteed government business, and publicly financed facilities are common throughout the transportation industry. To the extent that external costs are not included as a cost of providing a specific service, the actual cost is understated.
The general approach taken by the I.C.C. in considering costs in ruling on tariffs is to use as a base the average fully allocated cost for the industry .3 A reasonable profit is allowed above the cost base, depending upon the nature of the commodity and the distance the commodity must be moved to find a market. This is sometimes referred to as the rule of what the traffic will bear.s Deviations from this approach are considered by the I.C.C. only if a lower rate is proposed to meet a competitor. Higher rates are not allowed if they selectively discriminate against a small group of shippers or a particular commodity . S