estimates of u.s. postal demand elasticities derived from a random-coefficients discrete-choice...
TRANSCRIPT
ESTIMATES OF U.S. POSTAL DEMAND ELASTICITIES DERIVED FROM A RANDOM-COEFFICIENTS DISCRETE-CHOICE NORMAL MODEL
Margaret M. Cigno, Elena S. Patel and Edward S. Pearsall
The views represented are solely those of the authors and not necessarily those of the Postal Regulatory Commission.
1

Conventional Demand Models
Poorly suited to estimate elasticities in markets with many similar products Automobiles, Breakfast Cereals, Postal Products
Conventional Model Employs a demand model for each product Should include the price of all relevant products
Brings rise to familiar econometric problems Burdensome data requirement Prices of many products are highly correlated Cross-Price elasticity estimation requires large
sample size with sufficient variation
2
Conventional Postal Demand Models
These problems are not unfamiliar to postal practitioners (US) data are typically quarterly national aggregates
from 1971 to present Real postal rates tend to change together due to
inflation and coordination imposed by price cap regulation
U.S. Postal Service products divide into at least 15 different categories with distinct hedonic properties
Typically, models are fit including only own-price data Avoids multicolinearity problems
Result is an incomplete set of postal price elasticity estimates
3

A BLP Solution?
Berry et al (1995) introduce a Random-Coefficient Discrete-Choice Logit Model Individual choice model used to estimate
demand in a differentiated products market Requires only market-level data Known to produce cross-price elasticities that
reflect realistic substitution patterns Current “model du jour” in the Industrial
Organization literature Largely based on the version presented by
Nevo (2000, 2001) Has yet to be tried in the Postal Sector
4

The Guts of the Model
Linear Utility Function Two Mean-Centered Disturbances Random Coefficients
Gains or losses to household i when purchasing and consuming product j
ijjjixjiyjiijij ZDXDPCYU
5
BLP: The Good and the Bad Good News!
Model conforms well to economic theory Is not overly restrictive with respect to price elasticity
estimates Bad News
Model was designed for “big ticket” items Requires distribution of mean-centered demographic variables
and measurements of hedonic properties Worse News
We do not observe indirect utility, individual income, or consumer surplus
Fitting the model involves integrating out all of the random terms except for the mean disturbance
BLP/Nevo requires a simulation to extract mean indirect utilities by matching market share data (slow!)
Much Worse News BLP/Nevo is itself an algorithm Repeated calculation of mean indirect utilities is required to
fit the model (may take days or weeks to run)
6
A Modified BLP Solution! We discovered a way to revise the model and
greatly simplify/speed up the estimation process We replace the demographic variables with their
principal components The transformation forms a linear combination of
variables that are iid N(0,1) With this change
The simulation is replaced with a single-variable numerical integration
The estimation method is replaced with a Newton-Raphson method
Model can now be fit in under 12 hours with a moderately-sized postal application
We will ultimately split this paper in two Paper # 1 – Model and Methodology (Sections 1-6) Paper # 2 – Postal Application (Sections 7,8, and
Appendix)
7
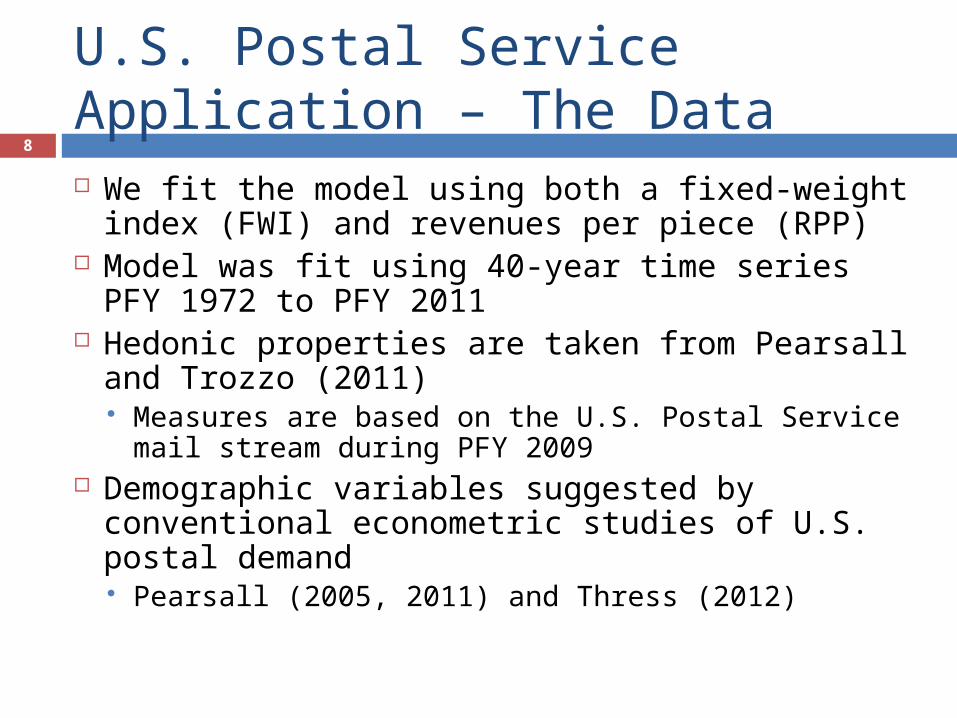
U.S. Postal Service Application – The Data We fit the model using both a fixed-weight
index (FWI) and revenues per piece (RPP) Model was fit using 40-year time series PFY
1972 to PFY 2011 Hedonic properties are taken from Pearsall
and Trozzo (2011) Measures are based on the U.S. Postal Service
mail stream during PFY 2009 Demographic variables suggested by
conventional econometric studies of U.S. postal demand Pearsall (2005, 2011) and Thress (2012)
8

Postal Application-DefinitionsDefinitions of Products and Variables
j Product (Postal Service Categories) Price (P) and Properties of Mail (X-vector)0 Outside Good P FWI Fixed-Weight Index, or 1 First-Class Single-Piece Ltrs, Flats, & Pcls RPP Revenue per Piece2 First-Class Presort Ltrs, Flats, & Pcls3 First-Class Single-Piece Cards X Std. Wgt/Pc Weight per Piece in 2011, or4 First-Class Presort Cards Wgt/Pc Weight per Piece5 Priority Mail6 Express Mail Letters Proportion of Letters7 Periodicals In-County Cards Proportion of Cards8 Periodicals Outside County Flats Proportion of Flats9 Standard non-Carrier-Route Ltrs, Flats & Pcls Parcels Proportion of Parcels (large and small)10 Standard Carrier-Route Ltrs, Flats & Pcls11 Parcel Post and Parcel Select Presort Number of USPS Machine Passes to Sort12 Bound Printed Matter Distance Log of Number of Miles to Destination13 Media and Library Mail14 Penalty, Franked and Free Mail Service Dummy for Domestic Mail Services15 Domestic Mail Services ex Evps & Box Rents
Demographic Variables (D-vector)hhadults Adults per Household (22+ years of age)gdp per hh Real Gross Domestic Product per Household (Chained 2005 Dollars)chg gdp per hh Annual Change in Real GDP per Household (Chained 2005 Dollars)net worth per hh Real net Worth per Household (Chained 2005 Dollars)broadband Proportion of Households with Broadband Accessunemployment rate Unemployment Ratelinear trend Linear Trend from 1970 to 2012
Definitions of Products and Variables
j Product (Postal Service Categories) Price (P) and Properties of Mail (X-vector)0 Outside Good P FWI Fixed-Weight Index, or 1 First-Class Single-Piece Ltrs, Flats, & Pcls RPP Revenue per Piece2 First-Class Presort Ltrs, Flats, & Pcls3 First-Class Single-Piece Cards X Std. Wgt/Pc Weight per Piece in 2011, or4 First-Class Presort Cards Wgt/Pc Weight per Piece5 Priority Mail6 Express Mail Letters Proportion of Letters7 Periodicals In-County Cards Proportion of Cards8 Periodicals Outside County Flats Proportion of Flats9 Standard non-Carrier-Route Ltrs, Flats & Pcls Parcels Proportion of Parcels (large and small)10 Standard Carrier-Route Ltrs, Flats & Pcls11 Parcel Post and Parcel Select Presort Number of USPS Machine Passes to Sort12 Bound Printed Matter Distance Log of Number of Miles to Destination13 Media and Library Mail14 Penalty, Franked and Free Mail Service Dummy for Domestic Mail Services15 Domestic Mail Services ex Evps & Box Rents
Demographic Variables (D-vector)hhadults Adults per Household (22+ years of age)gdp per hh Real Gross Domestic Product per Household (Chained 2005 Dollars)chg gdp per hh Annual Change in Real GDP per Household (Chained 2005 Dollars)net worth per hh Real net Worth per Household (Chained 2005 Dollars)broadband Proportion of Households with Broadband Accessunemployment rate Unemployment Ratelinear trend Linear Trend from 1970 to 2012
9
Selected Results – Mean Indirect Utility
FWI Weight/ Piece
Letters
Cards
Flats Parcels
Presort
Distance
Service
Alpha Beta (X1)
Beta (X2)
Beta (X3)
Beta (X4)
Beta (X5)
Beta(X6)
Beta(X7)
Beta(X8)
Coefficient
-2.51 1.50 5.21 7.92 3.86 7.95 -1.27 0.08 2.31
T-Value -24.6 13.3 65.1 76.7 34.2 69.1 -41.3 4.5 32.5
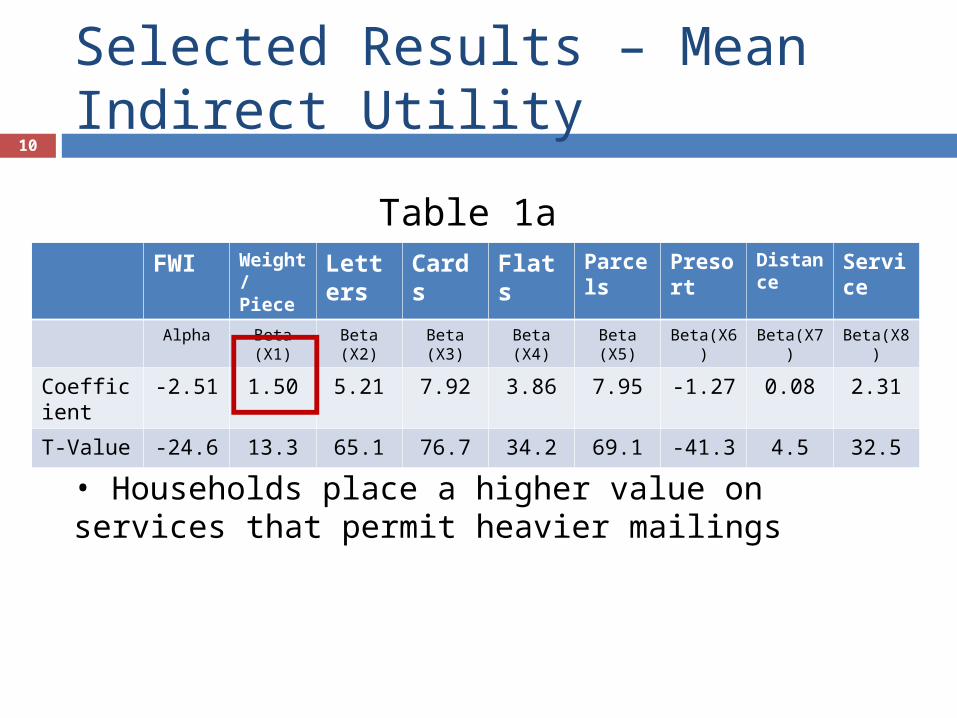
Table 1a
10
• Households place a higher value on services that permit heavier mailings
Selected Results – Mean Indirect Utility
FWI Weight/ Piece
Letters
Cards
Flats Parcels
Presort
Distance
Service
Alpha Beta (X1)
Beta (X2)
Beta (X3)
Beta (X4)
Beta (X5)
Beta(X6)
Beta(X7)
Beta(X8)
Coefficient
-2.51 1.50 5.21 7.92 3.86 7.95 -1.27 0.08 2.31
T-Value -24.6 13.3 65.1 76.7 34.2 69.1 -41.3 4.5 32.5
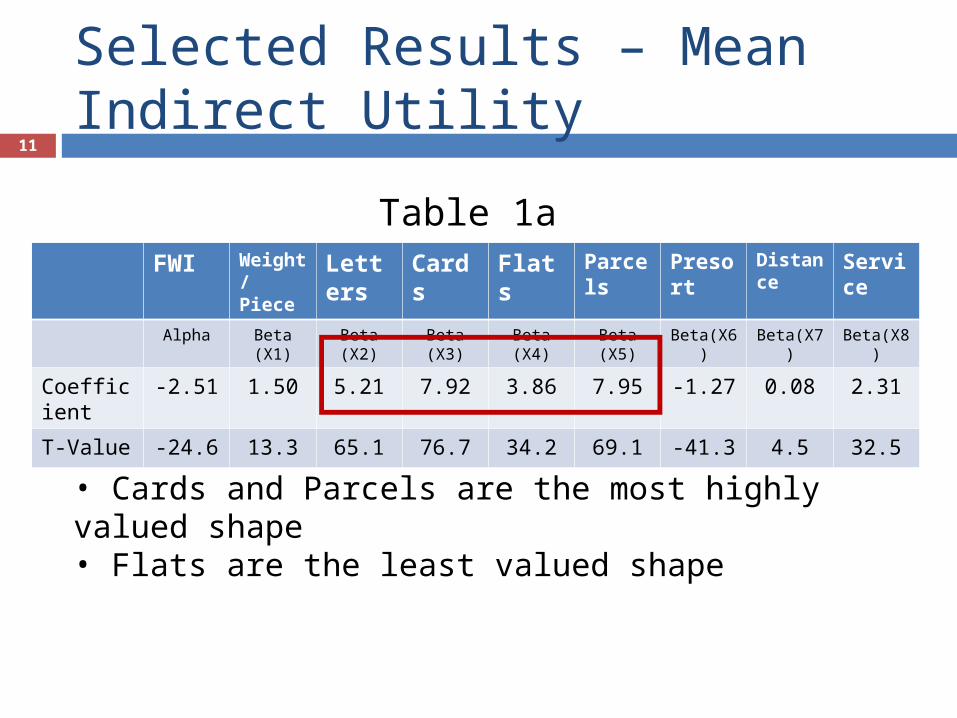
Table 1a
11
• Cards and Parcels are the most highly valued shape• Flats are the least valued shape
Selected Results – Mean Indirect Utility
FWI Weight/ Piece
Letters
Cards
Flats Parcels
Presort
Distance
Service
Alpha Beta (X1)
Beta (X2)
Beta (X3)
Beta (X4)
Beta (X5)
Beta(X6)
Beta(X7)
Beta(X8)
Coefficient
-2.51 1.50 5.21 7.92 3.86 7.95 -1.27 0.08 2.31
T-Value -24.6 13.3 65.1 76.7 34.2 69.1 -41.3 4.5 32.5
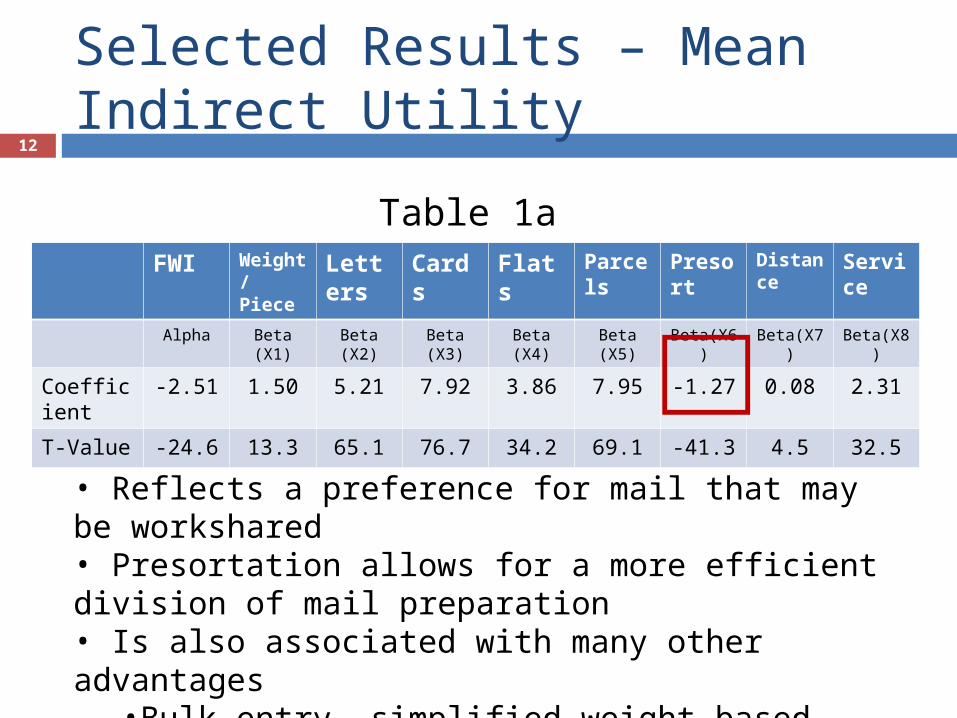
Table 1a
12
• Reflects a preference for mail that may be workshared• Presortation allows for a more efficient division of mail preparation• Is also associated with many other advantages•Bulk entry, simplified weight-based payment, faster service, etc.
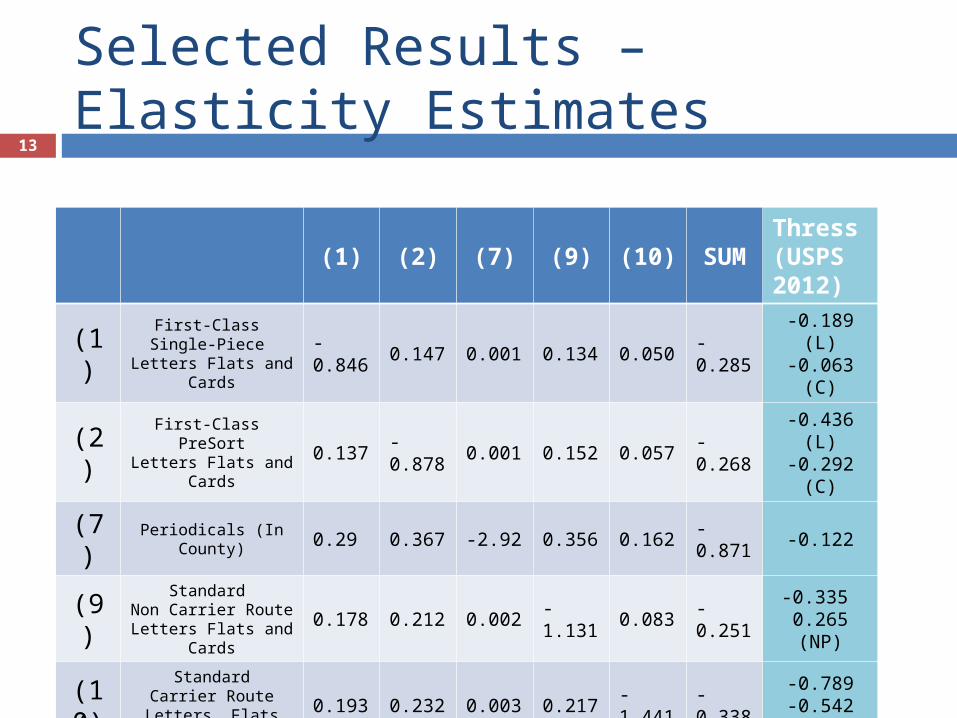
Selected Results – Elasticity Estimates
(1) (2) (7) (9) (10)SUM
Thress (USPS 2012)
(1)First-Class
Single-Piece Letters Flats and
Cards
-0.846
0.147 0.001 0.134 0.050-0.285
-0.189 (L)-0.063 (C)
(2)First-Class
PreSortLetters Flats and
Cards
0.137-0.878
0.001 0.152 0.057-0.268
-0.436 (L)-0.292 (C)
(7) Periodicals (In County) 0.29 0.367 -2.92 0.356 0.162
-0.871
-0.122
(9)Standard
Non Carrier RouteLetters Flats and
Cards
0.178 0.212 0.002-1.131
0.083-0.251
-0.335 0.265 (NP)
(10)
StandardCarrier Route
Letters, Flats and Cards
0.193 0.232 0.003 0.217-1.441
-0.338
-0.789-0.542 (NP)
13

Preliminary Conclusions14
We have found a model and methodology for estimating elasticities across all postal products Statistical properties of the model are quite good Signs of coefficients conform to expectations
U.S. postal products are much more sensitive to demand than conventional models estimate Conventional models yield estimates that combine
the effects of own and all cross-price elasticities Results should be regarded as the early results
of an initial exploration
Future Work15
Our application of the Random-Coefficient Discrete-Choice Normal mode leaves room for improvement Could fit the model using quarterly data with
post PAEA definitions of mail classes Could include a broader set of demographic
variables Could include a broader set of hedonic
properties Efficiency of the estimation methodology could
be improved through generalized least squares