estimates of selectivity for eastern atlantic bluefin tuna from catch
TRANSCRIPT
SCRS/2008/107 Collect. Vol. Sci. Pap. ICCAT, 64(2): 633-646 (2009)
633
A MANAGEMENT STRATEGY EVALUATION FRAMEWORK FOR
MEDITERRANEAN ATLANTIC BLUEFIN TUNA
L.T. Kell1 and J.-M. Fromentin2
SUMMARY This paper presents an example of Management Strategy Evaluation (MSE) for Mediterranean and East Atlantic bluefin tuna using the FLR open source framework. Scenarios corresponding to alternative plausible hypotheses about the stock dynamics were used to evaluate alternative management strategies and to test their robustness to implementation error e.g. catch mis-reporting. The strategies evaluated correspond to i) harvest control rule (HCR) based upon F0.1 (a proxy for FMSY ) with an objective of restoring the stock to a level that would “ permit the maximum sustainable catch” and ii) a reduction of fishing mortality on immature fish. The main conclusions were that the F0.1 HCR alone would not result in the recovery of the stock in the next 15 years and that additional measures are required.
RÉSUMÉ Ce document présente un exemple d’Evaluation de Stratégie de Gestion (MSE) pour le thon rouge de l’Atlantique Est et de la Méditerranée en utilisant le cadre de source libre FLR. Les scénarios correspondant à de hypothèses alternatives plausibles sur la dynamique du stock ont été utilisés pour évaluer des stratégies de gestion alternatives et tester leur robustesse à l’erreur d’implémentation, la déclaration des captures par exemple. Les stratégie évaluées correspondent à i) une réglementation de contrôle des captures (HCR) basée sur F0,1 (indice approchant de FPME ) visant à rétablir le stock à un niveau « permettant un rendement maximal soutenu » et ii) une réduction de la mortalité par pêche des poissons immatures. Les principales conclusions étaient que la HCR basée sur F0,1 ne pouvait pas, à elle seule, donner lieu au rétablissement du stock dans les 15 prochaines années et que des mesures complémentaires sont requises.
RESUMEN En este documento se presenta un ejemplo de la evaluación de estrategia de ordenación (MSE) para el atún rojo del Atlántico este y Mediterráneo utilizando un marco de fuente abierto FLR. Se utilizaron escenarios correspondientes a hipótesis plausibles alternativas sobre la dinámica del stock para evaluar estrategias de ordenación alternativas y para probar su robustez frente al error de implementación, por ejemplo, comunicación errónea de las capturas. Las estrategias evaluadas se corresponden con (i) norma de control de la captura (HCR) basada en F0.1 (aproximación de FRMS ) con el objetivo de que el stock se recupere hasta un nivel que “permitiría la captura máxima sostenible” e ii) una reducción de la mortalidad por pesca de ejemplares inmaduros. Las conclusiones principales fueron que F0.1 HCR por sí sola no daría lugar a la recuperación del stock en los próximos quince años y que es necesario adoptar medidas adicionales.
KEYWORDS
Thunnus thynnus, management plans, management strategy evaluation, simulation model
1 CEFAS, Lowestoft Laboratory, Pakefield Road, Lowestoft, Suffolk, NR33 0HT, UK. E-Mail: [email protected] 2 IFREMER, Centre de Recherche Halieutique Méditerranéen et Tropical, avenue Jean Monnet, BP 171, 34203 Sète cedex, France. E-Mail: [email protected]

634
1. Introduction In this paper we present an example of a Management Strategy Evaluation (MSE) for Atlantic bluefin tuna using the FLR open source software framework (Fisheries Library for R, http://www.flr-project.org, Kell et al. 2007). The intention is to show the advantages of the approach rather than to provide actual management advice at this stage. Although after agreeing appropriate stock hypotheses and management measures to be evaluated management advice could be provided. The three main elements of a MSE are: i) Operating Model (OM), that represents alternative plausible hypotheses about stock and fishery dynamics,
allowing integration of a higher level of complexity and knowledge than is generally used within stock assessment models;
ii) The Management Procedure (MP) or management strategy which is the combination of the available
pseudo-data, the stock assessment used to derive estimates of stock status and the management model or Harvest Control Rule (HCR) that generates the management outcomes, such as a target fishing mortality rate or Total Allowable Catch; and
iii) Observation Error Model (OEM) that describes how simulated fisheries data, or pseudo-data, are sampled
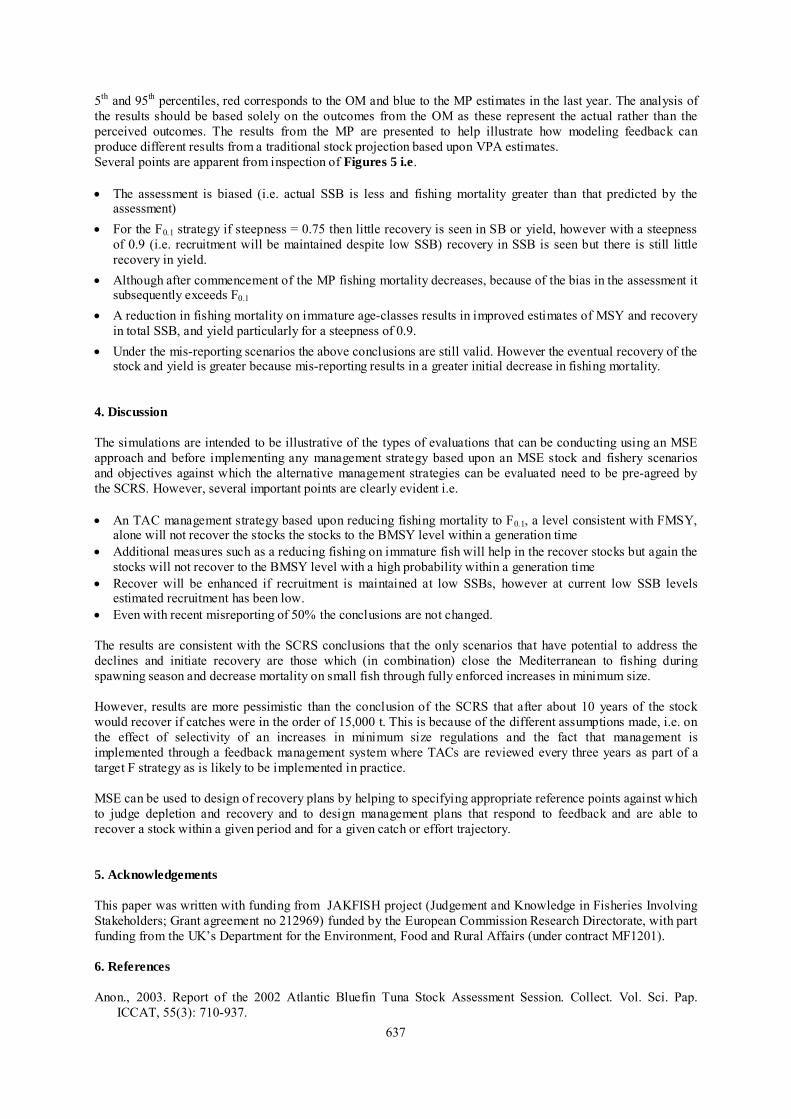
from the Operating Model. All terminology employed here is based upon that of Rademeyer et al. (2007). An important aspect of MSE is that the management outcomes from the HCR are fed back into the operating model so that their influence on the simulated stock and hence on the future simulated fisheries data is propagated through the stock dynamics (Figure 1). The success of the MSE approach depends on the extent to which the true range of uncertainty can be identified and represented in operating models. Several authors (e.g. Rosenberg and Restrepo 1994, Francis and Shotton 1997, Kell et al. 2007) have attempted to identify and categorize the uncertainties that can hinder attempts to manage fisheries (and other natural resources) successfully. These uncertainties include the following: • process error – natural variation in dynamic processes such as recruitment, somatic growth, natural mortality,
and the selectivity of the fishery; • observation error – related to collecting data from a system (e.g. age sampling, catches, surveys);
• estimation error – related to estimating parameters, both in the operating model, and, if a model-based management procedure is used, in the assessment model within the management procedure that leads to the perception of current resource status;
• model error – related to uncertainty about model structure (e.g. causal assumptions of the models), both in the operating model and in the management procedure; and
• implementation error – because management actions are never implemented perfectly and may result in realized catches that differ from those intended.
2. Material and methods The simulation framework comprises three elements, the Operating Model, Observation Error Model and the Management procedure detailed below. 2.1 Operating model The objective of this study is to use a simulation framework to evaluate management advice provided by ICCAT and the OM was constructed on the basis of the age-structured equation: Na,t = Na-1,,t-1 e-Za-1,t-1 where Na,t is the number of fish of age a at time t, and Za,t is the total mortality from age a–1 to age a. Za,t = Ma + Fa,t, where Ma is the natural mortality at age a and Fa,t is the fishing mortality at age a in year t. Life history traits

of the East Atlantic and Mediterranean population that have been used are described in Fromentin and Fonteneau (2001) and Anon. (2003): i) annual spawning (1 cohort per year), ii) 50% maturity at age 4, 100% maturity at ages 5+ (i.e. immature before age 4), iii) fecundity is linearly proportional to weight, iv) growth following the von-Bertalanffy equation used in the ICCAT working group (with the following
parameters: L∞ = 318.85, k=0.093, tO=-0.97), v) length-weight relationship used in the ICCAT working group (W=2.95.10-5*L2.899), vi) lifespan of 20 years. vii) age-specific, but time-invariant, natural mortality based on tagging experiments on the southern bluefin tuna
and used in the ICCAT working group (i.e., M=0.49 for age 1, M=0.24 for ages 2 to 5, M=0.2 for age 6, M=0.175 for age 7, M=0.15 for age 8, M=0.125 for age 9 and M=0.1 for ages 10 to 20).
Numbers and fishing mortality-at-age were taken from the most recent ICCAT assessment (Anon., 2007). The plus group in the assessment was age 10 due to lack of data for older ages, however in the OM ages older than 10 will have an important effect on the dynamics especially if fishing mortality is reduced and older ages become more abundant, therefore the plus group was extended to age 20 by assuming numbers-at-age were
proportional to the cumulative total mortality at age i.e. where F was equal to F at age 10 from the assessment. The corresponding historic time series are shown in Figure 2.
∑=
−n
iiZ
e 10
The population dynamics of the OM was further based on a Beverton and Holt stock/recruitment relationship (Beverton and Holt 1957), the fit is shown in Figure 3. There are no data to the left of the curve which would help in estimating recruitment at low stock size and inspection of residual pattern (negatively biased in the earlier period and positively later, with evidence of poor recruitment recently) shows that the fit is poor and there is also evidence of autocorrelation. Therefore the stock recruitment relationship was re-parameterized (for a given M, growth and maturity at age) in terms of steepness (τ) and virgin biomass (Francis 1992). Steepness is the fraction of the virgin recruitment (Rγ) that is expected when spawning stock biomass (SSB) has been reduced to 20% of its maximum, (i.e. R = γRγ when SSB = τ/5) and which represents the resilience of the stock to exploitation. In the absence of information on steepness, τ was set at 0.75 and 0.9, i.e., a range of values that make biological sense for bluefin tuna. The fit was re-estimated with an AR1 process. The stock recruitment parameters are given in Table 1 and the two related scenarios are shown in Table 2. The equilibrium or expected dynamics for the two assumed stock recruitment relationships are shown in Figure 4. The reference points corresponding to the points correspond to F0.1, FMSY and FCrash are indicated. In addition the effect of reducing the catchability of immature fish by 50% is shown by the thin lines. Higher yields are seen for a steepness of 0.9 and if fishing on younger ages is reduced. However, the biggest effect is seen for the fishing mortality level (Fcrash) that would drive the stock to extinction. 2.2. Observation error model There is uncertainty about the actual catch levels on which the VPA estimates are based for example the TAC advice for 2003, 2004, 2005 and 2006 was 32,000 tonnes. However, the SCRS estimates that for the recent years (including 2005 and 2006) actual catches were probably closer to about 43,000 t in the Mediterranean and about 50,000 t in the East Atlantic and Mediterranean. Therefore two alternatives were considered, either that the TAC regulations were respected or else catches are 50% greater than the TAC from 2002 onwards, Table 3.
635
636
2.3 Management procedures The Management Procedure (MP) is the specific combination of: (i) the sampling regime, (ii) the stock assessment method, (iii) the biological reference points and (iv) the management strategies. Here the MP is based on the ICCAT management regime applied to Atlantic bluefin tuna (Anon., 2003) and as simulation by Kell and Fromentin (2007) and compares two alternative forms of TAC based management (Table 4) Representing management objectives quantitatively is often one of the most difficult tasks to accomplish when evaluating management strategies since objectives are seldom defined in an operational sense. For example in the case of ICCAT, the objective is maximum sustainable catch which although often interpreted as MSY can be obtained in a variety of ways. In the same way, managers often experience great difficulty in determining how objectives can be expressed quantitatively when managing fleets by effort control or technical measures, (Sainsbury et al., 2000; Kirkwood and Smith, 1996). There are also often a wide range of possible management objectives largely of a qualitative nature. 2.3.1 Sampling regime The sampling regime corresponds to the collection of commercial catch data and the derivation of catch numbers-at-age and catch per unit effort (CPUE). These data were generated by the Observation Error Model in which growth, maturity and natural mortality-at-age were sampled without error from the OM (values were the same as used in the 2002 stock assessment and did not vary between years, see Fromentin and Kell 2006, for more details). However, catch-at-age was sampled with random error assuming a 30% CV and a log normal distribution. 2.3.2 Assessment method and biological reference points The stock assessment model used is Virtual Population Analysis (VPA) calibrated using CPUE data. VPA uses total catch-at-age data, conditional upon numbers (or fishing mortality)-at-age of the oldest age in each cohort where the latter is estimated using CPUE from the fishery, to recreate historical numbers and fishing mortality-at-age from. It is also assumed that catch and natural mortality are known without error and that there is no immigration or emigration and that the stock is homogeneous. The VPA was run over 30 years, as this is currently done within ICCAT stock assessment (Anon., 2003, 2007). The biological reference points (BRP) chosen was F0.1 a proxy for FMSY where F0.1 is the value of fishing mortality for which the slope of the yield per recruit curve (as a function of F) is 1/10th of the value at the origin, 2.3.3 Management strategies Two management strategies were considered: i) A harvest control rule (HCR) based on the ICCAT management objective of achieving a stock level that
would support the maximum sustainable yield. The total allowable catches (TACs) are set on a three year assessment cycle equivalent to achieving a level of fishing mortality equal to F0.1, based upon VPA and a short-term forecast; if current F> F0.1 F is reduced by 30% year on year until F0.1 is achieved.
ii) An additional measure based on a change in selection pattern of immature fish (i.e., younger than 5 years),
equivalent to a reduction of F of 75% of these ages. For each experimental scenario, management strategies were run for 15 years into the future because it corresponds to the generation time of Atlantic bluefin tuna (Fromentin and Kell 2006). 2.4 Scenarios Eight scenarios were run including all interactions, i.e. 2 each for the OM, OEM and MP. 3. Results The results from the scenarios are presented in summary Table 5 and Figure 5 as time series of spawning stock biomass (SSB), yield, fishing mortality and recruitment. The lines correspond to the medians, interquartile and
637
5th and 95th percentiles, red corresponds to the OM and blue to the MP estimates in the last year. The analysis of the results should be based solely on the outcomes from the OM as these represent the actual rather than the perceived outcomes. The results from the MP are presented to help illustrate how modeling feedback can produce different results from a traditional stock projection based upon VPA estimates. Several points are apparent from inspection of Figures 5 i.e. • The assessment is biased (i.e. actual SSB is less and fishing mortality greater than that predicted by the
assessment) • For the F0.1 strategy if steepness = 0.75 then little recovery is seen in SB or yield, however with a steepness
of 0.9 (i.e. recruitment will be maintained despite low SSB) recovery in SSB is seen but there is still little recovery in yield.
• Although after commencement of the MP fishing mortality decreases, because of the bias in the assessment it subsequently exceeds F0.1
• A reduction in fishing mortality on immature age-classes results in improved estimates of MSY and recovery in total SSB, and yield particularly for a steepness of 0.9.
• Under the mis-reporting scenarios the above conclusions are still valid. However the eventual recovery of the stock and yield is greater because mis-reporting results in a greater initial decrease in fishing mortality.
4. Discussion The simulations are intended to be illustrative of the types of evaluations that can be conducting using an MSE approach and before implementing any management strategy based upon an MSE stock and fishery scenarios and objectives against which the alternative management strategies can be evaluated need to be pre-agreed by the SCRS. However, several important points are clearly evident i.e. • An TAC management strategy based upon reducing fishing mortality to F0.1, a level consistent with FMSY,
alone will not recover the stocks the stocks to the BMSY level within a generation time • Additional measures such as a reducing fishing on immature fish will help in the recover stocks but again the
stocks will not recover to the BMSY level with a high probability within a generation time • Recover will be enhanced if recruitment is maintained at low SSBs, however at current low SSB levels
estimated recruitment has been low. • Even with recent misreporting of 50% the conclusions are not changed. The results are consistent with the SCRS conclusions that the only scenarios that have potential to address the declines and initiate recovery are those which (in combination) close the Mediterranean to fishing during spawning season and decrease mortality on small fish through fully enforced increases in minimum size. However, results are more pessimistic than the conclusion of the SCRS that after about 10 years of the stock would recover if catches were in the order of 15,000 t. This is because of the different assumptions made, i.e. on the effect of selectivity of an increases in minimum size regulations and the fact that management is implemented through a feedback management system where TACs are reviewed every three years as part of a target F strategy as is likely to be implemented in practice. MSE can be used to design of recovery plans by helping to specifying appropriate reference points against which to judge depletion and recovery and to design management plans that respond to feedback and are able to recover a stock within a given period and for a given catch or effort trajectory. 5. Acknowledgements This paper was written with funding from JAKFISH project (Judgement and Knowledge in Fisheries Involving Stakeholders; Grant agreement no 212969) funded by the European Commission Research Directorate, with part funding from the UK’s Department for the Environment, Food and Rural Affairs (under contract MF1201). 6. References Anon., 2003. Report of the 2002 Atlantic Bluefin Tuna Stock Assessment Session. Collect. Vol. Sci. Pap.
ICCAT, 55(3): 710-937.

638
Anon., 2007. Report of the 2006 Atlantic Bluefin Tuna Stock Assessment Session. Collect. Vol. Sci. Pap. ICCAT, 60(3): 652-880.
Beverton, R.J.H., and Holt, S.J., 1957. On the dynamics of exploited fish populations. Fish. Investig. London Ser. 2. No. 19.
Francis, R.I.C.C. and Shotton, R., 1997. ‘Risk’ in fisheries management: a review. Can. J. Fish. Aquat. Sci. 54: 1699-1715.
Fromentin, J.M., Kell, L.T., 2007. Consequences of variations in carrying capacity or migration for the perception of Atlantic bluefin tuna population dynamics. Canadian Journal of Fisheries and Aquatic Science 67, 627-836.
Kell, L.T., Fromentin, J.M., 2007. Evaluation of the robustness of MSY-based management strategies to variations in carrying capacity or migration pattern of Atlantic bluefin tuna Canadian Journal of Fisheries and Aquatic Science 67, 837-847.
Kell, L.T., Mosqueira, I., Grosjean, P., Fromentin, J-M., Garcia, D., Hillary, R., Jardim, E., Mardle, S., Pastoors, M.A., Poos, J.J., Scott, F. and Scott. R.D., 2007. FLR: an open-source framework for the evaluation and development of management strategies. ICES Journal of Marine Science 64:640-646.
Kirkwood, G.P. and Smith, A.D.M., 1996. Assessing the precautionary nature of fishery management strategies. In Precautionary Approach to Fisheries, Part 2: Scientific Papers. FAO Fisheries Technical Paper 350/2: 141-158.
Rademeyer, R.A., Plaga´nyi, E.E., and Butterworth, D.S., 2007. Tips and tricks in designing management procedures. ICES Journal of Marine Science, 64: 618-625.
Rosenberg, A.A. and Restrepo, V.R., 1994. Uncertainty and risk evaluation in stock assessment advice for U.S. marine fisheries. Can. J. Fish. Aquat. Sci. Vol. 51 (12), pp. 2715-2720.
Sainsbury, K.J., Punt, A.E. and Smith, A.D.M., 2000. Design of operational management strategies for achieving fishery ecosystem objectives. ICES J. Mar. Sci. 57: 731-741.

639
Table 1. Stock recruitment parameters.
Steepness Virgin biomass Autocorrelation 0.85 124475 0.0 0.75 124475 0.73 0.95 124475 0.73 Table 2. OM scenarios.
Scenario Factor Level
OM.1 Beverton and Holt stock recruitment relationship Steepness =0.75
OM.2 Steepness =0.9 Table 3. OEM scenarios.
Scenario Factor Level
OM.1 TAC misreporting None
OM.2 50% Table 4. MP scenarios.
Scenario Factor
MP.1 TAC management based upon an F0.1 strategy
MP.2 TAC as above plus 50% reduction in Selectivity at age for immature age classes Table 5. Summary statistics by scenario of the median values of SSB relative to BMSY and yield relative to MSY after one generation time (i.e. 2019).
Scenarios Median after 1 generation time
As Estimated Prior to Mesh Change
As Estimated Post Mesh Change
Misreporting Selectivity on Immature age classes
Steepness SSB/BMSY Yield/MSY SSB/BMSY Yield/MSY
None Status Quo 0.75 0.20 0.25 0.90 0.46 0.47 Reduced by 50% 0.75 0.29 0.53 0.30 0.46 0.90 0.56 0.83 0.57 0.72 50% Status Quo 0.75 0.34 0.40 0.90 0.62 0.61 Reduced by 50% 0.75 0.39 0.64 0.40 0.56 0.90 0.65 0.91 0.67 0.79
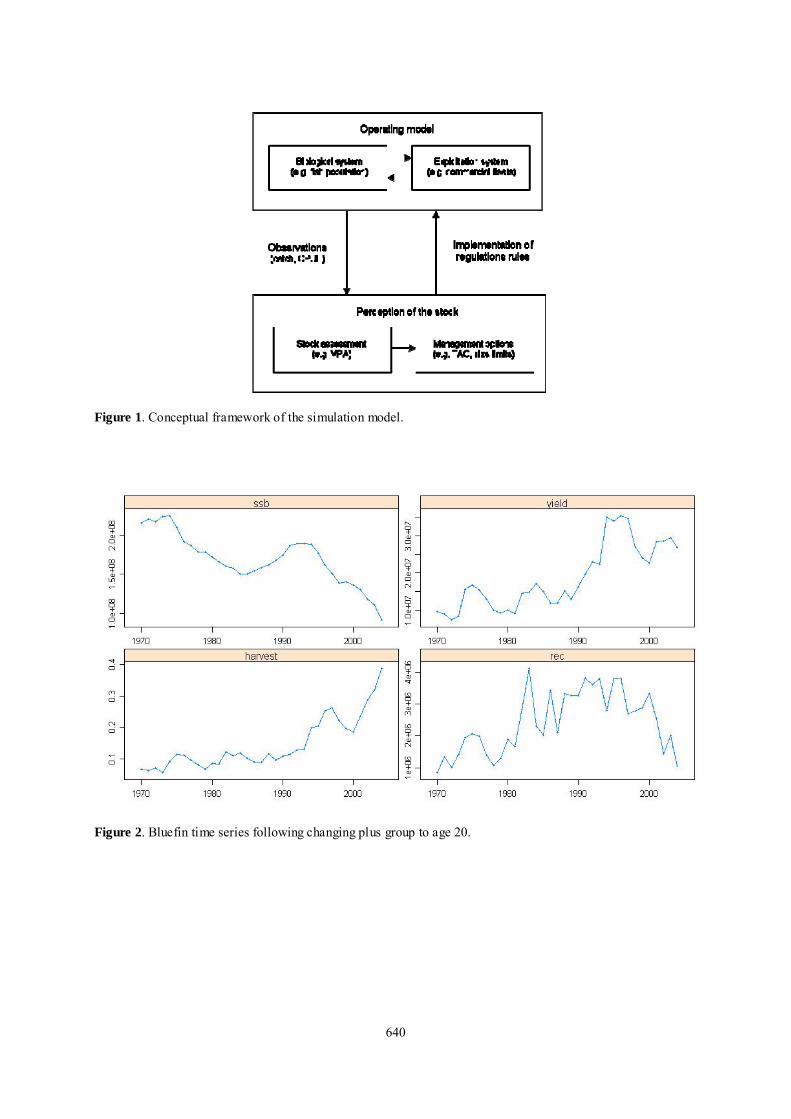
Figure 1. Conceptual framework of the simulation model.
Figure 2. Bluefin time series following changing plus group to age 20.
640

Figure 3. Beverton and Holt stock recruitment relationship as fitted to the bluefin time series.
641
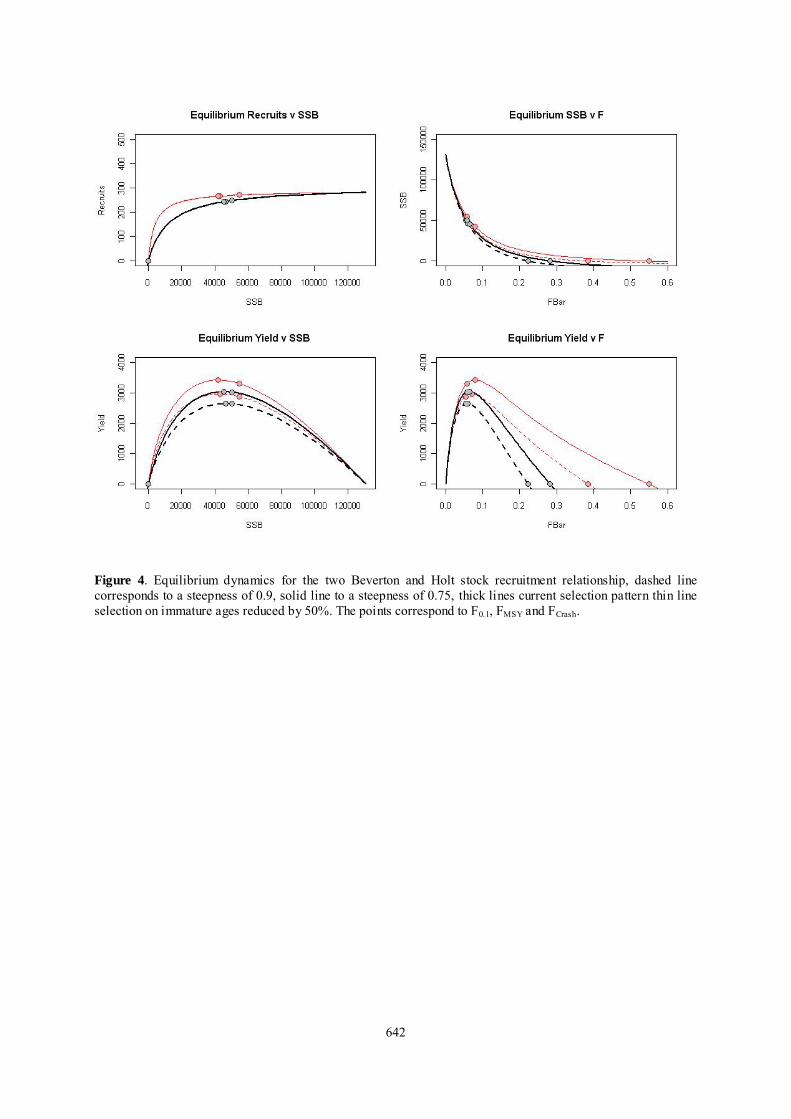
Figure 4. Equilibrium dynamics for the two Beverton and Holt stock recruitment relationship, dashed line corresponds to a steepness of 0.9, solid line to a steepness of 0.75, thick lines current selection pattern thin line selection on immature ages reduced by 50%. The points correspond to F0.1, FMSY and FCrash.
642

Figure 5a. Steepness=0.75 (OM.1), no misreporting (OEM1.) and TAC based management (MP.1).
Figure 5b. Steepness=0.9 (OM.1), no misreporting (OEM1.) and TAC based management (MP.1).
643

Figure 5c. Steepness=0.75 (OM.1), no misreporting (OEM1.) and TAC based management plus reduced selectivity on immature age-classes (MP.1).
Figure 5d. Steepness=0.9 (OM.1), no misreporting (OEM1.) and TAC based management plus reduced selectivity on immature age-classes (MP.1).
644
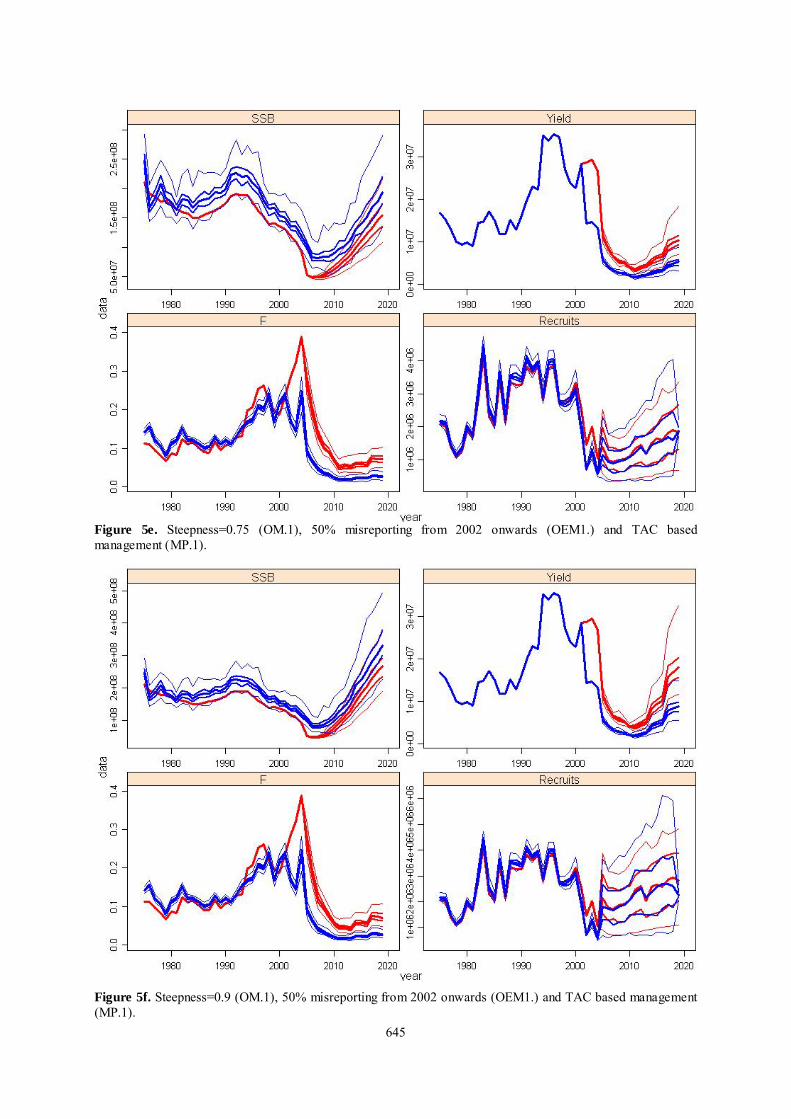
Figure 5e. Steepness=0.75 (OM.1), 50% misreporting from 2002 onwards (OEM1.) and TAC based management (MP.1).
Figure 5f. Steepness=0.9 (OM.1), 50% misreporting from 2002 onwards (OEM1.) and TAC based management (MP.1).
645

Figure 5g. Steepness=0.75 (OM.1), 50% misreporting from 2002 onwards (OEM1.) and TAC based management plus reduced selectivity on immature age-classes (MP.1).
Figure 5h. Steepness=0.9 (OM.1), 50% misreporting from 2002 onwards (OEM1.) and TAC based management plus reduced selectivity on immature age-classes (MP.1).
646