estimates of output, income, value added and …
TRANSCRIPT

ESTIMATES OF OUTPUT, INCOME, VALUE ADDED
AND EMPLOYMENT MULTIPLIERS FOR THE
MALTESE ECONOMY
Ian P. Cassar1
WP/03/2015
1 Dr Ian P. Cassar was engaged by the Bank to conduct this research under the editorial supervision of Dr Aaron
G. Grech, Head of Modelling and Research Department at the Central Bank of Malta. Dr Cassar is a lecturer in the Economics Department of the University of Malta. He would like to thank Prof. Josef Bonnici, Prof. Albert Leone Ganado, Dr Bernard Gauci, Mr Jesmond Pule and Mr. Joseph Bonello for their helpful comments and suggestions. The views expressed in this paper are those of the author and do not necessarily reflect those of the Central Bank of Malta. Any errors are the author’s own.
Corresponding author’s email address: [email protected]
1
Abstract
The study presents the first published estimates of industry specific multipliers which are
derived utilizing a highly disaggregated symmetric input-output table for the Maltese
Economy for 2008 which adheres to Eurostat System of National and Regional Accounts
(1995). The application of selected input-output models, which are a deterministic class of
models, to the symmetric input-output table allows for the estimation of industry specific
multipliers. The aim of this study is to derive output, income, value added and employment
multipliers at highly disaggregated industry level to study how an exogenous shock to the
final demand of each of these industries would affect the Maltese economy. Both the open
and the closed Leontief demand driven model (with respective to households) are utilized to
derive type I and type II multipliers with which to undertake a comparative analysis of the
direct, indirect and induced effects in terms of the income, output, value added and
employment generation for each industry within the Maltese Economy.
JEL Classification: C67, D57.
Keywords: Input-output analysis, Output multipliers, Income Multipliers, Value added
Multipliers, Employment multipliers, Malta.
2
Table of Contents
Abstract
1. Introduction………………………………………………………………… 3
2. Data and methodology……………………………………………………. 4
3. Type I and type II output multipliers……………………………………... 8
4. Income, value added and employment multipliers…………………….12
4.1 Income multipliers…………………………………………………….12
4.2 Value added multipliers……………………………………….......... 15
4.3 Employment multipliers…………………………………………....... 18
5. Conclusion…………………………………………………………………. 22
References.………………………………………………………………........24
Appendix A: Classification of industries following NACE Rev.2………… 26
Appendix B: Additional statistics derived from the symmetric input-output table of 2008……………………………………..28
Appendix C: Type I and type II output multipliers..……………………….. 30
Appendix D: Income, value added and employment ratios……………… 32
Appendix E: Type I and type II income-output multipliers……………….. 34
Appendix F: Type I and type II value added-output multipliers…………..36
Appendix G: Type I and type II employment-output multipliers…………. 38
3
1. Introduction
This study2 aims to derive and analyse a number of selected industry specific multipliers
based on the input-output methodological framework which portrays, at a highly
disaggregated industry level, how an increase in final demand to each of these industries
could potentially affect the Maltese economy. A significant advantage of utilizing input-output
methodology is that the resulting multipliers incorporate not only the direct effects, but also
the indirect and the induced effects on the economy as a result of an exogenous shock to
one of the components of final demand. Input-output multipliers are principally underpinned
by the interrelations between production sectors. Their strength or weakness strongly
influences sectoral growth which in turn has a significant impact on the overall economic
activity.
This study presents the derivation and analysis of both type I and type II output (production),
income (income-output), value added (value added-output) and employment (employment-
output) multipliers. The analysis conducted within this study is based on techniques which
have their foundation in the input-output methodology originally put forward by economist
Wassily Leontief for which he was later awarded a Nobel Prize in economics in 19733. Since
then there have been numerous theoretical and empirical studies on the various aspects of
multiplier linkages analysis within the input-output literature 4. Over the years input-output
analysis has grown into one of the most widely accepted methods of economic planning and
decision making. There have been only a few studies5 on the Maltese economy conducted
via the application of input-output analysis and the majority of these studies been conducted
with the aim to assess the impact of tourism6 on the Maltese economy. However, these
studies either utilize input-output tables which are not highly disaggregated, or which have
missing components, or which do not comply with either the Eurostat System of National and
Regional Accounts published in 1995 (ESA 95) or with the Eurostat methodological
guidelines for the construction of a symmetric input-output table (SIOT).
2 This study is in part based on the methodology also applied by the author in Cassar (2013).
3 Refer to Leontief (1941).
4 Refer to Blair and Wyckoff (1989) and Drejer (2002).
5Refer to Bonnici (1980), Bonnici (1983) and Gravino (2012).
6 Refer to Briguglio (1992) and Blake et.al.(2003b)
4
2. Data and Methodology
The application of input-output techniques requires the utilization of symmetric input-output
table (SIOT). An SIOT is an observed dataset illustrating the inter-industry transactions for a
specific geographic region measured for a particular time period (usually one year) and
which is generally recorded in monetary terms. The multipliers derived in this analysis are
based on an industry-by-industry SIOT for the reference year of 2008 which was constructed
by transforming the most recent set of supply and use tables for the Maltese Economy into a
SIOT by following the fixed product sales assumption transformation model which follows the
Eurostat Manual of Supply, Use and Input-Output Tables published in 2008. The SIOT was
derived from the supply and use tables for the year 2008, published by the National
Statistics Office of Malta in 2013. The supply and use tables were compiled according to the
concepts and definitions of the ESA 95. The resulting SIOT for Malta for 2008 has a 59
industry level of disaggregation which follows in large part the classification according to the
European Statistical Classification of Economic Activates (NACE)7 Rev.2.
An input-output table records the economy's inter-industry transactions via the
disaggregation of the economic activity into ‘n’ sectors or industries representing the various
producing sectors of the economy. The core data required to populate the Leontief demand
driven model essentially consist of the flows of products from each of the ‘n’ producing
sectors to each of the ‘n’ sectors purchasing input requirements in order to undertake the
production of output. The flow of products amongst the ‘n’ producing sectors of the economy
is what is referred to as inter-industry flows (or transactions). The input-output table is
therefore a data-set which essentially traces the monetary values of the numerous
transactions amongst the pairs of sectors (for each sector ‘i’ to each sector ‘j’) for a given
year. These recorded transfer payments portray a set of systematic relations which may then
be represented as a large set of linear equations. Each of these linear equations ultimately
illustrates the distribution of each industry's output throughout the whole of the economy.
The basic Leontief demand driven model presented within this study follows the
methodology presented within Miller and Blair (2009). This model may be defined as a fixed
price general static equilibrium model which describes the interrelations between industries
taking into account the technical relations throughout the economy via fixed-coefficient
production functions. At the core of the Leontief demand driven model is the concept of
7 The European Statistical Classification of Economic Activates (NACE) Rev 2, disaggregated to a 59 industry
level is presented in Appendix A.

5
technical coefficients denoted by ‘aij’. Technical coefficients are a measure of the fixed
relationships between a sector's output and its inputs. They describe the amount of input ‘i’
needed by sector ‘j’ to produce a unit of good ‘j’ such that, to produce ‘xj’ units of good ‘j’,
one would require ‘aijxj’ units of input ‘i’. From this definition it follows that:
Technical coefficients show, for each industry in the economy, the proportional value of
inputs purchased from all sectors in the economy (including itself) per monetary unit of
output. Leontief (1936) describes these fixed technical coefficients as constituting a “recipe”
of production for each industry's output. Following the above definition of a technical co-
efficient it is possible to construct a matrix of technical coefficients (denoted by matrix A)
representing the structure of production of this economy. The columns of the technical
coefficients matrix show the production functions of each productive sector within this
economy. Once the matrix of technical coefficients has been derived it is then possible to
compute the solution to the (open) Leontief demand driven model which is specified as:
The solution to the input-output system implies that, given the Leontief Inverse matrix, the
amount of total output (X) produced is determined solely by the structure of final demand (Y).
The key component necessary for the derivation of the industry specific multiplier is thus the
Leontief Inverse matrix (L) denoted by:
The elements within the Leontief inverse matrix (also known as multiplier matrix) incorporate
the notion that increases in final demand have a larger impact, on the overall production of
output, than solely the initial output produced (direct effects) required to supply the increase
in final demand. The Leontief inverse incorporates the concept that the production process
required to produce a unit of output for use by final demand, also requires the production of
output by other industries for use as intermediate inputs. Furthermore, the production of
these additional intermediate inputs requires subsequent increased rounds of production
since output has to be produced to satisfy the second round of input requirements. All these

6
rounds of additional increases in output are referred to as the indirect effects of an
exogenous increase in final demand on total output production.
The multipliers obtained from the open Leontief demand driven model are referred to as
type I multipliers, since they reflect only direct and indirect effects on production caused by
exogenous changes to final demand and omit the notion that increased production requires
more labour input which in turn increases household income which further increases
demand and consequently production. Households are thus not included within the matrix of
technical coefficients (A), but are considered to form part of final demand (Y). Within input-
output literature, type II output multipliers are generally referred to as the multipliers which
are obtained from a closed Leontief demand driven model. The term closed relates to the
fact that the technical coefficients matrix is closed with respect to households. The closed
Leontief demand driven model is derived from a SIOT and its application entails
endogenizing the behaviour of households within the economic system. These multipliers
capture the inter-relationships between revenue, income, and expenditure flows made by
households and the productive sector. The resultant multipliers also include the induced
effects relating to the additional impact on domestic production caused by the demand for
goods and services made by households induced through the additional income which is
obtained via the production of the new output originally associated with the initial exogenous
shock to final demand.
Solving the closed Leontief demand driven model for the household augmented technical
coefficients matrix would generate a Leontief inverse matrix of dimension (n+1) x (n+1) in
which each element would now capture the direct, indirect as well as the induced effects in
output production caused by an increase in exogenous final demand:
Such that the corresponding Leontief inverse matrix for the closed Leontief model is
specified as:
The difference between type I multipliers derived from the open Leontief demand driven
model and the type II multipliers derived from the closed Leontief demand driven model is
7
the induced effects which are caused by the added endogeneity of household behaviour.
The induced multiplier effects on the production activities of the ‘n’ sectors may be captured
and assessed individually via the computation of the difference between the truncated
Leontief multiplier matrix which may be derived from the above equation and the Leontief
multiplier matrix where households are treated as exogenous. Since the truncated
household endogenized multiplier matrix and the SIOT type I multiplier matrix are of the
same (n x n) dimension it would be possible to derive the induced multiplier effects for
sector ‘j’ as the column summation of the derived matrix of the induced effects.
One of the main factors which has a significant role in determining the overall magnitude of
the derived type I multipliers relates to the relative share of leakages from the domestic inter-
industry system in terms of import use, labour use or even total primary inputs use as a
share of the total input requirements for each industry. Given that Malta is a small open
economy, of great significance to the relative magnitude of the multipliers for each industry is
the extent of import use as a share of total input requirements per sector. The higher the
import content within the production process of a sector the smaller the magnitude of the
resulting multipliers for that sector will be. Additionally since we will also be deriving the type
II multipliers, another factor which will have a significant impact in determining the size of
these multipliers relates to the consumption pattern of households. The larger the share of
household income that is spent on consumption expenditure rather than being leaked out of
the system via, for example savings or taxation, the larger the induced effects would be.
Oosterhaven, Peik and Stedler (1986) assert that a realistic estimate of the true direct and
indirect effects of an increase in final demand on output, income and employment generally
lies roughly half way between the type I and type II multipliers. This statement is motivated
by the suggestion that type I multipliers probably underestimate economic impacts given that
they omit household and factor income activities, and that on other hand type II multipliers
probably overestimate these impacts due to the rigid assumptions regarding the behaviour of
household income-expenditure patterns.
8
3. Type I and type II output multipliers
An output multiplier for a given sector ‘j’ may be defined as the total value of production in all
sectors of the economy that is necessary in order to satisfy a 1 Euro worth of final demand
for sector ‘j's’ output. In other words the output multiplier measure captures the total sum of
direct and indirect input requirements from all sectors needed to supply 1 Euro worth of
sector ‘j's’ output to final demand. The type I output multipliers which captures solely the
direct and indirect effects can be derived via the summation of the column elements of the
Leontief inverse matrix as follows:
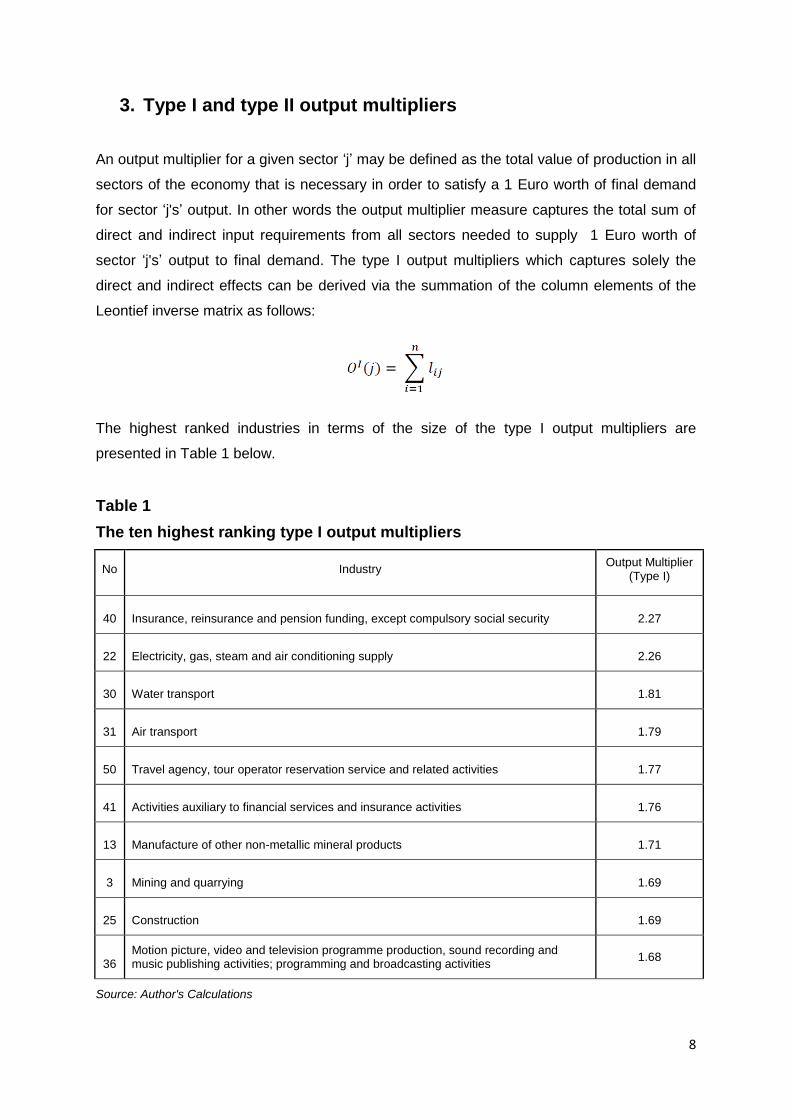
The highest ranked industries in terms of the size of the type I output multipliers are
presented in Table 1 below.
Table 1
The ten highest ranking type I output multipliers
No Industry Output Multiplier
(Type I)
40 Insurance, reinsurance and pension funding, except compulsory social security 2.27
22 Electricity, gas, steam and air conditioning supply 2.26
30 Water transport 1.81
31 Air transport 1.79
50 Travel agency, tour operator reservation service and related activities 1.77
41 Activities auxiliary to financial services and insurance activities 1.76
13 Manufacture of other non-metallic mineral products 1.71
3 Mining and quarrying 1.69
25 Construction 1.69
36 Motion picture, video and television programme production, sound recording and music publishing activities; programming and broadcasting activities
1.68
Source: Author's Calculations
9
It is observed that the industry with the largest type I output multiplier, is (40) Insurance,
reinsurance and pension funding, except compulsory social security sector which has a type
I output multiplier of 2.27 followed by the (22) Electricity, gas, steam and air conditioning
supply sector which has a multiplier of 2.26. This implies that every additional Euro worth of
final demand for the (40) Insurance, reinsurance and pension funding, except compulsory
social security sector industry, through direct and indirect effects, would generate a total
value in production from all sectors in the economy of 2.27 Euro. The type 1 multiplier
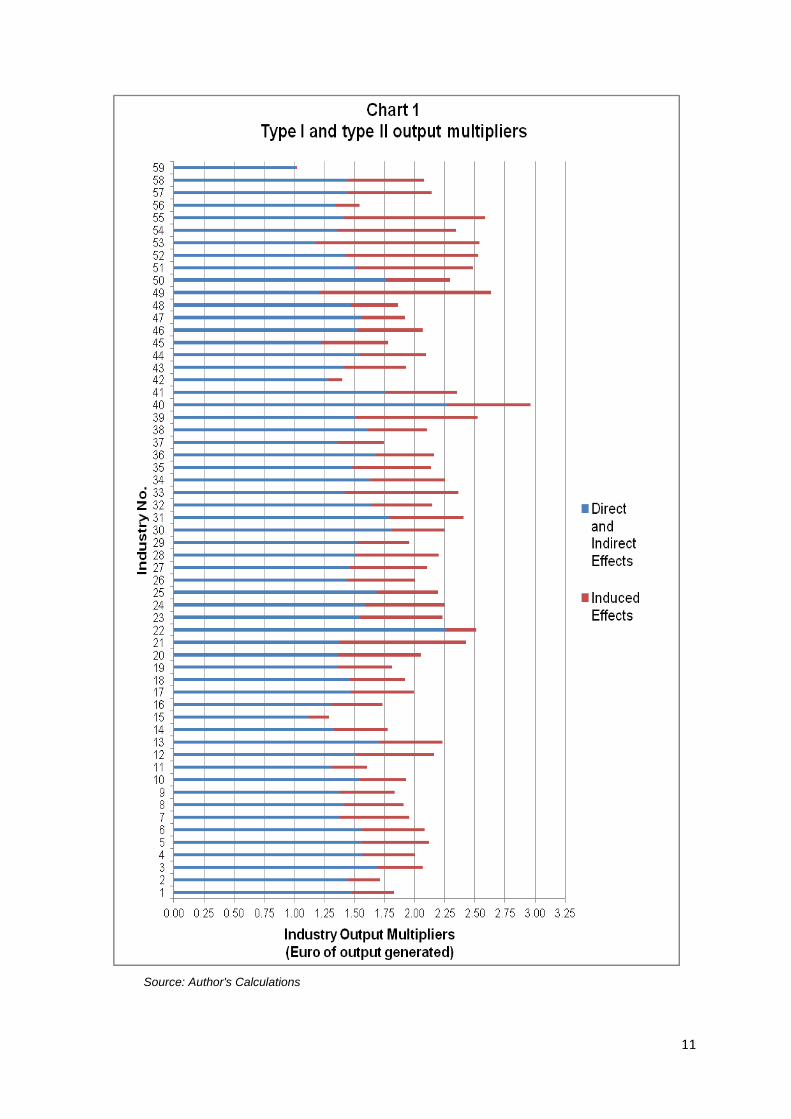
estimates for all 59 sectors8 may be viewed in Chart 1 by assessing the disaggregated direct
and indirect component of the type II multiplier.
Type II output multipliers capture the direct, indirect and induced output multiplier effects that
a 1 Euro increase in final demand of a specific industry will have on overall output
production. These multipliers are based on the Leontief Inverse matrix derived from the
solution to the closed Leontief demand driven model. Type II multipliers are derived via the
summation of the column elements of the truncated household endogenized Leontief inverse
matrix as follows:
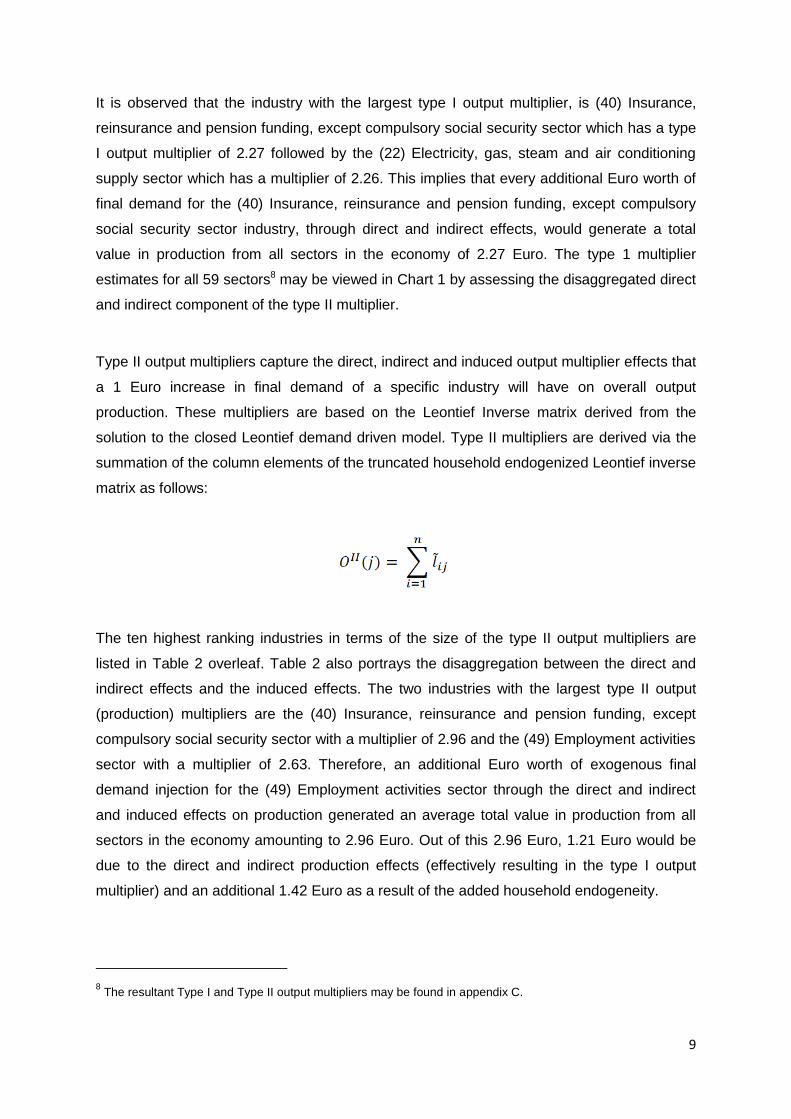
The ten highest ranking industries in terms of the size of the type II output multipliers are
listed in Table 2 overleaf. Table 2 also portrays the disaggregation between the direct and
indirect effects and the induced effects. The two industries with the largest type II output
(production) multipliers are the (40) Insurance, reinsurance and pension funding, except
compulsory social security sector with a multiplier of 2.96 and the (49) Employment activities
sector with a multiplier of 2.63. Therefore, an additional Euro worth of exogenous final
demand injection for the (49) Employment activities sector through the direct and indirect
and induced effects on production generated an average total value in production from all
sectors in the economy amounting to 2.96 Euro. Out of this 2.96 Euro, 1.21 Euro would be
due to the direct and indirect production effects (effectively resulting in the type I output
multiplier) and an additional 1.42 Euro as a result of the added household endogeneity.
8 The resultant Type I and Type II output multipliers may be found in appendix C.
10
Table 2
The ten highest ranking type II output multipliers
No Industry Direct and
Indirect Effects (Type I)
Induced Effects
Type II Multipliers
40 Insurance, reinsurance and pension funding, except compulsory social security 2.27 0.69 2.96
49 Employment activities 1.21 1.42 2.63
55 Social work activities 1.41 1.17 2.59
53 Education 1.18 1.36 2.54
52 Public administration and defence; compulsory social security 1.42 1.10 2.53
39 Financial service activities, except insurance and pension funding 1.51 1.01 2.52
22 Electricity, gas, steam and air conditioning supply 2.26 0.25 2.51
51 Security and investigation activities; services to buildings and landscape activities; office administrative, office support and other business support activities
1.50 0.98 2.49
21 Repair and installation of machinery and equipment 1.37 1.05 2.43
31 Air transport 1.79 0.61 2.41
Source: Author's Calculations
Comparing the results obtained from the type I and type II output multipliers, which are
illustrated in Chart 1, it may be observed that the added endogeneity has generated a
consistent upward pressure in terms of the magnitude of the multiplier effects for all the
productive sectors in the economy. We may also note that the additional induced effects
result in a number of significant changes in terms of the relative ranking amongst sectors9.
The sectors which generate the largest overall levels of induced effects within the economy
are the (49) Employment activities and the (53) Education sector sectors.
9 The respective industry ranking of the type I and type II output multipliers may be found in appendix C.
11
Source: Author's Calculations
12
4. Income, value added and employment multipliers
The derived output multipliers show where increases in final demand could have the greatest
impact in terms of Euro of output generated throughout the economy. However policy
makers may be more concerned with the impacts that additional spending might have in
terms of increased household income, value added or in terms of jobs created. Within the
input-output literature there are various specifications of income, employment and value
added multipliers. Since one of the aims of this study is to provide policy makers with
measures that estimate the possible differential effects of an exogenous demand shock to
final demand on the economy by industry, an appropriate specification to use would be the
income-output, value added-output and employment-output multipliers. These multiplier
measures directly convert the total Euro value of new final demand expenditure into new
income earned by households, value added generated and new employment created.
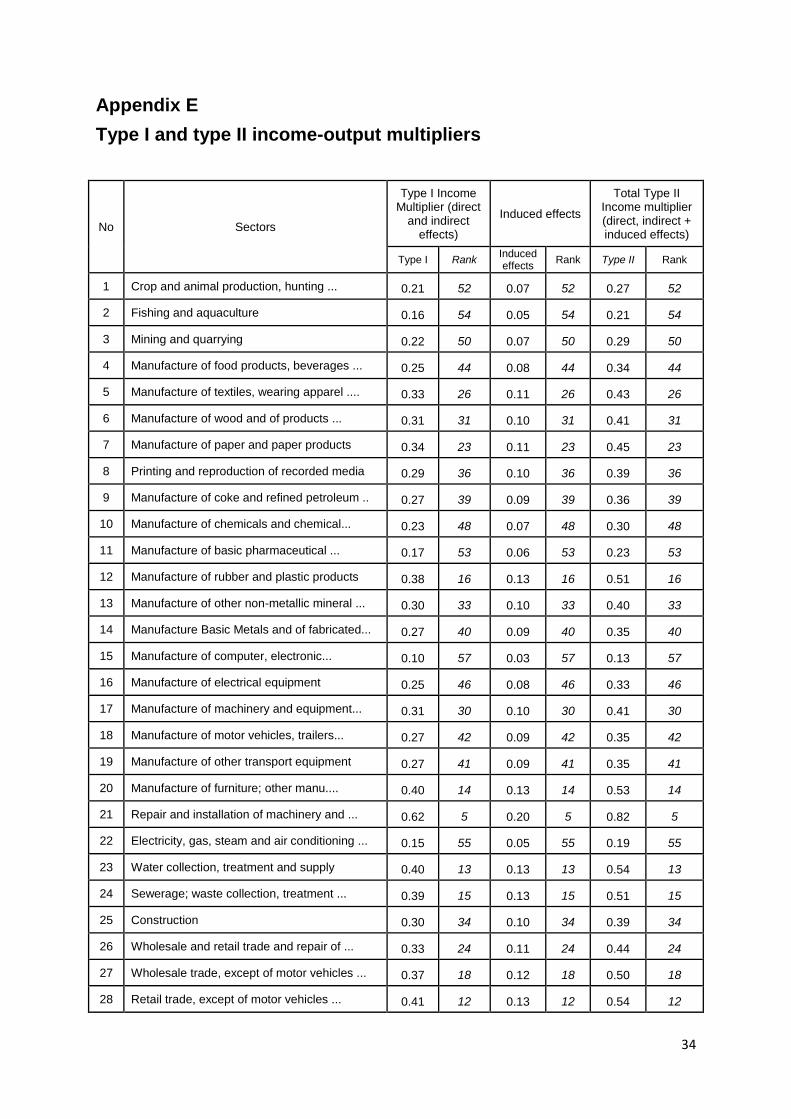
4.1 Income multipliers
The type I income-output multipliers are calculated by the multiplication of the row vector ‘ah’,
a row vector of labour-input coefficients 10 , with the SIOT Leontief inverse where ( )
represents the type I income-output multiplier for sector ‘j’.
The resulting multiplier illustrates the effect of an additional Euro of final demand for the
output of sector ‘j’, when all of the direct and indirect effects in the production process are
converted into a Euro estimate of new household income generated. Similarly a type II
income-output multiplier can be obtained for a sector ‘j’, which now includes direct, indirect
and the induced effect in terms of a Euro estimate of new household income generated
which results from a Euro worth of new final demand for the goods of sector ‘j’. We can
derive these type II income-output multipliers using the row vector of labour-input coefficients
‘ah’ and truncated household endogenized SIOT multiplier matrix which measures the direct,
indirect and induced effects on only the ‘n’ production activities which are caused by
exogenous changes to final demand. From the type I and type II income-output multipliers it
is also possible to decompose the individual direct, indirect and induced effects in terms of
10
The labour input-coefficients may be found in appendix D.
13
Euro of labour income per additional Euro worth of final demand for each sector. The
elements of the vector of labour-input coefficient ah, reflect the initial direct effect on labour
income which is generated in response to an additional Euro of final demand for each sector
j. The separate indirect effects may be estimated based on the differences between the type
I income-output multiplier, which incorporates both the direct and indirect effects, and the
initial labour-input coefficient, which represents the direct effects. Similarly the separate
induced effects caused by the added household endogeneity may be estimated on the basis
of the differences between the type II and the type I income-output multipliers. Summed
together the direct, indirect and induced effects equate to the total effects reflected by the
type II income-output multipliers.
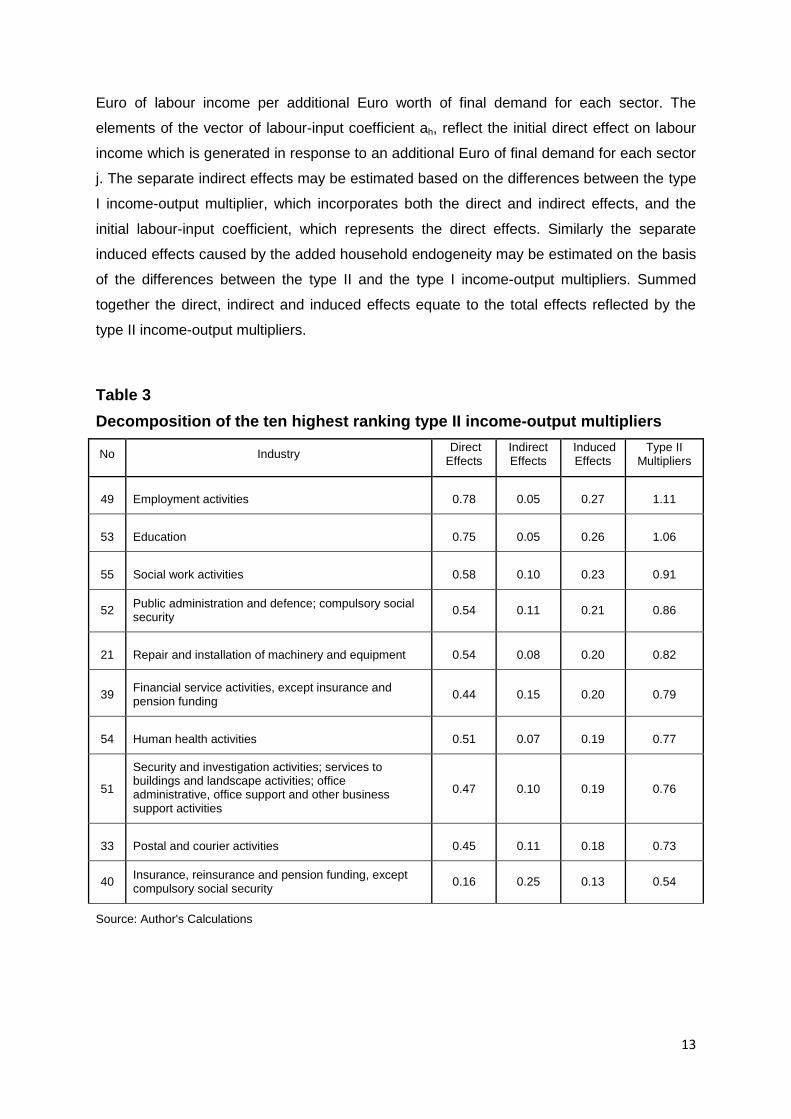
Table 3
Decomposition of the ten highest ranking type II income-output multipliers
No Industry Direct Effects
Indirect Effects
Induced Effects
Type II Multipliers
49 Employment activities 0.78 0.05 0.27 1.11
53 Education 0.75 0.05 0.26 1.06
55 Social work activities 0.58 0.10 0.23 0.91
52 Public administration and defence; compulsory social security
0.54 0.11 0.21 0.86
21 Repair and installation of machinery and equipment 0.54 0.08 0.20 0.82
39 Financial service activities, except insurance and pension funding
0.44 0.15 0.20 0.79
54 Human health activities 0.51 0.07 0.19 0.77
51
Security and investigation activities; services to buildings and landscape activities; office administrative, office support and other business support activities
0.47 0.10 0.19 0.76
33 Postal and courier activities 0.45 0.11 0.18 0.73
40 Insurance, reinsurance and pension funding, except compulsory social security
0.16 0.25 0.13 0.54
Source: Author's Calculations
14
Source: Author's Calculations

15
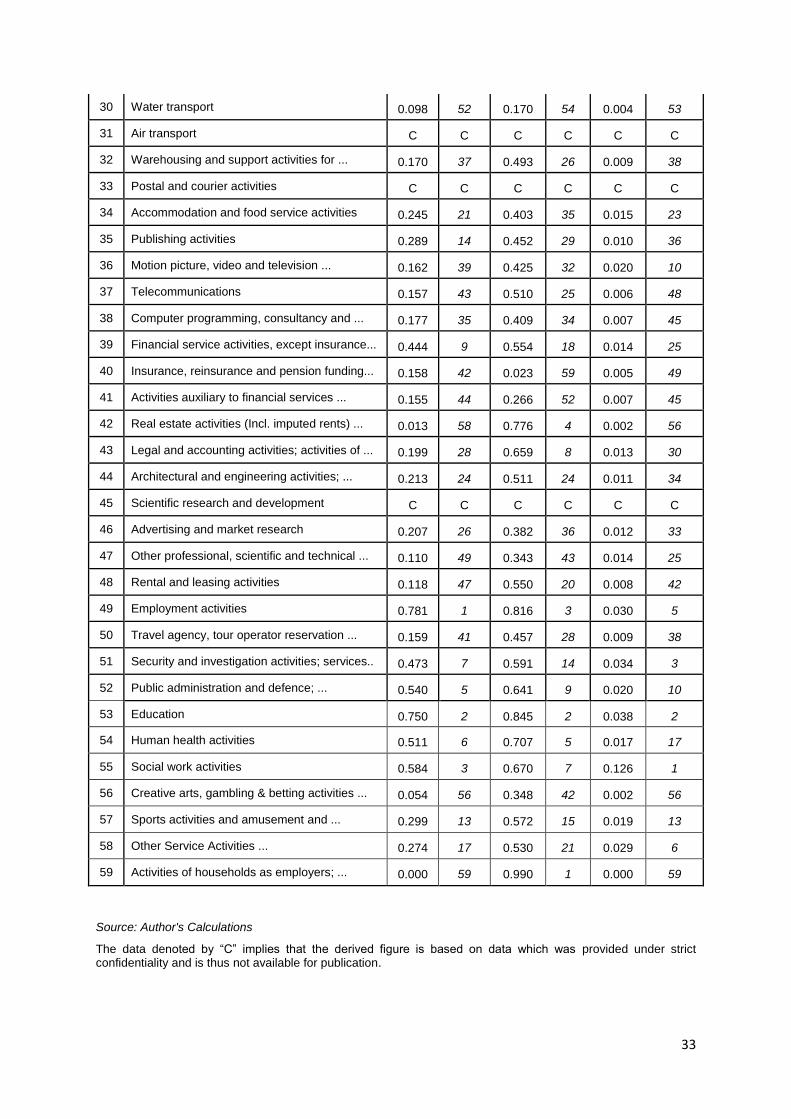
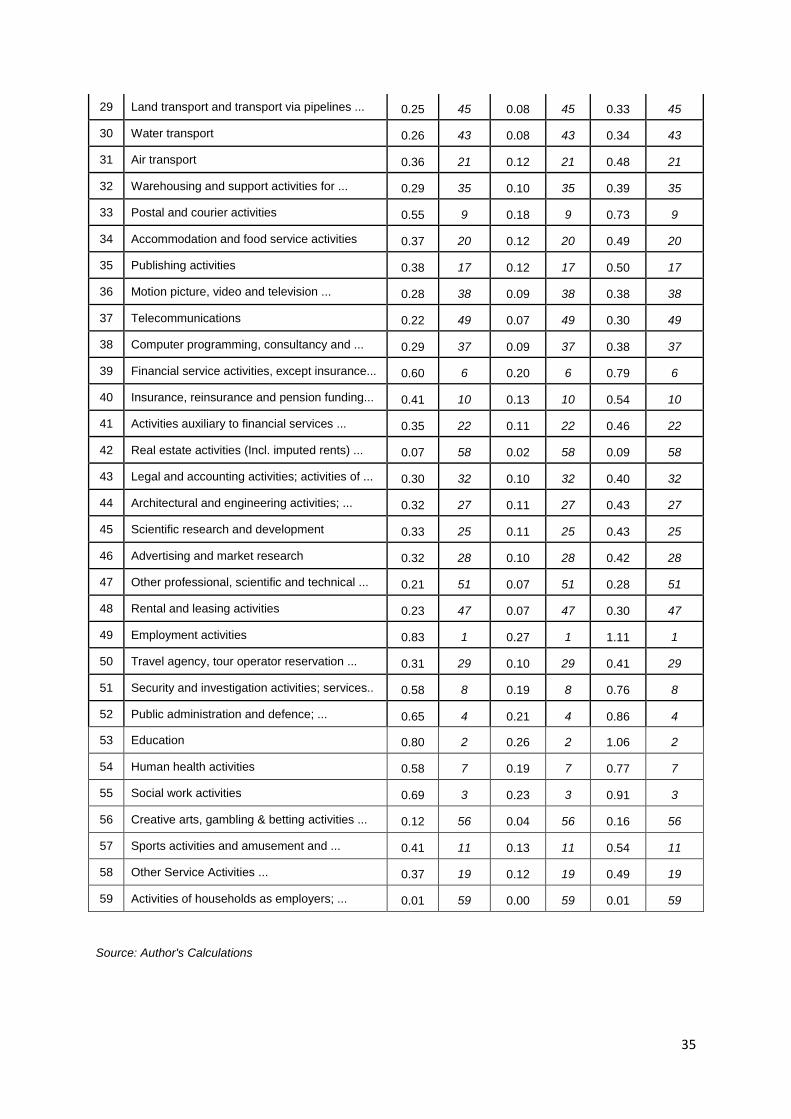
For both the type I and type II income-output multipliers generated11 the three highest
ranking sectors were respectively, the (49) Employment activities, the (53) Education and
the (47) Social work activities sectors. Interpreting the disaggregated type II multiplier for the
(53) Education sector observed from Table 3 it may be noted that in the year 2008 every
Euro of final demand for this sector generated on average 1.06 Euro of household income.
From this total, 0.75 Euro is paid in the form of salaries to the workers employed within the
sector. Another 0.05 Euro is paid in the form of labour income throughout all the other
productive sectors of the economy due to the linkages of this sector with the other sectors
providing its input requirements. And finally an additional 0.26 Euro is paid in wages and
salaries throughout all sectors of the economy, which corresponds to the resulting wages
and salaries accrued to households for the labour services needed to generate the
additional inputs required to satisfy the additional rounds of increased domestic consumption
expenditure.
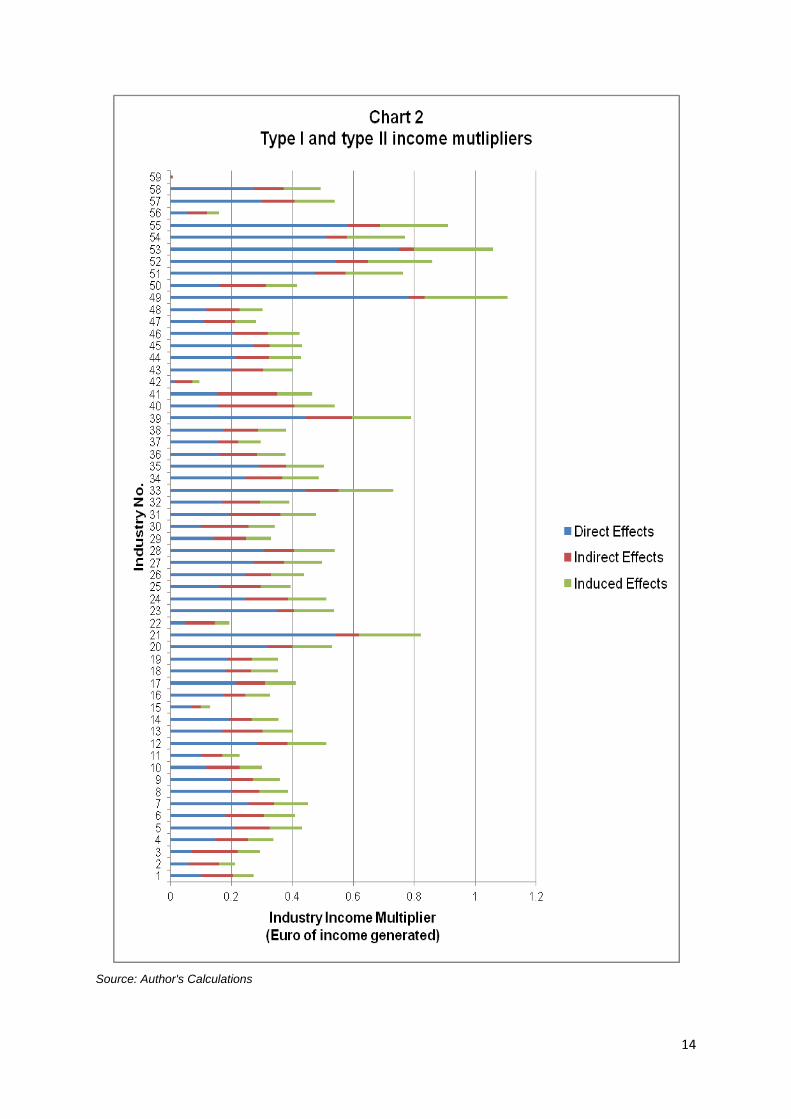
The full set of multipliers for all 59 sectors is presented in Chart 2, where the direct and
indirect effects components represent the type I income-output multiplier which together with
the induced effects component makes up the type II income-output multiplier. A high degree
of stability in terms of the relative rankings between the type I and type II income-output
multipliers for all the 59 sectors may be noted. This is due to the important role the labour-
input coefficients play in affecting the overall magnitude of both the type I and type II income-
output multipliers.
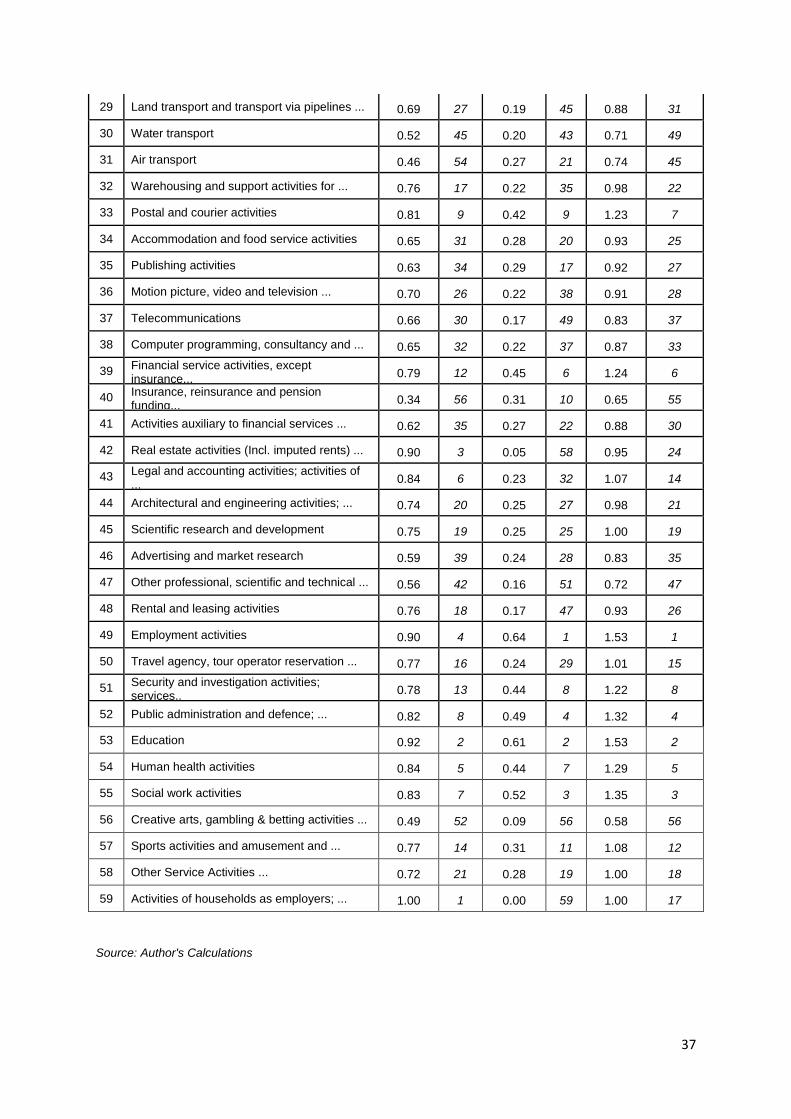
4.2 Value added multipliers
The type I value added-output multipliers are calculated via the multiplication of the row
vector ‘ava’, a row vector of value added coefficients12, with the SIOT Leontief inverse where
( ) represents the type I value added-output multiplier for sector ‘j’.
11
The results obtained from the derivation of both the type I and type II income-output multipliers are presented in appendix E.
12 The value added coefficients may be found in appendix D.
16
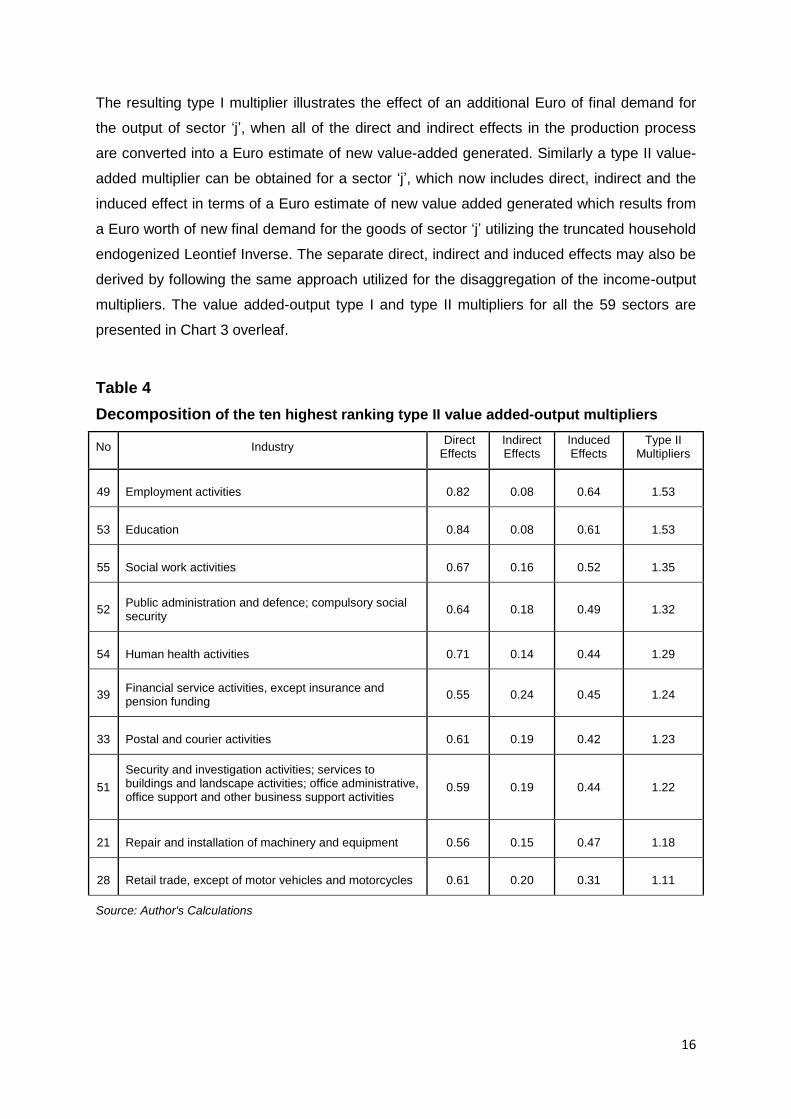
The resulting type I multiplier illustrates the effect of an additional Euro of final demand for
the output of sector ‘j’, when all of the direct and indirect effects in the production process
are converted into a Euro estimate of new value-added generated. Similarly a type II value-
added multiplier can be obtained for a sector ‘j’, which now includes direct, indirect and the
induced effect in terms of a Euro estimate of new value added generated which results from
a Euro worth of new final demand for the goods of sector ‘j’ utilizing the truncated household
endogenized Leontief Inverse. The separate direct, indirect and induced effects may also be
derived by following the same approach utilized for the disaggregation of the income-output
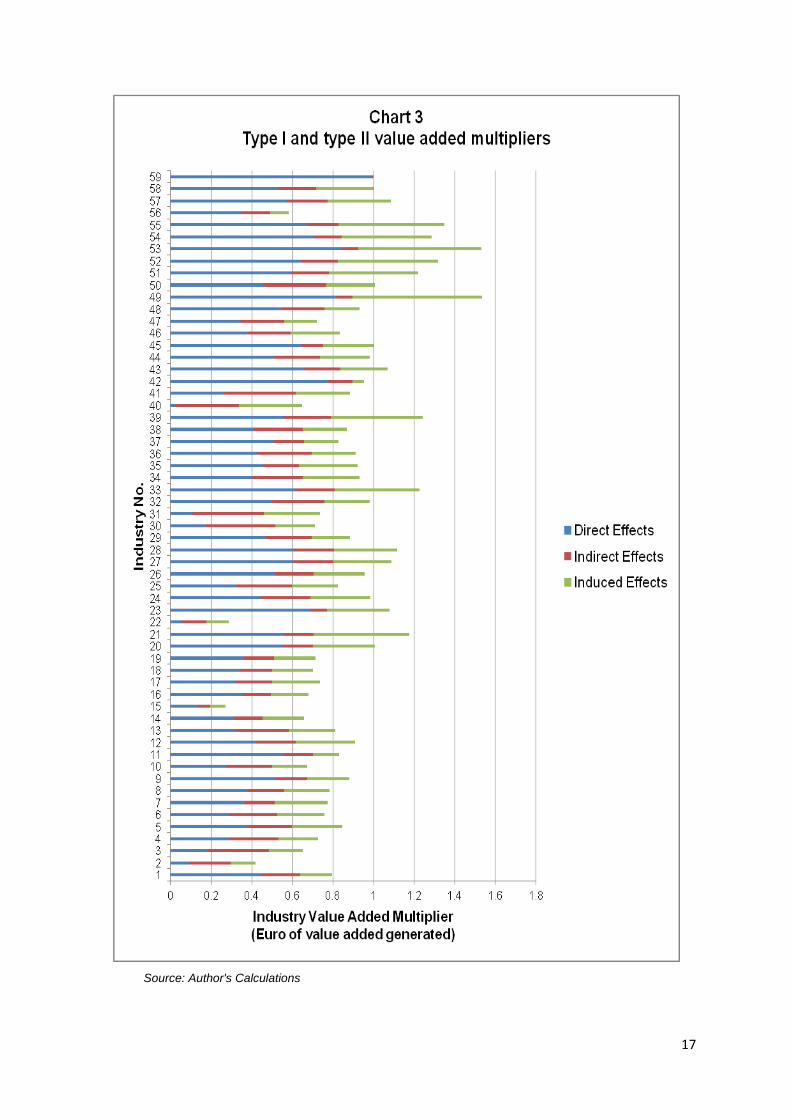
multipliers. The value added-output type I and type II multipliers for all the 59 sectors are
presented in Chart 3 overleaf.
Table 4
Decomposition of the ten highest ranking type II value added-output multipliers
No Industry Direct Effects
Indirect Effects
Induced Effects
Type II Multipliers
49 Employment activities 0.82 0.08 0.64 1.53
53 Education 0.84 0.08 0.61 1.53
55 Social work activities 0.67 0.16 0.52 1.35
52 Public administration and defence; compulsory social security
0.64 0.18 0.49 1.32
54 Human health activities 0.71 0.14 0.44 1.29
39 Financial service activities, except insurance and pension funding
0.55 0.24 0.45 1.24
33 Postal and courier activities 0.61 0.19 0.42 1.23
51
Security and investigation activities; services to buildings and landscape activities; office administrative, office support and other business support activities
0.59 0.19 0.44 1.22
21 Repair and installation of machinery and equipment 0.56 0.15 0.47 1.18
28 Retail trade, except of motor vehicles and motorcycles 0.61 0.20 0.31 1.11
Source: Author's Calculations
17
Source: Author's Calculations
18
In terms of the type I value added-output multipliers the three highest ranking sectors13 were
respectively (59) Activities of households as employers, (53) Education and (42) Real estate
activities sector. It is interesting to note that once the induced effects are included allowing
the generation of the type II multipliers, the relative magnitude, and thus ranking of both the
(59) Activities of householder as employers and (42) Real estate activities decreased
significantly due to the weak induced effects exhibited by these two industries. The ten
highest ranking type II value added-output multipliers are provided in Table 4. Interpreting
the disaggregated type II multiplier for the (54) Human health activities from Table 4 it is
observed that in the year 2008 every Euro of final demand for this sector generated on
average 1.29 Euro of value-added. From this total, 0.71 Euro is generated directly within the
sector. Another 0.14 Euro is generated in the form of additional value added throughout the
whole economy due to the linkages of this sector with the other sectors providing its input
requirements. And finally another 0.44 Euro of value added is generated throughout all
sectors of the economy, which corresponds to the additional value-added generated in
response to the additional inputs required to satisfy the additional rounds of increased
consumption expenditure.
4.3 Employment multipliers
Following Miller and Blair (2009) the employment-output multipliers derived in this section
shall be referred to as physical employment-output multipliers. This is because rather than
looking at the effects in terms of monetary income the derived multipliers shall assess the
effects of changes in the final demand for a sector in terms of the physical amount of jobs
created. To obtain these multipliers it has to be assumed that employment levels within an
industry are closely tied to the amount of output generated. Following this assumption an
employment-output ratios can be derived, which illustrate the numbers of (average) jobs per
thousand Euro of output produced for each sector ‘j’, we may denote the row vector of
employment-output ratios as ‘ae’14 . These ratios were derived by dividing the average
number of people in employment per sector over the year 200815 by the amount of gross
output generated by sector. These employment-output ratios reflect the jobs created within
the sector of production directly in response to an increase in production of thousand Euro
worth of output (direct effects). It may be noted that contrary to the analysis of multipliers
13
The results obtained from the derivation of both the type I and type II value added-output multipliers are
presented in appendix F.
14 The employment-output ratios may be found in appendix D.
15 The figures for the average number of people employed per sector for the year 2008 were provided by the
National Statistics Office of Malta.
19
conducted up to this point rather than analysing effects in per Euro of final demand, these
employment-output multipliers have to be assessed in terms of thousand Euro of final
demand.
The type I employment-output multiplier, denoted by ( ), for a sector ‘j’ measures the
additional physical employment that is generated by the direct and indirect effects on
production due to an additional thousand Euro worth of final demand for sector ‘j’. The type I
employment-output multipliers are calculated by the multiplication of the row vector of
employment-output ratios ‘ae’, with the SIOT Leontief inverse. The type II employment-output
multiplier for a sector j, ( ), reflects the direct and indirect effects as well as the induced
effects in terms of additional jobs created in the economy in response to an additional
thousand Euro of final demand for the output of sector ‘j’. We can decompose the individual
direct, indirect and induced effects following the same procedure undertaken for the income-
output multipliers keeping in mind that in this case the elements of the vector of employment-
output ratios ‘ah’, reflect the initial direct effect in terms of jobs created in response to an
additional thousand Euro of final demand for each sector ‘j’. The derived multipliers were
subsequently multiplied by a further one thousand in order to obtain a more feasible
interpretation, such that employment-output multipliers should thus be interpreted in terms of
1 million Euro increase in final demand.
The industry with both the largest type I and type II employment-output multipliers16 is the
(55) Social work activities sector. Similar to what was observed for the case of the income-
output multipliers, the larger the employment-output ratio (ae, numbers of jobs per thousand
Euro of output produced) for the industry and its supplying industries and the larger the total
effects in terms of job creation would be.
16
The results obtained from the derivation of both the type I and type II employment-output multipliers are
presented in appendix G.
20
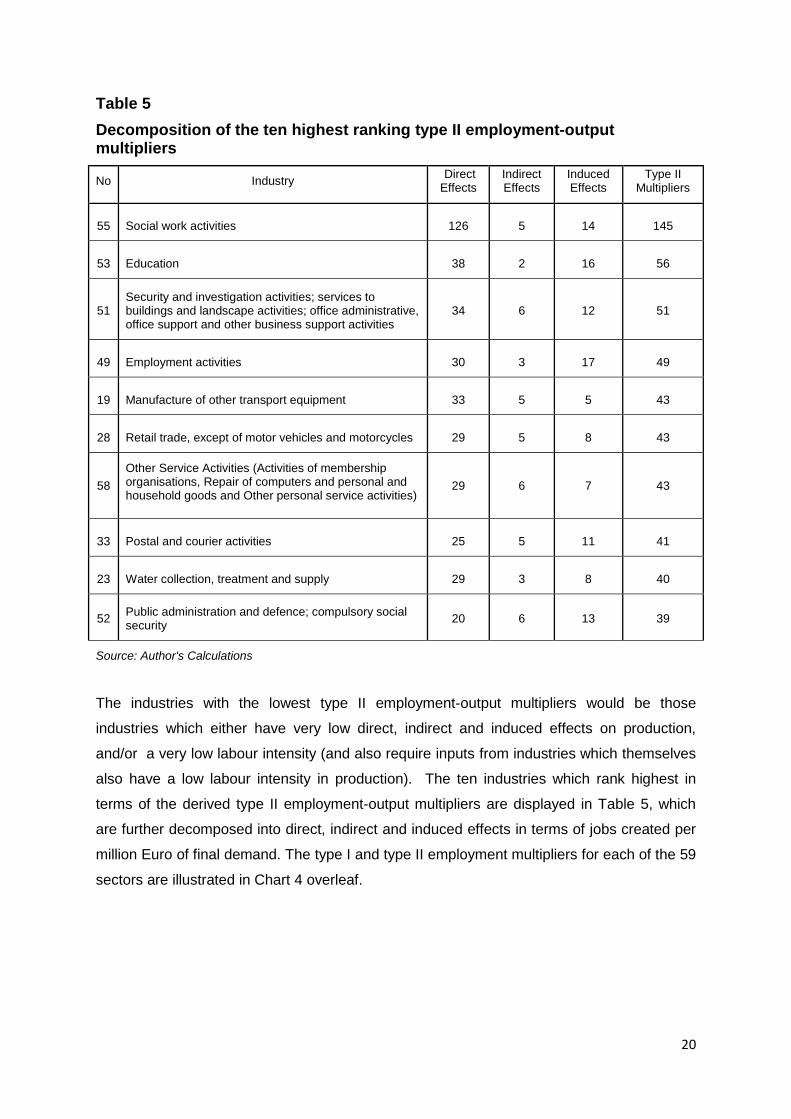
Table 5
Decomposition of the ten highest ranking type II employment-output multipliers
No Industry Direct Effects
Indirect Effects
Induced Effects
Type II Multipliers
55 Social work activities 126 5 14 145
53 Education 38 2 16 56
51 Security and investigation activities; services to buildings and landscape activities; office administrative, office support and other business support activities
34 6 12 51
49 Employment activities 30 3 17 49
19 Manufacture of other transport equipment 33 5 5 43
28 Retail trade, except of motor vehicles and motorcycles 29 5 8 43
58
Other Service Activities (Activities of membership organisations, Repair of computers and personal and household goods and Other personal service activities)
29 6 7 43
33 Postal and courier activities 25 5 11 41
23 Water collection, treatment and supply 29 3 8 40
52 Public administration and defence; compulsory social security
20 6 13 39
Source: Author's Calculations
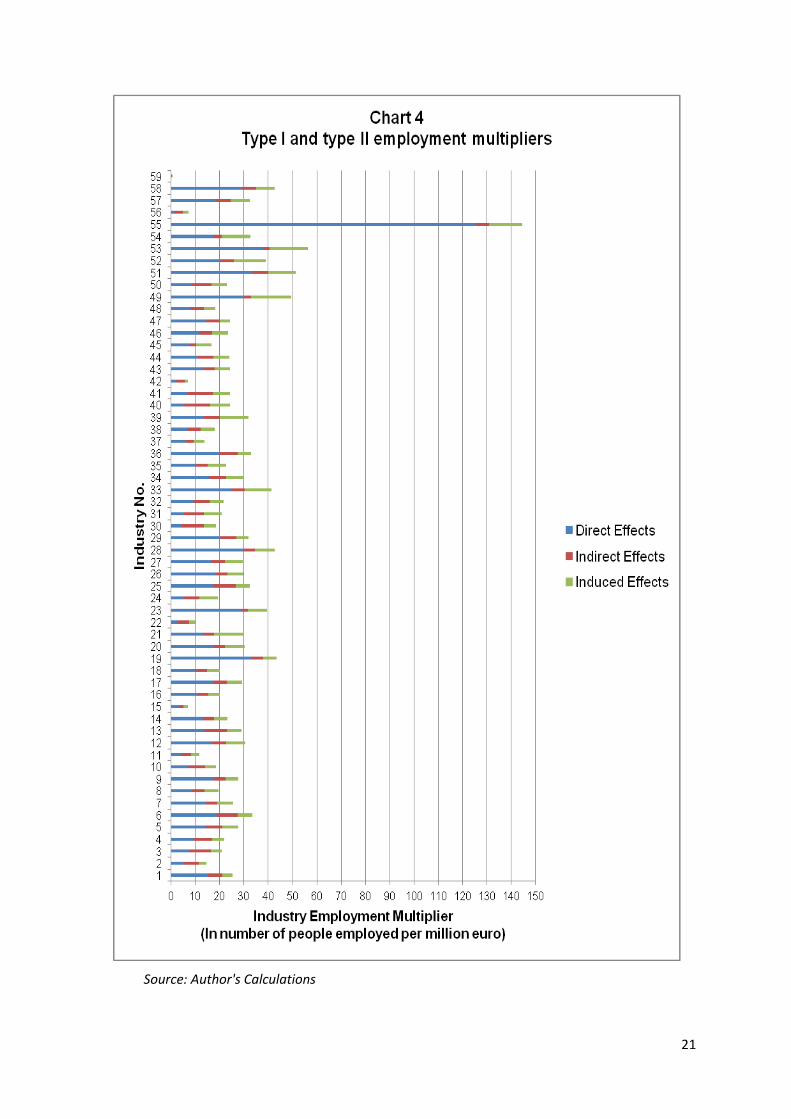
The industries with the lowest type II employment-output multipliers would be those
industries which either have very low direct, indirect and induced effects on production,
and/or a very low labour intensity (and also require inputs from industries which themselves
also have a low labour intensity in production). The ten industries which rank highest in
terms of the derived type II employment-output multipliers are displayed in Table 5, which
are further decomposed into direct, indirect and induced effects in terms of jobs created per
million Euro of final demand. The type I and type II employment multipliers for each of the 59
sectors are illustrated in Chart 4 overleaf.
21
Source: Author's Calculations
22
Out of these 39 new jobs created, 20 are generated directly within the industry itself, another
6 jobs would be created amongst the other productive sectors of the economy due to the
existing linkages with the other sectors providing its input requirements. Together the direct
and the indirect effect make up the type I employment-output multiplier of 26 jobs per million
Euro of increased final demand. And finally, this leaves another 13 jobs which would be
created throughout all sectors of the economy which are a result of the induced effects.
5. Conclusion
By assessing all the individual measures generated in this study it is possible to obtain a
very clear picture of the strength of the inter-industry relations amongst industries. It is also
possible to identify how the strength of these relations impacted the Maltese economy in the
reference year of 2008 in terms of productive output generated, household income, value
added generated and employment created. These measures can either be used for the
study of the characteristics of the structure of production or crucially can be of aid to policy
makers for the identification of industry-specific policies aimed at improving Malta's
competitiveness and economic resilience.
Evaluating the results obtained from each multiplier measure for a single industry may
provide policy makers with a broad range of analytically derived estimates with which to
evaluate the strategic importance of a specific industry within the context of the national
economy. Given that the tourism sector plays a significant role in determining the economic
prosperity of a small island economy like Malta, we can use the derived multipliers to gain a
better understanding of the impact this sector has on economy. Following Fletcher (1989)
and thus utilizing the (34) Accommodation and food service activities sector as an
approximation for the tourism sector, from the results obtained it is possible to provide policy
makers with analytically derived estimates of the impacts generated throughout the economy
by the tourism industry. Assessing the multiplier measures derived throughout this study it
can be inferred that based on the reference year of 2008, an additional million Euro worth of
exogenous final demand injections for the (34) Accommodation and food service activities
(tourism sector) through the direct, indirect and induced effects on production would have
generated an average increase in production from all sectors in the economy amounting to
2.25 million Euro (ranking 15th), an average increase in household income of 0.49 million
Euro (ranking 20th), an increase in value added of 0.93 million Euro (ranking 25th) and would
have created approximately 30 new jobs (ranking 21st).
23
The results generated by this study provide a different approach to evaluating the relative
significance of an industry within the context of the entire production structure of the Maltese
economy. For example, if one were to look at solely the share of output or value added of a
particular industry17 in relation to the total of the other industries, industries such as the (56)
Creative, arts and entertainment activities; gambling and betting activities, libraries, archives,
museums and other cultural activities industry would stand out as one of the most significant
productive sectors in the economy. However, when evaluating the potential impacts this
industry has in terms of the additional generation of domestic production, income and value
added generation and employment creation, per Euro increase in final demand, it
consistently ranks among the bottom quartile for each of the multiplier measures derived. On
the other-hand sectors which have a relatively low share of total output such as (40)
Insurance, reinsurance and pension funding and the (53) Education sector consistently rank
amongst the industries which generate the highest overall multiplier effects in terms of
output, income, value added as well as employment creation.
It should however be noted that interpreting multiplier estimates in the context of modelling
marginal changes in activity (impact analysis), will implicitly invoke assumptions about how
the economy behaves in response to changes in demand since these measures would
effectively be estimating the resulting impacts in an economic scenario which differs from
that of the given base year of 2008. Multiplier estimates derived from the Leontief demand
driven model tend to overestimate the real impact on the economy caused by an exogenous
increase in final demand due to the fact that economies do not exhibit the levels of excess
capacity assumed by the model, especially in the short run for which most impact analysis is
conducted (Ten Raa and Rueda-Cantuche, 2007). An alternate interpretation of the Leontief
demand driven model put forward by Charney and Vest (2003) views it as a long run model
implying that the estimates obtained from the various multiplier measures can be viewed as
long run multiplier effects on the economy. Although the industry specific multipliers derived
in this study should be evaluated with caution by policy makers, they still provide an
analytically derived first cut estimate of the possible impacts that could be generated
throughout the economy as a result of an exogenous increase in final demand.
17
Selected analytical industry statistics are provided in appendix B.
24
References
Blair, P.D. and Wyckoff A.W., (1989). The changing structure of the US economy. An input-
output analysis. Cited in: Miller R.E., Polenske K.R. and Rose A.Z. (eds.), Frontiers of Input-
Output Analysis. Oxford University Press, New York, pp. 293-307.
Blake, A., Sinclair, T.M., Sugiyarto, G. and DeHann, C., (2003b). The Economic Impact of
Tourism in Malta: Input-Output Modelling. The University of Nottingham, Report for the Malta
Tourism Authority.
Bonnici, J., (1980). Integrating Input-Output and Keynesian Models: A Case Study of Malta.
Unpublished doctoral dissertation, Simon Fraser University, Canada.
Bonnici, J. (1983), The relevance of input substitution in the Inter-Industry Model", European
Economic Review, 22 (1983), pp. 277-296
Briguglio, L., (1992). Tourism Multipliers in the Maltese Economy. In Johnson, P. and
Thomas, B. (eds.), Perspectives on Tourism Policy. Mansell, London, 76-80.
Cassar, I.P., (2013). A study of the production structure of the Maltese economy : An input-
output approach. Unpublished doctoral dissertation, Heriot-Watt University, Edinburgh.
Charney, A. and Vest, M., (2003). Modeling Practices and Their Ability to Assess
Tax/Expenditure Economic Impacts. Paper prepared for the AUBER Conference, New
Orleans, October 2003, the University of Arizona, Tucson, AZ.
Drejer, Ina., (2002). Input-Output Based Measures of Interindustry Linkages Revisited - A
Survey and Discussion, Paper presented at the 14th International Conference on Input-
Output Techniques, Montreal, Canada.
Gravino, D., (2012). Economic and Policy Implications of Industry Interdependence: An
Input-Output Approach. International Journal of Economics and Finance, 4 (6).
25
Leontief, W., (1936). Quantitative Input and Output Relations in the Economic System of the
United States. Review of Economics and Statistics, 18 ( 3), 105-25.
Leontief, W, (1941). The Structure of American Economy, 1919-1929. Cambridge: Harvard
University Press, (Second Ed., 1951, New York, Oxford University Press).
Miller, R. E. and Blair, P. D. (2009). Input-Output Analysis: Foundations and Extensions.
Cambridge University Press.
Oosterhaven, J., Piek, G. and Stedler, D., (1986). Theory and Practice of Updating Regional
Versus Interregional Interindustry Tables. Papers in Regional Science, 59 (1), 57-72.
Ten Raa, T. and Rueda-Cantuche, J.M., (2007). Stochastic Analysis of Input-Output
Multipliers on the basis of Use and Make Matrices. Review of Income and Wealth, 53, 3,
pp.1-17
26
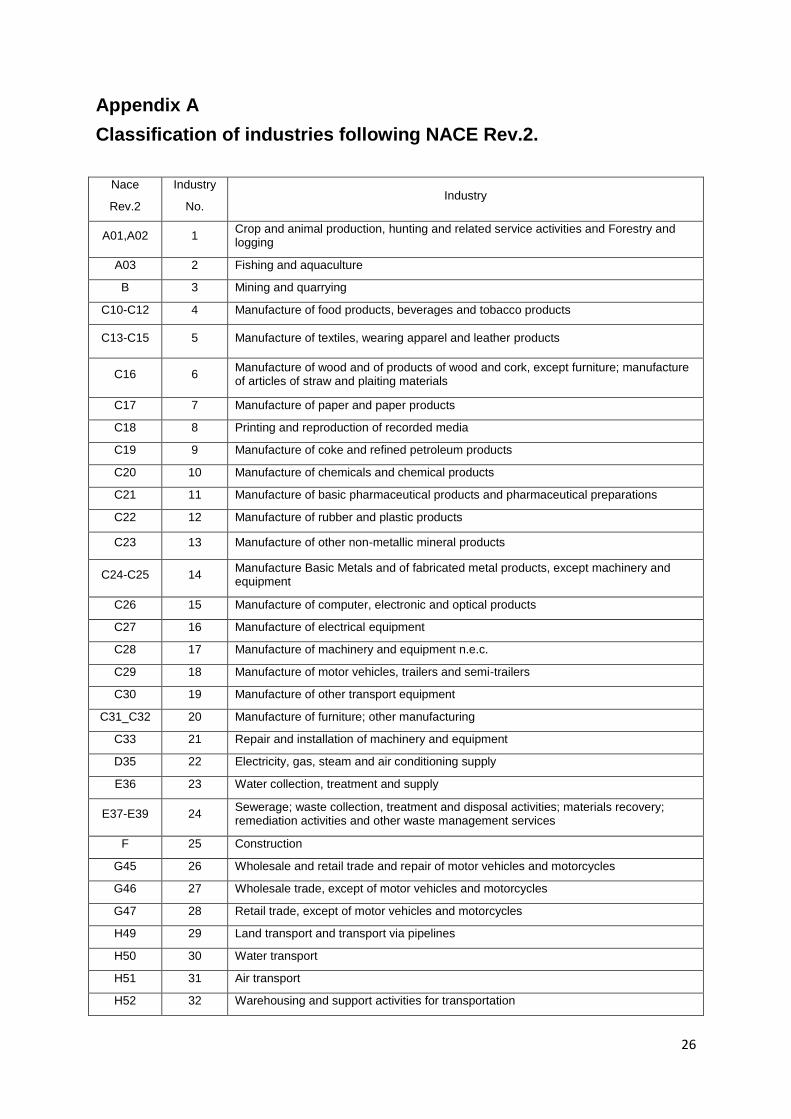
Appendix A
Classification of industries following NACE Rev.2.
Nace
Rev.2
Industry
No. Industry
A01,A02 1 Crop and animal production, hunting and related service activities and Forestry and logging
A03 2 Fishing and aquaculture
B 3 Mining and quarrying
C10-C12 4 Manufacture of food products, beverages and tobacco products
C13-C15 5 Manufacture of textiles, wearing apparel and leather products
C16 6 Manufacture of wood and of products of wood and cork, except furniture; manufacture of articles of straw and plaiting materials
C17 7 Manufacture of paper and paper products
C18 8 Printing and reproduction of recorded media
C19 9 Manufacture of coke and refined petroleum products
C20 10 Manufacture of chemicals and chemical products
C21 11 Manufacture of basic pharmaceutical products and pharmaceutical preparations
C22 12 Manufacture of rubber and plastic products
C23 13 Manufacture of other non-metallic mineral products
C24-C25 14 Manufacture Basic Metals and of fabricated metal products, except machinery and equipment
C26 15 Manufacture of computer, electronic and optical products
C27 16 Manufacture of electrical equipment
C28 17 Manufacture of machinery and equipment n.e.c.
C29 18 Manufacture of motor vehicles, trailers and semi-trailers
C30 19 Manufacture of other transport equipment
C31_C32 20 Manufacture of furniture; other manufacturing
C33 21 Repair and installation of machinery and equipment
D35 22 Electricity, gas, steam and air conditioning supply
E36 23 Water collection, treatment and supply
E37-E39 24 Sewerage; waste collection, treatment and disposal activities; materials recovery; remediation activities and other waste management services
F 25 Construction
G45 26 Wholesale and retail trade and repair of motor vehicles and motorcycles
G46 27 Wholesale trade, except of motor vehicles and motorcycles
G47 28 Retail trade, except of motor vehicles and motorcycles
H49 29 Land transport and transport via pipelines
H50 30 Water transport
H51 31 Air transport
H52 32 Warehousing and support activities for transportation
27
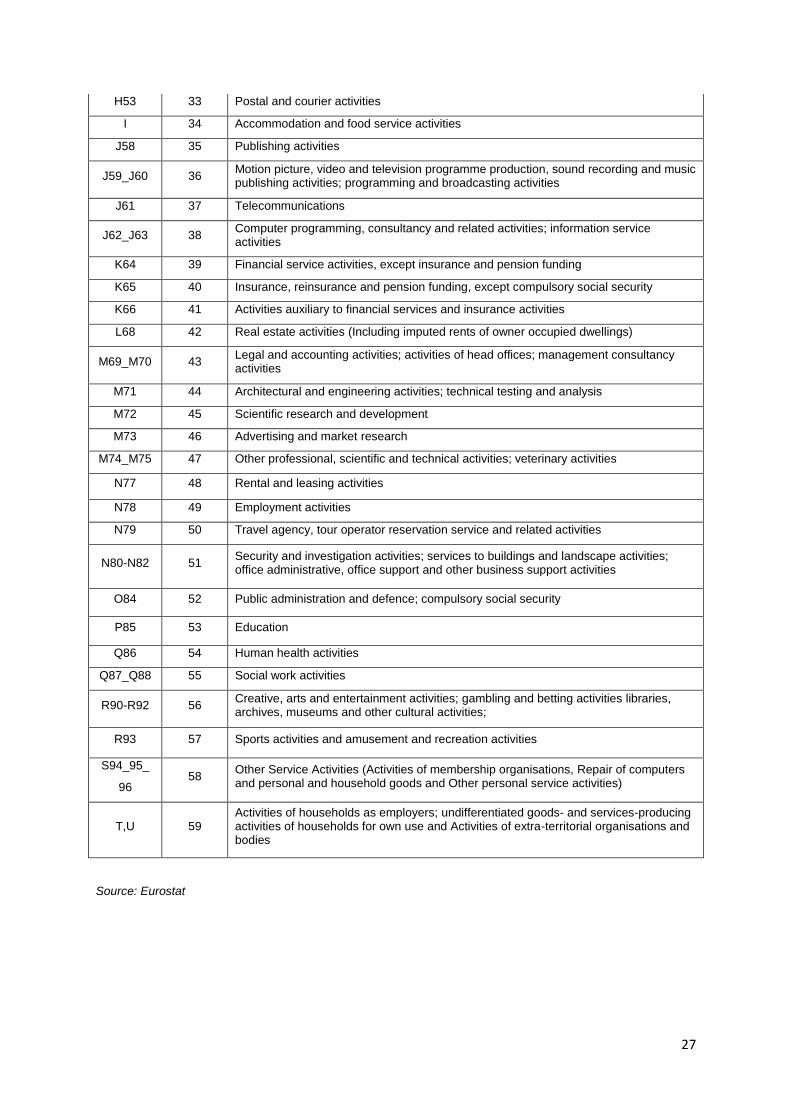
H53 33 Postal and courier activities
I 34 Accommodation and food service activities
J58 35 Publishing activities
J59_J60 36 Motion picture, video and television programme production, sound recording and music publishing activities; programming and broadcasting activities
J61 37 Telecommunications
J62_J63 38 Computer programming, consultancy and related activities; information service activities
K64 39 Financial service activities, except insurance and pension funding
K65 40 Insurance, reinsurance and pension funding, except compulsory social security
K66 41 Activities auxiliary to financial services and insurance activities
L68 42 Real estate activities (Including imputed rents of owner occupied dwellings)
M69_M70 43 Legal and accounting activities; activities of head offices; management consultancy activities
M71 44 Architectural and engineering activities; technical testing and analysis
M72 45 Scientific research and development
M73 46 Advertising and market research
M74_M75 47 Other professional, scientific and technical activities; veterinary activities
N77 48 Rental and leasing activities
N78 49 Employment activities
N79 50 Travel agency, tour operator reservation service and related activities
N80-N82 51 Security and investigation activities; services to buildings and landscape activities; office administrative, office support and other business support activities
O84 52 Public administration and defence; compulsory social security
P85 53 Education
Q86 54 Human health activities
Q87_Q88 55 Social work activities
R90-R92 56 Creative, arts and entertainment activities; gambling and betting activities libraries, archives, museums and other cultural activities;
R93 57 Sports activities and amusement and recreation activities
S94_95_
96 58
Other Service Activities (Activities of membership organisations, Repair of computers and personal and household goods and Other personal service activities)
T,U 59 Activities of households as employers; undifferentiated goods- and services-producing activities of households for own use and Activities of extra-territorial organisations and bodies
Source: Eurostat
28
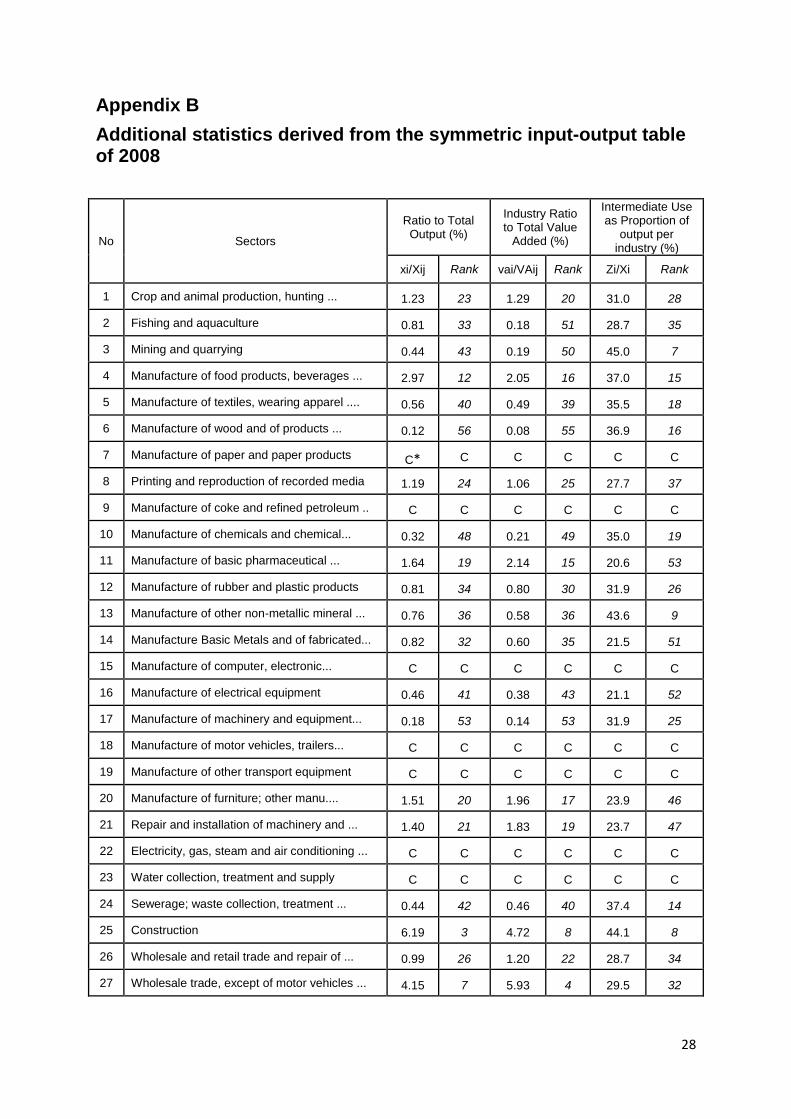
Appendix B
Additional statistics derived from the symmetric input-output table of 2008
No Sectors
Ratio to Total Output (%)
Industry Ratio to Total Value
Added (%)
Intermediate Use as Proportion of
output per industry (%)
xi/Xij Rank vai/VAij Rank Zi/Xi Rank
1 Crop and animal production, hunting ... 1.23 23 1.29 20 31.0 28
2 Fishing and aquaculture 0.81 33 0.18 51 28.7 35
3 Mining and quarrying 0.44 43 0.19 50 45.0 7
4 Manufacture of food products, beverages ... 2.97 12 2.05 16 37.0 15
5 Manufacture of textiles, wearing apparel .... 0.56 40 0.49 39 35.5 18
6 Manufacture of wood and of products ... 0.12 56 0.08 55 36.9 16
7 Manufacture of paper and paper products C*
C C C C C
8 Printing and reproduction of recorded media 1.19 24 1.06 25 27.7 37
9 Manufacture of coke and refined petroleum .. C
C C C C C
10 Manufacture of chemicals and chemical... 0.32 48 0.21 49 35.0 19
11 Manufacture of basic pharmaceutical ... 1.64 19 2.14 15 20.6 53
12 Manufacture of rubber and plastic products 0.81 34 0.80 30 31.9 26
13 Manufacture of other non-metallic mineral ... 0.76 36 0.58 36 43.6 9
14 Manufacture Basic Metals and of fabricated... 0.82 32 0.60 35 21.5 51
15 Manufacture of computer, electronic... C
C C C C C
16 Manufacture of electrical equipment 0.46 41 0.38 43 21.1 52
17 Manufacture of machinery and equipment... 0.18 53 0.14 53 31.9 25
18 Manufacture of motor vehicles, trailers... C
C C C C C
19 Manufacture of other transport equipment C
C C C C C
20 Manufacture of furniture; other manu.... 1.51 20 1.96 17 23.9 46
21 Repair and installation of machinery and ... 1.40 21 1.83 19 23.7 47
22 Electricity, gas, steam and air conditioning ... C
C C C C C
23 Water collection, treatment and supply C
C C C C C
24 Sewerage; waste collection, treatment ... 0.44 42 0.46 40 37.4 14
25 Construction 6.19 3 4.72 8 44.1 8
26 Wholesale and retail trade and repair of ... 0.99 26 1.20 22 28.7 34
27 Wholesale trade, except of motor vehicles ... 4.15 7 5.93 4 29.5 32
29
28 Retail trade, except of motor vehicles ... 3.15 10 4.49 9 31.1 27
29 Land transport and transport via pipelines ... 0.89 28 0.98 28 33.2 23
30 Water transport 0.88 29 0.35 45 51.2 3
31 Air transport C
C C C C C
32 Warehousing and support activities for ... 3.13 11 3.62 11 39.2 13
33 Postal and courier activities C
C C C C C
34 Accommodation and food service activities 5.37 4 5.09 7 40.1 12
35 Publishing activities 0.39 44 0.42 41 30.4 31
36 Motion picture, video and television ... 0.37 47 0.37 44 42.5 10
37 Telecommunications 2.19 16 2.62 13 24.0 45
38 Computer programming, consultancy and ... 1.96 18 1.89 18 40.8 11
39 Financial service activities, except insurance... 2.83 13 3.69 10 32.7 24
40 Insurance, reinsurance and pension funding... 0.75 37 0.04 56 64.2 1
41 Activities auxiliary to financial services ... 1.31 22 0.82 29 49.5 5
42 Real estate activities (Incl. imputed rents) ... 3.29 9 6.01 3 17.7 54
43 Legal and accounting activities; activities of ... 2.18 17 3.38 12 26.4 40
44 Architectural and engineering activities; ... 0.87 30 1.05 26 34.5 20
45 Scientific research and development C
C C C C C
46 Advertising and market research 0.56 39 0.50 38 33.5 22
47 Other professional, scientific and technical ... 0.21 51 0.17 52 36.4 17
48 Rental and leasing activities 0.99 27 1.28 21 30.9 29
49 Employment activities 0.37 46 0.72 31 13.0 56
50 Travel agency, tour operator reservation ... 1.10 25 1.19 23 45.3 6
51 Security and investigation activities; services.. 0.79 35 1.10 24 30.8 30
52 Public administration and defence; ... 4.25 6 6.41 2 27.2 39
53 Education 2.77 14 5.51 6 11.7 57
54 Human health activities 3.48 8 5.78 5 22.4 49
55 Social work activities 0.19 52 0.31 47 25.0 42
56 Creative arts, gambling & betting activities ... 11.01 1 9.00 1 22.4 50
57 Sports activities and amusement and ... 0.31 49 0.41 42 29.3 33
58 Other Service Activities ... 0.83 31 1.03 27 28.6 36
59 Activities of households as employers; ... 0.13 55 0.30 48 1.0 59
Source: Author's Calculations
* The data denoted by “C” implies that the derived figure is based on data which was provided under strict
confidentiality and is thus not available for publication

30
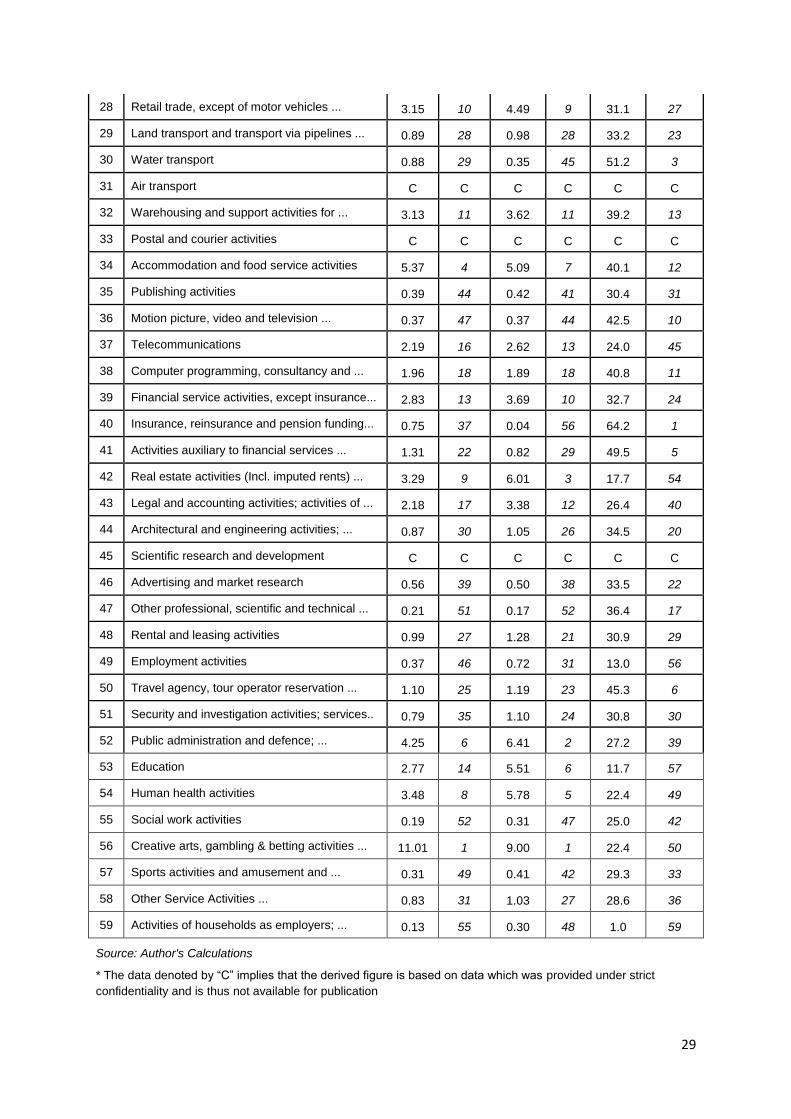
Appendix C
Type I and type II output multipliers
No Sectors
Type I Output Multiplier (direct
and indirect effects)
Induced effects
Total Type II multiplier (direct, indirect + induced
effects)
Type I Rank Induced effects
Rank Type II Rank
1 Crop and animal production, hunting ... 1.48 29 0.35 52 1.83 48
2 Fishing and aquaculture 1.44 36 0.27 54 1.71 54
3 Mining and quarrying 1.69 8 0.38 50 2.07 34
4 Manufacture of food products, beverages ... 1.57 15 0.43 44 2.00 36
5 Manufacture of textiles, wearing apparel .... 1.56 16 0.55 26 2.12 27
6 Manufacture of wood and of products ... 1.56 18 0.52 31 2.08 31
7 Manufacture of paper and paper products 1.38 43 0.58 23 1.95 39
8 Printing and reproduction of recorded media 1.41 41 0.50 36 1.91 45
9 Manufacture of coke and refined petroleum .. 1.37 45 0.46 39 1.83 47
10 Manufacture of chemicals and chemical... 1.55 19 0.38 48 1.93 41
11 Manufacture of basic pharmaceutical ... 1.31 53 0.29 53 1.60 55
12 Manufacture of rubber and plastic products 1.51 25 0.66 16 2.16 22
13 Manufacture of other non-metallic mineral ... 1.71 7 0.52 33 2.23 19
14 Manufacture Basic Metals and of fabricated... 1.32 51 0.45 40 1.78 51
15 Manufacture of computer, electronic... 1.12 58 0.17 57 1.29 58
16 Manufacture of electrical equipment 1.31 52 0.42 46 1.73 53
17 Manufacture of machinery and equipment... 1.47 31 0.53 30 2.00 38
18 Manufacture of motor vehicles, trailers... 1.47 32 0.45 42 1.92 44
19 Manufacture of other transport equipment 1.36 48 0.45 41 1.81 49
20 Manufacture of furniture; other manu.... 1.37 46 0.68 14 2.05 35
21 Repair and installation of machinery and ... 1.37 44 1.05 5 2.43 9
22 Electricity, gas, steam and air conditioning ... 2.26 2 0.25 55 2.51 7
23 Water collection, treatment and supply 1.54 20 0.69 13 2.23 18
24 Sewerage; waste collection, treatment ... 1.59 14 0.66 15 2.24 17
25 Construction 1.69 9 0.51 34 2.19 21
26 Wholesale and retail trade and repair of ... 1.44 37 0.56 24 2.00 37
27 Wholesale trade, except of motor vehicles ... 1.47 33 0.64 18 2.10 28
28 Retail trade, except of motor vehicles ... 1.51 26 0.69 12 2.20 20
31
29 Land transport and transport via pipelines ... 1.53 22 0.42 45 1.95 40
30 Water transport 1.81 3 0.44 43 2.25 16
31 Air transport 1.79 4 0.61 21 2.41 10
32 Warehousing and support activities for ... 1.64 11 0.50 35 2.14 24
33 Postal and courier activities 1.42 39 0.94 9 2.36 11
34 Accommodation and food service activities 1.63 12 0.62 20 2.25 15
35 Publishing activities 1.49 28 0.65 17 2.13 26
36 Motion picture, video and television ... 1.68 10 0.48 38 2.16 23
37 Telecommunications 1.36 47 0.38 49 1.74 52
38 Computer programming, consultancy and ... 1.61 13 0.49 37 2.10 29
39 Financial service activities, except insurance... 1.51 24 1.01 6 2.52 6
40 Insurance, reinsurance and pension funding... 2.27 1 0.69 10 2.96 1
41 Activities auxiliary to financial services ... 1.76 6 0.60 22 2.35 12
42 Real estate activities (Incl. imputed rents) ... 1.28 54 0.12 58 1.40 57
43 Legal and accounting activities; activities of ... 1.41 42 0.52 32 1.93 42
44 Architectural and engineering activities; ... 1.54 21 0.55 27 2.09 30
45 Scientific research and development 1.23 55 0.55 25 1.78 50
46 Advertising and market research 1.52 23 0.54 28 2.07 33
47 Other professional, scientific and technical ... 1.56 17 0.36 51 1.92 43
48 Rental and leasing activities 1.47 30 0.39 47 1.86 46
49 Employment activities 1.21 56 1.42 1 2.63 2
50 Travel agency, tour operator reservation ... 1.77 5 0.53 29 2.30 14
51 Security and investigation activities; services.. 1.50 27 0.98 8 2.49 8
52 Public administration and defence; ... 1.42 38 1.10 4 2.53 5
53 Education 1.18 57 1.36 2 2.54 4
54 Human health activities 1.36 49 0.99 7 2.34 13
55 Social work activities 1.41 40 1.17 3 2.59 3
56 Creative arts, gambling & betting activities ... 1.34 50 0.20 56 1.54 56
57 Sports activities and amusement and ... 1.45 34 0.69 11 2.14 25
58 Other Service Activties ... 1.45 35 0.63 19 2.08 32
59 Activities of households as employers; ... 1.01 59 0.01 59 1.02 59
Source: Author's Calculations
32
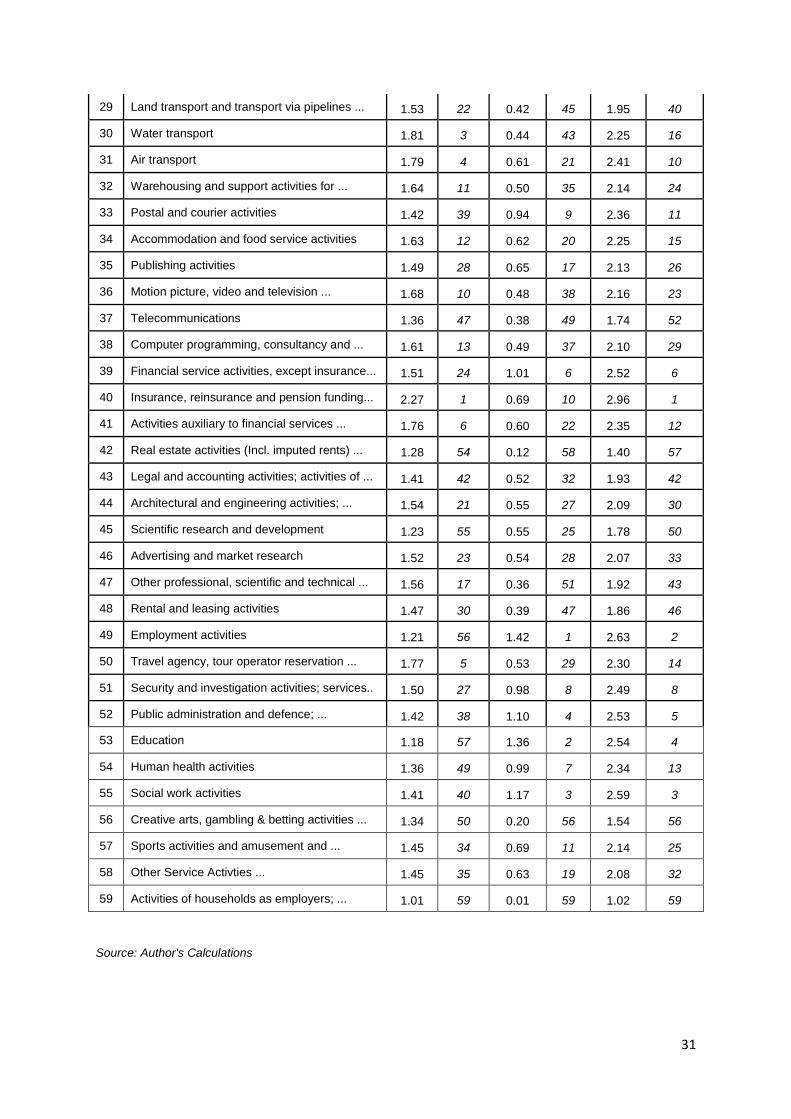
Appendix D
Income, value added and employment ratios
No Sectors Income Ratio
Value Added Ratio
Employment Ratio
ah,i Rank ava,i Rank ae,i Rank
1 Crop and animal production, hunting ... 0.101 51 0.447 30 0.015 23
2 Fishing and aquaculture 0.060 55 0.096 57 0.005 49
3 Mining and quarrying 0.070 53 0.181 53 0.008 42
4 Manufacture of food products, beverages ... 0.146 45 0.294 49 0.009 38
5 Manufacture of textiles, wearing apparel .... 0.209 25 0.375 38 0.014 25
6 Manufacture of wood and of products ... 0.181 33 0.289 50 0.019 13
7 Manufacture of paper and paper products C* C C C C C
8 Printing and reproduction of recorded media 0.201 27 0.379 37 0.009 38
9 Manufacture of coke and refined petroleum .. C C C C C C
10 Manufacture of chemicals and chemical... 0.117 48 0.273 51 0.007 45
11 Manufacture of basic pharmaceutical ... 0.102 50 0.556 17 0.004 53
12 Manufacture of rubber and plastic products 0.286 15 0.420 33 0.017 17
13 Manufacture of other non-metallic mineral ... 0.169 38 0.324 47 0.014 25
14 Manufacture Basic Metals and of fabricated... 0.193 29 0.312 48 0.013 30
15 Manufacture of computer, electronic... C C C C C C
16 Manufacture of electrical equipment 0.177 35 0.354 41 0.011 34
17 Manufacture of machinery and equipment... 0.216 23 0.325 45 0.017 17
18 Manufacture of motor vehicles, trailers... C C C C C C
19 Manufacture of other transport equipment C C C C C C
20 Manufacture of furniture; other manu.... 0.322 11 0.554 18 0.017 17
21 Repair and installation of machinery and ... 0.543 4 0.559 16 0.013 30
22 Electricity, gas, steam and air conditioning ... C C C C C C
23 Water collection, treatment and supply C C C C C C
24 Sewerage; waste collection, treatment ... 0.246 20 0.443 31 0.005 49
25 Construction 0.162 39 0.325 45 0.017 17
26 Wholesale and retail trade and repair of ... 0.244 22 0.512 22 0.018 15
27 Wholesale trade, except of motor vehicles ... 0.276 16 0.608 12 0.016 22
28 Retail trade, except of motor vehicles ... 0.307 12 0.606 13 0.029 6
29 Land transport and transport via pipelines ... 0.142 46 0.465 27 0.020 10
33
30 Water transport 0.098 52 0.170 54 0.004 53
31 Air transport C C C C C C
32 Warehousing and support activities for ... 0.170 37 0.493 26 0.009 38
33 Postal and courier activities C C C C C C
34 Accommodation and food service activities 0.245 21 0.403 35 0.015 23
35 Publishing activities 0.289 14 0.452 29 0.010 36
36 Motion picture, video and television ... 0.162 39 0.425 32 0.020 10
37 Telecommunications 0.157 43 0.510 25 0.006 48
38 Computer programming, consultancy and ... 0.177 35 0.409 34 0.007 45
39 Financial service activities, except insurance... 0.444 9 0.554 18 0.014 25
40 Insurance, reinsurance and pension funding... 0.158 42 0.023 59 0.005 49
41 Activities auxiliary to financial services ... 0.155 44 0.266 52 0.007 45
42 Real estate activities (Incl. imputed rents) ... 0.013 58 0.776 4 0.002 56
43 Legal and accounting activities; activities of ... 0.199 28 0.659 8 0.013 30
44 Architectural and engineering activities; ... 0.213 24 0.511 24 0.011 34
45 Scientific research and development C C C C C C
46 Advertising and market research 0.207 26 0.382 36 0.012 33
47 Other professional, scientific and technical ... 0.110 49 0.343 43 0.014 25
48 Rental and leasing activities 0.118 47 0.550 20 0.008 42
49 Employment activities 0.781 1 0.816 3 0.030 5
50 Travel agency, tour operator reservation ... 0.159 41 0.457 28 0.009 38
51 Security and investigation activities; services.. 0.473 7 0.591 14 0.034 3
52 Public administration and defence; ... 0.540 5 0.641 9 0.020 10
53 Education 0.750 2 0.845 2 0.038 2
54 Human health activities 0.511 6 0.707 5 0.017 17
55 Social work activities 0.584 3 0.670 7 0.126 1
56 Creative arts, gambling & betting activities ... 0.054 56 0.348 42 0.002 56
57 Sports activities and amusement and ... 0.299 13 0.572 15 0.019 13
58 Other Service Activities ... 0.274 17 0.530 21 0.029 6
59 Activities of households as employers; ... 0.000 59 0.990 1 0.000 59
Source: Author's Calculations
The data denoted by “C” implies that the derived figure is based on data which was provided under strict confidentiality and is thus not available for publication.
34
Appendix E
Type I and type II income-output multipliers
No Sectors
Type I Income Multiplier (direct
and indirect effects)
Induced effects
Total Type II Income multiplier (direct, indirect + induced effects)
Type I Rank Induced effects
Rank Type II Rank
1 Crop and animal production, hunting ... 0.21 52 0.07 52 0.27 52
2 Fishing and aquaculture 0.16 54 0.05 54 0.21 54
3 Mining and quarrying 0.22 50 0.07 50 0.29 50
4 Manufacture of food products, beverages ... 0.25 44 0.08 44 0.34 44
5 Manufacture of textiles, wearing apparel .... 0.33 26 0.11 26 0.43 26
6 Manufacture of wood and of products ... 0.31 31 0.10 31 0.41 31
7 Manufacture of paper and paper products 0.34 23 0.11 23 0.45 23
8 Printing and reproduction of recorded media 0.29 36 0.10 36 0.39 36
9 Manufacture of coke and refined petroleum .. 0.27 39 0.09 39 0.36 39
10 Manufacture of chemicals and chemical... 0.23 48 0.07 48 0.30 48
11 Manufacture of basic pharmaceutical ... 0.17 53 0.06 53 0.23 53
12 Manufacture of rubber and plastic products 0.38 16 0.13 16 0.51 16
13 Manufacture of other non-metallic mineral ... 0.30 33 0.10 33 0.40 33
14 Manufacture Basic Metals and of fabricated... 0.27 40 0.09 40 0.35 40
15 Manufacture of computer, electronic... 0.10 57 0.03 57 0.13 57
16 Manufacture of electrical equipment 0.25 46 0.08 46 0.33 46
17 Manufacture of machinery and equipment... 0.31 30 0.10 30 0.41 30
18 Manufacture of motor vehicles, trailers... 0.27 42 0.09 42 0.35 42
19 Manufacture of other transport equipment 0.27 41 0.09 41 0.35 41
20 Manufacture of furniture; other manu.... 0.40 14 0.13 14 0.53 14
21 Repair and installation of machinery and ... 0.62 5 0.20 5 0.82 5
22 Electricity, gas, steam and air conditioning ... 0.15 55 0.05 55 0.19 55
23 Water collection, treatment and supply 0.40 13 0.13 13 0.54 13
24 Sewerage; waste collection, treatment ... 0.39 15 0.13 15 0.51 15
25 Construction 0.30 34 0.10 34 0.39 34
26 Wholesale and retail trade and repair of ... 0.33 24 0.11 24 0.44 24
27 Wholesale trade, except of motor vehicles ... 0.37 18 0.12 18 0.50 18
28 Retail trade, except of motor vehicles ... 0.41 12 0.13 12 0.54 12
35
29 Land transport and transport via pipelines ... 0.25 45 0.08 45 0.33 45
30 Water transport 0.26 43 0.08 43 0.34 43
31 Air transport 0.36 21 0.12 21 0.48 21
32 Warehousing and support activities for ... 0.29 35 0.10 35 0.39 35
33 Postal and courier activities 0.55 9 0.18 9 0.73 9
34 Accommodation and food service activities 0.37 20 0.12 20 0.49 20
35 Publishing activities 0.38 17 0.12 17 0.50 17
36 Motion picture, video and television ... 0.28 38 0.09 38 0.38 38
37 Telecommunications 0.22 49 0.07 49 0.30 49
38 Computer programming, consultancy and ... 0.29 37 0.09 37 0.38 37
39 Financial service activities, except insurance... 0.60 6 0.20 6 0.79 6
40 Insurance, reinsurance and pension funding... 0.41 10 0.13 10 0.54 10
41 Activities auxiliary to financial services ... 0.35 22 0.11 22 0.46 22
42 Real estate activities (Incl. imputed rents) ... 0.07 58 0.02 58 0.09 58
43 Legal and accounting activities; activities of ... 0.30 32 0.10 32 0.40 32
44 Architectural and engineering activities; ... 0.32 27 0.11 27 0.43 27
45 Scientific research and development 0.33 25 0.11 25 0.43 25
46 Advertising and market research 0.32 28 0.10 28 0.42 28
47 Other professional, scientific and technical ... 0.21 51 0.07 51 0.28 51
48 Rental and leasing activities 0.23 47 0.07 47 0.30 47
49 Employment activities 0.83 1 0.27 1 1.11 1
50 Travel agency, tour operator reservation ... 0.31 29 0.10 29 0.41 29
51 Security and investigation activities; services.. 0.58 8 0.19 8 0.76 8
52 Public administration and defence; ... 0.65 4 0.21 4 0.86 4
53 Education 0.80 2 0.26 2 1.06 2
54 Human health activities 0.58 7 0.19 7 0.77 7
55 Social work activities 0.69 3 0.23 3 0.91 3
56 Creative arts, gambling & betting activities ... 0.12 56 0.04 56 0.16 56
57 Sports activities and amusement and ... 0.41 11 0.13 11 0.54 11
58 Other Service Activities ... 0.37 19 0.12 19 0.49 19
59 Activities of households as employers; ... 0.01 59 0.00 59 0.01 59
Source: Author's Calculations

36
Appendix F
Type I and type II value added-output multipliers
No Sectors
Type I Value Added Multiplier
(direct and indirect effects)
Induced effects
Total Type II Value Added multiplier (direct, indirect + induced effects)
Type I Rank Induced effects
Rank Type II Rank
1 Crop and animal production, hunting ... 0.64 33 0.16 52 0.80 40
2 Fishing and aquaculture 0.30 57 0.12 54 0.42 57
3 Mining and quarrying 0.48 53 0.17 50 0.65 54
4 Manufacture of food products, beverages ... 0.53 43 0.19 44 0.72 46
5 Manufacture of textiles, wearing apparel .... 0.60 37 0.25 26 0.85 34
6 Manufacture of wood and of products ... 0.52 44 0.23 31 0.76 43
7 Manufacture of paper and paper products 0.51 46 0.26 23 0.77 42
8 Printing and reproduction of recorded media 0.56 41 0.22 36 0.78 41
9 Manufacture of coke and refined petroleum .. 0.67 29 0.21 39 0.88 32
10 Manufacture of chemicals and chemical... 0.50 49 0.17 48 0.67 52
11 Manufacture of basic pharmaceutical ... 0.70 25 0.13 53 0.83 36
12 Manufacture of rubber and plastic products 0.62 36 0.29 16 0.91 29
13 Manufacture of other non-metallic mineral ... 0.58 40 0.23 33 0.81 39
14 Manufacture Basic Metals and of fabricated... 0.45 55 0.20 40 0.66 53
15 Manufacture of computer, electronic... 0.19 58 0.07 57 0.27 59
16 Manufacture of electrical equipment 0.49 51 0.19 46 0.68 51
17 Manufacture of machinery and equipment... 0.50 48 0.24 30 0.74 44
18 Manufacture of motor vehicles, trailers... 0.50 50 0.20 42 0.70 50
19 Manufacture of other transport equipment 0.51 47 0.20 41 0.71 48
20 Manufacture of furniture; other manu.... 0.70 24 0.30 14 1.01 16
21 Repair and installation of machinery and ... 0.70 22 0.47 5 1.18 9
22 Electricity, gas, steam and air conditioning ... 0.18 59 0.11 55 0.29 58
23 Water collection, treatment and supply 0.77 15 0.31 13 1.08 13
24 Sewerage; waste collection, treatment ... 0.69 28 0.29 15 0.98 20
25 Construction 0.60 38 0.23 34 0.82 38
26 Wholesale and retail trade and repair of ... 0.70 23 0.25 24 0.96 23
27 Wholesale trade, except of motor vehicles ... 0.80 11 0.28 18 1.09 11
28 Retail trade, except of motor vehicles ... 0.81 10 0.31 12 1.11 10
37
29 Land transport and transport via pipelines ... 0.69 27 0.19 45 0.88 31
30 Water transport 0.52 45 0.20 43 0.71 49
31 Air transport 0.46 54 0.27 21 0.74 45
32 Warehousing and support activities for ... 0.76 17 0.22 35 0.98 22
33 Postal and courier activities 0.81 9 0.42 9 1.23 7
34 Accommodation and food service activities 0.65 31 0.28 20 0.93 25
35 Publishing activities 0.63 34 0.29 17 0.92 27
36 Motion picture, video and television ... 0.70 26 0.22 38 0.91 28
37 Telecommunications 0.66 30 0.17 49 0.83 37
38 Computer programming, consultancy and ... 0.65 32 0.22 37 0.87 33
39 Financial service activities, except insurance...
0.79 12 0.45 6 1.24 6
40 Insurance, reinsurance and pension funding...
0.34 56 0.31 10 0.65 55
41 Activities auxiliary to financial services ... 0.62 35 0.27 22 0.88 30
42 Real estate activities (Incl. imputed rents) ... 0.90 3 0.05 58 0.95 24
43 Legal and accounting activities; activities of ...
0.84 6 0.23 32 1.07 14
44 Architectural and engineering activities; ... 0.74 20 0.25 27 0.98 21
45 Scientific research and development 0.75 19 0.25 25 1.00 19
46 Advertising and market research 0.59 39 0.24 28 0.83 35
47 Other professional, scientific and technical ... 0.56 42 0.16 51 0.72 47
48 Rental and leasing activities 0.76 18 0.17 47 0.93 26
49 Employment activities 0.90 4 0.64 1 1.53 1
50 Travel agency, tour operator reservation ... 0.77 16 0.24 29 1.01 15
51 Security and investigation activities; services..
0.78 13 0.44 8 1.22 8
52 Public administration and defence; ... 0.82 8 0.49 4 1.32 4
53 Education 0.92 2 0.61 2 1.53 2
54 Human health activities 0.84 5 0.44 7 1.29 5
55 Social work activities 0.83 7 0.52 3 1.35 3
56 Creative arts, gambling & betting activities ... 0.49 52 0.09 56 0.58 56
57 Sports activities and amusement and ... 0.77 14 0.31 11 1.08 12
58 Other Service Activities ... 0.72 21 0.28 19 1.00 18
59 Activities of households as employers; ... 1.00 1 0.00 59 1.00 17
Source: Author's Calculations
38
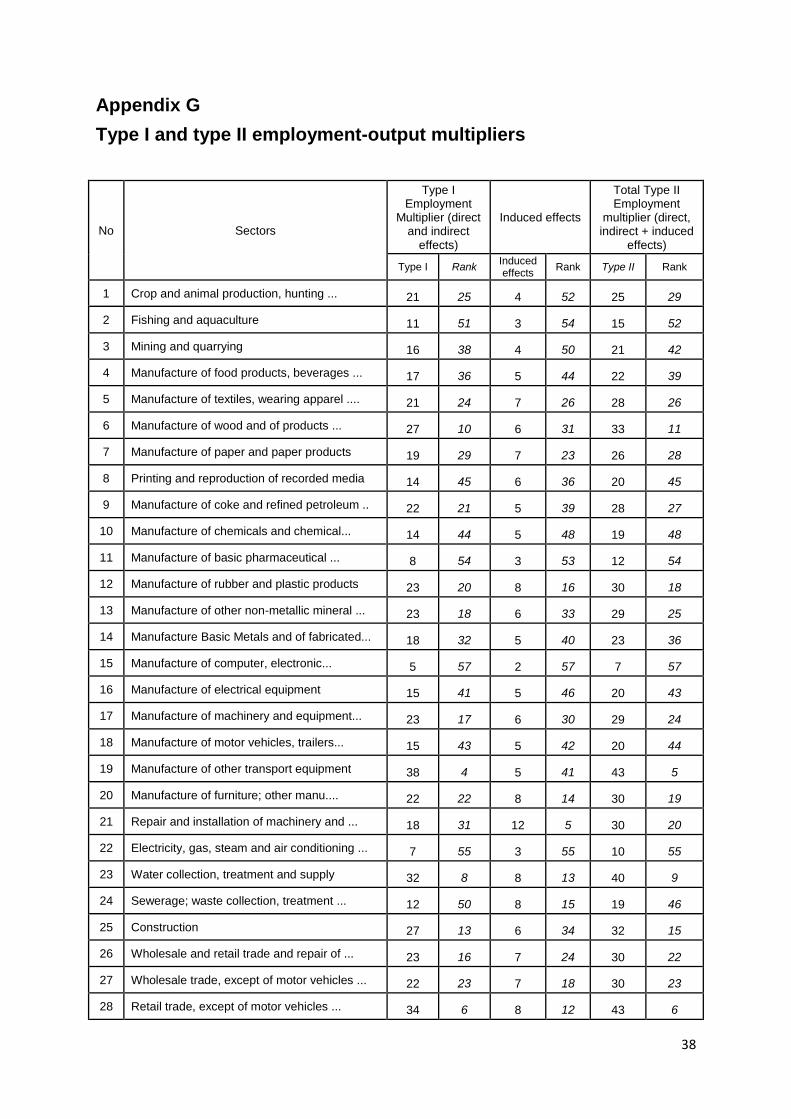
Appendix G
Type I and type II employment-output multipliers
No Sectors
Type I Employment
Multiplier (direct and indirect
effects)
Induced effects
Total Type II Employment
multiplier (direct, indirect + induced
effects)
Type I Rank Induced effects
Rank Type II Rank
1 Crop and animal production, hunting ... 21 25 4 52 25 29
2 Fishing and aquaculture 11 51 3 54 15 52
3 Mining and quarrying 16 38 4 50 21 42
4 Manufacture of food products, beverages ... 17 36 5 44 22 39
5 Manufacture of textiles, wearing apparel .... 21 24 7 26 28 26
6 Manufacture of wood and of products ... 27 10 6 31 33 11
7 Manufacture of paper and paper products 19 29 7 23 26 28
8 Printing and reproduction of recorded media 14 45 6 36 20 45
9 Manufacture of coke and refined petroleum .. 22 21 5 39 28 27
10 Manufacture of chemicals and chemical... 14 44 5 48 19 48
11 Manufacture of basic pharmaceutical ... 8 54 3 53 12 54
12 Manufacture of rubber and plastic products 23 20 8 16 30 18
13 Manufacture of other non-metallic mineral ... 23 18 6 33 29 25
14 Manufacture Basic Metals and of fabricated... 18 32 5 40 23 36
15 Manufacture of computer, electronic... 5 57 2 57 7 57
16 Manufacture of electrical equipment 15 41 5 46 20 43
17 Manufacture of machinery and equipment... 23 17 6 30 29 24
18 Manufacture of motor vehicles, trailers... 15 43 5 42 20 44
19 Manufacture of other transport equipment 38 4 5 41 43 5
20 Manufacture of furniture; other manu.... 22 22 8 14 30 19
21 Repair and installation of machinery and ... 18 31 12 5 30 20
22 Electricity, gas, steam and air conditioning ... 7 55 3 55 10 55
23 Water collection, treatment and supply 32 8 8 13 40 9
24 Sewerage; waste collection, treatment ... 12 50 8 15 19 46
25 Construction 27 13 6 34 32 15
26 Wholesale and retail trade and repair of ... 23 16 7 24 30 22
27 Wholesale trade, except of motor vehicles ... 22 23 7 18 30 23
28 Retail trade, except of motor vehicles ... 34 6 8 12 43 6

39
29 Land transport and transport via pipelines ... 27 12 5 45 32 17
30 Water transport 13 48 5 43 19 47
31 Air transport 14 47 7 21 21 41
32 Warehousing and support activities for ... 16 40 6 35 22 40
33 Postal and courier activities 30 9 11 9 41 8
34 Accommodation and food service activities 23 19 7 20 30 21
35 Publishing activities 15 42 8 17 23 38
36 Motion picture, video and television ... 27 11 6 38 33 12
37 Telecommunications 9 53 4 49 14 53
38 Computer programming, consultancy and ... 12 49 6 37 18 50
39 Financial service activities, except insurance... 20 28 12 6 32 16
40 Insurance, reinsurance and pension funding... 16 39 8 10 24 31
41 Activities auxiliary to financial services ... 17 34 7 22 24 32
42 Real estate activities (Incl. imputed rents) ... 5 56 1 58 7 58
43 Legal and accounting activities; activities of ... 18 30 6 32 24 33
44 Architectural and engineering activities; ... 17 33 6 27 24 34
45 Scientific research and development 10 52 7 25 17 51
46 Advertising and market research 17 35 6 28 23 35
47 Other professional, scientific and technical ... 20 27 4 51 24 30
48 Rental and leasing activities 14 46 5 47 18 49
49 Employment activities 33 7 17 1 49 4
50 Travel agency, tour operator reservation ... 17 37 6 29 23 37
51 Security and investigation activities; services.. 40 3 12 8 51 3
52 Public administration and defence; ... 26 14 13 4 39 10
53 Education 40 2 16 2 56 2
54 Human health activities 21 26 12 7 33 13
55 Social work activities 131 1 14 3 145 1
56 Creative arts, gambling & betting activities ... 5 58 2 56 7 56
57 Sports activities and amusement and ... 24 15 8 11 33 14
58 Other Service Activities ... 35 5 7 19 43 7
59 Activities of households as employers; ... 0 59 0 59 1 59
Source: Author's Calculations