establishing rigor in mail-survey procedures in international business research
TRANSCRIPT
Journal of World Business xxx (2014) xxx–xxx
G Model
WORBUS-668; No. of Pages 10
Establishing rigor in mail-survey procedures in international businessresearch
Agnieszka Chidlow a, Pervez N. Ghauri b,c, Sengun Yeniyurt d, S. Tamer Cavusgil e,*a Department of Management, Manchester Metropolitan University, Aytoun Street, Manchester M1 3GH, UKb Department of Management, King’s College London, 150 Stamford Street, London, UKc Visiting Professor, University of Vaasa, Finlandd Department of SCM and Marketing Sciences, Rutgers Business School, 100 Rockafeller Road, Piscataway, NJ, USAe J. Mack Robinson College of Business, Georgia State University, 35 Broad Street, Atlanta, USA
A R T I C L E I N F O
Article history:
Available online xxx
Keywords:
International business research
Mail survey
Data-collection procedures
Content analysis
A B S T R A C T
How rigorous have our data-collection procedures been in international business research? We report
the results of a comprehensive content analysis of scholarly work published in four leading international
business journals over the past decade. The focus is data-collection procedures used by researchers in
mail surveys. The intent is to be self-critical and formulate strategies for enhancing the rigor and success
of data-collection procedures in survey-based research. Our findings confirm that international business
scholars could significantly improve surveys’ response rates by following more rigorous and well-
established methodological practices already established in the social science literature. We also find
that, while some continents tend to be oversampled, a large portion of the world remains
underrepresented in international business research. The results point to interesting trends in cross-
cultural data-collection procedures. Given that primary research will always drive new knowledge
creation, scholars are strongly advised to practice best-available procedures for data collection.
� 2014 Published by Elsevier Inc.
Contents lists available at ScienceDirect
Journal of World Business
jo u r nal h o mep age: w ww.els evier . co m/lo c ate / jwb
1. Introduction
Carrying out international and comparative research based onmulti-country surveys has long been acknowledged as a difficultundertaking (Berry, 1999; Cavusgil & Das, 1997; Knight, Spreng, &Yaprak, 2003; Nasif, Al-Daeaj, Ebrahim, & Thibodeaux, 1991;Przeworski & Teune, 1966; Sekaran, 1983). While workablesolutions have been offered in such areas as questionnairedevelopment and data-analysis techniques (Brock, 2003; Harzing,1997, 2000; Jobber & Saunders, 1988; Jobber, Mirza, & Wee, 1991;Reynolds, Simintiras, & Diamantopoulos, 2003), collecting high-quality data across national borders remains a challenge (Cascio,2012; Ghauri & Grønhaug, 2010; Hult et al., 2008; Kjeldgaard,Csaba, & Ger, 2006; Yaprak, 2006).
By examining top international business (IB) journals in searchof a common research practice, Yang, Wang, and Su (2006, p. 216),found that a mail-survey questionnaire was ‘‘the most populardata-collection method’’ utilized by IB scholars during the period1992–2003. This finding is consistent with previous studies ofAdler (1983) and Peng, Peterson, and Shyi (1991).
* Corresponding author. Tel.: +1 404 413 7284; fax: +1 404 413 7276.
E-mail address: [email protected] (S.T. Cavusgil).
Please cite this article in press as: Chidlow, A., et al. Establishing rigJournal of World Business (2014), http://dx.doi.org/10.1016/j.jwb.201
1090-9516/$ – see front matter � 2014 Published by Elsevier Inc.
http://dx.doi.org/10.1016/j.jwb.2014.01.004
Given the popularity of mail-survey research by IB scholars, it isfirst important to examine the rigor of data-collection proceduresundertaken by researchers. We define rigor as the extent to whichthe researcher is thorough and precise in the data-collectionprocedures. This is because a lack of rigor in such procedures cansignificantly affect the reliability of research, the non-response bias(Dillman, Smyth, & Christian, 2009; Rada, 2000), the purpose ofconducting cross-national research (Craig & Douglas, 2000; Hultet al., 2008), and might jeopardize data-collection equivalence(Hult et al., 2008; Nasif et al., 1991; Sekaran, 1983). Second, weinvestigate ‘‘if’’ and ‘‘how’’ international business scholars havebeen reporting mail-survey-administration procedures in the lastdecade. Third, we explore the effectiveness of different data-collection practices in terms of the surveys’ response rates. Finally,we offer guidelines for international business researchers withregards to data-collection procedures in survey research.
The remainder of this paper is organized as follows. First, weprovide an overview of data-collection procedures in mail surveys,as suggested by Dillman (1978, 1999) and Dillman et al. (2009) inthe social science literature. We choose Dillman’s work as our pointof departure as it rigorously demonstrates a comprehensiveframework for mail surveys. Second, we discuss the adequacy ofsuch data-collection procedures for cross-cultural research andhighlight their benefits for mail survey research. Next, we presentthe empirical findings of mail survey-administration procedures
or in mail-survey procedures in international business research.4.01.004
A. Chidlow et al. / Journal of World Business xxx (2014) xxx–xxx2
G Model
WORBUS-668; No. of Pages 10
employed in some 285 studies by IB scholars. These werepublished in the highest-ranked international business journalsbetween 2000 and 2009. Finally, we offer a detailed discussion ofthe implications of the findings for IB research, focusing on thedata-collection procedures that should be employed to enhancedata quality in cross-cultural research.
2. A framework for cross-cultural data-collection procedures
When designing cross-cultural research, careful attention shouldbe focused on data collection to ensure comparability acrosscultures. This is because many countries have largely different socialsystems, literacy rates, and cultural norms and values. Even acountry with the same language might employ different vocabularyand cognitive processes (e.g., Germany/Austria, USA/UK).
During the data-collection phase, timing of data collection indifferent cultures, interviewer status, type of research andresponse equivalence are important (Cavusgil & Das, 1997; Ghauri& Grønhaug, 2010; Herk, Poorting, & Verhallen, 2005; Sekaran,1983). At the data-collection stage, effort should be made to ensurethat data-collection procedures are consistent across variouslocations, as this enhances the comparability of the data collected.Further, researchers should consider employing a mixed-methodapproach where more than one data-collection technique is usedfor gathering data (Couper, 2011; Czaja & Blair, 2005; Dillman,2000; Groves et al., 2004). By combining two or more data-collection methods, the researcher can compensate for theweaknesses of each individual method (De Leeuw, 2005, p. 235).Finally, ‘‘response equivalence can be ensured by adopting uniformdata-collection procedures in all the cultures in which a problem isbeing investigated’’ (Sekaran, 1983, p. 63).
Following the establishment of a seven-stage methodologymodel for conducting cross-cultural studies by Cavusgil and Das(1997), we hope to demonstrate the importance of data-collectionprocedures for survey research, with a specific emphasis on mailsurveys. We focus on the mail survey, as it is still the most commonmethod of collecting cross-national data used by IB scholars (Yang,Wang, & Su, 2006).
Concentrating on primary data-collection methods (mainlythose that use a questionnaire as a tool for gathering data), it isimportant to note that a variety of administration procedures canbe used by researchers depending how the questionnaire isdelivered to potential respondents (e.g. a postal vs. a personallyadministered questionnaire). For example, if a researcher choosesto use a mail survey, then a comprehensive framework ofadministration techniques developed by Dillman (1978, 1999)and Dillman et al. (2009) should be used to achieve thoroughnessin data-collection procedures.
Credible survey-administration procedures are essential forestablishing rigor in data collection in the IB field, as they directlyimpact the response rate, a generally accepted proxy for non-response bias and the overall reliability of the collected data.Further, by utilizing rigorous and comparable survey-administra-tion procedures across countries, IB scholars could establish data-collection-procedure equivalence. This issue has been highlightedby several scholars, including Sekaran (1983), Adler (1983), Nasifet al. (1991) and Hult et al. (2008).
When undertaking data collection for comparative surveyresearch, scholars face many potential sources of bias, any of whichcan make the results unreliable. One of these, for example, relatesto the non-response bias resulting from the fact that some of themembers of the sampled population do not respond to the surveyquestions (Cascio, 2012; Cavusgil & Das, 1997; Cox, 1974; Dillman,1991; Groves, 1989, 2004; Weisberg, 2005).
A substantial amount of research on improving mail-surveymethods has focused on response rates, a generally accepted proxy
Please cite this article in press as: Chidlow, A., et al. Establishing rigJournal of World Business (2014), http://dx.doi.org/10.1016/j.jwb.201
for non-response bias (Baruch & Holtom, 2008; Cascio, 2012;Cycota & Harris, 2006; Eichner & Habermehl, 1981; Herbelein &Baumgartner, 1978). Since carrying out international and compar-ative research based on a multi-country survey has long beenacknowledged as a difficult undertaking (Knight et al., 2003), thealmost singular focus in IB research is on response rates, due to thehigh potential for non-response bias. This is an issue that has longbeen considered as the major drawback of multi-country surveys(Harzing, 1997, 2000). Thus, in our view, employment of rigorousdata-collection procedures could reduce or eliminate such a non-response bias.
Maintaining rigor in data-collection procedures might appearstraightforward (Hult et al., 2008). Nevertheless, the nature of IBresearch poses threats and often leads to disparities in data-collection procedures (Eichner & Habermehl, 1981). Hence, theestablishment of appropriate and consistent survey-data-collec-tion techniques is crucial for rigorous scholarship. Failure to do socould jeopardize reliability and validity for knowledge creation inthe IB field (Mullen, 1995; Singh, 1995).
Guided by social exchange theory, Dillman (1978) proposed acomprehensive framework for mail-survey data-collection knownin the literature as the total design method (ToDM). According tosocial exchange theory (Blau, 1964; Homans, 1973), surveyrecipients are most likely to complete and return a questionnaireif they expect that the perceived benefits of doing so will outweighthe perceived costs (material and psychological) of responding.Consequently, the researcher (whether in the international or/anddomestic market) needs to minimize the expected costs andmaximize the expected benefits of participation.
Three elements are crucial for reinforcing this kind of behavior:rewards, costs, and trust. In simple terms, rewards are what oneanticipates to gain from a particular activity, costs are what onegives up or spends to obtain the rewards, and trust is theexpectation that in the long term the rewards of doing somethingwill offset the costs (Dillman, 1978). The key element of ToDM is aset of rigorous data-collection procedures that should be used byscholars in order to reduce non-response error (Dillman et al.,2009).
As an example, four carefully spaced mailings to potentialrespondents are proposed. First is the questionnaire mailing. Thequestionnaire is typically mailed in an envelope along with astamped and addressed return envelope and a detailed covering
letter. Second, a postcard is sent out to all potential respondents oneweek after mailing the questionnaire, thanking them for their co-operation and reminding those who have not yet responded that itis important to co-operate. Third, two weeks later, a second copy of
the questionnaire is sent out to those who have not yet sent in thecompleted questionnaire, along with a reminder letter that theirreplies have not yet been received. Finally, four to seven weekslater, a third copy of the questionnaire is mailed, this time byregistered mail to emphasize the importance of the survey. A note isalso included in this procedure to remind potential respondents ofthe importance of their response for the success of the survey.
Under the social exchange approach, a range of methods ofcontact is generally more powerful. Individuals with whom thefirst contact was successful will not be subject to receiving areplacement questionnaire. As a result, the later contacts need tobe varied in an effort to increase their effectiveness with non-respondents. Therefore it is important that each communicationmethod differs from previous ones in order to convey a sense ofappropriate renewal of an effort to communicate. Each of thesedelivery contacts, described above, builds upon past research(Dillman, Christenson, Carpenter, & Brooks, 1974; Herbelein &Baumgartner, 1978) showing that a distinctively different finalcontact improves response to mail surveys. In addition, it has beenshown in the literature that rigorous multiple contacts have a
or in mail-survey procedures in international business research.4.01.004

A. Chidlow et al. / Journal of World Business xxx (2014) xxx–xxx 3
G Model
WORBUS-668; No. of Pages 10
significantly greater collective capability for influencing responserates than any other individual and non-rigorous techniques forincreasing response to mail surveys (Dillman et al., 1974; Linsky,1975; Scott, 1961).
Taking into account the globalization of markets, the surge ofmail-survey techniques (Dillman et al., 2009; Dillman, 1972; Yanget al., 2006), and sometimes conflicting pressures from groups withmuch influence over how surveys get done, Dillman (2000)modified the original ToDM in the late 1990s and called it thetailored design method (TaDM). One of the new features of theTaDM is the change in the number of contacts. Here, the use of five
instead of four contacts is prescribed. The new contact is a brief pre-
notice letter. This is sent to potential respondents several days priorto mailing the questionnaire. It aims to signal that a questionnairefor an important survey will arrive in a few days and that theperson’s response would be greatly appreciated.
Dillman’s intention in designing each aspect of the implemen-tation system from pre-notice letter to return envelopes is to createpositive salience, where each element of the process is noticeablebut in a way that creates a positive impression and, thereby,increases a sense of reward, diminishes perceived costs and, at thesame time, creates trust. The overall impression that is establisheddepends not only on individual contacts but also on theconsistency among those contacts. Therefore, it is important thateach contact should not be thought of as self-contained but as partof an overall implementation system for which a change in onepart is likely to produce an unintended consequence for another.Thus, these contacts (or ‘touches’) should be seen as a totality ofprocedures that interact with each other to ensure a rigorous data-collection process.
Development of the ToDM technique and its ability to achievehigh response rates have contributed to an increase in the numberof mail surveys in business research (Dillman, 1991; Jussaume &Yamada, 1990; Rada, 2000). Because the ToDM was developed inthe United States, Goyder (1982, p. 533), by making reference toLadd’s (1980) work, points out that return rates on mail surveyswould be lower in foreign contexts than in the United States due to‘‘higher legitimacy of surveying in American cultures.’’ However,this no longer holds as investigations have been carried out inEurope, Australia, and Asia on whether the ToDM is a culture-bound survey methodology; it has proven to be otherwise. Forexample, Greatz (1985) assessed the feasibility of using rigorousimplementation procedures proposed by the ToDM in Australia. Hefound that such procedures yield very high response rates andreliable data. His results are comparable with those obtained in theUnited States. De Leeuw and Hox (1988), however, analyzed theefficiency of the personalization of a covering letter and reminderby registered mail (i.e. response-increasing factors of the ToDM) ona sample of the Dutch population. They found that response-stimulating factors have a statistically significant effect on thenumber of completed questionnaires and data quality, and thatresponse rates do not differ to any great extent from those in theU.S. either.
Another study in the Netherlands (Nederhof, 1983) demon-strated that the use of incentives positively influences the speedand quality of survey results. The results were also comparablewith those in the U.S. literature (Brennan, 1958; Watson, 1965).Conducting a study in Spain, Rada (2000) also validated theusefulness of Dillman’s implementation procedures. He found thatrigorous multiple contacts do indeed increase response rates.
In a study comparing the viability of the ToDM in Japan and theUnited States, Jussaume and Yamada (1990) found that ‘‘mailsurveys are feasible research tools in Japan and potentially in othercultures where the majority of the intended universe is literate, canbe sampled, and can be contacted through a dependable postalsystem (p. 226)’’. Their results suggested that the theoretical
Please cite this article in press as: Chidlow, A., et al. Establishing rigJournal of World Business (2014), http://dx.doi.org/10.1016/j.jwb.201
foundations of the ToDM are not culture-bound (specific toWestern countries) and that consideration of the theoretical base iskey to implementing the ToDM in foreign settings.
Therefore, we formulate the following hypotheses regardingthe effect of Dillman’s data-collection procedures on surveyresponse rates in international business research:
H1. The utilization of Dillman’s data-collection procedures has apositive effect on survey response rates in international businessresearch.
H2. The utilization of a pre-notice letter has a positive effect onsurvey response rates in international business research.
H3. The utilization of a cover letter has a positive effect on surveyresponse rates in international business research.
H4. The utilization of a reminder has a positive effect on surveyresponse rates in international business research.
H5. The utilization of a follow-up has a positive effect on surveyresponse rates in international business research.
H6. The utilization of incentives has a positive effect on surveyresponse rates in international business research.
H7. The utilization of a thank-you letter has a positive effect onsurvey response rates in international business research.
3. The analytical approach
To examine mail-survey-administration procedures used by IBresearchers, a comprehensive and systematic content analysis wascarried out (Krippendorf, 2004; Weber, 1990) among paperspublished in the Journal of International Business Studies (JIBS),International Business Review (IBR), Journal of World Business (JWB),and Management International Review (MIR). These four journalswere chosen because they are accepted by the internationalbusiness community as the top IB journals (DuBois & Reeb, 2000;Piekkari, Welch, & Paavilainen, 2009; Platt, 1996). We examinedarticles published over a decade, from 2000 to 2009.
3.1. Data collection
Our investigation proceeded as follows. First, all studies wereidentified through on-line access to each journal. The onlyexception was MIR, where hard-copy issues were examined forspecial and focused issues. Second, every article (omittingeditorials and commentaries) published in these four journalswas categorized based on the type of data collection used byauthors (e.g. primary, secondary or both). Within the primary-datacategory, each article was then placed into one of two groups –those using a survey (i.e. where only a questionnaire was used fordata collection) and those using a survey plus another primary-data technique (e.g. interviews, focus groups). Further, thequestionnaire category was re-grouped into the following sub-categories: mail, electronic, fax, personally administered, internalmail and mixed-method. This was undertaken in order to examine,in greater detail, the ways through which a questionnaire wasdelivered to potential respondents.
In cases where a delivery method was not mentioned by theauthors, the study was placed under the ‘‘not mentioned’’ category.Finally, we identified which of the articles used the multi-contactstrategies developed by Dillman (1978, 1999, 2000), as discussedabove. Any ambiguity related to the coding process was resolvedby the authors through discussion.
A total of 652 out of 1440 papers, published in the four journalsduring the study period, employed primary-data collection,
or in mail-survey procedures in international business research.4.01.004

Table 1Sample characteristics.
Categories Total (N = 285)
Frequency (%)
Mean (Std.dev) x2ðdfÞ
Corresponding author’s characteristics
Gender
Male 228 (80.00) 0.20 (0.40) 102.6(1)***
Female 57 (20.00)
Position
Assistant professor 77 (27.02) 2.26 (0.94) 208.67(4)***
Associate professor 69 (24.21)
Professor 132 (46.23)
PhD student 4 (1.40)
Non-academic 3 (1.05)
Country
North-Americaa 97 (34.04) 2.91 (1.67) 151.4(4)***
South-America 3 (1.05)
Europeb 110 (38.60)
Asiac 54 (18.95)
Oceaniad 21 (7.37)
Number of authors
One author 55 (19.30) 2.33 (0.94) 51.27(3)***
Two authors 119 (41.75)
Three authors 73 (25.61)
More than three authors 38 (13.33)
Number of countries surveyed
One country 160 (57.76) 2.05 (1.35) 1179.64(7)***
Two countries 32 (11.55)
Three countries 19 (6.86)
Four countries 16 (5.78)
Five countries 10 (3.61)
Six to ten countries 18 (6.50)
More than ten 22 (7.94)
Not clear how many 8 (2.81)
Continents surveyede
Europe 146 (51.23) 426.73(7)***
Asia 124 (43.51)
North America 107 (37.54)
South America 28 (9.82)
Australia 23 (8.07)
Africa 9 (3.16)
New Zealand 8 (2.81)
Middle East 7 (2.46)
Pilot study
Not referred 183 (64.21) 0.36 (0.48) 23.02(1)***
Referred 102 (35.79)
Response rate
Less than 10% 20 (7.02) 37.52 (20.72)f 189.54(10)***
10–19.99% 27 (9.47)
20–29.99% 57 (20.00)
30–39.99% 43 (15.09)
40–49.99% 33 (11.58)
50–59.99% 14 (4.91)
60–69.99% 9 (3.16)
70–79.99% 7 (2.46)
80–89.99% 5 (1.75)
90–99.99% 2 (0.70)
Not mentionedg 68 (23.86)
a Ninety-two percent of the North-American authors were based in the USA.b Thirty-nine percent of the European authors were from the UK. This was
followed by nine percent of authors from Denmark and Spain.c Fifty-four percent of the Asian authors were located in China.d Mainly Australia and New Zealand.e Percentages do not add to 100 as a large portion of the studies survey more than
one continent. America was the third most-often-surveyed continent among
studies that surveyed one country. America and Europe were the third most-often-
surveyed continents among studies that surveyed more than one country. America,
Europe and Asia were the most-often-surveyed continents among studies that
surveyed more than one country. Europe was the second most-often-surveyed
continent among studies that surveyed one and more than one country. Asia was
the most-often-surveyed continent for studies that surveyed one country.f Based on the number reported by authors and expressed in the form of a
percentage. In the case of a cross-country study, the mean response rate was included.g Here we mean studies where authors did not express the response rate.
**p < .05. ***p < .01.
A. Chidlow et al. / Journal of World Business xxx (2014) xxx–xxx4
G Model
WORBUS-668; No. of Pages 10
accounting for 45 per cent. In total, 348 (53%) of the 652 studieswere identified as using a questionnaire as their only data-collection method. The three most common ways of delivering aquestionnaire to potential respondents were by mail (82%),followed by personally administered delivery (8%), and a mixed-method approach (5%). Further, three (1%) studies out of 348 failedto mention how the questionnaire was administered.
Consistent with our stated objectives, we decided to includeonly studies that utilized a mail survey as a primary data-collectionmethod for the following reasons. First is the fact that mail surveysare still a popular way of gathering data by IB researchers (Yang etal., 2006). Second, the theoretical framework proposed by Dillman(1978) has been developed for mail-survey-data collection. Finally,the largest number of studies used this type of data-collectiontechnique in our sample.
Based on the above criteria, 285 articles were included in thepresent analysis. JIBS offered the largest number of articles (99 or35%), followed by IBR (71 or 25%), then JWB (60, 21%), and MIR (55,19%). (A list of the articles is available from the authors).
As to sample characteristics, Table 1 illustrates that in 228(80%) of the papers, the corresponding author was a male. In themajority of the studies (132 or 46%), the corresponding author wasa professor, followed by an assistant professor (77 or 27%), and anassociate professor (69 or 24%). In many of the papers (110 or 39%),the corresponding author was located in Europe, followed by NorthAmerica (97 or 34%), and Asia (54 or 19%). The largest percentage ofthe European authors (43 or 39%) was from the U.K., followed byDenmark and Spain (10 or 9% each).
As Table 1 shows, the majority of articles were authored by twoauthors (119 or 42%), followed by three authors (73 or 26%), and asingle authorship (55 or 19%). The number of countries mostfrequently surveyed by authors was one (160 or 58%), followed bytwo countries (33 or 12%), and more than ten countries (22 or 8%).The continent most surveyed by authors was Europe (146 or 51%),followed by Asia (124 or 44%), and North America (107 or 38%).While some differences exist across the four journals, it can beconcluded that Europe has been the most popular continent, whileother regions of the world such as South America, Australia, Africa,New Zealand and the Middle East have been generally under-represented by IB mail-survey research. More than half of thestudies under investigation (183 or 64%) did not mention the use ofa pilot study to pre-test the postal questionnaire. The typicalresponse rate indicated ranged between 20 and 29.99% (57 papers,20%), and the mean response rate was 38% – a higher percentagethan that obtained by Yang et al. (2006) for postal surveys across IBjournals between 1992 and 2003.
4. Empirical results
4.1. Data-collection procedures across journals
As demonstrated in Table 2, only 14 of the 285 articles underinvestigation referred to Dillman’s ToDM and/or TaDM for themail-survey-administration procedures. The journals with themost authors referring to those frameworks were MIR (5 studies),followed by JIBS and IBR (4 and 3 studies, respectively). Althoughthere is some variation in the distribution of studies referring toDillman across IB journals, these differences are not statisticallysignificant.
It has to be noted that this might be due to the fact thatstatistical analyses relating to the use of Dillman’s procedures werebased on a rather small sample and a low power of the test((1 � b) = 0.135), a rather complex relationship between the testparameters. This is an issue pointed out by Cohen (1977), Cohenand Cohen (1975), Cascio, Valenzi, and Silbey (1978), and Brock(2003).
Please cite this article in press as: Chidlow, A., et al. Establishing rigor in mail-survey procedures in international business research.Journal of World Business (2014), http://dx.doi.org/10.1016/j.jwb.2014.01.004
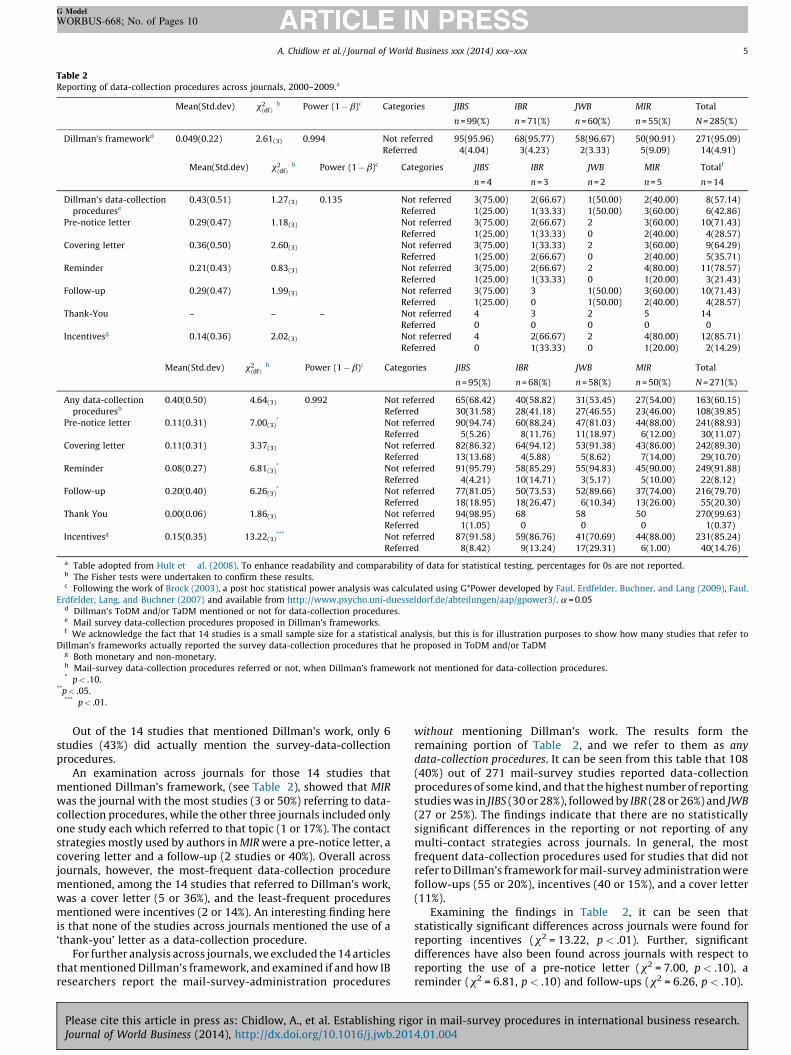
Table 2Reporting of data-collection procedures across journals, 2000–2009.a
Mean(Std.dev) x2ðdfÞ
b Power (1 � b)c Categories JIBS IBR JWB MIR Total
n = 99(%) n = 71(%) n = 60(%) n = 55(%) N = 285(%)
Dillman’s frameworkd 0.049(0.22) 2.61(3) 0.994 Not referred 95(95.96) 68(95.77) 58(96.67) 50(90.91) 271(95.09)
Referred 4(4.04) 3(4.23) 2(3.33) 5(9.09) 14(4.91)
Mean(Std.dev) x2ðdfÞ
b Power (1 � b)c Categories JIBS IBR JWB MIR Totalf
n = 4 n = 3 n = 2 n = 5 n = 14
Dillman’s data-collection
procedurese
0.43(0.51) 1.27(3) 0.135 Not referred 3(75.00) 2(66.67) 1(50.00) 2(40.00) 8(57.14)
Referred 1(25.00) 1(33.33) 1(50.00) 3(60.00) 6(42.86)
Pre-notice letter 0.29(0.47) 1.18(3) Not referred 3(75.00) 2(66.67) 2 3(60.00) 10(71.43)
Referred 1(25.00) 1(33.33) 0 2(40.00) 4(28.57)
Covering letter 0.36(0.50) 2.60(3) Not referred 3(75.00) 1(33.33) 2 3(60.00) 9(64.29)
Referred 1(25.00) 2(66.67) 0 2(40.00) 5(35.71)
Reminder 0.21(0.43) 0.83(3) Not referred 3(75.00) 2(66.67) 2 4(80.00) 11(78.57)
Referred 1(25.00) 1(33.33) 0 1(20.00) 3(21.43)
Follow-up 0.29(0.47) 1.99(3) Not referred 3(75.00) 3 1(50.00) 3(60.00) 10(71.43)
Referred 1(25.00) 0 1(50.00) 2(40.00) 4(28.57)
Thank-You – – – Not referred 4 3 2 5 14
Referred 0 0 0 0 0
Incentivesg 0.14(0.36) 2.02(3) Not referred 4 2(66.67) 2 4(80.00) 12(85.71)
Referred 0 1(33.33) 0 1(20.00) 2(14.29)
Mean(Std.dev) x2ðdfÞ
b Power (1 � b)c Categories JIBS IBR JWB MIR Total
n = 95(%) n = 68(%) n = 58(%) n = 50(%) N = 271(%)
Any data-collection
proceduresh
0.40(0.50) 4.64(3) 0.992 Not referred 65(68.42) 40(58.82) 31(53.45) 27(54.00) 163(60.15)
Referred 30(31.58) 28(41.18) 27(46.55) 23(46.00) 108(39.85)
Pre-notice letter 0.11(0.31) 7.00(3)* Not referred 90(94.74) 60(88.24) 47(81.03) 44(88.00) 241(88.93)
Referred 5(5.26) 8(11.76) 11(18.97) 6(12.00) 30(11.07)
Covering letter 0.11(0.31) 3.37(3) Not referred 82(86.32) 64(94.12) 53(91.38) 43(86.00) 242(89.30)
Referred 13(13.68) 4(5.88) 5(8.62) 7(14.00) 29(10.70)
Reminder 0.08(0.27) 6.81(3)* Not referred 91(95.79) 58(85.29) 55(94.83) 45(90.00) 249(91.88)
Referred 4(4.21) 10(14.71) 3(5.17) 5(10.00) 22(8.12)
Follow-up 0.20(0.40) 6.26(3)* Not referred 77(81.05) 50(73.53) 52(89.66) 37(74.00) 216(79.70)
Referred 18(18.95) 18(26.47) 6(10.34) 13(26.00) 55(20.30)
Thank You 0.00(0.06) 1.86(3) Not referred 94(98.95) 68 58 50 270(99.63)
Referred 1(1.05) 0 0 0 1(0.37)
Incentivesg 0.15(0.35) 13.22(3)*** Not referred 87(91.58) 59(86.76) 41(70.69) 44(88.00) 231(85.24)
Referred 8(8.42) 9(13.24) 17(29.31) 6(1.00) 40(14.76)
a Table adopted from Hult et al. (2008). To enhance readability and comparability of data for statistical testing, percentages for 0s are not reported.b The Fisher tests were undertaken to confirm these results.c Following the work of Brock (2003), a post hoc statistical power analysis was calculated using G*Power developed by Faul, Erdfelder, Buchner, and Lang (2009), Faul,
Erdfelder, Lang, and Buchner (2007) and available from http://www.psycho.uni-duesseldorf.de/abteilungen/aap/gpower3/. a = 0.05d Dillman’s ToDM and/or TaDM mentioned or not for data-collection procedures.e Mail survey data-collection procedures proposed in Dillman’s frameworks.f We acknowledge the fact that 14 studies is a small sample size for a statistical analysis, but this is for illustration purposes to show how many studies that refer to
Dillman’s frameworks actually reported the survey data-collection procedures that he proposed in ToDM and/or TaDMg Both monetary and non-monetary.h Mail-survey data-collection procedures referred or not, when Dillman’s framework not mentioned for data-collection procedures.* p < .10.
**p < .05.*** p < .01.
A. Chidlow et al. / Journal of World Business xxx (2014) xxx–xxx 5
G Model
WORBUS-668; No. of Pages 10
Out of the 14 studies that mentioned Dillman’s work, only 6studies (43%) did actually mention the survey-data-collectionprocedures.
An examination across journals for those 14 studies thatmentioned Dillman’s framework, (see Table 2), showed that MIR
was the journal with the most studies (3 or 50%) referring to data-collection procedures, while the other three journals included onlyone study each which referred to that topic (1 or 17%). The contactstrategies mostly used by authors in MIR were a pre-notice letter, acovering letter and a follow-up (2 studies or 40%). Overall acrossjournals, however, the most-frequent data-collection procedurementioned, among the 14 studies that referred to Dillman’s work,was a cover letter (5 or 36%), and the least-frequent proceduresmentioned were incentives (2 or 14%). An interesting finding hereis that none of the studies across journals mentioned the use of a‘thank-you’ letter as a data-collection procedure.
For further analysis across journals, we excluded the 14 articlesthat mentioned Dillman’s framework, and examined if and how IBresearchers report the mail-survey-administration procedures
Please cite this article in press as: Chidlow, A., et al. Establishing rigJournal of World Business (2014), http://dx.doi.org/10.1016/j.jwb.201
without mentioning Dillman’s work. The results form theremaining portion of Table 2, and we refer to them as any
data-collection procedures. It can be seen from this table that 108(40%) out of 271 mail-survey studies reported data-collectionprocedures of some kind, and that the highest number of reportingstudies was in JIBS (30 or 28%), followed by IBR (28 or 26%) and JWB
(27 or 25%). The findings indicate that there are no statisticallysignificant differences in the reporting or not reporting of anymulti-contact strategies across journals. In general, the mostfrequent data-collection procedures used for studies that did notrefer to Dillman’s framework for mail-survey administration werefollow-ups (55 or 20%), incentives (40 or 15%), and a cover letter(11%).
Examining the findings in Table 2, it can be seen thatstatistically significant differences across journals were found forreporting incentives (x2 = 13.22, p < .01). Further, significantdifferences have also been found across journals with respect toreporting the use of a pre-notice letter (x2 = 7.00, p < .10), areminder (x2 = 6.81, p < .10) and follow-ups (x2 = 6.26, p < .10).
or in mail-survey procedures in international business research.4.01.004
A. Chidlow et al. / Journal of World Business xxx (2014) xxx–xxx6
G Model
WORBUS-668; No. of Pages 10
JWB included the most studies that reported a pre-notice letter(11 or 19%) and incentives (17 or 29%). IBR contained the largestnumber of articles that used reminders (10 or 15%). However, bothIBR and JIBS included the highest number of studies that mentionedfollow-ups (18 or 19% and 18 or 27%, respectively). As indicated inthis part of Table 2, there was only one study (1%), published inJIBS, which reported a thank-you letter as a mail-survey-administration procedure.
We are fully aware here of the fact that the increased alpharaises the probability of Type 1 error occurring and thattraditionally either the 0.05 level or the 0.01 level have been usedin statistical-inference testing (Cowles & Davis, 1982). However,our understanding of the classical statistics is that the alpha error isgenerally arbitrary in hypothesis testing and that classical theorydoes not provide a set of rules for selecting the alpha level (Gibbons& Pratt, 1975; Greene, 2003). Thus, in order to support the use ofthe 0.10 significance level in our analyses, we would like to refer tothe work of Mayers and Melcher (1969, p. 35), who point out: ‘‘Toset a at the same level, say, 0.05 for all hypothesis-testingsituations is hardly rational. Rather, for some actions theprobability of not taking the right action when the hypothesis istrue should be small such as one out of 100 times; while for otherstatistical-inference problems this alpha error should be ratherlarge such as 30 or 40 per cent’’. In addition, we would also like tomention the work of Skipper, Guenther, and Nass (1967), Stanford(1968) and Cascio and Zedeck (1983) for choosing the adequatesignificance levels in social science.
4.2. Data-collection procedures across time
As shown in Table 3, statistically significant differences werefound between studies that either did or did not report Dillman’sframework for the postal-surveys’ data-collection process acrossyears (x2 = 17.22, p < .05). Of the 14 studies that mentionedDillman’s framework for the mail-survey-administration proce-dures, the highest annual percentage of reporting such approachamong studies was in 2004 (15% or 5), followed by 2007 (14% or 4).Of the five studies published in 2004, three (60%) actuallymentioned the mail-survey data-collection procedures, and ofthe four studies published in 2007 only one (25%) referred to suchstrategies. The most popular contact procedure used by authorsthat referred to Dillman’s work in 2004 was a follow-up (2 studiesor 40%).
Table 3 also reveals that between 2000 and 2009, only 108(40%) out of 271 studies mentioned any data-collection procedurefor mail surveys of any kind. It can also be seen that of those 108studies, the years from 2006 to 2009 included the most studies (13)that mentioned any data-collection procedures, and the year 2001included the fewest of these studies (7). Further, our finding acrossyears points out that a statistically significant result was found (i.e.among studies that mentioned any data-collection procedures)only for reporting a covering letter as a data-collection strategy formail surveys (x2 = 15.03, p < .10).
4.3. Data-collection procedures by the number of countries surveyed
Table 4 displays the results of either reporting or not reportingmail-survey data-collection procedures across four journals by thenumber of countries surveyed by authors. Here, 8 studies wereexcluded from the analysis as it was not clear how many countrieswere surveyed by authors. Please see Table 1 for samplecharacteristics.
As shown in Table 4, among studies that surveyed one country,JIBS was the journal with the most studies (45 or 28%), followed byIBR (43 or 27%), and MIR (37 or 23%). Of the 160 studies thatsurveyed one country, 77 studies (48%) referred to postal-survey
Please cite this article in press as: Chidlow, A., et al. Establishing rigJournal of World Business (2014), http://dx.doi.org/10.1016/j.jwb.201
data-collection procedures. MIR was the journal with most studies(21 or 27%) that reported any techniques, while JIBS was thejournal with the fewest studies (16 or 21%). Both IBR and JWB
contained an equal number of studies (20 or 26%) that referred tomail data-collection methods. Further, it appears that the mostcommon procedure utilized by authors that surveyed one countrywas follow-ups (41 or 26%), and the least common technique was areminder (18 or 12%). In addition, statistically significant resultswere only found for reporting incentives (x2 = 8.09, p < .05) andreminders (x2 = 7.75, p < .05) among studies that surveyed onecountry across the four journals. None of the studies that surveyedone country used a ‘thank-you’ letter as a mail data-collectionprocedure.
As indicated in Table 4, among studies that surveyed more thanone country, once again JIBS was the journal with the most studies(54 or 46%). JIBS was followed equally by IBR and JWB (25 or 21%),and MIR (13 or 11%). Only 35 studies (30%), out of 117 thatsurveyed more than one country, referred to mail-survey data-collection techniques. In contrast to previous findings, JIBS was thejournal with most studies (15 or 43%) that reported anytechniques, while MIR was the journal with the fewest studies(14 or 12%). Once again, both IBR and JWB contained an equalnumber of studies (8 or 23%) that referred to mail data-collectionmethods. The findings suggest that the most frequent data-collection procedures were incentives (16 or 14%) and follow-ups(16 or 14%), and the least-used technique was a pre-notice letter(7 or 6%). Moreover, a statistically significant result was found onlyfor reporting a pre-notice letter (x2 = 6.34, p < .10) as a data-collection strategy among studies that surveyed more than onecountry across journals.
The results also reveal that there is no statistically significantdifference between those that surveyed one country vs. studiesthat surveyed more than one country with respect to mail-survey-administration techniques across the journals.
4.4. Effects on survey response rate
As noted above, rigorous data-collection procedures areexpected to have a significant impact on the survey response rateand the quality of data that the researcher gathers. Therefore, wenow turn our attention into the non-response bias in IB surveyresearch.
Considering the wide variations in the survey-collectionprocedures utilized by the IB researchers, a regression analysiswas performed where the dependent variable is the response ratereported in each study. The linear model for mail-survey responserates is as follows:
ResponseRatei ¼ b0 þ b1 Yeari þ b2 NorthAmericai þ b3 Asiai
þ b4 OtherContinentsi
þ b5 LnðNumberofCountriesÞi þ b6 IBRi
þ b7 JWBi þ b8 MIRi þ b9 Pre � Noticei
þ b10 Coveringi þ b11 Reminderi
þ b12 Follow � u pi þ b13 Incentivesi
þ b14 Thank � Youi þ b15 Dillmani þ di (1)
where Response Rate is the reported response rate for the surveyutilized in study i, b0 is the intercept, and b1 to b15 are thecoefficients. Year is the trend variable and denotes the calendaryear in which the study was published, North America, Asia andOther Continents are dummy variables coded as 1 if study i collecteddata from the respective continent and 0 otherwise. Europe is thebase case. Number of Countries denotes the number of countriesthat are surveyed in study i. The number of countries has been
or in mail-survey procedures in international business research.4.01.004
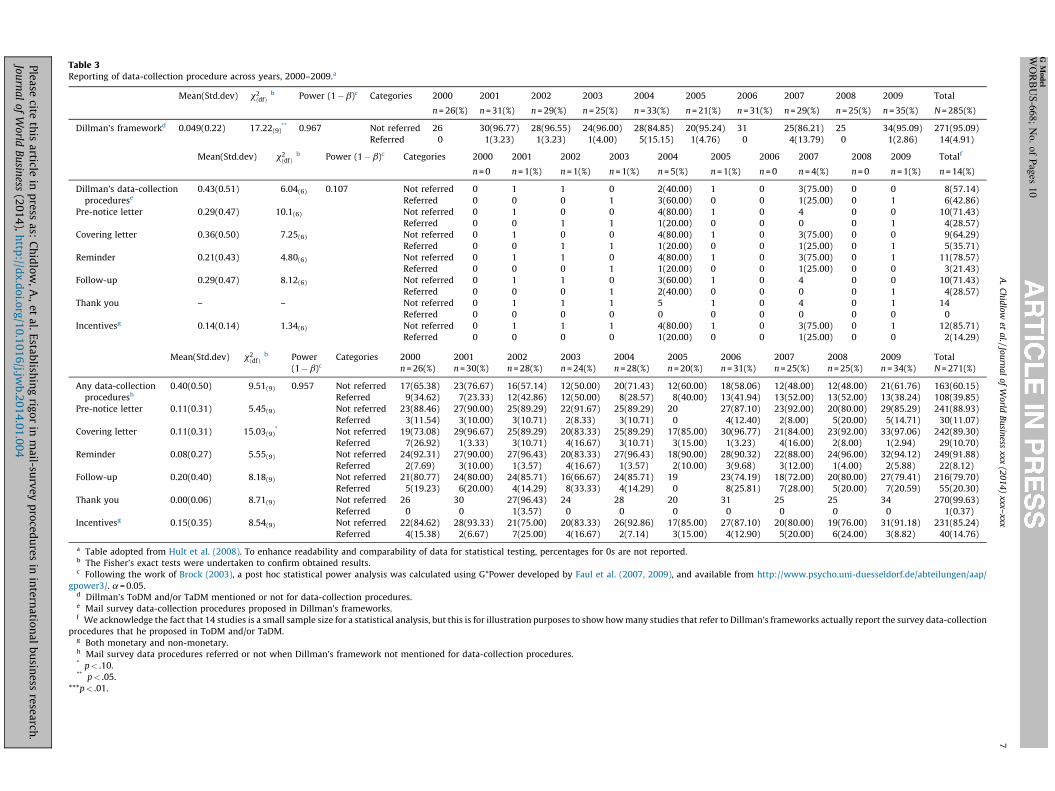
Table 3Reporting of data-collection procedure across years, 2000–2009.a
Mean(Std.dev) x2ðdfÞ
b Power (1�b)c Categories 2000 2001 2002 2003 2004 2005 2006 2007 2008 2009 Total
n = 26(%) n = 31(%) n = 29(%) n = 25(%) n = 33(%) n = 21(%) n = 31(%) n = 29(%) n = 25(%) n = 35(%) N = 285(%)
Dillman’s frameworkd 0.049(0.22) 17.22(9)** 0.967 Not referred 26 30(96.77) 28(96.55) 24(96.00) 28(84.85) 20(95.24) 31 25(86.21) 25 34(95.09) 271(95.09)
Referred 0 1(3.23) 1(3.23) 1(4.00) 5(15.15) 1(4.76) 0 4(13.79) 0 1(2.86) 14(4.91)
Mean(Std.dev) x2ðdfÞ
b Power (1�b)c Categories 2000 2001 2002 2003 2004 2005 2006 2007 2008 2009 Totalf
n = 0 n = 1(%) n = 1(%) n = 1(%) n = 5(%) n = 1(%) n = 0 n = 4(%) n = 0 n = 1(%) n = 14(%)
Dillman’s data-collection
procedurese
0.43(0.51) 6.04(6) 0.107 Not referred 0 1 1 0 2(40.00) 1 0 3(75.00) 0 0 8(57.14)
Referred 0 0 0 1 3(60.00) 0 0 1(25.00) 0 1 6(42.86)
Pre-notice letter 0.29(0.47) 10.1(6) Not referred 0 1 0 0 4(80.00) 1 0 4 0 0 10(71.43)
Referred 0 0 1 1 1(20.00) 0 0 0 0 1 4(28.57)
Covering letter 0.36(0.50) 7.25(6) Not referred 0 1 0 0 4(80.00) 1 0 3(75.00) 0 0 9(64.29)
Referred 0 0 1 1 1(20.00) 0 0 1(25.00) 0 1 5(35.71)
Reminder 0.21(0.43) 4.80(6) Not referred 0 1 1 0 4(80.00) 1 0 3(75.00) 0 1 11(78.57)
Referred 0 0 0 1 1(20.00) 0 0 1(25.00) 0 0 3(21.43)
Follow-up 0.29(0.47) 8.12(6) Not referred 0 1 1 0 3(60.00) 1 0 4 0 0 10(71.43)
Referred 0 0 0 1 2(40.00) 0 0 0 0 1 4(28.57)
Thank you – – Not referred 0 1 1 1 5 1 0 4 0 1 14
Referred 0 0 0 0 0 0 0 0 0 0 0
Incentivesg 0.14(0.14) 1.34(6) Not referred 0 1 1 1 4(80.00) 1 0 3(75.00) 0 1 12(85.71)
Referred 0 0 0 0 1(20.00) 0 0 1(25.00) 0 0 2(14.29)
Mean(Std.dev) x2ðdfÞ
b Power
(1�b)c
Categories 2000
n = 26(%)
2001
n = 30(%)
2002
n = 28(%)
2003
n = 24(%)
2004
n = 28(%)
2005
n = 20(%)
2006
n = 31(%)
2007
n = 25(%)
2008
n = 25(%)
2009
n = 34(%)
Total
N = 271(%)
Any data-collection
proceduresh
0.40(0.50) 9.51(9) 0.957 Not referred 17(65.38) 23(76.67) 16(57.14) 12(50.00) 20(71.43) 12(60.00) 18(58.06) 12(48.00) 12(48.00) 21(61.76) 163(60.15)
Referred 9(34.62) 7(23.33) 12(42.86) 12(50.00) 8(28.57) 8(40.00) 13(41.94) 13(52.00) 13(52.00) 13(38.24) 108(39.85)
Pre-notice letter 0.11(0.31) 5.45(9) Not referred 23(88.46) 27(90.00) 25(89.29) 22(91.67) 25(89.29) 20 27(87.10) 23(92.00) 20(80.00) 29(85.29) 241(88.93)
Referred 3(11.54) 3(10.00) 3(10.71) 2(8.33) 3(10.71) 0 4(12.40) 2(8.00) 5(20.00) 5(14.71) 30(11.07)
Covering letter 0.11(0.31) 15.03(9)* Not referred 19(73.08) 29(96.67) 25(89.29) 20(83.33) 25(89.29) 17(85.00) 30(96.77) 21(84.00) 23(92.00) 33(97.06) 242(89.30)
Referred 7(26.92) 1(3.33) 3(10.71) 4(16.67) 3(10.71) 3(15.00) 1(3.23) 4(16.00) 2(8.00) 1(2.94) 29(10.70)
Reminder 0.08(0.27) 5.55(9) Not referred 24(92.31) 27(90.00) 27(96.43) 20(83.33) 27(96.43) 18(90.00) 28(90.32) 22(88.00) 24(96.00) 32(94.12) 249(91.88)
Referred 2(7.69) 3(10.00) 1(3.57) 4(16.67) 1(3.57) 2(10.00) 3(9.68) 3(12.00) 1(4.00) 2(5.88) 22(8.12)
Follow-up 0.20(0.40) 8.18(9) Not referred 21(80.77) 24(80.00) 24(85.71) 16(66.67) 24(85.71) 19 23(74.19) 18(72.00) 20(80.00) 27(79.41) 216(79.70)
Referred 5(19.23) 6(20.00) 4(14.29) 8(33.33) 4(14.29) 0 8(25.81) 7(28.00) 5(20.00) 7(20.59) 55(20.30)
Thank you 0.00(0.06) 8.71(9) Not referred 26 30 27(96.43) 24 28 20 31 25 25 34 270(99.63)
Referred 0 0 1(3.57) 0 0 0 0 0 0 0 1(0.37)
Incentivesg 0.15(0.35) 8.54(9) Not referred 22(84.62) 28(93.33) 21(75.00) 20(83.33) 26(92.86) 17(85.00) 27(87.10) 20(80.00) 19(76.00) 31(91.18) 231(85.24)
Referred 4(15.38) 2(6.67) 7(25.00) 4(16.67) 2(7.14) 3(15.00) 4(12.90) 5(20.00) 6(24.00) 3(8.82) 40(14.76)
a Table adopted from Hult et al. (2008). To enhance readability and comparability of data for statistical testing, percentages for 0s are not reported.b The Fisher’s exact tests were undertaken to confirm obtained results.c Following the work of Brock (2003), a post hoc statistical power analysis was calculated using G*Power developed by Faul et al. (2007, 2009), and available from http://www.psycho.uni-duesseldorf.de/abteilungen/aap/
gpower3/. a= 0.05.d Dillman’s ToDM and/or TaDM mentioned or not for data-collection procedures.e Mail survey data-collection procedures proposed in Dillman’s frameworks.f We acknowledge the fact that 14 studies is a small sample size for a statistical analysis, but this is for illustration purposes to show how many studies that refer to Dillman’s frameworks actually report the survey data-collection
procedures that he proposed in ToDM and/or TaDM.g Both monetary and non-monetary.h Mail survey data procedures referred or not when Dillman’s framework not mentioned for data-collection procedures.* p< .10.** p< .05.
***p< .01.
A.
Ch
idlo
w et
al.
/ Jo
urn
al
of
Wo
rld B
usin
ess xxx
(20
14
) xxx–
xxx
7
G M
od
el
WO
RB
US
-66
8;
No
. o
f P
ages
10
Ple
ase
cite th
is a
rticle in
pre
ss a
s: C
hid
low
, A
., e
t a
l. E
stab
lishin
g rig
or
in m
ail-su
rve
y p
roce
du
res
in in
tern
atio
na
l b
usin
ess
rese
arch
.Jo
urn
al
of
Wo
rld B
usin
ess (2
01
4),
http
://dx
.do
i.org
/10
.10
16
/j.jwb
.20
14
.01
.00
4
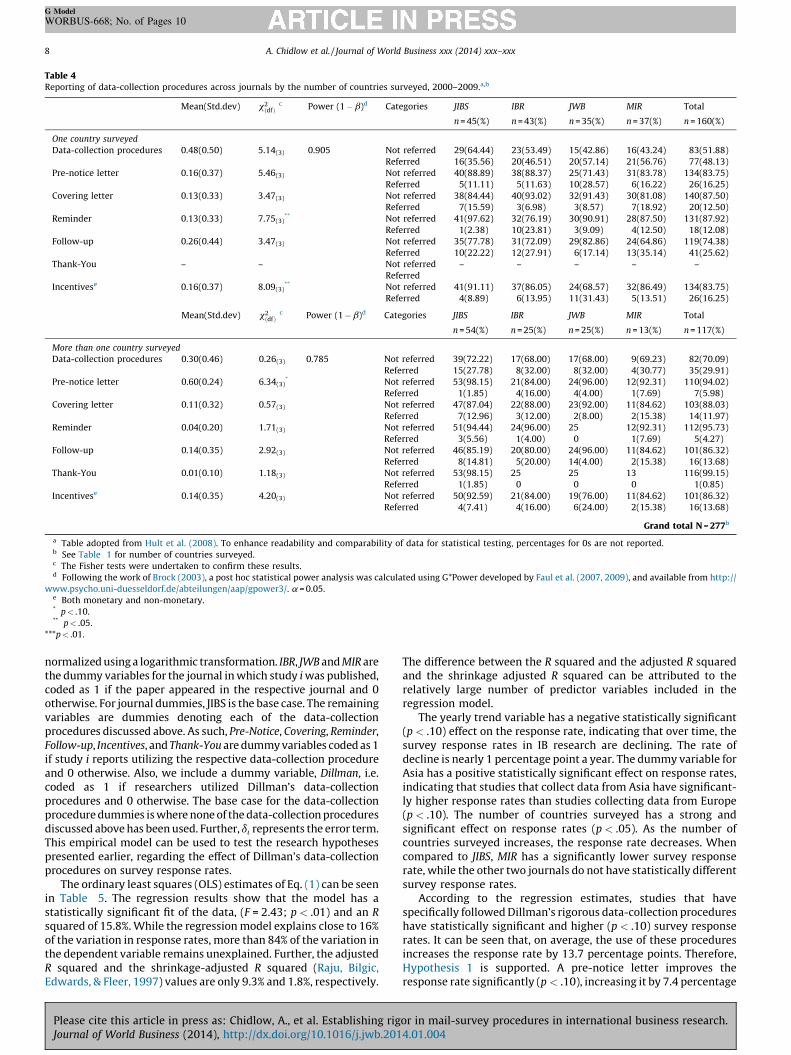
Table 4Reporting of data-collection procedures across journals by the number of countries surveyed, 2000–2009.a,b
Mean(Std.dev) x2ðdfÞ
c Power (1 � b)d Categories JIBS IBR JWB MIR Total
n = 45(%) n = 43(%) n = 35(%) n = 37(%) n = 160(%)
One country surveyed
Data-collection procedures 0.48(0.50) 5.14(3) 0.905 Not referred 29(64.44) 23(53.49) 15(42.86) 16(43.24) 83(51.88)
Referred 16(35.56) 20(46.51) 20(57.14) 21(56.76) 77(48.13)
Pre-notice letter 0.16(0.37) 5.46(3) Not referred 40(88.89) 38(88.37) 25(71.43) 31(83.78) 134(83.75)
Referred 5(11.11) 5(11.63) 10(28.57) 6(16.22) 26(16.25)
Covering letter 0.13(0.33) 3.47(3) Not referred 38(84.44) 40(93.02) 32(91.43) 30(81.08) 140(87.50)
Referred 7(15.59) 3(6.98) 3(8.57) 7(18.92) 20(12.50)
Reminder 0.13(0.33) 7.75(3)** Not referred 41(97.62) 32(76.19) 30(90.91) 28(87.50) 131(87.92)
Referred 1(2.38) 10(23.81) 3(9.09) 4(12.50) 18(12.08)
Follow-up 0.26(0.44) 3.47(3) Not referred 35(77.78) 31(72.09) 29(82.86) 24(64.86) 119(74.38)
Referred 10(22.22) 12(27.91) 6(17.14) 13(35.14) 41(25.62)
Thank-You – – Not referred – – – – –
Referred
Incentivese 0.16(0.37) 8.09(3)** Not referred 41(91.11) 37(86.05) 24(68.57) 32(86.49) 134(83.75)
Referred 4(8.89) 6(13.95) 11(31.43) 5(13.51) 26(16.25)
Mean(Std.dev) x2ðdfÞ
c Power (1 � b)d Categories JIBS IBR JWB MIR Total
n = 54(%) n = 25(%) n = 25(%) n = 13(%) n = 117(%)
More than one country surveyed
Data-collection procedures 0.30(0.46) 0.26(3) 0.785 Not referred 39(72.22) 17(68.00) 17(68.00) 9(69.23) 82(70.09)
Referred 15(27.78) 8(32.00) 8(32.00) 4(30.77) 35(29.91)
Pre-notice letter 0.60(0.24) 6.34(3)* Not referred 53(98.15) 21(84.00) 24(96.00) 12(92.31) 110(94.02)
Referred 1(1.85) 4(16.00) 4(4.00) 1(7.69) 7(5.98)
Covering letter 0.11(0.32) 0.57(3) Not referred 47(87.04) 22(88.00) 23(92.00) 11(84.62) 103(88.03)
Referred 7(12.96) 3(12.00) 2(8.00) 2(15.38) 14(11.97)
Reminder 0.04(0.20) 1.71(3) Not referred 51(94.44) 24(96.00) 25 12(92.31) 112(95.73)
Referred 3(5.56) 1(4.00) 0 1(7.69) 5(4.27)
Follow-up 0.14(0.35) 2.92(3) Not referred 46(85.19) 20(80.00) 24(96.00) 11(84.62) 101(86.32)
Referred 8(14.81) 5(20.00) 14(4.00) 2(15.38) 16(13.68)
Thank-You 0.01(0.10) 1.18(3) Not referred 53(98.15) 25 25 13 116(99.15)
Referred 1(1.85) 0 0 0 1(0.85)
Incentivese 0.14(0.35) 4.20(3) Not referred 50(92.59) 21(84.00) 19(76.00) 11(84.62) 101(86.32)
Referred 4(7.41) 4(16.00) 6(24.00) 2(15.38) 16(13.68)
Grand total N = 277b
a Table adopted from Hult et al. (2008). To enhance readability and comparability of data for statistical testing, percentages for 0s are not reported.b See Table 1 for number of countries surveyed.c The Fisher tests were undertaken to confirm these results.d Following the work of Brock (2003), a post hoc statistical power analysis was calculated using G*Power developed by Faul et al. (2007, 2009), and available from http://
www.psycho.uni-duesseldorf.de/abteilungen/aap/gpower3/. a = 0.05.e Both monetary and non-monetary.* p < .10.** p < .05.
***p < .01.
A. Chidlow et al. / Journal of World Business xxx (2014) xxx–xxx8
G Model
WORBUS-668; No. of Pages 10
normalized using a logarithmic transformation. IBR, JWB and MIR arethe dummy variables for the journal in which study i was published,coded as 1 if the paper appeared in the respective journal and 0otherwise. For journal dummies, JIBS is the base case. The remainingvariables are dummies denoting each of the data-collectionprocedures discussed above. As such, Pre-Notice, Covering, Reminder,Follow-up, Incentives, and Thank-You are dummy variables coded as 1if study i reports utilizing the respective data-collection procedureand 0 otherwise. Also, we include a dummy variable, Dillman, i.e.coded as 1 if researchers utilized Dillman’s data-collectionprocedures and 0 otherwise. The base case for the data-collectionprocedure dummies is where none of the data-collection proceduresdiscussed above has been used. Further, di represents the error term.This empirical model can be used to test the research hypothesespresented earlier, regarding the effect of Dillman’s data-collectionprocedures on survey response rates.
The ordinary least squares (OLS) estimates of Eq. (1) can be seenin Table 5. The regression results show that the model has astatistically significant fit of the data, (F = 2.43; p < .01) and an R
squared of 15.8%. While the regression model explains close to 16%of the variation in response rates, more than 84% of the variation inthe dependent variable remains unexplained. Further, the adjustedR squared and the shrinkage-adjusted R squared (Raju, Bilgic,Edwards, & Fleer, 1997) values are only 9.3% and 1.8%, respectively.
Please cite this article in press as: Chidlow, A., et al. Establishing rigJournal of World Business (2014), http://dx.doi.org/10.1016/j.jwb.201
The difference between the R squared and the adjusted R squaredand the shrinkage adjusted R squared can be attributed to therelatively large number of predictor variables included in theregression model.
The yearly trend variable has a negative statistically significant(p < .10) effect on the response rate, indicating that over time, thesurvey response rates in IB research are declining. The rate ofdecline is nearly 1 percentage point a year. The dummy variable forAsia has a positive statistically significant effect on response rates,indicating that studies that collect data from Asia have significant-ly higher response rates than studies collecting data from Europe(p < .10). The number of countries surveyed has a strong andsignificant effect on response rates (p < .05). As the number ofcountries surveyed increases, the response rate decreases. Whencompared to JIBS, MIR has a significantly lower survey responserate, while the other two journals do not have statistically differentsurvey response rates.
According to the regression estimates, studies that havespecifically followed Dillman’s rigorous data-collection procedureshave statistically significant and higher (p < .10) survey responserates. It can be seen that, on average, the use of these proceduresincreases the response rate by 13.7 percentage points. Therefore,Hypothesis 1 is supported. A pre-notice letter improves theresponse rate significantly (p < .10), increasing it by 7.4 percentage
or in mail-survey procedures in international business research.4.01.004
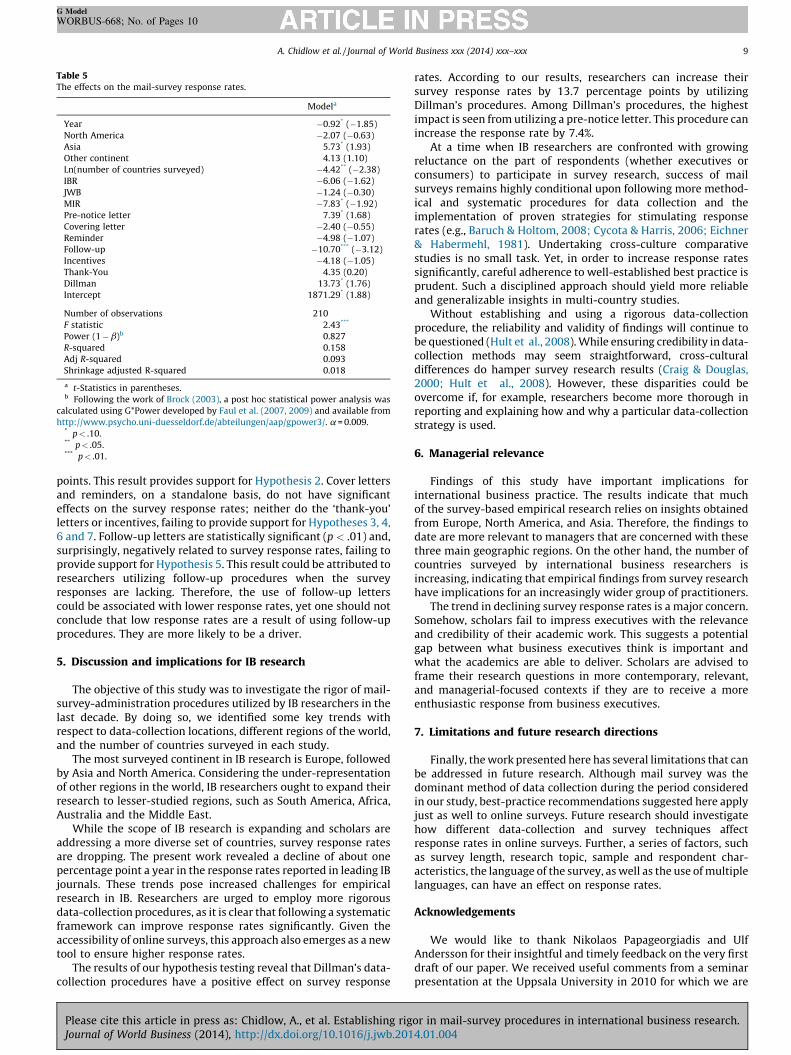
Table 5The effects on the mail-survey response rates.
Modela
Year �0.92* (�1.85)
North America �2.07 (�0.63)
Asia 5.73* (1.93)
Other continent 4.13 (1.10)
Ln(number of countries surveyed) �4.42** (�2.38)
IBR �6.06 (�1.62)
JWB �1.24 (�0.30)
MIR �7.83* (�1.92)
Pre-notice letter 7.39* (1.68)
Covering letter �2.40 (�0.55)
Reminder �4.98 (�1.07)
Follow-up �10.70*** (�3.12)
Incentives �4.18 (�1.05)
Thank-You 4.35 (0.20)
Dillman 13.73* (1.76)
Intercept 1871.29* (1.88)
Number of observations 210
F statistic 2.43***
Power (1 � b)b 0.827
R-squared 0.158
Adj R-squared 0.093
Shrinkage adjusted R-squared 0.018
a t-Statistics in parentheses.b Following the work of Brock (2003), a post hoc statistical power analysis was
calculated using G*Power developed by Faul et al. (2007, 2009) and available from
http://www.psycho.uni-duesseldorf.de/abteilungen/aap/gpower3/. a = 0.009.* p < .10.** p < .05.*** p < .01.
A. Chidlow et al. / Journal of World Business xxx (2014) xxx–xxx 9
G Model
WORBUS-668; No. of Pages 10
points. This result provides support for Hypothesis 2. Cover lettersand reminders, on a standalone basis, do not have significanteffects on the survey response rates; neither do the ‘thank-you’letters or incentives, failing to provide support for Hypotheses 3, 4,6 and 7. Follow-up letters are statistically significant (p < .01) and,surprisingly, negatively related to survey response rates, failing toprovide support for Hypothesis 5. This result could be attributed toresearchers utilizing follow-up procedures when the surveyresponses are lacking. Therefore, the use of follow-up letterscould be associated with lower response rates, yet one should notconclude that low response rates are a result of using follow-upprocedures. They are more likely to be a driver.
5. Discussion and implications for IB research
The objective of this study was to investigate the rigor of mail-survey-administration procedures utilized by IB researchers in thelast decade. By doing so, we identified some key trends withrespect to data-collection locations, different regions of the world,and the number of countries surveyed in each study.
The most surveyed continent in IB research is Europe, followedby Asia and North America. Considering the under-representationof other regions in the world, IB researchers ought to expand theirresearch to lesser-studied regions, such as South America, Africa,Australia and the Middle East.
While the scope of IB research is expanding and scholars areaddressing a more diverse set of countries, survey response ratesare dropping. The present work revealed a decline of about onepercentage point a year in the response rates reported in leading IBjournals. These trends pose increased challenges for empiricalresearch in IB. Researchers are urged to employ more rigorousdata-collection procedures, as it is clear that following a systematicframework can improve response rates significantly. Given theaccessibility of online surveys, this approach also emerges as a newtool to ensure higher response rates.
The results of our hypothesis testing reveal that Dillman’s data-collection procedures have a positive effect on survey response
Please cite this article in press as: Chidlow, A., et al. Establishing rigJournal of World Business (2014), http://dx.doi.org/10.1016/j.jwb.201
rates. According to our results, researchers can increase theirsurvey response rates by 13.7 percentage points by utilizingDillman’s procedures. Among Dillman’s procedures, the highestimpact is seen from utilizing a pre-notice letter. This procedure canincrease the response rate by 7.4%.
At a time when IB researchers are confronted with growingreluctance on the part of respondents (whether executives orconsumers) to participate in survey research, success of mailsurveys remains highly conditional upon following more method-ical and systematic procedures for data collection and theimplementation of proven strategies for stimulating responserates (e.g., Baruch & Holtom, 2008; Cycota & Harris, 2006; Eichner& Habermehl, 1981). Undertaking cross-culture comparativestudies is no small task. Yet, in order to increase response ratessignificantly, careful adherence to well-established best practice isprudent. Such a disciplined approach should yield more reliableand generalizable insights in multi-country studies.
Without establishing and using a rigorous data-collectionprocedure, the reliability and validity of findings will continue tobe questioned (Hult et al., 2008). While ensuring credibility in data-collection methods may seem straightforward, cross-culturaldifferences do hamper survey research results (Craig & Douglas,2000; Hult et al., 2008). However, these disparities could beovercome if, for example, researchers become more thorough inreporting and explaining how and why a particular data-collectionstrategy is used.
6. Managerial relevance
Findings of this study have important implications forinternational business practice. The results indicate that muchof the survey-based empirical research relies on insights obtainedfrom Europe, North America, and Asia. Therefore, the findings todate are more relevant to managers that are concerned with thesethree main geographic regions. On the other hand, the number ofcountries surveyed by international business researchers isincreasing, indicating that empirical findings from survey researchhave implications for an increasingly wider group of practitioners.
The trend in declining survey response rates is a major concern.Somehow, scholars fail to impress executives with the relevanceand credibility of their academic work. This suggests a potentialgap between what business executives think is important andwhat the academics are able to deliver. Scholars are advised toframe their research questions in more contemporary, relevant,and managerial-focused contexts if they are to receive a moreenthusiastic response from business executives.
7. Limitations and future research directions
Finally, the work presented here has several limitations that canbe addressed in future research. Although mail survey was thedominant method of data collection during the period consideredin our study, best-practice recommendations suggested here applyjust as well to online surveys. Future research should investigatehow different data-collection and survey techniques affectresponse rates in online surveys. Further, a series of factors, suchas survey length, research topic, sample and respondent char-acteristics, the language of the survey, as well as the use of multiplelanguages, can have an effect on response rates.
Acknowledgements
We would like to thank Nikolaos Papageorgiadis and UlfAndersson for their insightful and timely feedback on the very firstdraft of our paper. We received useful comments from a seminarpresentation at the Uppsala University in 2010 for which we are
or in mail-survey procedures in international business research.4.01.004
A. Chidlow et al. / Journal of World Business xxx (2014) xxx–xxx10
G Model
WORBUS-668; No. of Pages 10
very thankful. We would also like to acknowledge the Editor, Prof.Wayne Cascio as well as two anonymous reviewers for theirconstructive comments and suggestions on our manuscript.
References
Adler, N. J. (1983). Cross-cultural management research: The ostrich and the trend.Academy of Management Review, 2: 226–232.
Baruch, Y., & Holtom, B. C. (2008). Survey response rate levels and trends in organiza-tional research. Human Relation, 61(8): 1139–1160.
Berry, J. W. (1999). On cross-cultural comparability. International Journal of Psychology,4(2): 119–128.
Blau, P. M. (1964). Exchange and power in social life. New York: Wiley.Brennan, R. D. (1958). Trading stamps as an incentive in mail surveys. Journal of
Marketing, 22: 306–317.Brock, J.K.-W. (2003). The ‘power’ of international business research. Journal of Inter-
national Business Studies, 34(1): 90–99.Cascio, W. F. (2012). Methodological issues in international management research.
International Journal of Human Resource Management, 23(12): 2532–2545.Cascio, W. F., & Zedeck, S. (1983). Open a new window in rational research planning:
Adjust alpha to maximize statistical power. Personnel Psychology, 36: 517–526.Cascio, W., Valenzi, E., & Silbey, V. (1978). Validation and statistical power: Implica-
tions for applied research. Journal of Applied Psychology, 63(5): 589–595.Cavusgil, S. T., & Das, A. (1997). Methodological issues in empirical cross-cultural
research: A survey of the management literature and a framework. ManagementInternational Review, 37(1): 71–96.
Cohen, J. (1977). Statistical power analysis for the behavioural science (rev. ed.). NewYork: Academic Press.
Cohen, J., & Cohen, P. (1975). Applied multiple regression/correlation analysis for thebehavioural science. Hillsdale, NJ: Erlbaum.
Couper, M. P. (2011). The future of modes of data collection. Public Opinion Quarterly,75(5): 889–908.
Cowles, M., & Davis, C. (1982). On the origins of the .05 level of statistical significance.American Psychologist, 37(5): 553–558.
Cox, E. P. (1974). Research for business decisions: An interdisciplinary approach. Austin:Bureau of Business Research, The University of Texas.
Craig, S. C., & Douglas, S. P. (2000). International marketing research (2nd ed.). New York:Wiley & Sons.
Cycota, C. S., & Harris, D. A. (2006). What (not) to expect when surveying executives: Ameta-analysis of top managers response rates and techniques over time. Organi-zational Research Methods, 9(2): 133–160.
Czaja, R., & Blair, J. (2005). Designing surveys: A guide to decisions and procedures (2nded.). Thousand Oaks: Sage/Pine Forge Press.
De Leeuw, E. D. (2005). To mix or not to mix data collection modes in surveys. Journal ofOfficial Statistics, 21(2): 233–255.
De Leeuw, E. D., & Hox, J. J. (1988). The effects of response-stimulating factors onresponse rates and data quality in mail surveys: A test of Dillman’s total designmethod. Journal of Official Statistics, 4(3): 241–249.
Dillman, D. A., Smyth, J. D., & Christian, L. M. (2009). Internet, mail and mixed-modesurveys: The tailored design method (3rd ed.). New York: Wiley & Sons.
Dillman, D. A., Christenson, J. A., Carpenter, E. H., & Brooks, R. M. (1974). Increasing mailquestionnaire response: A four-state comparison. American Sociological Review, 39:744–756.
Dillman, D. A. (2000). Mail and internet surveys. The tailored design method (2nd ed.).New York: Wiley & Sons.
Dillman, D. A. (1999). Mail and other self-administered surveys in the 21st century: Thebeginning of a new era. Gallup Research Journal, Winter/Spring: 121–140.
Dillman, D. A. (1991). The design and administration of mail surveys. Annual Review ofSociology, 17: 225–249.
Dillman, D. A. (1978). Mail and telephone surveys: The total design method. New York:Wiley & Sons.
Dillman, D. A. (1972). Increasing mail questionnaire response for larger samples ofgeneral public. Public Opinion Quarterly, 35(3): 254–257.
DuBois, F. L., & Reeb, D. M. (2000). Ranking the international business journals. Journalof International Business Studies, 31(4): 689–704.
Eichner, K., & Habermehl, W. (1981). Predicting response rates in mail questionnaires.American Sociological Review, 46(3): 361–363.
Faul, F., Erdfelder, E., Buchner, A., & Lang, A.-G. (2009). Statistical power analyses usingG*Power 3.1: Tests for correlation and regression analyses. Behavior ResearchMethods, 41: 1149–1160.
Faul, F., Erdfelder, E., Lang, A.-G., & Buchner, A. (2007). G*Power 3: A flexible statisticalpower analysis program for the social, behavioural, and biomedical sciences.Behavior Research Methods, 39: 175–191.
Ghauri, P. N., & Grønhaug, K. (2010). Research methods in business studies: A practicalguide (3rd ed.). London: Financial Times Prentice Hall.
Gibbons, J. D., & Pratt, J. W. (1975). P-Values: Interpretation and methodology. Ameri-can Statistician, 29(1): 20–25.
Goyder, J. C. (1982). Further evidence on factors affecting response rates to mailedquestionnaires. American Sociological Review, 47: 550–553.
Greatz, B. (1985). The potential of mail surveys. Australian and New Zealand Journal ofSociology, 21: 445–455.
Greene, W. H. (2003). Econometric analysis. New Jersey: Pearson Education Inc.Groves, R. M., Fowler, F. J., Jr., Couper, M. P., Lepkowski, J. M., Singer, E., & Tourangeau, R.
(2004). Survey methodology. New York: John Wiley.Groves, R. M. (2004). Survey errors and survey costs. New Jersey: Wiley and Sons Inc.
Please cite this article in press as: Chidlow, A., et al. Establishing rigJournal of World Business (2014), http://dx.doi.org/10.1016/j.jwb.201
Groves, R. M. (1989). Research on survey data quality. Public Opinion Quarterly, 51: 156–172.
Harzing, A.-W. (2000). Cross-national industrial mail surveys: Why do response ratediffer between countries? Industrial Marketing Management, 29: 243–254.
Harzing, A.-W. (1997). Response rates in international mail surveys: Results of a 22-country study. International Business Review, 6(6): 641–665.
Herbelein, T. A., & Baumgartner, R. (1978). Factors affecting response rates to mailedquestionnaires: A quantitative analysis of the published literature. AmericanSociological Review, 43: 447–462.
Herk, H., Poorting, Y. H., & Verhallen, T. M. M. (2005). Equivalence of survey data:Relevance for international marketing. European Journal of Marketing, 39(3/4):351–364.
Homans, G. C. (1973). Social behaviour. London: Routledge and Kegan.Hult, T. G. M., Ketchen, D. J., Jr., Griffith, D. A., Finnegan, C. A., Gonzales-Padron, T.,
Harmancioglu, N., Huang, Y., Talay, B. M., & Cavusgil, T. S. (2008). Data equivalencein cross-cultural international business research: Assessment and guidelines.Journal of International Business Studies, 39(6): 1027–1044.
Jobber, D., Mirza, H., & Wee, K. H. (1991). Incentives and response rates to cross-national business surveys: A logit model analysis. Journal of International BusinessStudies, 22(4): 711–721.
Jobber, D., & Saunders, J. (1988). An experimental investigation into cross-nationalbusiness survey response rate. Journal of International Business Studies, 19(3): 483–489.
Jussaume, R. A., Jr., & Yamada, Y. (1990). A comparison of the variability ofmail surveys in Japan and the United States. Public Opinion Quarterly, 54(2):219–228.
Kjeldgaard, D., Csaba, F., & Ger, G. (2006). Grasping the global: Multi-sited ethnographicmarket studies. In R. W. Belk (Ed.), Handbook of qualitative research methods inmarketing (pp. 521–534). Cheltenham: Edward Elgar Publishing.
Knight, G. A., Spreng, R. A., & Yaprak, A. (2003). Cross-national development andvalidation of an international business measurement scale: The COISCALE. Inter-national Business Review, 12(5): 581–599.
Krippendorf, K. (2004). Content analysis: An introduction to its methodology (2nd ed.).Thousand Oaks, CA: Sage Publications.
Ladd, E. C. (1980). Polling and the press: The clash of institutional imperatives. PublicOpinion Quarterly, 44: 574–584.
Linsky, A. S. (1975). Stimulating responses to mailed questionnaire: A review. PublicOpinion Quarterly, 39: 82–101.
Mayers, B. L., & Melcher, A. J. (1969). On the choice of risk levels in managerial decision-making. Managerial Science, 16(2): 31–39.
Mullen, M. R. (1995). Diagnosing measurement equivalence in cross-national research.Journal of International Business Studies, 26(3): 573–596.
Nasif, E. G., Al-Daeaj, H., Ebrahim, B., & Thibodeaux, M. S. (1991). Methodologyproblems in cross-cultural research: An updated review. Management InternationalReview, 31: 79–91.
Nederhof, A. J. (1983). The effects of material incentives in mail surveys: Two studies.Public Opinion Quarterly, 47/1: 102–111.
Peng, T. K., Peterson, M. F., & Shyi, Y.-P. (1991). Quantitative methods in cross-nationalmanagement research: Trends and equivalence issues. Journal of OrganizationalBehaviour, 12(2): 87–107.
Piekkari, R., Welch, C., & Paavilainen, E. (2009). The case study as disciplinary conven-tion: Evidence from international business journals. Organisational Research Meth-ods, 12(3): 567–589.
Platt, J. (1996). A history of sociological research methods in America 1920–1960. Cam-bridge, UK: Cambridge University Press.
Przeworski, A., & Teune, H. (1966). Equivalence in cross-national research. PublicOpinion Quarterly, 30: 249–274.
Rada, V. D. (2000). Mail surveys using Dillman’s TDM in a Southern European country:Spain. International Journal of Public Opinion Research, 13(2): 159–172.
Raju, N. S., Bilgic, R., Edwards, J. E., & Fleer, P. F. (1997). Methodology review: Estimationof population validity and cross-validity, and the use of equal weights in predic-tion. Applied Psychological Measurement, 21: 291–305.
Reynolds, N. L., Simintiras, A. C., & Diamantopoulos, A. (2003). Theoretical justificationsof sampling choices in international marketing research: Key issues and guidelinesfor research. Journal of International Business Studies, 34(1): 80–89.
Scott, C. (1961). Research on mail surveys. Journal of the Royal Statistical Society, 124:143–205.
Sekaran, U. (1983). Methodological and theoretical issues and advancements in cross-national research. Journal of International Business Studies, 2: 61–74.
Singh, J. (1995). Measurement issues in cross-national research. Journal of InternationalBusiness Studies, 14(2): 61–73.
Skipper, J. K., Jr., Guenther, A. L., & Nass, G. (1967). The sacredness of .05: A noteconcerning the uses of statistical levels of significance in social science. AmericanSociologist, 3(2): 16–18.
Stanford, L. (1968). Criteria for selecting a significance level: A note on the sacrednessof .05. American Sociologist, 3(3): 220–222.
Watson, J. J. (1965). Improving the response rate in mail research. Journal of AdvertisingResearch, 5: 48–50.
Weber, R. P. (1990). Basic content analysis (2nd ed.). Newbury Park, CA: Sage.Weisberg, H. F. (2005). The total survey error approach: A guide to the new science of
survey research. Chicago: The University of Chicago Press.Yang, Z., Wang, X., & Su, C. (2006). A review of research methodologies in international
business. International Business Studies, 15(6): 601–617.Yaprak, A. (2006). Measurement problems in cross-national consumer research: The
state-of-the-art and future research directions. In S. C. Jain (Ed.), Handbook ofresearch in international marketing (pp. 174–190). Cheltenham: Edward Elgar.
or in mail-survey procedures in international business research.4.01.004