establishing care systems for an age-friendly community
TRANSCRIPT

Establishing Care Systems for
an Age-Friendly Community
City of Long Beach GAP Analysis
Karen Doolittle, FUSE Executive Fellow
May 1, 2018

Supported by a grant from SCAN Health Plan, based in Long Beach, California.
SCAN is an nonprofit public benefit corporation dedicated to finding innovative ways to enhance seniors’ ability to manage their health and to continue to control where and how they live.
2
Acknowledgement

Table of Contents
Context & Scope
Executive Summary
Aging Population Demographics
SWOT Analysis Summary
SWOT Analysis per Major Category
Trends
Hassle Maps
Unique Challenges - LGBTQ & Cambodian
Digital Divide Barriers
Inputs to Resources Mapping
Senior Services Heat Map
Appendix - Analysis of Service Providers
HousingTransportationHealthSafetyQuality of Life
1. Senior Links 2. Parks Recreation & Marine (PRM)3. Senior Center Information &
Assistance4. Multi-Service Center (MSC)5. Long Beach Police Department6. Jewish Family & Children’s Services
(JFCS)7. SCAN Health Plan8. Los Angeles County Area Agency on
Aging (AAA)
3
4
5
6
7
8-12
13
14-19
20-21
22
23
24
25-55
Topic Page(s)

Context & Scope
With an estimated 470,000 residents, Long Beach is the second largest city in Los Angeles County and the seventh largest city in California. One quarter of its current population is over 50 years old and 9% is over 65 years old, which forecasts a dramatic increase in the need for senior services in the areas of housing, transportation, safety, health, and quality of life. Providing quality support to the growing population of seniors is further complicated by the demographic changes underway. Long Beach’s residents are expected to become not only more ethnically diverse, but also older and financially insecure. By 2025, more than 22% of Long Beach’s senior residents will be living below the poverty line.
Long Beach has identified major gaps and lack of coordination in the services it currently offers its older adult residents.
The City of Long Beach is partnering with FUSE Corps to host an executive-level Fellow
for one year to design a coordinated and data-driven system for delivering and
financing services to seniors. The fellow will also develop a system for
measuring and communicating the economic and social value of services provided to
seniors to help the city leverage potential public funding and private-sector
partnerships. These efforts will help Long Beach realize its overarching goal: to improve
the quality of life for the city’s older adult residents by linking them to a coordinated
health and social service continuum of care.
4

The City of Long Beach, and its supporters, are actively pursuing ways to innovate and collaborate on ideas and approaches to close their greatest gaps in systems for the Aging Population, namely Housing and Transportation. Local organizations are securing grants and working together to create housing communities offering a safe place for one-stop access to meet needs around basic care, health, and quality of life. These early models can serve as pilots to replicate and scale services. This wraparound model typically applied to youth, can help assist caregivers and family members with an extra layer of support to navigate a continuum of care for their clients and loved ones, which relates to the third greatest need, in-home care.
Next to housing and transportation, the greatest need lies in affordable in-home care. Significant gaps exist due to the rise in demand for caregivers from increases in Alzheimer’s, dementia, or milder cognitive impairment, other disabilities, and complexities associated with multiple chronic diseases (diabetes, cardiovascular, etc.). Demographic shifts and other trends that limit the availability of potential caregivers, including lack of affordable care (especially a growing need for the middle class), an increased share of employed women, and caregiving expectations weakened by divorce and alternative lifestyles. Long Beach’s LGBTQ and Cambodian populations face a unique set of challenges that makes finding appropriate, affordable, safe and trustworthy caregivers yet more challenging.
Gerontological training and education on the needs of seniors, along with cultural and sensitivity training on equity and aging is needed across the community. A shared online referral system will assist with coordination, collaboration, tracking and reporting on systems of care, thus providing valuable feedback for decision making, and improved sustainability and impact. It is important to note that the online referral system will only be effective if the proper operating model and processes are thoughtfully established and continually enhanced. Innovative solutions and policies that improve housing, transportation, and long-term health and care services and supports, and reduce unmet needs, could benefit both older adults, their families and caregivers, for an age-friendly Long Beach.
Executive Summary
Long Beach has committed to serve and support the
older adult population as an age-friendly community!Mapping the Older Adults’ Journey
Evaluating the problems and multiple gaps seniors face when seeking services is a starting point for journey mapping the experience from the senior’s point-of-view. How can the city leverage inputs from the Senior Commissioners and activist groups like the Gray Panthers to help define the desired journey for older adults?
Inclusion of Vulnerable CommunitiesLong Beach protects its Veterans through priority treatment at the Multi-Service Center and Housing Authority, and focus through the newly established Veterans Affairs Commission. What can the city do to promote and enhance acceptance of its vulnerable seniors from the LGBTQ and Cambodian communities?
Just-in-Time SystemsThe Multi-Services Center (MSC) is a one-of-a-kind first point-of-contact for homelessness services. How can the MSC and the community best address the increase in homelessness and financial abuse among older adults?
Seniors VolunteerismSenior Police Partners and the 4th Street Senior Center are two examples of the less recognized plethora of volunteer opportunities within the city. What opportunities exist to create structures (without over formalizing) to help seniors help themselves, create purpose and prevent isolation?
Scalability of Co-Located ServicesAmerican Gold Star Manor, Villages at Cabrillo, and LINC Housing are co-locating services to create villages of care. How can these concepts be scaled while considering the benefits of inclusion, diversity, and intergenerational opportunities?
Coordination of Like ServicesHow can service agencies better coordinate and collaborate to improve health and wellness for seniors?
2017 Key City of Long Beach Accomplishments for Seniors• Provided 512,000 senior participant days in Parks, Recreation and Marine
Department programs• Capital improvements at the 4th Street Senior Center• Completed four housing projects, creating 355 affordable units for seniors:
Immanuel Place (3215 E. 3rd St.); Anchor Place/Villages at Cabrillo (2001 River Ave.); Long Beach Professional Building (117 E. 8th St.); and The Beacon (1201- 1235 Long Beach Blvd.)
Integration of City Social Services How can the Police, Fire, Department of Health & Human Services (DHHS), and other agencies better share information to improve client outcomes and prevent unnecessary spending?
Reviewing the SystemsAcknowledging People
Addressing the Gaps
Adoption of an Age-Friendly MindsetHow can the greater community members elevate themselves above structural and political barriers to innovate on solutions for an age-friendly city?
5

Long Beach Aging Population Demographics
Zip Code 55-64 65-74 75-84 85+ TOTAL Per 10,000
90805 9,616 5,434 2,187 750 17,987 1.80
90808 5,997 3,703 1,795 1,004 12,499 1.25
90803 5,464 4,155 1,755 731 12,105 1.21
90815 5,373 3,541 1,894 1,204 12,012 1.20
90807 4,615 2,981 1,320 888 9,804 0.98
90813 5,255 2,782 1,165 378 9,580 0.96
90802 4,817 2,975 1,212 489 9,493 0.95
90806 4,587 2,715 1,186 438 8,926 0.89
90810 4,088 2,622 1,357 522 8,589 0.86
90804 4,002 2,171 801 438 7,412 0.74
90814 2,465 1,556 627 276 4,924 0.49
Total 56,279 34,635 15,299 7,118 113,331
Age Range (Yrs)
Numbers of Seniors by Zip Code
People 65+ Living Below Poverty Level People 65+ Living Alone
Comparison of Percentage of Aging Population
6Source: http://www.livewelllongbeach.org

SWOT Analysis Summary of Findings
Collaboration & Technology
Strengths➢ A Caring Community • Stakeholders and advocates engage with the community to
address and support senior issues • Department of Health and Human Services (DHHS), Parks
recreation & Marine (PRM), and affinity groups offer dozens of enriching programs, providing high levels of individual hands-on attention to seniors
• DHHS staff help seniors prepare for doctor visits, reviewing what to ask the doctor, writing down instructions, and showing seniors how to use their smart phone
➢ Focus on Innovative Solutions• Existing City interdepartmental efforts work to improve
livability and mobility for the community• Agencies and affiliates are entrepreneurial and innovative,
and collaborate to improve policies and processes
Weaknesses➢ Disjointed & Fragmented Services• Silos of duplicate activities exist, versus a cohesive
supportive fabric to navigate program offerings• Staffing constraints facing many providers result in not
enough home visits and assessments; home visits allow for a comprehensive assessment of the senior
• Necessity for greater in-home outreach to address issues with self-care, alienation and isolation
➢ Lack of Senior Focus Lens• Vulnerability of seniors requires greater attention to what
and how services are offered• Lack of cultural awareness and understanding of the
needs of aging population, and special groups such as Veteran, Cambodian, Black, Hispanic, and LGBTQ seniors
Opportunities➢ Cultural Awareness & Sensitivity• Existing City plans can be revisited to specifically highlight
needs of older adults to be addressed in policies
➢ Coordination & Collaboration of Care• Connecting seniors with services through a technology and
people solution to close the information services gap
• Community coordination and collaboration through a
Warm Hand-off/Closed-Loop referral by city departments,
healthcare, and senior services organizations
• Need to frame a model for operating and funding services
that can be shared across systems
Threats➢ Lack of Housing & Transportation• Housing & Transportation are the foundation to support
needs around health, safety and quality of life; these are not just senior related issues
• Ignoring the utility of seniors helping seniors could prevent potential progress in housing and transportation
➢ Disparate Funding• Inadequate City funding for Senior Programs. City
programs and non-profit providers operate heavily on fundraising and grants, which is not sustainable
• Funding that is often framed in cost-avoidance, ignores the cost-benefit of a thriving senior population
Future State Solution for Long Beach Aging Services
Current State Situation Facing Seniors in Long Beach
• On January 23, 2018, the City Long Beach was
accepted into the AARP & WHO Network of Age-
Friendly Communities
• Establish office focusing on older adults as a
neutral convener of services and provide an
Institutional Standard of Practice for Continuity
• Foster systems-change and collaboration through
an Age Friendly Consortium (22+ organizations)
• Collaborate across City Departments and County
Agencies on services and fundraising
• Involve line staff to help implement a stronger
integration of services with both a technology and
people solution
7

HousingStrengths Weaknesses
Opportunities Threats
Lack of Affordable Housing• Seniors are being displaced by high rents and many move away, or become homeless.
Currently there is not enough affordable Senior Housing. Point in time count rendered 3 available spots in 40+ housing centers. Market rate is ~$2000 for a 1 bedroom, or ~$1000-$1700 for a studio.
• In May 2016, Section 8 waiting list opened for the first time in years, with 17,000
individuals on the waiting list
• Section 8 does not cover utilities, one can be housed and still not afford utilities
• More vouchers than units: Of 7,398 vouchers, 87% are in leases, 480 people have
unused vouchers, because they cannot find housing that accepts Section 8
• Long Beach housing assistance is 100% Federally funded, with no city support
• 648 persons experiencing homelessness over the age of 50 accessed the MSC in 2017
Lack of Senior-appropriate Housing• Shelters not appropriate for seniors – lack easier-to-grab door handles, grab bars• Covenants expired: multi-year senior housing contracts up for renewalSeniors Face additional Barriers when Seeking Housing• Seniors may lack transportation to search and interview for housing• Hoarding is an Obsessive Compulsive Disorder that is more prevalent at age 50+
(can be related to anxiety & depression). Hoarding escalates the more isolated a senior becomes---Stage 4 hoarding is up to the ceiling. Section 8 vouchers require a fire safety inspection and hoarding can lead to eviction.
• Substance use disorder makes it difficult to find and keep housing• LGBTQ seniors may face additional challenges: not feeling safe expressing their
sexual preference in a senior housing living environment, or living with HIV/AIDS
Modular Housing: Faster than constructionSeniors could co-locate to provide support to one-another• Can convert living room to an additional bedroom• Roommate locator service for seniors• Both address isolation factorGroup homes for Seniors – Ranch Style group home and meal sharingIntergenerational housing – Long Beach City College property includesgrandparents aged 55-75 yrs. caring for their grandchildren
American Goldstar Manor
• Four organizations each donated $50K to improve the Quality of Life at
Gold Star Manor (American Goldstar Manor, CSULB, Archstone and
SCAN) for developing new assisted living facilities, a possible memory
care center and a medical clinic
Villages at Cabrillo• Co-location of 20+ organization provides support ranging from shelter
and treatment, to transitional and permanent housingLINC Housing• Develop and construct new affordable housing for seniors and others• Retrofits existing affordable housing to create energy savings• Protects affordable housing supply through purchase of existing rentals
8

Transportation Strengths Weaknesses
Opportunities Threats
Transportation Challenges
Positive reviews of transportation options are riddled with caveats
• Must articulate needs properly
• Can be unreliable: Dial-a-Lift & Yellow-Cab: “Good to pick you up, but bad at returning you.”
• Adult Day Care Providers: Sometimes vehicle still needs fixed
• Need to book well in advance: Access works well, but requires 24hr. notice for reservation
• At mercy of public transportation: Bus system is good, but vulnerable to delays
o Routes are only on major thoroughfares, otherwise required to walk
o Timing can be tricky: Frequency changes at different times of the day and on weekends
• Based on medical needs: Free Shuttles may be limited to doctor’s appointments
• Ride Share scheduling can be difficult: “I don’t want to spend 5 hours in transportation, for a 1
hour appointment.”
Long Beach Transit both faces and contributes to barriers for transportation
1. Seniors are not aware of their eligibility for discounted bus fairs
2. Seniors expressed level of fear and reluctance to ride the bus
3. LB Transit federal funding is based on paid ridership, which acts as a disincentive to
provide completely free rides
First mile/last mile is the greatest challenge: People will walk a ¼ mile to get to a bus stop
• Other agencies are partnering with Uber or Lyft just to get to a bus stop
• Some vouchers are provided for short term rides to get to a transit center
Transportation Considerations for Seniors: • Curb-to-Curb – issues with walkers and canes• Elbow-to-Elbow – need assistance beyond door-to-door and with Wheelchairs • Crosswalk timers not long enough; if disabled “crossing PCH is dangerous”• Resources and services exist in the city, but transportation remains a barrier• “We could potentially have 20-30 more participants at the Senior Center per
day if seniors had transportation”
Pilot senior transportation projects in other cities:• Sacramento MicroTransit: For no extra fees, a shuttle will pick up and drop off
passengers across the city to fill gaps in bus routes• Laguna Beach contracts with Uber for subsidized transportation for seniors
LB Transit launched Connected Seniors Club in October 2017
• Groups of seniors will form their own club
• Ambussador will lead them on a fun excursion trip
• LB Transit provides Train-the-Trainer for the Ambussador
• Ambussador gets 30 days free if they plan and lead 2 trips a month.
FAME (First African Methodist Episcopal) provides monthly Taxi coupons and
Bus tokens for those with proof of income <$1500/month
City of Long Beach hosts annual place-based Livability Summit
• City is looking at ways to make Long Beach more transportation friendly
• Walkability and bikeability questionnaires evaluate transportation options
DHHS Nurses work hard to navigate the transportation systems to ensure their
disabled and vulnerable clients can make multiple appointment in one day
Long Beach needs to stay ahead to prevent gaps in transportation
• Molina shuttle ended its transportation services in the Houghton neighborhood
9

HealthStrengths Weaknesses
Opportunities Threats
Caregiving is becoming increasingly challenging, and particularly for the Middle Class
Chronic Illnesses & Complexities Impacting Seniors
• Nationally 77% of older adults live with at least 2 chronic conditions, such as: Diabetes,
Thyroid Conditions, Heart Disease, and Mental Illness *
• Nationally 23.5% of persons over age 65 are obese *
• Senior may be on 15-25 medications, breathing machine, electric wheelchair, plus special bed
• Falls and hip issues, addictions to pain medications, and bed bugs exacerbate conditions
Senior Mental Health Issues
• Dementia & Alzheimer’s – Late to diagnose and difficult to treat
• Many Long Beach CBOs interviewed noted that hoarding is pervasive, and they see many
clients with schizophrenia and bi-polar disorder
• Experiencing homelessness and substance use disorder
“Take away my pensions so I can be eligible”— One client who is
receiving a Pension and Social Security totaling $1800/month. For Cal
Fresh and Medi-Cal, the income cap is $1200 or $1600 for a couple
Challenges with Qualifying for Support Programs
• Must demonstrate need to qualify, need to re-apply every year, may need assistance to
complete forms, requires continuous follow-up
Greatest Need is for Affordable Non-Clinical In-Home Care
• If Medi-Cal can get IHSS homeworker; otherwise cost is $25/hour to hire a caregiver. If
just over Medi-Cal income threshold, but not wealthy, cannot afford it.
• Medicare does not pay for assisted living, only for skilled nursing. This leaves a large need
for seniors who do not have severe medical issues, but need someone to assist them in
Activities of Daily Living (ADL), such as bathing, laundry, counting pills.
• Agencies receive lots of calls from adult children living out of state who need help for
their parents, requesting an assessment to see if their parent can live by themselves.
Agencies can only do so many free assessments.
Two elderly seniors were living together malnourished and each
accidentally took the other’s meds and forgot to get more
Health Insurance Coverage among Older Adults
• 99.6% of persons over age 65 are insured, compared to only 88.3% of adults
aged 64 and under *
Hoarding Task Force
• Long Beach hosts a monthly Hoarding Task Force to share the latest
information and leading practices, and offer collaborative support on
challenging, multi-faceted mental health cases
In-home Assessments
• Many non-profit organizations, such as Heart of Ida, SCAN, Meals-On-Wheels
and Pathways, provide in-home assessments to address risks to health, falls,
food security, social-emotional, and abuse.
Elders need patient advocates & outreach to follow-up after medical appointments
• Quick discharge via taxi, then what do next?
• Medication distribution - Did not get medication because there was no one to assist
Seniors need Wellness Checks via Home Visits
• Home environment can be more revealing than a physician visit: can see how the
senior moves in the home, observe medication usage, assess food security, identify
social isolation and hoarding, to determine level of support required.
• Similar to Life Alerts and Panic Buttons, use telehealth or telephones to check-up on
seniors to avert a crisis.
Improved Coordination will use resources more effectively
• Opportunities exist for referrals from state of crisis to treatment and prevention:
- Fire Department could refer assist-up/falls calls to on-going case management
- Hospital ERs could refer non-emergency cases to primary care or case management
- Expand training opportunities for students to gain experience with senior clients
10Sources: 2015 Los Angeles County Health Survey; National Council on Aging www.ncoa.org/news/resources-for-reporters/get-the-facts/healthy-aging-facts/; State of Obesity, a project of the Trust for America’s Health & Robert Wood Johnson Foundation. https://stateofobesity.org/obesity-by-age/

Strengths Weaknesses
Opportunities Threats
Seniors are vulnerable in active daily living to:
• Scams
• Fraud
• Physical abuse
• Neglect
Many opportunities exist to teach the Older Adults about Safety:
• How to access services
• How to speak up for themselves
• Self Determination as long as not impacting the welfare of others
• To call APS to investigate senior abuse for themselves or for others
• How to double check references to be wise to financial scams
Holistic Elder Abuse Response Team (HEART)HEART is a Program of WISE & Healthy Aging that is operating on a grant to provide elder abuse case management to LA County, including Long Beach: Long Term Care Ombudsman, Licensed Clinical Social Worker, Core Support Group (therapy), and coordination with Adult Protective Services (APS)Long Beach Elder Abuse Prevention TeamGroup of abuse and neglect focused professionals and volunteers who meet quarterly to stay abreast of financial scams, case conference, and inter-refer
“In one case, the daughter was addicted to drugs and was stealing money from her elder mother and physically abusing her when she could not get enough money.”
Adult Protective Services (APS) Department of Children & Family Services (DCFS)
40,000 cases for 200 social workers* 50,000 cases. for 5,000 social workers
Ratio: 200 to 1 Ratio: 10 to 1
Significant Gaps Exist across LA County for Elder Abuse Social Workers *
People do not want to talk about Elder Abuse
• Financial abuse is highest among seniors, scams change constantly so people can’t keep up
• Need Older Adult Shelters for those evicted or fleeing Domestic Violence
• Need public guardians office and more staffing to step in and remove someone when they
cannot defend themselves. Support groups, case management, and therapy are needed
• Care taker may be neglecting them or taking advantage
• Senior may not understand how to keep themselves out of the hospital
• Those aged 80+ are from a generation that still sweeps things under the rug, and not report
• Senior Centers not funded to purvey case management
Safe Community Spaces
• Growing homelessness in parks and public spaces, deters frail elders from attending because
they fear for their safety
“We owe Seniors safe housing, safe neighbors, and places to go and be themselves.”
“Parks are safer when seniors are out walking and there is activity going on”
Parks are a Catch-22 when it comes to safety • Seniors need a safe way to walk and navigate the park; while at the same
time, having seniors out walking acts as a watch-dog to help reduce crime• Ramona Park is improving its “Livability” through fixes to sidewalks and
lighting to improve its safety. Next lies opportunities to offer programming and draw attendance from three surrounding senior housing facilities.
Long Beach Police Department Retired & Senior Volunteer Program served roughly 85-100 seniors in 2017 across all zip codes while engaging persons 55+ in enriching community service. • 38% of visits resulted in referrals to APS• Majority (65%) served were ages 65-79, 29% were 80+; 6% were 50-64• 10% served were Veterans
Safety
Source: California Department of Social Services http://www.cdss.ca.gov/inforesources/Research-and-Data/Disability-Adult-Programs-Data-Tables/SOC-242
*Same ratio at the state level for 2016/17, APS closed 159,782 investigations (based on numbers to be reported to the National Adult Maltreatment Reporting System). Therefore, APS workers handled, on average, 200 investigations per year l
11

Quality of LifeStrengths Weaknesses
Opportunities ThreatsAttacking the Digital Divide – Even though the digital divide remains prevalent, on demand
access is becoming increasingly important for seniors
• Considering technology access vs. Knowledge of how to use technology
• The “senior” population encompasses many generations that have varying degrees of tech
savviness
• Technology can become overwhelming for some seniors; however, it can be leveraged to
help seniors to live more independently and age in place
Expo Center offers well received programming, but its existence is threatened and needs
financial support to provide structure for volunteers and to expand programs
• Currently have word-of-mouth marketing and weekly email to 409 seniors from a socio-
economic diverse group from Del Amo Gardens to Carmelitos
Sharing Economy “Time Banking” Time is exchanged hour for hour to leverage the richness of one another’s talents and assets. Services may include driving, banking and taxes, or even making tamales. We need to encourage the use among seniors.
Restaurants can serve as gathering place where seniors own the dining room during the day, and the facility serves as a restaurant at night
Opportunity exists to make Senior Centers more physically appealingPRM Senior Centers offer quality programming and information, but how can
leading practices be shared and replicated across organizations?
• How should programs be better structured?
• El Dorado leads popular Tech Talk sessions with groups of 15 seniors that lead to
spin-off topics in smaller breakouts session
• Services are currently facility centric with ethnic clusters
• Should programs be offered across all sites and on the weekends?
LGBTQ and United Cambodian Centers (UCC) focus to improve the quality of life
of the population they serve and continuously evolve to address the most
pressing issues and strive to promote community awareness of vulnerabilities
PRM Programming and Intergenerational Events – Long Beach PRM offers social and wellness programs for seniors. Senior Center hosted a Thanksgiving Lunch with 200+ attendees where teens spoke with seniors to understand how they grew up, played games, mingled, and entertained, while seniors served as role models.
CSULB implements programs for peer to peer support and for pairing younger
generations with seniors
Successful Aging Expo: In October 2017, seniors were offered a resource fair to
explore available options to support and enrich their quality of life“People are working until their last breath!”
“Long Beach has a Village of Health philosophy in that health encompassing Physically, Spiritually, Mentally and Emotionally equals true health.”
Lack of funding and delayed focus on issues for seniors prevents continuity and depth of
services to address the needs of the aging population
Complexity and interdependency of housing, transportation, health and safety issues
creates barriers to gain traction on holistic solutions
Senior Economic Drivers are currently Cost Avoidance
• Economic benefit of seniors can no longer be ignored
• There is an economic benefit from seniors continuing to work from age 50-75
• Seniors who want to work is around 30%, and reality is that about 70% of seniors work
because they have to!
12

Trends
In many parts of the country, seniors are “aging in place” because disproportionate shares of young people have moved elsewhere. Older adults can remain safely in their own homes and communities, regardless of mobility, ability, age, or income through updates to existing homes to meet age-friendly universal design standards, and using smart technologies to assist with personal care. For example, Oregon's Rogue Valley in collaboration with AARP Oregon, developed a Lifelong Housing Certification program that provides an age-friendly livability checklist to assist buyers and renters and boosts benefits for property owners.
The number of Americans living with Alzheimer’s disease could nearly triple by 2050 to 14 million, from 5 million in 2013, increasing the demand for elder care. The Alzheimer’s Association says, “Someone in the United States develops Alzheimer's dementia every 66 seconds.” An estimated 5.5 million Americans are living with Alzheimer’s disease, and one in 10 people age 65 and older (10 percent) has Alzheimer's dementia. (AARP Nov 2017)
The number of people in need of in-home care in the United States is expected to reach 117 million by 2020, according to AARP. While families provide the vast majority of the informal care received by older adults, geographic mobility often demands caregiving at a distance. As the disproportionately large baby boom generation ages, the gap between elder care needs and available caregivers will widen dramatically. In 2010, there were seven potential caregivers ages 45 to 64 (the age group of the average family caregiver) for every person age 80 and older (the age group most likely to have a disability) (Redfoot, Feinberg, and Houser 2013). That ratio is projected to drop to 4 to 1 by 2030 and bottom out at 3 to 1 in 2050 when the entire baby boom generation passes the age 80 milestone.
Intergenerational equity is the concept or idea of fairness or justice in relationships between children, youth, adults and seniors, particularly in relation to treatment and interactions. Intergenerational conflict describes a more abstract conflict based on prejudices, and also cultural, social, or economic discrepancies between generations, which may be caused by shifts in values or conflicts of interest between younger and older generations. Intergenerational housing in cities allows for children to stay close to their aging relatives and to nourish relationships in real time. Many seniors are taking care of their grandchildren well into their 60’s, 70’s, and even 80’s, while their adult children are working. Senior centers are hosting inter-generational events to prevent older adult isolation, mentor today’s youth, and preserve cultural traditions.
Trends of the Aging
Population
In-Home Care Gaps
Alzheimer’s on the Rise
Intergenerational Equity
Digital Caregiving
Longevity Economy
Aging in Place
Caregiving is going digital with over half (53 percent) of projected market revenues expected to be from digital solutions in 2017-2021, up from just 28 percent in 2016. Just as consumers are increasingly able to manage life’s many details from a smartphone or tablet, so too will caregivers. Innovators are building intelligence into existing caregiving products such as voice-activated home assistants, virtual nurse avatars
for routine checkups, and even sophisticated robotic home companions. (AARP June 2017)
Source: The Population Reference Bureau report, “Aging in the United States”, (Jan 2016); AARP; Alzheimer’s Association, Population Reference Bureau
According to AARP’s 2016 Longevity Economy Report, the 50-plus age group generates $7.6 trillion in economic activity, including $5 trillion in consumer spending by people 50-plus combined with the further economic activity this spending generates (i.e. $1.8 trillion in federal, state and local taxes). Older adults are working longer because they are living longer and may benefit from additional income and activity. In 2014, 23 percent of men and about 15 percent of women ages 65 and older were in the labor force, and these levels are projected to rise further by 2022, to 27 percent for men and 20 percent for women. People over 50 are also critical in driving entrepreneurship and investment, and account for the majority of volunteering and philanthropic activities.
13

Hassle Maps
• A Hassle Map is a detailed study of problems, large and small, that people experience whenever they use their products or services. Hassle Maps are from Adrian Slywotsky’s book, “Demand”.
• A similar tool is the Customer Journey Map where you view the customer service process flow from the perspective of the client or customer, and includes the customer emotions experienced at each touchpoint.
• The Hassle Maps on the following slides illustrate the compounding effects of multiple gaps within the aging population. These gaps identify the opportunity where demand is hiding.
• The Hassle Maps synthesize interview findings and research. Each map reflects actual case situations supported by research articles.
• The maps serve as tools for analysis and planning of programs and services to support the aging population.
• The LGBTQ and Cambodian Snapshots describe in detail the barrier overlays to the existing hassles.
Source: http://changethis.com/manifesto/86.01.Demand/pdf/86.01.Demand.pdf14

Veteran at risk of homelessness
Source: UCLA, VA launch first-of-its-kind family wellness center, new legal clinic for veterans: Alison Hewitt | November 27, 2017http://newsroom.ucla.edu/releases/ucla-va-collaboration-fills-gaps-in-existing-services-for-vulnerable-veterans#.WiPb5Cue5cQ.email
For veterans at risk of homelessness, the tipping point can be as trivial as a jaywalking ticket.
The veteran may not be able to pay the fee for that ticket, and then could not get to court to explain the circumstances — perhaps because of a lack of access to transportation, an inability to miss a day of work, or crippling depression. Late-payment fines are tacked on to the original fine. A court warrant, a revoked driver’s license and a ruined credit history follow.
What might have seemed like a trivial citation has spiraled into a serious obstacle to being approved for housing, finding employment, driving to doctor’s appointments and reintegrating into civilian life.
Veteran receives a jaywalking ticket
Cannot afford to pay for ticket
Late-payment fines
Cannot get to court to explain circumstances (Lack of transportation,
cannot miss work, or crippling depression)
Escalating Hassle Map
Court warrant, revoked driver’s license, and ruined credit history
could lead to homelessness
15

Homeless senior with substance use disorder
Source: http://www.nationalhomeless.org/factsheets/addiction.pdf
Substance use disorder is much more common among persons experiencing homelessness than in the general population. Since substance use can be both a cause and a result of homelessness, both issues need to be addressed simultaneously.
Breaking an addiction is difficult for anyone, especially for someone experiencing homelessness. Motivation to stop using may be poor, because day-to-day survival takes priority. Many persons experiencing homelessness and substance use disorder have also become estranged from their families and friends and lack a social support network.
Sometimes people with untreated mental illnesses use illicit drugs as an inappropriate form of self-medication. Few programs for individuals experiencing homelessness also treat co-occurring issues of both mental illness and substance use disorder, and a person experiencing both could remain unsheltered.
Person experiencing homelessness and increased stress of living on the street
Turn to drugs and alcohol to cope with their situation or self-medicate for mental illness
Mental illness and homelessness leads to increased risk of
violence and victimization, and high utilization of health and
justice systems
Finding food and shelter takes priority over substance use disorder treatment, and
perhaps they refuse help
Escalating Hassle Map
Cannot find a shelter that treats both mental illness and substance use
disorder. Thus remains unsheltered.
16

LGBTQ senior seeking housing
Source: http://sageusa.org
Many LGBTQ older adults encounter long-term care settings that are not welcoming to their LGBTQ identities—and many report encountering hostility and discrimination. Moreover, the available research shows that few aging providers are trained in LGBTQ cultural competency, few conduct outreach to the LGBTQ community, and few are prepared to address acts of discrimination aimed at LGBTQ seniors by staff or other residents. This makes many LGBTQ older adults reluctant to access mainstream aging services, which can heighten their social isolation and negatively impact their physical and mental health.
LGBTQ seniors face difficulty finding an LGBTQ-identified or LGBTQ-competent caregiver who can understand their situation and provide in-home support. Transgender individuals feel even more isolated and rejected than their other LGBQ peers.
LGBTQ Senior does not feel welcome in a long-term care setting for fear of hostility and discrimination
Few aging providers are trained in LGBTQ cultural sensitivity awareness
LGBTQ older adult is reluctant to access mainstream aging services
Difficult to find an LGBTQ caregiver who can understand their situation and provide in-
home support
Escalating Hassle Map
Heightening social isolation and negatively impacting health
17
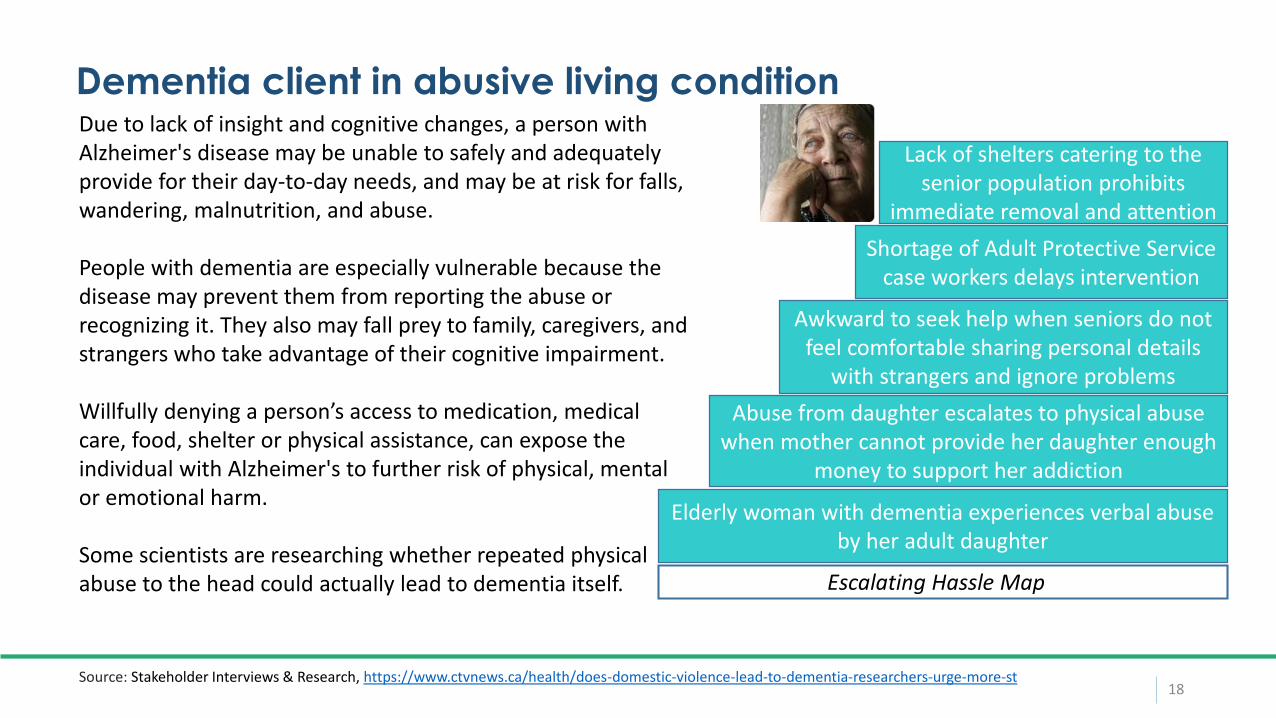
Dementia client in abusive living condition
Source: Stakeholder Interviews & Research, https://www.ctvnews.ca/health/does-domestic-violence-lead-to-dementia-researchers-urge-more-st
Elderly woman with dementia experiences verbal abuse by her adult daughter
Abuse from daughter escalates to physical abuse when mother cannot provide her daughter enough
money to support her addiction
Shortage of Adult Protective Service case workers delays intervention
Awkward to seek help when seniors do not feel comfortable sharing personal details
with strangers and ignore problems
Escalating Hassle Map
Lack of shelters catering to the senior population prohibits
immediate removal and attention
Due to lack of insight and cognitive changes, a person with Alzheimer's disease may be unable to safely and adequately provide for their day-to-day needs, and may be at risk for falls, wandering, malnutrition, and abuse.
People with dementia are especially vulnerable because the disease may prevent them from reporting the abuse or recognizing it. They also may fall prey to family, caregivers, and strangers who take advantage of their cognitive impairment.
Willfully denying a person’s access to medication, medical care, food, shelter or physical assistance, can expose the individual with Alzheimer's to further risk of physical, mental or emotional harm.
Some scientists are researching whether repeated physical abuse to the head could actually lead to dementia itself.
18

Middle-income couple experiencing food insecurity
Source: Stakeholder Interviews & Research, https://www.nationalgeographic.com/foodfeatures/hunger/
Lack of in-home care support can lead to medication mismanagement. It is important that seniors get the right medicine, at the right dose, at the right time. For seniors with multiple medicines, or with memory loss, this benefit alone can be a lifesaver. Even when taking the correct medications, drug interactions and side effects often mimic the symptoms of age-related cognitive disorders.
A growing group of middle-class and working-class individuals are food insecure, meaning they have difficulty feeding one or more of their household members at some point because of a lack of money. Do they use their income -- if they have one -- to pay their mortgage or feed themselves? Do they pay for a hospital visit or put dinner on the table?
When someone struggles to feed their family, they experience psychological and emotional consequences and often face stigmas. These struggles can exacerbate or lead to depression, which creates another barrier to receiving financial support and recovering from the situation.
A couple accidentally take one another’s medications and are unable to replace due to difficulty with memory
Unable to get replacement medication due to lacking transportation to physician and pharmacy
Combined Social Security & Pension income does not meet qualification
for food stamps
Cannot afford in-home care provider for help with everyday life skills
Escalating Hassle Map
Overwhelming shame for middle-income retirees now facing food insecurity for the
first time, prevents couple from seeking help
19

LGBTQ Community Snapshot
Source(s): Addressing Social, Economic, and Health Disparities of LGBT Older Adults & Best Practices in Data Collection, LGBT+ National Aging Research Center, www.age-pride.org. Promoting Health Equity Among LGBTQ Mid-Life and Older Adults. Generations PMC: 2015 May 14
• Lesbian and bisexual women: Higher rates of disability, cardiovascular disease, overweight, and poor general health
• Gay and bisexual men: Twice as likely to live alone; higher risk of cancer, and HIV
• Transgender older adults: Higher rates of discrimination, victimization, mental distress, poor health, and less support
• Bisexual older adults: Higher stigma, less likely to disclose sexual orientation, lower income, and have less support
• Older adults of color, and those with lower income and education: Elevated risk of health disparities and limited access to aging, health, and support services
Social Isolation in LGBTQ Older Adults
Current Challenges Potential Solutions
LGBTQ older adults are 20% less likely to have access to government services such as housing assistance, meal programs, and senior centers
The LGBTQ Center of Long Beach serves as a hub of support for the LGBTQ community and initiating collaborations with Long Beach government and social sector organizations.
Lifetime discrimination and victimization leads to weakened immune system and mental distress. Surviving these experiences has strengthened resilience in some LGBTQ seniors.
Cultural competency training through groups like SAGE is in its infancy to train service and care providers. GRIOT Circle is a pioneer as the country’s only service provider focused on LGBTQ seniors of color. LGBTQ-friendly older person services must be geographically and equitably accessible.
Elevated risk of poor general health and disability due to delayed and limited access to care, due to lower income, or not feeling comfortable disclosing their sexual orientation to their medical provider
Senior equity focused groups like DHHS Office of Equity, Gray Panthers, Senior Commission are taking the lead to ensureservices provided to the senior and LGBTQ community align with policies, research, community input, and best practices.
Elevated risk of isolation and lack of caregiving since less likely partnered or married, often live alone and have much fewer children than heterosexual seniors
Innovative approaches are being explored to reach hidden or potentially isolated seniors such as targeted community events and partnerships with Meals on Wheels and Hospice
40%Do not disclose their sexual
orientation to their healthcare provider
LGBTQ Seniors’ Health Statistics - Nationally (Source: SAGE)
42% Fear they will outlive their
retirement savings
34% Live Alone
Currently: An estimated 2.7 million adults ages 50 and older self-identify as lesbian, gay, bisexual, or transgender in the U.S. including 1.1 million age 65 and older.Estimates more than double based on same-sex behavior and romantic relationships.By 2060: The number of LGBTQ older adults will exceed 5 million
Key Disparities among LGBTQ Sub-groups
~3100 Same Sex
Couples in Long Beach
20

Cambodian Community Snapshot
Source(s): Interview with Susana Sngeim, Executive Director, United Cambodian Community (UCC)https://www.presstelegram.com/2018/01/25/federal-judge-again-stops-deportation-of-long-beach-man-other-cambodian-americans/
In the beginning: Khmer, Lao, and Chinese refugees from Cambodia began settling in Long Beach in 1975, and increased dramatically in the 1980's. In addition to the trauma of fleeing violence, refugees experienced cultural isolation in a foreign country. Social support institutions, such as United Cambodian Community (UCC) have been providing culturally-appropriate services for 40 years.
Today: The Cambodian community of Long Beach is multi-generational, with children born in the US, and multi-racial. Cambodian seniors still face cultural isolation, trauma, and language barriers.
Many older Cambodians prefer to reach out to historically Cambodian organizations, such as United Cambodian Community, Cambodian Association of America, and Khmer Parents Association, rather than the city, due to distrust of government.
50% Have 5+ chronic
health conditions
Long Beach Cambodian Seniors’ Health Statistics
51% Experience depression
62% Experience
PTSD
Current Challenges Potential Solutions
Half of Long Beach Cambodian seniors live with 5 or more chronic health conditions, including mental health and diabetes
Assist seniors with benefits enrollment through National Council on Aging (NCOA) to discover benefits like Medicare/Medicaid, CalFresh, etc. DHHS Partnering with PRM to co-locate trained enrollers.
Older adults need intensive case management and one-on-one support
Certified Nursing Assistants training: Support for caregivers through National Asian Pacific Center for Aging provides senior care training. McBride Park Senior Center serves Cambodian meals, Dream Beyond Foundation
Older adults silently internalize their experiences – headaches, stomach aches, nightmares, stigma for labeling as mental health
Address emotional needs through Buddhist Mind, Body & Spirit approach. Social networks are better than therapy.
Lack of affordable housing Seniors are beginning to co-rent studio apartments (for example, $500/month for rent, with only $200 left for living)
Fear of deportation Utilize trusted Cambodian serving organizations to provide services andreassure seniors they can access services without fear of deportation.
Transportation is a barrier for many Helping clients apply for Access for free transportation
Many are unfamiliar with technology and smart devices Adapting to use of Facebook and YouTube; training on filtering SPAM mail
74% of Cambodian Seniors are Monolingual Offer translation in Khmer and Lao
21

Long Beach’s Digital Divide
Source: Long Beach Business Journal – Oct 26 - Nov 6, 2017
Even if no longer working, online access for seniors is becoming increasingly important since information for banking, social security and medicine is more often being dispensed online
“24% of people 65+ do not subscribe to broadband, and 17% don’t even own a computer of any kind.”
Barriers to access can include cost, lack of skills, lack of trust
“Close to half of households subsisting on $10,000 or less per year – 42.9% – don’t have Internet access of any kind at home.”
Lack of online access compounds existing inequalities in income, education level, and race
“While just 7% of whites living in Long Beach lack an Internet connection, the percentage rises to 12.4% for Asian-American residents, 16.9% for Latinos and 19.2% for Blacks.”
Even though the digital divide remains prevalent, access is becoming increasingly important for seniors
22
Source(s): Compilation of services from One Degree and Aunt Bertha data extracts, AgeWell Magazine, discoveries from interviews, and The LGBTQ Center of Long Beach, DHHS Mental Health, and SAFE Long Beach Resource Guides
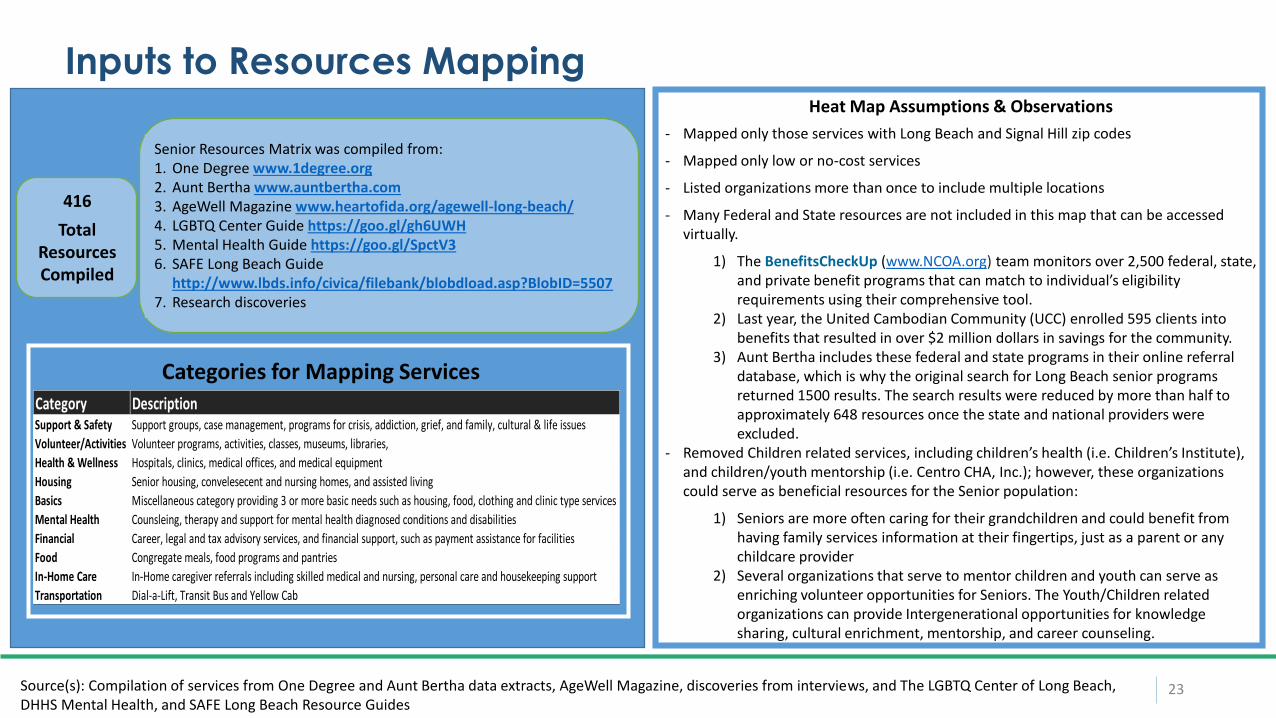
Inputs to Resources MappingHeat Map Assumptions & Observations
- Mapped only those services with Long Beach and Signal Hill zip codes
- Mapped only low or no-cost services
- Listed organizations more than once to include multiple locations
- Many Federal and State resources are not included in this map that can be accessed virtually.
1) The BenefitsCheckUp (www.NCOA.org) team monitors over 2,500 federal, state, and private benefit programs that can match to individual’s eligibility requirements using their comprehensive tool.
2) Last year, the United Cambodian Community (UCC) enrolled 595 clients into benefits that resulted in over $2 million dollars in savings for the community.
3) Aunt Bertha includes these federal and state programs in their online referral database, which is why the original search for Long Beach senior programs returned 1500 results. The search results were reduced by more than half to approximately 648 resources once the state and national providers were excluded.
- Removed Children related services, including children’s health (i.e. Children’s Institute), and children/youth mentorship (i.e. Centro CHA, Inc.); however, these organizations could serve as beneficial resources for the Senior population:
1) Seniors are more often caring for their grandchildren and could benefit from having family services information at their fingertips, just as a parent or any childcare provider
2) Several organizations that serve to mentor children and youth can serve as enriching volunteer opportunities for Seniors. The Youth/Children related organizations can provide Intergenerational opportunities for knowledge sharing, cultural enrichment, mentorship, and career counseling.
23
Senior Resources Matrix was compiled from:1. One Degree www.1degree.org2. Aunt Bertha www.auntbertha.com3. AgeWell Magazine www.heartofida.org/agewell-long-beach/4. LGBTQ Center Guide https://goo.gl/gh6UWH5. Mental Health Guide https://goo.gl/SpctV36. SAFE Long Beach Guide
http://www.lbds.info/civica/filebank/blobdload.asp?BlobID=55077. Research discoveries
416
Total Resources Compiled
Categories for Mapping Services
Category DescriptionSupport & Safety Support groups, case management, programs for crisis, addiction, grief, and family, cultural & life issues
Volunteer/Activities Volunteer programs, activities, classes, museums, libraries,
Health & Wellness Hospitals, clinics, medical offices, and medical equipment
Housing Senior housing, convelesecent and nursing homes, and assisted living
Basics Miscellaneous category providing 3 or more basic needs such as housing, food, clothing and clinic type services
Mental Health Counsleing, therapy and support for mental health diagnosed conditions and disabilities
Financial Career, legal and tax advisory services, and financial support, such as payment assistance for facilities
Food Congregate meals, food programs and pantries
In-Home Care In-Home caregiver referrals including skilled medical and nursing, personal care and housekeeping support
Transportation Dial-a-Lift, Transit Bus and Yellow Cab

Source(s): Senior Services Matrix data plotted using GPS tool by Emily Holman, DHHS, 4/17/2018 24
Heat Map of Low and No-Cost Senior Services by Zip Code

Appendix Analysis of Service Providers
1. Senior Links – Department of Health & Human Services (DHHS)2. Parks Recreation & Marine (PRM) Senior Services3. PRM 4th Street Senior Center Information & Assistance (I&A)4. DHHS Multi-Service Center (MSC)5. Long Beach Police Department (LBPD) – Senior Police Partners 6. Jewish Family & Children’s Services (JFCS)7. SCAN Independence at Home (IAH)8. Los Angeles County Area Agency on Aging (AAA) 25

DHHS Senior Links: Category of Services
• Over 88% of services provided at Senior Links were Health/Medical
• Only 6% of services were housing related
• During the data collection period, the Senior Links program operated with minimal staffing and primarily for health referrals. At full capacity, Senior Links would have more social worker time to address mental health and social services.
2
1
108
8
2
1
0 20 40 60 80 100 120
Food
Health Insurance
Health/Medical
Housing
Mental Health
Other
S ERVICES C ATEGORIES B AR C HART
Cat 1 Count of Cat 1
Food 2
Health Insurance 1
Health/Medical 108
Housing 8
Mental Health 2
Other 1
122
26Source: Department of Health and Human Services (Long Beach Health Department)

DHHS Senior Links: Type & Category of Services
• 122 Seniors were served over the period of 1 ½ months
• Overwhelming majority of clients are accessing the Senior Links program as walk-ins 1 1 1
52
41
6
21
42
2 1
8
Oth
er
Foo
d
Hea
lth
Insu
ran
ce
Hea
lth
/Med
ical
Ho
usi
ng
Men
tal H
ealt
h
Hea
lth
/Med
ical
Ho
usi
ng
Field Office Phone
Services provided by Type & Category by Sex(Aug 31 - Oct 12, 2017) (1.5 months)
Female Male
27Source: Department of Health and Human Services (Long Beach Health Department)

DHHS Senior Links: Age Ranges Served
• Diverse age ranges were equally served• 33% are 60-69 yrs.• 35% are 70-79 yrs.• 25% are 80+ yrs.• Only 8% were 50-59 yrs.
• Overall, 56% of those served were Female and 44% were male
• Females dominated each age range, with the exception of 60-69 yrs., where there were 20% more males. This is not surprising when compared with demographic trends.
8%
33%
35%
21%
3%
Percentage Served by Age Range
50-59
60-69
70-79
80-89
90-99
8
16
27
14
32
24
15
12
10
5
10
15
20
25
30
50-59 60-69 70-79 80-89 90-99
Female
Male
28Source: Department of Health and Human Services (Long Beach Health Department)

DHHS Senior Links: Zip Codes Served
• Majority served reside within the Long Beach Senior Center Zip Code 90802 (60%); Senior Links is located at the 4th Street Senior Center
• Next greatest number served come from the adjacent zip code 90813 (14%)
Count of ID Column Labels
Row Labels 90802 90803 90804 90805 90806 90807 90810 90813 90814Grand Total
50-59 7 1 1 1 10
60-69 23 1 4 1 2 1 1 5 2 40
70-79 21 8 3 9 1 42
80-89 19 2 2 3 26
90-99 3 1 4
Grand Total 73 2 12 1 5 4 1 17 7 122
0
5
10
15
20
25
50-59 60-69 70-79 80-89 90-99
90802
90803
90804
90805
90806
90807
90810
90813
90814
*Please note there is no representation from zip codes 90815
29Source: Department of Health and Human Services (Long Beach Health Department)

Parks Recreation & Marine (PRM) Senior Services Breakdown - FY17
Senior Center52%
Eldorado21%
McBride17%
Houghton6%
Silverado3%
Chavez1%
Senior Services Breakdown - FY17
Senior Center Eldorado McBride Houghton Silverado Chavez
Senior Center 213,438
Eldorado 85,317
McBride 68,676
Houghton 24,910
Silverado 12,529
Chavez 6,379
Total Services 411,249
Source: Parks, Recreation & Marine (PRM) 30

PRM Senior Services Breakdown - FY17
0 20,000 40,000 60,000 80,000 100,000 120,000 140,000 160,000
Programs
Drop-In, Self-Guided Activities
Active Class & Self-Guided Activities
Special Events
Lunch Program (Only)
Senior Services Comparison
Chavez Eldorado Houghton McBride Silverado Senior Center
S
• Caring staff listening to and addressing the needs of each center’s population
• Variety of fun and entertaining programs are offered for socialization and stimulation
W• Fragmentation of services for seniors across the centers
O
• Provide institutional standard of practice for continuity of care• How many seniors are not leaving their homes to benefit from the
services?
T
• Lack of funding sources• Senior center facilities are old and need repairs, residents complain
that senior centers do not have inviting facilities.
31Source: Parks, Recreation & Marine (PRM)

PRM Lunch Program Breakdown - FY17
26,252
17,459
13,506
9,917
2,4551,208
0
5,000
10,000
15,000
20,000
25,000
30,000
Senior Center Eldorado McBride Houghton Silverado Chavez
Lunch Programs Served - FY 17
32Source: Parks, Recreation & Marine (PRM)
S
• Human Services Assn LA (HSA) provides meals at 4 of the 6 senior centers
• McBride offers both Cambodian and American menus daily
W
• Disparate information dissuades patrons• Different organizations provide meals, some organizations expect a
$1 donation
O
• Congregate meals counter social isolation, improve mental health, and physical wellbeing
• Houghton Park has started a Crop Swap where residents exchange left over fruits and vegetables from their home gardens
• Engage Long Beach-based Food Finders organization to serve seniors
T
• Chavez currently serves around 5 meals a day --does not appear sustainable

4th Street Senior Center Services - FY17
20,600
17,050 16,231 15,370 14,654
18,926
16,09417,500 17,837 17,111
19,358
22,707
0
5,000
10,000
15,000
20,000
25,000
30,000
35,000
40,000
45,000
50,000
Oct Nov Dec Jan Feb Mar Apr May Jun Jul Aug Sep
SENIOR CENTER SERVICES - FY17
Programs Drop-In, Self-Guided Activities
Active Class & Self-Guided Activities Special Events
Lunch Program (Only) Total
Programs27%
Drop-In, Self-Guided
Activities35%
Active Class & Self-Guided
Activities21%
Special Events5%
Lunch Program (Only)12%
SENIOR CENTER SERVICES BREAKDOWN - FY17
Senior Center Services - FY17
Programs 57,598
Drop-In, Self-Guided Activities 75,768
Active Class & Self-Guided Activities 44,151
Special Events 9,669
Lunch Program (Only) 26,252
Total 213,438
Community Services Supervisor Elyse GarciaDaily Avg. Program Participants 890Daily Avg. Meals 100
33Source: Parks, Recreation & Marine (PRM)
S• The Resource Center, Senior Links, and diversity of program offerings
W • Dense location offers minimal parking
O• Establish an Office focusing on older adults
T• Homelessness issues need to be addressed

El Dorado Senior Services - FY17
Eldorado West Senior Services - FY17
Programs 17,103
Drop-In, Self-Guided Activities 20,235
Active Class & Self-Guided Activities 30,520
Special Events 0
Lunch Program (Only) 17,459
Total 85,317
7,306 7,378 7,337 6,8175,828
7,9947,127 7,513 7,239
6,6327,566
6,580
0
5,000
10,000
15,000
20,000
Oct Nov Dec Jan Feb Mar Apr May Jun Jul Aug Sep
EL DORADO WEST SENIOR PROGRAMS - FY17
Programs Drop-In, Self-Guided Activities
Active Class & Self-Guided Activities Special Events
Lunch Program (Only) Total
Programs20%
Drop-In, Self-Guided
Activities24%
Active Class & Self-Guided
Activities36%
Special Events0%
Lunch Program (Only)20%
EL DORADO SERVICES BREAKDOWN - FY17
Community Services Supervisor Sonny SengDaily Avg. Program Participants 100’sDaily Avg. Meals 65
34Source: Parks, Recreation & Marine (PRM)
S• Draw crowds: 200-300 for special events, 125-150 for dance/band, 65-70 for flower
arranging
W• Location is difficult to reach via public transportation
O
• Opportunity to take best practical ideas and implement for Tech Talk classes across senior centers (how to check bus schedules, check store hours, setup online banking, pay utility bills, navigate doctors). Educate in groups based on levels of knowledge.
• Nice to have day trips• Potential 10% increase in attendance if transportation provided.
T
• Digital Divide threatening independence and risking abuse from scam sites. Technology can become overpowering. Lack of knowledge in use, not access to technology. Technology can liberate seniors to live independently.

McBride Senior Services Breakdown - FY17
5,344
7,258 7,349
3,807
5,511
6,680
5,418 5,2785,849 5,883 5,850
4,449
0
2,000
4,000
6,000
8,000
10,000
12,000
14,000
16,000
Oct Nov Dec Jan Feb Mar Apr May Jun Jul Aug Sep
MCBRIDE SENIOR PROGRAMS - FY17
Programs Drop-In, Self-Guided Activities
Active Class & Self-Guided Activities Special Events
Lunch Program (Only) Total
Programs15%
Drop-In, Self-Guided
Activities49%
Active Class & Self-Guided
Activities12%
Special Events4%
Lunch Program (Only)20%
MCBRIDE SERVICES BREAKDOWN - FY17
McBride Senior Services - FY17
Programs 10,315
Drop-In, Self-Guided Activities 33,686
Active Class & Self-Guided Activities 8,669
Special Events 2,500
Lunch Program (Only) 13,506
Total 68,676
Community Services Supervisor Daveth YoakDaily Avg. Program Participants 25-60Daily Avg. Meals 50-60
35Source: Parks, Recreation & Marine (PRM)
S• Offer Cambodian and American lunches
W• No transportation offered, Wi-Fi is unreliable
O
• Frequent calls requesting pickup of seniors from their homes to attend programs. Could potentially increase participation by upwards of 20-30 more guests if provided transportation.
• Opportunity for better outreach and promotion
T
• Recent homeless encampment of 15 people ranging 35-60 years (smoking, trash, using bathroom outdoors, pets off leash), refused referral to MSC

Houghton Senior Services Breakdown - FY17
2,5111,978 1,955 1,839 1,585
5,056
1,763 1,9401,550 1,348
1,709 1,676
0
2,000
4,000
6,000
8,000
10,000
12,000
Oct Nov Dec Jan Feb Mar Apr May Jun Jul Aug Sep
HOUGHTON SENIOR PROGRAMS - FY17
Programs Drop-In, Self-Guided Activities
Active Class & Self-Guided Activities Special Events
Lunch Program (Only) Total
Programs10%
Drop-In, Self-Guided
Activities29%
Active Class & Self-Guided
Activities20%
Special Events1%
Lunch Program (Only)40%
HOUGHTON SERVICES BREAKDOWN - FY17
Community Services Supervisor Kameron TalaveraDaily Avg. Program Participants 35-40Daily Avg. Meals 20-40
Houghton Senior Services - FY17
Programs 2,390
Drop-In, Self-Guided Activities 7,339
Active Class & Self-Guided Activities 5,119
Special Events 145
Lunch Program (Only) 9,917
Total 24,910
36Source: Parks, Recreation & Marine (PRM)
S
• Offer Special Programs/Field Trips: i.e. OC Fair, America’s Got Talent taping• Provide Taxi vouchers and bus tokens as needed for ride home, doctor, shelter• Provide monthly Medical screenings: Healthcare Partners, CA Exchange, Caremore,
SCAN
W• Lost Free Molina Neighborhood Shuttle (lost 10-15 lunch participants)• Senior Wing was damaged by flooding (small cardio room, library and computer
room)
O
• Recent groundbreaking of 5-year project to construct entire new building• Should be a curriculum for older adults shared across the senior centers• Resume Saturday and Sunday Programs
T
• 3 year waiting list for Senior Apartments• Homelessness and substance use (4-5 people loiter after 6:30 pm)

Silverado Senior Services Breakdown - FY17
Silverado Senior Services - FY17
Programs 4,650
Drop-In, Self-Guided Activities 106
Active Class & Self-Guided Activities 4,533
Special Events 785
Lunch Program (Only) 2,455
Total 12,529
991862
728 783 727 696 643
1,2721,523
1,4211,595
1,288
0
500
1,000
1,500
2,000
2,500
3,000
3,500
Oct Nov Dec Jan Feb Mar Apr May Jun Jul Aug Sep
SILVERADO SENIOR PROGRAMS - FY17
Programs Drop-In, Self-Guided Activities
Active Class & Self-Guided Activities Special Events
Lunch Program (Only) Total
Programs37%
Drop-In, Self-Guided
Activities1%
Active Class & Self-Guided
Activities36%
Special Events6%
Lunch Program (Only)20%
SILVERADO SERVICES BREAKDOWN - FY17
Community Services Supervisor Etnangte RoeungDaily Avg. Program Participants 25-60Daily Avg. Meals 20-40
37Source: Parks, Recreation & Marine (PRM)
S
• Individualized attention. For example, writing down questions they should ask their doctor during their visit
• Amenities: Olympic Pool for water aerobics, large gym, and social hall with stage for dances• Intergenerational event over Thanksgiving with games and mingling, where teens put on a
show, and seniors served as role models (~ 200 attendees)
W• Transportation: Most accessible for those who can walk, drive, or dropped off by care
takers. Senior apartment across the street, yet unsure they are participating.
O
• Offer Intergenerational visits across parks as “Park Fairs” to intermingle and engage with all ages of Long Beach
• Attract more men, and more programming for male population• Engage senior apartments across the street for tailored programming• Increased senior “eyes” and presence in the park would decrease unwanted activity in the
park
T• Residents express safety concerns about this park• Nearby Century Villages at Cabrillo has a waitlist for Veteran housing

Chavez Senior Services Breakdown - FY17
Cesar Chavez Senior Services - FY17
Programs 0
Drop-In, Self-Guided Activities 1,888
Active Class & Self-Guided Activities 3,109
Special Events 174
Lunch Program (Only) 1,208
Total 6,379
507401 354 348 374
494 543
845700 663 680
470
0
500
1,000
1,500
2,000
Oct Nov Dec Jan Feb Mar Apr May Jun Jul Aug Sep
CESAR CHAVEZ SENIOR PROGRAMS - FY17
Programs Drop-In, Self-Guided Activities
Active Class & Self-Guided Activities Special Events
Lunch Program (Only) Total
Programs0% Drop-In, Self-
Guided Activities
29%
Active Class & Self-Guided
Activities49%
Special Events3%
Lunch Program (Only)19%
CESAR CHAVEZ SERVICES BREAKDOWN - FY17
Community Services Supervisor Heidi MazasDaily Avg. Program Participants 4-11 Daily Avg. Meals 5 (previously 15)
38Source: Parks, Recreation & Marine (PRM)
S
• Collaboration amongst seniors and teens to implement carnival for kids• Outdoor garden for cooking activities• Shared workout facility with dedicated time for women and seniors only• Bus stop is in close proximity
W• Lack of senior participation overall. Programming posted in 7 senior homes in the area.
However, competing proximity to 4th street Senior Center draws a greater audience
O
• Opportunity to draw more male programming since majority attendance is female• Vibrant child and teen program can address senior needs• Desire more partnerships with neighboring organizations (i.e. to provide pottery classes)
T
• Homeless population of around 50 seniors (accessing facility to charge phones), removed electrical outlets outside the building
• Some homeless have vouchers, but lack of housing to accept vouchers

4th Street Senior Center Information & Assistance (I&A) Stats
29
9
38
7
35
3
31
7
27
6
26
4
15
8
14
6 17
6
16
0
67
2
60
9
69
7
61
0
51
3
51
3
31
2
24
4
32
6
22
1
75
0
88
6
95
8
90
3
70
6
80
0
46
1
34
1
46
1
35
7
J A N U A R Y F E B R U A R Y M A R C H A P R I L M A Y J U N E J U L Y A U G U S T S E P T E M B E R O C T O B E R
INCOMING CALLS & WALK-INS - SENIOR CENTER 2017
Incoming Calls - Reception Incoming Calls - Direct Svc Walk-Ins
• The next several slides share data from January through October 2017 demonstrating the extensive level of care and service provided through calls coming into the reception desk, and I&A hotline and walk-ins
*Caveat that drop in numbers has to do with 1) issues with the new phone system not routing rotary dial calls and 2) volunteers not always capturing stats on a consistent basis
39Source: Parks, Recreation & Marine (PRM)

4th Street Senior Center I&A Stats
17211882
2008
1830
14951577
931
731
963
738
0
500
1000
1500
2000
2500
3000
3500
4000
4500
JANUARY FEBRUARY MARCH APRIL MAY JUNE JULY AUGUST SEPTEMBER OCTOBER
TOTAL VISITS - SENIOR CENTER 2017
Incoming Calls Walk-Ins Total Visits
• Consolidated data for all incoming calls, whether to the reception desk or I&A office • Displays total incoming touchpoints for each month
40Source: Parks, Recreation & Marine (PRM)

4th Street Senior Center I&A Stats
189 187
245
193
163 161 163
104
159
80
0
100
200
300
400
500
600
JAN FEB MAR APR MAY JUN JUL AUG SEP OCT
Advocacy Outreach TouchpointsSenior Center 2017
Advocacy - Calls Made Advocacy - Letters Written Advocacy - Total
• Consolidated data for all incoming calls, whether to the reception desk or to Room 107• Displays total incoming touchpoints for each month
41Source: Parks, Recreation & Marine (PRM)

4th Street Senior Center I&A Stats
• Majority of requests are for the 10 food related resources, the most active onsite being Food Finders• Transportation is the second most requested referral• Also popular is help signing up for PRM classes, utilities, discount programs, and filing income taxes
0 2000 4000 6000 8000 10000 12000
Appt - Bet Tzedek/Other
Appt - Notary
Food - Emerg. Food Pantry
Food - Food Stamps
Food - OCFB Food Distrib.
Income Tax Assistance
Info - Brochures/Literature
Medical - Assistive Devices
Police - Sr. Police Partners
Referral - Case Mgmt
Referral - Financial
Referral - In-Home Services
Referral - Mental Health
Referral - St. Mary Senior Clinic
Registr - Classes
Registr - Trips
Transp - Bus Passes
Transp - Dial-a-Lift/Access
Transp - Pkg Permit - NIGHT
Transp - General
Utility - UUTE
Requested Service by Month Jan-Oct 2017
JAN FEB MAR APR MAY JUN JUL AUG SEP OCT
42Source: Parks, Recreation & Marine (PRM)

4th Street Senior Center I&A Stats
Financial/Legal Appt - Bet Tzedek/Other
Financial/Legal Appt - Notary
Financial/Legal Referral - Financial
Financial/Legal Referral - Legal
Financial/Legal Income Tax Assistance
Financial/Legal Referral - Employment
Financial/Legal Social Security Issues
Food Food - Brown Bag Distrib.
Food Food - Emerg. Food Pantry
Food Food - Food Finders Distrib.
Food Food - Food Stamps
Food Food - Human Svc Assoc
Food Food - OCFB Food Distrib.
Housing Housing
Housing Referral - Homeless Issues
General Info Info - Board Postings/Binders
General Info Info - Brochures/Literature
General Info Info - Sr Ctr General/Vol Info
General Info Utility
Health Medical - Assistive Devices
Health Medical - Equip. Loans
Health Appt - HICAP
Health Referral - Mental Health
Health Referral - Senior Links
Health Referral - St. Mary Senior Clinic
Health Referral - Case Mgmt
Safety Police - Sr. Police Partners
Safety Referral - APS/Ombudsman
Quality of Life Referral - In-Home Services
Quality of Life Registr - Classes
Quality of Life Registr - Special Events
Quality of Life Registr - Trips
Transportation Transp - Bus Passes
Transportation Tranp - Bus Tokens
Transportation Transp - Dial-a-Lift/Access
Transportation Transp - Pkg Permit - DAY
Transportation Transp - Pkg Permit - NIGHT
Transportation Transp - Taxi Vouchers
Transportation Transp - General
Transportation Registr - AARP Driving
3677
42804605
2449
3381
2913 27922500 2499
2124
0
1000
2000
3000
4000
5000
6000
7000
8000
9000
10000
JAN FEB MAR APR MAY JUN JUL AUG SEP OCT
NUMBER OF TOUCHPOINTS REFERRALS/SERVICES
SENIOR CENTER - JAN - OCT 2017
Financial/Legal Food Housing General Info Health Safety Quality of Life Transportation TOTAL
• Touchpoints made for Referrals/Services handled on the spot or referred out• Recategorized the stats based on input from Staff and Clients to get a better idea of categories of service provided• Will be refining these categories with the Office of Aging in the future
43Source: Parks, Recreation & Marine (PRM)

4th Street Senior Center I&A Stats
Financial/Legal, 2,694, 9%
Food, 14,221, 46%
Housing, 1,743, 6%
General Info, 3,563, 11%
Health, 1,532, 5%
Safety, 163, 0%
Quality of Life, 2,228, 7%
Transportation, 5,076, 16%
CATEGORIES OF SERVICES
At the time of data collection, the I&A office was staffed by one fulltime employee and part-time volunteers.
44Source: Parks, Recreation & Marine (PRM)

4th Street Senior Center I&A Stats – Oct 2017
103, 33%
209, 67%
The Center
Incoming Calls Walk-Ins
22
10
17
9 912
2421
17
12
27
18
22
4 3
22 21
6
14
1012
00
10
20
30
40
50
60
SENIOR RESOURCE CENTER VISITS - OCT 2017
Incoming Calls Walk-Ins Total Visits
0
5
10
15
20
25
Mo
nd
ay
Tues
day
Wed
nes
day
Thu
rsd
ay
Frid
ay
Mo
nd
ay
Tues
day
Wed
nes
day
Thu
rsd
ay
Frid
ay
Mo
nd
ay
Tues
day
Wed
nes
day
Thu
rsd
ay
Frid
ay
Mo
nd
ay
Tues
day
Wed
nes
day
Thu
rsd
ay
Frid
ay
Mo
nd
ay
Tues
day
Senior Center Visits by Weekday - Oct 2017
Incoming Calls Walk-Ins
• Snapshot of October 2017 for a drilldown on the daily data
45Source: Parks, Recreation & Marine (PRM)

Age 50+ Accessing the DHHS Multi-Service Center (MSC) October 2016 - September 2017
Source: Long Beach Homeless Management Information System (HMIS)
The Multi-Service Center (MSC) is the homeless continuum of care for the city of Long Beach. Multiple providers serving individuals experiencing homelessness are co-located at the MSC in West Long Beach. The MSC is managed by the City of Long Beach Department of Health & Human Services.
46

Age 50+ Accessing the MSCOctober 2016 - September 2017
47Source: Long Beach Homeless Management Information System (HMIS)

Age 50+ Accessing the MSCOctober 2016 - September 2017
• Recipients of services entered from 134 known zip codeso Below is a breakdown of the numbers of seniors served per the 10 zip codes within Long Beacho Seniors access the Multi-Services Center came from 125 zip codes outside of Long Beach
Zip Code Number Served
90813 238
90802 41
90805 32
90804 29
90810 23
90806 20
90807 10
90803 7
90814 7
90808 3
48Source: Long Beach Homeless Management Information System (HMIS)

LBPD Senior Police Partners Snapshot of January – June 2017
38% Referred to Adult
Protective Services
10% Veteran Status
2, 6%
20, 65%
9, 29%
Majority of visits were for those aged 65+
50-64 65-79 80+*Please note that a single visit may have multiple reasons for contact
49Source: Long Beach Police Department (LBPD)
0
1
2
3
4
5
6
7
8
90802 90808 90805 90813 90804 90803 90806 90815 90810 90814
Number of Visits by Zip Code

Intake & Referral Requests by Category Sept 2016 – Dec 2017Ages 50+
Reference: Data provided by Leslie R. Evans, LCSW, Director of Social Work and Older Adult Services
0
10
20
30
40
50
60
246 Total Intake & Referral
Total
• JFCS’ mission is to empower people to make positive changes through professional, affordable counseling and support services • The Intake & Referral Hotline provides assistance, resources and tools for people who don't know where to go, or who to ask• The goal is to help seniors to live with dignity and age safely in their homes• JFCS Hotline received a total of 246 calls from Sept 2016-Dec 2017• Not surprising, housing requests was at the top of the list, followed by the growing need for in-home health care assistance
50

Count of Need by Age Range, Ethnicity and ReligionSept 2016 – Dec 2017Ages 50+
Reference: Data provided by Leslie R. Evans, LCSW, Director of Social Work and Older Adult Services
0
10
20
30
40
50
60
70
80
90
50-61 62-74 75-89 90+
Count of Need by Age Range
Total
0 50 100 150 200
Asian
Black
Caucasian
Latino
Other
(blank)
Count of Need by Ethnicity
0
20
40
60
80
100
120
140
160
Jewish Non-Jewish (blank)
Count of Need by Religion
Total
51
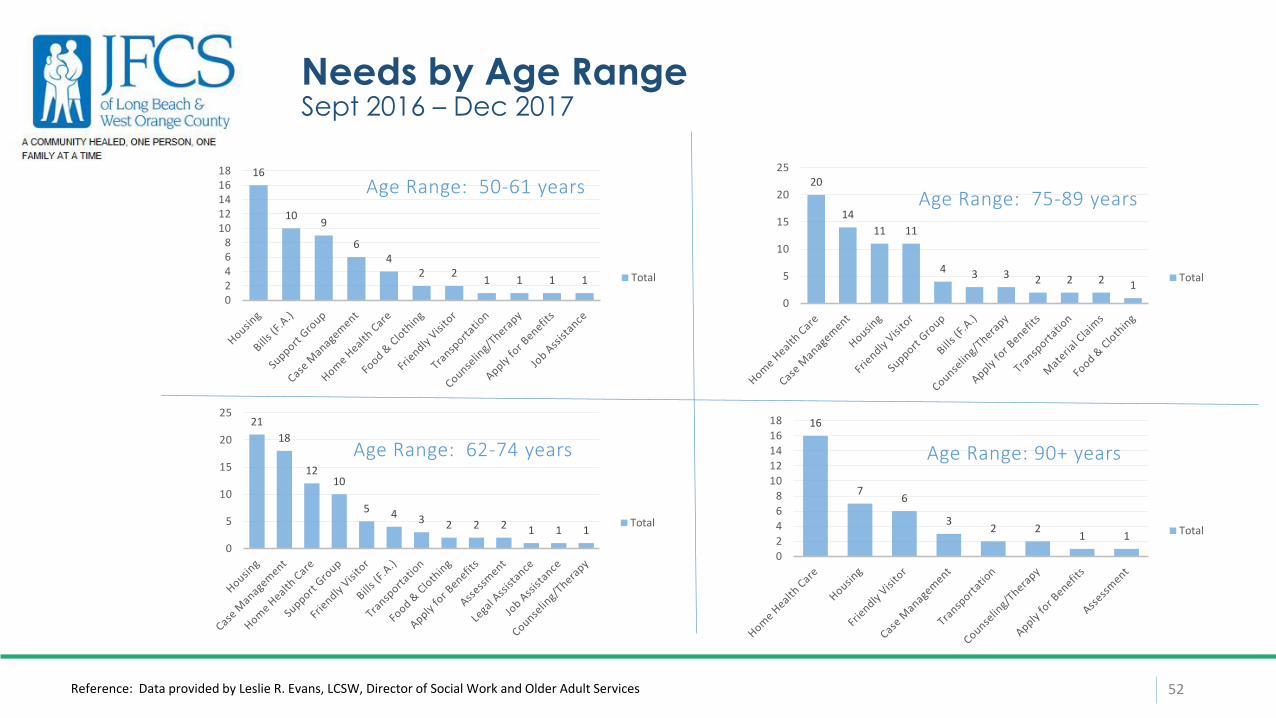
Needs by Age RangeSept 2016 – Dec 2017
Reference: Data provided by Leslie R. Evans, LCSW, Director of Social Work and Older Adult Services
16
109
64
2 21 1 1 1
02468
1012141618
Age Range: 50-61 years
Total
21
18
1210
5 4 3 2 2 2 1 1 1
0
5
10
15
20
25
Age Range: 62-74 years
Total
20
14
11 11
4 3 3 2 2 2 1
0
5
10
15
20
25
Age Range: 75-89 years
Total
16
76
32 2
1 1
0
2
4
6
8
10
12
14
16
18
Age Range: 90+ years
Total
52
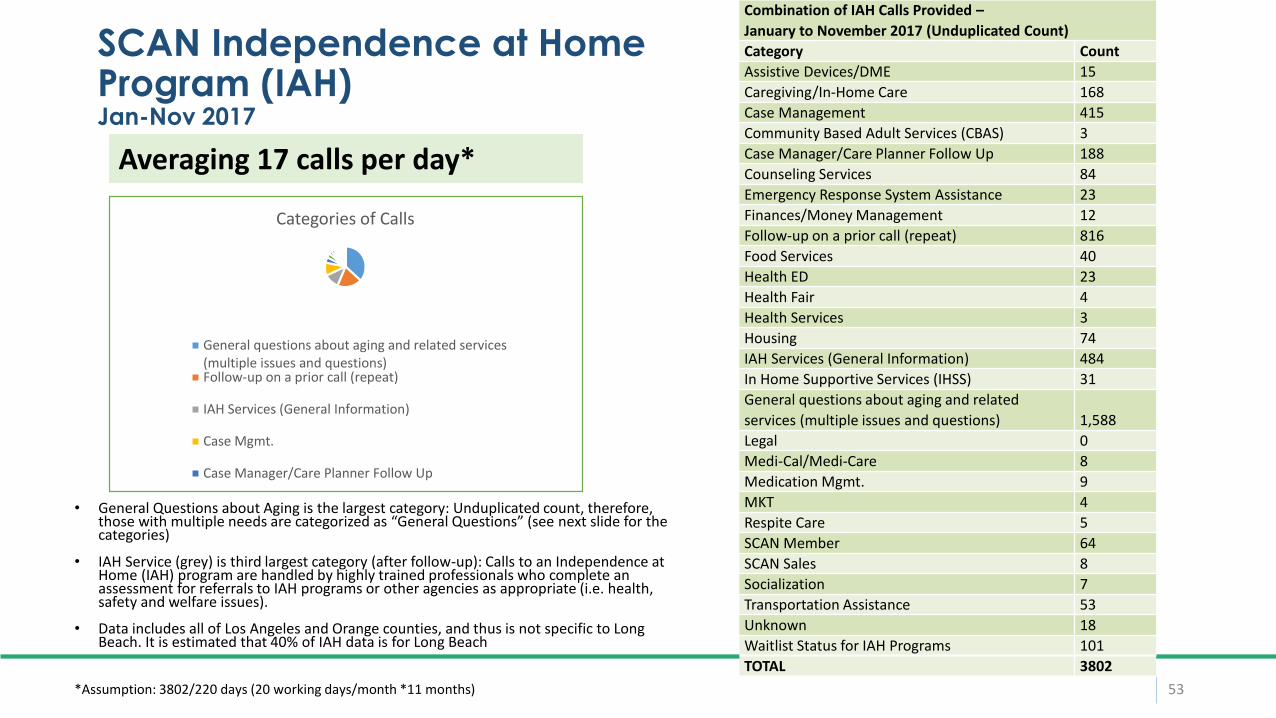
SCAN Independence at Home Program (IAH)Jan-Nov 2017
• General Questions about Aging is the largest category: Unduplicated count, therefore, those with multiple needs are categorized as “General Questions” (see next slide for the categories)
• IAH Service (grey) is third largest category (after follow-up): Calls to an Independence at Home (IAH) program are handled by highly trained professionals who complete an assessment for referrals to IAH programs or other agencies as appropriate (i.e. health, safety and welfare issues).
• Data includes all of Los Angeles and Orange counties, and thus is not specific to Long Beach. It is estimated that 40% of IAH data is for Long Beach
Combination of IAH Calls Provided –
January to November 2017 (Unduplicated Count)
Category Count
Assistive Devices/DME 15
Caregiving/In-Home Care 168
Case Management 415
Community Based Adult Services (CBAS) 3
Case Manager/Care Planner Follow Up 188
Counseling Services 84
Emergency Response System Assistance 23
Finances/Money Management 12
Follow-up on a prior call (repeat) 816
Food Services 40
Health ED 23
Health Fair 4
Health Services 3
Housing 74
IAH Services (General Information) 484
In Home Supportive Services (IHSS) 31
General questions about aging and related
services (multiple issues and questions) 1,588
Legal 0
Medi-Cal/Medi-Care 8
Medication Mgmt. 9
MKT 4
Respite Care 5
SCAN Member 64
SCAN Sales 8
Socialization 7
Transportation Assistance 53
Unknown 18
Waitlist Status for IAH Programs 101
TOTAL 3802
Averaging 17 calls per day*
Categories of Calls
General questions about aging and related services(multiple issues and questions)Follow-up on a prior call (repeat)
IAH Services (General Information)
Case Mgmt.
Case Manager/Care Planner Follow Up
*Assumption: 3802/220 days (20 working days/month *11 months) 53

SCAN Independence at Home (IAH) Categories
• Multipurpose Senior Services Program (MSSP): Long-term care management for nursing home certifiable community dwellers. Services provided in Southern Los Angeles County including Long Beach.
• Supportive Services Program: Los Angeles County service for short term care management of individuals 60+. Services are providing in southern Los Angeles County including Long Beach.
• Family Caregiver Support Program: Los Angeles County service for family caregivers of older adults. Services are providing insouthern Los Angeles County including Long Beach.
• Insights Behavioral Health Support Services: In-home counseling for depression and anxiety. Services are provided throughout Los Angeles and Orange Counties.
• COACH: Care management program for either older adults or their caregivers. Services are provided throughout Los Angeles and Orange Counties.
• Volunteer Action for Aging: Volunteer program to decrease senior social isolation. Services are provided throughout Los Angeles and Orange Counties.
• Health & Wellness Community Services: Health education staff that go out into the community and provide group healthy living education in multiple languages utilizing an evidence-based library of more than 50 topics. Additionally, they also go out and provide free health screenings. Services are provided throughout Los Angeles, Orange, and Riverside Counties.
• C-MEDS, Medication Safety Program: In-home service to help properly understand medication administration, storage and increase medication literacy. Services are provided throughout Los Angeles and Orange Counties.
Many calls are directly requesting enrollment in one of IAH’s community-wide free services. IAH delivers the following direct services:
54

Los Angeles County AAA Data on Numbers Served
55
Human Services Association (HSA) is the primary, AAA-funded provider of Elderly Nutrition Program Services, Family Caregiver Support Services (FCSP) and Supportive Services operating in the Long Beach area. The nutrition funding is allocated to HSA for one of eight geographical areas, Gateway Cities, whereas FCSP and Supportive Services funding is allocated to serve District 4, both of which include Long Beach. The total funding allocated to HSA for these services is $5.46 million but please note that this allocation is not only for Long Beach but for all cities and Census Designate of Places within the geographical region that they serve. Funding by city is not available.
Additionally, LA County Workforce Development, Aging and Community Services provides the following Countywide services at an annual allocation of about $2.1 million, which includes services to Long Beach: • Health Insurance Counseling and Advocacy Program• Disease Prevention and Health Promotion Program• Ombudsman Program
Source: LA County Workforce Development, Aging and Community Services Note: Counts represent information for data collected on registered participants; Client level data is not available for additional non-registered services delivered in the report period
