establishing a simple and reliable method of measuring
TRANSCRIPT
ORIGINAL PAPER Open Access
Establishing a simple and reliable methodof measuring ductility of fine metal wireShiori Gondo1,2*, Shinsuke Suzuki2,3, Motoo Asakawa3, Kosuke Takemoto4, Kenichi Tashima4 and Satoshi Kajino5
Abstract
Background: Measurement of the ductility like elongation and reduction of area of the fine metal wire is importantbecause of the progress for the weight reduction and miniaturization of various products. This study established asimple and reliable method of measuring the ductility of a fine metal wire.
Methods: Tensile and loading-unloading tests were performed with applying initial load to high-carbon steel wire(diameters of 0.06–0.296 mm) through capstan-type grippers for non-metal fiber. The wire fastened with thegrippers was separated into three parts: the fastened part, the contact part, and the non-contact part. Scanningelectron microscope (SEM) images were used to measure the wire radius under uniform deformation and agreedwell with the radius calculated using the radius before tensile testing and uniform elongation.
Results: The following conditions were clarified: non-slippage at the fastening between gripper and wire, alongitudinally uniform elongation, negligible cross-head bending, and the stroke calculation accuracy of elongatedlength by the initial load. Thus, uniform elongations were calculated as the ratio of the stroke at 0 N subtractedfrom the stroke at maximum tensile load to the additional initial chuck distance and the stroke at 0 N. Themaximum error of uniform elongation was 0.21%. The reduction of area could be calculated by using the radius atuniform deformation portion, while the radius at the most constricted point was measured using SEM image ofone fractured piece and uniform elongation. The measurement error of reduction of area was 1.9%.
Conclusion: This measurement method can be applied to other metal wires less than 1 mm in diameter.
Keywords: Fine metal wire, Tensile testing, Elongation, Reduction of area
BackgroundLow-carbon steel wires, high-carbon steel wires, stainlesssteel wires, copper wires, aluminum wires, magnesiumwires, gold wires, and amorphous wires have been usedas materials for structures, medical devices, electricaldevices, meshes, goods for hobby and so on (Yoshida2000). These wires are required to be much finer thantypical wires, because the weight reduction andminiaturization of various products has progressed. Forexample, gold wires less than 0.02 mm in diameter havebeen required because of decreasing spacing betweenbonding wires. Kim et al. investigated mechanical proper-ties of ultra-fine Au wires for the development of a fine
and high-strength Au wire (Kim et al. 2006). Daitoh et al.(Daitoh et al. 2000) and Tarui et al. (Tarui et al. 2005)developed the steel wire with a diameter of 0.02 mm andtensile strength higher than 4 GPa and investigated themicrostructure of the wire. Furthermore, Li et al. succeededin the development of ultra-fine steel wire with a diameterof 0.02 mm and tensile strength of 7 GPa (Li et al. 2014).However, ductility like an elongation of the wire was notmeasured sufficiently.The applicable standard, International Organization
for Standardization (ISO) 6892-1 (ISO 6982-1 2016),refers to a method for measuring the ductility of bulkmetal using its elongation and reduction of area. Ingeneral, the elongation is measured from the extension ofa wire. The extension is measured by an extensometer, notby the stroke increment of a cross-head (henceforth simplyreferred to as the stroke increment) which is measured bythe rotation angle of a ball screw in a universal testing
* Correspondence: [email protected] School of Fundamental Science and Engineering, Department ofApplied Mechanics, Waseda University, Shinjuku, Tokyo 169-8555, Japan2Kagami Memorial Research Institute of Materials Science and Technology,Waseda University, Shinjuku, Tokyo 169-0051, JapanFull list of author information is available at the end of the article
© The Author(s). 2018 Open Access This article is distributed under the terms of the Creative Commons Attribution 4.0International License (http://creativecommons.org/licenses/by/4.0/), which permits unrestricted use, distribution, andreproduction in any medium, provided you give appropriate credit to the original author(s) and the source, provide a link tothe Creative Commons license, and indicate if changes were made.
Gondo et al. International Journal of Mechanical and Materials Engineering (2018) 13:5 https://doi.org/10.1186/s40712-018-0091-0
machine. The stroke increment should be smaller thanthe genuine extension. This is because cross-heads bendduring tensile testing due the application of a large tensileload to the wire. Therefore, the ISO standard recommendsan extensometer be placed upon the tested wire. Thereduction of area is calculated from the diameter of a wireprior to tensile testing, and the diameter at the mostconstricted point after tensile testing is complete. Thesediameters are measured by joining fractured pieces.However, it is difficult to measure ductility of a fine
wire in terms of handling based on ISO 6892-1. For awire with a diameter less than 0.2 mm, an elaboratemeasurement method for elongation has traditionallybeen required, even though the elongations and reductionsof area of the wires greater than 0.2 mm in diameter havebeen calculated successfully (Ochiai et al. 1993; Zelin 2002;Hyung et al. 2007). For example, Khatibi et al. used a non-contact extensometer to perform tensile testing on a wirewith a diameter under 0.1 mm (Khatibi et al. 2004).However, using such non-contact extensometers is atime-consuming process. Furthermore, the authors havemeasured the reduction of area in a wire with a 0.06-mmdiameter using scanning electron microscope (SEM)images of a fractured piece following tensile testing. Itis necessary to discuss the difference of reduction ofarea occurred by drawing conditions is not measurementerror but significant difference (Gondo et al. 2015, 2016).An accuracy of the measurement method for reduction ofarea is required to be verified in detail again.For a fine wire, it is necessary to use tensile testing tools
and a load cell with a small capacity because such finewires will only sustain small tensile loads. Capstan-typegrippers are conventionally recommended for grippingnon-metal fibers (JIS R3420 2013) but can be applied to afine metal wire even though the tensile strength of thesefine wires is 6.3–7.0 GPa and is much greater than thestrength of non-metal fibers (Li et al. 2012, 2014). Add-itionally, the amount of cross-head bending during tensiletesting might be negligible in these situations. Thus, thestroke increment can be regarded as the wire extension.This investigation focused on a tensile testing method offastening the wire to the grippers under an initial load, asit is difficult to prevent the wire from slackening withoutan initial force. In this case, the wire is elastically de-formed, such that the genuine initial length is shorter thanthe superficial length. The genuine initial length, thestroke at 0 N, must therefore be calculated. The stroke at0 N can be extrapolated using the slope of the stroke-tensile testing force. To apply this method, the validity ofcapstan-type gripper use must be verified, including thefollowing conditions: no slip at the fastening between thegripper and wire, and longitudinally uniform elongation.Furthermore, the validity of regarding the stroke incre-ment as the extension of the wire should be considered
with the following conditions: negligible cross-head bend-ing and stroke calculation accuracy at 0 N from the slopeof the stroke increment and test force-stroke curve. If thevalidity of using capstan-type grippers and regarding thestroke increment as the wire extension are verified, it ispossible to draw the nominal stress-nominal strain curveand calculate elongation. The accuracy of the elongationcalculated using the stroke can be determined by compar-ing this value to the elongation calculated using anextensometer.The production of the cross-sectional area and the
longitudinal length of a wire remains constant duringtensile testing until a maximum tensile load is applied tothe wire. As such, the reduction of area can be calcu-lated with the radius of the wire at uniform deformationportion, the radius of the most constricted point, andthe uniform elongation. The radius of the wire at theuniform deformation portion and the most constrictedpoint can be measured using SEM images of a fracturedpiece after tensile testing is complete. Before applyingthis, though, the validity of the calculation method forreduction of area using SEM images of a fractured piecemust be established.Given the requirements set forth in the above section,
the purpose of this study was to establish a simple andreliable method of measuring the ductility of a fine metalwire. The following points are discussed: the validity ofusing capstan-type grippers, the validity of regarding thestroke increment as the extension of the wire, the accur-acy of calculating the elongation using stroke increment,and the validity of the reduction of area calculationmethod using SEM images of a fractured piece of wire.The correspondence between experimental and exam-ined items is shown in Table 1.
MethodsStarting materialsThe starting materials were patented pearlitic steel wireswith diameter of 0.444 mm and 0.98% carbon, providedby Nippon Steel & Sumikin SG Wire Co., Ltd. Thechemical compositions of the wires, as shown in Table 2,were measured based on Japanese Industrial Standards(JIS) G1211-3 (JIS G1211-3 2011), G1212 (JIS G12121997), and G1258 (JIS G1258-3 2014). These refer to thequantitative analysis of C, Si, and other relevant elements,respectively.
Wire drawingA wet-type non-slip wire drawing machine was used in thisstudy (Factory Automation Electronics Inc., D3ULT-10D).A wire could be drawn continuously through five passesusing this machine. The conditions for wire drawing aredisplayed in Table 3. The drawing strain for each individualpass was calculated as 2ln (dn − 1/dn), and the total drawing
Gondo et al. International Journal of Mechanical and Materials Engineering (2018) 13:5 Page 2 of 11
strain was calculated as 2ln (d0/d30). The symbol drepresents the diameter of the wire, and n representsthe pass number.
Tensile testTensile testing without a video-type non-contactextensometer was performed at Waseda University.Tensile testing with the extensometer was performed atthe Tokyo office of Shimadzu Co.
Tensile testing without a video-type non-contactextensometerA load cell with a maximum range of 500 N wasequipped on the lower side of a universal testing ma-chine (Shimadzu Co., Autograph AG-25TB) cross-head.The upper gripper (Shimadzu Co., Pneumatic CapstanGrips for Yarn and Cables) was fixed to a joint connectedto the load cell. The lower gripper was inserted at anotherjoint that was fixed to the testing machine table. Thedistance between the lower edge of the upper gripper andthe upper edge of the lower gripper was 50 mm in length,as shown in Fig. 1. It can thus be said that the lengthbetween point A and point B of the wire was 150 mmwhen the wire was fastened with an initial load. However,this length was not the genuine chuck distance becausethe wire was elastically deformed. A schematic of thetensile test is shown in Fig. 2, including a dial gauge, aheight gauge, and pieces of gauge tape.
Measurement of slippage at fastening between gripperand wire Wires with diameters measuring either 0.063or 0.296 mm were fastened to the upper gripper and thelower gripper and were pulled tight by the application of
an initial load ranging from 0.5–3.0 N. Gauge tape(2 mm × 7 mm) was placed on the wire 10 mm from thefastened edge of the upper gripper, as shown in Fig. 2. Aheight gauge (Mitsutoyo Co., HD-AX) was fixed on theuniversal testing machine table. The positions of thefastened edge and the tape were measured prior to tensiletesting. Next, the cross-head was elevated by 2 mm at aspeed of 10 mm/min. The positions of the edge and thetape were again measured with the height gauge. Thedistance between the edge and the tape (upper gripper-tape gap) was calculated.
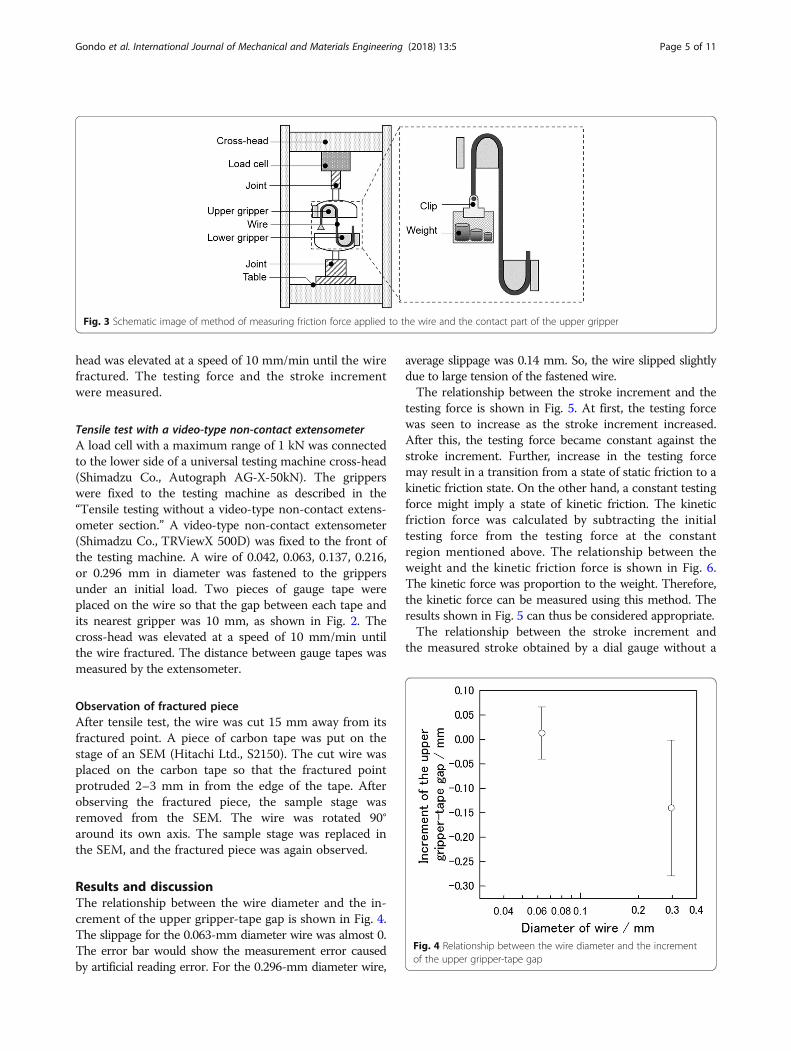
Measurement of friction force at contact part betweenthe gripper and the wire A weight with a clip wasequipped on one end of a wire (diameter 0.063 or0.296 mm) for testing. For the 0.063-mm diameter wire,weights of 60, 120, and 150 g were used. These were 5,10, and 20% of the maximum tensile load, respectively. Aweight of 600 g was applied to the 0.296-mm diameterwire, 5% of the maximum tensile load. The other side ofthe wire was fastened by the lower gripper. The wire waslaid over the upper gripper, as shown in Fig. 3. The cross-head was then elevated by 2 mm at a speed of 10 mm/min.A load cell was used to measure the testing force. Thestroke increment was measured by the rotation angle of aball screw in the universal testing machine.
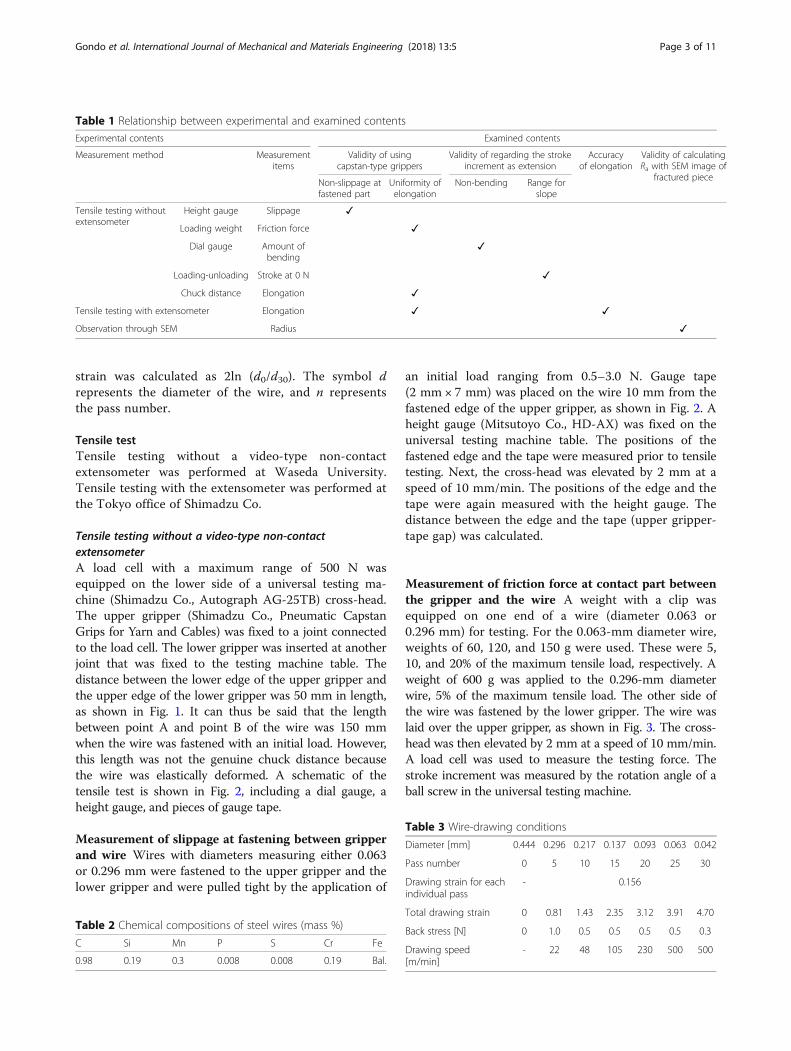
Table 1 Relationship between experimental and examined contents
Experimental contents Examined contents
Measurement method Measurementitems
Validity of usingcapstan-type grippers
Validity of regarding the strokeincrement as extension
Accuracyof elongation
Validity of calculatingRa with SEM image of
fractured pieceNon-slippage atfastened part
Uniformity ofelongation
Non-bending Range forslope
Tensile testing withoutextensometer
Height gauge Slippage ✓
Loading weight Friction force ✓
Dial gauge Amount ofbending
✓
Loading-unloading Stroke at 0 N ✓
Chuck distance Elongation ✓
Tensile testing with extensometer Elongation ✓ ✓
Observation through SEM Radius ✓
Table 2 Chemical compositions of steel wires (mass %)
C Si Mn P S Cr Fe
0.98 0.19 0.3 0.008 0.008 0.19 Bal.
Table 3 Wire-drawing conditions
Diameter [mm] 0.444 0.296 0.217 0.137 0.093 0.063 0.042
Pass number 0 5 10 15 20 25 30
Drawing strain for eachindividual pass
- 0.156
Total drawing strain 0 0.81 1.43 2.35 3.12 3.91 4.70
Back stress [N] 0 1.0 0.5 0.5 0.5 0.5 0.3
Drawing speed[m/min]
- 22 48 105 230 500 500
Gondo et al. International Journal of Mechanical and Materials Engineering (2018) 13:5 Page 3 of 11
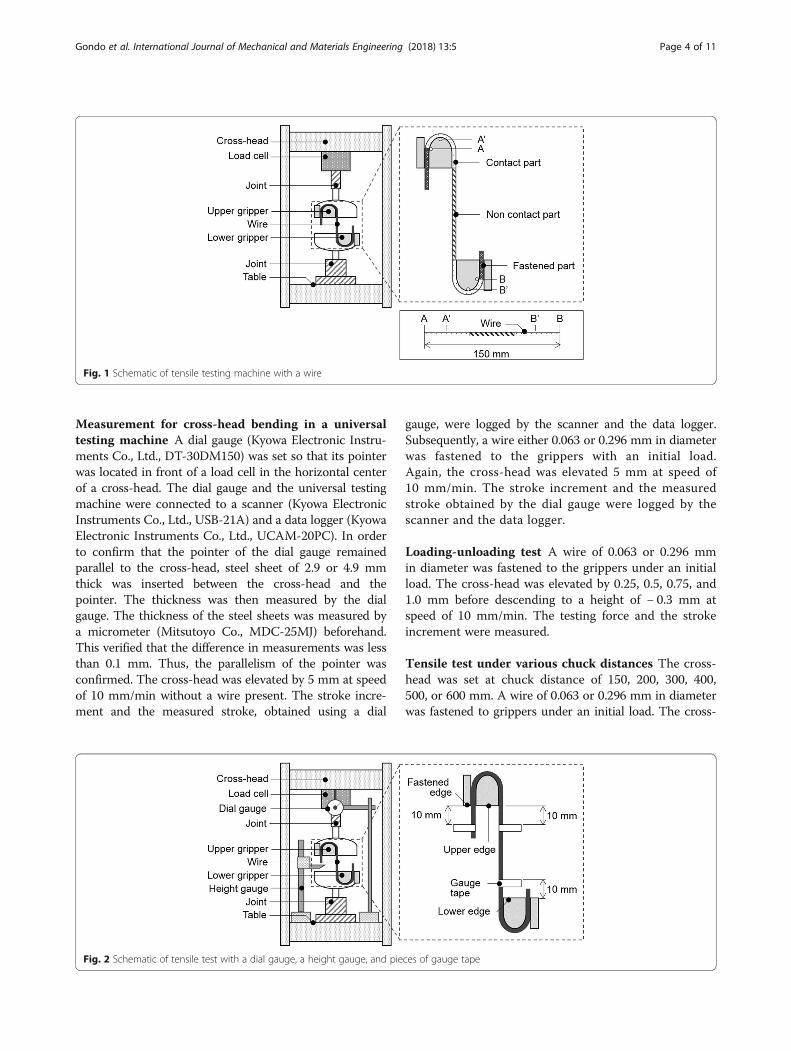
Measurement for cross-head bending in a universaltesting machine A dial gauge (Kyowa Electronic Instru-ments Co., Ltd., DT-30DM150) was set so that its pointerwas located in front of a load cell in the horizontal centerof a cross-head. The dial gauge and the universal testingmachine were connected to a scanner (Kyowa ElectronicInstruments Co., Ltd., USB-21A) and a data logger (KyowaElectronic Instruments Co., Ltd., UCAM-20PC). In orderto confirm that the pointer of the dial gauge remainedparallel to the cross-head, steel sheet of 2.9 or 4.9 mmthick was inserted between the cross-head and thepointer. The thickness was then measured by the dialgauge. The thickness of the steel sheets was measured bya micrometer (Mitsutoyo Co., MDC-25MJ) beforehand.This verified that the difference in measurements was lessthan 0.1 mm. Thus, the parallelism of the pointer wasconfirmed. The cross-head was elevated by 5 mm at speedof 10 mm/min without a wire present. The stroke incre-ment and the measured stroke, obtained using a dial
gauge, were logged by the scanner and the data logger.Subsequently, a wire either 0.063 or 0.296 mm in diameterwas fastened to the grippers with an initial load.Again, the cross-head was elevated 5 mm at speed of10 mm/min. The stroke increment and the measuredstroke obtained by the dial gauge were logged by thescanner and the data logger.
Loading-unloading test A wire of 0.063 or 0.296 mmin diameter was fastened to the grippers under an initialload. The cross-head was elevated by 0.25, 0.5, 0.75, and1.0 mm before descending to a height of − 0.3 mm atspeed of 10 mm/min. The testing force and the strokeincrement were measured.
Tensile test under various chuck distances The cross-head was set at chuck distance of 150, 200, 300, 400,500, or 600 mm. A wire of 0.063 or 0.296 mm in diameterwas fastened to grippers under an initial load. The cross-
Fig. 1 Schematic of tensile testing machine with a wire
Fig. 2 Schematic of tensile test with a dial gauge, a height gauge, and pieces of gauge tape
Gondo et al. International Journal of Mechanical and Materials Engineering (2018) 13:5 Page 4 of 11
head was elevated at a speed of 10 mm/min until the wirefractured. The testing force and the stroke incrementwere measured.
Tensile test with a video-type non-contact extensometerA load cell with a maximum range of 1 kN was connectedto the lower side of a universal testing machine cross-head(Shimadzu Co., Autograph AG-X-50kN). The gripperswere fixed to the testing machine as described in the“Tensile testing without a video-type non-contact extens-ometer section.” A video-type non-contact extensometer(Shimadzu Co., TRViewX 500D) was fixed to the front ofthe testing machine. A wire of 0.042, 0.063, 0.137, 0.216,or 0.296 mm in diameter was fastened to the grippersunder an initial load. Two pieces of gauge tape wereplaced on the wire so that the gap between each tape andits nearest gripper was 10 mm, as shown in Fig. 2. Thecross-head was elevated at a speed of 10 mm/min untilthe wire fractured. The distance between gauge tapes wasmeasured by the extensometer.
Observation of fractured pieceAfter tensile test, the wire was cut 15 mm away from itsfractured point. A piece of carbon tape was put on thestage of an SEM (Hitachi Ltd., S2150). The cut wire wasplaced on the carbon tape so that the fractured pointprotruded 2–3 mm in from the edge of the tape. Afterobserving the fractured piece, the sample stage wasremoved from the SEM. The wire was rotated 90°around its own axis. The sample stage was replaced inthe SEM, and the fractured piece was again observed.
Results and discussionThe relationship between the wire diameter and the in-crement of the upper gripper-tape gap is shown in Fig. 4.The slippage for the 0.063-mm diameter wire was almost 0.The error bar would show the measurement error causedby artificial reading error. For the 0.296-mm diameter wire,
average slippage was 0.14 mm. So, the wire slipped slightlydue to large tension of the fastened wire.The relationship between the stroke increment and the
testing force is shown in Fig. 5. At first, the testing forcewas seen to increase as the stroke increment increased.After this, the testing force became constant against thestroke increment. Further, increase in the testing forcemay result in a transition from a state of static friction to akinetic friction state. On the other hand, a constant testingforce might imply a state of kinetic friction. The kineticfriction force was calculated by subtracting the initialtesting force from the testing force at the constantregion mentioned above. The relationship between theweight and the kinetic friction force is shown in Fig. 6.The kinetic force was proportion to the weight. Therefore,the kinetic force can be measured using this method. Theresults shown in Fig. 5 can thus be considered appropriate.The relationship between the stroke increment and
the measured stroke obtained by a dial gauge without a
Fig. 3 Schematic image of method of measuring friction force applied to the wire and the contact part of the upper gripper
Fig. 4 Relationship between the wire diameter and the incrementof the upper gripper-tape gap
Gondo et al. International Journal of Mechanical and Materials Engineering (2018) 13:5 Page 5 of 11
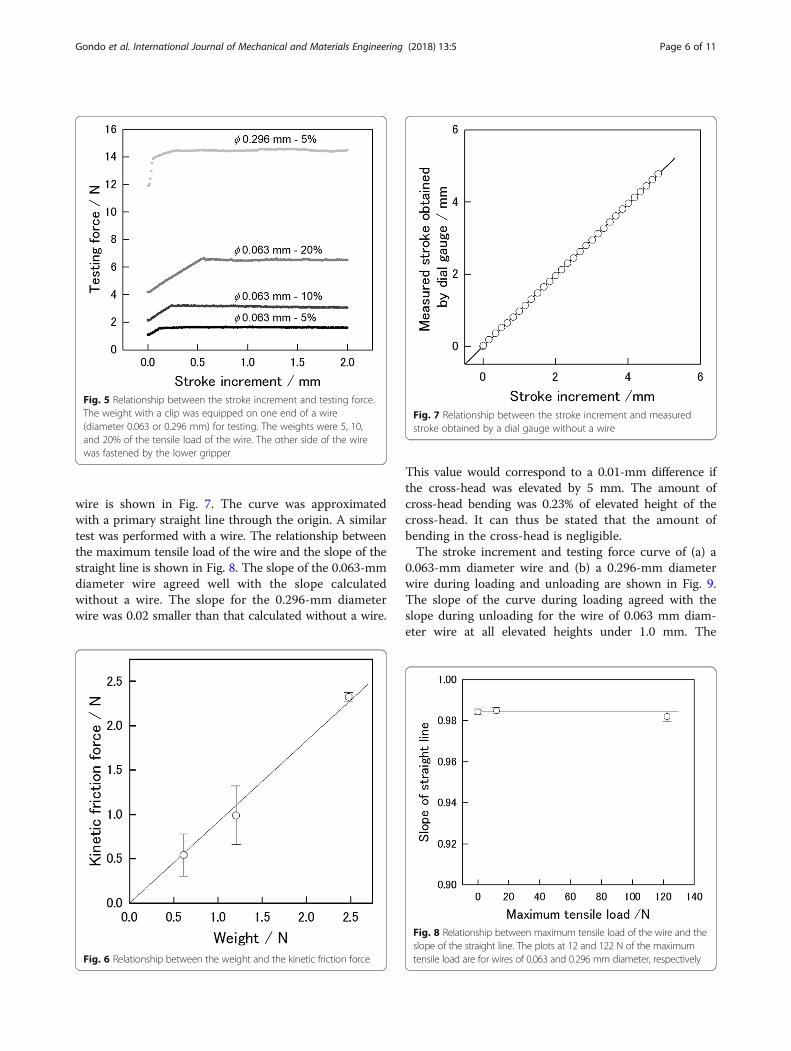
wire is shown in Fig. 7. The curve was approximatedwith a primary straight line through the origin. A similartest was performed with a wire. The relationship betweenthe maximum tensile load of the wire and the slope of thestraight line is shown in Fig. 8. The slope of the 0.063-mmdiameter wire agreed well with the slope calculatedwithout a wire. The slope for the 0.296-mm diameterwire was 0.02 smaller than that calculated without a wire.
This value would correspond to a 0.01-mm difference ifthe cross-head was elevated by 5 mm. The amount ofcross-head bending was 0.23% of elevated height of thecross-head. It can thus be stated that the amount ofbending in the cross-head is negligible.The stroke increment and testing force curve of (a) a
0.063-mm diameter wire and (b) a 0.296-mm diameterwire during loading and unloading are shown in Fig. 9.The slope of the curve during loading agreed with theslope during unloading for the wire of 0.063 mm diam-eter wire at all elevated heights under 1.0 mm. The
Fig. 5 Relationship between the stroke increment and testing force.The weight with a clip was equipped on one end of a wire(diameter 0.063 or 0.296 mm) for testing. The weights were 5, 10,and 20% of the tensile load of the wire. The other side of the wirewas fastened by the lower gripper
Fig. 6 Relationship between the weight and the kinetic friction force
Fig. 7 Relationship between the stroke increment and measuredstroke obtained by a dial gauge without a wire
Fig. 8 Relationship between maximum tensile load of the wire and theslope of the straight line. The plots at 12 and 122 N of the maximumtensile load are for wires of 0.063 and 0.296 mm diameter, respectively
Gondo et al. International Journal of Mechanical and Materials Engineering (2018) 13:5 Page 6 of 11
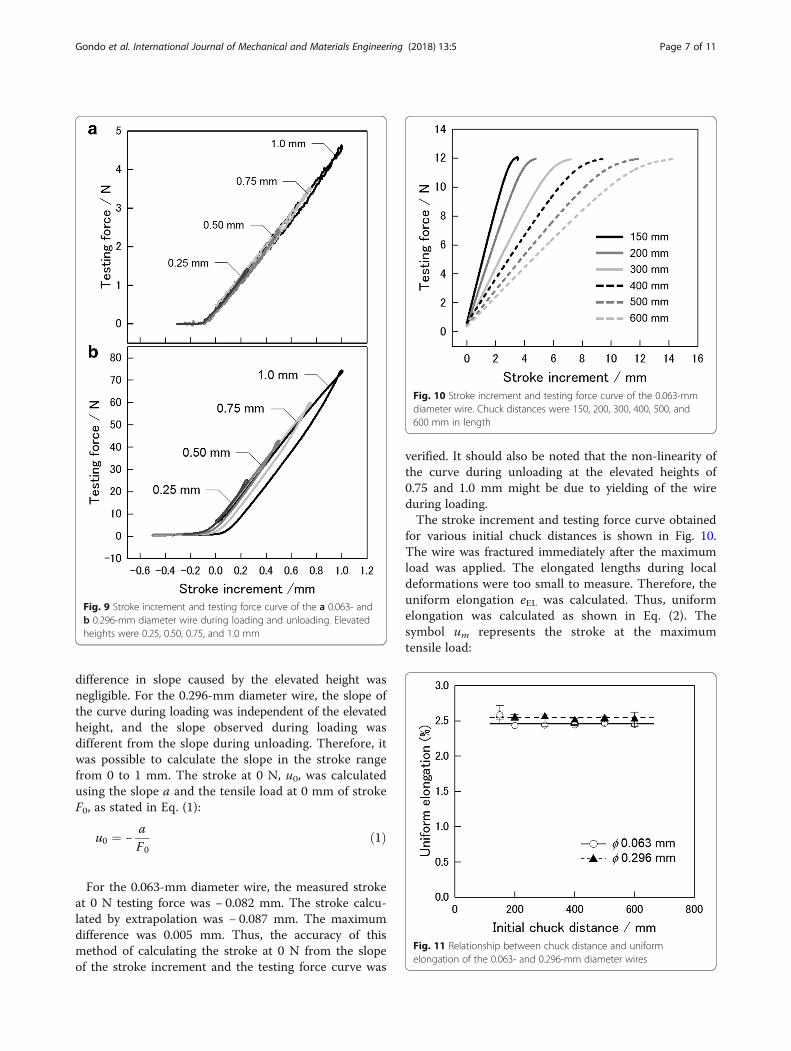
difference in slope caused by the elevated height wasnegligible. For the 0.296-mm diameter wire, the slope ofthe curve during loading was independent of the elevatedheight, and the slope observed during loading wasdifferent from the slope during unloading. Therefore, itwas possible to calculate the slope in the stroke rangefrom 0 to 1 mm. The stroke at 0 N, u0, was calculatedusing the slope a and the tensile load at 0 mm of strokeF0, as stated in Eq. (1):
u0 ¼ −aF0
ð1Þ
For the 0.063-mm diameter wire, the measured strokeat 0 N testing force was − 0.082 mm. The stroke calcu-lated by extrapolation was − 0.087 mm. The maximumdifference was 0.005 mm. Thus, the accuracy of thismethod of calculating the stroke at 0 N from the slopeof the stroke increment and the testing force curve was
verified. It should also be noted that the non-linearity ofthe curve during unloading at the elevated heights of0.75 and 1.0 mm might be due to yielding of the wireduring loading.The stroke increment and testing force curve obtained
for various initial chuck distances is shown in Fig. 10.The wire was fractured immediately after the maximumload was applied. The elongated lengths during localdeformations were too small to measure. Therefore, theuniform elongation eEL was calculated. Thus, uniformelongation was calculated as shown in Eq. (2). Thesymbol um represents the stroke at the maximumtensile load:
Fig. 9 Stroke increment and testing force curve of the a 0.063- andb 0.296-mm diameter wire during loading and unloading. Elevatedheights were 0.25, 0.50, 0.75, and 1.0 mm
Fig. 10 Stroke increment and testing force curve of the 0.063-mmdiameter wire. Chuck distances were 150, 200, 300, 400, 500, and600 mm in length
Fig. 11 Relationship between chuck distance and uniformelongation of the 0.063- and 0.296-mm diameter wires
Gondo et al. International Journal of Mechanical and Materials Engineering (2018) 13:5 Page 7 of 11
eEL ¼ um−u0150þ u0
� 100 ð2Þ
The relationship between the chuck distance and theuniform elongation is shown in Fig. 11. The differencein uniform elongation caused by chuck distance was notconfirmed, even when the ratio of the contact part tothe chuck distance decreased.The relationship between the diameter of the wire and
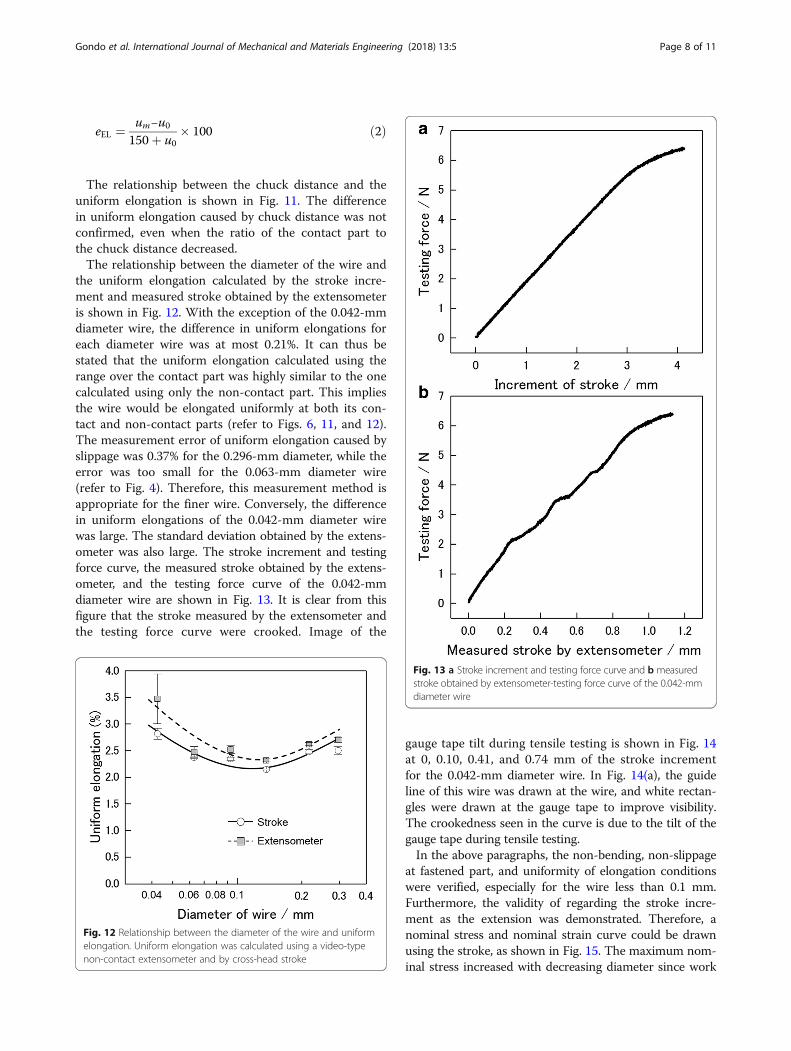
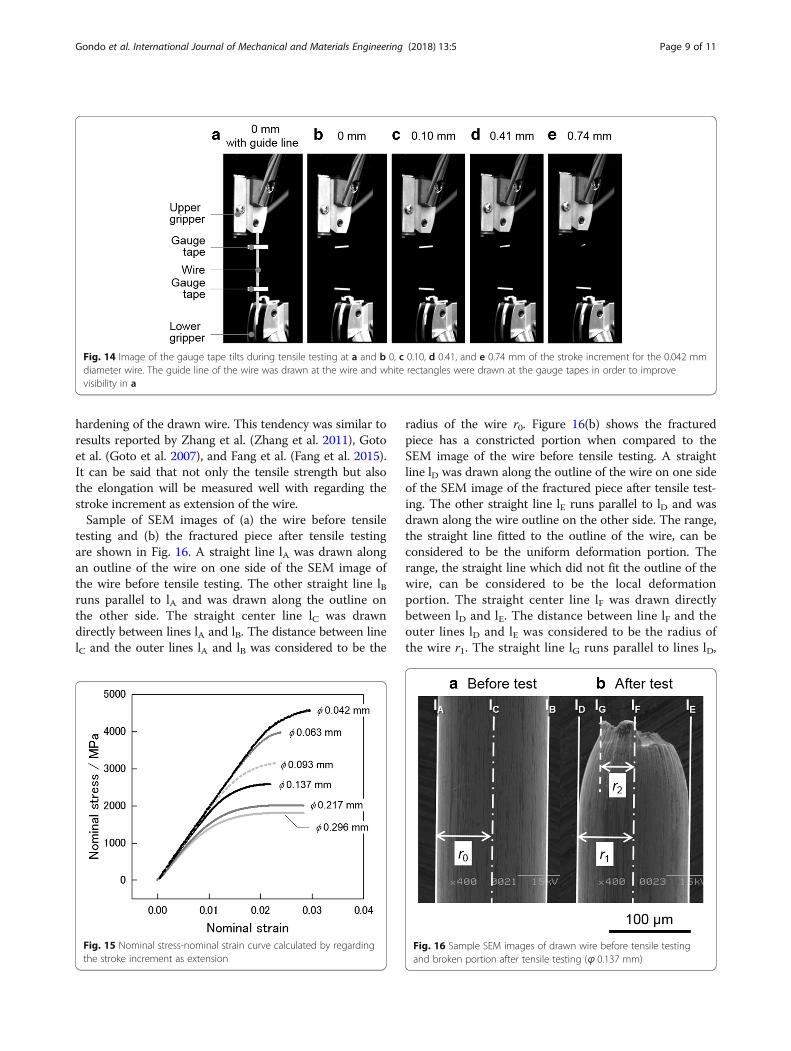
the uniform elongation calculated by the stroke incre-ment and measured stroke obtained by the extensometeris shown in Fig. 12. With the exception of the 0.042-mmdiameter wire, the difference in uniform elongations foreach diameter wire was at most 0.21%. It can thus bestated that the uniform elongation calculated using therange over the contact part was highly similar to the onecalculated using only the non-contact part. This impliesthe wire would be elongated uniformly at both its con-tact and non-contact parts (refer to Figs. 6, 11, and 12).The measurement error of uniform elongation caused byslippage was 0.37% for the 0.296-mm diameter, while theerror was too small for the 0.063-mm diameter wire(refer to Fig. 4). Therefore, this measurement method isappropriate for the finer wire. Conversely, the differencein uniform elongations of the 0.042-mm diameter wirewas large. The standard deviation obtained by the extens-ometer was also large. The stroke increment and testingforce curve, the measured stroke obtained by the extens-ometer, and the testing force curve of the 0.042-mmdiameter wire are shown in Fig. 13. It is clear from thisfigure that the stroke measured by the extensometer andthe testing force curve were crooked. Image of the
gauge tape tilt during tensile testing is shown in Fig. 14at 0, 0.10, 0.41, and 0.74 mm of the stroke incrementfor the 0.042-mm diameter wire. In Fig. 14(a), the guideline of this wire was drawn at the wire, and white rectan-gles were drawn at the gauge tape to improve visibility.The crookedness seen in the curve is due to the tilt of thegauge tape during tensile testing.In the above paragraphs, the non-bending, non-slippage
at fastened part, and uniformity of elongation conditionswere verified, especially for the wire less than 0.1 mm.Furthermore, the validity of regarding the stroke incre-ment as the extension was demonstrated. Therefore, anominal stress and nominal strain curve could be drawnusing the stroke, as shown in Fig. 15. The maximum nom-inal stress increased with decreasing diameter since work
Fig. 12 Relationship between the diameter of the wire and uniformelongation. Uniform elongation was calculated using a video-typenon-contact extensometer and by cross-head stroke
Fig. 13 a Stroke increment and testing force curve and b measuredstroke obtained by extensometer-testing force curve of the 0.042-mmdiameter wire
Gondo et al. International Journal of Mechanical and Materials Engineering (2018) 13:5 Page 8 of 11
hardening of the drawn wire. This tendency was similar toresults reported by Zhang et al. (Zhang et al. 2011), Gotoet al. (Goto et al. 2007), and Fang et al. (Fang et al. 2015).It can be said that not only the tensile strength but alsothe elongation will be measured well with regarding thestroke increment as extension of the wire.Sample of SEM images of (a) the wire before tensile
testing and (b) the fractured piece after tensile testingare shown in Fig. 16. A straight line lA was drawn alongan outline of the wire on one side of the SEM image ofthe wire before tensile testing. The other straight line lBruns parallel to lA and was drawn along the outline onthe other side. The straight center line lC was drawndirectly between lines lA and lB. The distance between linelC and the outer lines lA and lB was considered to be the
radius of the wire r0. Figure 16(b) shows the fracturedpiece has a constricted portion when compared to theSEM image of the wire before tensile testing. A straightline lD was drawn along the outline of the wire on one sideof the SEM image of the fractured piece after tensile test-ing. The other straight line lE runs parallel to lD and wasdrawn along the wire outline on the other side. The range,the straight line fitted to the outline of the wire, can beconsidered to be the uniform deformation portion. Therange, the straight line which did not fit the outline of thewire, can be considered to be the local deformationportion. The straight center line lF was drawn directlybetween lD and lE. The distance between line lF and theouter lines lD and lE was considered to be the radius ofthe wire r1. The straight line lG runs parallel to lines lD,
Fig. 14 Image of the gauge tape tilts during tensile testing at a and b 0, c 0.10, d 0.41, and e 0.74 mm of the stroke increment for the 0.042 mmdiameter wire. The guide line of the wire was drawn at the wire and white rectangles were drawn at the gauge tapes in order to improvevisibility in a
Fig. 15 Nominal stress-nominal strain curve calculated by regardingthe stroke increment as extension
Fig. 16 Sample SEM images of drawn wire before tensile testingand broken portion after tensile testing (ϕ 0.137 mm)
Gondo et al. International Journal of Mechanical and Materials Engineering (2018) 13:5 Page 9 of 11
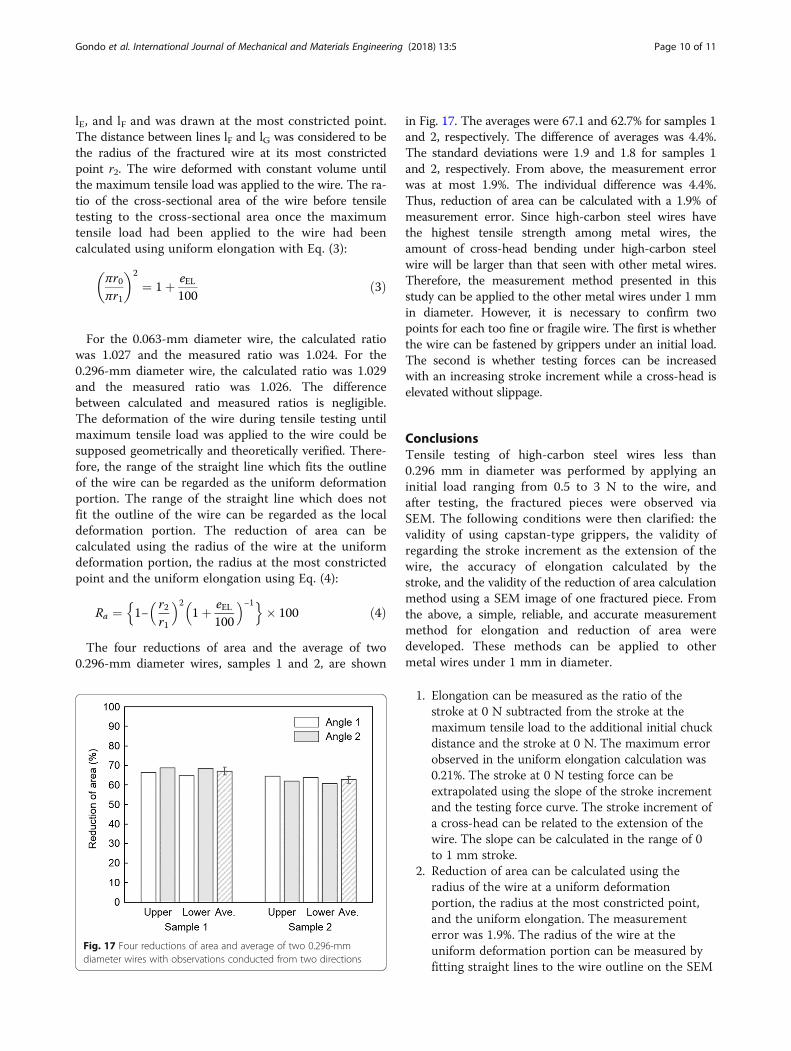
lE, and lF and was drawn at the most constricted point.The distance between lines lF and lG was considered to bethe radius of the fractured wire at its most constrictedpoint r2. The wire deformed with constant volume untilthe maximum tensile load was applied to the wire. The ra-tio of the cross-sectional area of the wire before tensiletesting to the cross-sectional area once the maximumtensile load had been applied to the wire had beencalculated using uniform elongation with Eq. (3):
πr0πr1
� �2
¼ 1þ eEL100
ð3Þ
For the 0.063-mm diameter wire, the calculated ratiowas 1.027 and the measured ratio was 1.024. For the0.296-mm diameter wire, the calculated ratio was 1.029and the measured ratio was 1.026. The differencebetween calculated and measured ratios is negligible.The deformation of the wire during tensile testing untilmaximum tensile load was applied to the wire could besupposed geometrically and theoretically verified. There-fore, the range of the straight line which fits the outlineof the wire can be regarded as the uniform deformationportion. The range of the straight line which does notfit the outline of the wire can be regarded as the localdeformation portion. The reduction of area can becalculated using the radius of the wire at the uniformdeformation portion, the radius at the most constrictedpoint and the uniform elongation using Eq. (4):
Ra ¼n1−
� r2r1
�2�1þ eEL
100
�−1o� 100 ð4Þ
The four reductions of area and the average of two0.296-mm diameter wires, samples 1 and 2, are shown
in Fig. 17. The averages were 67.1 and 62.7% for samples 1and 2, respectively. The difference of averages was 4.4%.The standard deviations were 1.9 and 1.8 for samples 1and 2, respectively. From above, the measurement errorwas at most 1.9%. The individual difference was 4.4%.Thus, reduction of area can be calculated with a 1.9% ofmeasurement error. Since high-carbon steel wires havethe highest tensile strength among metal wires, theamount of cross-head bending under high-carbon steelwire will be larger than that seen with other metal wires.Therefore, the measurement method presented in thisstudy can be applied to the other metal wires under 1 mmin diameter. However, it is necessary to confirm twopoints for each too fine or fragile wire. The first is whetherthe wire can be fastened by grippers under an initial load.The second is whether testing forces can be increasedwith an increasing stroke increment while a cross-head iselevated without slippage.
ConclusionsTensile testing of high-carbon steel wires less than0.296 mm in diameter was performed by applying aninitial load ranging from 0.5 to 3 N to the wire, andafter testing, the fractured pieces were observed viaSEM. The following conditions were then clarified: thevalidity of using capstan-type grippers, the validity ofregarding the stroke increment as the extension of thewire, the accuracy of elongation calculated by thestroke, and the validity of the reduction of area calculationmethod using a SEM image of one fractured piece. Fromthe above, a simple, reliable, and accurate measurementmethod for elongation and reduction of area weredeveloped. These methods can be applied to othermetal wires under 1 mm in diameter.
1. Elongation can be measured as the ratio of thestroke at 0 N subtracted from the stroke at themaximum tensile load to the additional initial chuckdistance and the stroke at 0 N. The maximum errorobserved in the uniform elongation calculation was0.21%. The stroke at 0 N testing force can beextrapolated using the slope of the stroke incrementand the testing force curve. The stroke increment ofa cross-head can be related to the extension of thewire. The slope can be calculated in the range of 0to 1 mm stroke.
2. Reduction of area can be calculated using theradius of the wire at a uniform deformationportion, the radius at the most constricted point,and the uniform elongation. The measurementerror was 1.9%. The radius of the wire at theuniform deformation portion can be measured byfitting straight lines to the wire outline on the SEM
Fig. 17 Four reductions of area and average of two 0.296-mmdiameter wires with observations conducted from two directions
Gondo et al. International Journal of Mechanical and Materials Engineering (2018) 13:5 Page 10 of 11
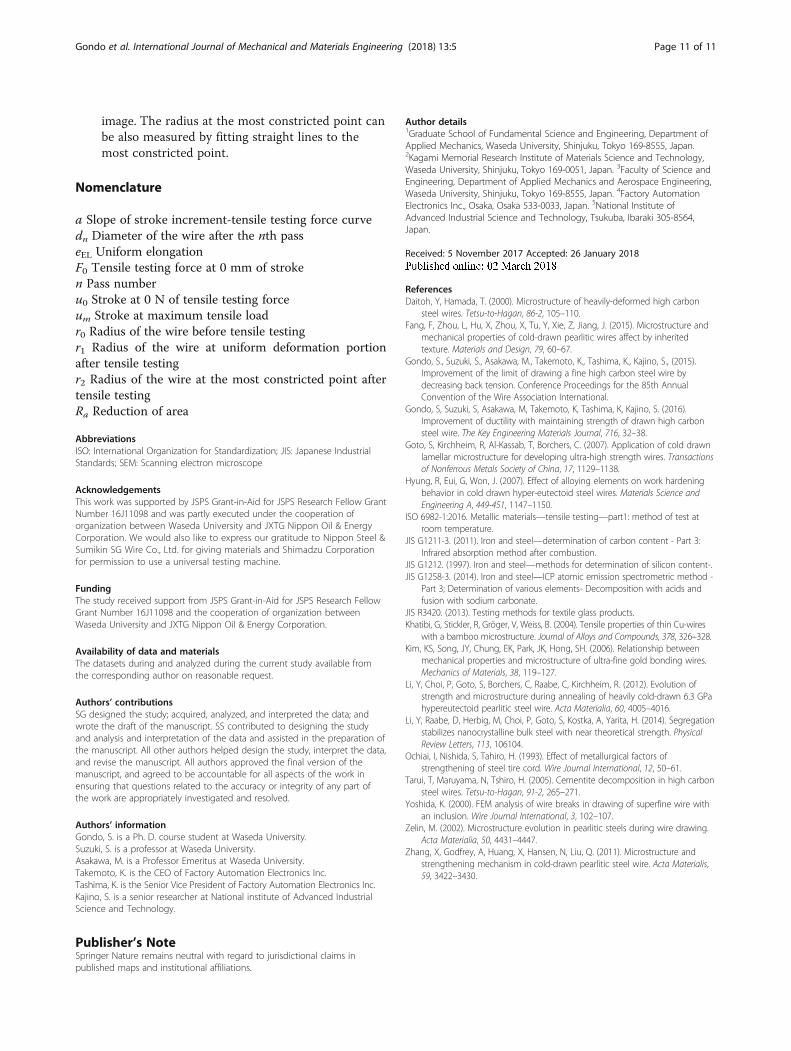
image. The radius at the most constricted point canbe also measured by fitting straight lines to themost constricted point.
Nomenclature
a Slope of stroke increment-tensile testing force curvedn Diameter of the wire after the nth passeEL Uniform elongationF0 Tensile testing force at 0 mm of stroken Pass numberu0 Stroke at 0 N of tensile testing forceum Stroke at maximum tensile loadr0 Radius of the wire before tensile testingr1 Radius of the wire at uniform deformation portionafter tensile testingr2 Radius of the wire at the most constricted point aftertensile testingRa Reduction of area
AbbreviationsISO: International Organization for Standardization; JIS: Japanese IndustrialStandards; SEM: Scanning electron microscope
AcknowledgementsThis work was supported by JSPS Grant-in-Aid for JSPS Research Fellow GrantNumber 16J11098 and was partly executed under the cooperation oforganization between Waseda University and JXTG Nippon Oil & EnergyCorporation. We would also like to express our gratitude to Nippon Steel &Sumikin SG Wire Co., Ltd. for giving materials and Shimadzu Corporationfor permission to use a universal testing machine.
FundingThe study received support from JSPS Grant-in-Aid for JSPS Research FellowGrant Number 16J11098 and the cooperation of organization betweenWaseda University and JXTG Nippon Oil & Energy Corporation.
Availability of data and materialsThe datasets during and analyzed during the current study available fromthe corresponding author on reasonable request.
Authors’ contributionsSG designed the study; acquired, analyzed, and interpreted the data; andwrote the draft of the manuscript. SS contributed to designing the studyand analysis and interpretation of the data and assisted in the preparation ofthe manuscript. All other authors helped design the study, interpret the data,and revise the manuscript. All authors approved the final version of themanuscript, and agreed to be accountable for all aspects of the work inensuring that questions related to the accuracy or integrity of any part ofthe work are appropriately investigated and resolved.
Authors’ informationGondo, S. is a Ph. D. course student at Waseda University.Suzuki, S. is a professor at Waseda University.Asakawa, M. is a Professor Emeritus at Waseda University.Takemoto, K. is the CEO of Factory Automation Electronics Inc.Tashima, K. is the Senior Vice President of Factory Automation Electronics Inc.Kajino, S. is a senior researcher at National institute of Advanced IndustrialScience and Technology.
Publisher’s NoteSpringer Nature remains neutral with regard to jurisdictional claims inpublished maps and institutional affiliations.
Author details1Graduate School of Fundamental Science and Engineering, Department ofApplied Mechanics, Waseda University, Shinjuku, Tokyo 169-8555, Japan.2Kagami Memorial Research Institute of Materials Science and Technology,Waseda University, Shinjuku, Tokyo 169-0051, Japan. 3Faculty of Science andEngineering, Department of Applied Mechanics and Aerospace Engineering,Waseda University, Shinjuku, Tokyo 169-8555, Japan. 4Factory AutomationElectronics Inc., Osaka, Osaka 533-0033, Japan. 5National Institute ofAdvanced Industrial Science and Technology, Tsukuba, Ibaraki 305-8564,Japan.
Received: 5 November 2017 Accepted: 26 January 2018
ReferencesDaitoh, Y, Hamada, T. (2000). Microstructure of heavily-deformed high carbon
steel wires. Tetsu-to-Hagan, 86-2, 105–110.Fang, F, Zhou, L, Hu, X, Zhou, X, Tu, Y, Xie, Z, Jiang, J. (2015). Microstructure and
mechanical properties of cold-drawn pearlitic wires affect by inheritedtexture. Materials and Design, 79, 60–67.
Gondo, S., Suzuki, S., Asakawa, M., Takemoto, K., Tashima, K., Kajino, S., (2015).Improvement of the limit of drawing a fine high carbon steel wire bydecreasing back tension. Conference Proceedings for the 85th AnnualConvention of the Wire Association International.
Gondo, S, Suzuki, S, Asakawa, M, Takemoto, K, Tashima, K, Kajino, S. (2016).Improvement of ductility with maintaining strength of drawn high carbonsteel wire. The Key Engineering Materials Journal, 716, 32–38.
Goto, S, Kirchheim, R, Al-Kassab, T, Borchers, C. (2007). Application of cold drawnlamellar microstructure for developing ultra-high strength wires. Transactionsof Nonferrous Metals Society of China, 17, 1129–1138.
Hyung, R, Eui, G, Won, J. (2007). Effect of alloying elements on work hardeningbehavior in cold drawn hyper-eutectoid steel wires. Materials Science andEngineering A, 449-451, 1147–1150.
ISO 6982-1:2016. Metallic materials—tensile testing—part1: method of test atroom temperature.
JIS G1211-3. (2011). Iron and steel—determination of carbon content - Part 3:Infrared absorption method after combustion.
JIS G1212. (1997). Iron and steel—methods for determination of silicon content-.JIS G1258-3. (2014). Iron and steel—ICP atomic emission spectrometric method -
Part 3; Determination of various elements- Decomposition with acids andfusion with sodium carbonate.
JIS R3420. (2013). Testing methods for textile glass products.Khatibi, G, Stickler, R, Gröger, V, Weiss, B. (2004). Tensile properties of thin Cu-wires
with a bamboo microstructure. Journal of Alloys and Compounds, 378, 326–328.Kim, KS, Song, JY, Chung, EK, Park, JK, Hong, SH. (2006). Relationship between
mechanical properties and microstructure of ultra-fine gold bonding wires.Mechanics of Materials, 38, 119–127.
Li, Y, Choi, P, Goto, S, Borchers, C, Raabe, C, Kirchheim, R. (2012). Evolution ofstrength and microstructure during annealing of heavily cold-drawn 6.3 GPahypereutectoid pearlitic steel wire. Acta Materialia, 60, 4005–4016.
Li, Y, Raabe, D, Herbig, M, Choi, P, Goto, S, Kostka, A, Yarita, H. (2014). Segregationstabilizes nanocrystalline bulk steel with near theoretical strength. PhysicalReview Letters, 113, 106104.
Ochiai, I, Nishida, S, Tahiro, H. (1993). Effect of metallurgical factors ofstrengthening of steel tire cord. Wire Journal International, 12, 50–61.
Tarui, T, Maruyama, N, Tshiro, H. (2005). Cementite decomposition in high carbonsteel wires. Tetsu-to-Hagan, 91-2, 265–271.
Yoshida, K. (2000). FEM analysis of wire breaks in drawing of superfine wire withan inclusion. Wire Journal International, 3, 102–107.
Zelin, M. (2002). Microstructure evolution in pearlitic steels during wire drawing.Acta Materialia, 50, 4431–4447.
Zhang, X, Godfrey, A, Huang, X, Hansen, N, Liu, Q. (2011). Microstructure andstrengthening mechanism in cold-drawn pearlitic steel wire. Acta Materialis,59, 3422–3430.
Gondo et al. International Journal of Mechanical and Materials Engineering (2018) 13:5 Page 11 of 11