essential question: why is a knowledge of basic statistics helpful in real-world situations?
TRANSCRIPT

Essential Question: Why is a knowledge of basic statistics helpful in real-world situations?

Population: The set of all people who can be chosen
Sample: The set of people from the population who were actually chosen
Example: Identify the population and the sample There are three schedule options for classes at a high school:
90-minute classes every other day for a year, 90-minute classes every day for a semester or 45-minute classes every day for a year. Out of 1200 students, 50 students from each grade level are chosen at random and asked their preference.
▪ Population:▪ Sample:
1200 students50 students • 4 grades = 200 students

Types of Data Qualitative – categorical Quantitative – numerical▪ Discrete – incremental▪ Continuous – no minimum difference
Example 1 The height of each player on a basketball team▪
The style of shoes worn by each student in a class▪
The number of people in each household in the US▪
Quantitative - continuousQualitative
Quantitative - discrete
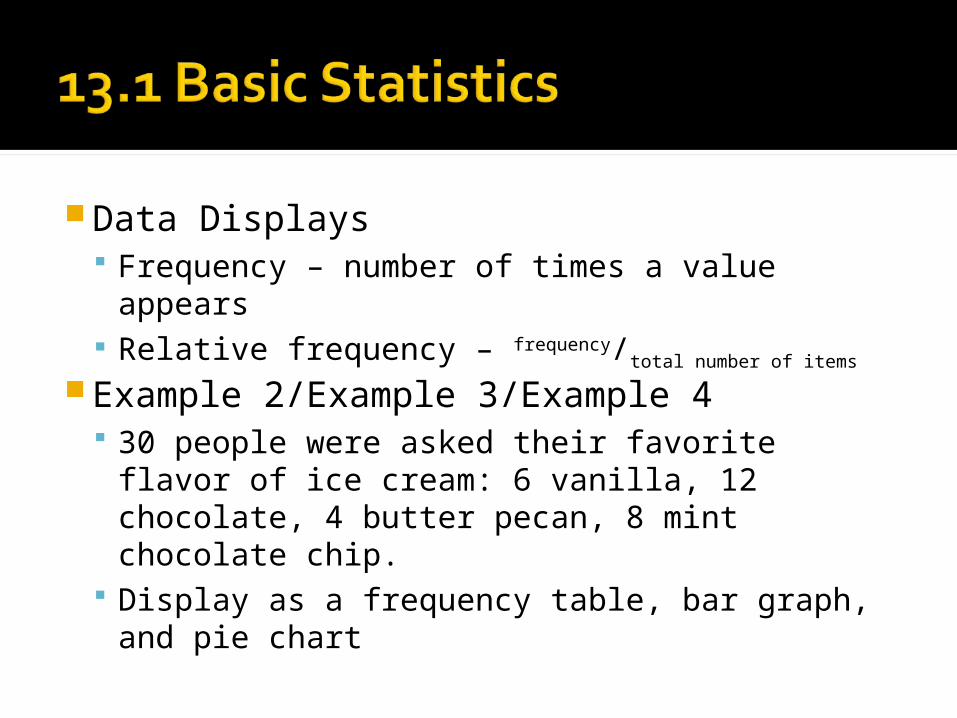
Data Displays Frequency – number of times a value
appears Relative frequency – frequency/total number of items
Example 2/Example 3/Example 4 30 people were asked their favorite flavor
of ice cream: 6 vanilla, 12 chocolate, 4 butter pecan, 8 mint chocolate chip.
Display as a frequency table, bar graph, and pie chart

Flavor Frequency Relative Frequency
Vanilla 6 6/30 = 0.2 = 20%
Chocolate 12 12/30 = 0.4 = 40%
Butter pecan 4 4/30 ≈ 0.13 ≈ 13%
Mint chocolate chip 8 8/30 ≈ 0.27 ≈27%

Pie Chart Each relative frequency takes a portion
of 360˚▪ Vanilla: 0.2 ∙ 360˚ = 72˚▪ Chocolate: 0.4 ∙ 360˚ = 144˚▪ Butter pecan : 0.13 ∙ 360˚ ≈ 47˚▪ Mint chocolate chip: 0.27 ∙ 360˚ ≈ 97˚
Chocolate
40%
Vanilla20%
Butter Pecan13%
Mint Chocolate
Chip27%

Displaying Quantitative Data Curve types▪ Uniform – all values have approximately same
frequency▪ Symmetric – right and left sides are mirror images▪ Skewed right – right side lower than the left side▪ Skewed left – left side lower than the right side
Skewed means “screwed” Outlier – data far removed from the rest.▪ Usually the culprit in skewed data

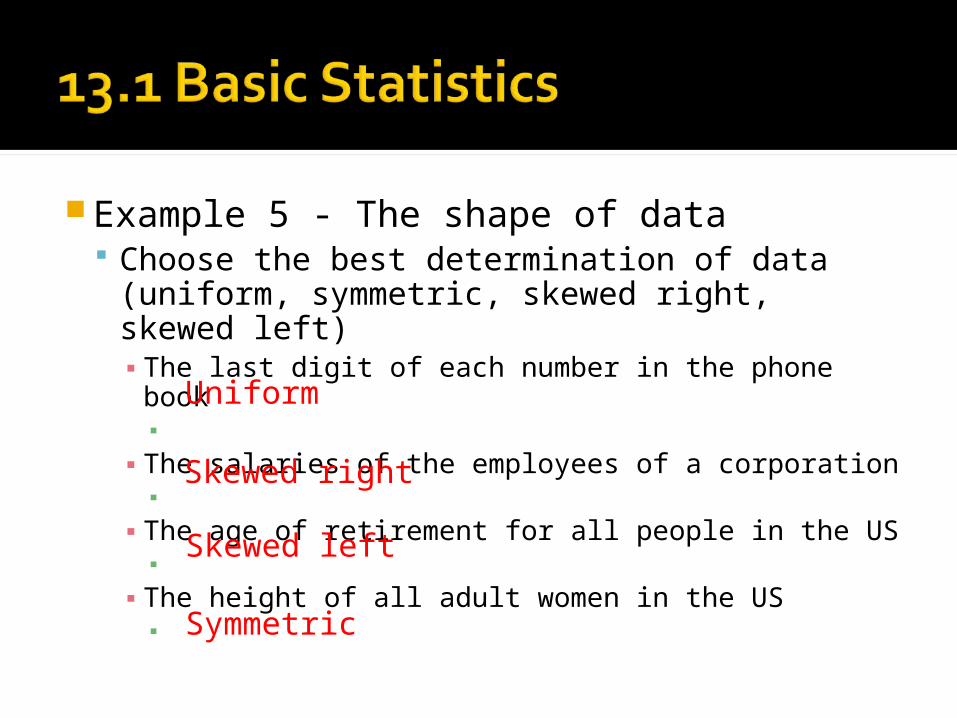
Example 5 - The shape of data Choose the best determination of data
(uniform, symmetric, skewed right, skewed left)▪ The last digit of each number in the phone book▪
▪ The salaries of the employees of a corporation▪
▪ The age of retirement for all people in the US▪
▪ The height of all adult women in the US▪
Uniform
Skewed right
Skewed left
Symmetric

Stem Plot Choose leading digit(s) as stems Arrange stems vertically Last digit is the leaf Provide a key

31 test scores on an exam 32, 67, 89, 90, 87, 72, 75, 88, 95, 83, 97, 72,
85, 93, 79, 63, 70, 87, 74, 86, 98, 100, 97, 85, 77, 88, 92, 94, 81, 76, 64
3 2
4
5
6 3 4 7
7 0 2 2 4 5 6 7 9
8 1 3 5 5 6 7 7 8 8 9
9 0 2 3 4 5 7 7 8
10
0
3|2 = 32
Assignment Page 851 Problems:▪ 1 – 9 (all)▪ 11, 15▪ 19 – 24 (all)