essays on the real effects of tax reforms
TRANSCRIPT

Essays on the
Real Effects of Tax Reforms
Dissertation
zur Erlangung des Doktorgrades
der Wirtschaftswissenschaftlichen Fakultät
der Georg-August-Universität Göttingen
vorgelegt von
Lisa Hillmann
geboren in Mühlhausen
Göttingen, 2020

II
Betreuungsausschuss:
Erstbetreuer: Prof. Dr. Andreas Oestreicher (Erstprüfer)
Weitere Betreuer: Prof. Dr. Olaf Korn (Zweitprüfer)
Prof. Dr. Robert Schwager (Drittprüfer)
Tag der mündlichen Prüfung: 15.12.2020

Table of Contents
III
Table of Contents
Page
Table of Contents ................................................................................................................. III
List of Figures ....................................................................................................................... VI
List of Tables ....................................................................................................................... VII
List of Figures and Tables in the Appendices .................................................................... IX
1. Introduction ..................................................................................................................... 1
1.1 Context and objectives of the thesis ........................................................................ 1
1.2 Structure and content of the thesis ........................................................................... 5
2. Private Firm and Shareholder Response to Dividend Taxation: Evidence from the
Taxation of Corporate Minority Shareholders ............................................................ 9
2.1 Introduction ............................................................................................................ 10
2.2 Taxation of dividends received by corporate shareholders in Germany ............... 14
2.3 Empirical predictions ............................................................................................. 18
2.3.1 Dividend taxation and dividend policy ...................................................... 18
2.3.2 Dividend taxation and shareholder response ............................................. 19
2.4 Research design and data ....................................................................................... 22
2.4.1 Estimation strategy ..................................................................................... 22
2.4.2 Data and sample overview ......................................................................... 25
2.4.3 Parallel trends ............................................................................................. 29
2.5 Main results ............................................................................................................ 30
2.5.1 Dividend payout ......................................................................................... 30
2.5.2 Corporate shareholder’s minority stake ..................................................... 32
2.5.3 Heterogeneity in the dividend tax response of shareholders ...................... 36
2.6 Additional analyses ................................................................................................ 39
2.6.1 Indirect effects of the dividend tax reform ................................................. 39
2.6.2 Matching .................................................................................................... 42
2.6.3 Placebo tests ............................................................................................... 44
2.6.4 Alternative dividend tax responses of shareholders ................................... 46
2.7 Conclusion ............................................................................................................. 48
2.8 Appendix ................................................................................................................ 50
Appendix 2.A: Alternative explanation for firms’ payout decisions ..................... 50

Table of Contents
IV
Appendix 2.B: Simultaneous equations approach ................................................. 53
Appendix 2.C: Alternative control group .............................................................. 55
Appendix 2.D: Additional tables ........................................................................... 63
3. Tax Depreciation and Investment Decisions: Evidence from the Leasing Sector ... 73
3.1 Introduction ............................................................................................................ 74
3.2 Institutional background and empirical predictions ............................................... 78
3.2.1 Literature review ........................................................................................ 78
3.2.2 Tax depreciation rules and regulatory requirements for leasing companies in
Germany ..................................................................................................... 80
3.2.3 Hypothesis .................................................................................................. 85
3.3 Research design and data ....................................................................................... 86
3.3.1 Estimation strategy ..................................................................................... 86
3.3.2 Data and sample overview ......................................................................... 89
3.4 The effect of tax depreciation on firms’ investment behaviour ............................. 91
3.4.1 Main results ................................................................................................ 91
3.4.2 Placebo tests ............................................................................................... 96
3.5 Heterogeneity in investment effects ...................................................................... 98
3.5.1 Firm-level variation in the exposure to regulatory requirements ............... 98
3.5.2 Firm-level variation in business models .................................................. 101
3.6 Conclusion ........................................................................................................... 105
3.7 Appendix .............................................................................................................. 107
Appendix 3.A: Value of the change in depreciation allowances ......................... 107
Appendix 3.B: Additional tables ......................................................................... 108
4. The Effect of Public Country-by-Country Reporting on Real Activities of EU Banks
....................................................................................................................................... 119
4.1 Introduction .......................................................................................................... 120
4.2 Country-by-country reporting under the EU Capital Requirements Directive IV
............................................................................................................................. 124
4.3 Related literature and hypotheses ........................................................................ 126
4.3.1 Literature review ...................................................................................... 126
4.3.2 Empirical predictions ............................................................................... 128
4.4 Research design and data ..................................................................................... 131
4.4.1 Estimation strategy ................................................................................... 131
4.4.2 Data and sample overview ....................................................................... 133

Table of Contents
V
4.5 Main results .......................................................................................................... 136
4.5.1 Banks’ tax avoidance behaviour .............................................................. 136
4.5.2 Banks’ economic activities ...................................................................... 138
4.5.3 Cross-sectional variation in the average treatment effect ........................ 142
4.6 Additional analyses .............................................................................................. 147
4.6.1 Matching .................................................................................................. 147
4.6.2 Parallel trend assumption ......................................................................... 148
4.6.3 Treatment and reform variation ............................................................... 150
4.7 Conclusion ........................................................................................................... 153
4.8 Appendix .............................................................................................................. 156
Appendix 4.A: Theoretical framework ................................................................ 156
Appendix 4.B: Additional tables ......................................................................... 157
5. Conclusion .................................................................................................................... 165
5.1 Summary of the results and contributions ........................................................... 165
5.2 Main limitations ................................................................................................... 167
5.3 Future research ..................................................................................................... 168
6. References .................................................................................................................... 171
7. Declaration of own contribution ................................................................................ 186
8. Declaration for admission to the doctoral examination ........................................... 187

List of Figures
VI
List of Figures
Page
- Chapter 1 -
Figure 1.1: Context of the thesis ............................................................................................ 2
Figure 1.2: Structure of the thesis .......................................................................................... 7
- Chapter 2 -
Figure 2.1: Parallel trends .................................................................................................... 30
Figure 2.2: Graphic illustration of ownership stakes over time........................................... 41
- Chapter 3 -
Figure 3.1: Graphic illustration of investments over time ................................................... 92
Figure 3.2: Treatment effects over time .............................................................................. 98
- Chapter 4 -
Figure 4.1: Treatment effects over time ............................................................................ 149

List of Tables
VII
List of Tables
Page
- Chapter 2 -
Table 2.1: Dividend tax burden of a corporate shareholder for the years 2010-2015 ........ 17
Table 2.2: Sample description ............................................................................................ 27
Table 2.3: Sample statistics ................................................................................................ 28
Table 2.4: Effect of dividend taxation on payout ............................................................... 31
Table 2.5: Effect of dividend taxation on corporate shareholders’ ownership stakes ........ 34
Table 2.6: Effect of dividend taxation on corporate ownership stakes – cross-sectional
findings .............................................................................................................. 37
Table 2.7: Indirect effects of the dividend tax reform ........................................................ 40
Table 2.8: Entropy balancing ............................................................................................. 43
Table 2.9: Placebo analysis ................................................................................................ 45
Table 2.10: Yearly treatment effects .................................................................................... 46
- Chapter 3 -
Table 3.1: Sample description ............................................................................................ 90
Table 3.2: Univariate time difference analysis ................................................................... 93
Table 3.3: Effect of tax depreciation on investment .......................................................... 94
Table 3.4: Effect of tax depreciation on investment – alternative dependent variables ..... 96
Table 3.5: Placebo treatment tests ...................................................................................... 97
Table 3.6: Cross-sectional findings – exposure to regulatory requirements ...................... 99
Table 3.7: Cross-sectional findings – product portfolio ................................................... 103
Table 3.8: Cross-sectional findings – manufacturer ownership ....................................... 104
- Chapter 4 -
Table 4.1: Sample description .......................................................................................... 134
Table 4.2: Summary statistics .......................................................................................... 135
Table 4.3: Effect of CbCR on banks’ tax avoidance ........................................................ 137
Table 4.4: Effect of CbCR on banks’ real economic activities ........................................ 139
Table 4.5: Alternative dependent variables ...................................................................... 141

List of Tables
VIII
Table 4.6: Cross-sectional findings – detection risk ........................................................ 144
Table 4.7: Cross-sectional findings – reputational risk .................................................... 146
Table 4.8: Entropy balancing ........................................................................................... 148
Table 4.9: Yearly treatment effects .................................................................................. 150
Table 4.10: Treatment date variation ................................................................................. 151
Table 4.11: Placebo treatment ............................................................................................ 152

List of Figures and Tables in the Appendices
IX
List of Figures and Tables in the Appendices
Page
- Chapter 2, Appendix 2.A -
Table 2.A1: Effect of dividend taxation on payout – cross-sectional findings ................... 51
- Chapter 2, Appendix 2.B -
Table 2.B1: Effect of dividend taxation – OLS and SEM .................................................. 54
- Chapter 2, Appendix 2.C -
Figure 2.C1: Parallel trends with alternative control group ................................................. 58
Table 2.C1: Sample description and summary statistics with alternative control group ... 56
Table 2.C2: Effect of dividend taxation on payout – alternative control group ................. 59
Table 2.C3: Effect of dividend taxation on ownership stakes – alternative control group 60
Table 2.C4: Cross-sectional tests – alternative control group ............................................ 62
- Chapter 2, Appendix 2.D -
Table 2.D1: Sample selection ............................................................................................. 63
Table 2.D2: Effect of dividend taxation – alternative identification strategy .................... 64
Table 2.D3: Variable definitions ........................................................................................ 65
Table 2.D4: Effect of dividend taxation – balanced sample ............................................... 66
Table 2.D5: Summary statistics over the period 2010-2012 .............................................. 67
Table 2.D6: Cross-sectional tests – ownership stake in the pre-reform period .................. 68
Table 2.D7: Effect of dividend taxation – fully interacted regression models ................... 69
Table 2.D8: Effect of dividend taxation on corporate shareholdings – control group split 70
Table 2.D9: Cross-sectional tests – complete sale of minority stakes after the reform ...... 71
Table 2.D10: Cross-sectional findings of shareholders’ dividend tax response – matched
sample ............................................................................................................. 72
- Chapter 3, Appendix 3.B -
Table 3.B1: Simplified example of tax depreciation methods ......................................... 108
Table 3.B2: Robustness tests – alternative dependent variable ........................................ 109

List of Figures and Tables in the Appendices
X
Table 3.B3: Variable definitions ...................................................................................... 110
Table 3.B4: Sample selection ........................................................................................... 111
Table 3.B5: Alternative regression specification – balanced sample ............................... 112
Table 3.B6: Alternative regression specification – winsorising ....................................... 113
Table 3.B7: Sample statistics over the period 2011-2013 ................................................ 114
Table 3.B8: Entropy balancing ......................................................................................... 115
Table 3.B9: Cross-sectional findings – legal form ........................................................... 116
Table 3.B10: Cross-sectional findings – exposure to regulatory requirements, matched
sample ........................................................................................................... 117
Table 3.B11: Cross-sectional findings – loss situation ....................................................... 118
- Chapter 4, Appendix 4.B -
Table 4.B1: Alternative regression specifications – standard errors ................................ 157
Table 4.B2: Variable definitions ...................................................................................... 158
Table 4.B3: Sample selection ........................................................................................... 159
Table 4.B4: Alternative regression specifications – without treated observations from FR
and UK .......................................................................................................... 160
Table 4.B5: Alternative regression specifications – without cooperative banks .............. 161
Table 4.B6: Alternative regression specifications – winsorising ..................................... 162
Table 4.B7: Effect of CbCR on banks’ economic activities – detailed earning assets ..... 163
Table 4.B8: Cross-sectional findings on detailed earning assets – presence in tax haven
country .......................................................................................................... 164

Introduction
1
“A good way to do econometrics
is a look for good natural experiments
and use statistical methods that can
tidy up the confounding factors that
nature has not controlled for us.”1
1. Introduction
1.1 Context and objectives of the thesis
Policymakers frequently use tax reforms to influence the decisions of companies.2 In
particular, tax reforms are popular policy tools during economic downturns. For example,
when introducing the US dividend tax cut in 2003 as part of the Jobs and Growth Tax Relief
Reconciliation Act of 2003 (JGTRRA), the former US President Georg W. Bush stated that
dividend taxation may “distort corporate dividend payout policy [as well as the financing] and
investment decisions of firms”.3 During the economic crisis caused by the Coronavirus
pandemic, the German legislative bodies passed the Coronavirus Tax Assistance Act in June
2020, which contained among other things “accelerated depreciation options [for movable
assets] that will boost incentives for investment”.4 The major objective of these reforms is the
promotion of corporate investments, which are expected to be a key driver to foster economic
growth (e.g., Keynes, 1936; De Long and Summers, 1991).
Besides the predominant objective to promote investment, tax reforms also aim at meeting
social goals. For example, when introducing the Country-by-Country Reporting (CbCR) as
part of the EU Capital Requirements Directive in 2013, the European Commission argued that
“[i]ncreased transparency regarding the activities of [financial] institutions, and in particular
regarding profits made, taxes paid and subsidies received, is essential for regaining the trust
of citizens of the Union in the financial sector. Mandatory reporting in that area can therefore
be seen as an important element of the corporate responsibility of institutions towards
stakeholders and society” (EU, 2013a, Recital 52). In addition to tax reforms having an
economic or social goal, some changes in the taxation result from requirements imposed by
1 Quote by Daniel McFadden (co-winner of the 2000 Nobel Memorial Prize in Economic Sciences). 2 This thesis focuses on corporate decisions because, on the one hand, corporate investment promotes economic
growth and employment (e.g., Keynes, 1936). On the other hand, sufficient data on companies is available to
examine tax reforms. 3 Economic Report of the President, February 2003, p. 203. 4 See, https://www.bundesfinanzministerium.de/Content/EN/Standardartikel/Topics/Public-Finances/Articles/
2020-06-04-fiscal-package.html.

Introduction
2
administrative orders or case law, for example in response to rulings of the European Court of
Justice.5
However, most of the tax reforms described above are based on the assumption that taxes play
a significant role in the decision-making process of companies. It is the task of empirical tax
research to examine this underlying assumption and analyse the outcome of tax reforms. In
this context, empirical studies can reveal intended but also unintended economic consequences
of changes in taxation, which is particularly important for assessing tax reforms that do not
have any economic or social objective.
Therefore, the overall objective of this thesis is to examine the real effects of tax reforms (see
Figure 1.1). Following Leuz and Wysocki (2016, p. 530), real effects are defined “as situations
in which the [company] changes its behaviour in the real economy (e.g., investment) as a result
of the [tax reform]”.6 Consequently, this thesis addresses the motivating question: Do tax
reforms affect corporate behaviour in the real economy?
Figure 1.1: Context of the thesis
5 Besides the listed reasons for tax reforms, there are other reasons such as simplification of the tax law, increasing
tax justice and tax revenues etc. However, this thesis only distinguishes between tax reforms with a political or
social goal and tax reforms resulting from requirements of administrative orders or case law. 6 In general, a distinction is made between “real effects” and “capital-market effects”. The latter represent capital
market outcomes that address the behaviour of capital market participants, such as financial analysts, based on
information disclosed by entities (Leuz and Wysocki, 2016). Examples for capital market effects in tax research:
book-tax differences and earnings forecasts (e.g., Lev and Nissim, 2004; Hanlon, 2005), earnings management
and tax accounts (e.g., Dhaliwal et al., 2004; Krull, 2004), and transparency (e.g., Chen et al., 2018a;
Balakrishnan et al., 2019).
Essays on the
REAL EFFECTS OF TAX REFORMS
Do tax reforms affect corporate behaviour in the real economy?
ONE MOTIVATING QUESTION
Tax Rate
THREE REFORM SETTINGS
Tax Base Tax Transparency
STUDY 1 STUDY 2 STUDY 3
Private Firm and Shareholder
Response to Dividend Taxation:
Evidence from the Taxation of
Corporate Minority
Shareholders
Tax Depreciation and
Investment Decisions: Evidence
from the Leasing Sector
(co-authored with
Andreas Oestreicher)
The Effect of Public Country-by-
Country Reporting on Real
Activities of EU Banks
Introduction
3
Examining real effects of changes in the tax policy has already been an important stream in
the empirical tax research over the past decades (for an overview, e.g., Hanlon and Heitzman,
2010; Bruehne and Jacob, 2019). Since taxes reduce firms’ after-tax cash flows and thereby
influence the cost of capital, theoretical literature predicts that tax reforms affect corporate
decisions (e.g., Hall and Jorgenson, 1967; Poterba and Summers, 1985; Auerbach, 2002). A
large body of the empirical literature provides evidence on the effect of corporate taxes on
various decisions of companies, such as investment decisions (e.g., Patel et al., 2017; Giroud
and Rauh, 2019), financing decisions (e.g., Desai et al., 2004; Huizinga et al., 2008), location
decisions (e.g., Buettner and Ruf, 2007, Barrios et al., 2012), and employment (e.g.,
Ljungqvist and Smolyansky, 2018).
In addition, empirical studies provide evidence that other types of taxes, such as shareholder
taxes and consumption taxes, affect corporate investment decisions (e.g., Becker et al., 2013;
Jacob et al., 2019) while shareholders taxes also impact dividend payouts (e.g., Blouin et al.,
2011; Jacob and Michaely, 2017). Further, changes in tax base elements, such as thin
capitalisation rules (e.g., Overesch and Wamser, 2010; Buettner et al., 2012), loss offset
restrictions (e.g., Dreßler and Overesch, 2013; Bethmann et al., 2018) and tax depreciation
allowances (e.g., Zwick and Mahon, 2017; Maffini et al., 2019), also have an effect on
corporate decisions. Finally, the disclosure of tax information can create real effects (e.g.,
Dyreng et al., 2016; De Simone and Olbert, 2020).
Overall, the underlying goal of empirical tax researchers is to draw causal inference from
changes in taxation (e.g., Gow et al., 2016). Tax reforms can provide settings that serve as
“natural experiments” and “exogenous shocks” and thus can be examined by using quasi-
experimental methods, such as a differences-in-differences approach (e.g., Angrist and
Pischke, 2009). Given that the assumptions of quasi-experimental research designs are
fulfilled, these methods generate credible estimates of causal effects (e.g. Gow et al., 2016).
These econometric approaches are all the more important as policymakers and researchers are
interested in the causal effects of tax reforms in order to evaluate them. Therefore, this thesis
examines three tax reforms that represent “exogenous shocks”. By applying a quasi-
experimental method, this thesis identifies the causal effects of taxation on corporate
decisions.7
7 However, it should be noted that the identification of purely causal effects is challenging, as assumptions of
quasi-experimental research designs are very strict and hardly ever fulfilled in reality (see Section 5.2).
Nevertheless, many approaches are applied in the three studies to address potential concerns about a wrong
identification of causal effects.

Introduction
4
The three tax reforms examined in this thesis address three different features of taxation
(Figure 1.1): (1) change in the tax rate, (2) change in the tax base, and (3) change in the
disclosure requirements of tax information. To be more precise, the first study of this thesis
examines the effect of a dividend tax reform on the payout decision of private firms and
portfolio decision of their shareholders. The second study provides evidence on the investment
response of finance lease firms to a change in tax depreciation allowances. The third and final
study investigates the reaction of financial institutions to the disclosure of tax information. By
examining tax reforms that address different features of taxation, it is possible to get a more
comprehensive impression on the real effects caused by tax reforms. This is important as
policymakers frequently initiate reforms on the three characteristics of taxation described
above. Moreover, the first two tax reforms mentioned above allow for the study of potential
unintended consequences resulting from tax reforms that have no economic or social goal.
However, the third tax reform pursues a social goal so that intended and unintended outcomes
can be examined.8
This thesis contributes to the literature in four ways. First, it sheds more light on the real effects
of tax reforms and thereby answers the call for research on real effects of taxation (e.g., Hanlon
and Heitzman, 2010; Dyreng and Maydew, 2018; Bruehne and Jacob, 2019). It adds to the
literature by providing additional evidence that companies alter their decisions when they face
changes in the tax rate (e.g., Jacob and Michaely, 2017), tax base (e.g., Ohrn, 2019) or
disclosure of tax information (e.g., Eberhartinger et al., 2020). Exploiting tax reforms with
quasi-experimental research designs increases the credibility that the results are causal effects
of tax reforms.
Second, the thesis examines intended and unintended consequences of tax reforms. On the one
hand, it is important for politicians to know whether the goal of the tax reform has been
achieved. On the other hand, policymakers also need to be informed about unintended
economic consequences of tax reforms. This is particularly the case if the reform does not
pursue an economic objective. However, prior literature on unintended consequences of
reforms is scarce so far (e.g., Bethmann et al., 2018; Rauter, 2020).
Third, the contribution of the thesis is also based on the identification of heterogeneity in the
reaction of companies to changes in the taxation (e.g., Zwick and Mahon, 2017; Jacob and
Michaely, 2017; Jacob et al., 2019). Examining cross-sectional variation in the response of
companies to tax reforms informs policymakers and researchers about characteristics that
8 The individual chapters provide more information on the purposes of the tax reforms (Chapter 2 to Chapter 4).

Introduction
5
moderate firm decisions. This knowledge is important to evaluate the consequences of tax
reforms.
Finally, the three studies capture the reactions of certain types of companies that have not been
the focus of the empirical tax research so far. Prior literature predominantly examined the
effect of taxes on publicly listed firms and their shareholders (e.g., Blouin et al., 2011; Desai
and Jin, 2011). The thesis contributes to the limited literature on the response of private firms
and their shareholders to changes in taxes (e.g., Michaely and Roberts, 2011; Berzins et al.,
2018). Further, prior literature often excluded financial institutions from their analyses (e.g.,
Giroud and Rauh, 2019). However, this thesis extends the prior literature by investigating the
reaction of finance lease firms and other financial institutions to tax reforms and thereby
answers the call for research on taxation and financial institutions (e.g., Hanlon and Heitzman,
2010).
1.2 Structure and content of the thesis
As outlined in Figure 1.2, the thesis is structured as follows. Chapter 2 to Chapter 4 present
the three empirical studies on the real effects of tax reforms. The final chapter concludes
(Chapter 5).
Chapter 2: Private Firm and Shareholder Response to Dividend Taxation: Evidence from the
Taxation of Corporate Minority Shareholders
The first study examines whether a dividend tax increase, which only affects corporate
shareholders owning a minority stake, has an effect on private firms’ payout decisions and on
minority shareholders’ portfolio choices. The study exploits a German dividend tax reform in
2013, which significantly increased the taxation of dividends received by German corporate
shareholders owning a stake of less than 10% in a dividend-paying German corporation.
Examining this plausible exogenous shock with my comprehensive and hand-collected data
on the ownership structure of private firms in Germany for the period 2010 to 2015 reveals
the following results. First, firms do not change their payout decisions if a dividend tax reform
affects only a particular group of shareholders without significant voting power. This result is
in line with prior literature, which shows that agency issues and shareholder conflicts mitigate
the dividend tax responsiveness of private firms in particular. Second, corporate shareholders
significantly reduce their minority stakes, confirming the prediction that they are incentivised
to rebalance their portfolios if they cannot influence the firm’s dividend payout decision.

Introduction
6
Additional cross-sectional tests reveal that the reduction in corporate shareholders’ minority
stakes is larger for those invested in firms with high dividend payouts and a majority
shareholder. The dividend tax responsiveness is also larger for financially distressed corporate
shareholders with a minority stake that do not belong to the same group as the firm in which
they own a minority stake. The findings contribute to the very limited literature on the effects
of dividend taxes on the payout decisions of private firms and the portfolio decisions of their
shareholders. In addition, the study enriches the literature on the characteristics that affect the
dividend tax responsiveness of shareholders. Furthermore, the results inform policymakers
about the potential effects of the asymmetric taxation of dividends on private firms and their
shareholders.
Chapter 3: Tax Depreciation and Investment Decisions: Evidence from the Leasing Sector
The second study focuses on a change in tax depreciation allowances. Using a German tax
depreciation reform as an exogenous shock that applies to firms offering finance leases, the
study examines whether this change impacts the investment decisions of finance lease
companies. Since the beginning of 2014, the German tax authority has abolished the lease-
specific straight-line tax depreciation over the lease term. Since then, the lessor has been
required to depreciate on a straight-line basis over the expected useful life of the asset. The
latter depreciation method is less beneficial as the lease term is shorter than the expected useful
life of an asset. The results suggest that finance lease firms significantly reduce their
investments in tangible assets after the reform compared to rental firms, which are not affected
by the reform.
Finance lease firms are financial institutions and thus subject to regulatory requirements
regarding liquidity and risk management. However, the increase in tax payments due to a shift
to the less beneficial tax depreciation allowance reduces cash flow and hence liquidity. Since
investment decisions of finance lease firms are tied to the regulatory requirements, a decline
in liquidity negatively affects investments. In line with this prediction, cross-sectional analyses
reveal that the exposure of finance lease firms to regulatory requirements moderates their
investment response.
Additional cross-sectional tests show that business model characteristics, such as a product
focus on mobile assets, affect the responsiveness of finance lease firms to the change in tax
depreciation allowances. The study adds to the literature on the effect of tax depreciation on
firms’ investment behaviour. In addition, the study extends the scarce literature on the effect
of taxation on financial institutions by providing evidence that regulatory requirements

Introduction
7
moderate the investment decision of finance lease firms. In this context, the study answers the
call for research on the effect of taxation on financial institutions.
Figure 1.2: Structure of the thesis
Chapter 1: Introduction Context and objectives of the thesis
Structure and content of the thesis
Pages
1-8
Chapter 2: Private Firm and Shareholder Response to Dividend Taxation:
Evidence from the Taxation of Corporate Minority Shareholders
Chapter 3: Tax Depreciation and Investment Decisions: Evidence from the
Leasing Sector
Chapter 4: The Effect of Public Country-by-Country Reporting on Real
Activities of EU Banks
Does mandatory public
disclosure of tax
information affect the
economic activities of
banks?
Do private firms and their
shareholders respond to a
dividend tax increase,
which only affects
corporate shareholders
with a minority stake?
Does a change in tax
depreciation allowances
affect the investment
decision of finance lease
firms?
EU multinational banks reduce
their tax avoidance behaviour
They also decrease their earning
assets, total assets and the
number of employees
Detection/enforcement risks and
reputational concerns moderate
the decrease in tax avoidance and
thus the reduction in economic
activities
Firms do not adjust their payout
policy
Corporate shareholders reduce
their minority stakes
Firm and shareholder
characteristics as well as the
relation between the shareholder
and the firm affect the dividend
tax responsiveness of a corporate
shareholder with minority stakes
Companies from the finance
lease sector reduce their
investments
Exposure to regulatory
requirements and a product
portfolio specialised in mobile
assets moderate the investment
effect
Pages
9-72
Blouin et al.,
TAR 2011
Jacob and
Michaely, RFS
2017
Maffini et al.,
AEJ 2019
Ohrn,
JPE 2019
Joshi et al., CAR
2020
De Simone and
Olbert, Working
Paper 2020
Pages
73-118
Pages
119-164
Chapter 5: Conclusion
Summary of the results and contributions
Main limitations
Future research
Pages
165-170

Introduction
8
Chapter 4: The Effect of Public Country-by-Country Reporting on Real Activities of EU Banks
The third and final study of this thesis uses a setting in the EU to examine whether public
disclosure of tax information creates real effects. The European Union’s Capital Requirements
Directive IV mandates that banks in the EU disclose annual financial and tax information by
geographical location and type of activity. The so-called Country-by-Country Reporting
(CbCR) was first required by banks in July 2014. Using CbCR as an exogenous shock in the
disclosure of tax information, the study finds that EU multinational banks decrease their tax
avoidance behaviour after the reform compared to EU domestic banks, which cannot employ
cross-border tax planning strategies. This result is in line with the prediction that CbCR
disclosures raise costs for banks due to an increase in detection and enforcement risks or
reputational concerns.
The study uses banks’ total assets, earning assets and the number of employees as proxies for
their economic activities. Results indicate that EU multinational banks reduce their real
economic activities after the CbCR disclosure reform compared to EU domestic banks. The
findings confirm the prediction that a decline in tax avoidance negatively affects real economic
activities when banks include the costs and benefits of tax avoidance in their decision to
maximise their after-tax profits. In this case, a reduction in the optimal level of tax avoidance
adversely affects the optimal level of the input factors such as labour and investments.
Additional cross-sectional tests reveal that not only detection and enforcement risks but also
reputational concerns moderate the treatment effect on banks’ tax avoidance. Further, both
channels capture the variation in the treatment effect on banks’ economic activities. Therefore,
the cross-sectional tests additionally underline that banks’ economic activities decline after
the CbCR disclosure because their tax avoidance activities decrease. The study adds to the
emerging literature on the effects of private and public CbCR by providing evidence that the
disclosure of tax information reduces tax avoidance and thereby adversely affects economic
activities, indicating that tax avoidance creates real effects. Further, it answers the call for
research on the impact of public disclosure of tax information on firms’ behaviour.

Private Firm and Shareholder Response to Dividend Taxation: Evidence from the Taxation
of Corporate Minority Shareholders
9
2. Private Firm and Shareholder Response to Dividend Taxation: Evidence from the
Taxation of Corporate Minority Shareholders
Lisa Hillmann9
Working Paper10
Abstract:
This paper examines the response of private firms and their shareholders to a dividend tax
increase, which only affects corporate shareholders owning a minority stake. Using this
exogenous shock in Germany, my results suggest that firms do not change their payout policy
but corporate shareholders reduce their minority stakes in firms after the dividend tax reform.
Additional cross-sectional tests indicate a larger reduction of corporate shareholders’ minority
stakes for those invested in firms with high dividend payouts and a majority shareholder. The
dividend tax responsiveness is also larger for financially distressed corporate shareholders
with minority stakes that do not belong to the same group as the firm in which they own a
minority stake. My findings add to the very limited literature on the effects of dividend taxes
on payout decisions of private firms and reactions of their shareholders.
JEL classification: G32, G35, H25
Keywords: Dividend taxation, closely held corporations, private firms, payout policy,
corporate shareholders, minority shareholders, ownership structure
Acknowledgements: For helpful comments and suggestions, I thank Nathan Goldman
(discussant), Ann-Kristin Großkopf, Jörg-Markus Hitz, Rebecca Höhl, Ken Klassen,
Drahomir Klimsa, Olaf Korn, Reinald Koch, Aliisa Koivisto (discussant), Jianwei Li
(discussant), Max Meinhövel, Alexander Merz, Florian Moritz, Jan Muntermann, Andreas
Oestreicher, Jochen Pierk, Robert Schwager, Raffael Speitmann (discussant) and workshop
and conference participants at University of Goettingen, the 2020 annual meeting of the VHB
in Frankfurt am Main, the 2019 IIPF annual congress in Glasgow, the 2019 AAA annual
meeting in San Francisco, and the 2019 EAA annual meeting in Paphos. This research was
partly conducted during my research visit at the University of North Carolina at Chapel Hill.
I thank the UNC accounting group for their hospitality and Jeff Hoopes and Ed Maydew for
their valuable comments in the early stage of my research project.
9 University of Goettingen, Faculty of Business and Economics, Tax Division, Platz der Goettinger Sieben 3,
37073 Goettingen, Germany. 10 First version of the working paper: November 2018 (previous title: “Taxation of Dividends and Governance
Issues of Corporate Minority Shareholders”). This version: September 2020.

Private Firm and Shareholder Response to Dividend Taxation: Evidence from the Taxation
of Corporate Minority Shareholders
10
2.1 Introduction
Theory suggests that dividend taxation affects the payout policy of firms (e.g., Poterba and
Summers, 1984; Chetty and Saez, 2010) and the portfolio decision of investors (e.g., Brennan
and Thakor, 1990; Allen et al., 2000). Consistent with theoretical predictions, recent empirical
literature confirms that the payout decision of listed firms is responsive to changes in dividend
taxes and provides some evidence that the portfolio decision of their investors is affected by
shareholder taxes (e.g., Blouin et al., 2011; Desai and Jin, 2011). However, prior studies
provide less evidence on the effect of dividend taxes on the payout decision of private firms
(e.g., Yagan, 2015; Jacob and Michaely, 2017; Berzins et al., 2019). In addition, it remains an
open empirical question whether dividend taxes affect shareholders of private firms. In this
paper, I examine the response of private firms11 and their shareholders to a dividend tax
increase in Germany, which only affects a particular group of shareholders – corporate
shareholders with a minority stake12. This unique setting allows me to investigate whether a
special dividend tax regime creates direct and indirect effects on the firm and shareholder
level.
Since March 2013, dividends received by German corporate shareholders owning a stake of
less than 10% (hereafter “minority stake”) in the dividend-paying German corporation are
subject to corporate and business taxes, amounting to a total dividend tax burden of around
30%. Prior to the reform, dividends received by those shareholders were 95% tax-exempt
under the Corporate Income Tax Act, resulting in a smaller dividend tax burden of around
14% (business taxes). In contrast, capital gains from the sale of shares that a German corporate
shareholder owns in another German corporation are not subject to this dividend tax reform.
They are 95% tax-exempt, regardless of the corporate shareholder’s ownership stake.
Previous empirical studies, which predominantly examined the US dividend tax cut in 2003,
provide empirical evidence on the effect of dividend taxes on the payouts of listed and unlisted
firms (e.g., Chetty and Saez, 2005; Blouin et al., 2011; Hanlon and Hoopes, 2014; Yagan,
2015). However, some studies question the economic relevance of dividend taxes on payouts
(e.g., Brav et al., 2008; DeAngelo et al., 2008; Hanlon and Heitzman, 2010; Yagan, 2015).
Recent empirical studies show that agency issues and shareholder conflicts, such as conflicts
between owners and managers or between majority and minority shareholders, mitigate the
11 I define private firms as unlisted separate legal entities, which are taxed under the German Corporate Income
Tax Act. Throughout the paper, I use “firm”, “corporation” and “company” interchangeably. 12 I define corporate shareholders owning a minority stake as German corporate shareholders owning a stake of
less than 10% in another German corporation.

Private Firm and Shareholder Response to Dividend Taxation: Evidence from the Taxation
of Corporate Minority Shareholders
11
dividend tax responsiveness (e.g., Jacob and Michaely, 2017; Berzins et al., 2019). In addition,
prior literature suggests that firms’ responses to dividend tax changes are stronger when
shareholders with a large stake are affected by the reform (e.g., Pérez-González, 2002). I thus
posit that the special German dividend taxation regime, which only affects corporate
shareholders owning a minority stake, does not have an impact on a firm’s payout policy
because minority shareholders do not have sufficient voting power to influence payouts.
With regard to shareholders, theory suggests that shareholders affected by an increase in
dividend taxes should switch to non-dividend-paying firms, if dividend-paying firms do not
change their dividend payouts and if capital gains taxes are smaller than dividend taxes
(Dhaliwal et al., 1999). However, shareholders of private firms are highly affected by
transaction costs because private firms operate on illiquid markets and generally have a small
number of owners that could be potential buyers for minority stakes (e.g., Bennedsen and
Wolfenzon, 2000). Therefore, prior studies that have examined the effect of dividend tax
reforms on the payout decision of private firms reveal stable ownership structures over time
(e.g., Jacob and Michaely, 2017; Berzins et al., 2018). Nevertheless, a large dividend tax
increase for one particular group of shareholders that cannot influence the firm’s dividend
payout decision incentivises them to rebalance their portfolios. I thus predict that corporate
shareholders reduce their minority stakes in German companies as a response to the dividend
tax increase.
To investigate both hypotheses, I exploit the exogenous shock setting by applying a difference-
in-differences (DiD) approach. My treatment group is defined as German corporate
shareholders owning a stake of less than 10% in another German corporation in the period
prior to the reform. The control group includes German corporate shareholders owning a stake
of at least 10% but less than 20% in another German corporation during the pre-reform period.
I test the first hypothesis by comparing the payout of firms with treated corporate shareholders
before and after the reform with firms having corporate shareholders in the control group. For
the second hypothesis, I compare the ownership stake of treated corporate shareholders before
and after the dividend tax reform with the ownership stake of corporate shareholders in the
control group.
I use a panel of private corporations in Germany to examine the effect of a dividend tax
increase on these firms and their respective corporate shareholders. My dataset has two main
advantages. First, in comparison to recent empirical studies, which use rather static ownership
structures (e.g., Michaely and Roberts, 2011; Nagar et al., 2011), I can hand-collect the exact

Private Firm and Shareholder Response to Dividend Taxation: Evidence from the Taxation
of Corporate Minority Shareholders
12
ownership structure of private corporations in Germany for the period 2010 to 2015, to
precisely examine the effect of the dividend tax reform on the ownership structure of German
corporations. Second, I have financial data on the shareholder level, which allows me to also
include shareholder characteristics in my tests.
The results of my main DiD analyses show that after the dividend tax increase firms do not
change their payouts but corporate shareholders reduce their minority stakes. Both effects are
consistent with my predictions that firms do not alter their payouts if a dividend tax reform
affects only a particular group of shareholders without significant voting power. Instead,
corporate shareholders adjust their minority stakes when they face changes in dividend taxes.
My results are robust when using alternative dependent variables, controlling for repurchases
and employing a simultaneous equations approach.
In addition to these analyses, I perform four cross-sectional tests to examine whether the
dividend tax responsiveness of corporate shareholders with minority stakes varies with firm-
and shareholder-level characteristics. First, I posit that the response of corporate shareholders
after the dividend tax increase is larger if they own minority stakes in firms with a high
dividend payout. Second, potential shareholder conflicts between majority and minority
shareholders can increase agency costs for treated minority shareholders (e.g., Bennedsen and
Wolfenzon, 2000; La Porta et al., 2000). I thus predict that the reduction in minority stakes of
corporate shareholders after the dividend tax reform is larger if they own minority stakes in
firms with a majority shareholder.
Third, the affiliation of the firm and corporate shareholder to the same group could affect the
behaviour of the corporate shareholder owning a minority stake. On the one hand, if the firm
and the corporate shareholder have the same global ultimate owner, the group could adjust the
ownership structure with lower transaction costs because the internal purchase and sale of
holdings are more efficient than external trades on illiquid markets. On the other hand, the
same group might employ tax-planning strategies to avoid the dividend tax burden at the
corporate shareholder level, resulting in no reaction of the corporate shareholder with a
minority stake. My prediction therefore varies. Finally, I expect that the reduction of minority
stakes after the dividend tax reform is larger for financially distressed corporate shareholders
because they are in particular reliant on after-tax cash flows from their investments in minority
stakes.
Results of my empirical tests are consistent with my cross-sectional predictions, indicating
that firm and shareholder characteristics as well as the relation between the shareholder and

Private Firm and Shareholder Response to Dividend Taxation: Evidence from the Taxation
of Corporate Minority Shareholders
13
the firm affect the dividend tax responsiveness of corporate shareholders with minority stakes.
The reduction of corporate shareholders’ minority stakes is larger for those invested in firms
with a high dividend payout and a majority shareholder. The dividend tax responsiveness is
also larger for financially distressed corporate shareholders with minority stakes that do not
belong to the same group as the firm in which they own a minority stake.
Additional analyses support the validity of my inferences and extend my main results. In the
first set of additional tests, I examine whether other shareholders are indirectly affected by the
dividend tax reform because they could buy the minority stakes, which corporate shareholders
want to sell after the dividend tax reform. My results indicate that potential new shareholders
do not purchase the minority stakes and therefore are not indirectly affected by the reform.
Instead, corporate shareholders primarily sell their minority stake to the shareholder with the
largest ownership stake in the firm. In addition, the dividend tax increase might prevent other
German corporate shareholders from reducing their ownership stakes to less than 10% after
the reform. However, my results reveal that shareholders do not adjust their ownership stakes
regularly. To mitigate the concern that my DiD approach may not be valid because my control
group could be indirectly affected by the reform, I use foreign corporate shareholders resident
in the EU and owning a stake of less than 10% in a German corporation as an alternative
control group. My findings are fully consistent with my main results, thus supporting the
validity of my DiD approach.
Further, I employ entropy balancing matching and re-estimate my baseline regressions on the
matched sample. My findings are fully consistent with my main results, suggesting that
observable differences across treated and control observations do not confound my results. In
addition, I conduct placebo tests to assess the validity of the parallel trend assumption. I find
insignificant reactions of corporate shareholders with minority stakes in my two placebo
reform dates, which increase the confidence that my findings are attributable to the dividend
tax reform.
In further additional analyses, I examine alternative reactions of German corporate
shareholders with minority stakes. First, I address the possibility of delayed responses of
treated corporate shareholders to the dividend tax reform by estimating yearly treatment
effects over the sample years. The results suggest that treated corporate shareholders respond
immediately or with a delay of one year. Finally, I discuss why an increase in ownership stakes
does not seem to be the predominant reaction of treated corporate shareholders.

Private Firm and Shareholder Response to Dividend Taxation: Evidence from the Taxation
of Corporate Minority Shareholders
14
My paper contributes to the very limited literature on the effects of dividend taxes on the
payout decisions of private firms and the portfolio choices of their shareholders (e.g., Michaely
and Roberts, 2011; Berzins et al., 2018). While the existing literature provides some evidence
that dividend taxes affect the payout decisions of private firms, prior studies generally consider
the ownership structure of a private firm as being stable over time (e.g., Jacob and Michaely,
2017; Berzins et al., 2018). I extend the literature by providing first evidence that minority
shareholders of private firms affected by the dividend tax reform react to the increase in
dividend taxes by reducing their ownership stakes. My setting is advantageous because it
overcomes the major limitations of prior studies (e.g., Desai and Jin, 2011; Blouin et al., 2011;
Berzins et al., 2019) by offering only a change in the dividend taxation of a particular
shareholder group that generally cannot influence the firm’s payout policy. Therefore, I can
estimate the shareholder response to the dividend tax increase more precisely.
Second, my study enriches the literature on the characteristics that affect the dividend tax
responsiveness of shareholders (e.g., Desai and Jin, 2011; Jacob and Michaely, 2017). My
unique dataset allows me to examine important characteristics on three different levels: firms,
shareholders and the relation between the firm and its shareholders. My results demonstrate
that besides firm-specific payout decisions and the financial position of the treated
shareholder, the dividend tax response is also conditional upon potential agency issues and the
affiliation of the treated shareholder and the firm to the same group. The heterogeneity in the
dividend tax responsiveness suggests that each of these different levels should be considered
to fully understand the decisions of shareholders.
The paper proceeds as follows. In Section 2.2, I describe the institutional background. Section
2.3 develops my predictions. Section 2.4 outlines the research design and data. In Section 2.5,
I present empirical findings. Section 2.6 provides additional analyses. Section 2.7 concludes.
2.2 Taxation of dividends received by corporate shareholders in Germany
The taxation of dividends that a German corporation receives from another German
corporation is similar to a dividends-received-deduction system, which is also used in other
countries such as France, Spain, United Kingdom and the United States (Erickson and
Maydew, 1998; IBFD, 2013).
In general, a corporation’s dividend income is subject to withholding taxes. In Germany, the
dividend-paying German corporation is obliged to withhold 25% of the dividends paid out to
its German corporate shareholders. The dividend-receiving German corporate shareholder is

Private Firm and Shareholder Response to Dividend Taxation: Evidence from the Taxation
of Corporate Minority Shareholders
15
allowed to effectively exempt 95%13 of the received dividends from its corporate income tax
base, regardless of its ownership stake in the dividend-paying German corporation. In
addition, the German corporate shareholder can fully deduct the withholding tax from its
corporate income tax burden, when filing the corporate tax return. Consequently, if the
corporate shareholder and the dividend-paying corporation both are resident in Germany, the
dividend income is almost fully exempt from corporation taxes and not affected by
withholding taxes. Under the Corporate Income Tax Act, only 5% of the dividends received
are taxed at the corporate shareholder level with a corporate income tax rate of 15%. In
addition, dividends are subject to business taxes (approx. 14%14) if the ownership stake is less
than 15%. Under consideration of an additional surtax of 5.5% on the corporate income tax,
the effective inter-corporate dividend tax burden is thus 14.8% for corporate shareholders with
an ownership stake of less than 15%, and 1.5% if the ownership stake is at least 15% (see
Table 2.1). In general, the same system applies to capital gains that German corporate
shareholders receive when they sell their shares in German corporations, except that the
overall tax burden is always 1.5%, regardless of the shareholding quota.
Compared to the taxation of inter-corporate dividends in Germany, profit distributions from a
German corporation to corporate shareholders in foreign countries are also subject to
withholding taxes.15 Nevertheless, the German withholding tax is final for foreign
corporations because they do not have the possibility to receive a tax credit or reimbursement
in Germany. However, this final withholding tax burden does not occur if the EU Parent-
Subsidiary Directive applies. The EU Parent-Subsidiary Directive (EU, 2011) abolishes
withholding taxes on dividends that are distributed to foreign corporate shareholders resident
in the EU if their ownership stake is at least 10%.
On October 20, 2011, the European Court of Justice (ECJ) declared that the German dividend
tax regulation violates the principle of the free movement of capital because dividends
distributed to companies that are resident in other Member States and that hold less than 10%
of the shares in the German corporation have a higher German dividend tax burden than
dividends distributed to German companies (EU, 2011).
13 Dividends that a corporate shareholder receives from another corporation are fully tax-exempt under the
Corporate Income Tax Act. However, 5% of the tax-exempt dividends are classified as non-deductible expenses.
Therefore, dividends are effectively 95% tax-exempt. 14 Business taxes are local taxes, which are levied by municipalities. I assume that the average rate of assessment
at the municipality level is 400%, resulting in an average business tax rate of 14% (= 3.5% * 400%). 15 The withholding tax rate equals the minimum of the German withholding tax rate and the withholding tax rate
specified in the double tax treaty with Germany (in general, a tax rate of 15%).

Private Firm and Shareholder Response to Dividend Taxation: Evidence from the Taxation
of Corporate Minority Shareholders
16
The German parliament had the choice of two options to change the national taxation of inter-
corporate dividends in order to comply with the EU law. The first option was that EU corporate
shareholders could receive dividends from German corporations, which would be exempt from
withholding taxes, regardless of their ownership stake. In this case, dividends distributed to
foreign corporate shareholders resident in the EU as well as dividends distributed to German
corporate shareholders would be, in general, exempt from corporate and withholding taxes in
Germany. The second option proposed that German corporate shareholders owning a stake
below 10% in a German corporation would have to pay corporate taxes on the total amount of
dividends received from the minority stake. In this case, foreign corporate shareholders
domiciled in the EU as well as German corporate shareholders would receive dividends, which
are fully taxable in Germany. The German legislative bodies discussed both options
thoroughly.
On February 26, 2013, the German parliament and German Federal Council agreed on the
latter proposal. Consequently, on March 21, 2013, the German parliament passed a law that
dividends are subject to corporate taxes (= 15%) if a German corporate shareholder has a direct
ownership stake of less than 10% in another corporation. This law had a retroactive
application, which means that the ownership stake at the beginning of the year 2013 was
decisive for the 10%-threshold in 2013. If, for example, a German corporate shareholder owns
a stake of less than 10% in another German corporation on January 1, the total amount of
dividends received in that year is subject to corporate and business taxes. In order to achieve
the threshold of 10% in a particular year, the Corporate Income Tax Act requires corporate
shareholders owning a stake of less than 10% to buy an additional 10% stake in that particular
year. The increase in the stake to ensure that the sum of previous and additional stakes equals
in total 10% is not sufficient in order to benefit from the 95% dividend tax exemption in the
year of the additional acquisition of shares.
Overall, German corporate shareholders are obliged to tax the total amount of dividends
received from their minority stakes after February 28, 2013, resulting in a total dividend tax
burden of around 30%. Table 2.1 outlines the dividend tax burden before and after the tax
reform.
Notably, the legislative reform did not change the 95% tax exemption for capital gains. Taken
together, German corporate shareholders have to pay corporate (and business) taxes on the
total amount of dividends received from their minority stakes, but capital gains derived from
the sale of shares they own in other corporations are 95% tax-exempt.

Private Firm and Shareholder Response to Dividend Taxation: Evidence from the Taxation
of Corporate Minority Shareholders
17
Table 2.1: Dividend tax burden of a corporate shareholder for the years 2010-2015
Years
Dividend tax burden
Ownership stake
< 10%
10% ≤ Ownership stake
< 15%
Ownership stake
15%
Pre-reform 2010-2012 14.8% 14.8% 1.5%
Post-reform 2013-2015 29.8% 14.8% 1.5%
Notes: The dividend tax burden is the sum of a corporate tax burden (15%), a surcharge of 5.5% on the corporate
tax burden and a business tax burden (on average 14%). The ownership stake determines the combined tax
burden. The total dividend tax burden is as follows: (1) 29.8% = 15% + 15% x 5.5% + 14%, (2) 14.8% = 5% x
15% + 5% x 15% x 5.5% + 14%, (3) 1.5% = 5% x 15% + 5% x 15% x 5.5% + 5% x 14%.
This unique setting has some valuable advantages. First, prior studies generally exploit reform
settings with changes in dividend tax rates and capital gains tax rates, which obfuscate the
pure dividend tax effect (e.g., Blouin et al., 2011). However, the German intra-corporate
dividend tax reform exclusively alters the taxation of intra-corporate dividends, while capital
gains from selling shares in other corporations remain 95% tax-exempt. This setting thereby
allows me to estimate precisely the effect of the change in dividend taxation.
Second, although the ECJ decided at the end of 2011 that the German intra-corporate dividend
taxation legislation contradicts EU law, the German legislative bodies thoroughly discussed
two potential changes of the intra-corporate dividend taxation regulation and could only agree
on one option in February 2013, before the law was subsequently passed in March 2013. In
addition to the ongoing discussions about the two proposals before February 2013, one of the
two proposals discussed did not include a change in the taxation of German corporate
shareholders with minority stakes. I therefore do not expect that the ECJ decision led to
anticipation effects. Third, the German government was obliged to adjust the dividend tax
regulation to comply with EU law. Therefore, it is reasonable to assume that corporate
shareholders with minority stakes perceived this dividend tax reform as permanent.
Fourth, the change in dividend taxes was significant for corporate shareholders owning a
minority stake as the dividend tax burden increased from 14.8% to 29.8% after the reform,
which is equal to a doubling of the initial tax burden. Finally, the dividend tax reform was not
confounded by other events in the years 2013 and 2014, which could have affected the payout
policy of corporations and the portfolio decision of shareholders.
In sum, this setting provides a significant and unanticipated change in the taxation of dividends
received by German corporate shareholders from their minority stakes in other corporations.
Furthermore, I cannot identify potential confounding events, which could affect my analyses.

Private Firm and Shareholder Response to Dividend Taxation: Evidence from the Taxation
of Corporate Minority Shareholders
18
Therefore, I can exploit this exogenous shock to examine the effects of changes in dividend
taxation on the payout policy of firms and the minority stakes of their corporate shareholders.
2.3 Empirical predictions
2.3.1 Dividend taxation and dividend policy
Theory suggests that dividend taxes have a large effect on a firm’s payout policy (e.g., Miller
and Modigliani, 1961; Poterba and Summers, 1985; Auerbach, 2002; Poterba, 2004; Chetty
and Saez, 2010). Previous empirical studies, which predominantly examined the US dividend
tax cut in 2003, confirm this theoretical prediction by providing empirical evidence on the
effect of dividend taxes on the payouts of listed and unlisted firms (e.g., Chetty and Saez,
2005; Blouin et al., 2011; Hanlon and Hoopes, 2014; Yagan, 2015). However, some studies
question the economic relevance of dividend taxes on payouts. For example, Brav et al. (2008)
find a larger increase in repurchases compared to dividends after the US dividend tax cut in
2003, although the tax rate on qualified dividends was reduced to the long-term capital gains
tax rate. In addition, the economic magnitude of the payout response in dollar terms seems to
be small for unlisted firms (Yagan, 2015). Due to the rather mixed results, shareholder taxes
do not appear to be a first-order determinant of firms’ payout policies (DeAngelo et al., 2008;
Hanlon and Heitzman, 2010).
Recent empirical studies provide evidence that frictions, such as agency issues and shareholder
conflicts, are a possible explanation for the weak dividend tax responsiveness. Jacob and
Michaely (2017) find that heterogeneity in owners’ tax preferences and conflicts between
owners and managers mute the effect of dividend taxes on payouts. Berzins et al. (2019) show
that potential conflicts between majority and minority shareholders also have a mitigating
effect on the dividend tax responsiveness. In addition, Pérez-González (2002) provides
evidence that the response of listed firms to dividend tax changes is much stronger when large
shareholders are affected by the reform because, as Shleifer and Vishny (1986) note, large
shareholders may have sufficient controlling rights to influence the firm’s decision.
I supplement this field of research in my first hypothesis. Since the German dividend tax
reform impacts only corporate shareholders owning minority stakes, I can examine whether a
firm’s payout policy is affected by a change in the taxation of dividends received by a group
of shareholders that does not have sufficient voting power to influence the payout decision. In
line with prior literature, I state my first hypothesis as follows:

Private Firm and Shareholder Response to Dividend Taxation: Evidence from the Taxation
of Corporate Minority Shareholders
19
Hypothesis 1: Firms with a corporate shareholder owning a minority stake do not alter their
payouts after the dividend tax reform in 2013.
2.3.2 Dividend taxation and shareholder response
According to the theoretical and empirical literature, dividend policies and shareholder
portfolio choices are simultaneous decisions (e.g., Dhaliwal et al., 1999; Allen et al., 2000).
Especially in the finance literature, shareholders with different tax preferences present tax
clienteles that favour different dividend policies (e.g., Graham, 2003). Dhaliwal et al. (1999)
document that institutional holdings increase when firms initiate dividends because dividends
are, in general, tax-disadvantaged for individual investors compared with institutional
investors. Desai and Jin (2011) report that “dividend-averse” institutions are significantly less
likely to hold shares in firms with larger dividend payouts. Using the US dividend tax cut in
2003, Desai and Dharmapala (2011) document based on country-level data that U.S. equity
investments shifted from foreign countries, where companies did not qualify for lower
dividend tax rates, to foreign countries, where companies did qualify for lower dividend tax
rates. Blouin et al. (2011) find for the same tax reform that firms increased their dividend
payouts. However, insiders such as directors and officers are the only individual investors who
appear to have rebalanced their portfolio in order to increase their dividend income.
The German dividend tax reform increased the taxation of dividends received by corporate
shareholders from their minority stakes. According to the tax clientele theory, corporate
shareholders affected by an increase in dividend taxes should rebalance their portfolios, to
maximise their after-tax returns, by switching to non-dividend-paying firms if dividend-
paying firms do not adjust their dividend payouts and if capital gains taxes are smaller than
dividend taxes (Dhaliwal et al., 1999). After the German reform, dividends received by
corporate shareholders from their minority stakes were taxed at around 30%, while capital
gains remained 95% tax-exempt, resulting in a total tax burden of only 1.5% (see Section 2.2).
Although this large difference in the dividends and capital gains tax burden should have
incentivised corporate shareholders with minority stakes to rebalance their portfolios,
Eberhardt et al. (2019) document that the free float of those German shareholders in German
listed corporations remained almost constant, despite the tax reform in 2013. The authors
assume that the treated shareholders of listed firms did not react to the dividend tax reform
because the positive performance of the German stock market index outweighed the additional
tax burden.
Private Firm and Shareholder Response to Dividend Taxation: Evidence from the Taxation
of Corporate Minority Shareholders
20
However, the focus of my study is on the reaction of private firms and their shareholders to
the dividend tax reform. In this setting, shareholders face additional transaction costs and
restrictions because private firms do not act on liquid markets such as a stock market (e.g.,
Bennedsen and Wolfenzon, 2000). In addition, private companies are typically closely held,
which means they are characterised by a small number of owners. Thus, if corporate
shareholders want to sell their minority stake, the existing owners of the company are, in
general, the only group of potential buyers for their minority stakes. Because of this situation,
prior studies that examined the effect of dividend tax reforms on the payout decision of private
firms identified stable ownership structures over time (e.g., Jacob and Michaely, 2017; Berzins
et al., 2018). However, I expect that a large dividend tax increase for one particular group of
shareholders, that cannot influence the firm’s dividend payout decisions, essentially
incentivises these shareholders to rebalance their portfolios.
Thus, corporate shareholders could decrease their dividend taxes payable by reducing their
minority stakes or avoid the higher dividend tax burden by increasing their ownership stake
above the threshold of 10%. However, an increase in the ownership stake is very unlikely for
two reasons. First, corporate shareholders owning a stake of less than 10% would have to buy
an additional 10% stake in the corporation in order to benefit from the 95% tax exemption in
2013, which would represent, for example, a threefold increase of their shareholding if they
owned a 5% stake prior to the reform. Second, since closely held firms only have a small
number of owners, it is unlikely that minority shareholders can buy stakes from other
shareholders, which would in effect reduce the latter shareholders’ voting power in the firm.
Therefore, I state my second hypothesis as follows:
Hypothesis 2: Corporate shareholders decrease their minority stakes in firms after the
dividend tax reform in 2013.
In addition to this hypothesis, I formulate four cross-sectional predictions based on firm- and
shareholder-level characteristics to investigate the intensity of the responsiveness of corporate
shareholders with minority stakes to the dividend tax reform. First, since minority shareholders
do not have the voting rights to influence important firm decisions, they are predominantly
interested in dividends as cash flow, resulting from their investment in a firm (e.g., Rozeff,
1982; Jensen, 1986). However, an increase in dividend taxes reduces the after-tax cash flow
from dividends. Therefore, I make the cross-sectional prediction that the response of corporate
shareholders is larger if they own minority stakes in firms with a high dividend payout.
Private Firm and Shareholder Response to Dividend Taxation: Evidence from the Taxation
of Corporate Minority Shareholders
21
Second, I expect that a firm’s ownership structure can influence the behaviour of corporate
shareholders owning minority stakes. Since private corporations are characterised by a small
number of owners, conflicts between majority and minority shareholders are an important
agency issue (e.g., Shleifer and Vishny, 1997; La Porta et al., 1999; De Cesari, 2012; Berzins
et al., 2018). A majority shareholder can in principle solely decide about the payout policy and
capture private benefits16, but has to share potential capital gains, e.g., from an increase in the
firm value and dividends, proportionally with minority shareholders (e.g., Jensen and
Meckling, 1976; Bennedsen and Wolfenzon, 2000; La Porta et al., 2000). In contrast, this
potential agency problem will not occur if the firm does not have a majority shareholder.
Previous literature shows that the dilution of power is an appropriate instrument to reduce
conflicts between majority and minority shareholders (e.g., Pagano and Roell, 1998; Gomes
and Novaes, 2005; Nagar et al., 2011). By diluting the power, single shareholders are restricted
to take actions that yield them private benefits and might come at the expense of other
shareholders (e.g., Bennedsen and Wolfenzon, 2000; Faccio et al., 2001). I thus posit in my
second cross-sectional prediction that the dividend tax response of corporate shareholders is
larger if they own minority stakes in firms with a majority shareholder.
Third, the affiliation of the firm and treated corporate shareholder to the same group17 can be
another characteristic affecting the dividend tax responsiveness. On the one hand, a group can
employ tax-planning strategies to avoid the dividend tax burden at the corporate shareholder
level, e.g., via debt-financing, transfer pricing, licensing and the appropriation of profits and
losses (e.g., Dischinger and Riedel, 2011; Buettner and Wamser, 2013; Rünger, 2019; Amiram
et al., 2019).18 Under this scenario, I do not expect a change in the corporate shareholder’s
minority stake. On the other hand, the group could adjust the ownership structure with lower
transaction costs because the internal purchase and sale of holdings are more efficient than
external trades on illiquid markets. Since the prediction is ambiguous, the cross-sectional
reaction of corporate shareholders with minority stakes should be tested empirically.
Finally, characteristics of corporate shareholders with minority stakes might also affect their
responsiveness to changes in dividend taxes. Minority shareholders may especially be reliant
on dividends as cash flow from their equity investment in a company if they are cash-
16 Examples and discussions regarding the incentive of large shareholders to capture private benefits can be found
in, e.g., Shleifer and Vishny (1997), La Porta et al. (2000), and Nagar et al. (2011). 17 A firm and corporate shareholder belong to the same group if they have the same global ultimate owner. I
define the “same global ultimate owner” as the ultimate parent company that owns directly or indirectly more
than 50% of the shares in the firm and the corporate shareholder. 18 For an overview of important studies over the past decade, see Wilde and Wilson (2018), and Dharmapala
(2014).

Private Firm and Shareholder Response to Dividend Taxation: Evidence from the Taxation
of Corporate Minority Shareholders
22
constrained (e.g., Altman, 1968). To serve their financial needs, it is plausible to expect that
after the dividend tax increase corporate shareholders sell their minority stakes to receive
capital gains, which are almost tax-exempt (e.g., Grullon and Michaely, 2002). Hence, I
predict as my fourth cross-sectional prediction that the reduction of minority stakes after the
dividend tax increase is larger for financially distressed corporate shareholders.
2.4 Research design and data
2.4.1 Estimation strategy
To test my empirical predictions, I apply a difference-in-differences (DiD) estimation method.
The application of the DiD approach requires the determination of a treatment and control
group. Since the dividend tax reform applies only to German corporate shareholders with
minority stakes, my treatment group consists of German corporate shareholders that held a
stake of less than 10% in a German corporation during the pre-reform period (2010-2012). My
control group includes German corporate shareholders that owned a stake of at least 10% but
less than 20% in a German corporation during the same pre-reform period (2010-2012).
This control group has several advantages. First, shareholders from the control group as well
as shareholders from the treatment group cannot take part in the decision-making process of a
firm or build a blocking minority, for which, in general, an ownership stake of at least 25%
would be necessary. Second, since both shareholder groups are generally excluded from a
firm’s decision-making process, they should have similar incentives to invest in a firm, e.g.,
receiving cash flow or following strategic interests. Third, shareholders from the treatment as
well as shareholders from the control group are German corporations. Thus, different country-
specific factors (e.g., cultural differences of shareholders regarding their portfolio decisions)
do not drive my results. Fourth, the dividend tax reform did not capture German corporate
shareholders that own a stake of at least 10% but less than 20% in a German corporation, hence
my control group should not be affected by the dividend tax reform.
To test the effect of the dividend tax reform on firms’ payout decisions (Hypothesis 1), I
estimate the following DiD model:
𝑃𝑎𝑦𝑜𝑢𝑡𝑗,𝑡 = 𝛽0 + 𝛽1𝑃𝑜𝑠𝑡𝑡 × 𝑇𝑟𝑒𝑎𝑡𝑚𝑒𝑛𝑡𝑗 + 𝛿𝐹𝑖𝑟𝑚_𝐶𝑜𝑛𝑡𝑟𝑜𝑙𝑠𝑗,𝑡 + 𝛼𝑗 + 𝛼𝑡 + 휀𝑗,𝑡 (1)
The dependent variable Payout of corporation j at the end of year t is defined as profit/loss
after tax net of changes in other equity relative to prior year’s total assets (following Bethmann

Private Firm and Shareholder Response to Dividend Taxation: Evidence from the Taxation
of Corporate Minority Shareholders
23
et al., 2018). My sample captures the period from 2010 to 2015.19 I use this relatively narrow
sample period to reduce the likelihood that other events unrelated to the dividend tax reform
affect firms’ payout policy. I exploit the dividend tax reform, which was passed in March 2013
and is retroactively effective from the beginning of 2013, as an exogenous event. Therefore,
Post equals 1 for 2013-2015 and 0 for 2010-2012.
The indicator variable Treatment distinguishes between observations belonging to the
treatment and control group, respectively. Treatment equals 1 for firms with at least one
corporate shareholder that owned a stake of less than 10% in the pre-reform period, and 0 for
firms with at least one corporate shareholder that owned a stake of at least 10% but less than
20% in the pre-reform period (2010-2012). I exclude firms that are part of the treatment and
control group, i.e., firms with at least one corporate shareholder owning a minority stake and
one corporate shareholder with an ownership stake of at least 10% but less than 20%, to avoid
identification issues in my DiD approach. In line with my prediction, I expect an insignificant
estimate of my DiD coefficient (Post x Treatment).
I estimate Eq. (1) using OLS regression and heteroscedasticity-robust standard errors clustered
at the firm level (Petersen, 2009). Following recent literature, I control for firm-level
characteristics that capture the firm value and the ability to pay dividends (e.g., Blouin et al.,
2011; Jacob and Michaely, 2017). I include total assets (Size) because size can be a proxy for
firm value. Leverage and Cash control for the capital structure and internal funds, which
influence the payout decision. In addition, I include firm and year fixed effects to control for
general time trends in payouts and time-invariant unobservable differences in firm
characteristics.
To test the effect of the dividend tax reform on the minority stake of corporate shareholders
(Hypothesis 2), I base my analyses on firm-shareholder-level observations. This detailed
observation level is appropriate to investigate the effect of the dividend tax reform on a single
corporate shareholder’s decision to invest in minority stakes, as I can track the decision of a
specific corporate shareholder i to invest in the ownership stake of a specific corporation j over
time. By using these detailed firm-shareholder-year observations, I estimate the following
baseline DiD model:
𝑆ℎ𝑎𝑟𝑒ℎ𝑜𝑙𝑑𝑖𝑛𝑔𝑠𝑖,𝑗,𝑡 = 𝛽0 + 𝛽1𝑃𝑜𝑠𝑡𝑡 × 𝑇𝑟𝑒𝑎𝑡𝑚𝑒𝑛𝑡𝑖,𝑗 + 𝛿𝐹𝑖𝑟𝑚_𝐶𝑜𝑛𝑡𝑟𝑜𝑙𝑠𝑗,𝑡
+ 𝛾𝑆ℎ𝑎𝑟𝑒ℎ𝑜𝑙𝑑𝑒𝑟_𝐶𝑜𝑛𝑡𝑟𝑜𝑙𝑠𝑖,𝑡 + 𝛼𝑖,𝑗 + 𝛼𝑡 + 휀𝑖,𝑗,𝑡
(2)
19 If variables are constructed using prior year’s values, I include data from 2009 to calculate variables in 2010.

Private Firm and Shareholder Response to Dividend Taxation: Evidence from the Taxation
of Corporate Minority Shareholders
24
The dependent variable Shareholdings is defined as the ownership stake of the corporate
shareholder i in the corporation j at the end of year t. Again, my sample captures the narrow
period from 2010 to 2015, to reduce the likelihood that other events unrelated to the dividend
tax reform affect corporate shareholders’ ownership stakes. Post equals 1 for 2013-2015 and
0 for 2010-2012. The indicator variable Treatment equals 1 if the corporate shareholder i
owned a minority stake in the corporation j in the pre-reform period, and 0 if the corporate
shareholder i owned a stake of at least 10% but less than 20% in the corporation j in the pre-
reform period (2010-2012). In line with my prediction, I expect a negative and significant
estimate of my DiD coefficient (Post x Treatment).
I estimate Eq. (2) using OLS regression and heteroscedasticity-robust standard errors clustered
at the firm-shareholder level (Petersen, 2009). I include the same firm controls as described
for Eq. (1). In addition, I control for shareholder characteristics to capture the ability of
shareholder i to invest in stakes of corporation j (e.g., Blouin et al., 2011; Jacob and Michaely,
2017). Since firms and shareholders are corporations in my sample, I control for the same
variables on the firm and shareholder level. I include shareholders’ total assets (Size) because
size can be a proxy for investment opportunities. Shareholders’ Leverage and Cash control for
the capital structure and internal funds, which affect shareholders’ investments in stakes.
Finally, to control for general time trends in ownership stakes and time-invariant unobservable
differences in firm-shareholder characteristics, I use firm-shareholder and year fixed effects.
The applied DiD approach may raise general concerns. First, the validity of the DiD analyses
is based on the assumption that the reform was not anticipated by corporate shareholders with
minority stakes. Although German policymakers were obliged to change the taxation of intra-
corporate dividends after the ECJ decision at the end of 2011, the German legislative bodies
discussed each of the two possible options extensively and could finally agree on one option
in February 2013 (see Section 2.2). Thus, the anticipation of a dividend tax increase seems
very unlikely because of the differing opinions of the German legislative bodies. To mitigate
this concern even further, I check the parallel trend assumption of my DiD analyses by
providing yearly treatment effects and conduct placebo tests (see Section 2.4.3 and 2.6.3).
Second, shareholders in my control group could be indirectly affected by the dividend tax
reform for two reasons. On the one hand, they could potentially buy the minority stakes, which
corporate shareholders want to sell after the dividend tax increase. On the other hand, the
dividend tax increase could discourage them from reducing their ownership stakes to less than
10% in the future. However, I mitigate these concerns about my control group by providing

Private Firm and Shareholder Response to Dividend Taxation: Evidence from the Taxation
of Corporate Minority Shareholders
25
evidence that: (i) shareholders from the control group do not buy the minority stakes, (ii)
shareholders do not seem to adjust their ownership stakes regularly, and (iii) my results are
robust when re-estimating my baseline regressions (Eq. (1) and (2)) with an alternative control
group of foreign corporate shareholders owning minority stakes in German corporations (see
Section 2.6.1 and Appendix 2.C (Appendix)).
2.4.2 Data and sample overview
The primary data source used in this study is the Amadeus database, provided by Bureau van
Dijk. Amadeus contains accounting statements (e.g., balance sheets and income statements)
for private firms in Europe. Table 2.D1 (Appendix) outlines the sample selection process. I
restrict the sample to active German corporations that were established before the year 2007
in order to exclude start-up companies.20 Furthermore, I focus on corporations that are not
stand-alone21 and have current financial data. After restricting my data further to firms with
unconsolidated German-GAAP financial data, I exclude all types of partnerships that the
Amadeus database wrongly identified as corporations, to ensure that my sample includes only
companies, which determine and tax their profits according to the German Corporate Income
Tax Act.22
After selecting the firms, I hand-collect data on ownership structures from the Amadeus
database and the commercial register entries for each corporation.23 Recent empirical studies
exploit static ownership structures, which depend on the latest database updates (e.g.,
Michaely and Roberts, 2011) or the date of the survey (e.g., Nagar et al., 2011). Data on
comprehensive and detailed ownership structures are rare (e.g., Jacob and Michaely, 2017).
The hand-collected data allow me to observe dynamic ownership structures for every year of
my sample so that I can precisely observe changes in the ownership structure and hence the
reaction of corporate shareholders with minority stakes to the dividend tax reform.
To be part of my sample, the previously selected German corporations had to have at least one
German corporate shareholder with a directly held ownership stake of less than 20% during
20 The overall data collection process lasted from the mid of 2018 until the mid of 2019. 21 The corporation has a corporate global ultimate owner in the EU. This characteristic allows me to employ my
third cross-sectional test. I restrict my sample to global ultimate owners, which are resident in the EU because
EU regulations and the common market support the comparability between my observations. 22 In addition, I verify whether my sample includes tax group structures as then a minority shareholder receives
a compensation payment instead of dividends. To mitigate this issue, I check all corporations with a profit of
zero, which can be an indicator for a profit transfer agreement and hence a tax group (Oestreicher and Koch,
2010). However, my sample does not include potential tax group structures. 23 The Amadeus database only provides the most recent ownership structure. However, the download of the
ownership history per company is possible but requires a single export per company.

Private Firm and Shareholder Response to Dividend Taxation: Evidence from the Taxation
of Corporate Minority Shareholders
26
the years 2010 until 2012 (pre-reform).24 I exclude observations with missing ownership
stakes. To avoid confounding events and reactions, I check for restructuring processes25 (e.g.,
mergers and takeovers) during the sample period, as well as potential bankruptcies by
requiring that firms and shareholders were active for three years after the sample period ends
(from 2016 to 2018). In addition, I exclude corporate shareholders that are non-profit
corporations, public institutions, banks, holding and insurance companies because the
dividend tax reform did not apply to them. Further, I also exclude firms and shareholders that
are listed on a stock exchange to ensure that all of the firms and shareholders operate on illiquid
markets. Finally, I check for indirect ownership stakes of shareholders and exclude
shareholders with a total ownership stake above 20% to enhance the comparability between
shareholders from the treatment and the control group and hence avoid any misspecifications
in my identification strategy.
The final sample comprises 4,074 firm-shareholder-year observations for the years 2010 to
2015. Table 2.2 provides information about the sample distribution. The 4,074 firm-
shareholder-year observations comprise 2,970 treated observations and 1,104 observations
from the control group (Panel A). Panel B reveals that my sample consists of 495 observations
from the treatment group and 184 observations from the control group per year. In Panel C, I
provide the sample distribution of firm-shareholder-year observations per firm-level and
shareholder-level industry. Panel C shows that industries are, in general, evenly distributed
between not only firms and shareholders but also between the treated and control observations.
24 I employ a rather restrictive identification strategy to ensure that shareholders from the treatment and control
group are comparable and do not only follow short-term investment incentives. However, I test the robustness of
the results for my two hypotheses by employing an identification strategy, which requires that the German
corporations had at least one German corporate shareholder with a directly held ownership stake of less than 20%
in 2012 (the year before the reform). I use the less restrictive sample over a period from 2012-2015 and re-
estimate my two baseline DiD regressions (Eq. (1) and (2)). The results are fully consistent with my main
findings, indicating that my restrictive identification strategy does not affect my results (see Table 2.D2
(Appendix)). 25 I check for restructuring processes by using the database Northdata, which provides company information on
German firms.

Private Firm and Shareholder Response to Dividend Taxation: Evidence from the Taxation
of Corporate Minority Shareholders
27
Table 2.2: Sample description
Panel A: Sample distribution
Number of firm-shareholder-
year observations
Number of
firms
Number of
shareholders
Treatment group 2,970 311 360
Control group 1,104 159 136
Total 4,074 470 496
Panel B: Sample distribution of firm-shareholder observations per year
2010 2011 2012 2013 2014 2015 Total
Treatment group 495 495 495 495 495 495 2,970
Control group 184 184 184 184 184 184 1,104
Total 679 679 679 679 679 679 4,074
Panel C: Sample distribution of firm-shareholder-year observations per industry
Firm industry Shareholder industry
Treated Control Treated Control
Obs. % Obs. % Obs. % Obs. %
1) Agriculture, forestry, fishing 78 2.63 24 2.17 168 7.45 36 4.17
2) Mining, quarrying 0 0.00 24 2.17 12 0.53 18 2.08
3) Manufacturing 390 13.13 144 13.04 180 7.98 90 10.42
4) Electricity, gas, steam 156 5.25 102 9.24 180 7.98 66 7.64
5) Water, waste management, sewerage 108 3.64 36 3.26 66 2.93 12 1.39
6) Construction 72 2.42 30 2.72 108 4.79 18 2.08
7) Wholesale, retail, repair of vehicles 306 10.30 120 10.87 204 9.04 84 9.72
8) Transporting, storage 174 5.86 54 4.89 84 3.72 48 5.56
9) Accommodation, food service 42 1.41 0 0.00 0 0.00 0 0.00
10) Information, communication 246 8.28 120 10.87 48 2.13 54 6.25
11) Finance, insurance 84 2.83 30 2.72 0 0.00 0 0.00
12) Real estate activities 324 10.91 84 7.61 384 17.02 24 2.78
13) Professional, technical activities 588 19.80 144 13.04 642 28.46 282 32.64
14) Administrative, support service 222 7.47 72 6.52 114 5.05 102 11.81
15) Education 12 0.40 24 2.17 0 0.00 0 0.00
16) Healthcare, social work 36 1.21 12 1.09 18 0.80 18 2.08
17) Arts, entertainment 30 1.01 30 2.72 0 0.00 6 0.69
18) Other services activities 102 3.43 54 4.89 48 2.13 6 0.69
Total 2,970 100 1,104 100 2,256 100 864 100
Notes: This table provides details on the sample distribution (Panel A), which is divided into the sample
distribution of firm-shareholder observations per year (Panel B) and the sample distribution of firm-shareholder-
year observations per industry (Panel C). The industry classification in Panel C is based on NACE codes. While
the total number of firm industry observations in Panel C is 4,074, the number of shareholder industry
observations is 3,120 because I do not observe the NACE code for every shareholder in my sample.

Private Firm and Shareholder Response to Dividend Taxation: Evidence from the Taxation
of Corporate Minority Shareholders
28
Table 2.3: Sample statistics
Panel A: Firm-shareholder observations
Sample: 2010-2015 N Mean StDev P25 P50 P75
Treatment group
Shareholdings 2,970 3.51 2.76 1.00 3.06 5.50
Size 2,643 8.90 2.07 7.64 8.68 10.10
Cash 2,643 0.20 0.25 0.01 0.09 0.34
Leverage 2,643 0.41 0.95 0.11 0.29 0.52
Size_SH 1,480 10.07 2.73 7.93 9.93 11.82
Cash_SH 1,480 0.10 0.15 0.01 0.04 0.12
Leverage_SH 1,480 0.41 0.84 0.13 0.33 0.57
Control group
Shareholdings 1,104 12.95 3.07 10.00 12.50 15.00
Size 988 8.54 2.16 7.10 8.60 9.61
Cash 988 0.17 0.23 0.01 0.06 0.25
Leverage 988 0.42 0.46 0.16 0.34 0.59
Size_SH 523 9.90 2.87 7.58 9.38 11.73
Cash_SH 523 0.11 0.17 0.01 0.04 0.15
Leverage_SH 523 0.32 0.28 0.09 0.24 0.48
Panel B: Firm-level observations
Sample: 2010-2015 N Mean StDev P25 P50 P75
Treatment group
Av_SH 1,532 3.80 2.74 1.00 4.34 5.68
Size 1,532 9.03 2.24 7.54 9.00 10.36
Cash 1,532 0.15 0.23 0.00 0.04 0.18
Leverage 1,532 0.46 1.22 0.11 0.29 0.58
Payout 761 0.03 0.15 0.00 0.01 0.07
Own holdings 1,532 0.57 3.10 0.00 0.00 0.00
Large_SH 1,532 82.12 20.53 69.90 94.00 95.00
Number of owners 1,532 4.46 6.88 2.00 2.00 4.00
Control group
Av_SH 736 13.07 3.11 10.00 12.50 15.00
Size 736 8.33 2.21 6.86 8.35 9.32
Cash 736 0.18 0.23 0.01 0.06 0.26
Leverage 736 0.42 0.50 0.14 0.34 0.59
Payout 347 0.06 0.13 0.00 0.03 0.10
Own holdings 736 0.29 2.02 0.00 0.00 0.00
Large_SH 736 68.01 19.84 51.42 74.95 85.00
Number of owners 736 3.63 2.26 2.00 3.00 4.00
Notes: This table provides summary statistics for the period 2010-2015 for different samples: Panel A is based
on firm-shareholder-year-level observations, and Panel B is based on firm-year-level observations. All variables
are defined in Table 2.D3 (Appendix).
Table 2.3 presents summary statistics separately for treatment and control group observations
based on firm-shareholder-level (Panel A) and firm-level data (Panel B).26 Table 2.D3
26 Since my final sample with controls is not balanced due to missing data, I test the robustness of the results for
my two hypotheses if I force the sample to be balanced. I use the balanced sample to re-estimate my two baseline
DiD regressions (Eq. (1) and (2)). The results are fully consistent with my main findings, indicating that missing
observations do not affect my results (see Table 2.D4 (Appendix)).

Private Firm and Shareholder Response to Dividend Taxation: Evidence from the Taxation
of Corporate Minority Shareholders
29
(Appendix) lists detailed variable definitions. The results of the summary statistics in Table
2.3 show that corporate shareholders have on average a minority stake of 3.51% in a German
corporation and that corporate shareholders from the control group own on average a stake of
12.95% in a German corporation. This implies that shareholders from the control group do not
own sufficient shares to be involved in the firm’s decision-making process and as a result, are
comparable to treated corporate shareholders. With regard to the firm and shareholder control
variables, observations from the treatment and control group are very similar in terms of size,
cash and leverage.
2.4.3 Parallel trends
One crucial assumption of my identification approach using DiD analyses is the parallel trend
in my treatment and control group. I test for the parallel trends of my two main dependent
variables by estimating a version of my baseline models (Eq. (1) and (2)), in which I replace
the DiD indicator (Post x Treatment) with a series of five separate DiD indicator variables,
each marking one year over the period between 2010 and 2015. I omit the indicator for the
year 2012 because this year serves as the benchmark. The purpose of these tests is to check
whether my dependent variables are trending and to observe whether the differences in the
outcome variables between the treated and control group are significant in the pre-reform
period. Since the parallel trend assumption requires that my dependent variables remain
parallel between both groups, I expect the point-estimates in the pre-reform period to be
insignificant.
Figure 2.1 provides point-estimates and two-tailed 95% confidence intervals for my treated
versus control observations when using Payout (Panel A) and Shareholdings (Panel B) as the
dependent variable, respectively. The results suggest that the pre-reform treatment effects
(2010-2012) are insignificant for each of the dependent variables. Overall, Figure 2.1 provides
support for the parallel trends in my sample and supports my expectation that neither firms
nor corporate shareholders were able to anticipate the inter-corporate dividend tax reform. In
addition to the test of parallel trends in the pre-reform period, Figure 2.1 provides first insights
into the post-reform effects (2013-2015). The treatment effects in Panel B are significantly
negative, indicating that treated corporate shareholders reduce their ownership stakes relative
to corporate shareholders from the control group. Panel A reveals that firms with at least one
corporate shareholder owning a minority stake do not significantly change their payout relative
to the firms in my control group. These first indications are further examined in the next
section.

Private Firm and Shareholder Response to Dividend Taxation: Evidence from the Taxation
of Corporate Minority Shareholders
30
Figure 2.1: Parallel trends
Panel A
Trends of payout over time
Panel B
Trends of corporate shareholdings over time
Notes: This figure provides statistical evidence that pre-reform trends in payout (Panel A) and ownership stakes
(Panel B) are similar, even though the dividend tax reform results in a significant decrease in the shareholdings
of affected shareholders but does not significantly change the payout of affected firms. In Panel A, the point-
estimators are generated by estimating the following regression model: Payoutjt = β0 + β12010t x Treatmentj +
β22011t x Treatmentj + β32013t x Treatmentj + β42014t x Treatmentj + β52015t x Treatmentj + 𝛿Firm_Controlsjt +
αj + εjt (Eq. (1)). In Panel B, the point-estimators are generated by estimating the following regression model:
Shareholdingsijt = β0 + β12010t x Treatmentij + β22011t x Treatmentij + β32013t x Treatmentij + β42014t x
Treatmentij + β52015t x Treatmentij + 𝛿Firm_Controlsjt + 𝛾Shareholder_Controlsit + αij + εijt (Eq. (2)). Since I
omit the DiD indicator for the year 2012 in both regression models, this year serves as the benchmark year. The
solid points indicate point-estimates and the lines represent 95% confidence intervals.
2.5 Main results
2.5.1 Dividend payout
In my first set of analyses, I examine whether firms with at least one corporate shareholder
owning a minority stake respond to the change in dividend taxation (Hypothesis 1). I test
-1.4
-1.2
-1
-0.8
-0.6
-0.4
-0.2
0
0.2
Estimated treatment effects (together with 95%
confidence interval)
-0.12
-0.08
-0.04
0
0.04
0.08
Estimated treatment effects (together with 95%
confidence interval)
2010 2011 2012 2013 2014 2015
2010 2011 2012 2013 2014 2015

Private Firm and Shareholder Response to Dividend Taxation: Evidence from the Taxation
of Corporate Minority Shareholders
31
Hypothesis 1 using my DiD approach based on firm-level data (Eq. (1)). Since I do not have
data on dividends (and repurchases), I use a Payout proxy, which is defined as profit/loss after
tax net of changes in other equity scaled by the prior year’s total assets (see Bethmann et al.,
2018). Panel A of Table 2.4 reports OLS regression results for my baseline model. I estimate
two specifications: DiD model with fixed effects but without controls (Column 1), and a fully
specified DiD model with fixed effects and firm controls (Column 2 as defined in Eq. (1)).
Table 2.4: Effect of dividend taxation on payout
Panel A: Payout
(1) (2)
Dependent variable: Payout Payout
Post x Treatment -0.00370 -0.00148
(0.0124) (0.0119)
Size -0.0303**
(0.0143)
Cash -0.0323
(0.0851)
Leverage 0.00337
(0.00710)
Firm controls None Included
Firm FE Included Included
Year FE Included Included
Adj. R² 0.537 0.549
N 1,108 1,036
Panel B: Alternative dependent variables
(1) (2) (3)
Dependent variable: Payout1 Payout2 Own holdings
Post x Treatment -0.0152 -0.00419 0.0643
(0.0450) (0.0119) (0.0980)
Firm controls Included Included Included
Firm FE Included Included Included
Year FE Included Included Included
Adj. R² 0.268 0.546 0.906
N 1,036 1,036 2,268
Notes: The dependent variable in Panel A is Payout. Panel A reports two different specifications: (1) regression
with fixed effects but without firm controls, and (2) regression with fixed effects and firm controls. The dependent
variable in Panel B is Payout1 in Column 1, Payout2 in Column 2, and Own holdings in Column 3. Panel B
reports regressions with fixed effects and firm controls. The main variable of interest in the multivariate models
of both panels is the interaction term Post x Treatment, capturing the difference-in-differences effect. The
interaction term Post x Treatment equals 1 for treated firms in the post treatment period 2013-2015 and 0
otherwise. All variables are defined in Table 2.D3 (Appendix). All regression models have standard errors that
are heteroscedasticity-robust and clustered at the firm level. Reported values: coefficient (standard errors) and
*** (**) (*) indicate significance levels at 1% (5%) (10%), two-tailed.
Overall, the findings in Panel A of Table 2.4 provide the following insights. First, the estimated
average treatment effect is (as predicted) insignificant for both specifications. Second, the
magnitudes of the coefficient estimates are very small and close to zero. Third, the p-values
are extremely high (p-value of 0.766 and 0.901 in Column 1 and 2, respectively). All three

Private Firm and Shareholder Response to Dividend Taxation: Evidence from the Taxation
of Corporate Minority Shareholders
32
findings indicate that, on average, the payouts of firms with corporate shareholders owning
minority stakes do not change after the dividend tax reform relative to the payout of firms with
corporate shareholders that own a stake of at least 10% but less than 20% in the pre-reform
period. These results confirm my first hypothesis and are consistent with my prediction that a
dividend tax increase, which affects a particular group of shareholders without sufficient
voting power, does not influence a firm’s payout decision.27, 28
Next, I test the robustness of my results by using alternative dependent variables. Since my
dependent variable can only approximate dividend payouts but does not allow for a separation
between dividends and repurchases due to data limitations in the Amadeus database, I employ
three alternative dependent variables to test the robustness of my proxy and to mitigate any
concern that repurchases might affect my results. First, I calculate Payout1 as profit/loss after
tax net of the change in other equity scaled by the sum of profit/loss after tax and the prior
year’s other equity (Oestreicher et al., 2014). Second, I define Payout2 as profit/loss after tax
net of the change in total equity scaled by the prior year’s total assets (Bethmann et al., 2018).
Third, I employ Own holdings as a dependent variable to approximate repurchases, which are
not affected by the dividend tax reform. If firms do not replace dividend payments with
repurchases after the dividend tax reform, I expect the average treatment effect to be
insignificant.
Panel B of Table 2.4 reports the results from OLS regressions with my three alternative
dependent variables: Payout1 (Column 1), Payout2 (Column 2), and Own holdings (Column
3). Overall, the results reveal that the estimated average treatment effect is insignificant across
all specifications, which is consistent with the results in Panel A of Table 2.4. The robustness
checks suggest that my payout proxy is robust to alternative variable definitions. In addition,
own holdings are not significantly affected by the dividend tax reform, indicating that firms
do not predominantly replace dividends with repurchases.
2.5.2 Corporate shareholder’s minority stake
In the next step, I examine whether corporate shareholders reduce their minority stakes after
the dividend tax reform. I test Hypothesis 2 by using my DiD approach based on firm-
shareholder-level data (Eq. (2)). Panel A of Table 2.5 reports OLS regression results for my
27 This result should be interpreted carefully because an insignificant result only means that the null hypothesis
cannot be rejected. It does not mean that the null hypothesis is confirmed. However, my results show very small
coefficients of around zero and very high p-values, which suggest a small type 2 error. 28 I discuss alternative explanations for my results in Appendix 2.A (Appendix).

Private Firm and Shareholder Response to Dividend Taxation: Evidence from the Taxation
of Corporate Minority Shareholders
33
baseline model. I estimate three specifications: DiD model with fixed effects but without
controls (Column 1), DiD model with fixed effects and firm controls (Column 2), and a fully
specified DiD model with fixed effects, firm and shareholder controls (Column 3 as defined
in Eq. (2)).
Overall, the findings in Panel A of Table 2.5 provide the following insights. First, the estimated
average treatment effect is (as predicted) negative and significant at conventional levels (p-
value < 0.01), which confirms my second hypothesis. Second, the statistical significance and
magnitude of the coefficient estimates are similar across the three specifications, indicating
that my results are robust against changes in the composition of the sample. Third, the
magnitude of the coefficient estimates is economically significant. Column 3 (Column 2)
reveals that corporate shareholders reduce their minority stake in a German corporation by
about 0.53 (0.7) percentage points relative to corporate shareholders in the control group.
Given that the average minority stake of corporate shareholders in the pre-reform sample is
about 3.89%, minority shareholdings of corporate shareholders decrease by 13.6% (18%).29
To test the robustness of my results, I use alternative dependent variables based on firm-
shareholder-level and firm-level data, respectively, to mitigate any concern that the
distribution of ownership stakes could influence my results. First, I replace the dependent
variable Shareholdings with SH_change, which is defined as the change in the ownership stake
scaled by the prior year’s ownership stake. Second, I conduct firm-level tests of my baseline
model (Eq. (1)) and use Av_SH and Av_SH_change as dependent variables, respectively.
Av_SH is the average stake of all German corporate shareholders that own a minority stake in
a treated firm. If the firm belongs to the control group, Av_SH is the average ownership stake
of all German corporate shareholders that own a stake of at least 10% but less than 20% in the
control firm. Av_SH_change is then defined as the change in the average ownership stake
scaled by the prior year’s average ownership stake.
29 Table 2.D5 (Appendix) contains descriptive statistics of the pre-reform sample.

Private Firm and Shareholder Response to Dividend Taxation: Evidence from the Taxation
of Corporate Minority Shareholders
34
Table 2.5: Effect of dividend taxation on corporate shareholders’ ownership stakes
Panel A: Minority stakes of corporate shareholders
(1) (2) (3)
Dependent variable: Shareholdings Shareholdings Shareholdings
Post x Treatment -0.673*** -0.699*** -0.533***
(0.123) (0.133) (0.135)
Size -0.295*** -0.324***
(0.0992) (0.103)
Cash -0.128 0.443*
(0.263) (0.234)
Leverage 0.0255 0.0150
(0.0409) (0.0401)
Size_SH 0.304*
(0.167)
Cash_SH -0.413
(0.551)
Leverage_SH -0.122***
(0.0157)
Firm controls None Included Included
Shareholder controls None None Included
Firm-shareholder FE Included Included Included
Year FE Included Included Included
Adj. R² 0.955 0.954 0.965
N 4,074 3,631 2,003
Panel B: Alternative specifications
Firm-shareholder-level tests Firm-level tests
(1) (2) (3) (4)
Dependent variable: SH_change SH_change Av_SH Av_SH_change
Post x Treatment -0.114*** -0.100*** -0.810*** -0.106***
(0.0207) (0.0351) (0.166) (0.0142)
Firm controls Included Included Included Included
Shareholder controls None Included None None
Firm FE None None Included Included
Firm-shareholder FE Included Included None None
Year FE Included Included Included Included
Adj. R² 0.033 0.027 0.954 0.037
N 3,563 1,976 2,268 2,226
Notes: The dependent variable in Panel A is Shareholdings. Panel A reports three different specifications: (1)
regression with fixed effects but without controls, (2) regression with fixed effects and firm controls, and (3)
regression with fixed effects, firm and shareholder controls. All regressions in Panel A are based on firm-
shareholder-level observations. The dependent variable in Panel B is SH_change in Column 1 and 2, Av_SH in
Column 3, and Av_SH_change in Column 4. The regressions in Column 1 and 2 are based on firm-shareholder-
level observations and include (1) fixed effects and firm controls, and (2) fixed effects, firm and shareholder
controls. The regressions in Column 3 and 4 are based on firm-level observations and include fixed effects and
firm controls. The main variable of interest in the multivariate models of both panels is the interaction term Post
x Treatment, capturing the difference-in-differences effect. When conducting firm-level (firm-shareholder-level)
tests, the interaction term Post x Treatment equals 1 for treated firms (for firm-shareholder observations with
treated corporate shareholders) in the post treatment period 2013-2015 and 0 otherwise. All variables are defined
in Table 2.D3 (Appendix). All regression models have standard errors that are heteroscedasticity-robust and
clustered at the firm-shareholder level in Panel A and Column 1 and 2 of Panel B or at the firm level in Column
3 and 4 of Panel B. Reported values: coefficient (standard errors) and *** (**) (*) indicate significance levels at
1% (5%) (10%), two-tailed.

Private Firm and Shareholder Response to Dividend Taxation: Evidence from the Taxation
of Corporate Minority Shareholders
35
Panel B of Table 2.5 reports the results from OLS regressions based on firm-shareholder-level
tests (Column 1 and 2) and firm-level tests (Column 3 and 4) with three alternative dependent
variables: SH_change (Column 1 and 2), Av_SH (Column 3), and Av_SH_change (Column 4).
Overall, the results reveal that the estimated average treatment effect is negative and
significant across all specifications, which is consistent with my results in Panel A of Table
2.5.30
In a further robustness test, I address the concern that observable firm and shareholder
characteristics can potentially vary before and after the reform and across the treatment and
control group. I therefore estimate a fully interacted model with additional interactions for
each control variable with the Post and the Treatment dummy, respectively. I test two
specifications: DiD model with fixed effects, firm controls and additional interactions with
firm controls, as well as a DiD model with fixed effects, firm and shareholder controls, and
additional interactions with firm and shareholder controls. The results are reported in Table
2.D7 (Appendix).31 Again, the findings are fully consistent with my baseline estimates.
In addition, I split my control group into two separate groups: (1) corporate shareholders with
an ownership stake of at least 10% but less than 15% in another corporation in the pre-reform
period, and (2) corporate shareholders with an ownership stake of at least 15% but less than
20% in another corporation during the pre-reform period. I split the control group at the
ownership stake of 15%, as this threshold affects the dividend tax burden (see Table 2.1).
Results are reported in Table 2.D8 (Appendix). My findings are consistent with my baseline
results, indicating that the difference in the dividend tax burden across both control groups
does not affect my baseline results.
Finally, I test the robustness of my results by using a simultaneous equations approach
following Blouin et al. (2011). A simultaneous equations approach permits a joint estimation
of firm and corporate shareholder responses to the dividend tax reform. This econometric
approach addresses the potential identification problem that both corporate shareholders and
firms can change their behaviour after a change in dividend taxes. Appendix 2.B provides the
30 To mitigate the concern that the average negative treatment effect is concentrated among corporate
shareholders with small minority stakes, I re-estimate my OLS regression (Eq. (2)) with SH_change as the
dependent variable and investigate whether the treatment effect varies with the average minority stake in the pre-
reform period (see Table 2.D6 (Appendix)). The results show that the coefficient estimates across all
specifications are, in general, statistically significant, indicating that corporate shareholders with small and
corporate shareholders with large minority stakes react to the dividend tax reform. However, shareholders with
large minority stakes have a smaller treatment effect than shareholders with small minority stakes. The difference
in coefficient estimates is statistically significant for the median and 75th percentile split. 31 Table 2.D7 (Appendix) also reports the results for a fully interacted model of Eq. (1) with Payout as the
dependent variable. The finding is fully consistent with my baseline result in Section 2.5.1.

Private Firm and Shareholder Response to Dividend Taxation: Evidence from the Taxation
of Corporate Minority Shareholders
36
empirical strategy of my simultaneous equations approach and reports the results. Consistent
with my findings above, the results of the simultaneous equations approach suggest that
corporate shareholders reduce their minority stake after the dividend tax increase while firms
do not alter their payouts.
In sum, the results from my two baseline analyses (Hypothesis 1 and 2 in Section 2.5.1 and
2.5.2) reveal the following insights. First, firms do not change their payout if a dividend tax
reform affects only a specific shareholder group without significant voting power. Second,
corporate shareholders reduce their minority stake when they face an increase in dividend
taxes.
2.5.3 Heterogeneity in the dividend tax response of shareholders
In addition to the two hypotheses, I examine the cross-sectional variation in the effect of the
dividend tax increase on the response of corporate shareholders with minority stakes. Since I
have data on firms, corporate shareholders and the direct ownership stake of the corporate
shareholder in the firm, I can examine important characteristics on all three levels. In Section
2.3.2, I identify the following four characteristics: the payout policy of the firm, the ownership
stake of the firm’s largest shareholder, the group affiliation of the firm and the corporate
shareholder with a minority stake, as well as the financial position of the corporate shareholder
owning a minority stake.
Table 2.6 reports the results of the four cross-sectional tests. I use my baseline DiD approaches
(Eq. (1) and (2)) but interact binary conditional variables with the DiD estimator Post x
Treatment in order to capture the cross-sectional variation in the baseline treatment effect. I
estimate DiD models with fixed effects and controls.
Column 1 of Table 2.6 reports the result of my first cross-sectional test, distinguishing between
firms with treated corporate shareholders that have a high and low payout in the pre-reform
period. This regression aims at testing a firm-level characteristic (Eq. (1)). Therefore, I use the
average ownership stake of treated shareholders or control shareholders in each firm as the
dependent variable (Av_SH). I define high payout (low payout) as an indicator equal to 1 for
treated firms with an average payout in the pre-reform period, which is above (below) the
mean of treated firms’ payouts in the pre-reform period. Consistent with my prediction, I find
that the treatment effect for firms with a high payout in the pre-reform period is significant
and larger than the insignificant coefficient for firms with a low payout in the pre-reform
period. The difference in coefficient estimates is statistically significant at conventional levels.

Private Firm and Shareholder Response to Dividend Taxation: Evidence from the Taxation
of Corporate Minority Shareholders
37
Table 2.6: Effect of dividend taxation on corporate ownership stakes – cross-sectional
findings
Firm-level tests
Firm-
shareholder-level
test
Shareholder-
level test
(1) (2) (3) (4)
Dependent variable: Av_SH Av_SH Shareholdings Av_SH
Post x Treatment x high payout -0.642***
(0.181)
Post x Treatment x low payout 0.414
(0.435)
Post x Treatment x maj_SH -0.852***
(0.176)
Post x Treatment x no maj_SH -0.481***
(0.186)
Post x Treatment x same GUO -0.0788
(0.165)
Post x Treatment x different GUO -0.559***
(0.142)
Post x Treatment x financial distress -0.629***
(0.190)
Post x Treatment x no financial distress -0.151
(0.167)
F-test for differences [p-value] [0.025] [0.061] [0.004] [0.017]
Firm controls Included Included Included None
Shareholder controls None None Included Included
Firm FE Included Included None None
Shareholder FE None None None Included
Firm-shareholder FE None None Included None
Year FE Included Included Included Included
Adj. R² 0.967 0.954 0.971 0.976
N 1,574 2,268 1,752 1,216
Notes: This table reports cross-sectional tests based on firm-level observations (Column 1 and 2), firm-
shareholder-level observations (Column 3), and shareholder-level observations (Column 4). The dependent
variable is Av_SH in Column 1, 2 and 4, and Shareholdings in Column 3. Regression models include additional
interaction terms based on conditional variables to assess the cross-sectional variation in the baseline treatment
effect. The following conditional variables are used: (1) high (low) payout equals 1 if the average payout proxy
of a treated firm in the pre-reform period is above (below) the mean across all treated firms in the pre-reform
period, (2) maj_SH (no maj_SH) equals 1 if the treated firm has a (no) majority shareholder in the year prior to
the reform, (3) same (different) GUO equals 1 if the treated shareholder and firm have the same (a different)
global ultimate owner, and (4) (no) financial distress equals 1 if the treated shareholder has an Altman z-score
below (above) the 75th quartile in the year prior to the reform. All variables are defined in Table 2.D3 (Appendix).
All regression models have standard errors that are heteroscedasticity-robust and clustered at the firm level in
Column 1 and 2, firm-shareholder level in Column 3 or shareholder level in Column 4. Reported values:
coefficient (standard errors) and *** (**) (*) indicate significance levels at 1% (5%) (10%), two-tailed.
Second, Column 2 of Table 2.6 reports the result of my second cross-sectional test. I
distinguish between treated firms with a majority shareholder and treated firms without a
majority shareholder prior to the reform. Since the regression once again aims at testing a firm-
level characteristic (Eq. (1)), I use the average ownership stake of treated shareholders or
control shareholders in each firm as the dependent variable (Av_SH). I define maj_SH (no
maj_SH) as an indicator variable equal to 1 for treated firms with (without) a majority

Private Firm and Shareholder Response to Dividend Taxation: Evidence from the Taxation
of Corporate Minority Shareholders
38
shareholder in the year before the reform. Consistent with my prediction, the result shows a
significant treatment effect for treated firms with a majority shareholder, which is larger
compared to treated firms without a majority shareholder. The difference in coefficient
estimates is statistically significant at a conventional level. The result suggests that potential
shareholder conflicts between majority and minority shareholders increase the responsiveness
of corporate shareholders with minority stakes to the dividend tax increase.
Column 3 of Table 2.6 reports the result of my third cross-sectional test. I compare the
dividend tax responsiveness of corporate shareholders that have the same global ultimate
owner as the firm in which they own a minority stake with corporate shareholders that have a
different global ultimate owner than the firm in which they own a minority stake. The
regression is based on firm-shareholder-level observations to exploit every single firm and
shareholder relation (see Eq. (2)). I define different GUO (same GUO) as an indicator variable
equal to 1 if the treated corporate shareholder and the firm have a different (the same) global
ultimate owner in the pre-reform period.32 The strong and significant result shows that
corporate shareholders are more responsive to the dividend tax increase if they are not
affiliated to the same group as the firm in which they own a minority stake. The difference in
coefficient estimates is statistically significant at conventional levels. The result indicates that
a group might employ tax-planning strategies to avoid the dividend tax burden at the minority
shareholder level without adjusting the ownership structure.
Finally, Column 4 of Table 2.6 reports the result of my fourth cross-sectional test, which
compares the dividend tax responsiveness of financially distressed with non-financially
distressed corporate shareholders owning minority stakes. This regression aims at testing a
shareholder-level characteristic. I therefore use the corporate shareholder-specific average
ownership stake of treated shareholdings and shareholdings from the control group as the
dependent variable (Av_SH). I use Altman’s z-score for private firms as a proxy for financial
distress (Altman, 2000).33 I define financial distress (no financial distress) as an indicator
variable equal to 1 for corporate shareholders with an Altman z-score below (above) the 75th
percentile of all treated shareholders in the year prior to the reform. The result is consistent
with my prediction. I find evidence that financially constrained corporate shareholders have a
32 One drawback of this binary variable is that I only have information on the global ultimate owner based on the
latest update in Amadeus. I therefore assume in this specification that the global ultimate owner is constant
(Michaely and Roberts, 2011). I mitigate the concern that the global ultimate owner changed over time by
controlling for restructuring processes (M&As) at the firm and shareholder level. 33 Because I do not observe retained earnings in my data, I have to modify the original Altman’s z-score for
private firms. This modification should not affect my results because I split the treatment sample according to
the 75th percentile and not the critical value of 1.23, as suggested by Altman (2000).

Private Firm and Shareholder Response to Dividend Taxation: Evidence from the Taxation
of Corporate Minority Shareholders
39
strong and significantly larger response to the dividend tax increase compared to corporate
shareholders in a better financial position. The difference in coefficient estimates is
statistically significant at conventional levels.
Overall, the results of my cross-sectional tests are consistent with my predictions, indicating
that firm and shareholder characteristics as well as the relation between the shareholder and
the firm affect the dividend tax responsiveness of shareholders. Besides firm-specific payout
decisions and the financial position of the treated shareholder, the dividend tax response is
also conditional upon potential agency issues and the affiliation of the treated shareholder and
firm to the same group. The heterogeneity in the dividend tax response implies that different
characteristics have to be considered to understand the reaction of shareholders.34
2.6 Additional analyses
2.6.1 Indirect effects of the dividend tax reform
In this section, I examine the indirect effects of the dividend tax reform. Although corporate
shareholders with minority stakes are directly affected by the increase in dividend taxes, other
shareholders are indirectly affected for at least two reasons. First, other shareholders can buy
the minority stake, which corporate shareholders want to sell after the dividend tax reform.
Second, the dividend tax increase might prevent other German corporate shareholders from
reducing their ownership stakes to less than 10% to avoid the higher dividend tax burden.
Since my main results in Section 2.5.2 indicate that, on average, corporate shareholders reduce
their minority stakes, it is still not clear who purchases the minority stakes. On the one hand,
the firm itself could repurchase the minority stake from the corporate shareholder.
Nevertheless, my analysis in Section 2.5.1 suggests that firms do not significantly increase
their own holdings after the dividend tax increase. On the other hand, new or existing
shareholders could also buy the minority stake from the corporate shareholder. However, since
private firms do not have a market for their shares, new investors do not have an easily
accessible way to purchase shares in a private firm (e.g., Bennedsen and Wolfenzon, 2000;
Nagar et al., 2011). Therefore, I predict that the sale of minority stakes results, on average, in
a decrease in the number of owners, indicating that new shareholders do not purchase the
34 In an additional test, I examine which of the characteristics prevail when shareholders completely sell their
minority stakes instead of only reducing their stakes. Therefore, I restrict my treatment group to shareholders
without a minority stake in at least one year of the post-reform period. I re-estimate the four cross-sectional tests
with the restricted sample (see Table 2.D9 (Appendix)). My results show that corporate shareholders have a
significantly larger response to the dividend tax reform if they have a minority stake in a firm with a majority
shareholder and do not belong to the same group as the firm in which they own the minority stake.

Private Firm and Shareholder Response to Dividend Taxation: Evidence from the Taxation
of Corporate Minority Shareholders
40
minority stakes. In contrast, existing shareholders could purchase the minority stakes.
However, since the number of owners in private firms is, in general, small and the power is
concentrated by the controlling shareholder, I expect that the shareholder with the largest
ownership stake, and hence the most voting rights and power, purchases the minority stake.
I test my predictions by re-estimating my baseline firm-level regression (Eq. (1)) and employ
#Owner (Column 1 and 2) and Large_SH (Column 3 and 4) as dependent variables. I define
#Owner as the natural logarithm of the number of owners of a firm. Large_SH is the largest
ownership stake that a shareholder owns in the firm. Table 2.7 reports the results from OLS
regressions with two specifications: DiD model with fixed effects but without firm controls
(Column 1 and 3), and DiD model with fixed effects and firm controls (Column 2 and 4). The
results in Table 2.7 provide two main insights. First, the number of owners decreases
significantly (p-value < 0.01) after the dividend tax reform, indicating that new shareholders
do not purchase the minority stakes and hence are not indirectly affected by the reform.
Second, the ownership stake of the shareholder with the largest ownership stake in the pre-
reform period increases significantly (p-value < 0.05) after the dividend tax reform, indicating
that corporate shareholders primarily sell their minority stakes to the shareholder with the
largest ownership stake in the firm.
Table 2.7: Indirect effects of the dividend tax reform
(1) (2) (3) (4)
Dependent variable: #Owner #Owner Large_SH Large_SH
Post x Treatment -0.121*** -0.130*** 1.764** 1.823**
(0.0231) (0.0248) (0.735) (0.776)
Firm controls None Included None Included
Firm FE Included Included Included Included
Year FE Included Included Included Included
Adj. R² 0.910 0.909 0.925 0.925
N 2,520 2,268 2,520 2,268
Notes: The dependent variable is #Owner in Column 1 and 2, and Large_SH in Column 3 and 4. The table reports
two different specifications: (1) regression with fixed effects but without controls (Column 1 and 3), and (2)
regression with fixed effects and firm controls (Column 2 and 4). All regressions are based on firm-level
observations. The main variable of interest in the multivariate models is the interaction term Post x Treatment,
capturing the difference-in-differences effect. The interaction term Post x Treatment equals 1 for treated firms in
the post treatment period 2013-2015 and 0 otherwise. All variables are defined in Table 2.D3 (Appendix). All
regression models have standard errors that are heteroscedasticity-robust and clustered at the firm level. Reported
values: coefficient (standard errors) and *** (**) (*) indicate significance levels at 1% (5%) (10%), two-tailed.
A potential concern of my DiD approach is that shareholders from the control group are
indirectly affected by the reform because they could potentially buy the minority stakes and
hence are not appropriate counterfactuals to my treated shareholders. However, the
identification strategy for my firm-level tests prohibits that shareholders from the control
group own a stake in the same firm as shareholders from the treatment group, which means

Private Firm and Shareholder Response to Dividend Taxation: Evidence from the Taxation
of Corporate Minority Shareholders
41
0
2
4
6
8
10
12
14
2010 2011 2012 2013 2014 2015
treated shareholders control shareholders
that a firm is not part of the treatment and the control group in my firm-level sample (see
Section 2.4.1). Therefore, if corporate shareholders from the control group want to purchase
the minority stakes, they would become new investors in the firm. However, the results in
Table 2.7 suggest that new investors do not buy minority stakes and hence are not indirectly
affected, which indicates that my control group contains appropriate counterfactuals in this
context.
In addition, my control group could also be indirectly affected by the reform as the dividend
tax increase might prevent other German corporate shareholders from reducing their
ownership stakes to less than 10%. However, prior studies show that the ownership structure
of private firms is, in general, stable (e.g., Jacob and Michaely, 2017; Berzins et al., 2018). In
Figure 2.2, I track the average ownership stakes of corporate shareholders with minority stakes
(blue line) and corporate shareholders in the control group (red line) over time in order to
verify whether the average ownership stakes of my control and treated shareholders are stable.
Figure 2.2: Graphic illustration of ownership stakes over time
Notes: This figure provides graphic illustrations of pre- and post-reform trends in ownership stakes (in %). The
figure plots the average ownership stake of corporate shareholders that own less than 10% (blue line) and
corporate shareholders that own at least 10% but less than 20% of another corporation’s shares in the pre-reform
period (red line). Ownership stake is the stake that a German corporate shareholder owns in another German
corporation in year t. The dashed vertical line highlights the year prior to the reform.
Figure 2.2 shows that prior to the reform, corporate shareholders’ minority stakes and non-
affected corporate shareholders’ ownership stakes are parallel and do not change over time.
However, minority stakes of corporate shareholders drop after 2012 while the average

Private Firm and Shareholder Response to Dividend Taxation: Evidence from the Taxation
of Corporate Minority Shareholders
42
ownership stake of corporate shareholders from the control group remains at the same level.
The almost constant average ownership stake of shareholders in my control group over time
indicates that shareholders do not adjust their ownership stakes regularly.
To further mitigate this concern, I use foreign corporate shareholders resident in the EU that
owned a minority stake in a German corporation during the pre-reform period as an alternative
control group. This control group has two main advantages. First, foreign corporate
shareholders with minority stakes have the same small ownership stake (less than 10%) as
treated shareholders. Second, since the dividend tax reform affects only German corporate
shareholders with minority stakes, the German withholding tax burden of foreign corporate
shareholders with minority stakes is not affected by the reform.35 In addition, after the dividend
tax reform, German corporate shareholders with minority stakes are, in general, subject to the
same German corporate tax burden on dividends compared to foreign corporate shareholders
resident in the EU. However, a drawback of this control group is the missing comparability
with German corporate shareholders based upon country-specific factors (e.g., cultural
differences of shareholders regarding their portfolio decisions). I mitigate this concern by
employing a thorough fixed effects structure and controlling for the dividend tax system in the
shareholder’s country of residence. I re-estimate my baseline models (Eq. (1) and (2)) with
my alternative control group. Appendix 2.C provides summary statistics and reports my
results. The findings are fully consistent with my main results in Section 2.5, indicating that
my DiD approach is valid.
2.6.2 Matching
My econometric approach could raise the concern that observations from the treatment and
control group are not comparable because differences in observable characteristics in the pre-
reform period across treated and control observations could drive unobserved differences in
35 In addition, the ECJ decided that Germany contradicts EU law by comparing foreign corporate shareholders
resident in the EU with German corporate shareholders both owning a minority stake (see Section 2.2), which
supports the comparability of both groups. However, it should be noted that foreign corporate shareholders with
minority stakes in German corporations were allowed to apply for a withholding tax refund after the ECJ decision
at the end of 2011 until the German law was passed at the beginning of 2013. Despite this possibility, I do not
expect that foreign corporate shareholders with minority stakes reacted to the ECJ decision for the following
reasons. First, the withholding tax refund for foreign corporate shareholders with minority stakes was only a
temporary possibility to achieve comparability with German corporate shareholders owning minority stakes until
the German government changed the taxation of inter-corporate dividends. Second, my identification process
requires that foreign corporate shareholders with minority stakes made their decision to invest in a German
corporation before the ECJ decision. Third, administrative burdens and compliance hurdles, e.g., extensive
reporting requirements and lengthy processes, complicate the reimbursement of withholding taxes (e.g., Jacob
and Todtenhaupt, 2020).

Private Firm and Shareholder Response to Dividend Taxation: Evidence from the Taxation
of Corporate Minority Shareholders
43
payout decisions and decisions to invest in shares. Although my DiD design already mitigates
this concern by employing time-varying controls as well as firm or firm-shareholder and year
fixed effects, I further re-estimate my baseline regressions (Section 2.4.1) based on an entropy-
balanced sample to ensure that treated and control observations are comparable in observable
characteristics (e.g., Hainmueller, 2012; Hainmueller and Xu, 2013).
I apply the matching procedure by matching on all of the covariates included, i.e., firm and/or
shareholder controls (Size, Cash and Leverage), in the year prior to the reform and set the
balancing constraint to the first moment (i.e., the mean). The entropy balancing method is used
to calculate weights, which I use to re-estimate my baseline regression models (Section 2.5.1
and 2.5.2). Table 2.8 reports the results from re-estimating Eq. (1) and (2) using entropy
balancing. First, I test two specifications for the firm-level tests with Payout as the dependent
variable: DiD model with fixed effects but without controls (Column 1), and DiD model with
fixed effects and firm controls (Column 2). Second, I test three specifications for the firm-
shareholder-level tests with Shareholdings as the dependent variable: DiD model with fixed
effects but without controls (Column 3), DiD model with fixed effects and firm controls
(Column 4), and DiD model with fixed effects, firm and shareholder controls (Column 5).
Table 2.8: Entropy balancing
Firm-level tests Firm-shareholder-level tests
(1) (2) (3) (4) (5)
Dependent variable: Payout Payout Shareholdings Shareholdings Shareholdings
Post x Treatment -0.00991 -0.00652 -0.535*** -0.482*** -0.470***
(0.0137) (0.0130) (0.161) (0.176) (0.177)
Firm controls None Included None Included Included
Shareholder controls None None None None Included
Firm FE Included Included None None None
Firm-shareholder FE None None Included Included Included
Year FE Included Included Included Included Included
Adj. R² 0.534 0.540 0.976 0.977 0.977
N 1,028 1,028 1,935 1,935 1,935
Notes: This table reports regressions based on a matched sample. I employ entropy balancing matching. The
dependent variable is Payout in Column 1 and 2, and Shareholdings in Column 3 to 5. The firm-level tests report
two specifications: (1) regression with fixed effects but without firm controls, and (2) regression with fixed
effects and firm controls. The firm-shareholder-level tests report three specifications: (3) regression with fixed
effects but without controls, (4) regression with fixed effects and firm controls, and (5) regression with fixed
effects, firm and shareholder controls. All variables are defined in Table 2.D3 (Appendix). All regression models
have standard errors that are heteroscedasticity-robust and clustered at the firm level in Column 1 and 2 or firm-
shareholder level in Column 3 to 5. Reported values: coefficient (standard errors) and *** (**) (*) indicate
significance levels at 1% (5%) (10%), two-tailed.
The results for my firm-level tests with Payout as the dependent variable (Column 1 and 2)
show insignificant treatment effects across the two specifications, which are in line with my
baseline findings (Table 2.4). Column 3 to 5 show the results from my firm-shareholder-level

Private Firm and Shareholder Response to Dividend Taxation: Evidence from the Taxation
of Corporate Minority Shareholders
44
tests with Shareholdings as the dependent variable. I find significant treatment effects with
similar economic magnitudes across all three specifications (p-value < 0.01). The results are
in line with my baseline findings (Table 2.5). Overall, the results in Table 2.8 do not suggest
that observable differences across observations from the treatment and control group confound
my baseline findings. In Table 2.D10 (Appendix), I re-estimate my cross-sectional tests (see
Section 2.5.3) based on entropy balancing weights. The results are fully consistent with my
findings in Table 2.6.
2.6.3 Placebo tests
To test the robustness of my results and challenge the validity of my exogenous shock
empirically, I conduct placebo tests (e.g., Dyreng et al., 2016). My rather restrictive
identification strategy requires that firms have at least one corporate shareholder with an
ownership stake of less than 20% during the pre-reform period (2010-2012) (see Section
2.4.2). Therefore, I can track whether the ownership stake changes in the pre-reform period
(see Figure 2.1). However, my identification strategy does not account for corporate
shareholders that could completely sell their stakes during the pre-reform period. To mitigate
the concern that firms and corporate shareholders anticipated the dividend tax reform after the
ECJ decision at the end of 2011, I extend my identification strategy and re-estimate my
baseline regressions (Eq. (1) and (2)) for two restricted sample periods (2010-2011 and 2011-
2012). Thus, the placebo treatment date is defined as the year 2011 (2012) for the sample
period 2010-2011 (2011-2012).
For the placebo test with 2011 (2012) as the treatment year, I require that a firm has at least
one corporate shareholder with an ownership stake of less than 20% in the year 2010 (2011).
The less restrictive identification strategy results in 8 additional shareholders (equal to 16 firm-
shareholder observations) in the sample period from 2010 to 2011, and 6 additional
shareholders (equal to 12 firm-shareholder observations) in the sample period from 2011 to
2012. The purpose of the placebo tests with the less restrictive identification strategies is to
examine whether my dependent variables reveal reactions before the actual treatment effect in
2013. I expect the DiD coefficient estimates during the pre-reform period (2010-2012) to
remain insignificant.
The results of both placebo tests are reported in Panel A and B of Table 2.9. I test each of the
placebo treatment dates with fixed effects and firm controls (Column 1 in Panel A and B) on
the dependent variable Payout. In addition, I examine the effect of each placebo treatment date

Private Firm and Shareholder Response to Dividend Taxation: Evidence from the Taxation
of Corporate Minority Shareholders
45
with fixed effects and firm controls (Column 2 in Panel A and B), and with fixed effects, firm
and shareholder controls (Column 3 in Panel A and B) on the dependent variable
Shareholdings. The results show that the placebo treatment effects are not statistically
significant and therefore support the validity of my exogenous shock. Moreover, the results of
the placebo tests complement my earlier analyses on the parallel trend assumption (see Section
2.4.3 and Figure 2.1) and further indicate that the change in minority shareholdings of
corporate shareholders in 2013 was not anticipated and could be attributed to the dividend tax
reform.
Table 2.9: Placebo analysis
Panel A: Sample period 2010-2011
Firm-level
test
Firm-shareholder-level tests
(1) (2) (3)
Dependent variable: Payout Shareholdings Shareholdings
2011 x Treatment 0.00251 -0.0236 -0.00146
(0.0272) (0.0396) (0.0305)
Firm controls Included Included Included
Shareholder controls None None Included
Firm FE Included None None
Firm-shareholder FE None Included Included
Year FE Included Included Included
Adj. R² 0.400 0.996 0.995
N 330 1,236 722
Panel B: Sample period 2011-2012
Firm-level
test
Firm-shareholder-level tests
(1) (2) (3)
Dependent variable: Payout Shareholdings Shareholdings
2012 x Treatment 0.0585 0.00703 -0.0334
(0.0384) (0.0848) (0.0247)
Firm controls Included Included Included
Shareholder controls None None Included
Firm FE Included None None
Firm-shareholder FE None Included Included
Year FE Included Included Included
Adj. R² 0.276 0.989 0.998
N 354 1,230 704
Notes: This table reports placebo tests for two sample periods (2010-2011 and 2011-2012) in which I define a
placebo treatment date as the year 2011 (Panel A) and 2012 (Panel B). The dependent variable is Payout in
Column 1 of Panel A and B, and Shareholdings in Column 2 and 3 of Panel A and B. The firm-level test reports
a regression with fixed effects and firm controls (Column 1 in Panel A and B). The firm-shareholder-level tests
report two specifications: (2) regression with fixed effects and firm controls, and (3) regression with fixed effects,
firm and shareholder controls. All variables are defined in Table 2.D3 (Appendix). All regression models have
standard errors that are heteroscedasticity-robust and clustered at the firm level in Column 1 of Panel A and B or
at the firm-shareholder level in Column 2 and 3 of Panel A and B. Reported values: coefficient (standard errors)
and *** (**) (*) indicate significance levels at 1% (5%) (10%), two-tailed.

Private Firm and Shareholder Response to Dividend Taxation: Evidence from the Taxation
of Corporate Minority Shareholders
46
2.6.4 Alternative dividend tax responses of shareholders
In this section, I discuss and examine two alternative responses of corporate shareholders with
minority stakes to the dividend tax reform in 2013: (1) delayed response to the dividend tax
increase, and (2) increase in ownership stakes after the dividend tax reform. First, I test for a
delayed response of corporate shareholders with minority stakes. Since the new dividend tax
regulation was passed very spontaneously on March 21, 2013, not all corporate shareholders
with minority stakes might have reacted immediately to the tax reform for several reasons. On
the one hand, treated minority shareholders have limited possibilities to adjust their ownership
stakes immediately as private companies operate on illiquid markets. On the other hand, as
many firms usually make decisions about their profit appropriation at the beginning of the year
or in early springtime, this coincided with the new law in 2013, making it plausible that some
treated shareholders had already received their dividends. Therefore, a reduction of minority
stakes could not have resulted in lower dividends and hence lower dividend tax payments in
2013. Given these reasons, corporate shareholders with minority stakes might have reacted at
the end of 2013 or at the beginning of 2014.
Table 2.10: Yearly treatment effects
(1) (2) (3)
Dependent variable: Shareholdings Shareholdings Shareholdings
2011 x Treatment 0.0431 -0.0240 -0.0257
(0.0562) (0.0454) (0.0416)
2012 x Treatment 0.00226 -0.0406 -0.0388
(0.0688) (0.0570) (0.0448)
2013 x Treatment -0.449*** -0.517*** -0.363***
(0.118) (0.120) (0.113)
2014 x Treatment -0.750*** -0.831*** -0.742***
(0.162) (0.173) (0.177)
2015 x Treatment -0.774*** -0.824*** -0.584***
(0.160) (0.171) (0.182)
Firm controls None Included Included
Shareholder controls None None Included
Firm-shareholder FE Included Included Included
Year FE Included Included Included
Adj. R² 0.955 0.954 0.964
N 4,074 3,631 2,003
Notes: The dependent variable is Shareholdings. I estimate the baseline model (Eq. (2)) for the entire sample
period from 2010-2015, in which I replace the DiD indicator (Post x Treatment) with a series of five separate
DiD indicator variables, each marking one year over the period between 2011 and 2015. I omit the indicator for
the year 2010 (2010 x Treatment) because this year serves as the benchmark. I estimate the yearly treatment
effects for three specifications: (1) regression with fixed effects and without controls, (2) regression with fixed
effects and firm controls, and (3) regression with fixed effects, firm and shareholder controls. All variables are
defined in Table 2.D3 (Appendix). All regression models have standard errors that are heteroscedasticity-robust
and clustered at the firm-shareholder level. Reported values: coefficient (standard errors) and *** (**) (*)
indicate significance levels at 1% (5%) (10%), two-tailed.

Private Firm and Shareholder Response to Dividend Taxation: Evidence from the Taxation
of Corporate Minority Shareholders
47
I test this presumption by re-estimating my baseline regression of the corporate shareholder’s
reaction to the dividend tax reform (Eq. (2)). However, I replace the DiD indicator (Post x
Treatment) with a series of five indicator variables, each marking one year over the period
from 2011 to 2015. I omit the indicator for the year 2010 (2010 x Treatment), which serves as
a benchmark. Column 1 to 3 of Table 2.10 report the results for the yearly treatment effects
with fixed effects but without controls (Column 1), with fixed effects and firm controls
(Column 2), and with fixed effects, firm and shareholder controls (Column 3). The results
show a reduction in minority stakes of corporate shareholders in 2013 and 2014. However, the
results do not suggest an additional decrease in minority stakes of corporate shareholders in
2015. This finding is consistent with the graphic evidence in Figure 2.2. Overall, these results
restrict my main results in Section 2.5.2 to a lower boundary.
Second, although I predict that corporate shareholders reduce on average their minority stakes
after the dividend tax reform, which my empirical results confirm (see Section 2.3.2 and 2.5.2),
corporate shareholders with minority stakes could alternatively avoid the dividend tax burden
by increasing their ownership stake above the threshold of 10%. However, this latter
shareholder reaction is not very likely for several reasons. On the one hand, shareholders of
private firms face restrictions when they want to increase their ownership stake because private
firms only have a small number of owners and therefore a restrictive source of potential sellers
of stakes, e.g., the average number of owners in my sample is four. If, however, large
shareholders sell their shares to minority shareholders, they would reduce their voting power
and potential influence over the firm. Therefore, it is more likely that corporate shareholders
with minority stakes reduce rather than increase their stakes after the dividend tax reform.
On the other hand, the Corporate Income Tax Act stipulates that corporate shareholders with
minority stakes could only avoid the higher dividend tax burden in the year 2013 if they
purchased an additional 10% stake in the firm. However, the average treated corporate
shareholder in my sample owns a minority stake of less than 4% in another German
corporation. To benefit from the dividend tax exemption in the year 2013, the average treated
corporate shareholder would have had to more than triple its minority stake in 2013 (increase
the stake by 10 percentage points from 4% to 14%). Therefore, it is not plausible that corporate
shareholders with minority stakes could have immediately increased their ownership stakes
by 10% in 2013. Nevertheless, an increase of a minority stake above the threshold of 10% in
2013 was sufficient to benefit from the dividend tax exemption in the year after 2013, even
though the average treated corporate shareholder in my sample still have had to more than
double its stake (increase the stake from 4% to 10%).

Private Firm and Shareholder Response to Dividend Taxation: Evidence from the Taxation
of Corporate Minority Shareholders
48
In line with this argument, my sample includes only 18 observations (equal to three
shareholders over six years) that could have increased their ownership stake after the dividend
tax reform.36 This small number of observations only represents 0.4% of the total number of
observations in my sample, which indicates that the majority of corporate shareholders with
minority stakes did not purchase more stakes to exceed the threshold of 10%. Therefore, an
increase of the ownership stakes is not the predominant reaction of treated corporate
shareholders.
2.7 Conclusion
In this paper, I examine the response of private firms and their shareholders to a dividend tax
increase, which only affects a particular group of shareholders. I find that firms do not adjust
their payout policy but that corporate shareholders with minority stakes, the only shareholder
group affected by an increase in dividend taxes, reduce their minority stakes in corporations
after the dividend tax reform in 2013. This suggests that minority shareholders without
sufficient voting power cannot influence a firm’s payout policy. Cross-sectional tests further
indicate that firm and shareholder characteristics as well as the relation between the
shareholder and the firm affect the dividend tax responsiveness. I find a larger reduction of
corporate shareholders’ minority stakes for those invested in firms with a high dividend payout
and a majority shareholder. The dividend tax responsiveness is also larger for financially
distressed corporate shareholders with minority stakes that do not belong to the same group as
the firm in which they own a minority stake.
My results are subject to limitations. First, my inferences rely on the parallel trend assumption
and the choice of the control group. Although I plot yearly treatment effects and conduct
placebo tests, which neither suggest a violation of the parallel trend assumption, I cannot
completely rule out that confounding effects might affect my inferences. However, my fixed
effects structure and thorough sample selection should increase the confidence that my
identification strategy mitigates time trends as well as firm- and shareholder-specific
confounding effects (e.g., mergers and takeovers) in my setting. In addition, the use of an
alternative control group should further support the validity of my DiD approach.
Second, the generalisability of my results is limited because I examine a German tax reform.
Thus, internal validity increases at the expense of external validity. However, Germany has
36 All three shareholders could only increase their ownership stake slightly above 10%. One shareholder could
immediately increase the ownership above 10% in 2013. The other two shareholders increased their stakes in
2014.

Private Firm and Shareholder Response to Dividend Taxation: Evidence from the Taxation
of Corporate Minority Shareholders
49
well-developed institutions, corporate governance and shareholder protection mechanisms as
well as a tax system that is comparable to many other developed countries, allowing my results
to be at least generalisable for developed countries (e.g., La Porta et al., 2002).
Despite these limitations, my findings contribute to the very limited literature on the effects of
dividend taxes on the payout decisions of private firms and the portfolio choices of their
shareholders. I extend the literature by providing evidence that minority shareholders of
private firms affected by a dividend tax increase reduce their ownership stakes, which has not
been identified so far. In addition, my study enriches the literature on the characteristics that
affect the dividend tax responsiveness of shareholders by examining important traits at the
firm, shareholder and firm-shareholder level. Overall, my results should inform politicians
about the potential effects of the asymmetric taxation of dividends on private firms and their
shareholders.

Private Firm and Shareholder Response to Dividend Taxation: Evidence from the Taxation
of Corporate Minority Shareholders
50
2.8 Appendix
Appendix 2.A: Alternative explanation for firms’ payout decisions
There are contrasting views of whether dividend taxation affects firms’ payout decisions.
Under the “old view”, marginal investments are financed by new equity issues. A dividend tax
increase would increase the cost of capital, resulting in lower corporate investments and
dividend payouts (e.g., Poterba and Summers, 1984). The “new view” notes instead that
dividend taxation has no effect on the cost of capital and, as a result, does not affect corporate
investments and dividend payout decisions because in this model retained earnings are used
to finance marginal investments (e.g., Auerbach, 1979; Bradford, 1981).37 Besides these
neoclassical theories, agency models extend explanations of firms’ reactions to changes in
dividend taxes (e.g., Easterbrook, 1984; Jensen, 1986; Chetty and Saez, 2010). Depending on
the ownership structure of firms and conflicts between shareholders and managers over payout
policies, firms react heterogeneously to changes in dividend taxes (e.g., Gordon and Dietz,
2008; Chetty and Saez, 2010).
My results in Table 2.4 indicate that firms do not alter their payouts after the dividend tax
reform because only corporate shareholders with minority stakes are affected by the reform
and this particular shareholder group does not have sufficient voting power to influence firm
decisions, which is in line with the agency theory. However, my results could also be explained
by the “new view”.
To support that the agency theory has explanatory power, I re-estimate my OLS regression
(Eq. (1)) with Payout as the dependent variable and investigate whether the treatment effect
varies with firm-level characteristics, which classify the treated firms as “old view” firms or
“new view” firms. Prior literature suggests that “new view” firms are cash-rich, rather mature
and larger compared to “old view” firms (e.g., Zodrow, 1991; Hanlon and Heitzman, 2010).
If the “new view” prevails, I expect the treatment effect for “old view” firms to be significantly
negative and the treatment effect for “new view” firms to be insignificant.
Table 2.A1 reports the results for the cross-sectional tests. I use three different firm-level
characteristics. First, I distinguish between treated firms with high and low cash in the pre-
reform period, respectively (e.g., Alstadsæter and Jacob, 2017). High (low) cash is an indicator
variable equal to 1 if a treated firm’s average cash scaled by total assets in the pre-reform
37 For a comprehensible discussion about the theoretical foundations of the old and new view see, for example,
Zodrow (1991). A general overview of both theories is provided by Hanlon and Heitzman (2010).

Private Firm and Shareholder Response to Dividend Taxation: Evidence from the Taxation
of Corporate Minority Shareholders
51
period is higher (lower) than the median across all treated firms in the pre-reform period.
Second, I compare “young” treated firms with rather mature treated firms (e.g., Auerbach,
1983; Zodrow, 1991). I define young (mature) as an indicator variable equal to 1, if a treated
firm’s age in the year of the reform is lower (higher) than the 10th percentile across all treated
firms. Third, I distinguish between small and large treated firms (e.g., Dobbins and Jacob,
2016). I define large (small) as an indicator variable equal to 1 if the average total assets of a
treated firm in the pre-reform period are higher (lower) than the median across all treated firms
in the pre-reform period.
Table 2.A1: Effect of dividend taxation on payout – cross-sectional findings
(1) (2) (3)
Dependent variable: Payout Payout Payout
Post x Treatment x high cash 0.0107
(0.0150)
Post x Treatment x low cash -0.0145
(0.0127)
Post x Treatment x mature -0.00601
(0.0119)
Post x Treatment x young 0.0492
(0.0366)
Post x Treatment x large -0.00646
(0.0124)
Post x Treatment x small 0.00372
(0.0156)
Firm controls Included Included Included
Firm FE Included Included Included
Year FE Included Included Included
Adj. R² 0.550 0.550 0.548
N 1,036 1,036 1,036
Notes: This table reports cross-sectional tests based on firm-level observations. The dependent variable is Payout.
Regression models include additional interaction terms based on conditional variables to assess the cross-
sectional variation in the baseline treatment effect. The following conditional variables are used: (1) high (low)
cash equals 1 if the firm’s average cash scaled by total assets in the pre-reform period is above (below) the median
across all treated firms in the pre-reform period, (2) mature (young) equals 1 if the firm is older (younger) than
the 10th percentile of treated firms (age is defined as the year of the reform less the year of foundation), and (3)
large (small) equals 1 if the average of total assets of a firm in the pre-reform period is above (below) the median
across all treated firms in the pre-reform period. All variables are defined in Table 2.D3 (Appendix). All
regression models have standard errors that are heteroscedasticity-robust and clustered at the firm level. Reported
values: coefficient (standard errors) and *** (**) (*) indicate significance levels at 1% (5%) (10%), two-tailed.
Across all cross-sectional tests, I find neither a significant treatment effect for “new view” nor
“old view” firms. While the results for “new view” firms are consistent with theoretical
predictions, the insignificant results for “old view” firms suggest that another explanation, i.e.,
agency theory, drives the results for “old view” firms. However, since the agency and new
view theory reveal the same prediction for a firm’s payout decision in my setting, the results
of the cross-sectional tests can only indirectly suggest that the “new view” cannot fully explain

Private Firm and Shareholder Response to Dividend Taxation: Evidence from the Taxation
of Corporate Minority Shareholders
52
my results by indicating that at least “old view” firms seem to react in accordance with the
agency theory.

Private Firm and Shareholder Response to Dividend Taxation: Evidence from the Taxation
of Corporate Minority Shareholders
53
Appendix 2.B: Simultaneous equations approach
Following Blouin et al. (2011), I employ a simultaneous equations approach to address
endogeneity issues in payout decisions and ownership structures. If dividend policies and
shareholder portfolio choices are simultaneous decisions, coefficient estimates of OLS
regressions are biased because the explanatory variable in each equation (i.e., payout or
minority stakes of corporate shareholders) is correlated with the error term (Angrist and
Pischke, 2009). However, the use of a simultaneous equations approach permits a joint
estimation of corporate shareholder and firm responses to the dividend tax reform by using
three-stage least squares (3SLS). I estimate the following system of two equations based on
firm-level data:
𝐴𝑣_𝑆𝐻𝑗,𝑡 = 𝛽0 + 𝛽1𝑃𝑜𝑠𝑡𝑡 + 𝛽2𝑃𝑎𝑦𝑜𝑢𝑡𝑗,𝑡 + 𝛽3𝑃𝑜𝑠𝑡𝑡 × 𝑃𝑎𝑦𝑜𝑢𝑡𝑗,𝑡
+ 𝛽4𝐹𝑖𝑟𝑚_𝐶𝑜𝑛𝑡𝑟𝑜𝑙𝑠𝑗,𝑡 + 휀𝑗,𝑡
(3)
𝑃𝑎𝑦𝑜𝑢𝑡𝑗,𝑡 = 𝛼0 + 𝛼1𝑃𝑜𝑠𝑡𝑡 + 𝛼2𝐴𝑣_𝑆𝐻𝑗,𝑡 + 𝛼3𝑃𝑜𝑠𝑡𝑡 × 𝐴𝑣_𝑆𝐻𝑗,𝑡
+ 𝛼4𝐹𝑖𝑟𝑚_𝐶𝑜𝑛𝑡𝑟𝑜𝑙𝑠𝑗,𝑡 + 𝜇𝑗,𝑡
(4)
Variables are defined in Table 2.D3 (Appendix) and below. The 3SLS estimation method
stipulates that the endogenous variables (Av_SH and Payout) are instrumented by the
exogenous variables (Firm_Controls). However, Blouin et al. (2011) note that prior studies do
not provide clear recommendations for the control variables that should be included in a
system of equations, which examines payout decisions and shareholder responses. I thus
follow the suggestions of Blouin et al. (2011) when I select the controls. In Eq. (3), I include
control variables, which capture investments in shares. I control for age, which is defined as
the regarded year less the year of foundation, and profitability, which is defined as profit/loss
before taxes scaled by the prior year’s total assets. In Eq. (4), I include control variables, which
capture payout decisions. I control for size, leverage, cash and sales, which are defined as sales
scaled by the prior year’s total assets.
The coefficient estimate of the indicator variable Post captures the initial reform effect, even
if the other factor in the interaction term is zero. A negative coefficient estimate of the
interaction term Post x Payout in Eq. (3) can be interpreted as a decrease of average minority
stakes after the dividend tax reform if payout increases. A negative coefficient estimate of the
interaction term Post x Av_SH in Eq. (4) can be interpreted as a decrease of payouts for a larger
average minority stake of corporate shareholders. However, since my hypotheses do not
predict a simultaneous decision of the firm’s payout policy and shareholder response (see

Private Firm and Shareholder Response to Dividend Taxation: Evidence from the Taxation
of Corporate Minority Shareholders
54
Section 2.3.1 and 2.3.2), I expect that the coefficient estimates of the interaction terms are
insignificant. Instead, I expect a negative coefficient estimate of Post in Eq. (3) because it
captures the initial effect of the dividend tax reform on the average minority stake.
Since I am only interested in the effect of the dividend tax reform on firms’ payouts and
corporate shareholders’ minority stakes, I restrict my sample to the years 2012 and 2013 and
exclude all control group observations. To consider changes in the variables over time, I
average the variables two years prior to the reform and two years after the reform. Thus, each
treated firm has two observations, i.e., one observation before and after the reform.
Table 2.B1: Effect of dividend taxation – OLS and SEM
OLS SEM
(1) (2) (3) (4)
Dependent variable: Payout Av_SH Payout Av_SH
Post -0.00894 -0.751*** 0.825 -0.877***
(0.0142) (0.161) (1.353) (0.325)
Payout -1.372 -1.756
(1.158) (3.520)
Post x Payout 0.438 4.891
(1.207) (3.818)
Av_SH -0.00409 0.290
(0.00532) (0.351)
Post x Av_SH 0.00168 -0.195
(0.00318) (0.349)
Firm controls Included Included Included Included
R² 0.028 0.127 0.008 0.000
N 234 234 234 234
Notes: The dependent variable is Payout in Column 1 and 3, and Av_SH in Column 2 and 4. I estimate OLS
regressions in Column 1 and 2, and simultaneous equations by using a 3SLS estimation method in Column 3 and
4. I restrict the sample to treated firms in the years 2012 and 2013. Reported values: coefficient (standard errors)
and *** (**) (*) indicate significance levels at 1% (5%) (10%), two-tailed.
Table 2.B1 reports the results. In Column 1 and 2, I estimate OLS regressions. Column 3 and
4 present the results of my 3SLS regressions. Overall, the results are consistent with my
predictions and provide three main insights. First, the coefficient estimate of Post is negative
and significant in the OLS and 3SLS regression (Column 2 and 4), indicating that the dividend
tax reform has a negative effect on the average amount of minority stakes. Second, no other
coefficient estimate of interest is significant, suggesting that a firm’s payout decision is not
affected by the reform and hence firms and shareholders do not simultaneously react to the
dividend tax increase in my sample. Third, the coefficient estimate of Post is only slightly
different across the OLS and 3SLS regression (Column 2 and 4), indicating that a potential
simultaneity bias does not affect my coefficient estimates.
Private Firm and Shareholder Response to Dividend Taxation: Evidence from the Taxation
of Corporate Minority Shareholders
55
Appendix 2.C: Alternative control group
In this section, I employ foreign corporate shareholders resident in the EU that owned a
minority stake in a German corporation during the pre-reform period as an alternative control
group to further enhance the validity of my DiD approach. As noted in Section 2.6.1, this
alternative control group has two main advantages. First, foreign corporate shareholders with
minority stakes have the same small ownership stake (less than 10%) as treated shareholders.
Second, the German withholding tax burden of foreign corporate shareholders is not affected
by the reform and does not change depending on their ownership stake.38
To be part of the sample, I follow, in general, the same sample selection process as outlined
in Table 2.D1 (Appendix) with the exception that I do not require that the German corporations
have at least one German corporate shareholder with a directly held ownership stake of less
than 20% in the pre-reform period. Instead, German corporations must have at least one
German corporate shareholder or a foreign corporate shareholder resident in the EU with a
directly held ownership stake of less than 10% during the years 2010 until 2012 (pre-reform).
The final sample comprises 3,666 firm-shareholder-year observations for the years 2010 to
2015. Table 2.C1 provides the sample distribution in Panel A and B. The 3,666 firm-
shareholder-year observations comprise the same 2,970 treated observations as my initial
sample and 696 observations from the control group (Panel A). Panel B reveals that my sample
consists of 495 observations from the treatment group (equal to the number of treated
observations in my initial sample) and 116 observations from the control group per year.
38 However, it should be noted that foreign corporate shareholders with minority stakes in German corporation
were allowed to apply for a withholding tax refund after the ECJ decision at the end of 2011 until the German
law was passed at the beginning of 2013. Despite this possibility, I do not expect that foreign corporate
shareholders with minority stakes reacted to the ECJ decision for the following reasons. First, the withholding
tax refund for foreign corporate shareholders with minority stakes was only a temporary possibility to achieve
comparability with German corporate shareholders owning minority stakes until the German government
changed the taxation of inter-corporate dividends. Second, my identification process requires that foreign
corporate shareholders with minority stakes made their decision to invest in a German corporation before the
ECJ decision. Third, administrative burdens and compliance hurdles, e.g., extensive reporting requirements and
lengthy processes, complicate the reimbursement of withholding taxes (e.g., Jacob and Todtenhaupt, 2020).

Private Firm and Shareholder Response to Dividend Taxation: Evidence from the Taxation
of Corporate Minority Shareholders
56
Table 2.C1: Sample description and summary statistics with alternative control group
Panel A: Sample distribution
Number of firm-shareholder-
year observations
Number of
firms
Number of
shareholders
Treatment group 2,970 311 360
Control group 696 98 69
Total 3,666 409 429
Panel B: Sample distribution of firm-shareholder observations per year
2010 2011 2012 2013 2014 2015 Total
Treatment group 495 495 495 495 495 495 2,970
Control group 116 116 116 116 116 116 696
Total 611 611 611 611 611 611 3,666
Panel C: Summary statistics based on firm-shareholder data
Sample: 2010-2015 N Mean StDev P25 P50 P75
Treatment group
Shareholdings 2,970 3.51 2.76 1.00 3.06 5.50
Eff_tax 2,970 0.22 0.08 0.15 0.22 0.30
Size 2,643 8.90 2.07 7.64 8.68 10.10
Cash 2,643 0.20 0.25 0.01 0.09 0.34
Leverage 2,643 0.41 0.95 0.11 0.29 0.52
Size_SH 1,480 10.07 2.73 7.93 9.93 11.82
Cash_SH 1,480 0.10 0.15 0.01 0.04 0.12
Leverage_SH 1,480 0.41 0.84 0.13 0.33 0.57
Control group
Shareholdings 696 3.94 2.33 1.86 4.99 5.52
Eff_tax 696 0.24 0.08 0.15 0.25 0.31
Size 655 9.79 1.57 8.77 9.65 10.78
Cash 655 0.08 0.15 0.01 0.02 0.01
Leverage 655 0.35 0.33 0.09 0.23 0.52
Size_SH 297 10.09 3.02 8.26 10.25 11.96
Cash_SH 297 0.13 0.24 0.00 0.01 0.12
Leverage_SH 297 0.18 0.25 0.00 0.07 0.28
Panel D: Summary statistics based on firm-level data
Sample: 2010-2015 N Mean StDev P25 P50 P75
Treatment group
Av_SH 1,613 3.82 2.72 1.00 4.40 5.68
Size 1,613 9.01 2.22 7.54 8.98 10.36
Cash 1,613 0.15 0.23 0.01 0.04 0.19
Leverage 1,613 0.46 1.19 0.12 0.30 0.59
Payout 793 0.03 0.17 0.00 0.01 0.07
Control group
Av_SH 496 4.06 2.34 2.00 5.09 6.00
Size 496 9.85 1.63 8.81 9.93 10.87
Cash 496 0.08 0.15 0.00 0.02 0.08
Leverage 496 0.40 0.34 0.13 0.27 0.65
Payout 297 0.06 0.20 0.00 0.02 0.10
Notes: This table provides details on the sample distribution in general (Panel A) and per year (Panel B).
Summary statistics for the period 2010-2015 are provided for different samples: Panel C is based on firm-
shareholder-year-level observations, and Panel D is based on firm-year-level observations. All variables are
defined in Table 2.D3 (Appendix) or Appendix 2.C. The control group observations comprise foreign corporate
shareholders owning minority stakes in German corporations.

Private Firm and Shareholder Response to Dividend Taxation: Evidence from the Taxation
of Corporate Minority Shareholders
57
With regard to the firm and shareholder control variables, observations from the treatment and
control group are very similar in terms of size, cash and leverage. While the summary statistics
for the treatment group in Panel C are identical to the summary statistics of my initial sample,
the summary statistics of the firm-level observations differ from Table 2.3. The reason for the
deviation is my identification strategy for firm-level observations. I exclude firms from my
firm-level sample, which are part of the treatment and control group, i.e., firms with at least
one German corporate shareholder and one foreign corporate shareholder both owning a
minority stake, to avoid identification issues in my DiD approach. This identification process
results in a different sample composition compared to my initial sample.
To examine the parallel trend assumption for my treatment and alternative control group, I
again estimate the yearly treatment effects over the period between 2010 and 2015 with the
year 2012 as the benchmark (see Section 2.4.3). Figure 2.C1 provides point-estimates and two-
tailed 95% confidence intervals for my treated versus alternative control observations when
using Payout (Panel A) and Shareholdings (Panel B) as the dependent variables. Overall,
Figure 2.C1 provides support for the parallel trends in my sample. In addition, Figure 2.1 and
2.C1 are very similar, which further supports the validity of my DiD approach.
Next, I test Hypothesis 1 by re-estimating my DiD regression based on firm-level data (Eq.
(1)) with my alternative control group. Table 2.C2 reports OLS regression results for two
specifications: DiD model with fixed effects but without controls (Column 1), and DiD model
with fixed effects and firm controls (Column 2 as defined in Eq. (1)). Overall, the results reveal
that the estimated average treatment effect is insignificant in both specifications, indicating
that my findings are consistent with my main results in Section 2.5.1.
Further, I test Hypothesis 2 by re-estimating my DiD regression based on firm-shareholder-
level data (Eq. (2)) with my alternative control group. Panel A of Table 2.C3 reports OLS
regression results for three specifications: DiD model with fixed effects but without controls
(Column 1), DiD model with fixed effects and firm controls (Column 2), and DiD model with
fixed effects, firm and shareholder controls (Column 3 as defined in Eq. (2)). Overall, the
findings show negative and significant estimated average treatment effects across all
specifications, which have similar magnitudes compared to my main results in Table 2.5.

Private Firm and Shareholder Response to Dividend Taxation: Evidence from the Taxation
of Corporate Minority Shareholders
58
Figure 2.C1: Parallel trends with alternative control group
Panel A
Trends of payout over time
Panel B
Trends of corporate shareholdings over time
Notes: This figure provides statistical evidence that pre-reform trends in payout (Panel A) and ownership stakes
(Panel B) are similar, and that the dividend tax reform results in a significant decrease in the ownership stake of
affected shareholders but does not significantly change the payout of affected firms. The control group
observations comprise foreign corporate shareholders with minority stakes in German corporations. In Panel A,
the point-estimators are generated by estimating the following regression model: Payoutjt = β0 + β12010t x
Treatmentj + β22011t x Treatmentj + β32013t x Treatmentj + β42014t x Treatmentj + β52015t x Treatmentj +
𝛿Firm_Controlsjt + αj + εjt (Eq. (1)). In Panel B, the point-estimators are generated by estimating the following
regression model: Shareholdingsijt = β0 + β12010t x Treatmentij + β22011t x Treatmentij + β32013t x Treatmentij +
β42014t x Treatmentij + β52015t x Treatmentij + 𝛿Firm_Controlsjt + 𝛾Shareholder_Controlsit + αij + εijt (Eq. (2)).
Since I omit the DiD indicator for the year 2012 in both regression models, this year serves as the benchmark
year. The solid points indicate point-estimates and the lines represent 95% confidence intervals.
-1.2
-1
-0.8
-0.6
-0.4
-0.2
0
0.2
Estimated treatment effects (together with 95%
confidence interval)
2010 2011 2012 2013 2014 2015
-0.16
-0.12
-0.08
-0.04
0
0.04
0.08
0.12
0.16
Estimated treatment effects (together with 95%
confidence interval)
2010 2011 2012 2013 2014 2015

Private Firm and Shareholder Response to Dividend Taxation: Evidence from the Taxation
of Corporate Minority Shareholders
59
Table 2.C2: Effect of dividend taxation on payout – alternative control group
(1) (2)
Dependent variable: Payout Payout
Post x Treatment 0.0236 0.0151
(0.0239) (0.0230)
Size -0.0340
(0.0281)
Cash -0.00284
(0.166)
Leverage 0.00142
(0.0137)
Firm controls None Included
Firm FE Included Included
Year FE Included Included
Adj. R² 0.460 0.464
N 1,090 1,014
Notes: The dependent variable is Payout. The table reports two different specifications: (1) regression with fixed
effects but without firm controls, and (2) regression with fixed effects and firm controls. The main variable of
interest in the multivariate models is the interaction term Post x Treatment, capturing the difference-in-
differences effect. The interaction term Post x Treatment equals 1 for treated firms in the post treatment period
2013-2015 and 0 otherwise. The control group observations comprise firms with foreign corporate shareholders
owning minority stakes. All variables are defined in Table 2.D3 (Appendix) or Appendix 2.C. All regression
models have standard errors that are heteroscedasticity-robust and clustered at the firm level. Reported values:
coefficient (standard errors) and *** (**) (*) indicate significance levels at 1% (5%) (10%), two-tailed.
In addition, I control for the corporate shareholder’s effective dividend tax burden (Eff_tax) in
Panel B of Table 2.C3. Since my firm-shareholder-level observations allow me to observe the
minority stake that a specific (foreign) corporate shareholder owns in a German company, I
obtain country-pairs to calculate the effective dividend tax burden. The effective dividend tax
burden for corporate shareholders domiciled in Germany is outlined in Table 2.1. However, if
the corporate shareholder is resident in a foreign country, the effective dividend tax burden
depends on the withholding tax rate, the dividend tax rate in the foreign country and the double
tax relief method (see Jacob and Todtenhaupt, 2020). I collect yearly data from PwC and EY
on the withholding tax rate in Germany (𝜏𝑤,𝐺) and the withholding tax rate in German double
tax treaties (𝜏𝑤,𝐷𝑇𝑇), as well as the relevant double tax relief system and the dividend tax rate
in the country in which the corporate shareholder resides (𝜏𝐷).39
39 I collect data from PwC’s “Tax Summaries” and EY’s “Worldwide Corporate Tax Guides”.
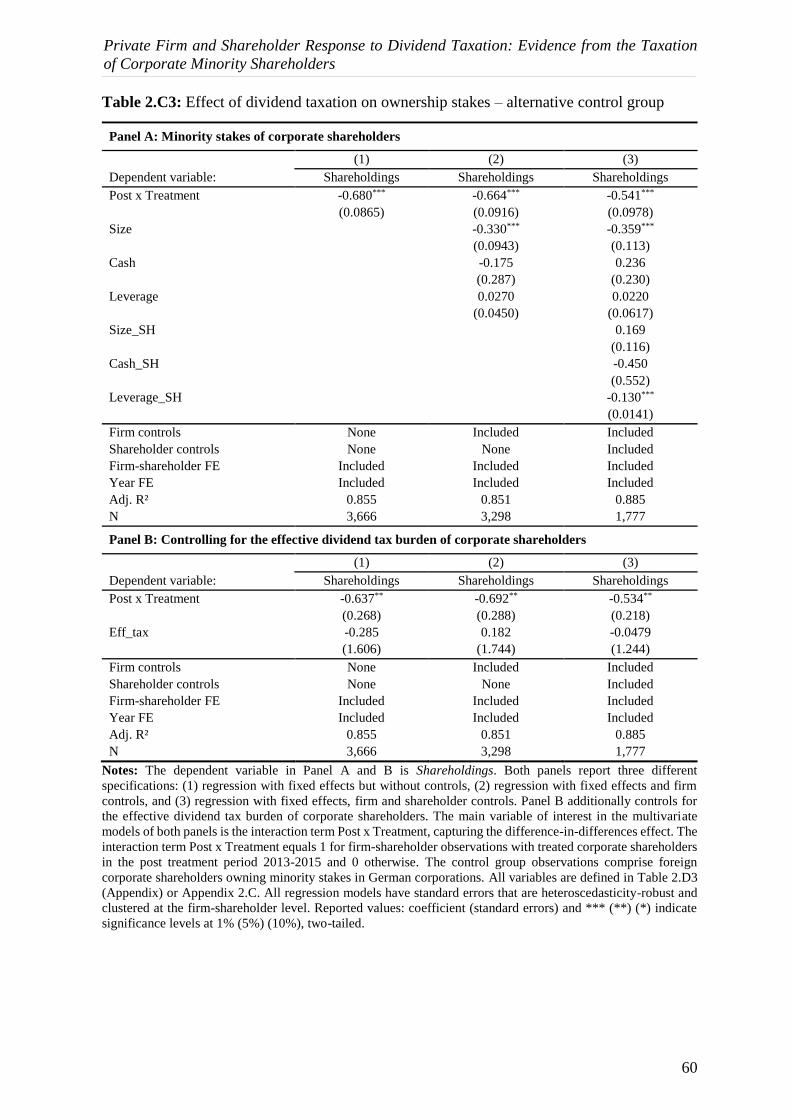
Private Firm and Shareholder Response to Dividend Taxation: Evidence from the Taxation
of Corporate Minority Shareholders
60
Table 2.C3: Effect of dividend taxation on ownership stakes – alternative control group
Panel A: Minority stakes of corporate shareholders
(1) (2) (3)
Dependent variable: Shareholdings Shareholdings Shareholdings
Post x Treatment -0.680*** -0.664*** -0.541***
(0.0865) (0.0916) (0.0978)
Size -0.330*** -0.359***
(0.0943) (0.113)
Cash -0.175 0.236
(0.287) (0.230)
Leverage 0.0270 0.0220
(0.0450) (0.0617)
Size_SH 0.169
(0.116)
Cash_SH -0.450
(0.552)
Leverage_SH -0.130***
(0.0141)
Firm controls None Included Included
Shareholder controls None None Included
Firm-shareholder FE Included Included Included
Year FE Included Included Included
Adj. R² 0.855 0.851 0.885
N 3,666 3,298 1,777
Panel B: Controlling for the effective dividend tax burden of corporate shareholders
(1) (2) (3)
Dependent variable: Shareholdings Shareholdings Shareholdings
Post x Treatment -0.637** -0.692** -0.534**
(0.268) (0.288) (0.218)
Eff_tax -0.285 0.182 -0.0479
(1.606) (1.744) (1.244)
Firm controls None Included Included
Shareholder controls None None Included
Firm-shareholder FE Included Included Included
Year FE Included Included Included
Adj. R² 0.855 0.851 0.885
N 3,666 3,298 1,777
Notes: The dependent variable in Panel A and B is Shareholdings. Both panels report three different
specifications: (1) regression with fixed effects but without controls, (2) regression with fixed effects and firm
controls, and (3) regression with fixed effects, firm and shareholder controls. Panel B additionally controls for
the effective dividend tax burden of corporate shareholders. The main variable of interest in the multivariate
models of both panels is the interaction term Post x Treatment, capturing the difference-in-differences effect. The
interaction term Post x Treatment equals 1 for firm-shareholder observations with treated corporate shareholders
in the post treatment period 2013-2015 and 0 otherwise. The control group observations comprise foreign
corporate shareholders owning minority stakes in German corporations. All variables are defined in Table 2.D3
(Appendix) or Appendix 2.C. All regression models have standard errors that are heteroscedasticity-robust and
clustered at the firm-shareholder level. Reported values: coefficient (standard errors) and *** (**) (*) indicate
significance levels at 1% (5%) (10%), two-tailed.

Private Firm and Shareholder Response to Dividend Taxation: Evidence from the Taxation
of Corporate Minority Shareholders
61
If the country of the foreign corporate shareholder offers an exemption method to mitigate the
double taxation, the effective dividend tax burden equals, in general, 𝜏𝐷 + min (𝜏𝑤,𝐺 , 𝜏𝑤,𝐷𝑇𝑇).
If the foreign country allows a complete exemption of the dividends received, the dividend tax
burden equals the minimum of the German withholding tax rate and the withholding tax rate
provided in the German double tax treaty (𝜏𝐷 = 0). If the dividends are not completely tax-
exempt in the foreign country, the effective dividend tax burden increases by the effective
dividend tax rate in the foreign country 𝜏𝐷 > 0. However, if the country of the foreign
corporate shareholder offers a credit method to mitigate the double taxation of dividends, the
effective dividend tax burden equals max (𝜏𝐷 , min (𝜏𝑤,𝐺 , 𝜏𝑤,𝐷𝑇𝑇)). The results in Panel B of
Table 2.C3 present robust results compared with Panel A, indicating that the effective dividend
tax burden does not bias my estimated average treatment effect.
Finally, I re-estimate my four cross-sectional tests from Section 2.5.3. Table 2.C4 reports the
results from my DiD models with fixed effects, controls and interactions with binary
conditional variables to capture the cross-sectional variation in the baseline treatment effect.
The results are consistent with my main results in Section 2.5.3, suggesting that besides firm-
specific payout decisions and the financial position of the treated shareholder, the dividend tax
response is also conditional upon potential agency issues and the affiliation of the treated
shareholder and firm to the same group.
Overall, my findings are fully consistent with my baseline results in Section 2.5 when using
EU resident foreign corporate shareholders with minority stakes as an alternative control
group, indicating that potential concerns regarding the impact of the dividend tax reform on
my initial control group do not affect my main findings. Thus, my results support the validity
of my DiD approach.

Private Firm and Shareholder Response to Dividend Taxation: Evidence from the Taxation
of Corporate Minority Shareholders
62
Table 2.C4: Cross-sectional tests – alternative control group
Firm-level tests
Firm-shareholder-
level test
Shareholder-
level test
(1) (2) (3) (4)
Dependent variable: Av_SH Av_SH Shareholdings Av_SH
Post x Treatment x high payout -0.644***
(0.148)
Post x Treatment x low payout 0.521
(0.452)
Post x Treatment x maj_SH -0.840***
(0.137)
Post x Treatment x no maj_SH -0.410***
(0.152)
Post x Treatment x same GUO -0.0829
(0.135)
Post x Treatment x different GUO -0.568***
(0.108)
Post x Treatment x financial distress -0.629***
(0.151)
Post x Treatment x no financial distress -0.159
(0.118)
F-test for differences [p-value] [0.010] [0.026] [0.004] [0.015]
Firm controls Included Included Included None
Shareholder controls None None Included Included
Firm FE Included Included None None
Shareholder FE None None None Included
Firm-shareholder FE None None Included None
Year FE Included Included Included Included
Adj. R² 0.868 0.833 0.903 0.905
N 1,365 2,109 1,528 1,059
Notes: This table reports cross-sectional tests based on firm-level observations (Column 1 and 2), firm-
shareholder-level observations (Column 3), and shareholder-level observations (Column 4). The dependent
variable is Av_SH in Column 1, 2 and 4, and Shareholdings in Column 3. Regression models include additional
interaction terms based on conditional variables to assess the cross-sectional variation in the baseline treatment
effect. The following conditional variables are used: (1) high (low) payout equals 1 if the average payout proxy
of a treated firm in the pre-reform period is above (below) the mean across all treated firms in the pre-reform
period, (2) maj_SH (no maj_SH) equals 1 if the treated firm has a (no) majority shareholder in the year prior to
the reform, (3) same (different) GUO equals 1 if the treated shareholder and firm have the same (a different)
global ultimate owner, and (4) (no) financial distress equals 1 if the treated shareholder has an Altman z-score
below (above) the 75th quartile in the year prior to the reform. The control group observations comprise foreign
corporate shareholders owning minority stakes in German corporations. All variables are defined in Table 2.D3
(Appendix) or Appendix 2.C. All regression models have standard errors that are heteroscedasticity-robust and
clustered at the firm level in Column 1 and 2, firm-shareholder level in Column 3 or shareholder level in Column
4. Reported values: coefficient (standard errors) and *** (**) (*) indicate significance levels at 1% (5%) (10%),
two-tailed.

Private Firm and Shareholder Response to Dividend Taxation: Evidence from the Taxation
of Corporate Minority Shareholders
63
Appendix 2.D: Additional tables
Table 2.D1: Sample selection
Selection criteria Number of
observations
Firm-level
German affiliates in Bureau van Dijk’s Amadeus database established
before 2007 with a corporate global ultimate owner in the EU and current
financial data
34,560
Excluding:
(1) Firms with consolidated non-German-GAAP financial data (191)
(2) Firms with a legal form that is not taxed according to the German
Corporate Income Tax Act
(3,912)
(3) Firms with missing detailed ownership structure information from 2010 to
2015
(8,460)
(4) Firms without a German corporate shareholder with an ownership stake of
less than 20% in the pre-reform period (from 2010 to 2012)
(21,221)
Preliminary number of firms 776
Firm-shareholder-level
Number of firm-shareholder-year observations based on the preliminary
number of firms after step (4) from 2010 to 2015
7,686
Excluding:
(5) Observations with missing shareholding quota in the sample period (1,530)
(6) Inactive shareholders or firms or restructuring processes (e.g., mergers)
during the sample period
(126)
(7) Banks, insurance, investment and holding companies as corporate
shareholders (NACE code = 6400-6630)
(510)
(8) Non-profit and public institutions as corporate shareholders (1,302)
(9) Listed firms or shareholders (90)
(10) Corporate shareholders with a total ownership stake (direct and indirect
ownership stake) above 20% in a sample firm
(54)
Final sample: Firm-shareholder-year observations 4,074
Notes: This table provides details on the sample selection process. The process starts with identifying German
corporate affiliates in the steps (1) and (2). Step (3) and (4) include the historical ownership structure of German
corporations. In particular, step (4) was conducted with hand-collected data, based on the annual ownership
structure of each individual firm, from Amadeus exports as well as from commercial register entries. In the
selection step (4), I also apply step (1) and (2) on the German corporate shareholder’s level. Since the main
examination unit is the firm-shareholder level, I consider the 776 German firms (resulting from selection step
(4)) with every German corporate shareholder that owned a stake of less than 20% in the pre-reform period (from
2010 to 2012) over six years (from 2010 to 2015). The use of firm-shareholder relations results in 7,686
observations as a starting point for further restrictions (step (5) to (10)). In step (6), I restrict the sample to active
firms and shareholders (with an ownership stake of less than 20% in the pre-reform period). To do so, I check
the status of the firms and shareholders three years after the sample period ends (from 2016 to 2018) to control
for firms and shareholders that went bankrupt after the end of the sample period.

Private Firm and Shareholder Response to Dividend Taxation: Evidence from the Taxation
of Corporate Minority Shareholders
64
Table 2.D2: Effect of dividend taxation – alternative identification strategy
Firm-level tests Firm-shareholder-level tests
(1) (2) (3) (4) (5)
Dependent variable: Payout Payout Shareholdings Shareholdings Shareholdings
Post x Treatment -0.0251 -0.0200 -0.660*** -0.665*** -0.502***
(0.0179) (0.0173) (0.119) (0.129) (0.145)
Firm controls None Included None Included Included
Shareholder controls None None None None Included
Firm FE Included Included None None None
Firm-shareholder FE None None Included Included Included
Year FE Included Included Included Included Included
Adj. R² 0.557 0.565 0.958 0.957 0.965
N 771 720 2,890 2,538 1,340
Notes: The dependent variable is Payout in Column 1 and 2, and Shareholdings in Column 3 to 5. The firm-level
tests report two specifications: (1) regression with fixed effects but without firm controls, and (2) regression with
fixed effects and firm controls. The firm-shareholder-level tests report three specifications: (3) regression with
fixed effects but without controls, (4) regression with fixed effects and firm controls, and (5) regression with
fixed effects, firm and shareholder controls. I employ an identification strategy, which requires that the German
corporations have at least one German corporate shareholder with a directly held ownership stake of less than
20% in 2012 (the year prior to the reform). Thus, the alternative sample is restricted to the period 2012-2015.
The less restrictive identification strategy results in 174 additional firm-shareholder-year observations. The main
variable of interest in the multivariate models is the interaction term Post x Treatment, capturing the difference-
in-differences effect. When conducting firm-level (firm-shareholder-level) tests, the interaction term Post x
Treatment equals 1 for treated firms (for firm-shareholder observations with treated corporate shareholders) in
the post treatment period 2013-2015 and 0 otherwise. All variables are defined in Table 2.D3 (Appendix). All
regression models have standard errors that are heteroscedasticity-robust and clustered at the firm level in
Column 1 and 2 or at the firm-shareholder level in Column 3 to 5. Reported values: coefficient (standard errors)
and *** (**) (*) indicate significance levels at 1% (5%) (10%), two-tailed.

Private Firm and Shareholder Response to Dividend Taxation: Evidence from the Taxation
of Corporate Minority Shareholders
65
Table 2.D3: Variable definitions
Variable Description Source
Firm-shareholder characteristics
Post Dummy variable equal to 1 for 2013, 2014, and 2015 and 0 otherwise Constructed
Same GUO Dummy variable equal to 1 if the treated shareholder and firm have
the same global ultimate owner
Amadeus
Shareholdings Ownership stake of a German corporate shareholder i in a German
corporation j
Hand-collected
SH_change Change in the ownership stake (Shareholdings) scaled by the prior
year’s ownership stake
Hand-collected
Treatment Dummy variable equal to 1 if a German corporate shareholder i
owned a stake of less than 10% in another German corporation j in
the pre-reform period (2010-2012)
Constructed
Firm characteristics
Av_SH Average stake of all German corporate shareholders that owned a
minority stake (ownership stake of less than 10% in the pre-reform
period) in German corporation j (= treatment group) and average
stake of all German corporate shareholders that owned a stake of at
least 10% but less than 20% (in the pre-reform period) in German
corporation k (= control group), respectively (j ≠ k)
Hand-collected
Av_SH_change Change in the average ownership stake (Av_SH) scaled by the prior
year’s average ownership stake
Hand-collected
Cash Cash and equivalents scaled by total assets Amadeus
Large_SH Largest ownership stake that a shareholder owns in the firm Hand-collected
Leverage Long-term debt scaled by total assets Amadeus
Maj_SH Dummy variable equal to 1 if the treated firm has a majority
shareholder in the year before the reform
Hand-collected
#Owner Natural logarithm of the number of owners Hand-collected
Own holdings Firm’s own holdings Hand-collected
Payout Profit/loss after tax net of the change in other equity scaled by the
prior year’s total assets
Amadeus
Payout1 Profit/loss after tax net of the change in other equity scaled by the
sum of profit/loss after tax and prior year’s other equity
Amadeus
Payout2 Profit/loss after tax net of the change in total equity scaled by the
prior year’s total assets
Amadeus
Size Natural logarithm of total assets Amadeus
Shareholder characteristics
Av_SH Average of minority stakes (ownership stake of less than 10% in the
pre-reform period) that a German corporate shareholder i owned in
other German corporations (= treatment group) and average of stakes
of at least 10% but less than 20% (in the pre-reform period) that a
German corporate shareholder h owned in other German
corporations (= control group), respectively (i ≠ h)
Hand-collected
Cash_SH Cash and equivalents scaled by total assets Amadeus
Financial distress Dummy variable equal to 1 if the treated shareholder has an Altman
z-score40
below the 75th percentile in the year prior to the reform
Amadeus
Leverage_SH Long-term debt scaled by total assets Amadeus
Size_SH Natural logarithm of total assets Amadeus
Notes: The table reports the variable definitions. The payout proxies are winsorised at the 1% (99%) level.
40 I use a modified version of the Altman z-score because I do not observe data on retained earnings:
0.717 ×𝑐𝑢𝑟𝑟𝑒𝑛𝑡 𝑎𝑠𝑠𝑒𝑡𝑠 − 𝑠ℎ𝑜𝑟𝑡 𝑡𝑒𝑟𝑚 𝑑𝑒𝑏𝑡
𝑡𝑜𝑡𝑎𝑙 𝑎𝑠𝑠𝑒𝑡𝑠+ 3.107 ×
𝑜𝑝𝑒𝑟𝑎𝑡𝑖𝑛𝑔 𝑝𝑟𝑜𝑓𝑖𝑡/𝑙𝑜𝑠𝑠
𝑡𝑜𝑡𝑎𝑙 𝑎𝑠𝑠𝑒𝑡𝑠+ 0.420 ×
𝑡𝑜𝑡𝑎𝑙 𝑒𝑞𝑢𝑖𝑡𝑦
𝑡𝑜𝑡𝑎𝑙 𝑎𝑠𝑠𝑒𝑡𝑠 − 𝑡𝑜𝑡𝑎𝑙 𝑒𝑞𝑢𝑖𝑡𝑦+ 0.998 ×
𝑠𝑎𝑙𝑒𝑠
𝑡𝑜𝑡𝑎𝑙 𝑎𝑠𝑠𝑒𝑡𝑠 .

Private Firm and Shareholder Response to Dividend Taxation: Evidence from the Taxation
of Corporate Minority Shareholders
66
Table 2.D4: Effect of dividend taxation – balanced sample
Firm-level tests Firm-shareholder-level tests
(1) (2) (3) (4) (5)
Dependent variable: Payout Payout Shareholdings Shareholdings Shareholdings
Post x Treatment 0.00184 0.00923 -0.673*** -0.734*** -0.585***
(0.0125) (0.0100) (0.123) (0.144) (0.158)
Firm controls None Included None Included Included
Shareholder controls None None None None Included
Firm FE Included Included None None None
Firm-shareholder FE None None Included Included Included
Year FE Included Included Included Included Included
Adj. R² 0.629 0.693 0.955 0.953 0.965
N 906 804 4,074 3,270 1,572
Notes: The dependent variable is Payout in Column 1 and 2, and Shareholdings in Column 3 to 5. The firm-level
tests report two specifications: (1) regression with fixed effects but without firm controls, and (2) regression with
fixed effects and firm controls. The firm-shareholder-level tests report three specifications: (3) regression with
fixed effects but without controls, (4) regression with fixed effects and firm controls, and (5) regression with
fixed effects, firm and shareholder controls. I use a balanced sample in every regression. The main variable of
interest in the multivariate models is the interaction term Post x Treatment, capturing the difference-in-
differences effect. When conducting firm-level (firm-shareholder-level) tests, the interaction term Post x
Treatment equals 1 for treated firms (for firm-shareholder observations with treated corporate shareholders) in
the post treatment period 2013-2015 and 0 otherwise. All variables are defined in Table 2.D3 (Appendix). All
regression models have standard errors that are heteroscedasticity-robust and clustered at the firm level in
Column 1 and 2 or at the firm-shareholder level in Column 3 to 5. Reported values: coefficient (standard errors)
and *** (**) (*) indicate significance levels at 1% (5%) (10%), two-tailed.

Private Firm and Shareholder Response to Dividend Taxation: Evidence from the Taxation
of Corporate Minority Shareholders
67
Table 2.D5: Summary statistics over the period 2010-2012
Panel A: Firm-shareholder observations
Sample: 2010-2012 N Mean StDev P25 P50 P75
Treatment group
Shareholdings 1,485 3.89 2.57 1.50 4.00 5.56
Size 1,334 8.83 2.10 7.61 8.57 9.97
Cash 1,334 0.21 0.26 0.01 0.08 0.38
Leverage 1,334 0.43 1.27 0.1 0.28 0.49
Size_SH 766 10.01 2.69 7.90 9.86 11.72
Cash_SH 766 0.09 0.14 0.01 0.03 0.12
Leverage_SH 766 0.37 0.30 0.12 0.32 0.55
Control group
Shareholdings 552 12.98 2.93 10.00 12.50 15.00
Size 495 8.52 2.18 7.00 8.54 9.68
Cash 495 0.16 0.22 0.01 0.06 0.22
Leverage 495 0.42 0.56 0.15 0.33 0.59
Size_SH 267 9.85 2.91 7.51 9.27 11.74
Cash_SH 267 0.11 0.17 0.01 0.04 0.15
Leverage_SH 267 0.33 0.28 0.09 0.25 0.48
Panel B: Firm-level observations
Sample: 2010-2012 N Mean StDev P25 P50 P75
Treatment group
Av_SH 781 4.23 2.45 2.30 5.00 5.68
Size 781 8.95 2.27 7.54 8.96 10.33
Cash 781 0.15 0.24 0.00 0.03 0.18
Leverage 781 0.50 1.65 0.11 0.27 0.56
Payout 382 0.02 0.16 0.00 0.01 0.07
Own holdings 781 0.49 2.93 0.00 0.00 0.00
Large_SH 781 80.73 20.98 65.00 93.94 94.90
Number of owners 781 4.72 7.35 2.00 2.00 5.00
Control group
Av_SH 372 13.09 3.01 10.00 12.50 15.00
Size 372 8.30 2.23 6.83 8.36 9.32
Cash 372 0.17 0.22 0.01 0.06 0.25
Leverage 372 0.42 0.62 0.13 0.32 0.59
Payout 173 0.06 0.14 0.00 0.03 0.10
Own holdings 372 0.24 1.71 0.00 0.00 0.00
Large_SH 372 67.59 19.95 51.04 74.90 84.75
Number of owners 372 3.68 2.30 2.00 3.00 4.00
Notes: This table provides summary statistics for the pre-reform period 2010-2012 for different samples: Panel
A is based on firm-shareholder-year-level observations, and Panel B is based on firm-year-level observations.
All variables are defined in Table 2.D3 (Appendix).

Private Firm and Shareholder Response to Dividend Taxation: Evidence from the Taxation
of Corporate Minority Shareholders
68
Table 2.D6: Cross-sectional tests – ownership stake in the pre-reform period
25th percentile Median 75th percentile
(1) (2) (3) (4) (5) (6)
Dependent
variable:
SH_change SH_change SH_change SH_change SH_change SH_change
Post x Treatment -0.0994*** -0.0671*** -0.0812*** -0.0469*** -0.0607*** -0.0410***
x high minority
stake
(0.0125) (0.0141) (0.0134) (0.0164) (0.0158) (0.0153)
Post x Treatment -0.161** -0.219 -0.148*** -0.160** -0.132*** -0.122***
x low minority
stake
(0.0757) (0.139) (0.0386) (0.0676) (0.0269) (0.0469)
F-test for
differences
[p-value]
[0.416] [0.265] [0.094] [0.091] [0.019] [0.095]
Firm controls Included Included Included Included Included Included
Shareholder
controls None Included None Included None Included
Firm-shareholder
FE Included Included Included Included Included Included
Year FE Included Included Included Included Included Included
Adj. R² 0.034 0.030 0.035 0.029 0.034 0.027
N 3,563 1,976 3,563 1,976 3,563 1,976
Notes: This table reports cross-sectional tests based on firm-shareholder-level observations. The dependent
variable is SH_change. Regression models include additional interaction terms based on conditional variables to
assess the cross-sectional variation in the baseline treatment effect. The following conditional variables are used:
(1) high (low) minority stake equals 1 if the average stake that a treated corporate shareholder owns in another
corporation in the pre-reform period is above (below) the 25th quartile across all treated observations in the pre-
reform period, (2) high (low) minority stake equals 1 if the average stake that a treated corporate shareholder
owns in another corporation in the pre-reform period is above (below) the median across all treated observations
in the pre-reform period, and (3) high (low) minority stake equals 1 if the average stake that a treated corporate
shareholder owns in another corporation in the pre-reform period is above (below) the 75th quartile across all
treated observations in the pre-reform period. All variables are defined in Table 2.D3 (Appendix). All regression
models have standard errors that are heteroscedasticity-robust and clustered at the firm-shareholder level.
Reported values: coefficient (standard errors) and *** (**) (*) indicate significance levels at 1% (5%) (10%),
two-tailed.

Private Firm and Shareholder Response to Dividend Taxation: Evidence from the Taxation
of Corporate Minority Shareholders
69
Table 2.D7: Effect of dividend taxation – fully interacted regression models
Firm-level test Firm-shareholder-level tests
(1) (2) (3)
Dependent variable: Payout Shareholdings Shareholdings
Post x Treatment -0.00193 -0.686*** -0.566***
(0.0139) (0.140) (0.142)
Firm controls Included Included Included
Shareholder controls None None Included
Firm FE Included None None
Firm-shareholder FE None Included Included
Year FE Included Included Included
Adj. R² 0.537 0.954 0.965
N 1,036 3,631 2,003
Notes: The dependent variable is Payout in Column 1 and Shareholdings in Column 2 and 3. The firm-level test
reports a regression with fixed effects and firm controls (Column 1). The firm-shareholder-level tests report two
specifications: (2) regression with fixed effects and firm controls, and (3) regression with fixed effects, firm and
shareholder controls. The main variable of interest in the multivariate models is the interaction term Post x
Treatment, capturing the difference-in-differences effect. When conducting the firm-level test (firm-shareholder-
level tests), the interaction term Post x Treatment equals 1 for treated firms (for firm-shareholder observations
with treated corporate shareholders) in the post treatment period 2013-2015 and 0 otherwise. In addition to the
interaction term Post x Treatment, I include interactions of each available control variable with the Post dummy
as well as interactions with the Treatment dummy in every regression model. All variables are defined in Table
2.D3 (Appendix). All regression models have standard errors that are heteroscedasticity-robust and clustered at
the firm level in Column 1 or at the firm-shareholder level in Column 2 and 3. Reported values: coefficient
(standard errors) and *** (**) (*) indicate significance levels at 1% (5%) (10%), two-tailed.

Private Firm and Shareholder Response to Dividend Taxation: Evidence from the Taxation
of Corporate Minority Shareholders
70
Table 2.D8: Effect of dividend taxation on corporate shareholdings – control group split
Control group:
10% ≤ ownership stake < 15%
Control group:
15% ≤ ownership stake < 20%
(1) (2) (3) (4)
Dependent variable: Shareholdings Shareholdings Shareholdings Shareholdings
Post x Treatment -0.722*** -0.598*** -0.658*** -0.415**
(0.166) (0.150) (0.165) (0.194)
Firm controls Included Included Included Included
Shareholder controls None Included None Included
Firm-shareholder FE Included Included Included Included
Year FE Included Included Included Included
Adj. R² 0.921 0.941 0.949 0.957
N 3,271 1,832 3,003 1,651
Notes: The dependent variable is Shareholdings. The table reports the results for two different control groups:
corporate shareholders with an ownership stake of at least 10% but less than 15% in another corporation in the
pre-reform period (Column 1 and 2), and corporate shareholders with an ownership stake of at least 15% but less
than 20% in another corporation in the pre-reform period (Column 3 and 4). The table shows two specifications
for both groups: (1) and (3) regression with fixed effects and firm controls, (2) and (4) regression with fixed
effects, firm and shareholder controls. The main variable of interest in the multivariate models is the interaction
term Post x Treatment, capturing the difference-in-differences effect. The interaction term Post x Treatment
equals 1 for firm-shareholder observations with treated corporate shareholders in the post treatment period 2013-
2015 and 0 otherwise. All variables are defined in Table 2.D3 (Appendix). All regression models have standard
errors that are heteroscedasticity-robust and clustered at the firm-shareholder level. Reported values: coefficient
(standard errors) and *** (**) (*) indicate significance levels at 1% (5%) (10%), two-tailed.
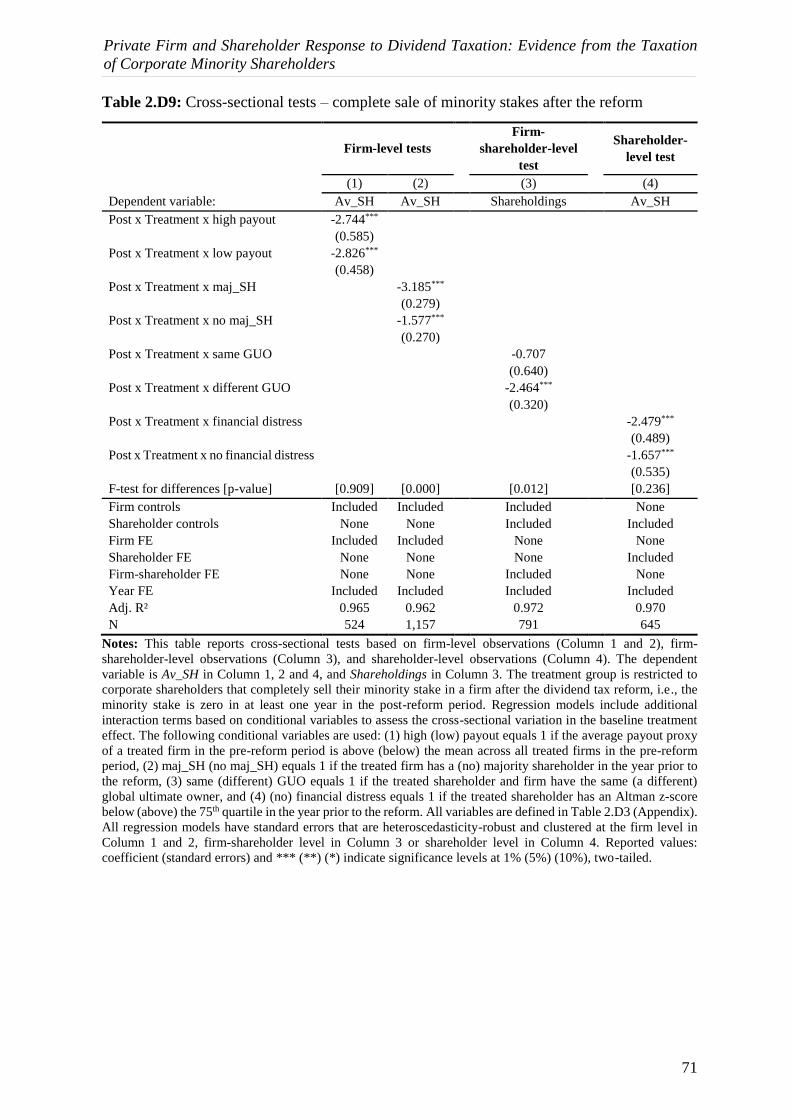
Private Firm and Shareholder Response to Dividend Taxation: Evidence from the Taxation
of Corporate Minority Shareholders
71
Table 2.D9: Cross-sectional tests – complete sale of minority stakes after the reform
Firm-level tests
Firm-
shareholder-level
test
Shareholder-
level test
(1) (2) (3) (4)
Dependent variable: Av_SH Av_SH Shareholdings Av_SH
Post x Treatment x high payout -2.744***
(0.585)
Post x Treatment x low payout -2.826***
(0.458)
Post x Treatment x maj_SH -3.185***
(0.279)
Post x Treatment x no maj_SH -1.577***
(0.270)
Post x Treatment x same GUO -0.707
(0.640)
Post x Treatment x different GUO -2.464***
(0.320)
Post x Treatment x financial distress -2.479***
(0.489)
Post x Treatment x no financial distress -1.657***
(0.535)
F-test for differences [p-value] [0.909] [0.000] [0.012] [0.236]
Firm controls Included Included Included None
Shareholder controls None None Included Included
Firm FE Included Included None None
Shareholder FE None None None Included
Firm-shareholder FE None None Included None
Year FE Included Included Included Included
Adj. R² 0.965 0.962 0.972 0.970
N 524 1,157 791 645
Notes: This table reports cross-sectional tests based on firm-level observations (Column 1 and 2), firm-
shareholder-level observations (Column 3), and shareholder-level observations (Column 4). The dependent
variable is Av_SH in Column 1, 2 and 4, and Shareholdings in Column 3. The treatment group is restricted to
corporate shareholders that completely sell their minority stake in a firm after the dividend tax reform, i.e., the
minority stake is zero in at least one year in the post-reform period. Regression models include additional
interaction terms based on conditional variables to assess the cross-sectional variation in the baseline treatment
effect. The following conditional variables are used: (1) high (low) payout equals 1 if the average payout proxy
of a treated firm in the pre-reform period is above (below) the mean across all treated firms in the pre-reform
period, (2) maj_SH (no maj_SH) equals 1 if the treated firm has a (no) majority shareholder in the year prior to
the reform, (3) same (different) GUO equals 1 if the treated shareholder and firm have the same (a different)
global ultimate owner, and (4) (no) financial distress equals 1 if the treated shareholder has an Altman z-score
below (above) the 75th quartile in the year prior to the reform. All variables are defined in Table 2.D3 (Appendix).
All regression models have standard errors that are heteroscedasticity-robust and clustered at the firm level in
Column 1 and 2, firm-shareholder level in Column 3 or shareholder level in Column 4. Reported values:
coefficient (standard errors) and *** (**) (*) indicate significance levels at 1% (5%) (10%), two-tailed.

Private Firm and Shareholder Response to Dividend Taxation: Evidence from the Taxation
of Corporate Minority Shareholders
72
Table 2.D10: Cross-sectional findings of shareholders’ dividend tax response – matched
sample
Firm-level tests
Firm-
shareholder-level
test
Shareholder-
level test
(1) (2) (3) (4)
Dependent variable: Av_SH Av_SH Shareholdings Av_SH
Post x Treatment x high payout -0.933***
(0.204)
Post x Treatment x low payout -0.0961
(0.146)
Post x Treatment x maj_SH -0.839***
(0.178)
Post x Treatment x no maj_SH -0.499**
(0.197)
Post x Treatment x same GUO -0.0200
(0.223)
Post x Treatment x different GUO -0.488**
(0.191)
Post x Treatment x financial distress -0.808***
(0.204)
Post x Treatment x no financial distress -0.342*
(0.191)
F-test for differences [p-value] [0.000] [0.099] [0.009] [0.020]
Firm controls Included Included Included None
Shareholder controls None None Included Included
Firm FE Included Included None None
Shareholder FE None None None Included
Firm-shareholder FE None None Included None
Year FE Included Included Included Included
Adj. R² 0.974 0.964 0.978 0.981
N 1,040 2,246 1,691 1,205
Notes: This table reports cross-sectional tests based on firm-level observations (Column 1 and 2), firm-
shareholder-level observations (Column 3), and shareholder-level observations (Column 4) by using a matched
sample. I employ entropy balancing matching. The dependent variable is Av_SH in Column 1, 2 and 4, and
Shareholdings in Column 3. Regression models include additional interaction terms based on conditional
variables to assess the cross-sectional variation in the baseline treatment effect. The following conditional
variables are used: (1) high (low) payout equals 1 if the average payout proxy of a treated firm in the pre-reform
period is above (below) the mean across all treated firms in the pre-reform period, (2) maj_SH (no maj_SH)
equals 1 if the treated firm has a (no) majority shareholder in the year prior to the reform, (3) same (different)
GUO equals 1 if the treated shareholder and firm have the same (a different) global ultimate owner, and (4) (no)
financial distress equals 1 if the treated shareholder has an Altman z-score below (above) the 75th quartile in the
year prior to the reform. All variables are defined in Table 2.D3 (Appendix). All regression models have standard
errors that are heteroscedasticity-robust and clustered at the firm level in Column 1 and 2, firm-shareholder level
in Column 3 or shareholder level in Column 4. Reported values: coefficient (standard errors) and *** (**) (*)
indicate significance levels at 1% (5%) (10%), two-tailed.

Tax Depreciation and Investment Decisions: Evidence from the Leasing Sector
73
3. Tax Depreciation and Investment Decisions: Evidence from the Leasing Sector
Lisa Hillmann and Andreas Oestreicher41
Working Paper42
Abstract:
This paper examines the investment response of finance lease firms to a change in tax
depreciation rules. Using an exogenous shock in Germany, our results suggest that finance
lease companies, the only organisations affected by such a change, reduce their investments
following the abolition of a beneficial and long-standing tax depreciation method. We provide
evidence that the exposure of finance lease firms to regulatory requirements moderates the
investment effect. Additional cross-sectional tests indicate a larger investment response for
finance lease firms with a product portfolio specialised in mobile assets and, in particular,
office and IT assets. Our findings add to the existing contributions on the effect of tax
depreciation on investment decisions and to the limited literature looking into the effect of
taxation on financial institutions.
JEL classification: D22, E22, G23, G31, H32, H25
Keywords: Tax depreciation, investment decisions, leasing companies
Acknowledgements: For helpful comments and suggestions, we thank Olaf Korn, Robert
Schwager and two anonymous reviewers for the 2020 EAA annual meeting in Bucharest
(which is postponed due to the corona virus). In addition, we thank Andreas Lube (German
Federal Financial Supervisory Authority) for providing us with yearly lists of the German
supervised companies from the finance lease sector.
41 University of Goettingen, Faculty of Business and Economics, Tax Division, Platz der Goettinger Sieben 3,
37073 Goettingen, Germany. 42 First version of the working paper: November 2019. This version: November 2020.

Tax Depreciation and Investment Decisions: Evidence from the Leasing Sector
74
3.1 Introduction
Prior literature has primarily analysed the effect of tax depreciation incentives on investment
decisions of manufacturing firms. However, we know little about the investment response of
leasing companies to tax incentives, despite the fact that leasing is one of the most important
types of financing. In 2017, almost half of the investments in equipment and software by
private firms in the United States were purchased via leases, which makes leasing the most
common payment method.43 In Europe, total new leasing volumes amount to EUR 384.1bn in
2017 with UK (EUR 101.3bn) as the largest leasing market followed by Germany (EUR
58.7bn).44 Given the importance of leasing companies as a provider of assets, it is important
to understand the effect of tax depreciation on leasing firms’ investments in leased assets. In
addition, compared to manufacturing firms, due to their financing function lease firms, which
offer finance leases are subject to regulatory requirements in many countries (e.g., Germany,
Italy, Spain and Belgium).45 It thus remains an open empirical question how tax depreciation
allowances affect lease firms’ investment decisions in a regulated environment. We answer
this question by investigating the effect of tax depreciation allowances on investments by
finance lease firms.
The expected stimulating effect of tax depreciation deductions was investigated by many
empirical studies (e.g., Hassett and Newmark, 2008; Hanlon and Heitzman, 2010). A large
proportion of prior literature exploits the bonus depreciation provisions in the US as exogenous
reform settings (e.g., Desai and Goolsbee, 2004; Cohen and Cummins, 2006; Hulse and
Livingstone, 2010; Zwick and Mahon, 2017; Ohrn, 2019). The results suggest that temporary
bonus depreciation regimes incentivise investments. In line with studies on US bonus
depreciation allowances, a few studies additionally provide evidence that accelerated
depreciation provisions incentivise firm investments in other country-specific settings, e.g.,
Germany, Netherlands and United Kingdom (e.g., Wielhouwer and Wiersma, 2017;
Eichfelder and Schneider, 2018; Maffini et al., 2019). However, empirical evidence on the
43 See, 2018 Equipment Leasing and Finance Industry Horizon Report of the Equipment Leasing and Finance
Foundation (https://www.store.leasefoundation.org/cvweb/Portals/ELFA-LEASE/Documents/Products/2018%
20Equipment%20Leasing%20&%20Finance%20Industry%20Horizon%20Report.pdf, last assessed June 29,
2020). 44 See, Annual Survey 2017 of Leaseurope (http://www.leaseurope.org/uploads/documents/stats/European
%20Leasing%20Market%202017.pdf, last assessed June 29, 2020). 45 See, Global Financial Services Regulatory Guide by Baker McKenzie, November 2019
(https://globalfsrguide.bakermckenzie.com/-/media/global-financial-services-regulatory-guide/files/updated112
2_global-fsr-guide.pdf?la=en, last assessed June 29, 2020). Offering finance leases is in principle an activity that
requires a license. In order to become authorised, countries have various requirements that need to be satisfied,
e.g., legal form, initial capital, minimum capital requirements etc.

Tax Depreciation and Investment Decisions: Evidence from the Leasing Sector
75
effect of tax depreciation on firms’ investments is limited in at least three ways. First, the
majority of studies examine the investment response of manufacturing firms. Second, most
existing studies focus on temporary tax depreciation regimes such as special bonus or
discretionary tax depreciation provisions. Third, the majority of studies investigate
depreciation tax incentives during economic downturns. Countries often foster the economy
during economic crises by introducing such provisions simultaneously with other tax or
investment incentives, resulting in potential confounding effects that limit the validity of
previous results. Our paper aims to overcome these limitations and examines the investment
response of leasing firms to a change in tax depreciation rules.
We do so by exploiting a German tax depreciation reform that is applicable to firms offering
finance leases. Before 2013, tax authorities accepted two regular depreciation methods for tax
purposes. First, the lessor could apply straight-line tax depreciation over the expected useful
life of the leased asset, which is determined in tax depreciation tables issued by the Federal
Ministry of Finance. Second, the lessor could apply straight-line depreciation over the lease
term under consideration of the residual value provided in the lease contract.
The latter depreciation method was the preferred and most frequently applied method for tax
and accounting purposes of finance lease contracts. This is because the business model of
finance lease firms requires the leased asset to be financed and amortised during the non-
cancellable lease term. In contrast to finance leases, this depreciation method is not common
for operating leases because the business model of operating lease firms requires that the
leased asset is financed and amortised by multiple and short-term transfers of the leased asset
to various lessees. With effect from 1.1.2014, the supreme tax authorities abolished lease-
specific straight-line tax depreciation over the lease term.46 Since then, when determining the
depreciation deduction for tax purposes the lessor has had to apply straight-line depreciation
over the expected useful life of the asset, based on the tax depreciation tables.
This setting has some valuable advantages, which, on the one hand, mitigate the limitations of
prior literature. We examine a permanent and significant change in tax depreciation rules that
is neither overlapped by other tax or accounting changes nor by special economic
circumstances, e.g., economic downturns. On the other hand, we have a clear setting in which
46 See, e.g., Federal Ministry of Finance, IV C 6 – S 2170/08/10002:004, of February 24, 2014 and specialist
information of the tax authority Hamburg, 52 – O 1000 – 003/12, Number 06/2014 (https://stbk-hamburg.de/wp-
content/uploads/Fach-Info-6-2014-f%C3%BCr-StB-Kammer-15-12-14_1.pdf).

Tax Depreciation and Investment Decisions: Evidence from the Leasing Sector
76
only finance lease companies are affected by a change in tax depreciation deductions, allowing
us to investigate the investment behaviour of a specific kind of financial institution.
Based on theoretical considerations, the tax depreciation method applied affects the present
value of tax depreciation deductions and hence the present value of tax payments and the cost
of investment (e.g., Hall and Jorgenson, 1967; Summers, 1981; Auerbach, 1983). In addition
to a reduction in the cost of capital, tax depreciation deductions can alleviate financial frictions
due to imperfect markets or regulatory requirements and thus increase investments (e.g.,
Fazzari et al., 1988). Straight-line tax depreciation over the expected useful life of the leased
asset results in a lower present value of tax depreciation deductions compared to straight-line
tax depreciation over the lease term, because the expected useful life of a leased asset is longer
than the lease term. However, the benefit of a shorter depreciation period in terms of net
present value is dependent on the capital market interest rate. Where this interest rate is zero,
clearly the difference vanishes. Considering both potential channels (cost of capital and
financial friction) for the investment response, we posit that the change of tax depreciation
rules to a less beneficial tax depreciation regime decreases investments.
To investigate this hypothesis, we exploit the German exogenous shock setting by applying a
difference-in-differences (DiD) approach. Our treatment group is defined as German
companies from the finance lease sector. We manually collect financial statement data of
German companies that offer finance leases from the German Federal Gazette’s Company
Register database. These companies can be identified because they are licensed, supervised
and registered by the German Federal Financial Supervisory Authority. Our control group
consists of German firms that belong to the rental sector. We collect financial data of our
control firms from Bureau van Dijk’s Amadeus database.
The results of our DiD analysis show that after the preferred tax depreciation over the lease
term was abolished, making the less beneficial tax depreciation over the expected useful life
of the asset the only applicable tax depreciation method, firms from the finance lease sector
reduce their investments in tangible assets. The estimated elasticity of investments with
respect to the net-of-tax cost of a unit investment is about -6, which is in line with prior
literature (e.g., Ohrn, 2018). Our result is consistent when applying alternative definitions of
the dependent variable and using matched samples. Further, we conduct placebo tests to
challenge the validity of our exogenous shock. The results suggest that the placebo treatment
effects are not statistically significant, thereby supporting our parallel trend assumption.

Tax Depreciation and Investment Decisions: Evidence from the Leasing Sector
77
In addition to this analysis, we investigate whether financial frictions resulting from regulatory
requirements regarding liquidity and risk management moderate the investment response of
treated firms. Finance lease firms can only undertake investment decisions when they comply
with these regulatory standards. However, the increase in tax payments due to a shift to the
less beneficial tax depreciation allowance reduces cash flow and hence liquidity, resulting in
a burden on the equity. Due to the regulatory requirements that finance lease firms are exposed
to, we predict that this decrease in liquidity and burden on equity negatively affect their
investment. We conduct cross-sectional tests to examine whether our treatment effect varies
with the firm’s exposure to regulatory requirements. We apply four firm-level characteristics
as proxies for the exposure of finance lease firms to regulatory standards. Results from our
cross-sectional tests reveal a stronger treatment effect for small firms and firms with low cash
and low equity that are affiliated to banks, suggesting that finance lease firms, which are
particularly strongly exposed to regulatory requirements, have a stronger investment response
to the change in tax depreciation methods.
In our second set of cross-sectional tests, we examine whether our treatment effect varies with
business model characteristics. First, we find that the investment response of finance lease
firms is stronger if their product portfolio relies heavily on leased assets for which the
difference between the lease term and the expected useful life of the leased asset is high. Our
results reveal that finance lease firms with a product focus on mobile assets, especially,
office/IT assets, are heavily affected by the reform. Second, we find no significant treatment
effect for direct lease firms of specific manufacturers, indicating that our findings cannot be
explained by a decrease in demand.
Our paper contributes to the literature on the effect of tax depreciation on firms’ investment
behaviour. The majority of the recent literature provides evidence on manufacturing firms only
or focuses on temporary tax depreciation regimes (e.g., Hassett and Newmark, 2008; Hulse
and Livingstone, 2010; Wielhouwer and Wiersma, 2017; Zwick and Mahon, 2017; Eichfelder
and Schneider, 2018; Ohrn, 2018; Ohrn, 2019). We add to the literature by exploiting a setting
that overcomes the major limitations of prior studies. Our setting offers a permanent change
in tax depreciation rules and is not confounded by other tax changes or economic factors.
Therefore, we are able to identify a clearer investment response to a change in tax depreciation
allowances.
Second, our study adds to the limited literature on the effect of taxation on financial
institutions. Prior literature examines the effect of taxation on various decisions of banks, e.g.,
Tax Depreciation and Investment Decisions: Evidence from the Leasing Sector
78
profit-shifting activities, capital structure choice, location decision and transparency (e.g.,
Huizinga et al., 2014; Merz and Overesch, 2016; Merz et al., 2017; Heckemeyer and de Mooij,
2017; Andries et al., 2017). However, previous studies do not focus on finance lease firms as
a specific financial institution operating in a regulated environment. We work towards filling
this gap by examining the effect of tax depreciation allowances on leasing firms’ investments.
In addition, we provide evidence that regulatory requirements moderate the investment effect.
In this context, we answer the call for research on the effect of taxation on financial institutions
(Hanlon and Heitzman, 2010).
The paper is structured as follows. In Section 3.2, we provide a literature review, describe the
institutional background of tax depreciation rules and regulatory requirements for leasing
companies in Germany, and develop our empirical prediction. Section 3.3 outlines the research
design and describes the data. In Section 3.4 and 3.5, we present empirical findings for our
baseline and cross-sectional tests. Section 3.6 delivers our conclusions.
3.2 Institutional background and empirical predictions
3.2.1 Literature review
There is a volume of literature that examines the effect of tax incentives on firms’ investment
decisions (e.g., Hassett and Newmark, 2008; Hanlon and Heitzman, 2010; Dwenger, 2010).
Early literature fails to provide evidence on the effect of tax incentives on investment decisions
due to rather endogenous tax regime changes when employing aggregate time-series data and
displays difficulties in controlling for non-tax effects on investments (e.g., Hines, 1998;
Hassett and Hubbard, 2002; Dwenger, 2010). However, more recent literature uses exogenous
cross-sectional variation in the user cost of capital at firm- and asset-levels to overcome the
earlier identification issues (e.g., Zwick and Mahon, 2017; Maffini et al., 2019; Ohrn, 2019).
The bonus depreciation provisions are widely exploited reform settings that were applicable
in the US from the end of 2001 to the end of 2004 and from 2008 onwards. While theory
predicts that bonus depreciation deductions decrease the user cost of capital and hence should
increase investment (e.g., Cohen et al., 2002), little evidence exists in early literature that
bonus depreciation provisions increased firms’ investment (Hanlon and Heitzman, 2010).
Desai and Goolsbee (2004) apply a tax-adjusted q-model with firm-level data. Although they
find that investment is positively associated with the bonus depreciation allowance, the effect
is rather small and does not prevent the decrease in aggregate investments.

Tax Depreciation and Investment Decisions: Evidence from the Leasing Sector
79
Cohen and Cummins (2006) differentiate between assets with a long and a short tax life to
investigate the effect of the bonus depreciation provision on specific asset classes. However,
their results suggest only a very limited impact on investment spending. House and Shapiro
(2008) show timing and substitution effects of the bonus depreciation allowances on
investment, although it is unclear whether aggregate investments respond to the new
depreciation regulation (Hanlon and Heitzman, 2010). Dauchy and Martinez (2008) find a
significant overall effect on investment, albeit a small one. They point out that the isolation of
the bonus depreciation effect from the general trend is challenging. In the same manner, Hulse
and Livingstone (2010) underline that a conclusion to the effect of the bonus depreciation
provisions should be reached cautiously because of the mixed and rather weak results with
relatively minor outcomes.47
However, recent studies that use predominantly comprehensive data on micro levels support
the theoretical prediction that temporary bonus depreciations affect investment decisions.
Zwick and Mahon (2017) compare firms in industries with mainly long-duration investments
to firms in industries with mainly short-duration investments during the US bonus depreciation
periods. They find an investment effect that is larger for small and cash-poor firms. Ohrn
(2019) complements the results by showing that two state adopted accelerated depreciation
policies (US bonus depreciation and Section 179 allowance) have a big effect on investments
in the US manufacturing sector. However, each of the policies is mitigated as the other is made
more generous.
In line with the latest literature on US bonus depreciation allowances, a few studies also
provide evidence that accelerated depreciation provisions incentivise firm investments in other
country-specific settings. Eichfelder and Schneider (2018) investigate a bonus depreciation
provision for investments in eastern Germany after reunification. They find a strong effect on
large firms’ investments and in particular for investments in long-lived assets, although the
investment increase seems to be partly driven by timing effects. Wielhouwer and Wiersma
(2017) study a discretionary tax depreciation regime, which was introduced in the Netherlands
during the financial crisis. They find that the more flexible tax depreciation regime increases
investments but only among firms that face the highest marginal tax rate. In addition, they
47 In order to explain the rather mixed results of prior literature, Edgerton (2010) argues that the effectiveness of
US bonus depreciation provisions was reduced because of the asymmetric tax treatment of profits and losses. In
addition, the effectiveness of tax depreciation incentives may be limited because the temporary tax depreciation
benefit does not directly affect accounting earnings and thus does not have financial reporting consequences,
which are more important to managers (e.g., Neubig, 2006; Hulse and Livingstone, 2010; Edgerton, 2012).
Results of different surveys reveal that temporary accelerated and bonus depreciation provisions do not appear
to be of great importance to managers (e.g., Rose and O’Neil, 1985; Porcano, 1987; Cohen and Cummins, 2006).

Tax Depreciation and Investment Decisions: Evidence from the Leasing Sector
80
show that firms postpone tax depreciation when facing losses or loss carry forwards. Maffini
et al. (2019) investigate the effect of accelerated depreciation allowances in the UK for small
and medium sized firms by exploiting exogenous changes in the qualifying threshold for first-
year depreciation allowances.48 They find that access to more capital allowances increases
firms’ investments, which is mainly due to the reduction in the user cost of capital and not
based on a cash flow effect.
Taken together, previous literature can provide some evidence on the effect of tax depreciation
on investment in general, although prior studies have some common features, which provide
only limited insights into the investment effects of tax depreciation. Existing studies focus on
temporary tax depreciation regimes such as special bonus or discretionary tax depreciation
provisions. In addition, the majority of studies examine depreciation tax incentives during
economic downturns and provisions that were often introduced simultaneously with other tax
factors such as corporate tax rate changes or other investment incentives. Potential
confounding effects in these settings limit the validity of the results.
3.2.2 Tax depreciation rules and regulatory requirements for leasing companies in
Germany
Leasing activities can be generally split up into operating and finance leases. Operating leases
are characterised by short lease terms, flexible and easy possibilities to cancel the lease
contract, and multiple transfers of the leased asset to different lessees. In the case of operating
lease contracts, the lessor bears the risk borne by the leased asset. This type of lease is
generally used for short-term investments. In contrast to operating leases, finance leases have
two essential functions: transfer of the right to use the leased asset and the financing function.
Since finance leases constitute financial service activities, companies from the finance lease
sector are licensed and supervised by the German Federal Financial Supervisory Authority
(FFSA). According to the FFSA49, the characteristic of finance leases is that the lessor
company procures the asset in its own name and on its own account. Then, the lessor transfers
the use of the asset to the lessee, who essentially finances and amortises the asset over the
lease term based on the contractual formulation. Thus, the lessee bears the investment risk,
and not the lessor. In addition, the lessee is contractually prohibited from cancelling the lease
48 It should be noted that the change in the qualifying threshold is also relevant for claiming SME research and
development tax credits. 49 FFSA, Bulletin Finance Lease, January 19, 2009, (only available in German, https://www.bafin.
de/SharedDocs/Veroeffentlichungen/DE/Merkblatt/mb_090119_tatbestand_finanzierungsleasing.html).

Tax Depreciation and Investment Decisions: Evidence from the Leasing Sector
81
contract during the lease term. Since the financing function is the important feature of finance
leases, this type of lease is used primarily for medium and long-term investments.
Besides the different business models of operating and finance lease firms, companies in the
latter category are treated as financial services institutions and thus are licensed and supervised
by the FFSA. Therefore, finance lease firms are subject to organisational-specific regulatory
obligations, in particular the Minimum Requirements for Risk Management (MaRisk) issued
by the FFSA.50 The provisions cover general requirements for risk management and specific
provisions regarding the performance of meaningful stress tests, the handling of risk
concentrations, and the quality and quantity of liquidity buffers. For example, the requirements
for the management of liquidity risks demand a liquidity buffer of liquid assets that is sufficient
to offset negative consequences resulting from a general decline in the price of marketable
assets, and a general deterioration in refinancing conditions. In contrast, operating lease firms
are neither supervised by the FFSA nor subject to such regulatory requirements.
According to the German-GAAP, the attribution of leased assets depends on the beneficial
ownership, which is comparable to IFRS and US-GAAP (e.g., Eisfeldt and Rampini, 2009;
Bauman and Francis, 2011). Beneficial owner of the leased asset is the party bearing the
majority of the opportunities and risks that the leased asset carries. Since there is no legal
definition of beneficial ownership in Germany, the treatment for tax purposes, which is based
on the Leasing Decrees of the German Federal Ministry of Finance, is generally applicable to
lease accounting. While the lessor is undeniably the beneficial owner of the leased asset in the
case of operating lease activities, resulting in the recognition of the leased asset on the balance
sheet of the lessor, the beneficial ownership is ambiguous in the case of finance lease contracts.
For this reason, the Federal Ministry of Finance defines, in particular, the necessary criteria
for the attribution of leased assets to the lessor with regard to finance lease contracts.
Under the Leasing Decrees of the Federal Ministry of Finance51, the lessor is regarded as
beneficial owner of the leased asset if under a full-payout lease of mobile assets the lease term
is between 40% and 90% of the expected useful life of the asset. If the lease contract contains
a purchase or rental extension option, the purchase price and the aggregate rent must be higher
than the book value or the lower market value. Under a partial-payout lease of mobile assets,
50 See, FFSA, Minimum Requirements for Risk Management, Circulars 15/2009 (BA) of August 14, 2009 and
11/2010 (BA) of December 15, 2010. 51 The Federal Ministry of Finance differentiates between full-payout leases (Federal Ministry of Finance, IV B/2
– S 2170 – 31/71, of April 19, 1971) and partial-payout leases (Federal Ministry of Finance, IV B/2 – S 2170 –
161/75, of December 22, 1975).

Tax Depreciation and Investment Decisions: Evidence from the Leasing Sector
82
the lessee does not finance or amortise the asset over the lease term. However, the asset is
attributed to the lessor if the lessor has a right to sell the leased asset to the lessee or the lessee
is bound by contract to compensate the remaining amortisation after the end of the lease term.
If the leased asset is attributed to the lessor, the lessor is required to recognise the leased asset
as a non-current asset measured at acquisition costs on the balance sheet, charge depreciation,
and recognise impairment losses, if applicable. Until the end of 2013, German tax authorities
accepted two regular depreciation methods for tax purposes. First, the lessor could apply
straight-line depreciation over the expected useful life of the leased asset, which was, and still
is, determined in tax depreciation tables issued by the Federal Ministry of Finance. Second,
the lessor could apply straight-line depreciation over the lease term under consideration of the
residual value provided in the lease contract. We provide a simplified example in Table 3.B1
(Appendix) to present the economic advantage of the tax depreciation over the lease term
compared to tax depreciation over the longer expected useful life of the leased asset.
Straight-line depreciation over the lease term under consideration of the residual value was
the most preferred and applied depreciation method with regard to finance lease contracts for
tax and accounting purposes, because the business model of finance leases requires that the
leased asset is financed and amortised over the non-cancellable lease term.52 Since the leased
asset is only attributed to the lessor if the lease term is no longer than 90% of the expected
useful life of the asset, the lease term provided in the contract is always shorter than the
expected useful life of the asset. With regard to the business model of finance lease companies,
depreciation over the lease term allows for a better match of revenues and allocation of
acquisition costs over time.
In contrast to finance leases, straight-line depreciation over the lease term is not the common
tax depreciation method for operating leases. Here, the business model requires that the leased
asset is not financed and amortised by a single transfer of the right to use the leased asset but
by multiple, short-term transfers of the leased asset to various lessees.
With effect from 1.1.2014, the lease-specific tax depreciation method was abolished by the
supreme tax authorities (see Federal Association of German Leasing Companies, 2014). Since
52 After the end of the lease term, finance lease firms in general sell the leased asset at the residual value. However,
in the case of full-payout leases the residual value of the leased asset is zero. The revenue from the sale of the
leased asset generally amounts to 4.87% of the acquisition costs (median value from an evaluation of 47,479
lease contracts of two German finance lease firms, see Oestreicher and Hillmann (2016)). Since the residual value
and the revenue from the sale of the asset are of subordinate importance to our analysis due to their small
magnitude, we do not take account of these values in our paper.

Tax Depreciation and Investment Decisions: Evidence from the Leasing Sector
83
then, the lessor has been required to apply straight-line depreciation over the expected useful
life of the leased asset, based on the tax depreciation tables, when determining the depreciation
deductions for tax purposes. For lease accounting purposes under the German-GAAP, the
lessor can continue to apply straight-line depreciation over the lease term.
This unique change in the tax depreciation rules allows us to investigate the investment effect
of tax depreciations in a setting characterised by properties that mitigate identification issues
due to endogenous changes in the tax regime, for the following reasons. First, compared to
prior literature this setting does not present a temporary change in tax depreciation regimes
but a permanent change in applicable depreciation methods for tax purposes. Therefore, in our
setting it can be ruled out that finance lease firms postponed investment in the expectation that
this regulatory change was only temporary.
Second, compared to prior literature, our investigations do not apply to a period of economic
downturn, which can directly affect investment behaviour or at least confound the effect of
tax depreciation deductions (e.g., Edgerton, 2010). Third, we exploit a setting not associated
with a specific political goal that could lead to anticipation effects or influence certain firm
behaviour. Instead, the change in depreciation rules was an administrative decision by the
supreme tax authorities because the applied tax depreciation over the lease term did not
correspond with the administrative interpretation of the tax law (Federal Association of
German Leasing Companies, 2014). Although the Federal Ministry of Finance accepted tax
depreciation over the lease term, this acceptance was subject to a regular meeting of the
German Länder heads of tax department in late 2013 with a view to a possible deviation from
basic depreciation principles.53 However, we do not expect that knowledge about this meeting
the result of which reached the public in February 2014 lead to anticipation effects.
Fourth, the change in the applicable tax depreciation methods was significant for the finance
lease sector because the tax depreciation over the lease term was the preferred and
predominantly applied depreciation method for a company operating in the finance lease
sector. The German leasing sector has a new business volume of EUR 50bn per year on
average, of which 90% is recognised on the balance sheet of the lessor (Federal Association
of German Leasing Companies, 2012). Therefore, leasing companies have a high intensity of
investment (non-current assets on the balance sheet) due to their business model. In our
sample, the average ratio of tangible assets to total assets is 70%. Consequently, changes in
tax depreciation rules directly affect a large part of the balance sheet. The Federal Association
53 See, Federal Ministry of Finance, IV C 6 – S 2170/08/10002:004, of February 24, 2014.

Tax Depreciation and Investment Decisions: Evidence from the Leasing Sector
84
of German Leasing Companies (2014) highlights that the shift of tax payments to earlier years
due to the less beneficial tax depreciation rule affects the equity and hence restricts financing
options for investments in new assets for customers.
Finally, the change does not overlap with other tax changes relevant to the leasing sector. Since
we examine a change in German tax depreciation rules that affects only the German finance
lease sector, different country-specific factors (such as country-specific differences in firms’
investment behaviour and regulatory differences in lease tax accounting, etc.) cannot explain
our results.54
However, a potential concern might be that the Basel III reform affects our analysis. In June
2013, the EU Capital Requirements Directive IV (CRD IV) (EU, 2013a) was published with
the primary objective of implementing the Basel III regulatory framework into EU law (EU,
2013b, Recital 1 and 10). After the financial crisis, the Basel Committee on Banking
Supervision (2011) agreed on a set of measures regarding capital and liquidity requirements
in order to strengthen the supervision and risk management in the financial sector. Since the
CRD IV applies to all banks in the EU, finance lease companies are in principle not affected
by this regulation, except for leasing companies that are part of a banking group. However,
we do not expect CRD IV to affect directly finance lease companies affiliated to banks in
2014, for the following reasons. First, the Basel III reform is anticipated by banks as the Basel
Committee on Banking Supervision (2011) issued the regulatory standard at the end of 2010.
Second, Basel III provided for relatively long transition periods. For example, the capital
maintenance buffer was to be built up gradually starting in 2016 and the structural liquidity
ratio and the maximum debt ratio were introduced in 2018. Third, substantial parts of the
liquidity regulations of Basel III which do not have to be implemented until 2015 are already
effective for finance lease firms due to the MaRisk regulation.55
In sum, this setting provides us with a significant and unanticipated change in tax depreciation
rules for firms operating in the finance lease sector. Furthermore, we cannot identify potential
confounding effects that could affect our analysis. Therefore, we can exploit this setting to
examine the effect of tax depreciation rules on investments by finance lease firms.
54 Since we examine unconsolidated German GAAP financial statements of mainly private finance lease and
rental firms, it is not likely that our results are due to drafts and changes to IFRS 16. 55 To further mitigate the concern that the CRD IV confounds our analyses, we exclude all finance lease
companies affiliated to banks and re-estimate our OLS regression (Eq. (1)) with Investment as the dependent
variable for our full and matched sample. In tests not documented here, the results are in general consistent with
our main findings, indicating that finance lease firms affiliated to banks do not drive our results.

Tax Depreciation and Investment Decisions: Evidence from the Leasing Sector
85
3.2.3 Hypothesis
Theoretical considerations concerning the effect of taxation on investment decisions of firms
have their roots in neoclassical investment theory (e.g., Jorgenson, 1963; Tobin, 1969), as
amended to encompass corporate taxation (e.g., Hall and Jorgenson, 1967; Summers, 1981).
In general, a firm should invest as long as the marginal benefit of an additional investment
exceeds the marginal costs of the additional investment. To measure this association, Hall and
Jorgenson (1967) derive from the neoclassical investment theory the concept of the user cost
of capital, in which the cost of investment is, among other influencing factors, affected by
corporate taxes. In this model, corporate taxes on profits reduce the investment’s cash flow
and hence increases the cost of investment (e.g., Auerbach, 1983). On the other hand,
allowances for tax depreciation decrease the cost of investment because tax depreciation
deductions reduce the corporate income tax base (e.g., Summers, 1981).
The method of tax depreciation affects the present value of tax depreciation deductions and
therefore the present value of tax payments and cost of investment. In general, the tax benefit
of depreciation deductions depends on the tax rate, interest rate, depreciation period and the
permitted amount of depreciation per year (Hall and Jorgenson, 1967). The change from
straight-line tax depreciation based on the lease term to straight-line tax depreciation over the
longer expected useful life of the asset reduces the present value of tax depreciation
deductions. According to the neoclassical investment theory, higher cost of capital due to a
decrease in the present value of tax depreciation deductions should lead to a lower capital
stock and thus to a decrease in the investment rate in the short term.
In contrast to theoretical models that assume perfect capital markets and no financial frictions
(e.g., Miller and Modigliani, 1958; Hall and Jorgenson, 1967), some theoretical approaches
examine investment behaviour under the assumption of incomplete and imperfect markets
(e.g., Greenwald et al., 1984; Fazzari et al., 1988). In the latter theoretical approach, cash flow
is considered an important determinant of firms’ investment spending if internal finance has
important cost advantages over external finance (e.g., Fazzari et al., 1988; Michaely and
Roberts, 2011). Besides incomplete and imperfect markets, regulatory requirements regarding
liquidity and capital present additional financial frictions limiting the opportunities to finance
investment (e.g., Gropp et al., 2019). If a firm is financially constrained in the sense that it
faces imperfect markets or regulatory requirements, less beneficial tax depreciation
allowances can aggravate financial constraints and decrease investments. Considering both

Tax Depreciation and Investment Decisions: Evidence from the Leasing Sector
86
potential channels56 for the investment response (i.e., cost of capital and financial frictions),
we state our hypothesis as follows:
Hypothesis: Finance lease firms decrease their investments after the change in tax
depreciation allowances to a less beneficial tax depreciation regime in 2014.
3.3 Research design and data
3.3.1 Estimation strategy
To test our empirical predictions, we apply a difference-in-differences (DiD) estimation
method. The application of the DiD approach requires the determination of a treatment and a
control group. In general, the change in tax depreciation rules applies to companies from the
leasing sector. However, not all lease companies are affected by the change in tax depreciation
rules because operating and finance leases follow different business models. The business
model of finance leases is that of financial services, because a finance lease is characterised
by the transfer of the right to use the leased asset to a single lessee, who essentially finances
and amortises the asset over the lease term. Due to this business model, prior to the
administrative order in 2014, straight-line depreciation over the lease term was the most
preferred and applied depreciation method in terms of tax and accounting for assets leased
under a finance lease contract. Since finance lease companies are directly affected by the
change in tax depreciation allowances, we use German finance lease firms as our treatment
group.
The use of finance lease firms as our treatment group has two advantages. First, as mentioned
in Section 3.2.2, almost all finance lease companies recognise the leased assets on their balance
sheet because of the special attribution criteria according to the Leasing Decrees of the German
Federal Ministry of Finance. Therefore, we can observe the change in investment volumes of
finance lease companies during our sample period. Second, we have access to the total
population of finance lease companies in Germany. Since the FFSA supervises German
finance lease firms, a list of all licensed finance lease companies is publicly available. In sum,
our treatment group consists of companies operating in the finance lease sector, which are
registered with the German Federal Financial Supervisory Authority over the course of our
sample period (2011-2015).
56 In Section 3.5.1, we shed more light on the financial friction channel affecting the investment response.

Tax Depreciation and Investment Decisions: Evidence from the Leasing Sector
87
In contrast to finance leases, operating leases are characterised by short lease terms. Thus,
multiple transfers to different lessees of the right to use the leased asset are necessary in order
to amortise the asset. The business model of operating leases is that of rental services, because
operating lease firms depreciate the leased asset over the expected useful life of the said asset.
Therefore, our control group consists of German companies in the rental industry, including
operating lease firms.
This control group has several advantages. First, the business model of renting out assets has
considerable similarities with finance lease activities, which means that both industries are
affected by similar economic circumstances, e.g. fluctuations in demand or competition with
credit institutions. Second, companies in the rental, operating lease and finance lease sectors
invest intensively in tangible assets and hence have a similar balance sheet structure. However,
rental and operating lease organisations are not affected by the change in tax depreciation
allowances described above, because the lease-specific tax depreciation method was
applicable to leased assets and used, in particular, for assets leased by finance lease firms.
To test the effect of the change in tax depreciation rules on the investments made by finance
lease companies (Hypothesis 1), we estimate the following baseline DiD model:
𝐼𝑛𝑣𝑒𝑠𝑡𝑚𝑒𝑛𝑡𝑖,𝑡 = 𝛽0 + 𝛽1𝑃𝑜𝑠𝑡𝑡 × 𝑇𝑟𝑒𝑎𝑡𝑚𝑒𝑛𝑡𝑖 + 𝛽2𝐶𝑜𝑛𝑡𝑟𝑜𝑙𝑠𝑖,𝑡 + 𝛽3𝑌𝑒𝑎𝑟𝑡
+ 𝛽4𝐹𝑖𝑟𝑚𝑖 + 휀𝑖,𝑡
(1)
The dependent variable Investment is defined as the difference in tangible assets from t to t-1
relative to the prior year’s tangible assets (e.g., Dobbins and Jacob, 2016). Although finance
lease companies are in general obliged to disclose leased assets separately from other tangible
assets, we define tangible assets as the sum of leased and other tangible assets for two reasons.
First, the use of tangible assets ensures better comparability between our treatment and our
control group. Second, we avoid the problem of missing values if leased assets are not shown
separately on the balance sheet.57
57 In an additional test, we re-estimate our OLS regression but use as the dependent variable the net investment
rate of leasing assets for our treated firms (instead of the sum of tangible and leasing assets) to address the concern
that changes in other tangible assets drive our results. The dependent variable for our control group does not
change since we have no information about potential leasing assets of rental firms/operating lease firms. The
results are consistent with our main findings, indicating that our results reveal effects on leasing assets and not
tangible assets (see Table 3.B2 (Appendix)). However, we cannot solve a potential measurement error in the
dependent variable for our control group.

Tax Depreciation and Investment Decisions: Evidence from the Leasing Sector
88
We define our sample period from 2011 to 2015.58 We use this relatively narrow sample
window to reduce the likelihood that other events unrelated to the change in tax depreciation
rules affect the investment decision of companies from the finance lease sector. We exploit
the change in the tax depreciation regime for the finance lease sector, which has been effective
and enforced by the tax authorities since the beginning of 2014, as an exogenous event.
Therefore, Post equals 1 for 2014-2015 and 0 for 2011-2013. The indicator variable Treatment
distinguishes between observations belonging to the treatment and control group, respectively.
In line with our prediction, we expect a negative and significant estimate of our DiD
coefficient (Post x Treatment).
We estimate Equation (1) using OLS regression and heteroscedasticity-robust standard errors
clustered at the firm level (Petersen, 2009). Following recent literature, we control for firm-
level characteristics to capture the ability to invest in tangible assets (e.g., Dobbins and Jacob,
2016; Jacob et al., 2019; Rauter, 2020). We include total assets (Size) to control for the firm’s
size because size can be a proxy for firm value and investment opportunities. Leverage
controls for the capital structure, which influences investment decisions. In addition, we
include Profitability and Loss in order to control for the firm’s performance and potential
investment opportunities. Further, we control for available cash by including Liquidity.
Finally, to control for general time trends in investment activities and time-invariant
unobservable differences in firm characteristics, we use firm and year fixed effects. Table 3.B3
(Appendix) provides a description of the variables used in this study.
The econometric approach we apply may raise general concerns. First, since our treated and
control firms belong to different industries, they have different characteristics, which might
drive the differences observed in the investment behaviour. We try to mitigate this concern by
employing a matching approach. Therefore, our empirical strategy is to use a sample of
comparable rental and operating lease firms that we match with our finance lease firms. Using
propensity score matching, we match each treated firm with a control firm based on pre-reform
average values of the natural logarithm of tangible assets and all covariates used in our main
DiD regression model (Eq. (1)). To avoid a sample size reduction, we use one-to-one nearest
neighbour matching without replacement, which is the most common method of matching in
accounting research (Shipman et al., 2017).59
58 Since we scale most of our controls by prior year’s total assets, we include data from 2010 to calculate controls
in 2011. 59 Our main inferences do not change when we use a different matching strategy (e.g., one-to-two nearest
neighbour matching with replacement).

Tax Depreciation and Investment Decisions: Evidence from the Leasing Sector
89
Second, the validity of our DiD analyses hinges on the assumption that the reform is not
anticipated by finance lease firms. However, anticipation of the change in tax depreciation
allowances seems very unlikely because the change was an administrative order by the
supreme tax authorities, which is not similar to a public legislative procedure (see Section
3.2.2). To mitigate this concern further, we check the parallel trend assumption of our DiD
analysis by conducting placebo tests and providing yearly treatment effects in Section 3.4.2.
3.3.2 Data and sample overview
We use two different data sources to construct our sample. First, we use the Amadeus database
provided by Bureau van Dijk. Amadeus contains accounting statements (i.e., balance sheets
and income statements) for private firms in Europe. We use this data source to collect financial
statement data of our control firms, which are German firms that belong to the rental and
operating lease sectors (NACE code 7710-7739, hereafter “rental firms”).60 Second, we
identify and collect financial statement data relating to our treated firms. Since the Amadeus
database does not contain comprehensive data on banks and financial services companies, we
manually collect financial statement data of German firms from the finance lease sector, which
is published in the German Federal Gazette’s Company Register database. To identify
companies offering finance leases, we received a list from the Federal Financial Supervisory
Authority comprising all companies from the finance lease sector that were licensed and
supervised by the Federal Financial Supervisory Authority over the sample period (2011-
2015). During our sample period, 311 companies were licensed to carry out finance lease
activities.
Table 3.B4 (Appendix) outlines our sample selection process. We restrict our data to firms
with unconsolidated German-GAAP financial statement data because we want to examine the
investment response of each individual firm. In order to avoid confounding events and effects,
we check for restructuring processes (e.g. mergers and takeovers) during the sample period.61
A potential concern in our identification of control firms could arise because companies from
the finance lease sector might be wrongly attributed to the operating lease sector in the
Amadeus database. In order to address this concern, we drop all firms in our control group
that have similar company names compared to the firms in our treatment group. In addition,
60 While the Amadeus database in principle separates finance leases (NACE code 6491) from operating leases,
the database combines hiring activities and operating leases in the NACE codes 7710-7739. 61 We check for restructuring processes by using the database Northdata, which provides company information
on German firms.

Tax Depreciation and Investment Decisions: Evidence from the Leasing Sector
90
we require firm-year observations to contain information on our dependent variable
(investment) and controls (total assets, leverage, profitability, loss, and liquidity). Finally, each
firm needs at least one observation before and after the reform. The final sample comprises
2,226 firm-year observations of 548 firms for the years 2011 to 2015.62
Table 3.1:Sample description
Panel A: Sample distribution
Full sample Matched sample
Number of firm-
year observations
Number of
firms
Number of firm-
year observations
Number of
firms
Treatment group 927 195 927 195
Control group 1,299 353 732 195
Total 2,226 548 1,659 390
Panel B: Summary statistics over the period 2011-2015
N Mean StDev P50 Min Max
Treatment group
Investment 927 0.0220 0.2896 0.0035 -0.6898 4.0512
Liquidity 927 0.0007 0.0072 0.0000 0.0000 0.1877
Size 927 10.0241 1.8133 9.9699 5.3270 13.9484
Leverage 927 0.6172 0.3491 0.6442 0.0000 2.4416
Profitability 927 0.0318 0.0785 0.0155 -0.3454 0.6980
Loss 927 0.1931 0.3949 0.0000 0.0000 1.0000
Full sample control group
Investment 1,299 0.1082 0.3689 0.0232 -0.7885 3.0672
Liquidity 1,299 0.0922 0.1188 0.0449 0.0000 0.6457
Size 1,299 8.5800 1.7554 8.6045 4.3820 13.1019
Leverage 1,299 0.5246 0.3599 0.5191 0.0000 2.3487
Profitability 1,299 0.0891 0.1275 0.0593 -0.3298 0.8024
Loss 1,299 0.1424 0.3496 0.0000 0.0000 1.0000
Matched sample control group
Investment 732 0.0816 0.3348 0.0091 -0.7885 2.3117
Liquidity 732 0.0260 0.0409 0.0120 0.0000 0.4789
Size 732 8.7833 1.753 8.8100 4.5109 13.1019
Leverage 732 0.5770 0.3692 0.5783 0.0000 1.9337
Profitability 732 0.0685 0.1129 0.0458 -0.3125 0.6409
Loss 732 0.1831 0.3870 0.0000 0.0000 1.0000
Notes: This table provides the sample description. Panel A outlines the sample distribution of our full and
matched sample. Panel B provides summary statistics for the treatment, full and matched sample control group
over the period 2011-2015. All variables are defined in Table 3.B3 (Appendix). In order to calculate the control
variables in 2011, which are scaled by prior year’s total assets, we use data from 2010, which we do not include
in our sample period.
62 Since our final sample is not balanced due to missing data, we check the robustness of our main results,
following the process to balance the sample. We use the balanced sample to re-estimate our DiD regression (Eq.
(1)) with Investment as the dependent variable for our full and matched sample (see Table 3.B5 (Appendix)).
Although the size of the balanced sample is substantially smaller, the results are in general consistent with our
main findings, indicating that missing firm-year observations do not affect our results.

Tax Depreciation and Investment Decisions: Evidence from the Leasing Sector
91
Panel A in Table 3.1 reports that out of 548 firms, 195 firms belong to the finance lease sector
(treatment group) and 353 firms belong to the rental sector (control group). After applying the
one-to-one nearest neighbour matching, the number of control firms drops to 195 resulting in
1,659 firm-year observations of 390 firms. Panel B in Table 3.1 presents summary statistics
separately for treatment, full sample and matched sample control group observations over the
sample period 2011-2015. Since our sample size is very small, we do not correct for outliers
in our analyses.63 Table 3.B3 (Appendix) lists detailed variable definitions.
Our summary statistics show that treated firms in general have a smaller net investment rate
compared to control firms. With regard to the control variables, the full sample rental firms
and finance lease firms have on average a similar leverage, profitability and frequency of loss
occurrence. However, our full sample control firms are on average slightly smaller and have
more liquidity compared to our treated firms. Our matched sample reduces the mean difference
between the treated and control firms, which increases the comparability of the two groups.64
However, we note that differences between our treatment and control group remain. To further
mitigate concerns that observable differences between our treatment and control group drive
our results, we employ entropy balancing matching (Hainmueller, 2012; see Table 3.B8
(Appendix)).65
3.4 The effect of tax depreciation on firms’ investment behaviour
3.4.1 Main results
We start our main analysis with a graphic illustration of investment rates over time. Using our
full sample, Figure 3.1 plots the average Investment of firms from the finance lease sector
(blue line) and firms from the rental sector (red line) over the years 2011-2015. We observe a
parallel trend in the investment rates of finance lease and rental firms in the pre-reform period
(2011-2013). While rental firms invest on average 10-11% of their tangible assets, finance
lease firms invest 4-5% of their tangible assets every year. Following the administrative decree
63 In order to mitigate the concern that outliers influence our results, we winsorise all continuous variables at the
1% (99%) level and re-estimate our OLS regression (Eq. (1)) with Investment as the dependent variable for our
full and matched sample (see Table 3.B6 (Appendix)). The results are consistent with our main findings,
indicating that outliers do not affect our results. 64 In Table 3.B7 (Appendix), we provide summary statistics separately for treatment, full sample and matched
sample control group observations over the pre-reform sample period 2011-2013. We can draw the same
conclusions from the summary statistics of the pre-reform and full sample period. 65 We employ entropy balancing matching and re-estimate our main regression model (Eq. (1)) with Investment
as the dependent variable. By constructing weights for each control observation, entropy balancing ensures that
treated and control firms are comparable in observable firm-level characteristics (Hainmueller and Xu, 2013).
Our DiD results are in general consistent with our main regression results (see Table 3.B8 (Appendix)).

Tax Depreciation and Investment Decisions: Evidence from the Leasing Sector
92
in 2014, we observe a sharp drop in the investment rate of finance lease firms, which recovers
slightly in 2015. The investment rate of rental firms, on the other hand, increases slightly in
the post-reform period.
Figure 3.1: Graphic illustration of investments over time
Notes: This figure provides visual evidence that pre-reform trends in investments are similar while the reform of
tax depreciation allowances results in a significant decrease in the investment of finance lease firms. The figure
plots the average investment in % of finance lease firms (blue line) and rental firms (red line). Investment is
defined in Table 3.B3 (Appendix). The dashed vertical line highlights the year prior to the reform.
We further compare investments of finance lease and rental firms before and after the reform.
Panel A of Table 3.2 shows that the average investment rate of finance lease firms is lower for
the periods after the reform (-0.0097) than before the reform (0.0434). The time difference is
significant at conventional levels (p-value < 0.01). Panel B and Panel C present the time
difference in the average investment rate before and after the reform for rental firms in our full
(Panel B) and matched sample (Panel C). Firms in the rental sector have on average a higher
investment rate in the pre- and post-reform period. However, we find no significant time
difference in investment rates for either control group, i.e., rental firms in our full or in our
matched sample.
After the first indications reveal that the reform of tax depreciation allowances decreases the
investment rate of finance lease firms, we test our Hypothesis 1 using our DiD approach (Eq.
(1)). Table 3.3 reports OLS regression results for our baseline model. We estimate two
specifications for our full and matched sample: DiD model with fixed effects but without
controls (Column 1 and 3), and a fully specified DiD model with fixed effects and firm controls
(Column 2 and 4 as defined in Eq. (1)).
-0.06
-0.04
-0.02
0.00
0.02
0.04
0.06
0.08
0.10
0.12
0.14
Finance lease firms Rental firms
2011 2012 2013 2014 2015
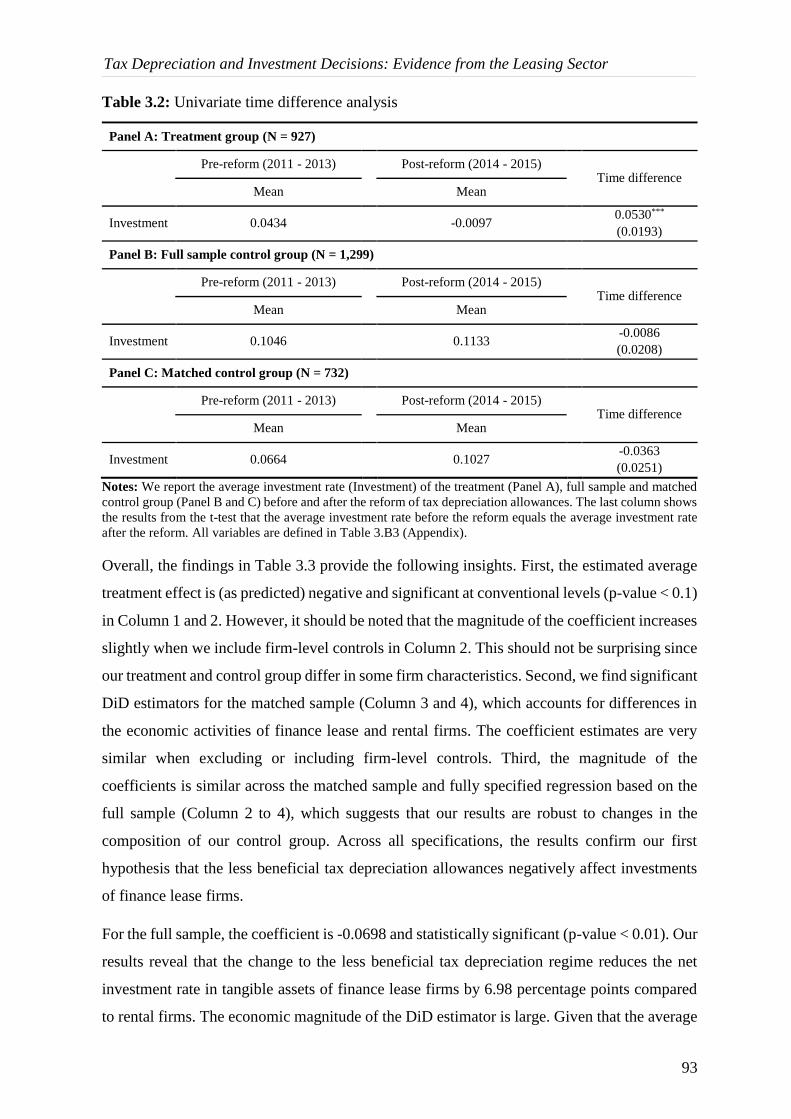
Tax Depreciation and Investment Decisions: Evidence from the Leasing Sector
93
Table 3.2: Univariate time difference analysis
Panel A: Treatment group (N = 927)
Pre-reform (2011 - 2013) Post-reform (2014 - 2015) Time difference
Mean Mean
Investment 0.0434 -0.0097 0.0530***
(0.0193)
Panel B: Full sample control group (N = 1,299)
Pre-reform (2011 - 2013) Post-reform (2014 - 2015) Time difference
Mean Mean
Investment 0.1046 0.1133 -0.0086
(0.0208)
Panel C: Matched control group (N = 732)
Pre-reform (2011 - 2013) Post-reform (2014 - 2015) Time difference
Mean Mean
Investment 0.0664 0.1027 -0.0363
(0.0251)
Notes: We report the average investment rate (Investment) of the treatment (Panel A), full sample and matched
control group (Panel B and C) before and after the reform of tax depreciation allowances. The last column shows
the results from the t-test that the average investment rate before the reform equals the average investment rate
after the reform. All variables are defined in Table 3.B3 (Appendix).
Overall, the findings in Table 3.3 provide the following insights. First, the estimated average
treatment effect is (as predicted) negative and significant at conventional levels (p-value < 0.1)
in Column 1 and 2. However, it should be noted that the magnitude of the coefficient increases
slightly when we include firm-level controls in Column 2. This should not be surprising since
our treatment and control group differ in some firm characteristics. Second, we find significant
DiD estimators for the matched sample (Column 3 and 4), which accounts for differences in
the economic activities of finance lease and rental firms. The coefficient estimates are very
similar when excluding or including firm-level controls. Third, the magnitude of the
coefficients is similar across the matched sample and fully specified regression based on the
full sample (Column 2 to 4), which suggests that our results are robust to changes in the
composition of our control group. Across all specifications, the results confirm our first
hypothesis that the less beneficial tax depreciation allowances negatively affect investments
of finance lease firms.
For the full sample, the coefficient is -0.0698 and statistically significant (p-value < 0.01). Our
results reveal that the change to the less beneficial tax depreciation regime reduces the net
investment rate in tangible assets of finance lease firms by 6.98 percentage points compared
to rental firms. The economic magnitude of the DiD estimator is large. Given that the average

Tax Depreciation and Investment Decisions: Evidence from the Leasing Sector
94
tangible assets of a finance lease firm in the pre-reform sample are about EUR 64.8m,
investments in tangible assets decrease by EUR 4.5m for each finance lease firm, on average.66
This quite large effect of tax depreciation on investments can be explained by the business
model of companies from the finance lease sector. The main purpose of leasing companies
with a focus on finance lease contracts is to buy assets, which are recognised on the balance
sheet of the lessor, and lease them over a specific lease term to the lessee as agreed by contract.
Consequently, the business model of companies from the finance lease sector relies heavily
on the amount of leased assets. The average ratio of tangible assets to total assets is 70%,
which underlines the focus on tangible assets.
Table 3.3: Effect of tax depreciation on investment
Full sample Matched sample
(1) (2) (3) (4)
Post x Treatment -0.0437* -0.0698*** -0.0673** -0.0632**
(0.0264) (0.0256) (0.0309) (0.0283)
Size -0.194*** -0.192***
(0.0442) (0.0481)
Leverage 0.759*** 0.714***
(0.0813) (0.0950)
Profitability 0.303** 0.0720
(0.147) (0.135)
Loss -0.0153 -0.0214
(0.0268) (0.0266)
Liquidity -0.0852 0.993*
(0.214) (0.550)
Controls None Included None Included
Year fixed effects Included Included Included Included
Firm fixed effects Included Included Included Included
Adj. R² 0.142 0.384 0.152 0.411
N 2,226 2,226 1,659 1,659
Notes: The dependent variable is Investment. The table reports two different specifications for the full and
matched sample: (1) and (3) regression with fixed effects but without firm-level controls, and (2) and (4) fully
specified regression with fixed effects and firm-level controls. The main variable of interest in the multivariate
models is the interaction term Post x Treatment, capturing the difference-in-differences effect. The interaction
term Post x Treatment equals 1 for treated firm observations (companies from the finance lease sector) in the
post treatment period 2014-2015 and 0 otherwise. All variables are defined in Table 3.B3 (Appendix). All
regression models have standard errors that are heteroscedasticity-robust and clustered at the firm level. Reported
values: coefficient (standard errors) and *** (**) (*) indicate significance levels at 1% (5%) (10%), two-tailed.
We translate our results into an elasticity of investments in tangible assets with respect to the
net-of-tax cost of a unit investment (following Jacob et al., 2019, and Maffini et al., 2019).
Tangible assets of a finance lease firm increase, on average, by 4.3% in the pre-reform period
(see Table 3.B7 (Appendix)). A reduction in net investments by 6.98 percentage points means
that the finance lease firm’s growth factor of tangible assets decreases by 6.7% (= 0.0698 /
66 Table 3.B7 (Appendix) contains descriptive statistics of tangible assets.

Tax Depreciation and Investment Decisions: Evidence from the Leasing Sector
95
(1+0.043)) relative to renting firms. Assuming the marginal tax rate is 30%, the discount rate
is 7%, the average lease term is 4 years and the average tax depreciation period is 6 years, the
change in depreciation allowances increases the net-of-tax cost of a unit investment by around
1.13% (see Appendix 3.A (Appendix)). Therefore, the implied elasticity of investment with
respect to the net-of-tax cost of a unit investment is about -6.
To put our depreciation allowance effect into perspective, we compare our results with the
recent literature, which calculates the elasticity of investment with respect to the net-of-tax
cost of a unit investment. Using changes in thresholds for first-year allowances in the UK,
Maffini et al. (2019) estimate elasticities of 8.3 – 9.9 for small and medium firms. Ohrn (2018)
examines the effect of the Domestic Production Activities Deduction (DPAD) in the US and
calculates an elasticity around 6.5. Other studies estimate the elasticity of capital expenditure
with respect to the net-of-tax cost of a unit investment. For example, Zwick and Mahon (2017)
study US federal bonus depreciation allowances and estimate an elasticity of 7 using industry-
level variations. Ohrn (2019) examines the response to US state bonus depreciation policies
and estimates an elasticity of 9.55.
Our result is mostly comparable to Maffini et al. (2019) and Ohrn (2018) because both studies
calculate the elasticity of investment with respect to the net-of-tax cost of a unit investment.
Our result is especially in line with Ohrn (2018). However, we acknowledge that the
comparison with both studies is limited since we use the net investment rate instead of
investment (which equals capital expenditure scaled by lagged fixed assets) as the dependent
variable.67, 68
Next, we test the robustness of our results by using alternative dependent variables. Since the
drawback of our investment rate could be that it does not account for depreciation and changes
in total assets, we employ two different investment rates to mitigate the concern that scaling
effects and depreciation affect our results. First, we calculate the investment rate as the change
in tangible assets scaled by the prior year’s total assets (e.g., Dobbins and Jacob, 2016).
Second, we employ the gross investment rate, defined as the change in tangible assets before
67 Due to data limitations, we do not have information about capital expenditure, which prevents us from
calculating elasticities for specifications similar to prior literature. 68 We note that we use an interest rate of 7% for the determination of the elasticity to be comparable with the
prior literature. However, the average effective interest rate of German banks granting loans for new businesses
up to EUR 1 million over our sample period is 3.08% (https://www.bundesbank.de/statistic-rmi/Statistic
Download?tsId=BBK01.SUD124&its_csvFormat=en&its_fileFormat=csv&mode=its). Employing this interest
rate and re-calculating our elasticity results in an elasticity of -10.8, which is very much in line with the result of
Maffini et al. (2019). Therefore, we acknowledge that our initial elasticity underestimates the effect of the change
in tax depreciation allowances on investments.

Tax Depreciation and Investment Decisions: Evidence from the Leasing Sector
96
depreciation scaled by the prior year’s total assets (e.g., Bethmann et al., 2018; Jacob et al.,
2019).
Table 3.4 reports the results from OLS regressions with our two alternative dependent
variables for the full (Column 1 and 2) and matched sample (Column 3 and 4): change in
tangible assets scaled by prior year’s total assets (Column 1 and 3) and gross investment rate
(Column 2 and 4). Overall, the results show a negative significant effect of a less beneficial
tax depreciation regime on the investment of companies from the finance lease sector, which
is consistent with the results of Table 3.3.
Table 3.4: Effect of tax depreciation on investment – alternative dependent variables
Full sample Matched sample
(1) (2) (3) (4)
Dependent variable: Inv_TA Inv_Depr Inv_TA Inv_Depr
Post x Treatment -0.0338*** -0.0365** -0.0323** -0.0343**
(0.0127) (0.0142) (0.0158) (0.0158)
Controls Included Included Included Included
Year fixed effects Included Included Included Included
Firm fixed effects Included Included Included Included
Adj. R² 0.487 0.657 0.481 0.674
N 2,226 1,935 1,659 1,508
Notes: The dependent variable is change in tangible assets scaled by prior year’s total assets (Inv_TA) in Column
1 and 3 and the gross investment rate (Inv_Depr) in Column 2 and 4. The table reports fully specified regressions
with fixed effects and firm-level control for the full and matched sample. The main variable of interest in the
multivariate models is the interaction term Post x Treatment, capturing the difference-in-differences effect. The
interaction term Post x Treatment equals 1 for treated firm observations (companies from the finance lease sector)
in the post treatment period 2014-2015 and 0 otherwise. All variables are defined in Table 3.B3 (Appendix). All
regression models have standard errors that are heteroscedasticity-robust and clustered at the firm level. Reported
values: coefficient (standard errors) and *** (**) (*) indicate significance levels at 1% (5%) (10%), two-tailed.
3.4.2 Placebo tests
Since one crucial assumption of our identification approach using DiD analyses is the parallel
trend in our treatment and control group, we assess the robustness of our results by challenging
the validity of our exogenous shock. Thus, we conduct placebo tests by re-estimating our
baseline regression (Eq. (1)) in two versions. First, we use a restricted sample period from
2011 to 2013 and apply a pseudo-reform in 2013. Second, we use a restricted sample period
from 2011 to 2012 and define the placebo treatment date as the year 2012. If the parallel trend
assumption is satisfied for the treatment and control group observations, we expect the DiD
coefficient estimators of the pseudo-reform settings to be insignificant.
The results of both placebo tests are reported in Table 3.5. We test both placebo treatment
dates with the full (Column 1 and 3) and matched sample (Column 2 and 4). The results

Tax Depreciation and Investment Decisions: Evidence from the Leasing Sector
97
suggest that the placebo treatment effects are not statistically significant, supporting the
validity of our DiD analyses.
Table 3.5: Placebo treatment tests
Full sample Matched sample Full sample Matched sample
(1) (2) (3) (4)
Sample period: 2011-2013 Sample period: 2011-2012
2012 x Treatment
-0.0355 -0.0296
(0.0351) (0.0396)
2013 x Treatment 0.00280 0.0418
(0.0378) (0.0374)
Controls Included Included Included Included
Year fixed effects Included Included Included Included
Firm fixed effects Included Included Included Included
Adj. R² 0.351 0.399 0.330 0.396
N 1,224 924 690 528
Notes: The dependent variable is Investment. The table reports placebo treatment tests for two sample periods:
2011-2013 in Column 1 and 2, and 2011-2012 in Column 3 and 4, in which we define a placebo treatment date
as the year 2013 (Column 1 and 2) and 2012 (Column 3 and 4). For both sample periods we test two
specifications: (1) and (3) placebo test with fixed effects and firm controls based on the full sample, and (2) and
(4) placebo test with fixed effects and firm controls based on the matched sample. All variables are defined in
Table 3.B3 (Appendix). All regression models have standard errors that are heteroscedasticity-robust and
clustered at the firm level. Reported values: coefficient (standard errors) and *** (**) (*) indicate significance levels
at 1% (5%) (10%), two-tailed.
To further check the validity of the parallel trend assumption in our setting, we plot the point-
estimates based on a version of our baseline model (Eq. (1)), in which we replace the DiD
indicator (Post x Treatment) with a series of four separate DiD indicator variables, each
marking one year over the period between 2011 and 2015. We omit the indicator for the year
2013 because this year serves as a benchmark. The purpose of this test is to check whether our
dependent variable has a trend and the difference in the trends between the treated and control
group is significant in the pre-reform period. Since the parallel trend assumption requires that
our dependent variable remains constant and parallel between both groups, we expect that the
point-estimates in the pre-reform period are insignificant.
Figure 3.2 provides point-estimates and two-tailed 90% confidence intervals for our treated
versus control firms. The results in Figure 3.2 suggest that the yearly treatment effects in the
pre-reform period (2011-2013) are insignificant, which provide support for the parallel trends
in our sample. These findings are consistent with results of our placebo tests.

Tax Depreciation and Investment Decisions: Evidence from the Leasing Sector
98
Figure 3.2: Treatment effects over time
Notes: This figure plots the yearly treatment effects. The point-estimators are generated by estimating the
following regression model: Investmentit = β0 + β12011t x Treatmenti + β22012t x Treatmenti + β32014t x
Treatmenti + β42015t x Treatmenti + β5Controlsit + β6Yeart + β7Firmi + εit. Since we omit the DiD indicator for
the year 2013, this year serves as the benchmark year. The solid points indicate point-estimates and the lines
represent 90% confidence intervals.
3.5 Heterogeneity in investment effects
3.5.1 Firm-level variation in the exposure to regulatory requirements
In Section 3.2.3, we identify two channels affecting the investment response: cost of capital
and financial friction. Since finance lease firms face financial frictions due to regulatory
requirements, we investigate in this section whether the latter channel is verifiable. The notion
behind this channel relies on the impact that regulatory requirements have on financing
opportunities. As outlined in Section 3.2.2, finance lease firms have to fulfil regulatory
requirements regarding liquidity and risk management. Consequently, they can only undertake
investment decisions when they comply with these regulatory standards.
Since the change to the less beneficial tax depreciation regime shifts the tax-deductible
expenses to the end of the lease contract, the lessor has higher tax payments until the end of
the lease term. However, an increase in tax payments due to a shift to the less beneficial tax
depreciation allowance reduces cash flow and hence liquidity, resulting in a burden on the
equity.69 Due to the regulatory requirements that finance lease firms are exposed to, this
decrease in liquidity and burden on equity negatively affect their investment.
69 In general, banks do not provide loans for the settlement of tax payments.
-0.2
-0.15
-0.1
-0.05
0
0.05
0.1
0.15
Estimated treatment effects (together with 90% confidence interval)
2011 2012 2013 2014 2015

Tax Depreciation and Investment Decisions: Evidence from the Leasing Sector
99
We examine this channel by conducting cross-sectional tests analysing whether our treatment
effect predictably varies with the firm’s exposure to regulatory requirements measured by firm
characteristics that capture these standards. We predict that firms more exposed to regulatory
requirements have a stronger investment response to the change in tax depreciation
allowances. We apply four different firm-level characteristics as proxies for the exposure of
finance lease firms to regulatory standards.
Table 3.6 reports the results for our cross-sectional tests based on our full sample. We use our
baseline DiD approach (Eq. (1)). However, to capture cross-sectional variation in the baseline
treatment effect, we interact binary conditional variables with the DiD estimator Post x
Treatment. We estimate DiD models with fixed effects and firm controls.
Table 3.6: Cross-sectional findings – exposure to regulatory requirements
Full sample
(1) (2) (3) (4)
Post x treatment x high cash -0.0485*
(0.0262)
Post x treatment x low cash -0.132***
(0.0422)
Post x treatment x high equity -0.0562**
(0.0271)
Post x treatment x low equity -0.110***
(0.0388)
Post x treatment x large -0.0249
(0.0335)
Post x treatment x small -0.0828***
(0.0281)
Post x treatment x bank -0.120***
(0.0356)
Post x treatment x no bank -0.0518*
(0.0275)
F-test for differences [p-value] [0.041] [0.159] [0.096] [0.053]
Controls Included Included Included Included
Year fixed effects Included Included Included Included
Firm fixed effects Included Included Included Included
Adj. R² 0.385 0.384 0.384 0.385
N 2,226 2,226 2,226 2,226
Notes: The dependent variable is Investment. We use our full sample. Regression models include additional
interaction terms based on conditional variables to assess the cross-sectional variation in the baseline treatment
effect. The following conditional variables are used: (1) high cash (low cash) equals 1 if the average cash of a
finance lease firm, which is defined as cash holdings including receivables from credit institutions scaled by prior
year’s total assets, is above (below) the 25th percentile across the treated firms in the pre-reform period; (2) high
equity (low equity) equals 1 if equity scaled by prior year’s total assets of a finance lease firm is above (below)
the 25th percentile across the treated firms in the year prior to the reform; (3) large (small) equals 1 if total assets
of a finance lease firm are above (below) the mean across the treated firms in the year prior to the reform; (4)
bank (no bank) equals 1 if a finance lease firm is (is not) an affiliate of a bank. All regression models have
standard errors that are heteroscedasticity-robust and clustered at the firm level. Reported values: coefficient
(standard errors) and *** (**) (*) indicate significance levels at 1% (5%) (10%), two-tailed.

Tax Depreciation and Investment Decisions: Evidence from the Leasing Sector
100
First, we distinguish between finance lease firms with high and low cash in the pre-reform
period, respectively (e.g., Zwick and Mahon, 2017; Jacob et al., 2019). We use cash as a proxy
for liquidity, which is one of the most important regulatory requirements. Therefore, we
predict that firms with low cash in the pre-reform period have a stronger investment response.
Cash is defined as cash and equivalents (including receivables from credit institutions) scaled
by the prior year’s total assets. High (low) cash is an indicator variable equal to 1 if a finance
lease firm’s average Cash in the pre-reform period is higher (lower) than the 25th percentile
across all treated firms in the pre-reform period.
Second, we compare the investment response of finance lease firms with high and low equity,
respectively. Since equity is essential to comply with the risk management requirements, we
expect a larger investment response for firms with low equity. We define high (low) equity as
an indicator variable equal to 1 if a finance lease firm’s equity ratio in the year prior to the
reform is higher (lower) than the 25th percentile across all treated firms in the year prior to the
reform.70
Third, we distinguish between small and large finance lease firms, respectively (e.g., Dobbins
and Jacob, 2016). Prior literature shows that small firms’ growth is limited by the amount of
internal finance, which is why small firms rely more heavily on internal funds (e.g., Carpenter
and Petersen, 2002). Since internal funds, which are also needed to fulfil the regulatory
standards, are an important financing possibility, we expect smaller firms to have a stronger
investment response. We define large (small) as an indicator variable equal to 1 if the total
assets of a finance lease firm in the year prior to the reform are higher (lower) than the average
of total assets across all treated firms in the year prior to the reform.
Fourth, we compare the investment response of finance lease firms that are an affiliate of a
bank (bank) with finance lease firms without an affiliation with a bank (no bank). Since a
banking group is subject to stronger liquidity and equity requirements (e.g., due to reforms
proposed by the Basel Committee on Banking Supervision), we expect that bank-owned
finance lease firms have a stronger reaction to the tax depreciation reform.
70 In order to mitigate the concern that the legal form of the finance lease firm affects our results due to a different
determination of equity, we re-estimate our OLS regression (Eq. (1)) with Investment as the dependent variable
for our full and matched sample and investigate whether the treatment effect varies with the legal form (see Table
3.B9 (Appendix)). The results show that the coefficient estimate for corporations has a similar magnitude and
statistical power compared to partnerships suggesting that the legal form does not affect the investment response
of finance lease firms.

Tax Depreciation and Investment Decisions: Evidence from the Leasing Sector
101
Consistent with our predictions, we find a stronger treatment effect for small firms and firms
with low cash and low equity that are affiliated to banks. The difference in coefficient
estimates is statistically significant at conventional levels (except for Column 2). Therefore,
our results suggest that finance lease firms, which are particularly strongly exposed to the
regulatory requirements, have a stronger investment response to the change in tax depreciation
methods. In Table 3.B10 (Appendix), we re-estimate our cross-sectional tests based on our
matched sample. The results are robust and consistent with our findings in Table 3.6.71
3.5.2 Firm-level variation in business models
In our second set of cross-sectional tests, we examine whether our treatment effect predictably
varies with firm-level characteristics that capture the business model of finance lease firms.
We collect all information on a finance lease firm’s business model by using the firm’s annual
report in the year prior to the reform and checking the company website. Using the collected
information, we can conduct several cross-sectional tests. We use our baseline DiD approach
(Eq. (1)). However, to capture the cross-sectional variation in the baseline treatment effect, we
again interact binary conditional variables with the DiD estimator Post x Treatment. We
estimate DiD models with fixed effects and firm controls for our full and matched sample.
First, we examine whether the product focus affects the investment response of finance lease
firms. Since the change in the tax depreciation regime causes an extension of the depreciation
period, we expect that the investment response of finance lease firms is stronger if their
product portfolio heavily relies on leased assets for which the difference between the lease
term and the useful life of the leased asset is high. We gather information on the difference
between the lease term and useful life of the leased asset for different asset classes from
Oestreicher and Hillmann (2016), which we use to formulate our predictions.72 Table 3.7
reports the results for our cross-sectional tests capturing the variation in the firm’s product
portfolio.
71 However, we note that the tax depreciation effect should be predominant if firms have profits (e.g., Wielhouwer
and Wiersma, 2017). To analyse this pattern, we re-estimate our OLS regression (Eq. (1)) with Investment as the
dependent variable for our full and matched sample and investigate whether the treatment effect varies with profit
and loss situations (see Table 3.B11 (Appendix)). The results show that the coefficient estimate for profitable
firms is significant while the coefficient estimate for loss firms is not significant, suggesting that the change in
tax depreciation allowances affects predominantly the investment response of profitable and not loss-making
firms. However, the coefficient estimates are not statistically different. 72 In Oestreicher and Hillmann (2016), we analyse 85,604 lease contracts of two important German finance lease
companies with a diverse product portfolio. About 54,919 lease contracts offer information on the lease term and
expected useful life of the leased asset for tax purposes. In a descriptive analysis, we show which product classes
should be predominantly affected by the German tax depreciation reform, i.e., have the largest difference between
the lease term and expected useful life of the leased asset.

Tax Depreciation and Investment Decisions: Evidence from the Leasing Sector
102
In Panel A of Table 3.7, we test two specifications for the full and matched sample. First, we
distinguish between finance lease firms with a product focus on mobile assets and finance
lease firms with a product focus on immobile assets, respectively (Column 1 and 3). Since
immobile assets (e.g., buildings) are long-lived assets, which are leased over a long period, we
expect that finance lease firms with a focus on mobile assets (e.g., machinery) have a stronger
investment response to the tax depreciation reform. Second, we further split the product focus
on mobile assets into finance lease firms with a diverse portfolio of mobile assets and finance
lease firms with a specialised portfolio of mobile assets (Column 2 and 4). We expect that
finance lease firms with a diverse portfolio of mobile assets react less strongly to the reform
because the diversity of the assets should reduce the overall effect of the reform.
Consistent with our predictions, we find a significant treatment effect for finance lease firms
with a product focus on mobile assets in the full and matched sample while the treatment effect
is not significant for finance lease firms with a product focus on immobile assets. In addition,
we find a significant treatment effect for finance lease firms with a specialised focus on a
particular asset class in the full and matched sample. We find only weak evidence for finance
lease firms with a diverse product portfolio of mobile assets in the full sample and even no
significant effect in the matched sample. However, the difference in coefficient estimates is
not statistically significant at conventional levels in Panel A.
In Panel B of Table 3.7, we further split finance lease firms with a specialised product focus
on a particular asset class into the following different product classes: office/IT, industry,
medicine, agriculture and vehicles. The order of the listed product classes complies with a
decrease in the difference between the lease term and expected useful life of a leased asset,
which means that leased office/IT assets have the largest while vehicles have the smallest
difference between the lease term and the expected useful life of the leased asset. Column 1
and 2 report the results for the full and matched sample, respectively. Consistent with our
prediction, the results suggest that finance lease firms with a product focus on office/IT assets
have a large and significant investment response to the reform. We present the difference in
coefficient estimates to the coefficient estimate of finance lease firms with a focus on office/IT
products. The difference in coefficients is significant for the product classes with the smallest
difference between the lease term and expected useful life of the leased asset (i.e., agriculture
and vehicles). In line with Panel A, we find again a weak effect of finance lease firms with a
diverse product portfolio of mobile assets, which is again not significant in the matched
sample.

Tax Depreciation and Investment Decisions: Evidence from the Leasing Sector
103
Table 3.7: Cross-sectional findings – product portfolio
Panel A: General product focus
Full sample Matched sample
(1) (2) (3) (4)
Post x treatment x mobile -0.0704*** -0.0641**
(0.0263) (0.0290)
Post x treatment x immobile -0.0618 -0.0509
(0.0403) (0.0360)
Post x treatment x specialised -0.0659** -0.0604**
(0.0278) (0.0303)
Post x treatment x diverse -0.0815* -0.0733
(0.0429) (0.0446)
Post x treatment x immobile -0.0618 -0.0509
(0.0403) (0.0360)
F-test for differences [p-value] [0.825] [0.684]
F-test for differences [p-value]
specialised vs. diverse
[0.720]
[0.766]
specialised vs. immobile [0.918] [0.775]
Controls Included Included Included Included
Year fixed effects Included Included Included Included
Firm fixed effects Included Included Included Included
Adj. R² 0.384 0.383 0.410 0.410
N 2,226 2,226 1,659 1,659
Panel B: Detailed product focus
Full sample Matched sample
(1) (2)
Coefficient
estimate (s.e.)
Difference to
office/IT
[p-value]
Coefficient
estimate (s.e.)
Difference to
office/IT
[p-value]
Post x treatment x office/IT -0.184** -0.176**
(0.0772) (0.0766)
Post x treatment x industry -0.112 [0.588] -0.106 [0.590]
(0.112) (0.111)
Post x treatment x medicine -0.0680 [0.189] -0.0617 [0.186]
(0.0490) (0.0506)
Post x treatment x agriculture 0.0427 [0.006] 0.0486 [0.006]
(0.0404) (0.0416)
Post x treatment x vehicles -0.0379 [0.054] -0.0335 [0.054]
(0.0262) (0.0292)
Post x treatment x immobile -0.0608 [0.129] -0.0498 [0.097]
(0.0403) (0.0359)
Post x treatment x diverse -0.0812* [0.223] -0.0730 [0.210]
(0.0429) (0.0446)
Controls Included Included
Year fixed effects Included Included
Firm fixed effects Included Included
Adj. R² 0.384 0.412
N 2,226 1,659
Notes: The dependent variable is Investment. We use our full (Panel A, Column 1 and 2 and Panel B, Column
1) and matched sample (Panel A, Column 3 and 4 and Panel B, Column 2). Regression models include additional
interaction terms based on conditional variables to assess the cross-sectional variation in the baseline treatment
effect. The following conditional variables are used in Panel A: (1) mobile (immobile) equals 1 if a finance lease
firm’s product focus is on mobile (immobile) assets; (2) we further split mobile assets into specialised (diverse),
which equals 1 if a finance lease firm offers mainly products for a specific sector (wide range of products). The

Tax Depreciation and Investment Decisions: Evidence from the Leasing Sector
104
following conditional variables are used in Panel B: (1) office/IT equals 1 if a finance lease firm’s product focus
is on office/IT assets; (2) industry equals 1 if a finance lease firm’s product focus is on machinery and equipment;
(3) medicine equals 1 if a finance lease firm’s product focus is on medical products; (4) agriculture equals 1 if a
finance lease firm’s product focus is on agricultural products; (5) vehicles equals 1 if a finance lease firm’s
product focus is on vehicles; (6) immobile equals 1 if a finance lease firm’s product focus is on immobile assets;
(7) diverse equals 1 if a finance lease firm offers a wide range of products from different sectors. All regression
models have standard errors that are heteroscedasticity-robust and clustered at the firm level. Reported values:
coefficient (standard errors) and *** (**) (*) indicate significance levels at 1% (5%) (10%), two-tailed.
In addition to the product focus, we examine whether the leasing-specific business
characteristic of direct leases affects the investment response of finance lease firms. Direct
lease is a business model in which manufacturers use finance leases to promote their products.
This specific business characteristic allows us to address a potential concern in our research
design. Since finance leases present a financial services function, the business of finance lease
firms is highly demand-related, which means that finance lease firms only invest in assets if
they enter into a contract with a lessee about the leased asset. Thus, observing a negative
investment response after the change in tax depreciation regimes could reflect merely a decline
in demand and not a response to the reform. To investigate potential demand effects, we
distinguish between finance lease firms that are direct lease firms of a specific manufacturer
and finance lease firms without an affiliation with a manufacturer, respectively. Direct lease
firms of manufacturers are highly reliant on the customers’ demand for the product range of
the specific manufacturer because direct lease firms serve only as an additional distribution
channel. A decline in demand should thus immediately result in a decrease in investment by
direct lease firms, while the change in the tax depreciation regime should not have a significant
effect on investment because direct lease firms are only a channel to directly distribute and
finance products of their affiliated companies.
Table 3.8: Cross-sectional findings – manufacturer ownership
Full sample Matched sample
(1) (2)
Post x treatment x manufacturer -0.0533 -0.0496
(0.0396) (0.0412)
Post x treatment x no manufacturer -0.0732*** -0.0660**
(0.0271) (0.0297)
F-test for differences [p-value] [0.615] [0.678]
Controls Included Included
Year fixed effects Included Included
Firm fixed effects Included Included
Adj. R² 0.384 0.410
N 2,226 1,659
Notes: The dependent variable is Investment. We use our full and matched sample. Regression models include
additional interaction terms based on a conditional variable to assess the cross-sectional variation in the baseline
treatment effect. We include the conditional variable manufacturer (no manufacturer), which equals 1 if a finance
lease firm is (is not) a direct lease firm of a specific manufacturer. All regression models have standard errors
that are heteroscedasticity-robust and clustered at the firm level. Reported values: coefficient (standard errors)
and *** (**) (*) indicate significance levels at 1% (5%) (10%), two-tailed.

Tax Depreciation and Investment Decisions: Evidence from the Leasing Sector
105
Table 3.8 reports the results for our cross-sectional tests. The findings reveal an insignificant
treatment effect for direct lease firms of specific manufacturers, indicating that a decrease in
demand cannot explain the findings in our main analysis. However, the difference in
coefficient estimates is not statistically significant at conventional levels.
3.6 Conclusion
In this paper, we examine the investment response of companies from the finance lease sector
to a change in tax depreciation rules. We find that finance lease companies reduce their
investments after a German administrative order in the beginning of 2014 changed the
applicable tax depreciation method from the previous more beneficial straight-line tax
depreciation over the lease term to the less beneficial straight-line tax depreciation over the
longer expected useful life of the leased asset. In addition, we predict and find that the
regulatory requirements to which finance lease firms are exposed moderate the investment
effect. Further cross-sectional tests indicate that the business model affects the investment
response. We find a stronger treatment effect for finance lease firms with a product portfolio
that heavily relies on leased assets for which the difference between the lease term and the
expected useful life of the leased asset is high. Our results reveal that finance lease firms with
a product focus on mobile assets and especially office/IT assets are heavily affected by the
reform.
Our results are subject to limitations. First, we cannot observe the applied tax depreciation
method of firms from the operating lease and finance lease sector. However, based on their
business models and legal requirements with regard to the attribution of leased assets to the
lessor we assume that finance lease companies applied the more favourable tax depreciation
over the lease term prior to the administrative order while this was not the common
depreciation method for operating lease firms. Despite the lease-specific depreciation
preferences, we cannot fully rule it out that companies from the finance and operating lease
sector could have applied other tax depreciation methods. However, this would bias our results
against finding investment effects.
Second, our inferences rely on the parallel trend assumption. Although we plot the yearly point
estimates in Figure 3.2, which do not suggest a violation of the parallel trend assumption, we
cannot completely rule out the possibility of confounding effects affecting our inferences.
However, our fixed-effects structure, matching design and thorough sample selection should

Tax Depreciation and Investment Decisions: Evidence from the Leasing Sector
106
increase the confidence that our identification strategy mitigates time trends and firm-specific
confounding effects in our setting.
Third, we exploit only one exogenous shock, which allows us to examine the sector-specific
investment effect of finance lease firms in Germany. Therefore, internal validity increases at
the expense of external validity. However, we expect that our results are at least generalisable
to other countries in Europe because the German leasing market and the regulatory
requirements are comparable to other countries in Europe.
Despite these potential limitations, our paper provides novel evidence on the effect of tax
depreciation allowances on investment of finance lease firms, which are financial institutions
operating in a regulated and supervised environment. In addition, we extend the general
literature on tax depreciation and investment by exploiting a setting that overcomes the major
limitations of prior studies. We are hence able to identify a clearer investment response to tax
depreciation. Further, our study reveals that regulatory requirements regarding liquidity and
risk management are an important moderator of the investment response of regulated firms.

Tax Depreciation and Investment Decisions: Evidence from the Leasing Sector
107
3.7 Appendix
Appendix 3.A: Value of the change in depreciation allowances
We define z as the present value of tax savings from tax depreciation deductions for an increase
in investment by one unit (Maffini et al., 2019). The marginal tax rate (τ) is 30%, which equals
in general the total tax burden of corporations. Following recent literature, we assume that the
interest rate (r) is 7% (e.g., Zwick and Mahon, 2017; Maffini et al., 2019; Ohrn, 2019). Further,
we assume that the average lease term is 4 years and the average tax depreciation period is 6
years. We base our assumptions on a study by Oestreicher and Hillmann (2016) in which we
analysed 85,604 lease contracts of German firms from the finance lease sector.
Before the reform, the present value of tax savings due to straight-line tax depreciation based
on the lease term (Dpre) can be expressed as
𝑧𝑝𝑟𝑒 = 𝜏 ∑𝐷𝑝𝑟𝑒
(1 + 𝑟)𝑡
4
𝑡=1
= 𝜏 ∑0.25
(1 + 𝑟)𝑡
4
𝑡=1
= 0.8468𝜏
After the reform, straight-line depreciation over the expected useful life of the asset is the only
applicable depreciation method. However, since finance leases require that the leased asset is
financed and amortised over the non-cancellable lease term, finance lease firms sell their assets
after the lease term to an anticipated residual value, which we assume to be zero for
simplification (see Section 3.2.2 and Table 3.B1 (Appendix)). The present value of tax savings
due to straight-line tax depreciation based on the useful life of the asset (Dpost) can be expressed
as
𝑧𝑝𝑜𝑠𝑡 = 𝜏 ∑𝐷𝑝𝑜𝑠𝑡
(1 + 𝑟)𝑡
4
𝑡=1
+𝜏(1 − ∑ 𝐷𝑝𝑜𝑠𝑡
4𝑡=1 )
(1 + 𝑟)4= 𝜏 ∑
0.16667
(1 + 𝑟)𝑡
4
𝑡=1
+0.33333𝜏
(1 + 𝑟)4= 0.8188𝜏
Therefore, the change in the present value of tax savings from tax depreciation deductions for
an increase in investment by one unit is -0.033 (= 𝑑𝑧/𝑧 = −0.028𝜏/0.8468𝜏), which
complies with a decrease of the present value of tax depreciation deductions for a unit
investment by around 3.3%. Given the assumption that the marginal tax rate is 30%, the
change in tax depreciation allowance should increase the net-of-tax cost of a unit investment,
1 – z, by around 1.13% (= 𝑑(1 − 𝑧)/(1 − 𝑧) = 0.028 × 0.3/(1 − 0.8468 × 0.3)).

Tax Depreciation and Investment Decisions: Evidence from the Leasing Sector
108
Appendix 3.B: Additional tables
Table 3.B1: Simplified example of tax depreciation methods
Panel A: Straight-line depreciation over the expected useful life of the leased asset
t1 t2 t3 t4
Depreciation 166.66 166.66 166.66 166.66
Loss on sale 333.36
a. Tax benefit from depreciation 50.00 50.00 50.00 150.00
Panel B: Straight-line depreciation over the lease term considering a residual value
t1 t2 t3 t4
Depreciation 250.00 250.00 250.00 250.00
Loss on sale 0
b. Tax benefit from depreciation 75.00 75.00 75.00 75.00
Panel C: Liquidity effect
a.-b. Difference in the tax benefit -25.00 -25.00 -25.00 75.00
Present value of difference in tax benefits -8.39
Notes: This table presents the liquidity effect (Panel C) that results from a comparison between the tax benefit
of two tax depreciation methods based on a simplified example. The following assumptions are made for the
example: the acquisition cost of the leased asset is EUR 1,000, the expected useful life of the leased asset is six
years, the lease term is four years, the residual value and market value of the leased asset at the end of the lease
term are EUR 073, the tax rate of the lessor is 30% and the interest rate is 7%. Panel A presents the tax benefit
from depreciation if straight-line tax depreciation over the expected useful life of the leased asset is applied.
Panel B presents the tax benefit from depreciation if straight-line tax depreciation over the lease term under
consideration of the residual value of the leased asset at the end of the lease term is applied.
73 Due to the business model of finance lease firms, the residual value and sales price of the leased asset are of
subordinate importance to our analysis. For simplification purposes, we assume both values to be zero.

Tax Depreciation and Investment Decisions: Evidence from the Leasing Sector
109
Table 3.B2: Robustness tests – alternative dependent variable
Full sample Matched sample
(1) (2)
Dependent variable: Net investment rate of leasing assets (Inv_Leasing)
Post x Treatment -0.0645** -0.0563*
(0.0272) (0.0300)
Controls Included Included
Year fixed effects Included Included
Firm fixed effects Included Included
Adj. R² 0.361 0.374
N 2,128 1,561
Notes: The dependent variable is the net investment rate of leased assets for our treated firms and Investment for
our control group. The table reports fully specified regressions with fixed effects and firm-level controls for the
full and matched sample. The main variable of interest in the multivariate models is the interaction term Post x
Treatment, capturing the difference-in-differences effect. The interaction term Post x Treatment equals 1 for
treated firm observations (companies from the finance lease sector) in the post treatment period 2014-2015 and
0 otherwise. All variables are defined in Table 3.B3 (Appendix). All regression models have standard errors that
are heteroscedasticity-robust and clustered at the firm level. Reported values: coefficient (standard errors) and ***
(**) (*) indicate significance levels at 1% (5%) (10%), two-tailed.

Tax Depreciation and Investment Decisions: Evidence from the Leasing Sector
110
Table 3.B3: Variable definitions
Variable Description Source
Investment measures
Investment Change in tangible assets (including leasing assets) scaled
by prior year’s tangible assets (≙ net investment rate)
Amadeus/hand-collected
Inv_Depr Change in tangible assets (including leasing assets) before
depreciation scaled by prior year’s total assets (≙ gross
investment rate)
Amadeus/hand-collected
Inv_Leasing Change in leasing assets scaled by prior year’s leasing
assets for treated firms; change in tangible assets scaled by
prior year’s tangible assets for control firms
Amadeus/hand-collected
Inv_TA Change in tangible assets (including leasing assets) scaled
by prior year’s total assets
Amadeus/hand-collected
Other firm characteristics
Leverage Total debt scaled by prior year’s total assets Amadeus/hand-collected
Liquidity Cash and equivalents scaled by prior year’s total assets Amadeus/hand-collected
Loss Dummy variable equal to 1 if prior year’s profit/loss before
taxes is negative
Amadeus/hand-collected
Profitability Profit/loss before taxes scaled by prior year’s total assets Amadeus/hand-collected
Post Dummy variable equal to 1 for 2014 and 2015 and 0
otherwise
Constructed
Size Natural logarithm of prior year’s total assets Amadeus/hand-collected
Treatment Dummy variable equal to 1 if the firm is a company from
the finance lease sector, and 0 if the firm belongs to the
rental or operating lease sector
Constructed
Note: This table shows variable definitions.

Tax Depreciation and Investment Decisions: Evidence from the Leasing Sector
111
Table 3.B4: Sample selection
Selection criteria Number of
firms
Number of
observations
Panel A: Treatment group
German companies from the finance lease sector, which are
registered by the Federal Financial Supervisory Authority
from 2011 to 2015, with published unconsolidated annual
financial statements in the German Federal Gazette’s
Company Register database
311 1,555
Excluding:
(1) Firms with restructuring processes (e.g. mergers) during the
sample period
(35) (175)
(2) Observations with missing values for the dependent and
control variables
(72) (435)
(3) Firms without financial data of the net investment rate at
least one year prior and after the reform
(9) (18)
Final sample of treated firms 195 927
Panel B: Control group
German firms in Bureau van Dijk’s Amadeus database
belonging to the rental sector (NACE code: 7710-7739)
9,784 48,920
Excluding:
(1) Firms with consolidated or non-German-GAAP financial
data
(7) (35)
(2) Firms with similar company names compared to companies
from the finance lease sector
(16) (80)
(3) Firms with restructuring processes (e.g. mergers) during the
sample period
(4) (20)
(4) Observations with missing values for the dependent and
control variables
(8,756) (47,097)
(5) Firms without financial data of the net investment rate at
least one year prior and after the reform
(648) (389)
Final sample of control firms 353 1,299
Final sample of treated and control firms: 548 2,226
Notes: This table provides details on the sample selection process for our treated (Panel A) and control firms
(Panel B). Our primary data sources are the German Federal Gazette’s Company Register database for our treated
firms and the Bureau van Dijk’s Amadeus database for our control firms. Dependent and control variables are
defined in Table 3.B3 (Appendix).

Tax Depreciation and Investment Decisions: Evidence from the Leasing Sector
112
Table 3.B5: Alternative regression specification – balanced sample
Full sample Matched sample
(1) (2)
Post x Treatment -0.0457 -0.0696*
(0.0294) (0.0353)
Controls Included Included
Year fixed effects Included Included
Firm fixed effects Included Included
Adj. R² 0.345 0.329
N 1,245 930
Notes: The dependent variable is Investment. The table reports fully specified regressions with fixed effects and
firm-level controls for the full and matched sample. We use a balanced sample. The main variable of interest in
the multivariate models is the interaction term Post x Treatment, capturing the difference-in-differences effect.
The interaction term Post x Treatment equals 1 for treated firm observations (companies from the finance lease
sector) in the post treatment period 2014-2015 and 0 otherwise. All variables are defined in Table 3.B3
(Appendix). All regression models have standard errors that are heteroscedasticity-robust and clustered at the
firm level. Reported values: coefficient (standard errors) and *** (**) (*) indicate significance levels at 1% (5%)
(10%), two-tailed.

Tax Depreciation and Investment Decisions: Evidence from the Leasing Sector
113
Table 3.B6: Alternative regression specification – winsorising
Full sample Matched sample
(1) (2)
Post x Treatment -0.0529** -0.0530**
(0.0223) (0.0246)
Controls Included Included
Year fixed effects Included Included
Firm fixed effects Included Included
Adj. R² 0.404 0.449
N 2,226 1,659
Notes: The dependent variable is Investment. The table reports fully specified regressions with fixed effects and
firm-level controls for the full and matched sample. We winsorise all continuous variables at the 1% (99%) level.
The main variable of interest in the multivariate models is the interaction term Post x Treatment, capturing the
difference-in-differences effect. The interaction term Post x Treatment equals 1 for treated firm observations
(companies from the finance lease sector) in the post treatment period 2014-2015 and 0 otherwise. All variables
are defined in Table 3.B3 (Appendix). All regression models have standard errors that are heteroscedasticity-
robust and clustered at the firm level. Reported values: coefficient (standard errors) and *** (**) (*) indicate
significance levels at 1% (5%) (10%), two-tailed.

Tax Depreciation and Investment Decisions: Evidence from the Leasing Sector
114
Table 3.B7: Sample statistics over the period 2011-2013
N Mean StDev P50 Min Max
Treatment group
Investment 553 0.0434 0.3325 -0.0009 -0.5863 4.0512
Liquidity 553 0.0005 0.0036 0.0000 0.0000 0.0695
Size 553 10.0219 1.8030 9.9806 5.3270 13.8670
Leverage 553 0.6227 0.3602 0.6460 0.0000 2.4416
Profitability 553 0.0282 0.0719 0.0149 -0.3454 0.5839
Loss 553 0.2170 0.4126 0.0000 0.0000 1.0000
Total assets (in EUR 1,000) 553 98,572 191,483 21,687 313 1,142,128
Tangible assets (in EUR 1,000) 553 64,820 138,554 1,2465 0.0262 889,141
Full sample control group
Investment 769 0.1046 0.3431 0.0190 -0.7592 1.6973
Liquidity 769 0.0916 0.1177 0.0448 0.0000 0.6457
Size 769 8.4802 1.7591 8.4884 4.3944 13.1019
Leverage 769 0.5321 0.3583 0.5191 0.0000 2.0387
Profitability 769 0.0913 0.1268 0.0591 -0.2817 0.8024
Loss 769 0.1378 0.3450 0.0000 0.0000 1.0000
Matched sample control group
Investment 426 0.0664 0.3045 0.0007 -0.7147 1.6458
Liquidity 426 0.0198 0.0224 0.0112 0.0000 0.1175
Size 426 8.7005 1.7598 8.7227 4.5109 13.1019
Leverage 426 0.5827 0.3684 0.5891 0.0000 1.8712
Profitability 426 0.0657 0.1034 0.0404 -0.1836 0.6409
Loss 426 0.1901 0.3929 0.0000 0.0000 1.0000
Notes: This table provides summary statistics of the treatment, full and matched control group for the pre-reform
period 2011-2013. All variables are defined in Table 3.B3 (Appendix).

Tax Depreciation and Investment Decisions: Evidence from the Leasing Sector
115
Table 3.B8: Entropy balancing
(1) (2)
Post x Treatment -0.0418 -0.0627**
(0.0276) (0.0258)
Controls None Included
Year fixed effects Included Included
Firm fixed effects Included Included
Adj. R² 0.152 0.362
N 1,830 1,830
Notes: This table provides the results of our baseline regression based on a matched sample. We employ entropy
balancing matching. We match on first differences of all firm-level covariates (size, leverage, profitability,
liquidity, loss) and the natural logarithm of tangible assets in the year before the reform. The entropy balancing
method calculates weights, which we use to re-estimate our main regression model (Section 3.4.1). The
dependent variable is Investment. The table reports two different specifications: (1) regression with fixed effects
but without firm-level controls, and (2) fully specified regression with fixed effects and firm-level controls. The
main variable of interest in the multivariate models is the interaction term Post x Treatment, capturing the
difference-in-differences effect. The interaction term Post x Treatment equals 1 for treated firm observations
(companies from the finance lease sector) in the post treatment period 2014-2015 and 0 otherwise. All variables
are defined in Table 3.B3 (Appendix). All regression models have standard errors that are heteroscedasticity-
robust and clustered at the firm level. Reported values: coefficient (standard errors) and *** (**) (*) indicate
significance levels at 1% (5%) (10%), two-tailed.

Tax Depreciation and Investment Decisions: Evidence from the Leasing Sector
116
Table 3.B9: Cross-sectional findings – legal form
Full sample Matched sample
(1) (2)
Post x Treatment x corporation -0.0698** -0.0635**
(0.0284) (0.0305)
Post x Treatment x partnership -0.0696** -0.0622*
(0.0318) (0.0347)
F-test for differences [p-value] [0.995] [0.968]
Controls Included Included
Year fixed effects Included Included
Firm fixed effects Included Included
Adj. R² 0.539 0.410
N 2,226 1,659
Notes: The dependent variable is Investment. We use our full and matched sample (Column 1 and 2). Regression
models include additional interaction terms based on a conditional variable to assess the cross-sectional variation
in the baseline treatment effect. We include the conditional variable corporation (partnership), which equals 1 if
the finance lease firm has a legal form that is equivalent to a limited liability company (partnership). All
regression models have standard errors that are heteroscedasticity-robust and clustered at the firm level. Reported
values: coefficient (standard errors) and *** (**) (*) indicate significance levels at 1% (5%) (10%), two-tailed.

Tax Depreciation and Investment Decisions: Evidence from the Leasing Sector
117
Table 3.B10: Cross-sectional findings – exposure to regulatory requirements, matched sample
Matched sample
(1) (2) (3) (4)
Post x treatment x high cash -0.0421
(0.0290)
Post x treatment x low cash -0.125***
(0.0433)
Post x treatment x high equity -0.0501*
(0.0298)
Post x treatment x low equity -0.102**
(0.0399)
Post x treatment x large -0.0188
(0.0352)
Post x treatment x small -0.0760**
(0.0306)
Post x treatment x bank -0.113***
(0.0372)
Post x treatment x no bank -0.0454
(0.0299)
F-test for differences [p-value] [0.041] [0.171] [0.095] [0.049]
Controls Included Included Included Included
Year fixed effects Included Included Included Included
Firm fixed effects Included Included Included Included
Adj. R² 0.413 0.411 0.411 0.412
N 1,659 1,659 1,659 1,659
Notes: The dependent variable is Investment. We use our matched sample. Regression models include additional
interaction terms based on conditional variables to assess the cross-sectional variation in the baseline treatment
effect. The following conditional variables are used: (1) high cash (low cash) equals 1 if the average cash of a
finance lease firm, which is defined as cash holdings including receivables from credit institutions scaled by prior
year’s total assets, is above (below) the 25th percentile across the treated firms in the pre-reform period; (2) high
equity (low equity) equals 1 if equity scaled by prior year’s total assets of a finance lease firm is above (below)
the 25th percentile across the treated firms in the year prior to the reform; (3) large (small) equals 1 if total assets
of a finance lease firm are above (below) the mean across the treated firms in the year prior to the reform; (4)
bank (no bank) equals 1 if a finance lease firm is (is not) an affiliate of a bank. All regression models have
standard errors that are heteroscedasticity-robust and clustered at the firm level. Reported values: coefficient
(standard errors) and *** (**) (*) indicate significance levels at 1% (5%) (10%), two-tailed.

Tax Depreciation and Investment Decisions: Evidence from the Leasing Sector
118
Table 3.B11: Cross-sectional findings – loss situation
Full sample Matched sample
(1) (2)
Post x treatment x profit -0.0681*** -0.0635**
(0.0257) (0.0288)
Post x treatment x loss -0.0781 -0.0617
(0.0553) (0.0548)
F-test for differences [p-value] [0.853] [0.972]
Controls Included Included
Year fixed effects Included Included
Firm fixed effects Included Included
Adj. R² 0.384 0.410
N 2,226 1,659
Notes: The dependent variable is Investment. We use our full and matched sample (Column 1 and 2). Regression
models include additional interaction terms based on a conditional variable to assess the cross-sectional variation
in the baseline treatment effect. We include the conditional variable profit (loss), which equals 1 if the average
profit/loss before taxes in the pre-reform period is positive (negative). All regression models have standard errors
that are heteroscedasticity-robust and clustered at the firm level. Reported values: coefficient (standard errors)
and *** (**) (*) indicate significance levels at 1% (5%) (10%), two-tailed.

The Effect of Public Country-by-Country Reporting on Real Activities of EU Banks
119
4. The Effect of Public Country-by-Country Reporting on Real Activities of EU Banks
Lisa Hillmann74
Working Paper75
Abstract:
In this paper, I examine the effects of mandatory public Country-by-Country Reporting
(CbCR) disclosure requirements in the EU financial sector on banks’ real economic activities.
Using the implementation of CbCR as an exogenous shock, I find that EU multinational banks
decrease their tax avoidance activities, total assets, earning assets and the number of
employees compared to EU domestic banks after CbCR disclosure requirements became
effective in 2014. Cross-sectional tests reveal that the response of EU multinational banks
prevails for those exposed to reputational concerns and detection risks. My findings add to the
literature on the real effects of disclosure and supplements the emerging literature on the
consequences of public CbCR in particular.
JEL classification: E51, G21, G28, H20, H26, M41, M48
Keywords: Tax transparency, country-by-country reporting, banks, real effects, tax avoidance
Acknowledgements: For helpful comments and suggestions, I thank Rebecca Höhl, Reinald
Koch, Olaf Korn, Andreas Oestreicher and Robert Schwager.
74 University of Goettingen, Faculty of Business and Economics, Tax Division, Platz der Goettinger Sieben 3,
37073 Goettingen, Germany. 75 First version of the working paper: April 2020. This version: November 2020.
The Effect of Public Country-by-Country Reporting on Real Activities of EU Banks
120
4.1 Introduction
Prior literature provides evidence on the effect of mandatory public disclosure on real firm
behaviour, especially in the context of corporate social responsibility (CSR) disclosures (e.g.,
Christensen et al., 2017; Chen et al., 2018b; Fiechter et al., 2019; Rauter, 2020). However,
little is known about the effect of mandatory public disclosure of tax information on real firm
behaviour (Dyreng and Maydew, 2018). I reduce this gap by exploiting a setting in Europe,
which allows me to test whether public disclosure of tax information creates “real effects”
(e.g., Leuz and Wysocki, 2016).
The European Union’s (EU) Capital Requirements Directive IV (CRD IV) (Directive
2013/36/EU), which was passed in June 2013, mandates banks76 in the EU to disclose annual
financial and tax information by geographical location and type of activity. The so-called
Country-by-Country Reporting (CbCR) was first required from banks in July 2014. They had
to disclose turnover and the number of employees per country based on consolidated data.
Since 1 January 2015, EU banks have had to disclose profit or loss before tax, tax on profit or
loss and public subsidies received in addition to the previously mentioned information.
A small bunch of studies investigates the effects of the CbCR, which is public for the EU
financial sector and private for EU multinational firms. Previous literature finds that under the
private CbCR disclosure regulation treated multinational firms reduce their tax avoidance
behaviour (Hugger, 2019; Joshi, 2020). In addition, treated multinational firms decrease their
number of subsidiaries in tax havens, but increase revenues, employment, investment and tax
expenses in low-tax European countries, indicating that firms shift their real economic
activities (De Simone and Olbert, 2020).
Studies that exploit the effect of public CbCR for EU banks find mixed market reactions (e.g.,
Dutt et al., 2019a; Flagmeier and Gawehn, 2020). Brown et al. (2019) find no significant
change in the reported number of geographic segments or country segments after the
introduction of public CbCR. However, Eberhartinger et al. (2020) reveal that banks reduce
their number of subsidiaries in tax havens after the introduction of the public disclosure
requirement. The effect of public CbCR for EU banks on their overall tax avoidance is mixed,
depending on the sample selection, control group identification and data (Brown, 2018;
Overesch and Wolff, 2019; Joshi et al., 2020). My paper extends Joshi et al. (2020) and
Overesch and Wolff (2019) by examining the effect of CbCR disclosures on real activities of
76 The term “banks” captures all financial sector entities that fall under the CbCR disclosure requirements.

The Effect of Public Country-by-Country Reporting on Real Activities of EU Banks
121
EU banks and complements De Simone and Olbert (2020) by investigating the effect of a
mandatory public disclosure provision.
The impact of CbCR disclosures on banks’ activities depends on the expected costs of
disclosure. One potential cost channel could be that banks face higher detection and
enforcement risks by tax authorities. The importance of this channel depends on the relevance
of the information content of CbCR disclosures to tax authorities. Another potential cost
channel could be reputational concerns. The disclosure of tax information per country could
facilitate the monitoring of bank activities that the public could perceive as tax avoidance
behaviour, which is not socially desirable (e.g., Roychowdhury et al., 2019). Under this
channel, banks might change their tax avoidance behaviour to reduce potential social costs
such as loss of trust and damage to their image. If, however, CbCR disclosures raised costs for
banks due to either an increase in detection and enforcement risks or reputational concerns, I
would expect that banks reduce their tax avoidance activities.
A decline in tax avoidance resulting from the disclosure of tax information negatively affects
real economic activities when banks include tax avoidance behaviour in their decision to
maximise their after-tax profits. If the benefits and costs of tax avoidance are part of the bank’s
profit function, the optimal level of tax avoidance affects the optimal levels of the input factors,
e.g. capital and labour (Bruehne and Jacob, 2019; Dyreng et al., 2020). Therefore, I predict
that the increase in the costs of tax avoidance due to the disclosure of tax information decreases
tax avoidance behaviour, resulting in a decline in real activities, such as investment decisions.
I examine the effect of CbCR disclosures on banks’ tax avoidance behaviour and real
economic activities by applying a difference-in-differences (DiD) approach. The treatment
group consists of multinational banks headquartered in the EU because the CRD IV applies to
each EU bank. In line with prior literature, the control group comprises domestic banks
domiciled in the EU since they do not have opportunities to employ cross-border tax avoidance
activities (e.g., Demirgüç-Kunt and Huizinga, 2001; Overesch and Wolff, 2019; Joshi et al.,
2020). I use a sample period from 2011-2015, defining the years 2014 and 2015 as the
treatment period.
I collect financial and ownership data from the Bankscope database provided by Bureau van
Dijk. Following prior literature, I use the GAAP effective tax rate as a proxy for tax avoidance
behaviour (see for an overview, e.g., Hanlon and Heitzman, 2010; Blouin, 2014; Wilde and
Wilson, 2018). Further, I employ total assets, earning assets (i.e., the sum of loans, securities

The Effect of Public Country-by-Country Reporting on Real Activities of EU Banks
122
and property) and the number of employees as proxies for real economic activities of EU banks
(e.g., Gropp et al., 2019; De Simone and Olbert, 2020).
My first set of empirical tests shows that EU multinational banks decrease their tax avoidance
behaviour after the CbCR disclosure requirement became effective in 2014. This result is
statistically and economically significant compared to EU domestic banks. Further, the result
is in line with prior studies (e.g., Overesch and Wolff, 2019; Joshi et al., 2020). My finding is
robust after controlling for bank and bank’s home country characteristics and using an
alternative tax avoidance measure as the dependent variable.
In my second set of tests, I find that after the CbCR disclosure reform EU multinational banks
reduce their real economic activities measured as total assets, earning assets and the number
of employees (e.g., Gropp et al., 2019). These results suggest that a decrease in tax avoidance
due to the disclosure of tax information negatively affects a bank’s real economic activities.
My findings seem to be robust after including bank and bank’s home country characteristics
and employing alternative dependent variables.
In my third set of empirical tests, I explore the cross-sectional variation in the multinational
bank’s response to CbCR by examining whether the two possible cost channels –
enforcement/detection risks and reputational concerns – moderate the treatment effect on tax
avoidance and hence on real economic activities. These tests aim at providing more insights
and evidence that banks’ real economic activities reduce after the CbCR disclosure because
their tax avoidance activities decrease. My results for the channel covering the enforcement
and detection risk reveal that the effect of CbCR disclosures on tax avoidance and real
economic activities of multinational banks is significant for those with at least one affiliate in
a tax haven country and with a high number of foreign affiliates. In addition, I find a significant
response of treated banks headquartered in a country with a high government quality. The
results for the reputation channel reveal that the effect of CbCR disclosures on treated banks’
tax avoidance and real economic activities is significant for large banks and those
headquartered in a country in which at least one NGO is resident. However, the listing of a
treated bank affects tax avoidance but does not predominantly impact real economic activities.
Overall, I find support for both channels, indicating that the decrease in tax avoidance drives
the adverse effects of CbCR disclosures on banks’ real economic activities.
Additional analyses support the validity of my inferences and enhance my results. First, I re-
estimate my baseline regressions based on an entropy-balanced sample to mitigate the
concerns that EU domestic banks and EU multinational banks are not comparable (e.g.,

The Effect of Public Country-by-Country Reporting on Real Activities of EU Banks
123
Hainmueller and Xu, 2013; Fiechter et al., 2019; Joshi et al., 2020). The results do not suggest
that observable differences across treated and control banks confound the baseline inferences.
Second, I assess the validity of the parallel trend assumption by estimating the yearly treatment
effects over the sample period. The results indicate that the parallel trend assumption can be
supported. Third, I vary the definition of the treatment date and treatment group to mitigate
the concern that misspecifications affect my findings. Results from variations in the treatment
date are consistent with my baseline findings. To further address the concern that other
provisions of the CRD IV confound and drive the reduction in real activities, I define placebo
treatments regarding the bank’s liquidity, equity and profitability (following Overesch and
Wolff, 2019). My results do not show a decrease in real economic activities after the reform
for less liquid or less profitable banks or banks with low equity, suggesting that the CbCR
disclosure requirement induces the decline in tax avoidance and real activities of multinational
banks.
My paper contributes to the literature on real effects of public disclosures (e.g., Leuz and
Wysocki, 2016; Christensen et al., 2017; Chen et al., 2018b; Fiechter et al., 2019; Rauter,
2020). I respond to the call for research by Dyreng and Maydew (2018) on how public
disclosure of tax information affects the behaviour of firms. Prior literature provides little
evidence on the effect of mandatory public disclosure of tax information on the location of
subsidiaries, firm’s tax avoidance behaviour and tax authority’s enforcement attention (e.g.,
Dyreng et al., 2016; Bozanic et al., 2017). I contribute to this branch of literature by showing
that banks respond to the disclosure of tax information not only by decreasing their tax
avoidance activities but also by reducing their real economic activities. These results should
be of interest to policymakers because the disclosure of tax information seems to achieve its
main policy objective of reducing aggressive tax avoidance. However, the regulation seems to
have unintended consequences on real economic activities of banks (e.g., Rauter, 2020; De
Simone and Olbert, 2020).
In particular, my study adds to the emerging literature on the consequences of public and
private CbCR (e.g., Brown, 2018; Brown et al., 2019; Dutt et al., 2019a; Hugger, 2019;
Overesch and Wolff, 2019; Joshi, 2020; De Simone and Olbert, 2020; Joshi et al., 2020;
Flagmeier and Gawehn, 2020; Eberhartinger et al., 2020). Recent studies find that
multinational firms reduce tax avoidance and the number of subsidiaries in tax havens, but
shift their real economic activities, e.g. revenues, employment and investment, to low-tax
European countries after the implementation of mandatory private CbCR (Joshi, 2020; De
Simone and Olbert, 2020). However, evidence on the effects of mandatory public CbCR on

The Effect of Public Country-by-Country Reporting on Real Activities of EU Banks
124
banks’ tax avoidance behaviour is mixed (Brown, 2018; Overesch and Wolff, 2019; Joshi et
al., 2020), even though first evidence indicates that the tax haven presence declined after the
introduction of public CbCR for European banks (Eberhartinger et al., 2020). I contribute to
this branch of literature by providing first evidence on the effect of public CbCR on real
activities of EU banks, i.e., on employment and investment, when comparing EU multinational
banks with EU domestic banks in a DiD setting. Additionally, I show that the real impact is
based on the effect of CbCR on tax avoidance, which depends on reputational concerns as well
as detection and enforcement risks. My paper is closely related to Joshi et al. (2020) and De
Simone and Olbert (2020). However, it extends and complements both papers by examining
the real effects of public CbCR on banks’ real economic activities.
The paper proceeds as follows. Section 4.2 presents the regulatory background. In Section 4.3,
I provide a literature review and develop my empirical predictions. Section 4.4 outlines the
research design and describes the sample and data. In Section 4.5, I present the baseline and
cross-sectional findings. Section 4.6 provides additional analyses and Section 4.7 concludes.
4.2 Country-by-country reporting under the EU Capital Requirements Directive IV
In June 2013, the European Parliament and European Council published the EU Capital
Requirements Directive IV (Directive 2013/36/EU) (EU, 2013a). The primary objective of the
CRD IV was to implement the Basel III regulatory framework into EU law (EU, 2013b, Recital
1 and 10). After the financial crisis, the Basel Committee on Banking Supervision (2011)
agreed on a set of measures regarding capital and liquidity requirements to strengthen the
supervision and risk management in the financial sector. The overall aim was to reduce the
risk of future crises in the financial sector (EU, 2013a, Recital 34). The CRD IV implemented
most of the Basel III recommendations and imposed additional provisions to enhance
corporate governance practices by institutions (EU, 2013a, Recital 53) and to increase
transparency via a country-by-country reporting (Art. 89 CRD IV).
Article 89 CRD IV contains the most relevant provision I examine in this paper. The CbCR
mandates banks to disclose annual financial and tax information by geographical location and
type of activity. Recital 52 of the Directive states the aim of CbCR (EU, 2013a): “Increased
transparency regarding the activities of institutions, and in particular regarding profits made,
taxes paid and subsidies received, is essential for regaining the trust of citizens of the Union
in the financial sector. Mandatory reporting in that area can therefore be seen as an important
element of the corporate responsibility of institutions towards stakeholders and society.”

The Effect of Public Country-by-Country Reporting on Real Activities of EU Banks
125
The CbCR regulation broadly applies to banks, investment firms and other credit institutions
(hereafter “banks”) in the European Economic Area77 (Art. 4 CRR in EU, 2013b).78 All
member states of the EEA oblige each bank to disclose information on a consolidated basis by
the member state and by the third country in which it has an establishment (Art. 89 CRD IV).
Consequently, a bank headquartered in the EEA with foreign subsidiaries must fill a CbC
report at the group level. Banks headquartered outside the EEA but with subsidiaries domiciled
in the EEA only have to disclose information on their subsidiaries in the EEA.
According to the CRD IV, banks have to reveal each year the following information per
country on a consolidated basis (Art. 89 CRD IV):
a) Names, nature of activities and geographical location;
b) Turnover;
c) Number of employees on a full time equivalent basis;
d) Profit or loss before tax;
e) Tax on profit or loss;
f) Public subsidies received.
The implementation of the CbCR regulation into national law by member states was required
by 1 January 2014. By 1 July 2014, banks had to disclose the first CbC report consisting of
information a) to c).79 Since 1 January 2015, EU banks have been required to disclose the
information referred to a) to f).
This change in mandatory public disclosure of tax information offers valuable features that
mitigate identification issues in econometric analyses for the following reasons. First, this
exogenous shock setting reduces the possibility of anticipation effects. Although the EU
Commission started working on the CRD IV in 2009 (PwC, 2016), the tax transparency
requirement was only suggested at a very late stage. In February 2013, the final proposal of
the CRD IV included the first proposal of CbCR for banks before the final Directive was
passed four months later (PwC, 2016). This short period of negotiating the tax transparency
requirement and the short period between passing the CRD IV and implementing the Directive
into national law mitigate the possible shortcoming that banks could anticipate the reform.
77 The European Economic Area (EEA) consists of countries of the European Union, Iceland, Liechtenstein and
Norway. 78 The detailed definitions are complex and their application in practice can be uncertain (PwC, 2016). 79 In addition, all global systematically important institutions authorised within the Union shall submit to the
Commission the information referred to d) to f) on a confidential basis (Art. 89 CRD IV).

The Effect of Public Country-by-Country Reporting on Real Activities of EU Banks
126
In addition, it seems reasonable to assume that banks perceive this reform as permanent.
Although Article 89 CRD IV states that the EU Commission shall conduct a general
assessment about potential negative economic consequences of the public disclosure of tax
information by 31 December 2014, it seems unlikely for several reasons that this reform is just
temporary. First, the OECD (2013) also suggested a (private) CbCR for multinational
enterprises in Action 13 of the BEPS project in 2013. Second, the assessment of the European
Commission (2014) on the public CbCR was already published in October 2014 and revealed
that the tax transparency requirement is not expected to have adverse economic consequences
and thus should apply.
A potential challenge regarding the setting is that the CRD IV is a package comprising several
provisions in addition to CbCR. However, I mitigate the concern that other provisions of the
package drive my results. First, not all provisions became effective in 2014 but in later years,
making it less likely that banks immediately react to other provisions than the CbCR.80 Second,
my identification strategy and choice of the control group should reduce potential concerns
regarding confounding effects (see Section 4.4.1). Third, by examining placebo treatments, I
provide evidence that other provisions of the CRD IV do not affect my results (see Section
4.6.3).
4.3 Related literature and hypotheses
4.3.1 Literature review
Prior literature provides some empirical evidence on the effect of mandatory public disclosure
on real firm behaviour, e.g., on changes in investments (e.g., Leuz and Wysocki, 2016; Dyreng
and Maydew, 2018). Investigating mandatory CSR disclosure regulations, Chen et al. (2018b)
find that CSR disclosure resulted in a decrease in firms’ pollutant emissions in China due to
an increase in CSR activities. Fiechter et al. (2019) exploit the EU CSR Directive as an
exogenous shock and find that firms anticipated the disclosure mandate by increasing CSR
activities even before the first mandatory disclosures were required. Examining the Dodd-
Frank Act of 2010, Christensen et al. (2017) reveal that the disclosure of violations of mine-
safety regulations in financial statements improved firms’ compliance with mine safety
regulations, leading to a reduction in workforce injuries. Rauter (2020) examines the EU
country-by-country reporting of extraction payments and shows that disclosing firms
80 For example, the regulations for capital requirements shall apply from 1 January 2016 onward (Art. 162 CRD
IV).

The Effect of Public Country-by-Country Reporting on Real Activities of EU Banks
127
increased their payments to host governments, decreased investment and obtained fewer
extraction licenses.
Evidence on the effect of mandatory public disclosure of tax information on real firm
behaviour is sparse (Dyreng and Maydew, 2018). Dyreng et al. (2016) investigate the effect
of public scrutiny of UK firms’ subsidiary locations on firms’ disclosure and tax avoidance
behaviour. They find that firms, which were initially not compliant with the mandatory public
subsidiary disclosure regulation in the UK and gained public attention, decreased their tax
avoidance behaviour and use of tax havens. Bozanic et al. (2017) provide evidence that the
Internal Revenue Service finds public FIN 4881 disclosures of income tax risks in the United
States useful for tax enforcement purposes.
An increasing number of studies investigate the effects of the EU country-by-country reporting
disclosure of tax information, which is public for the EU financial sector and private for EU
multinational firms. Joshi (2020) examines the private CbCR disclosure regulation and finds
that treated multinational firms reduced their tax avoidance behaviour measured with the
GAAP effective tax rate. However, Hugger (2019) exploits the same reform setting and shows
that the effective tax rate of treated multinational firms increased, but the growth rate of total
tax payments was unaffected. De Simone and Olbert (2020) extend Joshi (2020) by examining
the effect of private CbCR disclosures on firms’ real economic activities. They find that treated
multinational firms reduced their number of subsidiaries in tax havens, but increased revenues,
employment, investment and tax expenses in low-tax European countries, indicating that firms
shifted their real economic activities.
A few recent studies investigate the effect of public CbCR for EU banks. Dutt et al. (2019a)
examine the stock price reaction to the adoption of public CbCR and find no market reaction,
while Flagmeier and Gawehn (2020) show weakly significant investor reactions by applying
another event date and treatment group. Brown et al. (2019) investigate the effect of public
CbCR on geographic segment reports of EU banks. They find no evidence of a change in the
number of geographic segments, country segments or items per geographic segment.
However, they reveal a positive association between banks’ operations in tax havens and
strategical aggregation of geographic segments, indicating that banks potentially tried to
obfuscate activities in tax havens. However, Eberhartinger et al. (2020) find evidence that
81 FIN 48 is an interpretation issued by the FASB (Financial Accounting Standards Board) regarding the
calculation and disclosure of reserves for uncertain tax positions.

The Effect of Public Country-by-Country Reporting on Real Activities of EU Banks
128
banks reduced their tax haven presence after the introduction of CbCR compared to companies
from the insurance industry.
Brown (2018) and Overesch and Wolff (2019) examine the effect of public CbCR for EU
banks on the bank’s overall tax avoidance. However, they find mixed results. Overesch and
Wolff (2019) show that treated banks increased their GAAP effective tax rate after the
implementation of public CbCR, while Brown (2018) cannot provide evidence for a decrease
in tax avoidance of EU banks. Exploiting the same reform, Joshi et al. (2020) find a decrease
in the level of income shifted by the financial affiliates of European banks but no robust
evidence on the increase in European banks’ overall tax burden after the reform. The mixed
findings result from differences in the sample selection, control group identification and data.
4.3.2 Empirical predictions
The effect of CbCR disclosures on banks’ activities depends on the expected costs of
disclosure. One potential cost channel could be that banks face higher detection and
enforcement risks by tax authorities. The importance of this channel depends on the relevance
of the information content of CbCR disclosures to tax authorities. It is questionable whether
CbCR disclosure offers an additional benefit to tax authorities because it can be assumed that
tax authorities are informed about the common tax planning strategies of banks due to prior
tax audits (Evers et al., 2017). In addition, banks are already subject to tax disclosure
regulations, e.g. many countries require banks to prepare a transfer pricing documentation,
which informs tax authorities (Deloitte 2019). Further, taxpayers are obliged to provide tax
auditors with additional information upon request during their tax audits (OECD, 2006, p. 14,
note 45). Moreover, CbCR disclosures do not appear to be helpful to tax authorities when they
assess transfer pricing risks because CbCR does not reflect international transfer pricing rules,
but a geographic overview of economic activities (Hanlon, 2018). In addition, it does not seem
to be very reasonable to relate tax payments with profits per country and year because these
items are probably affected by prior periods, e.g. loss carry-forwards and, in general,
differences between financial accounting and the determination of taxable income (Evers et
al., 2017; Hanlon, 2018).
Apart from that, CbCR could provide tax authorities with additional useful information.
Before the CbCR regulation became effective, most countries required local entities to prepare
a transfer pricing documentation, which typically discloses only transactions of the local entity
with related parties. CbCR provides now additional country-level information about

The Effect of Public Country-by-Country Reporting on Real Activities of EU Banks
129
subsidiaries of a group, even if these subsidiaries do not have transactions with local entities.
Therefore, local tax authorities gain more insights into operations in foreign countries, in
particular in foreign tax haven countries (Dutt et al., 2019b; De Simone and Olbert, 2020).
The goal of the OECD (2015, p. 9) regarding CbCR is to provide tax authorities with useful
information to assess transfer pricing risks and other BEPS-related risks and thus potentially
enhance enforcement effectiveness. A survey among tax managers and executives reveals that
85% of the respondents agree or strongly agree that tax authorities will increase tax audit
assessments globally (Deloitte, 2018).
Another potential cost channel could be reputational concerns. The main goal of CbCR for
banks is to increase transparency regarding the activities of institutions and thus regain the
trust of stakeholders and society (EU, 2013a, Recital 52). The disclosure of tax information
per country could facilitate the monitoring of banks’ activities that the public could perceive
as tax avoidance behaviour, which is not socially desirable (e.g., Roychowdhury et al., 2019).
For example, banks with a high engagement in tax haven countries, an unequal distribution of
tax payments across countries or a low share of tax payments relative to economic factors such
as turnover and the number of employees across countries could face reputational concerns.
Under this channel, banks might change their tax avoidance behaviour to reduce potential
social costs such as loss of trust and damage to their image.
Surveys among tax managers and executives reveal that managers are concerned about the
continuing high interest of media, political and activist groups in corporate taxation (Deloitte,
2018). Further, they show that reputational concerns are important to managers and affect the
degree to which they engage in tax planning (Graham et al., 2014; Deloitte, 2018). For many
managers, tax planning in their organisations has become a corporate responsibility issue and
not just a compliance issue (Deloitte, 2018).
However, empirical literature in the field of reputational costs and tax planning is mixed. Some
studies show that investors do not seem to continuously react to potential reputation effects
resulting from the disclosure of (potential) tax avoidance strategies (e.g., Hanlon and Slemrod,
2009; Gallemore et al., 2014; Huesecken et al., 2018; Hoopes et al., 2018; Dutt et al., 2019a).
In contrast to these studies, there is ample evidence in the literature that managers and
investors react to reputational concerns by changing their tax planning behaviour, in particular
when they anticipate public scrutiny and stakeholder reactions (e.g., Hanlon and Slemrod,
2009; Graham et al., 2014; Dyreng et al., 2016; Austin and Wilson, 2017; Hoopes et al., 2018).
The Effect of Public Country-by-Country Reporting on Real Activities of EU Banks
130
Taken together, if CbCR disclosures raised costs for banks due to either an increase in
detection and enforcement risks or reputational concerns, I would expect that banks reduce
their tax avoidance activities and hence their overall tax avoidance. My first hypothesis states
as follows:
Hypothesis 1: EU multinational banks decrease their level of tax avoidance after the
implementation of public CbCR disclosure requirements in 2014.
A decrease in tax avoidance resulting from the disclosure of tax information can affect real
economic activities. Dyreng et al. (2020) provide a theoretical framework that includes tax
avoidance behaviour in the firm’s decision to maximise their after-tax profits.82 The authors
assume that, on the one hand, engaging in tax avoidance reduces the tax rate (τ – A). On the
other hand, tax avoidance causes potential costs (see above). Consequently, the optimum level
of tax avoidance requires that the marginal benefit from one additional percentage point of
taxes avoided equals the marginal cost of tax avoidance. Therefore, an increase in the cost of
tax avoidance negatively affects the optimal level of tax avoidance. As engaging in tax
avoidance reduces the tax rate (τ – A), the optimal level of tax avoidance impacts the optimal
levels of the input factors, e.g., capital and labour (Bruehne and Jacob, 2019). Thus, a decrease
in tax avoidance adversely affects real economic activities (capital and labour).
The recent empirical literature provides evidence that tax avoidance creates real effects (for
an overview, see Bruehne and Jacob, 2019). An increase in tax avoidance can increase
corporate investment decisions (e.g., De Vito et al., 2019), decrease the transparency of firms’
operations (e.g., Kim et al., 2011; Donohoe and Knechel, 2014; Chen et al., 2018a; Chung et
al., 2019) and increase the cost of debt (e.g., Hasan et al., 2014; Platikanova, 2017).
Although prior studies generally examine the behaviour of non-financial firms, the theoretical
prediction and empirical results can be transferred (at least in part) to the financial sector
because recent empirical studies provide evidence that banks are also engaged in tax avoidance
behaviour (e.g., Merz and Overesch, 2016; Langenmayr and Reiter, 2017).83 In addition,
empirical literature shows that banks’ loan supply and income from various business models
are negatively responsive to taxes (e.g., Huizinga et al., 2014; Han et al., 2015; Merz and
Overesch, 2016).
82 Appendix 4.A (Appendix) provides a detailed overview of the theoretical framework by Dyreng et al. (2020). 83 It should be noted that the business model of financial firms substantially differs from other firms. Therefore,
for example, a bank’s production function includes the additional input factor loanable funds (e.g., Clark, 1984;
Wang, 2003a; Wang, 2003b). Further, banks employ different tax avoidance strategies (e.g., Langenmayr and
Reiter, 2017).

The Effect of Public Country-by-Country Reporting on Real Activities of EU Banks
131
Given this theoretical prediction and prior empirical literature, I expect that the increase in the
cost of tax avoidance because of the disclosure of tax information decreases the tax avoidance
behaviour, resulting in a decline in real activities, e.g., investment decisions.
Hypothesis 2: EU multinational banks decrease their real activities after the implementation
of public CbCR disclosure requirements in 2014.
4.4 Research design and data
4.4.1 Estimation strategy
Although the CRD IV applies to all banks headquartered in the EU, I employ a difference-in-
differences (DiD) analysis to test my empirical predictions. My treatment group consists of
multinational banks headquartered in the EU because these banks can employ tax avoidance
activities with affiliates abroad and thus potentially react to CbCR. In line with the recent
literature, I choose domestic banks headquartered in the EU as my control group (e.g.,
Overesch and Wolff, 2019; Joshi et al., 2020). The advantage of this control group is that
purely domestic banks have neither an incentive nor the opportunity to employ cross-border
tax planning strategies (e.g., Demirgüç-Kunt and Huizinga, 2001). Therefore, it is reasonable
to assume that CbCR does not provide tax authorities and stakeholders with incremental
information, which could increase detection and enforcement risks as well as reputational costs
for domestic banks. Thus, I do not expect domestic banks to react to the CbCR disclosure
requirement.
Besides the fact that domestic banks do not have the opportunity to engage in cross-border tax
planning, EU domestic banks have several favourable characteristics mitigating potential
endogeneity issues. First, domestic and multinational banks in the EU face the same EU
financial market environment and regulatory requirements, in general. Second, EU domestic
and multinational banks are both subject to the liquidity and capital requirements under the
CRD IV. Using domestic banks as a control group should therefore mitigate the concern that
other provisions under the CRD IV, except the CbCR disclosure requirement, drive my results.
By applying the DiD approach, I compare both groups (first difference) before and after the
reform (second difference) regarding the overall tax avoidance and real economic activities. I
thus employ the following DiD model to test both hypotheses:
𝑂𝑢𝑡𝑐𝑜𝑚𝑒𝑖,𝑡 = 𝛽0 + 𝛽1𝑃𝑜𝑠𝑡𝑡 × 𝑇𝑟𝑒𝑎𝑡𝑚𝑒𝑛𝑡𝑖,𝑡 + 𝛽2𝐶𝑜𝑛𝑡𝑟𝑜𝑙𝑠𝑖,𝑡 + 𝛽3𝑌𝑒𝑎𝑟𝑡
+ 𝛽4𝐵𝑎𝑛𝑘𝑖 + 휀𝑖,𝑡
(1)

The Effect of Public Country-by-Country Reporting on Real Activities of EU Banks
132
In my first set of tests, I define the dependent variable Outcome as the GAAP effective tax
rate (ETR) of a bank i at the end of year t. The ETR is a widely used proxy for tax avoidance
in the prior literature (see for an overview, e.g., Hanlon and Heitzman, 2010; Blouin, 2014;
Wilde and Wilson, 2018). To test my second hypothesis, I define the dependent variable
Outcome as a measure for banks’ real activities such as earning assets, total assets and number
of employees (e.g., Gropp et al., 2019; De Simone and Olbert, 2020). My sample period
captures the years from 2011 to 2015.84 I use this relatively narrow sample window to reduce
the likelihood that other events unrelated to the change in disclosure requirements affect the
tax avoidance behaviour and economic activities of multinational banks in the EU.85 I exploit
the change in disclosure requirements, which is effective since July 2014 as an exogenous
event. Therefore, Post equals 1 for 2014-2015 and 0 for 2011-2013. The indicator variable
Treatment distinguishes between observations belonging to the treatment and control group,
respectively. In line with my predictions, I expect a positive (negative) and significant estimate
of my DiD coefficient (Post x Treatment) when I test hypothesis 1 (hypothesis 2).
I estimate Eq. (1) using OLS regression and heteroscedasticity-robust standard errors clustered
at the bank level (Petersen, 2009).86 Following Joshi et al. (2020) and Overesch and Wolff
(2019), I control for bank-level characteristics that could affect the bank’s effective tax rate
and capture the ability to invest in assets and employees. I include total equity (Size) because
size can be a proxy for tax planning and investment opportunities. ROA presents the return on
assets of a bank as a proxy for profitability and financial resources. Leverage controls for the
capital structure affecting the tax shield on interest and investment decisions.87
I also include several variables controlling for country-year-level characteristics of the
parent’s home country that might correlate with tax avoidance and investment activities. I add
the statutory tax rate (STR) to control for tax rate changes. Further, GDP growth and inflation
represent the market growth and price level, respectively. In Table 4.B2 (Appendix), I provide
a detailed variable description. Finally, to control for general time trends in tax avoidance and
economic activities and time-invariant unobservable differences in bank characteristics, I
include bank and year fixed effects.
84 I include data from 2010 to calculate growth rates of variables or lagged controls in 2011. 85 I restrict my sample to the period 2011-2015 for the following reasons. First, I want to avoid that the financial
crisis between 2007 and 2009 affects my data. Second, the OECD published the final reports of the 15 BEPS
actions in 2015. Since then, many countries have been revising their national tax regulations, which also affect
financial institutions. 86 In addition, I check whether the clustered-level of standard errors affects my results. Therefore, I cluster the
standard errors at the country level to capture that errors might correlate at that level (e.g., Fiechter et al., 2019).
Table 4.B1 (Appendix) shows that my inferences are robust to a different clustering of standard errors. 87 I lag bank-level controls to avoid an endogeneity bias (e.g., Dobbins and Jacob, 2016; Andries et al., 2017).

The Effect of Public Country-by-Country Reporting on Real Activities of EU Banks
133
My identification approach may raise the general concern that multinational and domestic
banks are not comparable because they have different business models and are different in size
and investment activities (e.g., Buch and Golder, 2001; Pasiouras and Kosmidou, 2007). I
mitigate this concern by employing a matching approach. By using entropy balancing
matching in Section 4.6.1, I ensure that treated and control banks are comparable in observable
bank-level characteristics. In addition, I check the parallel trend assumption of my DiD
analysis by providing yearly treatment effects in Section 4.6.2, thereby supporting the view
that EU domestic banks are appropriate peers to the treated EU multinational banks. Further,
I test placebo treatments in Section 4.6.3 to mitigate the concern that other provisions of the
CRD IV, e.g., additional liquidity and capital requirements, drive my results.
4.4.2 Data and sample overview
I use the Bankscope database provided by Bureau van Dijk to obtain financial and ownership
data for banks. Table 4.B3 (Appendix) outlines my sample selection process. I select all active
financial institutions that are the ultimate parent of their respective group because I am
interested in the overall the tax avoidance of the group (e.g., Overesch and Wolff, 2019; Joschi
et al., 2020). In line with Joschi et al. (2020), I include all active financial institutions with
banking activities because it is broadly accepted that these institutions are subject to the
disclosure requirements (Art. 4 CRD IV; PwC, 2016).
Further, I exclude all banks headquartered outside the EU as the Directive does not apply or
only partly applies to banks outside the EU.88 In addition, I drop all banks without at least one
majority-owned affiliate from the financial sector and without consolidated accounting data89.
Following Merz and Overesch (2016) and Joshi et al. (2020), I exclude micro-financing
institutions and specialised governmental institutions to mitigate the concern that their profit
shifting behaviour may differ from other banks. To avoid that potential measurement errors
could drive my results, I drop all observations with a GAAP effective tax rate below zero and
above one. In addition, I require bank-year observations to contain information on my
dependent variables (total assets, earnings assets, GAAP effective tax rate and the number of
employees). The final sample comprises 1,107 bank-year observations for the years 2011 to
2015.
88 CbCR under CRD IV applies even to banks headquartered outside the EU if they have at least one affiliate in
the EU. Then, banks have to prepare a CbC report for the EU financial affiliates. 89 I cannot conduct analyses based on unconsolidated data due to a lack of sufficient data on the subsidiary level.

The Effect of Public Country-by-Country Reporting on Real Activities of EU Banks
134
Table 4.1: Sample description
Panel A: Sample distribution
Number of banks Number of observations
EU banks 263 1,107
with at least one foreign financial
institution affiliate (≙ EU multina-
tional banks)
122 510
without foreign financial institution
affiliates (≙ EU domestic banks)
141 597
Panel B: Sample distribution by country
Number of observations Percent
AT Austria 52 4.70
BE Belgium 14 1.26
BG Bulgaria 7 0.63
CY Cyprus 5 0.45
CZ Czech Republic 2 0.18
DE Germany 89 8.04
DK Denmark 65 5.87
ES Spain 79 7.14
FI Finland 31 2.80
FR France 211 19.06
GB United Kingdom 242 21.86
GR Greece 23 2.08
HU Hungary 9 0.81
IE Ireland 4 0.36
IT Italy 137 12.38
LT Lithuania 5 0.45
LU Luxembourg 19 1.72
LV Latvia 14 1.26
MT Malta 5 0.45
PL Poland 11 0.99
PT Portugal 28 2.53
RO Romania 4 0.36
SE Sweden 46 4.16
SI Slovenia 5 0.45
Total 1,107 100
Panel C: Sample distribution by specialisation
Number of observations Percent
Commercial banks 309 27.91
Cooperative banks 274 24.75
Finance companies 68 6.14
Investment & Trust corporations 51 4.61
Investment banks & Financial services 158 14.27
Other credit institutions & Financial services 28 2.53
Real Estate & Mortgage banks 117 10.57
Savings banks 73 6.59
Securities firms 29 2.62
Total 1,107 100
Notes: This table provides details on the sample distribution (Panel A), which is divided into the sample
distribution per country (Panel B) and the sample distribution per specialisation (Panel C).

The Effect of Public Country-by-Country Reporting on Real Activities of EU Banks
135
Panel A of Table 4.1 reports that out of 263 EU banks, 122 banks have at least one majority-
owned foreign affiliate belonging to the banking sector (treatment group) and 141 banks only
have majority-owned domestic affiliates from the banking sector (control group). I require that
domestic banks in my control group have at least one affiliate to mitigate the concern that
investment activities differ between stand-alone banks and groups. Panel B reveals the sample
distribution by country. In general, observations are evenly distributed across countries, except
for the United Kingdom and France.90 Panel C reports the sample distribution by
specialisation. Commercial and cooperative banks present the majority of observations.91
Table 4.2: Summary statistics
Sample period: 2011-2015
N Mean P50 StDev
EU multinational banks
ETR 510 0.26 0.23 0.17
Earning Assets 510 16.35 16.29 2.60
Total Assets 510 16.63 16.52 2.36
Employees 510 7.96 7.71 2.06
Size 503 14.19 14.07 2.01
Leverage 503 0.86 0.92 0.16
ROA 503 0.01 0.01 0.03
STR 503 0.27 0.26 0.06
Inflation 503 1.52 1.50 1.36
GDP Growth 503 0.95 1.10 2.41
EU domestic banks
ETR 597 0.29 0.29 0.14
Earning Assets 597 15.14 15.48 2.05
Total Assets 597 15.29 15.52 1.82
Employees 597 6.60 6.78 1.57
Size 579 12.91 12.92 1.67
Leverage 579 0.87 0.90 0.14
ROA 579 0.01 0.01 0.04
STR 579 0.29 0.30 0.06
Inflation 579 1.60 1.50 1.29
GDP Growth 579 1.17 1.20 1.58
Notes: This table provides summary statistics of the treatment (EU multinational banks) and control (EU
domestic banks) group for the sample period from 2011 to 2015. All variables are defined in Table 4.B2
(Appendix). In order to calculate the control variables in 2011, which are scaled by prior year’s total assets, I use
data from 2010.
90 To rule out that observations from the United Kingdom and France drive my results, I exclude the treated
observations from both countries and re-estimate my DiD regression (Eq. (1)) (see Table 4.B4 (Appendix)). The
results are consistent with my main findings, indicating that observations from France and the United Kingdom
do not drive my results. 91 Since cooperative banks can differ from commercial banks regarding the ownership structure and business
model, I check whether cooperative banks affect my results. Therefore, I exclude cooperative banks from my
initial sample and re-estimate my DiD regression (Eq. (1)) (see Table 4.B5 (Appendix)). The results are consistent
with my main findings, indicating that cooperative banks do not drive my results.

The Effect of Public Country-by-Country Reporting on Real Activities of EU Banks
136
Table 4.2 presents summary statistics for treatment and control group observations,
respectively. Table 4.B2 (Appendix) lists detailed variable definitions. The summary statistics
show that EU domestic banks have, on average, a higher ETR compared to EU multinational
banks, which is in line with the missing possibility for domestic banks to engage in cross-
border tax planning. Further, the summary statistics reveal that, compared to the observations
in my treatment group, the observations in my control group show only slightly lower
economic activities, measured in terms of total assets, earning assets and the number of
employees. These statistics mitigate the concern that domestic banks are not comparable with
multinational banks.92 In terms of the control variables, my control banks are, on average, very
similar to my treated banks.
4.5 Main results
4.5.1 Banks’ tax avoidance behaviour
In my first set of analyses, I replicate Joshi et al. (2020) and Overesch and Wolff (2019) by
addressing my first hypothesis whether EU multinational banks decrease their tax avoidance
behaviour in response to the CbCR disclosure requirement under the CRD IV. Table 4.3
reports OLS regression results from estimating my baseline model (Eq. (1)) with a tax
avoidance measure as the dependent variable. I estimate three different specifications in both
panels: (1) regression with fixed effects but without controls, (2) regression with fixed effects
and bank-level controls, and (3) fully specified regression with fixed effects, bank- and
country-level controls (as defined in Eq. (1)).
In Panel A, I use the GAAP effective tax rate (ETR)93 as the dependent variable. My findings
reveal three main insights. First, the estimated average treatment effect (Post x Treatment) is
positive and significant for each specification (p-value < 1%). Second, the different regression
specifications do not seem to affect the economic significance of the results. Both insights
indicate that the DiD coefficient estimate is robust after controlling for bank and bank’s home
country characteristics. Third, the magnitude of the DiD effect is economically significant.
Compared to EU domestic banks, EU multinational banks face an increase in the GAAP
effective tax rate of approximately 5% points. The results confirm my first hypothesis and are
92 In an additional test, I mitigate the concern that outliers bias my small sample. Therefore, I winsorise my four
dependent variables at the 1% and 99% level and re-estimate Eq. (1) (see Table 4.B6 (Appendix)). The results
are consistent with my main findings, indicating that outliers do not drive my results. 93 Due to data limitations in Bankscope, I cannot use the cash effective tax rate as the dependent variable.

The Effect of Public Country-by-Country Reporting on Real Activities of EU Banks
137
in line with Joshi et al. (2020), although I use a slightly different identification strategy and
set of control variables.
Table 4.3: Effect of CbCR on banks’ tax avoidance
Panel A: GAAP effective tax rate
(1) (2) (3)
Dependent variable: ETR ETR ETR
Post x Treatment 0.0522*** 0.0549*** 0.0509***
(0.0173) (0.0174) (0.0176)
Size 0.0117 0.0129
(0.0287) (0.0259)
Leverage -0.0146 -0.00556
(0.111) (0.108)
ROA -0.0392 -0.0374
(0.176) (0.172)
STR 0.813***
(0.280)
Inflation -0.0118
(0.00724)
GDP Growth 0.00557
(0.00342)
Firm controls None Included Included
Country controls None None Included
Year fixed effects Included Included Included
Bank fixed effects Included Included Included
Adj. R² 0.405 0.401 0.408
N 1,107 1,082 1,082
Panel B: Difference between STR and GAAP ETR
(1) (2) (3)
Dependent variable: STR_ETR STR_ETR STR_ETR
Post x Treatment -0.0517*** -0.0553*** -0.0509***
(0.0173) (0.0173) (0.0176)
Firm controls None Included Included
Country controls None None Included
Year fixed effects Included Included Included
Bank fixed effects Included Included Included
Adj. R² 0.339 0.334 0.337
N 1,107 1,082 1,082
Notes: The dependent variable is ETR (GAAP effective tax rate) in Panel A and STR_ETR (difference between
the statutory tax rate (STR) and ETR) in Panel B. The table reports three different specifications for each panel:
(1) regression with fixed effects but without control variables, (2) regression with fixed effects and bank-level
controls, and (3) fully specified regression with fixed effects, bank-level and country-level controls. The main
variable of interest in the multivariate models is the interaction term Post x Treatment, capturing the difference-
in-differences effect. The interaction term Post x Treatment equals 1 for treated bank observations in the post
treatment period 2014-2015 and 0 otherwise. All variables are defined in Table 4.B2 (Appendix). All regression
models have standard errors that are heteroscedasticity-robust and clustered at the bank level. Reported values:
coefficient (standard errors) and *** (**) (*) indicate significance levels at 1% (5%) (10%), two-tailed.
In Panel B, I use an alternative tax avoidance measure to test the robustness of my results.
Following Thomsen and Watrin (2018), I consider the difference between the statutory tax
rate of the bank’s home country and the bank’s GAAP effective tax rate (STR_ETR) as my

The Effect of Public Country-by-Country Reporting on Real Activities of EU Banks
138
second dependent variable. This measure has the feature that, to some extent, it captures the
effect that banks pay lower taxes if the government reduces the statutory tax rate. I expect that
a decrease in the difference between the STR and ETR indicates a reduction in the tax
avoidance behaviour. The findings in Panel B are in line with my prediction. The results show
across all three specifications that the difference between the STR and ETR decreases after
the introduction of the CbCR disclosure requirement, indicating that banks reduce their tax
avoidance behaviour. These findings are entirely in line with the results in Panel A.
Overall, my results suggest that EU multinational banks decrease their tax avoidance
behaviour after the CbCR disclosure mandate became effective.94 This result is statistically
and economically significant compared to EU domestic banks.
4.5.2 Banks’ economic activities
In my second set of analyses, I examine whether EU multinational banks reduce their
economic activities in response to the CbCR disclosure requirement because they face a
decrease in tax avoidance. I use the natural logarithm of banks’ total assets, earning assets and
number of employees as proxies for banks’ real economic activities (e.g., Gropp et al., 2019).
Table 4.4 reports OLS regression results from estimating my baseline model (Eq. (1)) for each
of the three dependent variables. I estimate two different specifications for each dependent
variable: (1) regression with fixed effects but without controls, and (2) fully specified
regression with fixed effects, bank- and country-level controls (as defined in Eq. (1)).
My findings offer two main insights. First, the estimated average treatment effect (Post x
Treatment) is negative and significant in each specification (p-value < 10%). Second, the
magnitude of the DiD effect is economically significant. Compared to EU domestic banks, EU
multinational banks face a decrease in total assets by approximately 5% (Column 2). This
decrease in total assets is caused by a decrease in earnings assets of roughly 6% (Column 4).
Since earning assets include all income-generating and income-contributing assets, such as
loans, securities, real estate properties and other tangible assets, the reduction in these assets
indicates that banks’ core economic activities decrease. Further, compared to EU domestic
banks, EU multinational banks reduce the number of employees by approximately 5.6% after
the CbCR disclosure requirement became effective.
94 However, it should be noted that my tax avoidance measures cannot directly determine the tax avoidance
behaviour of banks. Each of these measures has limitations and thus only presents a proxy for tax avoidance (e.g.,
Hanlon and Heitzman, 2010; Blouin, 2014; Thomsen and Watrin, 2018).

The Effect of Public Country-by-Country Reporting on Real Activities of EU Banks
139
Table 4.4: Effect of CbCR on banks’ real economic activities
(1) (2) (3) (4) (5) (6)
Dependent variable: Total assets Total assets Earning assets Earning assets Employees Employees
Post x Treatment -0.0928** -0.0540** -0.0919* -0.0632** -0.0735** -0.0564**
(0.0425) (0.0273) (0.0474) (0.0297) (0.0289) (0.0225)
Size 0.590*** 0.586*** 0.372***
(0.0940) (0.120) (0.0646)
Leverage -1.035 2.651 -0.513**
(0.664) (2.703) (0.198)
ROA 2.712*** 3.304*** 1.225***
(0.564) (0.845) (0.394)
STR -2.040*** -1.881*** -2.542***
(0.513) (0.595) (0.425)
Inflation -0.0148 0.00879 0.00136
(0.0125) (0.0172) (0.0100)
GDP Growth -0.000344 -0.000754 0.00201
(0.00529) (0.00610) (0.00438)
Controls None Included None Included None Included
Year fixed effects Included Included Included Included Included Included
Bank fixed effects Included Included Included Included Included Included
Adj. R² 0.989 0.995 0.985 0.991 0.993 0.996
N 1,107 1,082 1,107 1,082 1,107 1,082
Notes: The dependent variable is Total assets (natural logarithm of total assets) in Column 1 and 2, Earning assets (natural logarithm of earning assets) in Column 3 and 4, and
Employees (natural logarithm of the number of employees) in Column 5 and 6. The table reports two different specifications for the three dependent variables: (1), (3) and (5)
regression with fixed effects but without control variables, and (2), (4) and (6) fully specified regression with fixed effects, bank-level and country-level controls. The main variable
of interest in the multivariate models is the interaction term Post x Treatment, capturing the difference-in-differences effect. The interaction term Post x Treatment equals 1 for
treated bank observations in the post treatment period 2014-2015 and 0 otherwise. All variables are defined in Table 4.B2 (Appendix). All regression models have standard errors
that are heteroscedasticity-robust and clustered at the bank level. Reported values: coefficient (standard errors) and *** (**) (*) indicate significance levels at 1% (5%) (10%), two-
tailed.

The Effect of Public Country-by-Country Reporting on Real Activities of EU Banks
140
In further tests, I validate the robustness of my results. In the first set of additional tests, I re-
estimate Eq. (1) but use alternative dependent variables. First, I replace the number of
employees with the cost of employees. It is arguable that the cost of employees is a more
flexible measure and captures more variation over time compared to the number of employees
and should therefore reduce potential measurement errors. Second, my main analyses on the
effect of CbCR on banks’ real economic activities reveal that banks’ total assets decrease after
the CbCR disclosure requirement became effective (see Table 4.4). In addition, my findings
show that the decline in total assets is driven by a decrease in earning assets. Alternatively, the
reduction in banks’ total assets could result from a decrease in non-earning assets. To test this
alternative outcome variable, I use non-earning assets as a dependent variable and re-estimate
Eq. (1).
Panel A of Table 4.5 reports the results. Replacing the number of employees with the cost of
employees as the dependent variable does not seem to affect the DiD estimator (Column 1).
The average treatment effect is robust with respect to the statistical significance and economic
magnitude, confirming the results of my analyses on banks’ number of employees. Further,
Column 2 reveals that CbCR disclosure requirements do not affect non-earning assets of EU
multinational banks compared to EU domestic banks. This result rules out that the decrease in
total assets is driven by a factor other than the income-generating assets (earning assets) shown
in Table 4.4.
In my second set of robustness tests, I change the definition of my dependent variables that
serve as proxies for banks’ real economic activities. So far, I use the natural logarithm of total
assets, earnings assets and the number of employees as the dependent variables. This definition
of the dependent variables could cause a measurement error since I do not consider the
previous amount of the specific item when calculating the dependent variables. Therefore, I
replace the dependent variables with growth rates, i.e., the change in the natural logarithm of
the item scaled by the natural logarithm of the prior year’s item (e.g., Dobbins and Jacob,
2016; De Simone and Olbert, 2020).
Panel B of Table 4.5 reports the results for the alternatively defined dependent variables:
Earning assets growth (Column 1), Total assets growth (Column 2) and Employment growth
(Column 3). The coefficient estimate for earning assets growth and total assets growth is
negative and significant, but the growth rate of the number of employees is not significant.
These additional tests indicate that the findings are only partly consistent with the results of
my main analyses. However, due to data limitations, these tests should be considered with

The Effect of Public Country-by-Country Reporting on Real Activities of EU Banks
141
caution. My unbalanced sample limits the calculation of growth rates and thus restricts the
validity of the results.
Table 4.5: Alternative dependent variables
Panel A: Alternative dependent variable
(1) (2)
Dependent variable: Cost of Emp Non-earning assets
Post x Treatment -0.0589** -0.0746
(0.0230) (0.0567)
Controls Included Included
Year fixed effects Included Included
Bank fixed effects Included Included
Adj. R² 0.995 0.972
N 1,074 1,073
Panel B: Alternative definition of dependent variables
(1) (2) (3)
Dependent variable: Earning assets growth Total assets growth Employment growth
Post x Treatment -0.00137** -0.00110* 0.00120
(0.000659) (0.000645) (0.00101)
Controls Included Included Included
Year fixed effects Included Included Included
Bank fixed effects Included Included Included
Adj. R² 0.268 0.388 0.369
N 933 933 933
Notes: In Panel A, I use the following alternative dependent variables: Cost of Emp (natural logarithm of
personnel expenses) in Column 1 and Non-earning assets (natural logarithm of non-earning assets) in Column 2.
In Panel B, I apply the following alternative definitions of the dependent variables used in my baseline model:
Earning assets growth (change in the natural logarithm of bank’s earning assets scaled by the natural logarithm
of prior year’s earning assets) in Column 1, Total assets growth (change in the natural logarithm of bank’s total
assets scaled by the natural logarithm of prior year’s total assets) in Column 2 and Employment growth (change
in the natural logarithm of bank’s number of employees scaled by the natural logarithm of the prior year’s number
of employees) in Column 3. The table reports fully specified regressions with fixed effects, bank-level and
country-level controls. The main variable of interest in the multivariate models is the interaction term Post x
Treatment, capturing the difference-in-differences effect. The interaction term Post x Treatment equals 1 for
treated bank observations in the post treatment period 2014-2015 and 0 otherwise. All regression models have
standard errors that are heteroscedasticity-robust and clustered at the bank level. Reported values: coefficient
(standard errors) and *** (**) (*) indicate significance levels at 1% (5%) (10%), two-tailed.
Since my results show that earning assets are negatively affected by the disclosure
requirement, additional tests aim at getting more insights into the effect of CbCR on single
items within the earning assets. Therefore, I divided earning assets into Gross loans, Net loans,
Securities, Bank loans and Investments. I re-estimate Eq. (1) with these single items as the
dependent variable. Table 4.B7 (Appendix) reports the results of my DiD analysis with fixed
effects and without controls (Panel A) and with fixed effects and controls (Panel B). My
findings suggest that gross and net loans significantly decrease after the reform. However, this

The Effect of Public Country-by-Country Reporting on Real Activities of EU Banks
142
result does not hold when I include controls.95 The DiD estimators are negative but not
significant when using securities, bank loans or investments as the dependent variable.
Overall, the results confirm my second hypothesis by indicating that EU multinational banks
reduce their real economic activities after the CbCR disclosure reform. However, it should be
noted that the statistical significance and economic magnitude vary with different
specifications.
4.5.3 Cross-sectional variation in the average treatment effect
In Section 4.3.2, I state that the effect of CbCR on tax avoidance depends on two possible cost
channels: enforcement/detection risk and reputational concerns. In addition, I predict that a
decrease in tax avoidance adversely affects banks’ economic activities, indicating that real
effects only appear if the bank’s tax avoidance behaviour is affected. To test these relations, I
conduct cross-sectional tests designed to examine whether my treatment effects vary with
detection/enforcement risks and reputational concerns. I predict that treated banks exposed to
higher detection risks and reputational costs strongly decrease their tax avoidance behaviour,
resulting in a larger reduction in real activities.
I identify proxies to test whether both channels moderate the responsiveness of banks to the
disclosure requirement. To empirically assess the moderating effects, I use my baseline DiD
approach (Eq. (1)), but interact binary conditional variables with the DiD estimator Post x
Treatment. I estimate DiD models with fixed effects and controls for each of my four
dependent variables (effective tax rate, total assets, earning assets and the number of
employees) that capture tax avoidance and real economic activities of banks.
First, I examine whether higher enforcement and detection risks moderate the treatment
effects. I argue that, once tax information is disclosed per country in the CbC reports, banks
with affiliates in tax haven countries or with a high number of foreign affiliates could face
higher detection risks because tax authorities could perceive them as engaged in aggressive
tax avoidance activities. Under this channel, disclosing banks should change their tax planning
strategies to avoid additional tax audits. This potential decrease in tax avoidance could
negatively affect banks’ real economic activities. In addition, I predict that the quality of
government affects the behaviour of banks, because the quality of government includes the
95 In a cross-sectional test, I find that treated banks significantly reduce gross and net loans after the reform if
they have at least one affiliate in a tax haven. This effect is larger compared with treated banks without an affiliate
in a tax haven country (see Table 4.B8 (Appendix)). Cross-sectional tests regarding the presence in a tax haven
are explained in Section 4.5.3.

The Effect of Public Country-by-Country Reporting on Real Activities of EU Banks
143
government’s ability to formulate, implement and enforce regulations, which leads to a higher
detection and enforcement risk.
Table 4.6 reports the results for my first set of cross-sectional tests. In Panel A, I distinguish
between treated banks that have at least one subsidiary from the financial sector headquartered
in a tax haven (Tax haven) and treated banks without a subsidiary from the financial sector
domiciled in a tax haven country (No tax haven). Following De Simone and Olbert (2020), I
classify a country as a tax haven if it is listed in any of the tax haven lists used in Bennedsen
and Zeume (2018). In Panel B, I distinguish between treated banks with a number of foreign
affiliates in the top 20th percentile (High no. foreign subs) and below the top 20th percentile
(Low no. foreign subs).96 In Panel C, I distinguish between treated banks domiciled in a
country with a government quality index above the median (High quality) and below the
median (Low quality) in the pre-reform period. I obtain data on the government quality from
the worldwide governance indicators provided by the World Bank (e.g., Dharmapala and
Hines, 2009; Osswald and Sureth-Sloane, 2020). I calculate the government quality index for
each country as the mean of the three indicators: government effectiveness, regulatory quality
and rule of law in the pre-reform period.
The results in Table 4.6 reveal the following insights. Across all panels and specifications, the
effect of CbCR disclosures on the tax avoidance and real economic activities of banks is
significant for those with at least one affiliate in a tax haven country and a high number of
foreign affiliates. In addition, the response of banks is significant if they are headquartered in
a country with a high government quality. However, the difference in coefficient estimates is
only significant for total assets and earning assets if the bank has at least one affiliate in a tax
haven country (Panel A) and for the number of employees if the bank has a high number of
foreign affiliates (Panel B). Overall, these results provide indications that the cost channel
regarding enforcement and detection risk moderates the effect of CbCR on banks’ tax
avoidance and hence their real economic activities.
96 Due to the highly skewed distribution of the bank’s number of foreign affiliates, I choose the top 20th percentile
for the cross-sectional test.

The Effect of Public Country-by-Country Reporting on Real Activities of EU Banks
144
Table 4.6: Cross-sectional findings – detection risk
Panel A: Presence in tax haven countries
(1) (2) (3) (4)
Dependent variable: ETR Total assets Earning assets Employees
Post x Treatment x Tax haven 0.0567*** -0.0892** -0.111*** -0.0755***
(0.0187) (0.0384) (0.0394) (0.0263)
Post x Treatment x No tax haven 0.0439 -0.0112 -0.00529 -0.0333
(0.0295) (0.0293) (0.0342) (0.0315)
F-test for differences [p-value] [0.6998] [0.0734] [0.0226] [0.2425]
Controls Included Included Included Included
Year fixed effects Included Included Included Included
Bank fixed effects Included Included Included Included
Adj. R² 0.408 0.995 0.991 0.996
N 1,082 1,082 1,082 1,082
Panel B: Number of foreign subsidiaries
(1) (2) (3) (4)
Dependent variable: ETR Total assets Earning assets Employees
Post x Treatment x High no. foreign subs 0.0901*** -0.110* -0.145** -0.137***
(0.0319) (0.0662) (0.0614) (0.0469)
Post x Treatment x Low no. foreign subs 0.0408** -0.0394 -0.0422 -0.0358
(0.0195) (0.0275) (0.0311) (0.0230)
F-test for differences [p-value] [0.1669] [0.2983] [0.1108] [0.0373]
Controls Included Included Included Included
Year fixed effects Included Included Included Included
Bank fixed effects Included Included Included Included
Adj. R² 0.410 0.995 0.991 0.996
N 1,082 1,082 1,082 1,082
Panel C: Government quality
(1) (2) (3) (4)
Dependent variable: ETR Total assets Earning assets Employees
Post x Treatment x High quality 0.0697*** -0.0634* -0.0847** -0.0689**
(0.0253) (0.0341) (0.0375) (0.0298)
Post x Treatment x Low quality 0.0289 -0.0429 -0.0380 -0.0419
(0.0221) (0.0379) (0.0411) (0.0294)
F-test for differences [p-value] [0.2135] [0.6622] [0.3657] [0.4857]
Controls Included Included Included Included
Year fixed effects Included Included Included Included
Bank fixed effects Included Included Included Included
Adj. R² 0.410 0.995 0.991 0.996
N 1,082 1,082 1,082 1,082
Notes: In all panels, the dependent variable is ETR (GAAP effective tax rate) in Column 1, Total assets (natural
logarithm of total assets) in Column 2, Earning assets (natural logarithm of earning assets) in Column 3, and
Employees (natural logarithm of the number of employees) in Column 4. Regression models include an additional
interaction term based on the conditional variable to assess the cross-sectional variation in the baseline treatment
effect. The following conditional variables are used: Tax haven (No tax haven) equals 1 for treated banks with
at least one (without a) subsidiary from the financial sector headquartered in a tax haven (Panel A), High no.
foreign subs (Low no. of subs) equals 1 for treated banks with a number of foreign affiliates above (below) the
top 20th percentile (Panel B), High quality (Low quality) equals 1 for treated banks domiciled in a country with
a government quality index above (below) the median in the pre-reform period (Panel C). All regression models
have standard errors that are heteroscedasticity-robust and clustered at the bank level. Reported values:
coefficient (standard errors) and *** (**) (*) indicate significance levels at 1% (5%) (10%), two-tailed.

The Effect of Public Country-by-Country Reporting on Real Activities of EU Banks
145
Second, I examine whether reputational concerns moderate the treatment effects. The
disclosure of tax information per country could facilitate the monitoring of banks’ activities
that the public could perceive as tax avoidance behaviour, which is not socially desirable.
Therefore, banks exposed to reputational concerns should decrease their tax avoidance
behaviour to reduce potential social costs such as loss of trust and damage to corporate image.
However, a decrease in tax avoidance could reduce real economic activities of banks. I predict
that banks are more exposed to reputational concerns if they are headquartered in countries in
which non-governmental organisations (NGOs) are resident. For example, NGOs can affect
the behaviour of banks via “shaming campaigns” (e.g., Fiechter et al., 2019; Rauter, 2020).
Further, I expect a higher treatment effect for large banks as they often have higher media
attention (e.g., Rauter, 2020).97 Besides, banks listed on stock markets are more exposed to
the perception of investors and stakeholders and thus should have a stronger response to the
CbCR disclosures if they anticipate adverse stakeholder reactions (e.g., Hoopes et al., 2018).
Table 4.7 reports the results for my second set of cross-sectional tests. In Panel A, I distinguish
between treated banks headquartered in a country in which at least one NGO is resident (NGO)
and treated banks headquartered in a country without an NGO (No NGO). Following Fiechter
et al. (2019), I obtain the presence of NGOs from the UN.98 In Panel B, I distinguish between
treated banks with average total assets above the median (Large) and below the median (Small)
in the pre-reform period. In Panel C, I distinguish between listed and unlisted treated banks.
The results in Table 4.7 reveal the following insights. The effect of CbCR disclosures on the
tax avoidance and real economic activities of banks is significant for large banks and those
headquartered in a country in which at least one NGO is resident. However, the difference in
coefficient estimates is only significant for the number of employees if the bank is large.
Considering the effect of the listing on the treatment effect, I only find weak and partly mixed
results. While my results show a significantly larger effect on tax avoidance for listed banks
compared to unlisted banks, I find no strong indication that the decrease in tax avoidance
affects real activities. My findings indicate that banks react to reputational concerns by
decreasing their tax avoidance. However, this does not seem to predominantly affect their real
activities because, for example, listed firms have lower costs for access to external capital
needed to finance their real activities (e.g., Goyal et al., 2011). Overall, these results provide
97 I acknowledge that size can also be a channel for the detection risk as larger firms generally face a higher risk
for tax audits. 98 See, https://www.unenvironment.org/civil-society-engagement/accreditation/list-accredited-organizations
(Number of UN-accredited NGOs per country; last access: February 2020).

The Effect of Public Country-by-Country Reporting on Real Activities of EU Banks
146
some indications that the cost channel with respect to reputational concerns also moderates
the effect of CbCR on banks’ real economic activities.
Table 4.7: Cross-sectional findings – reputational risk
Panel A: Presence of NGOs in the country of the parent
(1) (2) (3) (4)
Dependent variable: ETR Total assets Earning assets Employees
Post x Treatment x NGO 0.0456** -0.0512* -0.0586* -0.0487**
(0.0194) (0.0307) (0.0339) (0.0245)
Post x Treatment x No NGO 0.0299 -0.0153 -0.0254 -0.0435
(0.0352) (0.0415) (0.0494) (0.0347)
F-test for differences [p-value] [0.7401] [0.5739] [0.6542] [0.9194]
Controls Included Included Included Included
Year fixed effects Included Included Included Included
Bank fixed effects Included Included Included Included
Adj. R² 0.409 0.995 0.991 0.996
N 1,082 1,082 1,082 1,082
Panel B: Bank size
(1) (2) (3) (4)
Dependent variable: ETR Total assets Earning assets Employees
Post x Treatment x Large 0.0601*** -0.0744** -0.0802** -0.107***
(0.0222) (0.0362) (0.0370) (0.0274)
Post x Treatment x Small 0.0423* -0.0349 -0.0472 -0.00903
(0.0250) (0.0360) (0.0404) (0.0285)
F-test for differences [p-value] [0.5750] [0.4048] [0.5082] [0.0049]
Controls Included Included Included Included
Year fixed effects Included Included Included Included
Bank fixed effects Included Included Included Included
Adj. R² 0.408 0.995 0.991 0.996
N 1,082 1,082 1,082 1,082
Panel C: Listing
(1) (2) (3) (4)
Dependent variable: ETR Total assets Earning assets Employees
Post x Treatment x Listed 0.0711*** -0.0577 -0.0731* -0.0573**
(0.0226) (0.0360) (0.0395) (0.0272)
Post x Treatment x Unlisted 0.0106 -0.0466 -0.0433 -0.0548*
(0.0238) (0.0303) (0.0322) (0.0319)
F-test for differences [p-value] [0.0568] [0.8001] [0.5329] [0.9488]
Controls Included Included Included Included
Year fixed effects Included Included Included Included
Bank fixed effects Included Included Included Included
Adj. R² 0.412 0.995 0.991 0.996
N 1,082 1,082 1,082 1,082
Notes: In all panels, the dependent variable is ETR (GAAP effective tax rate) in Column 1, Total assets (natural
logarithm of total assets) in Column 2, Earning assets (natural logarithm of earning assets) in Column 3, and
Employees (natural logarithm of the number of employees) in Column 4. Regression models include an additional
interaction term based on the conditional variable to assess the cross-sectional variation in the baseline treatment
effect. The following conditional variables are used: NGO (No NGO) equals 1 for treated banks headquartered
in a country with (without) an NGO (Panel A), Large (Small) equals 1 for treated banks with average total assets
above (below) the median in the pre-reform period (Panel B), Listed (Unlisted) equals 1 for treated banks, which
are (are not) listed on a stock exchange. All regression models have standard errors that are heteroscedasticity-
robust and clustered at the bank level. Reported values: coefficient (standard errors) and *** (**) (*) indicate
significance levels at 1% (5%) (10%), two-tailed.

The Effect of Public Country-by-Country Reporting on Real Activities of EU Banks
147
However, my cross-sectional results face several limitations. First, the Bureau van Dijk’s
Bankscope database has some drawbacks. Regarding ownership data, the data on subsidiaries,
in particular subsidiaries in tax havens, are not complete. In addition, ownership data and
information on listings are, in general, only available for the most recent update.99 Second,
most differences in coefficient estimates are not significant, indicating that my proxies for
both channels do not entirely drive the effect on banks’ tax avoidance and real economic
behaviour. Third, my proxy indicator variables might correlate with each other, obfuscating
the results of my cross-sectional tests. Therefore, my findings should be interpreted with
caution.
4.6 Additional analyses
4.6.1 Matching
As outlined in Section 4.4.1, my identification strategy may raise concerns about the
comparability of EU domestic banks with EU multinational banks in my DiD model because
both groups differ in size, their business model and investment activities (e.g., Buch and
Golder, 2001; Pasiouras and Kosmidou, 2007). Consequently, these differences could drive
unobserved differences in banks’ tax avoidance behaviour and real economic activities. To
mitigate this concern, I re-estimate my baseline regressions (Section 4.5.1 and 4.5.2) based on
an entropy-balanced sample to ensure that treated and control banks are comparable in
observable bank characteristics (e.g., Hainmueller and Xu, 2013; Fiechter et al., 2019; Joshi
et al., 2020).
The entropy balancing method constructs a weight for each control observation such that the
sample moments of observed covariates are identical between the treatment and weighted
control group (Imai and Ratkovic, 2014, p. 244). In contrast to other matching methods (e.g.
nearest neighbour matching) where units are either dropped or matched (weights of zero or
one), the reweighting scheme in entropy balancing is more flexible. It reweights units
appropriately to achieve balance, but at the same time keeps the weights as close as possible
to the initial weights in order to avoid loss of information and thus maintain efficiency for the
analysis (Hainmueller, 2012, p. 26). In this regard, entropy balancing provides a generalisation
of the propensity score weighting approach (Hainmüller, 2012, p. 26).
99 The last update of the data I use in this study is from December 2016. However, these drawbacks should bias
my results against finding effects.

The Effect of Public Country-by-Country Reporting on Real Activities of EU Banks
148
I match on all bank-level covariates (Size, ROA and Leverage) in the two years before the
reform and set the balancing constraint to the first moment (i.e., mean). The entropy balancing
method calculates weights that I use to re-estimate my baseline regression models (Section
4.5.1 and 4.5.2).
Table 4.8: Entropy balancing
(1) (2) (3) (4)
Dependent variable: ETR Total assets Earning assets Employees
Post x Treatment 0.0544*** -0.0564* -0.0791** -0.0476*
(0.0192) (0.0313) (0.0339) (0.0241)
Controls Included Included Included Included
Year fixed effects Included Included Included Included
Bank fixed effects Included Included Included Included
Adj. R² 0.504 0.996 0.994 0.997
N 883 883 883 883
Notes: This table provides the results of my baseline regressions based on a matched sample. I employ entropy
balancing matching. The dependent variable is ETR (GAAP effective tax rate) in Column 1, Total assets (natural
logarithm of total assets) in Column 2, Earning assets (natural logarithm of earning assets) in Column 3, and
Employees (natural logarithm of the number of employees) in Column 4. The table reports fully specified
regressions with fixed effects, bank-level and country-level controls. The main variable of interest in the
multivariate models is the interaction term Post x Treatment, capturing the difference-in-differences effect. The
interaction term Post x Treatment equals 1 for treated bank observations in the post treatment period 2014-2015
and 0 otherwise. All regression models have standard errors that are heteroscedasticity-robust and clustered at
the bank level. Reported values: coefficient (standard errors) and *** (**) (*) indicate significance levels at 1%
(5%) (10%), two-tailed.
Table 4.8 reports the results from re-estimating Eq. (1) using entropy balancing. I find
significant treatment effects with comparable economic magnitudes across all four
specifications (p-value < 10%). In general, the results are in line with my baseline findings
(Table 4.3 and 4.4). However, the statistical significance is slightly lower for the regressions
with total assets and the number of employees as the dependent variable (Column 2 and 4).
Overall, the results in Table 4.8 do not suggest that observable differences across treated and
control banks confound the baseline inferences.
4.6.2 Parallel trend assumption
The DiD estimation requires a parallel trend in the outcome variables for my treatment and
control group before the reform. To check the validity of the parallel trend assumption in my
setting, I plot the point-estimates based on a version of my baseline model (Eq. (1)) in which
I replace the DiD indicator (Post x Treatment) with a series of four separate DiD indicator
variables, each marking one year over the period between 2011 and 2015. I omit the indicator
for the year 2013 because this year serves as the benchmark. The purpose of this test is to
check whether the four dependent variables are trending and the difference in the trends
between the treated and control group is significant in the pre-reform period. Since the parallel

The Effect of Public Country-by-Country Reporting on Real Activities of EU Banks
149
-0.25
-0.2
-0.15
-0.1
-0.05
0
0.05
0.1
0.15
Estimated treatment effects (together with
95% confidence interval)
trend assumption requires that the dependent variables remain constant and parallel between
both groups, I expect the point-estimates in the pre-reform period to be insignificant.
Figure 4.1: Treatment effects over time
Notes: This figure plots the yearly treatment effects. The point-estimators are generated by estimating the
following regression model: Outcomeit = β0 + β12011t x Treatmenti + β22012t x Treatmenti + β32014t x Treatmenti
+ β42015t x Treatmenti + β5Controlsit + β7Banki + εit. Since I omit the DiD indicator for the year 2013, this year
serves as the benchmark year. The dependent variables represent the GAAP ETR (Figure 1a), total assets (Figure
1b), earning assets (Figure 1c) and the number of employees (Figure 1d). All variables are defined in Table 4.B2
(Appendix). The solid points indicate point-estimates and the lines represent 95% confidence intervals.
Figure 4.1 provides point-estimates and two-tailed 95% confidence intervals for my treated
versus control banks and each of the four dependent variables. The results presented in Figure
4.1 suggest that the placebo treatment effects in the pre-reform period (2011-2012) are slightly
insignificant, providing only weak support for the parallel trends in my sample. Further, at
around the time when CbCR was partially implemented, I observe significant effects for
banks’ effective tax rates and the number of employees, but not for total assets and earning
assets. On the other hand, in the year after the partial implementation of CbCR, Figure 4.1
reveals no significant effect for banks’ effective tax rates, which is in line with Joshi et al.
-0.15
-0.1
-0.05
0
0.05
0.1
0.15
Estimated treatment effects (together with
95% confidence interval)
-0.3
-0.2
-0.1
0
0.1
0.2
Estimated treatment effects (together with
95% confidence interval)
Figure 1a
GAAP effective tax rate
2011 2012 2013 2014 2015 2011 2012 2013 2014 2015
Figure 1b
Total assets
Figure 1c
Earning assets Figure 1d
Number of employees
2011 2012 2013 2014 2015 -0.15
-0.1
-0.05
0
0.05
0.1
0.15
Estimated treatment effects (together with
95% confidence interval)
2011 2012 2013 2014 2015

The Effect of Public Country-by-Country Reporting on Real Activities of EU Banks
150
(2020), and banks’ number of employees, while the effects on banks’ total assets and earning
assets are significant.
To further challenge the validity of my exogenous shock, I calculate yearly treatment effects
as described above, but use the year 2011 as the benchmark (e.g., Dyreng et al., 2016). Table
4.9 reports the results. The regression results indicate that the coefficients in the two years
leading up to the reform are not statistically significant (p-value > 10%) except for total assets.
I find weak evidence of higher total assets among EU multinational banks two years prior to
the reform (Column 2). However, the difference does not persist. In the two years following
the implementation of CbCR, the coefficients are significant (p-value < 10%) except for total
assets and earning assets in the year of the implementation. Overall, these results are in line
with Figure 4.1, indicating that the parallel trend assumption can be supported and the effects
can be attributed to the reform. However, I note that the magnitude of the coefficients before
the reform is high and their statistical significance is weak in the year following the reform.
Table 4.9: Yearly treatment effects
(1) (2) (3) (4)
Dependent variable: ETR Total assets Earning assets Employees
2012 x Treatment 0.0269 0.0505* 0.0496 0.0266
(0.0252) (0.0281) (0.0380) (0.0225)
2013 x Treatment 0.0402 -0.0418 -0.0380 -0.0412
(0.0244) (0.0290) (0.0397) (0.0268)
2014 x Treatment 0.101*** -0.0250 -0.00260 -0.0596**
(0.0253) (0.0315) (0.0424) (0.0291)
2015 x Treatment 0.0427* -0.0833* -0.127** -0.0649*
(0.0235) (0.0424) (0.0547) (0.0355)
Controls Included Included Included Included
Year fixed effects Included Included Included Included
Bank fixed effects Included Included Included Included
Adj. R² 0.047 0.514 0.375 0.370
N 1,082 1,082 1,082 1,082
Notes: The dependent variable is ETR (GAAP effective tax rate) in Column 1, Total assets (natural logarithm of
total assets) in Column 2, Earning assets (natural logarithm of earning assets) in Column 3, and Employees
(natural logarithm of the number of employees) in Column 4. The table reports yearly treatment effects. I estimate
the baseline model for the entire sample period from 2011-2015 by replacing the DiD indicator (Post x Treatment)
with a series of four separate DiD indicator variables, each marking one year over the period between 2012 and
2015. I omit the indicator for the year 2011 (2011 x Treatment) because this year serves as the benchmark. The
table reports fully specified regressions with fixed effects, bank-level and country-level controls. All regression
models have standard errors that are heteroscedasticity-robust and clustered at the bank level. Reported values:
coefficient (standard errors) and *** (**) (*) indicate significance levels at 1% (5%) (10%), two-tailed.
4.6.3 Treatment and reform variation
In this section, I vary the Post and Treatment definition to mitigate the concern that
misspecifications affect my results. In the first set of additional tests, I change the treatment
date to account for the fact that the CbCR disclosure requirement was passed in June 2013,

The Effect of Public Country-by-Country Reporting on Real Activities of EU Banks
151
partially became effective in 2014 and is fully effective since 2015 (e.g., Overesch and Wolff,
2019). To test whether the year 2013 affects my results, I drop this year in my sample and re-
estimate Eq. (1) with each of my four dependent variables. Panel A of Table 4.10 reports the
results. My findings are consistent with my baseline results (Table 4.3 and 4.4), although the
economic magnitude of the coefficient estimates is slightly larger.
Further, I test whether banks responded in 2015, as each banking group has since been obliged
to disclose all items required by the CbCR. Therefore, I re-define the Post variable by
assuming that the reform year is 2015 and re-estimate Eq. (1) with each of my four dependent
variables. Panel B of Table 4.10 reports the results. In line with my yearly treatment analyses
(Table 4.9), the effect of CbCR disclosures on the ETR is not significant in 2015, indicating
that the disclosure requirement does not have a persistent effect on the bank’s ETR. However,
banks significantly decrease their real economic activities in 2015, suggesting that the bank’s
response to the reform is related to timing effects in order to adjust their real activities.
Table 4.10: Treatment date variation
Panel A: Without the year 2013
(1) (2) (3) (4)
Dependent variable: ETR Total assets Earning assets Employees
Post x Treatment 0.0625*** -0.0840*** -0.0947*** -0.0760***
(0.0192) (0.0321) (0.0354) (0.0274)
Controls Included Included Included Included
Year fixed effects Included Included Included Included
Bank fixed effects Included Included Included Included
Adj. R² 0.423 0.994 0.990 0.995
N 855 855 855 855
Panel B: Treatment year in 2015
(1) (2) (3) (4)
Dependent variable: ETR Total assets Earning assets Employees
Post x Treatment -0.00264 -0.0775** -0.129*** -0.0438*
(0.0163) (0.0349) (0.0466) (0.0247)
Controls Included Included Included Included
Year fixed effects Included Included Included Included
Bank fixed effects Included Included Included Included
Adj. R² 0.400 0.995 0.991 0.996
N 1,082 1,082 1,082 1,082
Notes: In both panels, the dependent variable is ETR (GAAP effective tax rate) in Column 1, Total assets (natural
logarithm of total assets) in Column 2, Earning assets (natural logarithm of earning assets) in Column 3, and
Employees (natural logarithm of the number of employees) in Column 4. The table reports fully specified
regressions with fixed effects, bank-level and country-level controls. In Panel A, I exclude the year 2013 from
the sample. The main variable of interest in the multivariate models is the interaction term Post x Treatment,
capturing the difference-in-differences effect. In Panel A, the interaction term Post x Treatment equals 1 for
treated bank observations in the post treatment period 2014-2015 and 0 otherwise. In Panel B, the interaction
term Post x Treatment equals 1 for treated bank observations in the year 2015 and 0 otherwise. All regression
models have standard errors that are heteroscedasticity-robust and clustered at the bank level. Reported values:
coefficient (standard errors) and *** (**) (*) indicate significance levels at 1% (5%) (10%), two-tailed.

The Effect of Public Country-by-Country Reporting on Real Activities of EU Banks
152
Table 4.11: Placebo treatment
Panel A: Treatment based on liquidity
(1) (2) (3)
Dependent variable: Total assets Earning assets Employees
Post x Treatment_liquidity 0.0171 0.0410 0.0195
(0.0313) (0.0289) (0.0246)
Controls Included Included Included
Year fixed effects Included Included Included
Bank fixed effects Included Included Included
Adj. R² 0.995 0.991 0.996
N 1,082 1,082 1,082
Panel B: Treatment based on equity
(1) (2) (3)
Dependent variable: Total assets Earning assets Employees
Post x Treatment_equity -0.0188 -0.0168 -0.0278
(0.0373) (0.0387) (0.0297)
Controls Included Included Included
Year fixed effects Included Included Included
Bank fixed effects Included Included Included
Adj. R² 0.995 0.991 0.996
N 1,082 1,082 1,082
Panel C: Treatment based on profitability
(1) (2) (3)
Dependent variable: Total assets Earning assets Employees
Post x Treatment_profitability -0.0407 -0.0237 -0.00103
(0.0289) (0.0300) (0.0270)
Controls Included Included Included
Year fixed effects Included Included Included
Bank fixed effects Included Included Included
Adj. R² 0.995 0.991 0.996
N 1,082 1,082 1,082
Notes: In each panel, the dependent variable is Total assets (natural logarithm of total assets) in Column 1,
Earning assets (natural logarithm of earning assets) in Column 2, and Employees (natural logarithm of the number
of employees) in Column 3. The table reports fully specified regressions with fixed effects, bank-level and
country-level controls. The main variable of interest in the multivariate models is the interaction term Post x
Treatment, capturing the difference-in-differences effect. I define the following placebo treatments: (Panel A)
treatment equals 1 for banks with a cash to total assets ratio below the 25th percentile in the year before the
reform; (Panel B) treatment equals 1 for banks with an equity ratio below the 25th percentile in the year before
the reform; (Panel C) treatment equals 1 for banks with a return on assets below the 25th percentile in the year
before the reform. The interaction term Post x Treatment equals 1 for placebo treated bank observations in the
post treatment period 2014-2015 and 0 otherwise. All regression models have standard errors that are
heteroscedasticity-robust and clustered at the bank level. Reported values: coefficient (standard errors) and ***
(**) (*) indicate significance levels at 1% (5%) (10%), two-tailed.
In the second set of additional tests, I address the concern that other provisions of the CRD IV
confound and drive my results. The major provisions in the CRD IV package comprise new
standards regarding capital and liquidity requirements as well as corporate governance
practices (EU, 2013a). To mitigate the concern that the reduction in real activities results from
stricter regulatory requirements regarding capital and liquidity, I follow Overesch and Wolff
(2019) by defining placebo treatments with respect to liquidity, equity and profitability. The

The Effect of Public Country-by-Country Reporting on Real Activities of EU Banks
153
idea of placebo treatments is to test whether the effect of the CRD IV on banks’ real activities
depends on the bank’s liquidity, equity ratio and profitability rather than on the type of bank,
i.e., multinational or domestic. It could be expected that less liquid banks, banks with low
equity or less profitable banks predominantly respond to the CRD IV provisions. However, if
my findings result from the decrease in tax avoidance due to the CbCR disclosure and are not
driven by other provisions of the CRD IV, I expect insignificant DiD coefficients.
Table 4.11 reports the results of my DiD analyses with three placebo treatments. In Panel A,
treatment equals 1 for banks with liquidity below the 25th percentile in the year before the
reform (= less liquid banks). In Panel B, treatment equals 1 for banks with an equity ratio
below the 25th percentile in the year before the reform (= low equity banks). In Panel C,
treatment equals 1 for banks with profitability below the 25th percentile in the year before the
reform (= less profitable banks). Across all panels and all specifications, I do not find
significant placebo treatment effects. Overall, my results suggest that total assets, earning
assets and the number of employees are lower in multinational banks after the reform, but not
in less liquid or less profitable banks or banks with low equity. These findings support that my
main results (Section 4.5.2) are caused by the decrease in tax avoidance due to the CbCR
disclosure requirement.
4.7 Conclusion
In this paper, I investigate the response of EU multinational banks to mandatory public
disclosure of tax information. Using the EU CRD IV, which became effective in 2014 and
contained the CbCR disclosure requirement for all banks in the EU, as an exogenous shock
setting, allows me to examine whether disclosure of tax information affects banks’ tax
avoidance behaviour and real economic activities. I predict and find that EU multinational
banks reduce their tax avoidance behaviour and decrease their investments in earning assets
as well as their total assets and the number of employees compared to EU domestic banks after
the reform in 2014. Cross-sectional analyses reveal that detection risks and reputational
concerns moderate the decrease in tax avoidance, resulting in a reduction in real economic
activities.
My results are subject to limitations. First, my inferences rely on the parallel trend assumption.
Although I plot and estimate yearly treatment effects with different benchmark years, which
do not suggest a violation of the parallel trend assumption, it should be noted that the

The Effect of Public Country-by-Country Reporting on Real Activities of EU Banks
154
magnitude of the coefficients in the periods prior to the reform are high and the statistical
significance of the coefficients in the year following the reform is rather weak.
Second, I cannot entirely rule out that confounding events might affect my inferences. Since
the CRD IV package also comprises new regulations for capital and liquidity requirements, it
could be possible that these additional regulations bias my results (e.g., Gropp et al., 2019).
However, since all banks in the EU are affected by the provisions of the CRD IV, I mitigate
this concern by using EU domestic banks as my control group. I also apply placebo treatments,
but these are not significant, indicating that other provisions of the CRD IV package do not
drive my results.
Further, the treatment effect of EU multinational banks could also be affected by anticipation
effects due to the EU Directive on the disclosure of non-financial information100 (Directive
2014/95/EU), which was passed in 2014 (e.g., Fiechter et al., 2019). It could be expected that
an increase in CSR would be at the expense of other economic activities. However, since the
CSR Directive applies to large companies, including banks, in the EU with more than 500
employees, my sample comprises treated and control banks, which both are potentially
affected. Therefore, potential anticipation effects of the CSR Directive should not bias my
results, if multinational as well as domestic banks react in the same way to the non-financial
disclosure regulation. My tests with placebo treatments also indicate that anticipation effects
of the CSR Directive do not bias my results.
Fourth, another challenge is that real economic activities of EU banks could be driven by a
reduction in the demand for bank products (e.g., Gropp et al., 2019). In this case, I would
expect that not only multinational but also domestic banks face the demand reduction.
Therefore, this potential driver should affect both groups in the same way. In addition, my
fixed-effects structure, matching design and thorough sample selection should increase the
confidence that my identification strategy mitigates time trends and bank-specific confounding
effects in my setting. Fifth, as my inferences are based on consolidated data, future research
should shed more light on the response of banks’ affiliates to the CbCR disclosure
requirement.
Despite these limitations, my findings contribute to the literature on real effects of public
disclosures (e.g., Leuz and Wysocki, 2016; Christensen et al., 2017; Chen et al., 2018b;
Fiechter et al., 2019; Rauter, 2020). I reveal that banks respond to the disclosure of tax
100 This Directive is called “CSR Directive” (Corporate Social Responsibility).

The Effect of Public Country-by-Country Reporting on Real Activities of EU Banks
155
information by decreasing their real economic activities. In addition, my study adds to the
emerging literature on the consequences of public and private CbCR (e.g., Brown, 2018;
Brown et al., 2019; Dutt et al., 2019a; Hugger, 2019; Overesch and Wolff, 2019; Joshi, 2020;
De Simone and Olbert, 2020; Joshi et al., 2020; Flagmeier and Gawehn, 2020; Eberhartinger
et al., 2020). My paper is closely related to Joshi et al. (2020), Overesch and Wolff (2019) and
De Simone and Olbert (2020) but extends and complements the studies by examining real
effects of public CbCR disclosures on banks’ real economic activities. However, since the
setting faces many challenges, my results should serve as a first indication of the real economic
effects of public CbCR. Further research is needed to shed more light on the real effects of
public disclosure requirements.

The Effect of Public Country-by-Country Reporting on Real Activities of EU Banks
156
4.8 Appendix
Appendix 4.A: Theoretical framework
I follow the theoretical framework provided by Dyreng et al. (2020). This framework makes
it possible to understand the firm’s decision to engage in tax avoidance (Bruehne and Jacob,
2019). Using the following model, Dyreng et al. (2020) assume that a firm wants to maximise
after-tax profits:
П(𝐾, 𝐿, 𝐴) = [1 − (𝜏 − 𝐴)](𝜌𝐹(𝐾, 𝐿) − 𝑤𝐿 − 𝜂𝑟𝐾) − (1 − 𝜂)𝑟𝐾 − 𝐶(𝐴) (2)
The input factors comprise capital K, labour, L and tax avoidance A. All three factors cause
costs, i.e., cost of capital investment r and wage costs w. The parameter η expresses tax-
induced investment distortions, e.g., limited tax loss offset rules and non-deductible costs,
capturing the characteristic that the cost of financing and the economic depreciation are not
fully deductible for tax purposes. The statutory tax rate is represented by the parameter 𝜏.
Engaging in tax avoidance reduces the statutory tax rate by 𝐴 percentage points, resulting in
an effective tax rate of 𝜏 − 𝐴. However, tax avoidance is, on the other hand, costly. It can be
assumed that the costs of tax avoidance 𝐶(𝐴) increase with a firm’s engagement in tax
avoidance strategies (𝐶′(𝐴) > 0).101 Differentiating Eq. (2) with respect to tax avoidance 𝐴,
the optimal level of tax avoidance satisfies the following condition:
𝜌𝐹(𝐾∗, 𝐿∗) − 𝑤𝐿∗ − 𝜂𝑟𝐾∗ = 𝐶′(𝐴∗) (3)
Eq. (3) presents equilibrium values. The left-hand side reveals the tax base, indicating that a
higher tax base incentivises the engagement in tax avoidance. Hence, it depicts the marginal
benefits of tax avoidance. The right-hand side captures the marginal costs of tax avoidance.
Eq. (2) and (3) provide two main insights. First, the costs of tax avoidance affect the optimal
level of tax avoidance. Second, the optimal level of tax avoidance impacts the optimal level
of the input factors, such as capital and labour. Tax avoidance can therefore have real effects.
101 For simplification, the authors assume that the cost of tax avoidance is not deductible for tax purposes.

The Effect of Public Country-by-Country Reporting on Real Activities of EU Banks
157
Appendix 4.B: Additional tables
Table 4.B1: Alternative regression specifications – standard errors
(1) (2) (3) (4)
Dependent variable: ETR Total assets Earning assets Employees
Post x Treatment 0.0509*** -0.0540** -0.0632** -0.0564*
(0.0164) (0.0223) (0.0295) (0.0303)
Controls Included Included Included Included
Year fixed effects Included Included Included Included
Bank fixed effects Included Included Included Included
Clustered SE Country Country Country Country
Adj. R² 0.408 0.995 0.991 0.996
N 1,082 1,082 1,082 1,082
Notes: The dependent variable is ETR (GAAP effective tax rate) in Column 1, Total assets (natural logarithm of
total assets) in Column 2, Earning assets (natural logarithm of earning assets) in Column 3, and Employees
(natural logarithm of the number of employees) in Column 4. The table reports fully specified regressions with
fixed effects, bank-level and country-level controls. The main variable of interest in the multivariate models is
the interaction term Post x Treatment, capturing the difference-in-differences effect. The interaction term Post x
Treatment equals 1 for treated bank observations in the post treatment period 2014-2015 and 0 otherwise. All
regression models have standard errors that are heteroscedasticity-robust and clustered at the country level.
Reported values: coefficient (standard errors) and *** (**) (*) indicate significance levels at 1% (5%) (10%), two-
tailed.

The Effect of Public Country-by-Country Reporting on Real Activities of EU Banks
158
Table 4.B2: Variable definitions
Variable Description Source
Outcome variables
ETR Tax expenses scaled by pre-tax profit (GAAP effective tax
rate)
Bankscope
STR_ETR Difference between the home country’s statutory tax rate and
the GAAP effective tax rate
Earning Assets Natural logarithm of earning assets Bankscope
Total Assets Natural logarithm of total assets Bankscope
Employees Natural logarithm of the number of employees Bankscope
Cost of Emp Natural logarithm of personnel costs Bankscope
Non-earning assets Natural logarithm of non-earning assets Bankscope
Total assets growth Change in the natural logarithm of total assets scaled by the
natural logarithm of prior year’s total assets
Bankscope
Earning assets growth Change in the natural logarithm of earning assets scaled by the
natural logarithm of prior year’s earning assets
Bankscope
Employment growth Change in the natural logarithm of the number of employees
scaled by the natural logarithm of the prior year’s number of
employees
Bankscope
Bank characteristics
Post Dummy variable equal to 1 for 2014 and 2015 and 0 otherwise Constructed
Treatment Dummy variable equal to 1 for EU multinational banks and 0
for EU domestic banks
Constructed
Size Natural logarithm of prior year’s total equity Bankscope
Leverage Prior year’s total liabilities scaled by prior year’s total assets Bankscope
ROA Prior year’s pre-tax profit or loss scaled by prior year’s total
assets
Bankscope
Country characteristics
STR Top statutory corporate tax rate in the home country per year IBFD European Tax
Handbooks
Inflation Annual average rate of change in the harmonized index of
consumer prices
Eurostat
GDP Growth Annual growth rate of GDP Eurostat
Note: This table shows variable definitions.

The Effect of Public Country-by-Country Reporting on Real Activities of EU Banks
159
Table 4.B3: Sample selection
Number of banks
All active banks that are the ultimate parent in their group 4,046
Excluding:
(1) Banks headquartered outside the EU (3,013)
(2) Banks without at least one majority-owned affiliate from the
financial sector
(229)
(3) Banks without consolidated data (487)
(4) Micro-financing institutions and specialised governmental credit
institutions
(6)
(5) Observations with GAAP ETR below zero and above one (15)
(6) Observations with missing values for my dependent variables: total
assets, earning assets, GAAP effective tax rate and number of
employees
(33)
Final sample of banks 263
Total firm-year observations 1,107
Notes: This table provides details on the sample selection process. My primary data source is Bureau van Dijk’s
Bankscope database.

The Effect of Public Country-by-Country Reporting on Real Activities of EU Banks
160
Table 4.B4: Alternative regression specifications – without treated observations from FR and
UK
(1) (2) (3) (4)
Dependent variable: ETR Total assets Earning assets Employees
Post x Treatment 0.0515** -0.0589** -0.0601** -0.0569**
(0.0213) (0.0269) (0.0302) (0.0257)
Controls Included Included Included Included
Year fixed effects Included Included Included Included
Bank fixed effects Included Included Included Included
Adj. R² 0.405 0.995 0.992 0.995
N 961 961 961 961
Notes: The dependent variable is ETR (GAAP effective tax rate) in Column 1, Total assets (natural logarithm of
total assets) in Column 2, Earning assets (natural logarithm of earning assets) in Column 3, and Employees
(natural logarithm of the number of employees) in Column 4. I exclude treated observations from the countries
France and United Kingdom. The table reports fully specified regressions with fixed effects, bank-level and
country-level controls. The main variable of interest in the multivariate models is the interaction term Post x
Treatment, capturing the difference-in-differences effect. The interaction term Post x Treatment equals 1 for
treated bank observations in the post treatment period 2014-2015 and 0 otherwise. All regression models have
standard errors that are heteroscedasticity-robust and clustered at the bank level. Reported values: coefficient
(standard errors) and *** (**) (*) indicate significance levels at 1% (5%) (10%), two-tailed.

The Effect of Public Country-by-Country Reporting on Real Activities of EU Banks
161
Table 4.B5: Alternative regression specifications – without cooperative banks
(1) (2) (3) (4)
Dependent variable: ETR Total assets Earning assets Employees
Post x Treatment 0.0408** -0.0582* -0.0636* -0.0570**
(0.0180) (0.0318) (0.0334) (0.0276)
Controls Included Included Included Included
Year fixed effects Included Included Included Included
Bank fixed effects Included Included Included Included
Adj. R² 0.389 0.995 0.991 0.996
N 808 808 808 808
Notes: The dependent variable is ETR (GAAP effective tax rate) in Column 1, Total assets (natural logarithm of
total assets) in Column 2, Earning assets (natural logarithm of earning assets) in Column 3, and Employees
(natural logarithm of the number of employees) in Column 4. I exclude cooperative banks from the sample. The
table reports fully specified regressions with fixed effects, bank-level and country-level controls. The main
variable of interest in the multivariate models is the interaction term Post x Treatment, capturing the difference-
in-differences effect. The interaction term Post x Treatment equals 1 for treated bank observations in the post
treatment period 2014-2015 and 0 otherwise. All regression models have standard errors that are
heteroscedasticity-robust and clustered at the bank level. Reported values: coefficient (standard errors) and ***
(**) (*) indicate significance levels at 1% (5%) (10%), two-tailed.

The Effect of Public Country-by-Country Reporting on Real Activities of EU Banks
162
Table 4.B6: Alternative regression specifications – winsorising
(1) (2) (3) (4)
Dependent variable: ETR Total assets Earning assets Employees
Post x Treatment 0.0490*** -0.0515* -0.0536* -0.0554**
(0.0163) (0.0274) (0.0288) (0.0225)
Controls Included Included Included Included
Year fixed effects Included Included Included Included
Bank fixed effects Included Included Included Included
Adj. R² 0.423 0.995 0.994 0.996
N 1,082 1,082 1,082 1,082
Notes: The dependent variable is ETR (GAAP effective tax rate) in Column 1, Total assets (natural logarithm of
total assets) in Column 2, Earning assets (natural logarithm of earning assets) in Column 3, and Employees
(natural logarithm of the number of employees) in Column 4. In each Column, I winsorise the dependent variable
at the 1% and 99% level to reduce effects of outliers. The table reports fully specified regressions with fixed
effects, bank-level and country-level controls. The main variable of interest in the multivariate models is the
interaction term Post x Treatment, capturing the difference-in-differences effect. The interaction term Post x
Treatment equals 1 for treated bank observations in the post treatment period 2014-2015 and 0 otherwise. All
regression models have standard errors that are heteroscedasticity-robust and clustered at the bank level. Reported
values: coefficient (standard errors) and *** (**) (*) indicate significance levels at 1% (5%) (10%), two-tailed.

The Effect of Public Country-by-Country Reporting on Real Activities of EU Banks
163
Table 4.B7: Effect of CbCR on banks’ economic activities – detailed earning assets
Panel A: Without controls
(1) (2) (3) (4) (5)
Dependent variable: Gross loans Net loans Securities Bank loans Investments
Post x Treatment -0.0967* -0.112* -0.115 -0.105 -0.182
(0.0573) (0.0594) (0.0915) (0.0899) (0.171)
Controls None None None None None
Year fixed effects Included Included Included Included Included
Bank fixed effects Included Included Included Included Included
Adj. R² 0.979 0.988 0.957 0.946 0.937
N 1,040 1,040 1,084 995 595
Panel B: With controls
(1) (2) (3) (4) (5)
Dependent variable: Gross loans Net loans Securities Bank loans Investments
Post x Treatment -0.0517 -0.0614 -0.0837 -0.108 -0.167
(0.0451) (0.0462) (0.0856) (0.0949) (0.165)
Controls Included Included Included Included Included
Year fixed effects Included Included Included Included Included
Bank fixed effects Included Included Included Included Included
Adj. R² 0.988 0.987 0.963 0.946 0.939
N 1,015 1,015 1,062 976 586
Notes: In both panels, the dependent variable is Gross loans (natural logarithm of gross loans) in Column 1, Net
loans (natural logarithm of net loans) in Column 2, Securities (natural logarithm of securities) in Column 3, Bank
loans (natural logarithm of bank loans) in Column 4 and Investments (natural logarithm of plants and properties)
in Column 5. The table reports fully specified regressions with fixed effects, bank-level and country-level
controls. The main variable of interest in the multivariate models is the interaction term Post x Treatment,
capturing the difference-in-differences effect. The interaction term Post x Treatment equals 1 for treated bank
observations in the post treatment period 2014-2015 and 0 otherwise. All regression models have standard errors
that are heteroscedasticity-robust and clustered at the bank level. Reported values: coefficient (standard errors)
and *** (**) (*) indicate significance levels at 1% (5%) (10%), two-tailed.

The Effect of Public Country-by-Country Reporting on Real Activities of EU Banks
164
Table 4.B8: Cross-sectional findings on detailed earning assets – presence in tax haven
country
(1) (2) (3) (4) (5)
Dependent variable: Gross loans Net loans Securities Bank loans Investments
Post x Treatment x Tax haven -0.153*** -0.151*** -0.0845 -0.158 -0.233
(0.0541) (0.0552) (0.0937) (0.106) (0.192)
Post x Treatment x No tax haven 0.0615 0.0383 -0.0829 -0.0548 -0.0891
(0.0684) (0.0724) (0.102) (0.114) (0.229)
F-test for differences [p-value] [0.0119] [0.0363] [0.9864] [0.3534] [0.5820]
Controls Included Included Included Included Included
Year fixed effects Included Included Included Included Included
Bank fixed effects Included Included Included Included Included
Adj. R² 0.988 0.987 0.963 0.946 0.939
N 1,015 1,015 1,062 976 586
Notes: The dependent variable is Gross loans (natural logarithm of gross loans) in Column 1, Net loans (natural
logarithm of net loans) in Column 2, Securities (natural logarithm of securities) in Column 3, Bank loans (natural
logarithm of bank loans) in Column 4 and Investments (natural logarithm of plants and properties) in Column 5.
Regression models include an additional interaction term based on the conditional variable to assess the cross-
sectional variation in the baseline treatment effect. The following conditional variable is used: Tax haven (No
tax haven) equals 1 for treated banks with at least one (without a) subsidiary from the financial sector
headquartered in a tax haven. All regression models have standard errors that are heteroscedasticity-robust and
clustered at the bank level. Reported values: coefficient (standard errors) and *** (**) (*) indicate significance
levels at 1% (5%) (10%), two-tailed.

Conclusion
165
5. Conclusion
5.1 Summary of the results and contributions
The three empirical studies in this thesis contribute to the literature on the real effects of tax
reforms and thereby answer the call for research on real effects of taxation (e.g., Hanlon and
Heitzman, 2010; Dyreng and Maydew, 2018; Bruehne and Jacob, 2019). The three studies
inform policymakers about intended and unintended consequences resulting from changes in
taxation. In addition, they reveal heterogeneity in the reaction of companies to tax reforms.
Finally, this thesis provides insights into the impact of taxation on the behaviour of private
firms and financial institutions that have been rather neglected in the empirical tax research so
far (e.g., Hanlon and Heitzman, 2010).
The first study uses a dividend tax increase in Germany, which only affects corporate
shareholders owning a stake of less than 10% in the dividend-paying German corporation, to
examine the effect of this reform on payout decisions of private firms and portfolio decisions
of their corporate shareholders. The results show that firms do not alter their payouts after the
dividend tax reform. This finding suggests that minority shareholders without sufficient voting
power cannot influence the payout policy of a firm. However, corporate shareholders reduce
their minority stakes after the dividend tax increase in 2013. This result is not apparent because
shareholders of private firms face limitations, e.g., they cannot trade their shares on liquid
markets and can only sell their shares to the existing owners of the firm, in general. Prior
literature therefore identified rather stable ownership structures of private firms over time
(Jacob and Michaely, 2017; Berzins et al., 2018).
Cross-sectional tests reveal a larger reduction of minority stakes for corporate shareholders of
firms with a high dividend payout and a majority shareholder. The dividend tax responsiveness
is also larger for financially distressed corporate shareholders with minority stakes that do not
belong to the same group as the firm in which they own a minority stake. This study adds to
the literature on taxation and payout decisions of private firms. Further, the study is the first
to identify a reaction of private firms’ shareholders to a dividend tax increase. By examining
important traits at the firm, shareholder and firm-shareholder level, this study also sheds more
light on the heterogeneity in the dividend tax responsiveness of shareholders. Finally, since
this German dividend tax reform was passed to comply with EU law, the results inform
policymakers about the impact of the asymmetric taxation of dividends received by corporate
shareholders of private firms and thus reveal unintended consequences.

Conclusion
166
The second study investigates the impact of a change in tax depreciation rules on the
investment decision of companies from the finance lease sector. Since 2014, a German
administrative order has changed the applicable tax depreciation method from the previous
more beneficial straight-line tax depreciation over the lease term to the less beneficial straight-
line tax depreciation over the longer expected useful life of the leased asset. The results show
that finance lease companies reduce their investments after the change to the less beneficial
tax depreciation method. Since finance lease companies are financial institutions, they are
subject to regulatory requirements regarding liquidity and risk management. This study
predicts and finds that the exposure to regulatory requirements affects the investment response
of finance lease firms.
Additional cross-sectionals tests reveal that the investment response of finance lease firms is
also affected by their product portfolios, in particular by their product focus on mobile assets.
This result is in line with the prediction that the investment response should be stronger for
leased assets for which the difference between the lease term and the expected useful life of
the leased asset is high. Further tests suggest that the results cannot be explained by a general
decrease in the demand for leasing products. This study adds to the literature on tax
depreciation and investment by providing novel evidence that finance lease firms, which are
financial institutions, react to a change in tax depreciation allowances. Further, the results
highlight that regulatory requirements affect the responsiveness of regulated firms to tax
reforms. Like Study 1, the second study exploits a tax reform that has no political or social
goal, but was an administrative order to comply with the administrative interpretation of the
tax law. Therefore, this study also informs policymakers about unintended consequences
resulting from the change in taxation.
Using the implementation of the CbCR disclosure requirement for all banks in the EU as an
exogenous shock, the third study investigates the effects of mandatory public disclosure of tax
information on banks. The study finds that EU multinational banks reduce their tax avoidance
behaviour after the CbCR disclosure requirement became effective in 2014. This result is in
line with the prediction that the disclosure of tax information increases the cost of tax
avoidance due to detection/enforcement risks and reputational concerns. Additional findings
suggest that EU multinational banks reduce their economic activities after the reform,
indicating that a decrease in tax avoidance creates real effects.
Cross-sectional tests reveal that detection/enforcement risks and reputational concerns
moderate the reduction in banks’ tax avoidance and their economic activities. These results

Conclusion
167
suggest that economic activities decrease because banks reduce their tax avoidance activities.
This study adds to the literature on the real effects of public disclosures by providing evidence
that the disclosure of tax information creates real activities. Further, the findings indicate that
these real effects are driven by a change in the tax avoidance behaviour of banks. Compared
to Study 1 and Study 2, the third study analyses a change in disclosure requirements of tax
information with the social objective of increasing transparency regarding taxes paid and thus
addressing the corporate responsibility of financial institutions towards stakeholders and
society (EU, 2013a, Recital 52). In general, the public perceives tax avoidance as socially
undesirable, as all taxable entities have the responsibility to pay their fair share of taxes (e.g.,
Roychowdhury et al., 2019). Since the third study shows that tax avoidance decreases after
the disclosure of tax information, the reform seems to achieve the social goal described above.
However, this study also reveals the unintended consequences of the reform. The decrease in
tax avoidance is at the expense of economic activities.
5.2 Main limitations
As outlined in the respective chapters, the findings of this thesis are subject to several
limitations. Since the inferences of this thesis result from a DiD approach, concerns arise if
the assumptions of this method are not fulfilled. To avoid endogeneity (e.g., omitted variables
or reverse causality), exploiting natural experiments requires a random assignment to the
treatment and control group (e.g., Gow et al., 2016). When considering the tax reforms
examined in this thesis, the advantage is that changes in taxation are imposed on firms and
thus are exogenously given. Nevertheless, in general, firms are not randomly assigned to the
treatment and control group because there are typically political, economic or legal reasons
for tax reforms, which may result in selection problems (e.g., Leuz and Wysocki, 2016).
To address this concern and mitigate issues due to endogeneity, researchers are focusing on
the assumption of parallel trends, the avoidance of confounding events and the adequacy of
the control group (e.g., Leuz and Wysocki, 2016). This thesis carefully mitigates concerns that
endogeneity and misspecifications in the research designs weaken the validity of the findings.
First, in each of the three studies, the parallel trend assumption is supported by plotting yearly
treatment effects and conducting placebo tests. Although the analyses do not suggest a
violation of the parallel trend assumption, the studies cannot completely rule out that
unobservable factors affect the inferences.

Conclusion
168
Second, each study applies a fixed effects structure and thorough sample selection to mitigate
time trends and firm-specific confounding effects (e.g., M&As in Study 1 and Study 2).
However, Study 3 cannot completely rule out that other regulations of the CRD IV package
(e.g., Gropp et al., 2019), anticipation effects due to the EU Directive on the disclosure of non-
financial information (Fiechter et al., 2019) or a decrease in the demand for loans impact the
results, although placebo treatments and the choice of the control group should mitigate these
concerns.
Third, the choice and the adequacy of the control group can be criticised for the following
reasons. The control group in the first study might be indirectly affected by the dividend tax
increase. However, this concern is addressed by using an alternative control group. In the
second study, the applied tax depreciation method of firms from the operating lease and
finance lease sector cannot be observed. Due to this shortcoming, the study cannot fully rule
out that the reform might also affect firms from the control group, although the characteristics
of the business model suggest that operating lease companies are not affected by the change
in tax depreciation allowances. Further limitations could arise because observations from the
treatment and control group are not comparable in observable characteristics. This concern is
addressed by employing matching approaches in each study.
Besides the limitations regarding the quasi-experimental research design, a drawback of this
thesis is the limited generalisability of the results. In particular, Study 1 and Study 2 examine
German tax reforms. Although internal validity is high, external validity is limited.
Nevertheless, the results of the first study should be generalisable for developed countries
since Germany has well-developed institutions and a tax system that is comparable to many
developed countries. The findings of the second study should be generalisable to European
countries as the regulatory requirements are comparable within Europe.
5.3 Future research
The findings and limitations of the thesis point to additional research opportunities. First,
researchers should be interested in generalisable results. Therefore, future research should
challenge the findings of Study 1 and Study 2 by exploiting similar reforms for different
periods and institutional settings. Recent literature applies this procedure by providing first
evidence based on a single tax change and then extending the results by examining several tax
changes in an international sample (e.g., Jacob et al., 2019; Jacob and Todtenhaupt, 2020).

Conclusion
169
Further, the focus of this thesis relies on the effect of taxation on corporate decisions. Future
research should also examine tax reforms affecting natural persons. It is important to examine
the behaviour of individuals because income taxes account for a large share of tax revenues.
Since individuals can be customers, employees, entrepreneurs and shareholders, there are
many tax reforms that can be exploited to shed more light on the behaviour of individuals. In
addition, it should be investigated whether tax reforms that affect employees also have an
impact on companies. For example, changes in the income tax rate or social security
contributions affect the personnel costs of a company and could therefore potentially influence
the investment decision of a company.
With respect to the third study, future research should employ comprehensive data at the level
of banks’ affiliates to examine where and how affiliates’ economic activities are affected by
the CbCR disclosure requirement. Further, additional research is necessary to examine why
the effect of CbCR on tax avoidance only appears in the short-term (e.g., Joshi et al., 2020).
Following De Simone and Olbert (2020), it is plausible to assume that banks shift their tax
avoidance activities to low-tax countries in Europe. In addition, it would also be worth to
examine how the disclosure of tax information affects peers and in particular competitors. It
could be assumed that firms learn about the tax practices of their peers via their disclosure of
tax information (e.g., Brown and Drake, 2014; Bird et al., 2018).
In addition, researchers should shed more light on the effects of public disclosure of tax and
tax-related information (e.g., Dyreng and Maydew, 2018). Therefore, new “exogenous
shocks” must be analysed. For example, the German transparency register, which discloses
the beneficial owner of a company, might be an interesting setting to examine the reaction of
companies and in particular of companies with a beneficial owner in a tax haven. The stream
of research on public disclosure of tax and tax-related information is becoming increasingly
important as different stakeholder groups and society demand that companies pay their fair
share of taxes. This increased focus on the tax avoidance behaviour of firms is also driven by
various initiatives of the OECD and the EU.
Further, more research is needed on the real effects of tax avoidance (Study 3). The theoretical
framework proposed by Dyreng et al. (2020) suggests that tax avoidance can affect labour and
capital if the profit function of a company includes the costs and benefits of tax avoidance.
Since prior literature in this field of research is scarce (e.g., De Vito et al., 2019), more
knowledge in this area is necessary as many firms are heavily involved in tax avoidance.

Conclusion
170
Finally, prior literature on the effect of taxation on private firms (Study 1) and financial
institutions (Study 2) is still limited. More research is required to understand how the particular
environment in which private firms and financial institutions operate affects their responses to
changes in taxation. For example, prior literature finds that private firms are, in general,
financially constrained because they are unlisted (e.g., Gao et al., 2013). Further, they might
have a closely held ownership structure (e.g., Michaely and Roberts, 2011) and managers who
are also owners of the firm (e.g., Denis and Denis, 1994). First evidence in the literature
indicates that these features influence the reaction of firms to changes in taxation (e.g., Chen
et al., 2010; Jacob and Michaely, 2017). With respect to financial institutions, it is still unclear
how regulatory requirements affect their responses to tax changes.
Overall, there are still many unanswered questions in the empirical tax research, in particular
regarding private firms, financial institutions and the real effects of disclosure requirements
and tax avoidance. Researchers should look for more exogenous shocks, i.e. tax reforms, and
exploit them with appropriate econometric tools to draw causal inferences.
“If the data were perfect, collected from
well-designed randomized experiments,
there would hardly be room for
a separate field of econometrics.”102
102 Griliches (1986, p. 1466).

References
171
6. References
Allen, F./Bernardo, A. E./Welch, I., A Theory of Dividends Based on Tax Clienteles, Journal
of Finance 2000, 55(6): 2499-2536
Altman, E. I., Financial Ratios, Discriminant Analysis and the Prediction of Corporate
Bankruptcy, Journal of Finance 1968, 23(4): 589-609
Altman, E. I., Predicting Financial Distress of Companies: Revisiting the Z-Score and ZETA
Models, Working Paper 2000, New York University
Amiram, D./Bauer, A. M./Frank, M. M., Tax Avoidance at Public Corporations Driven by
Shareholder Taxes: Evidence from Changes in Dividend Tax Policy, The Accounting
Review 2019, 94(5): 27-55
Andries, K./Gallemore, J./Jacob, M., The Effect of Corporate Taxation on Bank Transparency:
Evidence from Loan Loss Provisions, Journal of Accounting and Economics 2017, 63(2-
3): 307-328
Angrist, J. D./Pischke, J.-S., Mostly Harmless Econometrics, Princeton University Press 2009
Auerbach, A. J., Share Valuation and Corporate Equity Policy, Journal of Public Economics
1979, 11(3): 291-305
Auerbach, A. J., Taxation, Corporate Financial Policy and the Cost of Capital, Journal of
Economic Literature 1983, 21(3): 905-940
Auerbach, A. J., Taxation and Corporate Financial Policy, in: Auerbach, A. J./Feldstein, M.
(Eds.), Handbook of Public Economics 2002, Vol. 3, Amsterdam: 1109-1784
Austin, C. R./Wilson, R. J., An Examination of Reputational Costs and Tax Avoidance:
Evidence from Firms with Valuable Consumer Brands, Journal of the American Taxation
Association 2017, 39(1): 67-93
Balakrishnan, K./Blouin, J. L./Guay, W. R., Tax aggressiveness and corporate transparency,
The Accounting Review 2019, 94(1): 45-69
Barrios, S./Huizinga, H./Laeven, L./Nicodeme, G., International taxation and multinational
firm location decisions, Journal of Public Economics 2012, 96(11): 946-958
Basel Committee on Banking Supervision, Basel III: A global regulatory framework for more
resilient banks and banking systems, Bank for International Settlement, December 2010,
superseded by its revised version in June 2011

References
172
Bauman, M. P./Francis, R. N., Issues in Lessor Accounting: The Forgotten Half of Lease
Accounting, Accounting Horizon 2011, 25(2): 247-266
Becker, B./Jacob, M./Jacob, M., Payout taxes and the allocation of investment, Journal of
Financial Economics 2013, 107(1): 1-24
Bennedsen, M./Wolfenzon, D., The Balance of Power in Closely Held Corporations, Journal
of Financial Economics 2000, 58(1-2): 113-139
Bennedsen, M./Zeume, S., Corporate Tax Havens and Transparency, Review of Financial
Studies 2018, 31(4): 1221–1264
Berzins, J./Bøhren, Ø./Stacescu, B., Shareholder Conflicts and Dividends, Review of Finance
2018, 22(5): 1807-1840
Berzins, J./Bøhren, Ø./Stacescu, B., Dividends and Taxes: The Moderating Role of Agency
Conflicts, Journal of Corporate Finance 2019, 58: 583-604
Bethmann, I./Jacob, M./Müller, M. A., Tax Loss Carrybacks: Investment Stimulus versus
Misallocation, The Accounting Review 2018, 93(4): 101-125
Bird, A./Edwards, A./Ruchti, T. G., Taxes and peer effects, The Accounting Review 2018,
93(5): 97-117
Blouin, J., Defining and Measuring Tax Planning Aggressiveness, National Tax Journal 2014,
67(4): 875-900
Blouin, J. L./Raedy, J. S./Shackelford, D. A., Dividends, Share Repurchases, and Tax
Clienteles: Evidence from the 2003 Reductions in Shareholder Taxes, The Accounting
Review 2011, 86(3): 887-914
Bozanic, Z./Hoopes, J. L./Thornock, J. R./Williams, B. M., IRS Attention, Journal of
Accounting Research 2017, 55(1): 79-114
Bradford, D. F., The Incidence and Allocation Effects of a Tax on Corporate Distributions,
Journal of Public Economics 1981, 15(1): 1-22
Brav A./Graham, J. R./Harvey, C. R., The Effect of the May 2003 Dividend Tax Cut on
Corporate Dividend Policy: Empirical and Survey Evidence, National Tax Journal 2008,
61(3): 381-396
Brennan, M. J./Thakor, A. V., Shareholder Preferences and Dividend Policy, Journal of
Finance 1990, 45(4): 993-1018

References
173
Brown, J. L./Drake, K. D., Network ties among low-tax firms, The Accounting Review 2014,
89(2): 483-510
Brown, R. J., The Impact of Mandatory Country-by-Country Tax Disclosures on the Tax
Aggressiveness of European Union Banks, Working Paper 2018, London School of
Economics and Political Science
Brown, R. J./Jorgensen, B. N./Pope, P. F., The Interplay between Mandatory Country-by-
Country Reporting, Geographic Segment Reporting, and Tax Havens: Evidence from the
European Union, Journal of Accounting and Public Policy 2019, 38(2): 106-129
Bruehne, A./Jacob, M., Corporate Tax Avoidance and the Real Effects of Taxation: A Review,
SSRN Working Paper, November 2019
Buch, C. M./Golder, S. M., Foreign versus Domestic Banks in Germany and the US: A Tale
of Two Markets?, Journal of Multinational Financial Management 2001, 11(4-5): 341-
361
Buettner, T./Overesch, M./Schreiber, U./Wamser, G., The impact of thin-capitalization rules
on the capital structure of multinational firms, Journal of Public Economics 2012, 96(11-
12): 930-938
Buettner, T./Ruf, M., Tax incentives and the location of FDI: Evidence from a panel of
German multinationals, International Tax and Public Finance 2007, 14: 151-164
Buettner, T./Wamser, G., Internal Debt and Multinational Profit Shifting: Empirical Evidence
from Firm-Level Panel Data, National Tax Journal 2013, 66(1): 63-96
Carpenter, R. E./Petersen, B. C., Is the Growth of Small Firms Constrained by Internal
Finance?, Review of Economics and Statistics 2002, 84(2): 298-309
Chen, C.-W./Hepfer, B. F./Quinn, P. J./Wilson, R. J., The effect of tax-motivated income
shifting on information asymmetry, Review of Accounting Studies 2018a, 23(3): 958-
1004
Chen, S./Chen, X./Cheng, Q./Shevlin, T. J., Are family firms more tax aggressive than non-
family firms?, Journal of Financial Economics 2010, 95(1): 41-61
Chen, Y.-C./Hung, M./Wang, Y., The Effect of Mandatory CSR Disclosure on Firm
Profitability and Social Externalities: Evidence from China, Journal of Accounting and
Economics 2018b, 65(1): 169-190
Chetty, R./Saez, E., Dividend Taxes and Corporate Behavior: Evidence from the 2003
Dividend Tax Cut, Quarterly Journal of Economics 2005, 120(3): 791-833

References
174
Chetty, R./Saez, E., Dividend and Corporate Taxation in an Agency Model of the Firm,
American Economic Journal: Economic Policy 2010, 2(3): 1-31
Christensen, H. B./Floyd, E./Liu, L. Y./Maffett, M., The Real Effects of Mandated
Information on Social Responsibility in Financial Reports: Evidence from Mine-Safety
Records, Journal of Accounting and Economics 2017, 64(2-3): 284-304
Chung, S. G./Goh, B. W./Lee, J./Shevlin, T. J., Corporate tax aggressiveness and insider
trading, Contemporary Accounting Research 2019, 36(1): 230-258
Clark, J. A., Estimation of Economies of Scale in Banking Using a Generalized Functional
Form, Journal of Money, Credit and Banking 1984, 16(1): 53-68
Cohen, D./Cummins, J., A Retrospective Evaluation of the Effects of Temporary Partial
Expensing, Finance and Economics Discussion Series 2006, No. 2006-19
Cohen, D. S./Hansen, D.-P./Hassett, K. A., The Effects of Temporary Partial Expensing on
Investment Incentives in the United States, National Tax Journal 2002, 55(3): 457-466
Dauchy, E./Martinez, C., Corporate Tax Minimization and the Effectiveness of Investment
Tax Incentives, Proceedings of the 100th Annual Conference on Taxation 2008
De Cesari, A., Expropriation of Minority Shareholders and Payout Policy, British Accounting
Review 2012, 44(4): 207-220
De Long, J. B./Summers, L. H., Equipment Investment and Economic Growth, Quarterly
Journal of Economics 1991, 106(2): 445-502
De Simone, L./Olbert, M., Real Effects of Private Country-by-Country Disclosure, SSRN
Working Paper, June 2020
De Vito, A./Jacob, M./Müller, M. A., Avoiding Taxes to Fix the Tax Code, SSRN Working
Paper, November 2019
DeAngelo, H./DeAngelo, L./Skinner, D. J., Corporate Payout Policy, Foundations and Trends
in Finance 2008, 3(2-3): 95-287
Deloitte, OECD’s Base Erosion and Profit Shifting (BEPS) Initiative and the “Global Tax
Reset”, 2018 Full Results of Fifth Annual Multinational Survey
Deloitte, Financial Services Transfer Pricing, Sector Trends and Global Developments, July
2019

References
175
Demirgüç-Kunt, A./Huizinga, H., The Taxation of Domestic and Foreign Banking, Journal of
Public Economics 2001, 79(3): 429-453
Denis, D. J./Denis, D. K., Majority owner-managers and organizational efficiency, Journal of
Corporate Finance 1994, 1: 91-118
Desai, M. A./Dharmapala, D., Dividend Taxes and International Portfolio Choice, Review of
Economics and Statistics 2011, 93(1): 266-284
Desai, M. A./Foley, C. F./Hines, J. R., A multinational perspective on capital structure choice
and internal capital markets, Journal of Finance 2004, 59(6): 2451-2487
Desai, M. A./Goolsbee, A., Investment, Overhang, and Tax Policy, Brookings Papers on
Economic Activity 2004, 2: 285-355
Desai, M. A./Jin, L., Institutional Tax Clienteles and Payout Policy, Journal of Financial
Economics 2011, 100(1): 68-84
Dhaliwal, D. S./Erickson, M./Trezevant, R., A Test of the Theory of Tax Clienteles for
Dividend Policies, National Tax Journal 1999, 52(2): 179-194
Dhaliwal, D. S./Gleason, C./Mills, L., Last-chance earnings management: using the tax
expense to meet analysts’ forecasts, Contemporary Accounting Research 2004, 21(2):
431-459
Dharmapala, D., What Do We Know about Base Erosion and Profit Shifting? A Review of the
Empirical Literature, Fiscal Studies 2014, 35(4): 421-448
Dharmapala, D./Hines, J. R., Which countries become tax havens?, Journal of Public
Economics 2009, 93(9-10): 1058-1068
Dischinger, M./Riedel, N., Corporate Taxes and the Location of Intangible Assets within
Multinational Firms, Journal of Public Economics 2011, 95(7-8): 691-707
Dobbins, L./Jacob, M., Do Corporate Tax Cuts Increase Investments?, Accounting and
Business Research 2016, 46(7): 731-759
Donohoe, M. P./Knechel, R. W., Does corporate tax aggressiveness influence audit pricing?
Contemporary Accounting Research 2014, 31(1): 284-308
Dreßler, D./Overesch, M., Investment impact of tax loss treatment – empirical insights from a
panel of multinationals, International Tax and Public Finance 2013, 20: 513-543

References
176
Dutt, V. K./Ludwig, C. A./Nicolay, K./Vay, H./Voget, J., Increasing tax transparency: investor
reactions to the country‑by‑country reporting requirement for EU financial institutions,
International Tax and Public Finance 2019a, 26: 1259-1290
Dutt, V. K./Nicolay, K./Vay, H./Voget, J., Can European Banks’ Country-by-Country Reports
Reveal Profit Shifting? An Analysis of the Information Content of EU Banks’
Disclosures, ZEW Discussion Paper 2019b, No. 19-042
Dwenger, N., User Cost Elasticity of Capital Revisited, Economica 2014, 81(321): 161-186
Dyreng, S. D./Hoopes, J. L./Wilde, J. H., Public Pressure and Corporate Tax Behavior, Journal
of Accounting Research 2016, 54(1): 147-186
Dyreng, S. D./Jacob, M./Jiang, X./Müller, M. A., Tax Incidence and Tax Avoidance, SSRN
Working Paper, June 2020
Dyreng, S. D./Maydew, E. L., Virtual Issue on Tax Research, Journal of Accounting Research
2018, 56(2): 311
Easterbrook, F. H., Two Agency-Cost Explanations of Dividends, American Economic
Review 1984, 74(4): 650-659
Eberhardt, D./Linnemann, N./Thomsen, M., Die Einführung von § 8b Abs. 4 KStG – Eine
ökonomische Analyse potentieller Ausweichreaktionen, Schmalenbachs Zeitschrift für
betriebswirtschaftliche Forschung 2019, 71: 271-311
Eberhartinger, E./Speitmann, R./Sureth-Sloane, C., Real Effects of Public Country-by-
Country Reporting and the Firm Structure of European Banks, WU International Taxation
Research Paper Series 2020, No. 2020-01
Edgerton, J., Investment Incentives and Corporate Tax Asymmetries, Journal of Public
Economics 2010, 94(11-12): 936-952
Edgerton, J., Investment, Accounting, and the Salience of the Corporate Income Tax, NBER
Working Paper 2012, No. 18472
Eichfelder, S./Schneider, K., How Do Tax Incentives Affect Business Investment? Evidence
from German Bonus Depreciation, arqus Discussion Paper 2018, No. 231
Eisfeldt, A. L./Rampini, A. A., Leasing, Ability to Repossess, and Debt Capacity, Review of
Financial Studies 2009, 22(4): 1621-1657
Erickson, M. M./Maydew, E. L., Implicit Taxes in High Dividend Yield Stocks, The
Accounting Review 1998, 73(4): 435-458

References
177
EU, Council Directive 2011/96/EU on the common system of taxation applicable in the case
of parent companies and subsidiaries of different Member States, Official Journal of the
European Union, L 345/8, 12/29/2011
EU, Directive 2013/36/EU of the European Parliament and of the Council of 26 June 2013 on
access to the activity of credit institutions and the prudential supervision of credit
institutions and investment firms, Official Journal of the European Union, L 176/338,
06/27/2013a
EU, Regulation (EU) No 575/2013 of the European Parliament and of the Council of 26 June
2013 on prudential requirements for credit institutions and investment firms, Official
Journal of the European Union, L 176/1, 06/27/2013b
EU, Directive 2014/95/EU of the European Parliament and of the Council of 22 October 2014
amending Directive 2013/34/EU as regards disclosure of non-financial and diversity
information by certain large undertakings and groups, Official Journal of the European
Union, L 330/1, 11/15/2014
European Commission, Report from the Commission to the European Parliament and the
Council: General Assessment of Economic Consequences of Country-by-Country
Disclosure Requirements Set Out in Article 89 of Directive 2013/36/EU of the European
Parliament and of the Council of 26 June 2013, COM(2014) 676 final
Evers, M. T./Meier, I./Spengel, C., Country-by-Country Reporting: Tension between
Transparency and Tax Planning, ZEW Discussion Paper 2017, No. 17-008
Faccio, M./Lang, L. H. P./Young, L., Dividends and Expropriation, American Economic
Review 2001, 91(1): 54-78
Fazzari, S. R./Hubbard, G./Petersen, B., Financing Constraints and Corporate Investment,
Brooking Papers on Economic Activity 1988, 1: 141-195
Federal Association of German Leasing Companies, Annual Report 2011/2012, Berlin 2012
Federal Association of German Leasing Companies, Annual Report 2014, Berlin 2014
Fiechter, P./Hitz, J.-M./Lehmann, N., Real Effects in Anticipation of Mandatory Disclosures:
Evidence from the European Union’s CSR Directive, SSRN Working Paper, November
2019
Flagmeier, V./Gawehn, V., Do Investors Care about Tax Disclosure?, arqus Discussion Paper
2020, No. 254

References
178
Gallemore, J./Maydew, E. L./Thornock, J. R., The Reputational Costs of Tax Avoidance,
Contemporary Accounting Research 2014, 31(4): 1103-1133
Gao, H./Harford, J./Li, K., Determinants of Corporate Cash Policy: Insights from Private
Firms, Journal of Financial Economics 2013, 109(3): 623-639
Giroud, X./Rauh, J., State taxation and the reallocation of business activity: Evidence from
establishment-level data, Journal of Political Economy 2019, 127(3): 1262-1316
Gomes, A. R./Novaes, W., Sharing of Control as a Corporate Governance Mechanism, PIER
Working Paper 2005, No. 01-029
Gordon, R./Dietz, M., Dividends and Taxes, in: Auerbach, A. J./Shaviro, D. N. (Eds.),
Institutional Foundations of Public Finance: Economic and Legal Perspectives 2008,
Cambridge: 204-224
Gow, I. D./Larcker, D. F./Reiss, P. C., Causal Inference in Accounting Research, Journal of
Accounting Research 2016, 54(2): 477-523
Goyal, V. K./Nova, A./Zanetti, L., Capital Market Access and Financing of Private Firms,
International Review of Finance 2011, 11(2): 155-179
Graham, J. R., Taxes and Corporate Finance: A Review, Review of Financial Studies 2003,
16(4): 1075-1129
Graham, J. R./Hanlon, M./Shevlin, T./Shroff, N., Incentives for Tax Planning and Avoidance:
Evidence from the Field, The Accounting Review 2014, 89(3): 991-1023
Greenwald, B./Stiglitz, J. E./Weiss, A., Informational Imperfections in the Capital Market and
Macroeconomic Fluctuations, American Economic Review 1984, 74(2): 194-199
Griliches, Z., Economic Data Issues, in: Griliches, Z./Intriligator, M. D. (Eds.), Handbook of
Econometrics 1983, Vol. 3, Amsterdam: 1465-1514
Gropp, R./Mosk, T./Ongena, S./Wix, C., Banks Response to Higher Capital Requirements:
Evidence from a Quasi-Natural Experiment, Review of Financial Studies 2019, 32(1):
266-299
Grullon, G./Michaely, R., Dividends, Share Repurchases, and the Substitution Hypothesis,
Journal of Finance 2002, 57(4): 1649-1684
Hainmueller, J., Entropy Balancing for Causal Effects: A Multivariate Reweighting Method
to Produce Balanced Samples in Observational Studies, Political Analysis 2012, 20(1):
25-46

References
179
Hainmueller, J./Xu, Y., Ebalance: A Stata Package for Entropy Balancing, Journal of
Statistical Software 2013, 54(7): 1-18
Hall, R./Jorgenson, D., Tax Policy and Investment Behavior, American Economic Review
1967, 57(3): 391-414
Han, J./Park, K./Pennacchi, G., Corporate Taxes and Securitization, Journal of Finance 2015,
70(3): 1287-1321
Hanlon, M., The persistence and pricing of earnings, accruals, and cash flows when firms have
large book-tax differences, The Accounting Review 2005, 80(1): 137-166
Hanlon, M., Country-by-Country Reporting and the International Allocation of Taxing Rights,
Bulletin for International Taxation 2018, 72(4-5): 209-217
Hanlon, M./Heitzman, S., A Review of Tax Research, Journal of Accounting and Economics
2010, 50(2-3): 127-178
Hanlon, M./Hoopes, J. L., What do Firms do when Dividend Tax Rates Change? An
Examination of Alternative Payout Responses, Journal of Financial Economics 2014,
114(1): 105-124
Hanlon, M./Slemrod, J., What does Tax Aggressiveness Signal? Evidence from Stock Price
Reactions to News about Tax Shelter Involvement, Journal of Public Economics 2009,
93(1-2): 126-141
Hasan, I./Hoi, C.-K. S./Wu, Q./Zhang, H., Beauty is in the eye of the beholder: The effect of
corporate tax avoidance on the cost of bank loans, Journal of Financial Economics 2014,
113(1): 109-130
Hassett, K./Hubbard, G., Tax Policy and Business Investment, in: Auerbach, A./Feldstein, M.
(Eds.), Handbook of Public Economics 2002, Vol. 3, Amsterdam: 1294-1343
Hassett, K./Newmark, K., Taxation and Business Behavior: A Review of the Recent
Literature, in: Diamond, J./Zodrow, G. (Eds.), Fundamental Tax Reform: Issues, Choices
and Implications 2008, Cambridge: 191-214
Heckemeyer, J. H./de Mooij, R. A., Taxation and Corporate Debt: Are Banks any Different?,
National Tax Journal 2017, 70(1): 53-76
Hines, J. R., Investment Ramifications of Distortionary Tax Subsidies, NBER Working Paper
Series 1998, No. 6615

References
180
Hoopes, J. L./Robinson, L./Slemrod, J., Public Tax-Return Disclosure, Journal of Accounting
and Economics 2018, 66(1): 142-162
House, C. L./Shapiro, M. D., Temporary Investment Tax Incentives: Theory with Evidence
from Bonus Depreciation, American Economic Review 2008, 98(3): 737-768
Huesecken, B./Overesch, M./Tassius, A., Effects of Disclosing Tax Avoidance: Capital
Market Reaction to LuxLeaks, SSRN Working Paper, February 2018
Hugger, F., The Impact of Country-by-Country Reporting on Corporate Tax Avoidance, ifo
Working Paper 2019, No. 304
Huizinga, H./Laeven, L./Nicodeme, G., Capital structure and international debt shifting,
Journal of Financial Economics 2008, 88(1): 80-118
Huizinga, H./Voget, J./Wagner, W., International Taxation and Cross-Border Banking,
American Economic Journal: Economic Policy 2014, 6(2): 94-125
Hulse, D. S./Livingstone, J. R., Incentive Effects of Bonus Depreciation, Journal of
Accounting and Public Policy 2010, 29(6): 578-603
IBFD, European Tax Handbook 2013, Amsterdam
Imai, K./Ratkovic, M., Covariate Balancing Propensity Score, Journal of the Royal Statistical
Society 2014, 76(1): 243-263
Jacob, M./Michaely, R., Taxation and Dividend Policy: The Muting Effect of Agency Issues
and Shareholder Conflicts, Review of Financial Studies 2017, 30(9): 3176-3222
Jacob, M./Michaely, R./Müller, M. A., Consumption Taxes and Corporate Investment,
Review of Financial Studies 2019, 32(8): 3144-3182
Jacob, M./Todtenhaupt, M., Withholding Taxes, Compliance Cost, and Foreign Portfolio
Investment, SSRN Working Paper, June 2020
Jensen, M. C., Agency Costs of Free Cash Flow, Corporate Finance, and Takeovers, American
Economic Review 1986, 76(2): 323-329
Jensen, M. C./Meckling, W. H., Theory of the Firm: Managerial Behavior, Agency Costs and
Ownership Structure, Journal of Financial Economics 1976, 3(4): 305-360
Jorgenson, D., Capital Theory and Investment Behavior, American Economic Review 1963,
53(2): 247-259

References
181
Joshi, P., Does Private Country-by-Country Reporting Deter Tax Avoidance and Income
Shifting? Evidence from BEPS Action Item 13, Journal of Accounting Research 2020,
58(2): 333-381
Joshi, P./Outslay, E./Persson, A., Does Public Country-by-Country Reporting Deter Tax
Avoidance and Income Shifting? Evidence from the European Banking Industry,
Contemporary Accounting Research, forthcoming 2020
Keynes, J. M., General theory of employment, interest and money, London 1936
Kim, J.-B./Li, Y./Zhang, L., Corporate tax avoidance and stock price crash risk: Firm-level
analysis, Journal of Financial Economics 2011, 100(3): 639–662
Krull, L., Permanently reinvested foreign earnings, taxes, and earnings management, The
Accounting Review 2004, 79(3): 745-767
La Porta, R./Lopez-De-Silanes, F./Shleifer, A., Corporate Ownership around the World,
Journal of Finance 1999, 54(2): 471-517
La Porta, R./Lopez-De-Silanes, F./Shleifer, A./Vishny, R. W., Agency Problems and Dividend
Policies around the World, Journal of Finance 2000, 55(1): 1-33
La Porta, R./Lopez-De-Silanes, F./Shleifer, A./Vishny, R. W., Investor Protection and
Corporate Valuation, Journal of Finance 2002, 57(3): 1147-1170
Langenmayr, D./Reiter, F., Trading Offshore: Evidence on Banks’ Tax Avoidance, CESifo
Working Paper Series 2017, No. 6664-2017
Leuz, C./Wysocki, P. D., The Economics of Disclosure and Financial Reporting Regulation:
Evidence and Suggestions for Future Research, Journal of Accounting Research 2016,
54(2): 525–622
Lev, B./Nissim, D., Taxable income, future earnings, and equity values, The Accounting
Review 2004, 79(4): 1039-1074
Ljungqvist, A./Smolyansky, M., To cut or not to cut? On the impact of corporate taxes on
employment and income, SSRN Working Paper, October 2018
Maffini, G./Xing, J./Devereux, M. P., The Impact of Investment Incentives: Evidence from
UK Corporation Tax Returns, American Economic Journal: Economic Policy 2019,
11(3): 361-389
Merz, J./Overesch, M., Profit Shifting and Tax Response of Multinational Banks, Journal of
Banking and Finance 2016, 68: 57-68

References
182
Merz, J./Overesch, M./Wamser, G., The location of financial sector FDI: Tax and regulation
policy, Journal of Banking and Finance 2017, 78: 14-26
Michaely, R./Roberts, M. R., Corporate Dividend Policies: Lessons from Private Firms,
Review of Financial Studies 2011, 25(3): 711-746
Miller, M. H./Modigliani, F., The Cost of Capital, Corporation Finance and the Theory of
Investment, The American Economic Review 1958, 48(3): 261-297
Miller, M. H./Modigliani, F., Dividend Policy, Growth, and the Valuation of Shares, Journal
of Business 1961, 34(1): 411-433
Nagar, V./Petroni, K./Wolfenzon, D., Governance Problems in Closely Held Corporations,
Journal of Financial and Quantitative Analysis 2011, 46(4): 943-966
Neubig, T., Where’s the Applause? Why Most Corporations Prefer a Lower Rate, Tax Notes
2006, 111(4): 483-486
OECD, Strengthening Tax Audit Capabilities: General Principles and Approaches, prepared
by the Forum on Tax Administration’s Compliance Sub-group, 2006
OECD, Transfer Pricing Documentation and Country-by-Country Reporting, Action 13 - 2015
Final Report, OECD/G20 Base Erosion and Profit Shifting Project, OECD Publishing
2015
Oestreicher, A./Hillmann, L., Vertragslaufzeit und Abschreibung des Leasingvermögens beim
Leasinggeber – was sagen uns die Daten? (translation: Contract term and depreciation of
leased assets attributed to the lessor – what do empirical data tell us?), Working Paper
2016, https://www.uni-goettingen.de/de/document/download/8edc8a4d4c09d32f967700
e38564014d.pdf/WP%2016-001_Abschreibungen%20bei%20Leasinggesellschaften.pdf
Oestreicher, A./Koch, R., The Determinants of Opting for the German Group Taxation
Regime with regard to Taxes on Corporate Profits, Review of Managerial Science 2010,
4(2): 119-147
Oestreicher, A./Koch, R./Vorndamme, D./Hohls, S., ASSERT – Assessing the effects of
reforms in taxation – a micro-simulation approach, FACT Working 2014, No. 14-001
Ohrn, E., The Effect of Corporate Taxation on Investment and Financial Policy: Evidence
from the DPAD, American Economic Journal: Economic Policy 2018, 10(2): 272-301
Ohrn, E., The effect of tax incentives on U.S. manufacturing: Evidence from state accelerated
depreciation policies, Journal of Public Economics 2019, 180: 104084

References
183
Osswald, B./Sureth-Sloane, C., Do country risk factors attenuate the effect of taxes on
corporate risk-taking?, SSRN Working Paper, October 2020
Overesch, M./Wamser, G., Corporate tax planning and thin-capitalization rules: evidence from
a quasi-experiment, Applied Economics 2010, 42(5): 563-573
Overesch, M./Wolff, H., Financial Transparency to the Rescue: Effects of Country-by-
Country Reporting in the EU Banking Sector on Tax Avoidance, SSRN Working Paper,
February 2019
Pagano, M./Roell, A., The Choice of Stock Ownership Structure: Agency Costs, Monitoring,
and the Decision to Go Public, Quarterly Journal of Economics 1998, 113(1): 187-225
Pasiouras, F./Kosmidou, K., Factors Influencing the Profitability of Domestic and Foreign
Commercial Banks in the European Union, Research in International Business and
Finance 2007, 21(2): 222-237
Patel, E./Seegert, N./Smith, M., At a loss: The real and reporting elasticity of corporate taxable
income, SSRN Working Paper, June 2017
Pérez-González, F., Large Shareholders and Dividends: Evidence from U.S. Tax Reforms,
Working Paper 2002, Columbia University
Petersen, M. A., Estimating Standard Errors in Financial Panel Data Sets: Comparing
Approaches, Review of Financial Studies 2009, 22(1): 435-480
Platikanova, P., Debt maturity and tax avoidance, European Accounting Review 2017, 26(1):
97-124
Porcano, T. M., Government Tax Incentives and Fixed Asset Acquisitions: A Comparative
Study of Four Industrial Countries, Journal of the American Taxation Association 1987,
9(1): 7-23
Poterba, J. M., Taxation and Corporate Payout Policy, American Economic Review 2004,
94(2): 171-175
Poterba, J. M./Summers, L., The Economic Effects of Dividend Taxation, NBER Working
Paper 1984, No. 1353
PwC, Tax Transparency and Country by Country Reporting, BEPS and Beyond, June 2016
Rauter, T., The Effect of Mandatory Extraction Payment Disclosures on Corporate Payment
and Investment Policies Abroad, Journal of Accounting Research 2020, 58(5): 1075-1116

References
184
Rose, C. C./O’Neil, C. J., The Viewed Importance of Investment Tax Incentives by Virginia
Decision Makers, Journal of the American Taxation Association 1985, 7(1): 34-43
Roychowdhury, S./Shroff, N./Verdi, R. S., The Effects of Financial Reporting and Disclosure
on Corporate Investment: A Review, Journal of Accounting and Economics 2019, 68(2-
3): 101246
Rozeff, M. S., Growth, Beta and Agency Costs as Determinants of Dividend Payout Ratios,
Journal of Financial Research 1982, 5(3): 249-259
Rünger, S., The Effect of Cross-Border Group Taxation on Ownership Chains, European
Accounting Review 2019, 28(5): 929-946
Shipman, J. E./Swanquist, G. T./Whited, R. L., Propensity Score Matching in Accounting
Research, The Accounting Review 2017, 92(1): 213-244
Shleifer, A./Vishny, R. W., Large Shareholders and Corporate Control, Journal of Political
Economy 1986, 94(3): 461-488
Shleifer, A./Vishny, R. W., A Survey of Corporate Governance, Journal of Finance 1997,
52(2): 737-783
Summers, L., Taxation and Corporate Investment: A Q-Theory Approach, Brookings Papers
on Economic Activity 1981, 1: 67-140
Thomsen, M./Watrin, C., Tax avoidance over time: A comparison of European and U.S. firms,
Journal of International Accounting, Auditing and Taxation 2018, 33: 40-63
Tobin, J., A General Equilibrium Approach to Monetary Theory, Journal of Money, Credit,
and Banking 1969, 1(1): 15-29
Wang, J. C., Loanable Funds, Risk, and Bank Service Output, SSRN Working Paper,
September 2003a
Wang, J. C., Productivity and Economies of Scale in the Production of Bank Service Value
Added, SSRN Working Paper, July 2003b
Wielhouwer, J. L./Wiersma, E., Investment Decisions and Depreciation Choices under a
Discretionary Tax Depreciation Rule, European Accounting Review 2017, 26(3): 603-
627
Wilde, J. H./Wilson, R. J., Perspectives on Corporate Tax Planning: Observations from the
Past Decade, Journal of the American Taxation Association 2018, 40(2): 63-81

References
185
Yagan, D., Capital Tax Reform and the Real Economy: The Effects of the 2003 Dividend Tax
Cut, American Economic Review 2015, 105(12): 3531-3563
Zodrow, G. R., On the “Traditional” and “New” Views of Dividend Taxation, National Tax
Journal 1991, 44(4): 497-509
Zwick, E./Mahon, J., Tax Policy and Heterogeneous Investment Behavior, American
Economic Review 2017, 107(1): 217-248

Declaration of own contribution
186
7. Declaration of own contribution
Study 1: “Private Firm and Shareholder Response to Dividend Taxation: Evidence from the
Taxation of Corporate Minority Shareholders”
This study is single-authored.
Study 2: “Tax Depreciation and Investment Decisions: Evidence from the Leasing Sector”
This study was conducted in cooperation with Andreas Oestreicher (University of
Goettingen). I was continuously involved and took a substantial part in the
development of the concept of this study, the theoretical framework and the writing of
the text document. In particular, I was solely responsible for the data collection and the
execution of the empirical analyses.
Study 3: “The Effect of Public Country-by-Country Reporting on Real Activities of EU Banks”
This study is single-authored.
_____________________________________________
Lisa Hillmann

Declaration for admission to the doctoral examination
187
8. Declaration for admission to the doctoral examination
Ph.D. program in Economics
Declaration for admission to the doctoral examination
I confirm
1. that the dissertation “Essays on the Real Effects of Tax Reforms” that I submitted was
produced independently without assistance from external parties, and not contrary to
high scientific standards and integrity,
2. that I have adhered to the examination regulations, including upholding a high degree of
scientific integrity, which includes the strict and proper use of citations so that the
inclusion of other ideas in the dissertation are clearly distinguished,
3. that in the process of completing this doctoral thesis, no intermediaries were
compensated to assist me neither with the admissions or preparation processes, and in
this process,
- no remuneration or equivalent compensation were provided
- no services were engaged that may contradict the purpose of producing a doctoral
thesis
4. that I have not submitted this dissertation or parts of this dissertation elsewhere.
I am aware that false claims and the discovery of those false claims now, and in the future with
regards to the declaration for admission to the doctoral examination can lead to the invalidation
or revoking of the doctoral degree.
Goettingen, 23 November 2020
_______________________________________________
Lisa Hillmann