essays on climate change mitigation, building energy
TRANSCRIPT

ESSAYS ON CLIMATE CHANGE MITIGATION, BUILDING ENERGY EFFICIENCY, AND
URBAN FORM
Chaosu Li
A dissertation submitted to the faculty at the University of North Carolina at Chapel Hill in partial fulfillment of the requirements for the degree of Doctor of Philosophy in the Department of City and
Regional Planning in the College of Arts and Sciences.
Chapel Hill
2018
Approved by:
Yan Song
Nikhil Kaza
T. William Lester
Danielle Spurlock
Catherine Zimmer

ii
© 2018
Chaosu Li
ALL RIGHTS RESERVED

iii
ABSTRACT
Chaosu Li: Essays on climate change mitigation, building energy efficiency, and urban form
(Under the direction of Yan Song)
This dissertation includes three self-contained and interrelated papers on climate
change mitigation, building energy efficiency, and urban form.
Paper 1: Urban form and household electricity consumption: a multilevel study
While urban form affects building energy consumption, the pathways, direction
and magnitude of the effect are disputed in the literature. This paper uses a unique dataset
to examine the effect of urban form on residential electricity consumption in Ningbo,
China. Using survey and utility bill data of 534 households in 46 neighborhoods in the
city, I model the electricity use of households using a multi-level regression model. I find
that neighborhood street configuration and tree shade are important in controlling
residential electricity consumption and, consequently, greenhouse gas emissions. The
results suggest that seasonality and dwelling type condition the effect of neighborhood
densities on electricity consumption. Neighborhood density is associated with household
electricity consumption in summer months, while there is no such association in the
winter months. As neighborhood density increases, households in slab and tower
apartments in dense urban neighborhoods consume more electricity in summer months,
which can be partly explained by exacerbated heat island effect. Interestingly, the

iv
neighborhood density is negatively associated with electricity consumption for single-
family houses, suggesting that the effect of neighborhood density is different for different
types of dwelling units.
Paper 2: Explaining spatial variations in residential energy usage intensity in Chicago: the
role of urban form and geomorphometry
Understanding the spatial pattern of energy consumption within buildings is
essential to urban energy planning and management. In this study, I explore the spatial
complexity of residential energy usage intensity, with a focus on urban form and the
geomorphometry attributes of urban ventilation, solar insolation, and vegetation. I use
building energy use data in Chicago at a Census tract level and merge information from
various datasets including parcel attributes, three-dimensional data geometry, aerial
imagery, and Census. Using spatial regression models, I find that while vegetation has
more local impact on energy intensity, urban porosity and roughness length have
consistent spillover effects on building electricity usage intensity in Chicago.
Additionally, these relationships are seasonally varied: while vegetation, ventilation, and
insolation affect electricity usage in summer, they have no impact on the winter gas
consumption. The results highlight the importance of spatially explicit policies and clear
urban design and form frameworks for reducing urban energy consumption and
mitigating climate change.
Paper 3: Government response to climate change in China: a study of first-generation
provincial and municipal plans

v
In this paper, I provide an overview of the first-generation local and regional
climate change plans in China by scrutinizing planning documents of 16 cities, four
autonomous regions, and 22 provinces. I develop and apply an evaluation protocol to
understand goals, process, and strategies in these plans. The results indicate that
provincial and local plans include numerous policies and strategies, yet some important
types of local policies, such as land use and urban form, are not well identified in the
plans. The results also indicate that current climate change planning in China is
characterized by the “top-down” approach, in which the central governmental incentives
play a vital role in shaping provincial and municipal plans. In addition, most plans have
the following issues: vague definition of what characterizes a low carbon city/region,
deficiency in the quality of GHG inventory and reduction targets, inadequate stakeholder
engagement, and weak horizontal coordination. Finally, I offer recommendations to
improve climate change planning in China.

vi
ACKNOWLEDGEMENTS
This dissertation would not have been possible without the continuous and
unfaltering support of my advisor, Dr. Yan Song. The critiques and suggestions I
received from dissertation committee members, Dr. Nikhil Kaza, Dr. Catherine Zimmer,
Dr. Bill Lester, and Dr. Danielle Spurlock, have substantially improved my dissertation
and would benefit my future academic career. I am also indebted to my cohorts and
friends at UNC, who kindly offered me their support and encouragement throughout my
PhD journey.
A portion of this dissertation was supported by the World Bank through the
research project entitled Urban Scale Building Energy Efficiency and Renewable Energy
(ID: P130786). I would like to thank Hong Hu, Yihua Lu, and Chenming Wu from the
Ningbo Planning & Design Institute and Dr. Liyan Ren for their help with local data
collection.
Lastly, I would like to express my deepest gratitude to my parents. Without your
love, I could not have been able to go this far. You are the greatest treasure of my life.

vii
TABLE OF CONTENTS
LIST OF FIGURES ......................................................................................................... x
LIST OF TABLES .......................................................................................................... xi
LIST OF ABBREVIATIONS ........................................................................................ xii
CHAPTER 1: INTRODUCTION ....................................................................................... 1
1.1. Statement of the problem .................................................................................... 1
1.2. Research questions ............................................................................................. 3
1.2.1. Paper one ...................................................................................................... 4
1.2.2. Paper two ...................................................................................................... 4
1.2.3. Paper three .................................................................................................... 5
REFERENCES ................................................................................................................ 6
CHAPTER 2. URBAN FORM AND HOUSEHOLD ELECTRICITY
CONSUMPTION: A MULTILEVEL STUDY ................................................................... 8
2.1. Introduction ........................................................................................................ 8
2.2. Literature review and research questions ......................................................... 10
2.3. Methods ............................................................................................................ 13
2.3.1. Description of the survey ........................................................................... 13
2.3.2. Urban form measures ................................................................................. 18
2.3.3. Model specification .................................................................................... 20
2.3.4. Descriptive statistics ................................................................................... 23
2.4. Results .............................................................................................................. 26
2.5. Discussion ......................................................................................................... 31
2.6. Conclusions ...................................................................................................... 33
REFERENCES .............................................................................................................. 35
CHAPTER 3. EXPLAINING SPATIAL VARIATIONS IN
RESIDENTIAL ENERGY USAGE INTENSITY IN CHICAGO:
THE ROLE OF URBAN FORM AND GEOMORPHOMETRY .................................... 39
viii
3.1. Introduction ...................................................................................................... 39
3.2. Prior research .................................................................................................... 40
3.3. Data and methods ............................................................................................. 44
3.3.1. EUI data ...................................................................................................... 44
3.3.2. Urban form and geomorphometry measures .............................................. 45
3.3.3. Variable coding, descriptive statistics, and spatial patterns ........................ 47
3.3.4. Model specification .................................................................................... 54
3.4. Findings ............................................................................................................ 56
3.5. Discussion ......................................................................................................... 62
3.6. Conclusions ...................................................................................................... 65
REFERENCES .............................................................................................................. 66
CHAPTER 4. GOVERNMENT RESPONSE TO CLIMATE
CHANGE IN CHINA: A STUDY OF FIRST-GENERATION
PROVINCIAL AND MUNICIPAL PLANS ..................................................................... 69
4.1. Introduction ...................................................................................................... 69
4.2. A review of climate change planning and plan evaluation research ................. 72
4.3. Research approach ............................................................................................ 74
4.3.1. Site selection ............................................................................................... 74
4.3.2. Content analysis .......................................................................................... 75
4.4. Findings ............................................................................................................ 79
4.4.1. Plan content and process ............................................................................ 79
4.4.2. Policy and strategies ................................................................................... 82
4.5. Discussion: existing issues and challenges ....................................................... 90
4.6. Conclusions ...................................................................................................... 97
REFERENCES .............................................................................................................. 99
CHAPTER 5: CONCLUSION AND FUTURE RESEARCH ....................................... 103
5.1. Summary ......................................................................................................... 103
5.2. Policy Implications ......................................................................................... 105
5.3. Limitations and future research ...................................................................... 108
REFERENCES ............................................................................................................. 111
APPENDIX 1: HOUSEHOLD SURVEY INSTRUMENT .........................................112

ix
APPENDIX 2: GENERAL DESCRIPTION OF TYPICAL
PROVINCIAL PLANS REVIEWED ..........................................................................115
APPENDIX 3: GENERAL DESCRIPTION OF
MUNICIPAL PLANS REVIEWED ............................................................................117

x
LIST OF FIGURES
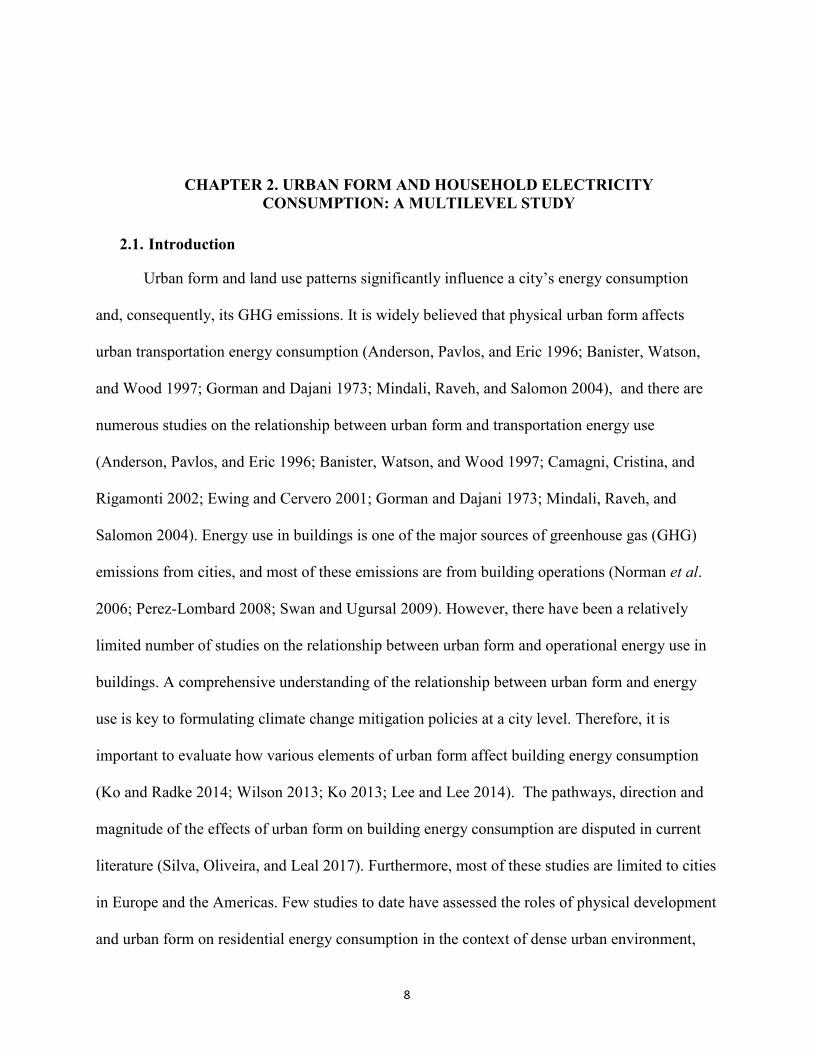
Fig. 1 Images of the six communities across Ningbo used in this study, accessed December 10, 2015. Photograph: Baidu Map. ................................................... 17
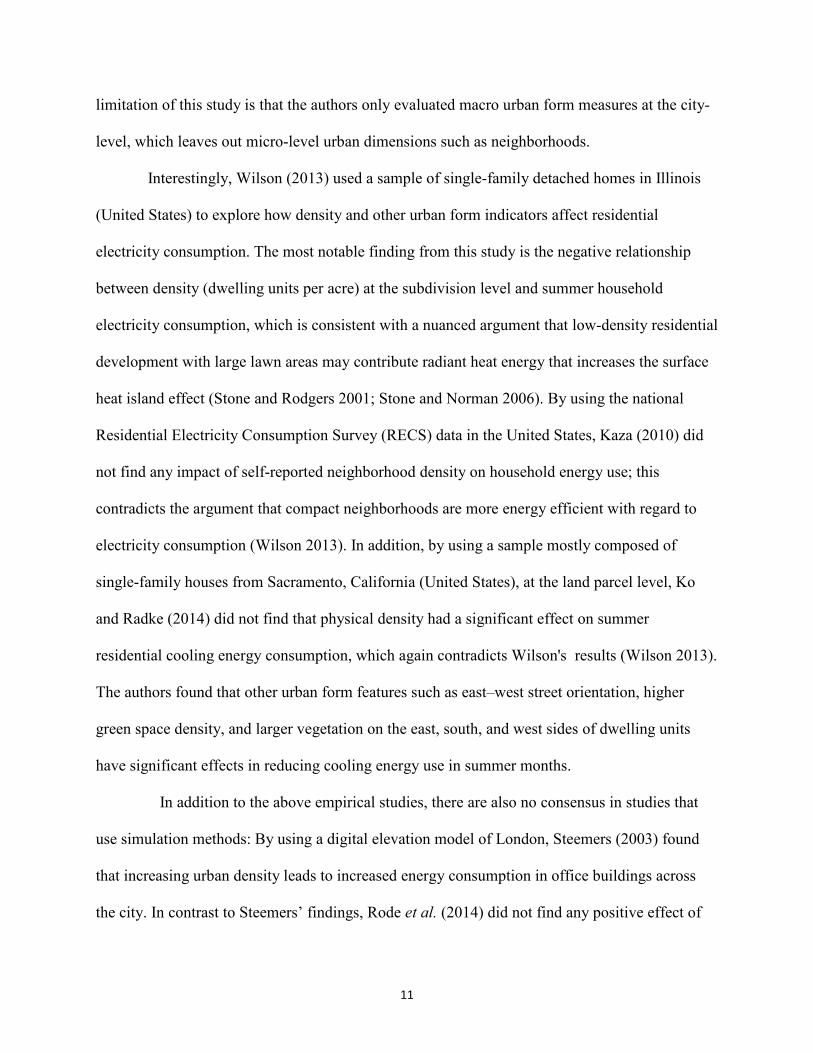
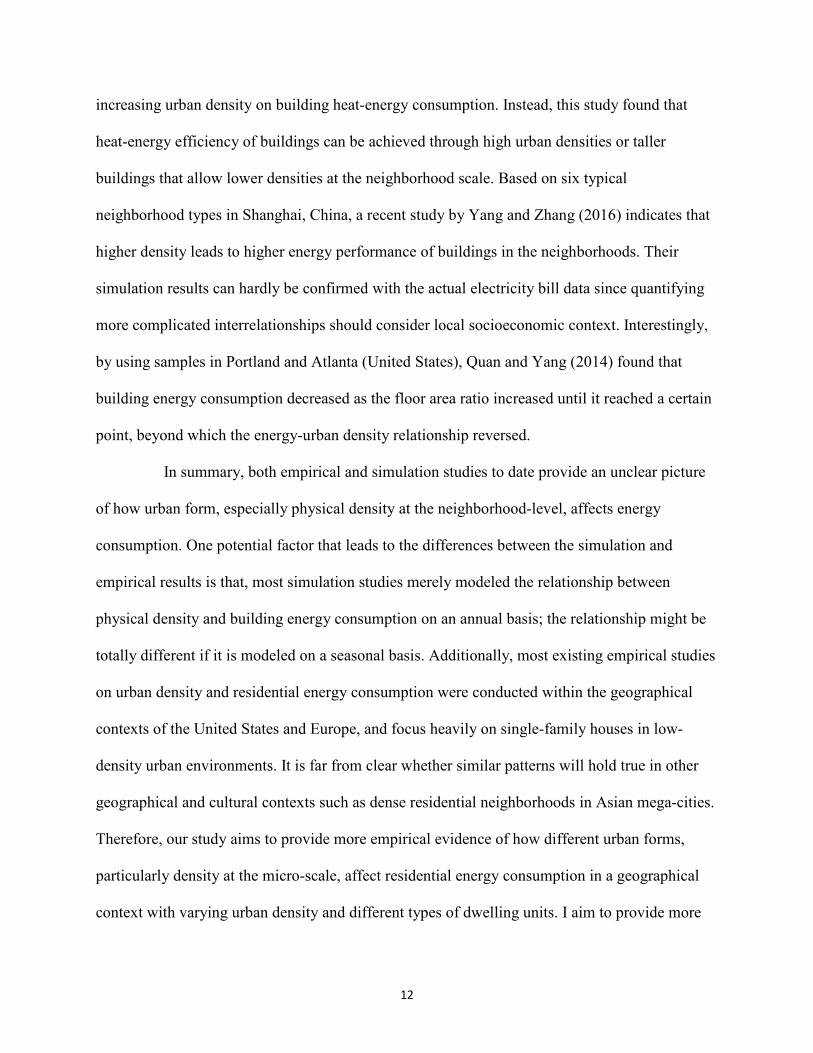
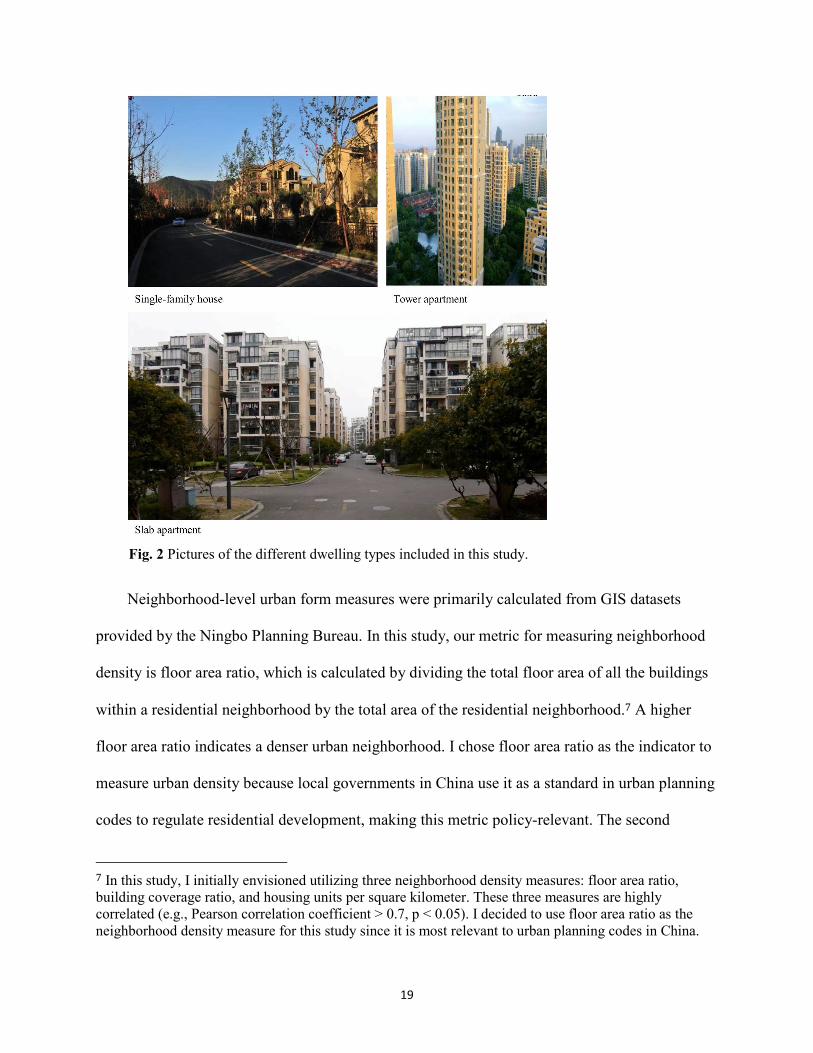
Fig. 2 Pictures of the different dwelling types included in this study. .............................. 19
Fig. 3 Spatial patterns of (a) Average annual electricity usage intensity, (b) Average summer electricity usage intensity, (c) Average winter gas usage intensity, (d) Population density,(e) Building orientation, (f) Annual insolation per building volume, (g) Annual vegetation index (NDVI), (h) Urban porosity, (i) Urban roughness length by census tract in Chicago .......................... 52
Fig. 4 Provinces and cities with climate change plans reviewed in this study .................................................................................................................................. 75
Fig. 5 Distribution of total number of policies by subcategory in provincial plans .................................................................................................................................. 82
Fig. 6 Distribution of total number of policies by subcategory in municipal plans .................................................................................................................................. 83
Fig. 7 Framework and breadth of policy actions and strategies (energy, industry, and transportation) ............................................................................................. 84
Fig. 8 Framework and breadth of policy actions and strategies (building, carbon sink, land use/urban form, lifestyle/behavior, and waste) ..................................... 85
Fig. 9 Framework and breadth of policy actions and strategies (water and agriculture) ........................................................................................................................ 86

xi
LIST OF TABLES
Table 1 Key characteristics of the six communities. ........................................................ 17
Table 2 Analysis of intraclass correlation. ........................................................................ 21
Table 3 Descriptive statistics (N=534). ............................................................................ 25
Table 4 Annual and seasonal multilevel regression results. .......................................... 27
Table 5 Descriptive statistics (N=780). .......................................................................... 48
Table 6 Annual and seasonal spatial regression results. ................................................ 57
Table 7 Description of climate change plan document evaluation protocol. .................... 76

xii
LIST OF ABBREVIATIONS
DEM Digital Elevation Model
EIA Energy Information Administration
EUI Energy Usage Intensity
GHG Greenhouse Gas
GIS Geographic Information System
ICLEI Local Governments for Sustainability
IPCC Intergovernmental Panel on Climate Change
NDRC National Development and Reform Commission
NDVI Normalized Difference Vegetation Index
OLS Ordinary Least Square
SDEM Spatial Durbin Error Model
SEM Spatial Error Model
U.S. United States
VIF Variation Inflation Factor

1
CHAPTER 1: INTRODUCTION
1.1. Statement of the problem
Climate change is considered as one of the most complex challenges in the 21st century,
especially in the field of planning (Donaghy 2007; Wheeler, 2008; Blanco et al. 2009). Urban
areas are both significant contributors of greenhouse gas (GHG) emissions and where innovation
and policy action take place (Satterthwaite 2008; Kennedy et al. 2009). Urban energy use
significantly contributes to climate change: the Intergovernmental Panel on Climate Change
(IPCC) report shows that urban areas consume between 67% and 76% of global energy and
generate about three quarters of global carbon emissions (IPCC 2013).
Urban form is increasingly being recognized for the potential role in increasing energy
efficiency and mitigating climate change: the most recent IPCC report also identifies urban form
and spatial planning, the 2D and 3D relationships between the physical urban settlements and
land use patterns, as one of the key determinants of a city’s energy consumption, and
consequently, its greenhouse gas (GHG) emissions (Güneralp et al. 2017; IPCC 2013).
Additionally, urban form could significantly affects both direct (operational) and indirect
(embodied) energy consumption (Rickwood, Glazebrook, and Searle 2008; Güneralp et al.
2017). Thus, a comprehensive understanding of the relationship between urban form and energy
efficiency should be the key constituent of climate change mitigation. Nevertheless, urban
energy consumption cut across sectors and disciplines, which complicates relative exploration on
the relationship between urban form and energy efficiency.
2
It is well established that energy use in buildings is one of the largest energy consuming
sectors and the major sources of greenhouse gas (GHG) emissions from cities, and most of the
emissions are from building operations (Roaf, Norman, MacLean, and Kennedy 2006; Perez-
Lombard, Ortiz and Pout 2008; Swan and Ugursal 2009). In developed countries, energy
consumption in buildings has exceeded other major sectors such as industrial use and
transportation (Pe´rez-Lombard, Ortiz, and Pout 2008). For instance, in the United States, 40
percent of total energy is consumed in residential and commercial buildings (21 percent for
residential and 19 percent for commercial); the building sector has become the largest energy
consumption sector (EIA 2015).
Previous studies on building energy consumption by planning scholars mainly focus on
the effects of occupant behavior, adoption of energy-efficient technologies (e.g., Andrews and
Krogmann 2009), and specific city-level policies on building energy efficiency, such as
benchmarking policy (e.g., Hsu 2014). Analysis of the relationship between energy consumption
in buildings and urban form has not received enough attention until recent years. It is widely
believed that physical urban form affect urban transport energy consumption(Anderson, Pavlos,
and Eric 1996; Banister, Watson, and Wood 1997; Gorman and Dajani 1973; Mindali, Raveh,
and Salomon 2004), and there are numerous studies on the relationship between urban form and
transport energy use(Anderson, Pavlos, and Eric 1996; Banister, Watson, and Wood 1997;
Camagni, Cristina, and Rigamonti 2002; Ewing and Cervero 2001; Gorman and Dajani 1973;
Mindali, Raveh, and Salomon 2004). Nevertheless, there have been relatively limited studies on
the relationship between urban form and operational energy use in buildings. It is important to
evaluate how various urban form elements affect building energy consumption (Ko 2013; Wilson
2013; Ko and Radke 2014; Lee and Lee 2014). Nevertheless, research to date still provides a

3
blurred picture of how urban density and various urban form elements affects building energy
consumption: the pathways, direction and magnitude of the effect are disputed in the literature
(Li, Song, and Kaza 2018).
Meanwhile, cities have been increasingly recognized as major sites for climate change
response (Kousky and Schneider 2003; Betsill and Bulkeley 2007; Dhakal and Betsill 2007;
Donaghy 2007; Ruth and Coelho 2007; Pamlin et al. 2009; While et al. 2010). A growing
number of subnational governments have recognized that global climate change has an essential
local and regional dimension. Some international programs, such as the Cities for Climate
Protection (CCP) Campaign that encourages local government emission reductions, are vibrant
examples of this trend (Betsill 2001; Kousky and Schneider 2003; Lindseth 2004; Lutsey 2008;
Wheeler 2008; Anguelovski and Carmin 2011). Although there has been burgeoning literature
offering theory and practical guidance on local climate change mitigation(Bulkeley and Betsill
2005; Bulkeley and Betsill 2013; Bulkeley et al. 2010; Millard-Ball 2013; Kousky and Schneider
2003; Millard-Ball 2012) , scant attention has been paid to evaluating existing plans to shed light
on to what extent policies and strategies has incorporated in to planning documents. In effect, it
is important to evaluate existing climate change plans to advance our understanding of local
climate change planning process and identifying current issues and challenges. In addition, there
is limited empirical understanding of whether urban form and land use policies have been
incorporated into current climate change plans.
1.2. Research questions
This dissertation includes three self-contained and interrelated papers on climate change
mitigation, building energy efficiency, and urban form. The first paper (Chapter 2), which has
4
been published in the journal Energy and Buildings, examines the effect of neighborhood density
on household residential electricity consumption (Li, Song, and Kaza 2018). The second paper
(Chapter 3), which will be submitted to Planning Education and Research, explores the spatial
complexity of residential energy (including electricity and natural gas) usage intensity, with a
focus on urban ventilation, solar insolation, and vegetation and the associated spatial spillover
effects. The third paper, a proportion of which has been published in the journal of
Environmental Planning and Management, evaluates the first-generation provincial and
municipal climate change plans in China, and examines which policy categories and key
strategies are prioritized and whether the urban form and land use subcategory is well identified
in the plans (Li and Song 2016). The research questions for each paper are listed as follows:
1.2.1. Paper one
1) Is there a relationship between urban form (especially neighborhood density) and residential
energy consumption after controlling for differences in demographic, socioeconomic, behavioral,
and property-related characteristics at the household level?
2) Are the effects of urban form on residential energy consumption consistent across seasons?
How do these effects differ between the summer and the winter?
3) Does neighborhood density affect residential energy consumption differently for households
located in different dwelling units?
1.2.2. Paper two
1) Do urban ventilation, solar insolation, and vegetation affect residential energy usage intensity?
Are these effects consistent across seasons?

5
2) Do urban ventilation and vegetation have spillover effects on residential energy usage
intensity?
1.2.3. Paper three
1) What are the main planning interventions taken by Chinese cities and provinces to respond to
climate change? What are the main issues with the first-generation subnational climate change
plans?
2) Which policy categories and key strategies are prioritized in provincial and municipal climate
change plans? Is the subcategory of urban form and land use well identified?

6
REFERENCES
Anderson, W P, S K Pavlos, and J M Eric. 1996. “Urban Form , Energy and the Environm : A Review of Issues , Evidence and Policy.” Urban Studies 33(1): 7–35.
Andrews, C.J. and U. Krogmann. 2009. “Technology diffusion and energy intensity in US commercial buildings.” Energy Policy 37(2): 541–553.
Anguelovski, I., and J. Carmin. 2011. “Something Borrowed, Everything New: Innovation and Institutionalization in Urban Climate Governance.” Current Opinion in Environmental
Sustainability 3 (3): 169–175.
Banister, D, S Watson, and C Wood. 1997. “Sustainable Cities: Transport, Energy, and Urban Form.” Environment and Planning B-Planning & Design 24 (1): 125–143.
Blanco, H., M. Alberti, R. Olshansky, S. Chang, S. M. Wheeler, J. Randolph, J. B. London, et al. 2009. “Shaken, Shrinking, Hot, Impoverished and Informal: Emerging Research Agendas in Planning.” Progress in Planning 72 (4): 195–250.
Bulkeley, H., and M. Betsill. 2005. “Rethinking Sustainable Cities: Multilevel Governance and the ‘Urban’ Politics of Climate Change.” Environmental Politics 14 (1): 42–63.
Bulkeley, H., and M. M. Betsill. 2013. “Revisiting the Urban Politics of Climate Change.” Environmental Politics 22 (1): 136–154.
Camagni, R, M. Cristina, and P. Rigamonti. 2002. “Urban Mobility and Urban Form: The Social and Environmental Costs of Different Patterns of Urban Expansion.” Ecological economics 40: 199–216.
Ewing, R., and R. Cervero. 2001. “Travel and the Built Environment: A Synthesis.” Transportation
Research Record 1780: 87–114.
Gorman, G., and J. Dajani. 1973. “Energy, Urban Form and Transportation Policy.” Transportation
Research 8 (4–5): 267–276.
Güneralp, B., Y. Zhou, D. Ürge-Vorsatz, M. Gupta, S. Yu, P. L. Patel, M. Fragkias, X. Li, and K. C. Seto. 2017. “Global Scenarios of Urban Density and Its Impacts on Building Energy Use through 2050.” Proceedings of the National Academy of Sciences 114 (34): 8945–8950.
Hsu, D., 2014. “Improving energy benchmarking with self-reported data.” Building Research &
Information, 42(5): 641-656.
IPCC. 2013. “IPCC Fifth Assessment Report (AR5).” IPCC, 10-12.
Kennedy, C., J. Steinberger, B. Gasson, Y. Hansen, T. Hillman, M. Havranek, D. Pataki, A. Phdungsilp, A. Ramaswami, and G. V. Mendez. 2009. “Greenhouse Gas Emissions from Global Cities.” Environmental Science & Technology 43 (19): 7297–7302.
Ko, Y. 2013. “Urban Form and Residential Energy Use: A Review of Design Principles and Research Findings.” Journal of Planning Literature 28 (4): 327–351.
7
Ko, Y, and J. D. Radke. 2014. “The Effect of Urban Form and Residential Cooling Energy Use in Sacramento, California.” Environment and Planning B: Planning and Design 41 (4): 573–593.
Kousky, C., and S. H. Schneider. 2003. “Global Climate Policy: Will Cities Lead the Way?” Climate
Policy 3 (4): 359–372.
Lee, S., and B. Lee. 2014. “The Influence of Urban Form on GHG Emissions in the U.S. Household Sector.” Energy Policy 68: 534–549.
Li, C., Y. Song, and N. Kaza. 2018. “Urban Form and Household Electricity Consumption: A Multilevel Study.” Energy and Buildings 158, 181–193.
Li, C., and Y. Song. 2015. “Government Response to Climate Change in China: A Study of Provincial and Municipal Plans.” Journal of Environmental Planning and Management 59(9), 1679–1710.
Millard-Ball, A. 2012. “Do City Climate Plans Reduce Emissions?” Journal of Urban Economics 71 (3): 289–311.
Millard-Ball, A. 2013. “The Limits to Planning Causal Impacts of City Climate Action Plans.” Journal of
Planning Education and Research 33 (1): 5–19.
Mindali, O., A. Raveh, and I. Salomon. 2004. “Urban Density and Energy Consumption: A New Look at Old Statistics.” Transportation Research Part A: Policy and Practice 38 (2): 143–162.
Rickwood, P., G. Glazebrook, and G. Searle. 2008. “Urban Structure and Energy-a Review.” Urban
Policy and Research 26 (1): 57–81.
Satterthwaite, D. 2008. “Cities’ Contribution to Global Warming: Notes on the Allocation of Greenhouse Gas Emissions.” Environment and Urbanization 20 (2): 539–549.
Silva, M., V. Oliveira, and V. Leal. 2017. “Urban Form and Energy Demand.” Journal of Planning
Literature. doi:10.1177/0885412217706900.
Wheeler, S. 2008. “State and Municipal Climate Change Plans: The First Generation.” Journal of the
American Planning Association 74 (4): 481–496.
Wilson, Bev. 2013. “Urban Form and Residential Electricity Consumption: Evidence from Illinois, USA.” Landscape and Urban Planning 115: 62–71.
8
CHAPTER 2. URBAN FORM AND HOUSEHOLD ELECTRICITY
CONSUMPTION: A MULTILEVEL STUDY
2.1. Introduction
Urban form and land use patterns significantly influence a city’s energy consumption
and, consequently, its GHG emissions. It is widely believed that physical urban form affects
urban transportation energy consumption (Anderson, Pavlos, and Eric 1996; Banister, Watson,
and Wood 1997; Gorman and Dajani 1973; Mindali, Raveh, and Salomon 2004), and there are
numerous studies on the relationship between urban form and transportation energy use
(Anderson, Pavlos, and Eric 1996; Banister, Watson, and Wood 1997; Camagni, Cristina, and
Rigamonti 2002; Ewing and Cervero 2001; Gorman and Dajani 1973; Mindali, Raveh, and
Salomon 2004). Energy use in buildings is one of the major sources of greenhouse gas (GHG)
emissions from cities, and most of these emissions are from building operations (Norman et al.
2006; Perez-Lombard 2008; Swan and Ugursal 2009). However, there have been a relatively
limited number of studies on the relationship between urban form and operational energy use in
buildings. A comprehensive understanding of the relationship between urban form and energy
use is key to formulating climate change mitigation policies at a city level. Therefore, it is
important to evaluate how various elements of urban form affect building energy consumption
(Ko and Radke 2014; Wilson 2013; Ko 2013; Lee and Lee 2014). The pathways, direction and
magnitude of the effects of urban form on building energy consumption are disputed in current
literature (Silva, Oliveira, and Leal 2017). Furthermore, most of these studies are limited to cities
in Europe and the Americas. Few studies to date have assessed the roles of physical development
and urban form on residential energy consumption in the context of dense urban environment,

9
such as fast-growing megacities in Asia, where urban form policies might play a more important
role in promoting building energy efficiency.
In China, residential sector is the second largest energy-consuming sector after Industry
and consumes about 13% of the total energy consumption1 (National Bureau of Statistics of
China 2015). Together with the unprecedented scope of urbanization in recent decades,
residential energy consumption in China has increased enormously: the growth rate in residential
electricity demand has reached an annual average of 11.9% (National Bureau of Statistics of
China 2015). Since this growth shows no signs of abatement, it is crucial to know how changes
to physical development patterns and modifications to urban built environment can contribute to
lowering residential energy consumption. However, existing studies on residential energy
consumption in China have largely focused on occupants’ socio-economic status and behavior,
price deregulation, policy effectiveness, as well as technical measures to improve energy
efficiency (Chen, Wang, and Steemers 2013; Zheng et al. 2014; Zhao, Li, and Ma 2012; Ouyang
et al. 2011).
The purpose of this paper is to explore the effects of urban form on residential energy
consumption, in the contexts of urban environments in China, so as to shed light on the role of
urban form on residential energy efficiency. I first review current literature debate concerning
urban form and building energy consumption and justify the research questions. I then present
our research design, data collection and analysis methods, including the household survey, urban
form measures, and model specification. I then present the results for the study area in Ningbo
1 According to National Bureau of Statistics of China, energy consumption from the transportation sector is underestimated since it only includes commercial transportation, postal and warehousing industries. The energy consumption from non-commercial transportation (e.g., private cars and motorcycles) is not included (Zhang et al. 2014).

10
city and set these in the context of existing literature. I discuss directions for future research and
conclude with policy implications.
2.2. Literature review and research questions
Urban density, a measure that is central to physical planning, was long considered
important driver for building energy consumption (Silva, Oliveira, and Leal 2017). Early
expositions of this relationship suggested that urban development patterns with higher physical
density are associated with higher urban temperatures and heat island effect (Giridharan,
Ganesan, and Lau 2004; B. Chun and Guldmann 2014), which could in turn increase cooling
loads in buildings (Taha 1997). In recent years, the relationship between urban form and energy
consumption has enjoyed a resurgence of interest (Wilson 2013). However, there has been
disagreement among literature concerning pathways, direction and magnitude of the effects of
urban form (especially urban density) on building energy consumption. Ewing and Rong (2008)
posit three possible pathways through which urban form impacts residential energy consumption:
energy loss through electric transmission and distribution, increased energy demand associated
with the urban heat island effect, and energy consumption variance through size and type of
housing stocks. The complicated stepped analysis and the conclusions of this study are still under
debate, as Randolph (2008) argues that urban form is still an excessively blunt tool without
sufficient empirical evidence and Ewing and Rong fails to consider the dynamic aspects of
markets or consumer behavior in their study. More recently, Lee and Lee (2014) examined the
effects of urban form on households’ carbon dioxide emissions in the 125 largest urban areas in
the United States and found that doubling population-weighted density can reduce residential
energy consumption by 35%; this supports the idea that smart growth polices and compact urban
form are an important part of macro-efforts to mitigate greenhouse gas emissions. A notable
11
limitation of this study is that the authors only evaluated macro urban form measures at the city-
level, which leaves out micro-level urban dimensions such as neighborhoods.
Interestingly, Wilson (2013) used a sample of single-family detached homes in Illinois
(United States) to explore how density and other urban form indicators affect residential
electricity consumption. The most notable finding from this study is the negative relationship
between density (dwelling units per acre) at the subdivision level and summer household
electricity consumption, which is consistent with a nuanced argument that low-density residential
development with large lawn areas may contribute radiant heat energy that increases the surface
heat island effect (Stone and Rodgers 2001; Stone and Norman 2006). By using the national
Residential Electricity Consumption Survey (RECS) data in the United States, Kaza (2010) did
not find any impact of self-reported neighborhood density on household energy use; this
contradicts the argument that compact neighborhoods are more energy efficient with regard to
electricity consumption (Wilson 2013). In addition, by using a sample mostly composed of
single-family houses from Sacramento, California (United States), at the land parcel level, Ko
and Radke (2014) did not find that physical density had a significant effect on summer
residential cooling energy consumption, which again contradicts Wilson's results (Wilson 2013).
The authors found that other urban form features such as east–west street orientation, higher
green space density, and larger vegetation on the east, south, and west sides of dwelling units
have significant effects in reducing cooling energy use in summer months.
In addition to the above empirical studies, there are also no consensus in studies that
use simulation methods: By using a digital elevation model of London, Steemers (2003) found
that increasing urban density leads to increased energy consumption in office buildings across
the city. In contrast to Steemers’ findings, Rode et al. (2014) did not find any positive effect of
12
increasing urban density on building heat-energy consumption. Instead, this study found that
heat-energy efficiency of buildings can be achieved through high urban densities or taller
buildings that allow lower densities at the neighborhood scale. Based on six typical
neighborhood types in Shanghai, China, a recent study by Yang and Zhang (2016) indicates that
higher density leads to higher energy performance of buildings in the neighborhoods. Their
simulation results can hardly be confirmed with the actual electricity bill data since quantifying
more complicated interrelationships should consider local socioeconomic context. Interestingly,
by using samples in Portland and Atlanta (United States), Quan and Yang (2014) found that
building energy consumption decreased as the floor area ratio increased until it reached a certain
point, beyond which the energy-urban density relationship reversed.
In summary, both empirical and simulation studies to date provide an unclear picture
of how urban form, especially physical density at the neighborhood-level, affects energy
consumption. One potential factor that leads to the differences between the simulation and
empirical results is that, most simulation studies merely modeled the relationship between
physical density and building energy consumption on an annual basis; the relationship might be
totally different if it is modeled on a seasonal basis. Additionally, most existing empirical studies
on urban density and residential energy consumption were conducted within the geographical
contexts of the United States and Europe, and focus heavily on single-family houses in low-
density urban environments. It is far from clear whether similar patterns will hold true in other
geographical and cultural contexts such as dense residential neighborhoods in Asian mega-cities.
Therefore, our study aims to provide more empirical evidence of how different urban forms,
particularly density at the micro-scale, affect residential energy consumption in a geographical
context with varying urban density and different types of dwelling units. I aim to provide more

13
detailed empirical understanding of how urban form characteristics shape residential energy
consumption for different seasons, and for different types of dwelling units located in different
neighborhoods by answering the following questions:
1) Is there a relationship between urban form (especially neighborhood density) and residential
energy consumption after controlling for differences in demographic, socioeconomic, behavioral,
and property-related characteristics at the household level?
2) Are the effects of urban form on residential energy consumption consistent across seasons?
How do these effects differ between the summer and the winter?
3) Does neighborhood density affect residential energy consumption differently for households
located in different dwelling units?
2.3. Methods
2.3.1. Description of the survey
In order to probe the research questions of this study in detail, I conducted a household survey
in Ningbo, a sub-provincial city located along the eastern coast of China. Ningbo is a typical city
in the Yangtze River Delta Metropolitan Region, which is situated in China’s “hot summer and
cold winter” climate zone. The total population within the built-up area of Ningbo is 2.182
million, with a residential density in the city center of 10,399 people per square kilometer. I
selected Ningbo mainly because its residential urban form is representative of development in
other cities in Yangtze River Delta Metropolitan Region, which is the largest metropolitan area
in China. Additionally, I have got pre-permission from the Ningbo Electric Power Bureau to
access the residents’ utility bills for this study. The typical types of residential building in
Ningbo include slab apartment homes, tower apartment homes, and single-family houses, which
is also consistent with other Chinese cities.

14
The household survey instrument used in this study (Appendix 1) was developed based on
previous studies (Holden and Norland 2005; Chen, Wang, and Steemers 2013; Wilson 2013), as
well as the U.S. Residential Energy Consumption Survey; these surveys are designed to capture
the important demographic, socioeconomic, behavioral, and property-related explanatory
variables for household electricity consumption. In the survey, I required our participants to
provide us the identification numbers for their electricity meters. Participants agreed to
participate in our survey and let us access their utility bills from the Ningbo Electric Power
Bureau and use this information for our study before our survey started. The survey is composed
of four parts. The first part of the survey was completed by the surveyors and is composed of
basic questions about participants, including addresses, floor levels2, dwelling types, and the
electricity meter identification number of the households. The second part of the survey deals
with building ages, the area of the dwelling units, and households’ estimates of their monthly
utility bills. Information about home heating equipment was also gathered in this section. The
third part of the survey primarily comprised of questions about the demographic and socio-
economic status of the participating households, including the ages of family members and
household incomes. A survey of major household appliances3 was also completed during this
part of the survey and used to calculate the home appliance index4 in the regression model. The
2 Since floor level (e.g., differences between first floor, intermediate floor, and top floor) could be a potential factor affecting the household’s insulation and its exposure to external temperature (Ferhat and Boutrahi 2014), I included it in our survey and classified each household’s floor level into four categories: first floor, middle floor (floor level 2-8), high floor (floor level >8), and top floor.
3 Following Chen et al. (2013), the term “major household appliances” refers to electricity-intensive appliances in Chinese homes, including air-conditioners, fridges, washing machines, water heaters, computers, and televisions. 4 I calculated the electricity conservation index for each housing unit based on the information that I derived from part 4 of our household survey (Appendix 1). I coded questions 23-27 on a 0–2 ordinal scale and summed up all the coded values of these questions to get the electricity conservation index.

15
final section of the survey includes seven questions to learn about electricity conservation actions
used within the households as well as other micro-level urban form characteristics, such as
whether their households have tree shade and whether their neighborhoods are adjacent to water
bodies.
Initially, I conducted a priori sample size estimation to determine how many observations
are needed for this study5. By setting a desired statistical power level of 0.95, I calculated the
minimum sample sizes for different effect sizes of 0.05 (small), 0.15 (medium), and 0.35 (large).
Our required sample size ranged from 105 to 634 observations. By referring to previous studies
(Holden and Norland 2005; J. Chen, Wang, and Steemers 2013; Wilson 2013), I targeted 560
households as our desired sample size to ensure a relatively large sample.
5 I used the methods recommended by Faul et al. (2009) to conduct the power analysis for multiple regressions. I set 20 as the number of predictors.

16

17
Fig. 1 Images of the six communities across Ningbo used in this study, accessed December 10, 2015. Photograph: Baidu Map.
Our sampling strategies are as follows: First, I selected six different “typical” communities
(Fig.1) across Ningbo in different locations (Table 1). I then used a random drawing to select 560
households within these communities based on addresses gathered from the Ningbo Planning
Institute. The selected households are located in 46 residential neighborhoods6 with various
building stocks, densities, and urban form features. After the samples were selected, I hired a
survey company to do households surveys. I paid the surveying company 120 RMB for each
survey. To ensure survey quality, every surveyor was required to attend a half-day training
lecture. During the training process, one of our questionnaire designers discussed each question
with all surveyors. Each surveyor received intensive training on sampling strategy and interview
skills.
Table 1 Key characteristics of the six communities.
A pilot survey of 20 households was conducted in June 2015 to reveal any possible
misinterpretations of survey questions, ambiguity in response categories, or other issues. The
6 Residential neighborhood in this study refers to “juzhuzutuan”, which is the primary unit in residential areas in China. It is often maintained by a single property management company and composed of homogenous residential buildings.
Characteristics
Sanjiangkou
Shijidongfang
Yizhou Gaotang Hongtang Donghuguandi
Distance to city center Close Medium Distant Medium Distant Distant Distance to city sub-centers Relative housing density
Medium
High
Close
Medium
Medium Medium
Distant
High
Distant
High
Distant
Low
Housing type(s)
Slab apartment/Tower apartment
Slab apartment/Tower apartment
Slab apartment/Tower apartment
Slab apartment/Tower apartment/Single-family house
Slab apartment/Tower apartment
Slab apartment/ Single-family house

18
survey instrument was slightly revised based on the responses from our pilot survey. The formal
survey was conducted during July 2015. After that, monthly electricity data in the most recent
year for each household was collected from the Ningbo Electric Power Bureau. After validity
checks on both the electricity data and the survey results, 534 total observations in 46 different
neighborhoods remained in our final sample.
2.3.2. Urban form measures
Urban form measures in this study are derived both at the housing unit- and neighborhood-
levels. At the housing unit-level, the type of dwelling in which the household is located is
deemed as an important micro-level urban form factor. Numerous previous studies indicate that
dwelling type can have a major effect on household energy consumption, as single-family units
tend to consume more energy than multi-family units (IPART 2011; Kaza 2010; Min,
Hausfather, and Lin 2010).In the context of Chinese cities, primary dwelling types include slab
and tower apartments located in high-density neighborhoods. Thus, in this study, three binary
variables were included to capture if a housing unit is in a single-family house, a slab apartment,
or a tower apartment (Fig.2). Similar to Wilson (2013), our household survey includes a question
which indicates if the surveyed housing unit has tree shade.
19
Fig. 2 Pictures of the different dwelling types included in this study.
Neighborhood-level urban form measures were primarily calculated from GIS datasets
provided by the Ningbo Planning Bureau. In this study, our metric for measuring neighborhood
density is floor area ratio, which is calculated by dividing the total floor area of all the buildings
within a residential neighborhood by the total area of the residential neighborhood.7 A higher
floor area ratio indicates a denser urban neighborhood. I chose floor area ratio as the indicator to
measure urban density because local governments in China use it as a standard in urban planning
codes to regulate residential development, making this metric policy-relevant. The second
7 In this study, I initially envisioned utilizing three neighborhood density measures: floor area ratio, building coverage ratio, and housing units per square kilometer. These three measures are highly correlated (e.g., Pearson correlation coefficient > 0.7, p < 0.05). I decided to use floor area ratio as the neighborhood density measure for this study since it is most relevant to urban planning codes in China.
20
neighborhood-level urban form measure is street configuration, which has been identified as
another important factor in influencing household energy consumption since the ideal east-west
orientation of a street will result in more south-facing buildings in a neighborhood (Erley and
Jaffe 1979; Robinette 1983; Shishegar 2013; Ko 2013; Ko and Radke 2014). To measure street
configuration, I initially determined the major axis of streets using street network GIS data. I
then calculated the orientation angle for each street in the major axis. If more than 80% of the
streets in the major axis are within five degrees of the ideal east-west orientation, the street
configuration variable for the neighborhood was coded as 1; otherwise, it was coded as 0. The
last neighborhood urban form measure, also coded as a binary variable, indicates whether a
neighborhood is adjacent to natural water bodies (e.g., rivers, lakes). This variable was primarily
derived from the household survey and confirmed with Google Earth images.
2.3.3. Model specification
Multilevel regression was used in this study since it is designated to analyze hierarchically
clustered data. It is also known as a hierarchical linear model or linear mixed model, which deals
with the within-group dependency issues whilst estimating ecological effects (Steenbergen and
Jones 2002; Raudenbush and Bryk 2002; Ballas and Tranmer 2012). Furthermore, the multilevel
specification also models spatial autocorrelation by capturing spatial structure in the data (Orford
2000).
The decision whether to use a hierarchical linear model is based on both statistical and
theoretical criteria. The general statistical guideline for checking the need to use a hierarchical
linear model is based on the calculation of intraclass correlation which, in this case, gives an
estimate of the degree of variance in the surveyed households that can be explained by
21
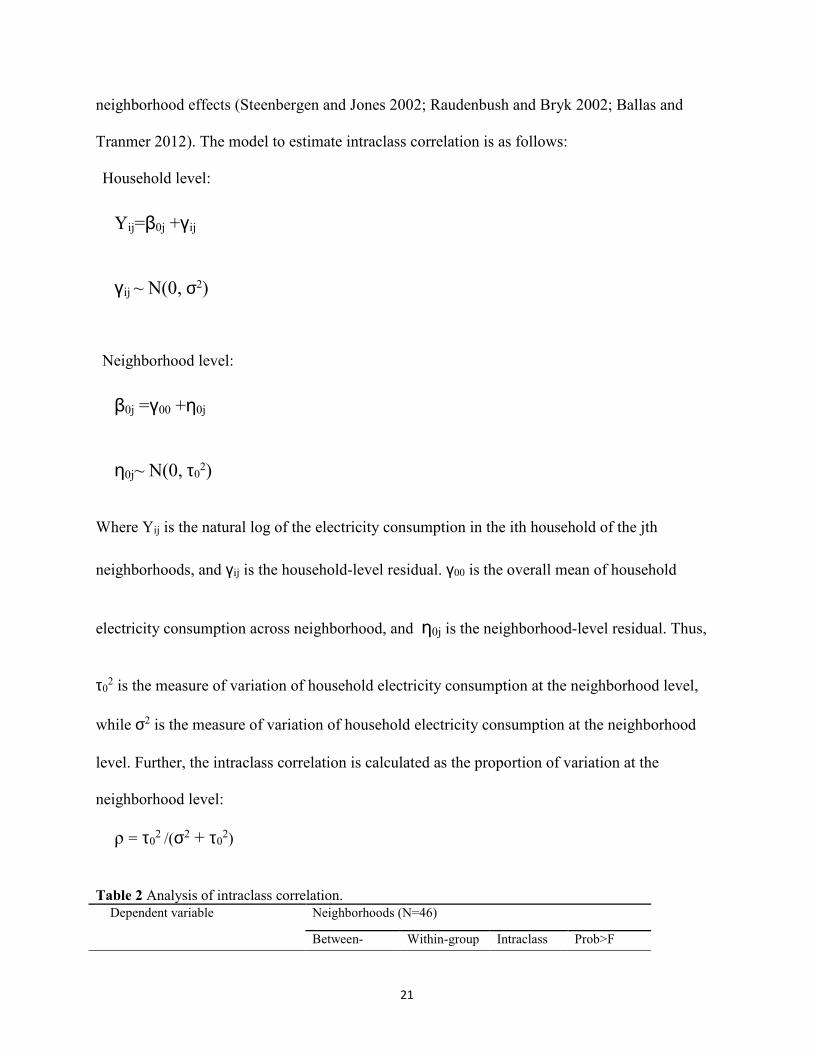
neighborhood effects (Steenbergen and Jones 2002; Raudenbush and Bryk 2002; Ballas and
Tranmer 2012). The model to estimate intraclass correlation is as follows:
Household level:
Yij=β0j +γij
γij ~ N(0, σ2)
Neighborhood level:
β0j =γ00 +η0j
η0j~ N(0, τ02)
Where Yij is the natural log of the electricity consumption in the ith household of the jth
neighborhoods, and γij is the household-level residual. γ00 is the overall mean of household
electricity consumption across neighborhood, and η0j is the neighborhood-level residual. Thus,
τ02 is the measure of variation of household electricity consumption at the neighborhood level,
while σ2 is the measure of variation of household electricity consumption at the neighborhood
level. Further, the intraclass correlation is calculated as the proportion of variation at the
neighborhood level:
ρ = τ02 /(σ2 + τ0
2)
Table 2 Analysis of intraclass correlation. Dependent variable Neighborhoods (N=46)
Between- Within-group Intraclass Prob>F
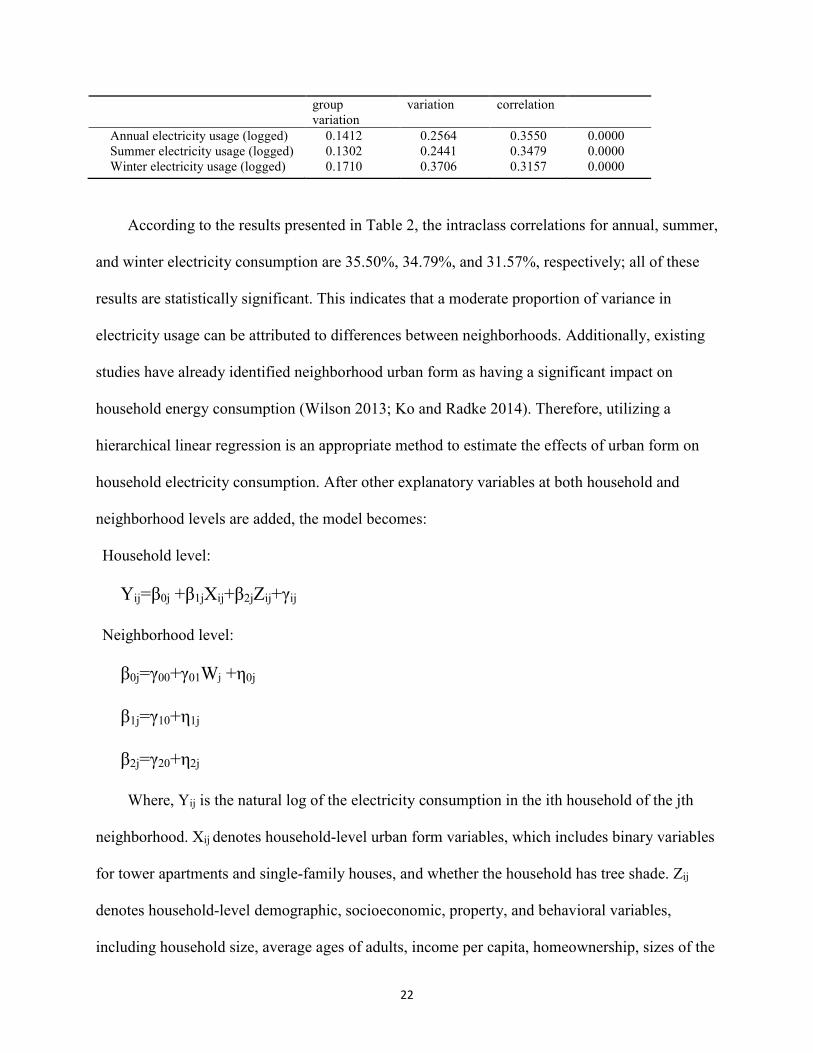
22
group variation
variation correlation
Annual electricity usage (logged) 0.1412 0.2564 0.3550 0.0000 Summer electricity usage (logged) 0.1302 0.2441 0.3479 0.0000 Winter electricity usage (logged) 0.1710 0.3706 0.3157 0.0000
According to the results presented in Table 2, the intraclass correlations for annual, summer,
and winter electricity consumption are 35.50%, 34.79%, and 31.57%, respectively; all of these
results are statistically significant. This indicates that a moderate proportion of variance in
electricity usage can be attributed to differences between neighborhoods. Additionally, existing
studies have already identified neighborhood urban form as having a significant impact on
household energy consumption (Wilson 2013; Ko and Radke 2014). Therefore, utilizing a
hierarchical linear regression is an appropriate method to estimate the effects of urban form on
household electricity consumption. After other explanatory variables at both household and
neighborhood levels are added, the model becomes:
Household level:
Yij=β0j +β1jXij+β2jZij+γij
Neighborhood level:
β0j=γ00+γ01Wj +η0j
β1j=γ10+η1j
β2j=γ20+η2j
Where, Yij is the natural log of the electricity consumption in the ith household of the jth
neighborhood. Xij denotes household-level urban form variables, which includes binary variables
for tower apartments and single-family houses, and whether the household has tree shade. Zij
denotes household-level demographic, socioeconomic, property, and behavioral variables,
including household size, average ages of adults, income per capita, homeownership, sizes of the

23
apartments/houses, floor levels, ages of apartments/houses, an appliance index, and an electricity
conservation index. Wj are neighborhood-level urban form indicators of the jth neighborhood,
including floor area ratios, street configurations, and adjacencies to water bodies.
In the third stage, our analysis was expanded to include cross-level interactions. Since I
hypothesize that neighborhood density would have different effects for households located in
different types of dwelling units, Denj×Typij was added into the model to test the hypothesized
interaction between neighborhood density and dwelling type. Here Denj denotes the floor area
ratio of the jth neighborhood, while Typij includes two binary variables which indicate if the ith
household of the jth neighborhood is located in a tower apartment or a single-family house.
Thus, after the cross-level interaction term was added, the model becomes:
Household level:
Yij=β0j +β1jXij+β2jZij+γij
Neighborhood level:
β0j=γ00+ γ01Wj + γ02Denj×Typij+η0j
β1j=γ10+η1j
β2j=γ20+η2j
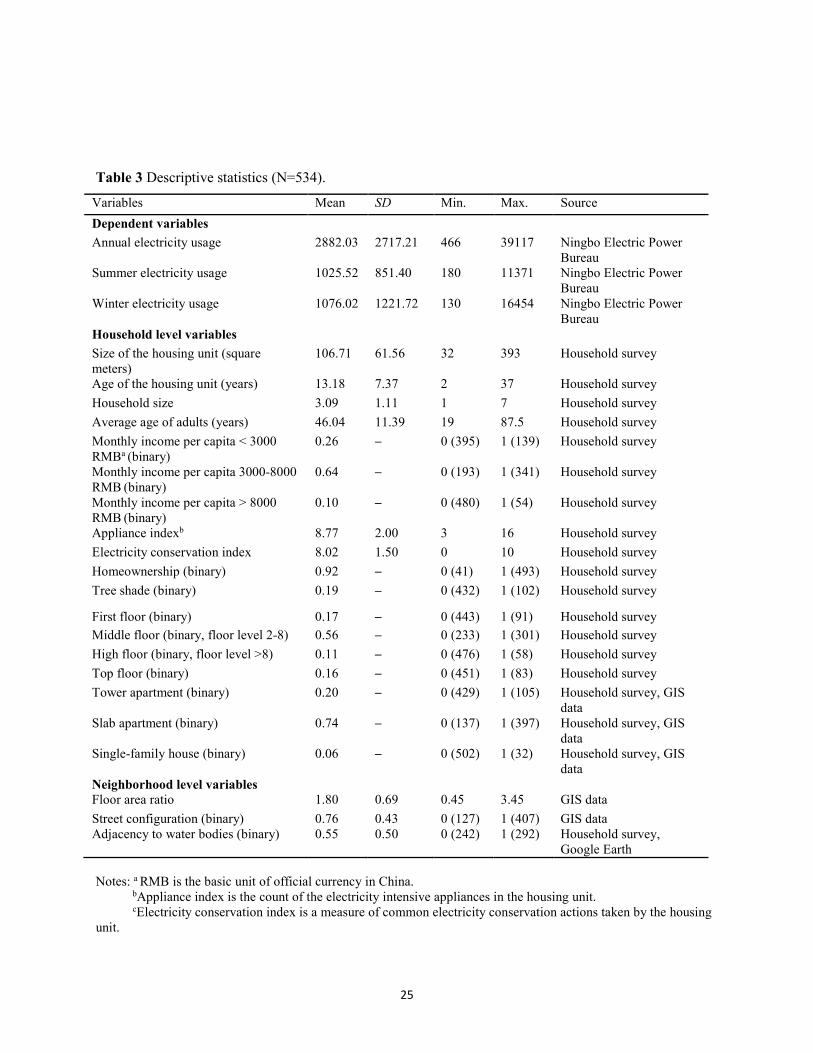
2.3.4. Descriptive statistics
Table 3 provides descriptive statistics for the measures used in the multilevel model. Annual
electricity usage refers to annual household electricity usage from October 2014 to September
2015, in the unit of kWh. Summers and winters in Ningbo both last four months, with summer
months including June, July, August, and September, and winter months including December,
January, February, and March. Thus, I calculated the summer electricity usage by using the

24
household electricity data from June 2015 to September 2015; accordingly, winter electricity
consumption was derived from the electricity data from December 2014 to March 2015. Annual
household electricity usage ranged from 466 kWh to 39,117 kWh, with 2,882.03 kWh as the
mean and 2,717.21kWh as the standard deviation. Not surprisingly, the annual, summer, and
winter usages are all right-skewed, so I transferred them to natural log form. According to the
descriptive statistics, the dominant housing type is slab apartment, which accounts for 74% of
our sample, followed by tower apartments (20%) and single-family houses (6%).
Since residential electricity in Ningbo is solely provided by the Ningbo Electric Power
Bureau with a consistent pricing scheme across neighborhoods, I did not consider energy price as
a factor that causes variations in household electricity consumption. Because electricity price is
not included in our model, it is crucial to include household income in our residential energy
consumption model (Romanos 1978; Wilson 2013); this data is derived from the household
survey8. Additionally, according to our survey results, 98.6% of households use air-conditioners
and (or) electric heaters as their primary home heating equipment(s) during winter, thus
electricity is the primary home heating fuel for the households I surveyed in Ningbo9.
8 The low-, medium-, and high-income categories were derived from 2015 municipal income data from the Ningbo Bureau of Statistics. The low-income category is defined as monthly per capita income less than 3000 RMB, while the high-income category is defined as monthly per capita income greater than 8000 RMB. Other incomes are included in the medium-income category.
9 China's heating system is very different from other countries in the world. In the 1950s, the central government drew a line across the country, only allowing places located north of the line to utilize central heating systems with subsidies from the government. Ningbo is located below this line. Central heating systems are not provided in Ningbo, even though Ningbo experiences cold and dry winters. Households in Ningbo use air-conditioners or electric heaters during winter months. In recent years, some rich households also install and use radiant floor heating systems as heating equipment in winter.
25
Table 3 Descriptive statistics (N=534).
Notes: a RMB is the basic unit of official currency in China.
bAppliance index is the count of the electricity intensive appliances in the housing unit. cElectricity conservation index is a measure of common electricity conservation actions taken by the housing unit.
Variables Mean SD Min. Max. Source
Dependent variables
Annual electricity usage 2882.03 2717.21 466 39117 Ningbo Electric Power Bureau
Summer electricity usage 1025.52 851.40 180 11371 Ningbo Electric Power Bureau
Winter electricity usage 1076.02 1221.72 130 16454 Ningbo Electric Power Bureau
Household level variables
Size of the housing unit (square meters)
106.71 61.56 32 393 Household survey
Age of the housing unit (years) 13.18 7.37 2 37 Household survey
Household size 3.09 1.11 1 7 Household survey
Average age of adults (years) 46.04 11.39 19 87.5 Household survey
Monthly income per capita < 3000 RMBa (binary)
0.26 — 0 (395) 1 (139) Household survey
Monthly income per capita 3000-8000 RMB (binary)
0.64 — 0 (193) 1 (341) Household survey
Monthly income per capita > 8000 RMB (binary)
0.10 — 0 (480) 1 (54) Household survey
Appliance indexb 8.77 2.00 3 16 Household survey
Electricity conservation index 8.02 1.50 0 10 Household survey
Homeownership (binary) 0.92 — 0 (41) 1 (493) Household survey
Tree shade (binary) 0.19 — 0 (432) 1 (102) Household survey
First floor (binary) 0.17 — 0 (443) 1 (91) Household survey
Middle floor (binary, floor level 2-8) 0.56 — 0 (233) 1 (301) Household survey
High floor (binary, floor level >8) 0.11 — 0 (476) 1 (58) Household survey
Top floor (binary) 0.16 — 0 (451) 1 (83) Household survey
Tower apartment (binary) 0.20 — 0 (429) 1 (105) Household survey, GIS data
Slab apartment (binary) 0.74 — 0 (137) 1 (397) Household survey, GIS data
Single-family house (binary) 0.06 — 0 (502) 1 (32) Household survey, GIS data
Neighborhood level variables Floor area ratio 1.80 0.69 0.45 3.45 GIS data
Street configuration (binary) 0.76 0.43 0 (127) 1 (407) GIS data Adjacency to water bodies (binary) 0.55 0.50 0 (242) 1 (292) Household survey,
Google Earth

26
2.4. Results
Multilevel regression results for annual, summer, and winter electricity consumption are
presented in Table 4. In each case, base models (Annual Model 1, Summer Model 1, and Winter
Model 1) only include household-level variables; Annual Model 2, Summer Model 2, and Winter
Model 2 include both household-level variables and neighborhood urban form metrics as
explanatory variables. Based on the chi-square values of the summer and winter electricity
consumption models, the summer electricity consumption models generally have more
explanatory power than the winter models. For the annual models, after the neighborhood urban
form metrics were added, the chi-square value increases from 314.15 to 401.46, which is quite
significant with 3 degrees of freedom. Similar patterns can be found in summer and winter
models: the addition of neighborhood urban form metrics can cause increases to chi-square
values of 92.78 and 54.57 respectively, which are both significant with 3 degrees of freedom.
Overall, the addition of neighborhood urban form metrics can significantly improve model fit for
annual and seasonal electricity consumption models.
Annual Model 3, Summer Model 3, and Winter Model 3 are the extension models with the
interaction terms of neighborhood density and dwelling type added. In Summer Model 3, after
the interaction terms are added, the chi-square values increase from 419.83 to 436.30, which is
significant with 2 degrees of freedom. However, the addition of the same interaction terms would
not improve the overall model fit for either annual or winter models, since the increase of the
chi-square values are not statistically significant at the 0.1 level.

27
Table 4 Annual and seasonal multilevel regression results.
Variable Annual Model 1
Annual Model 2
Annual Model 3
Summer Model 1
Summer Model 2
Summer Model3
Winter Model 1
Winter Model 2
Winter Model 3
Household level variables
Ln(Size of the apartment/house)
0.3207*** (0.0813)
0.3032*** (0.0810)
0.3047*** (0.0810)
0.3220*** (0.0782)
0.3053*** (0.0777)
0.3059*** (0.0719)
0.3625*** (0.1002)
0.3458*** (0.1013)
0.3476*** (0.1014)
Age of the apartment/house
-0.0003 (0.0042)
-0.0002 (0.0038)
-0.0008 (0.0039)
0.0018 (0.0040)
0. 0015 (0.0036)
0. 0009 (0.0037)
-0.0042 (0.0051)
-0.0038 (0.0048)
-0.0044 (0.0049)
Household size
0.1062*** (0.0191)
0.0980*** (0.0190)
0.0970*** (0.0191)
0.0992*** (0.0184)
0.0909*** (0.0183)
0.0891*** (0.0182)
0.1175*** (0.0237)
0.1087*** (0.0236)
0.1079*** (0.0236)
Average age of adults
-0.0049*** (0.0019)
-0.0052*** (0.0018)
-0.0054*** (0.0018)
-0.0058*** (0.0018)
-0.0061*** (0.0018)
-0.0064*** (0.0018)
-0.0049** (0.0023)
-0.0053** (0.0023)
-0.0054** (0.0023)
Income per capita < 3000 RMB
-0.1826*** (0.0552)
-0.1766*** (0.0542)
-0.1826*** (0.0552)
-0.1573*** (0.0533)
-0.1440*** (0.0521)
-0.1480*** (0.0518)
-0.2109*** (0.0683)
-0.2076*** (0.0676)
-0.2090*** (0.0675)
Income per capita > 8000 RMB
0.1196 (0.0798)
0.1406 (0.0786)
0.1208 (0.0807)
0.1201 (0.0771)
0.1376 (0.0757)
0.0964 (0.0775)
0.1071 (0.0989)
0.1337 (0.0979)
0.1193 (0.1007)
Appliance index
0.0387*** (0.0141)
0.0496*** (0.0135)
0.0496*** (0.0135)
0.0417*** (0.0123)
0.0521*** (0.0130)
0.0524*** (0.0130)
0.0362** (0.0166)
0.0468*** (0.0169)
0.0467*** (0.0169)
Electricity conservation index
-0.0273* (0.0136)
-0.0243* (0.0138)
-0.0241* (0.0139)
-0.0205 (0.0136)
-0.0184 (0.0133)
-0.0165 (0.0134)
-0.0371** (0.0174)
-0.0332* (0.0172)
-0.0334* (0.0174)
Homeownership
-0.0482 (0.0818)
-0.0920 (0.0802)
-0.0883 (0.0804)
-0.0553 (0.0789)
-0.0938 (0.0772)
-0.0912 (0.0770)
-0.0224 (0.1012)
-0.0681 (0.1000)
-0.0642 (0.1003)
Tree shade -0.1719*** (0.0687)
-0.1829*** (0.0667)
-0.1796*** (0.0677)
-0.1723*** (0.0661)
-0.1837*** (0.0638)
-0.1754*** (0.0638)
-0.1785*** (0.0847)
-0.1994** (0.0836)
-0.1976** (0.0837)
First floor 0.0997* (0.0543)
0.0924* (0.0539)
0.0938* (0.0538)
0.0140* (0.0525)
0.0079 (0.0519)
0.0098 (0.0517)
0.1817*** (0.0673)
0.1736** (0.0670)
0.1748*** (0.0670)
High floor (floor level >8)
-0.0278 (0.0811)
-0.0323 (0.0797)
-0.0268 (0.0809)
-0.0112 (0.0783)
-0.0151 (0.0767)
-0.0127 (0.0775)
-0.0520 (0.1004)
-0.0539 (0.0994)
-0.0475 (0.1009)
Top floor 0.0400 (0.0715)
0.0286 (0.0718)
0.0304 (0.0723)
0.0370 (0.0690)
0.0264 (0.0691)
0.0352 (0.0695)
0.0430 (0.0885)
0.0242 (0.0894)
0.0243 (0.0902)

28
Tower apartment
0.0018 (0.0689)
0.00247 (0.0645)
0.0817 (0.0689)
-0.0429 (0.0662)
-0.0314 (0.0618)
-0.0249 (0.1646)
-0.0525 (0.0848)
0.0769 (0.0808)
0.1470 (0.2186)
Single-family house
0.6648*** (0.1544)
0.6601** (0.1446)
1.3054** (0.6161)
0.6017*** (0.1486)
0.6041*** (0.1383)
1.8725*** (0.5862)
0.7132*** (0.1902)
0.7006*** (0.1811)
1.1854 (0.7718)
Neighborhood level variables
Floor area ratio
0.0707 (0.0461)
0.0806* (0.0489)
0.0914*** (0.0436)
0.0999** (0.0456)
0.0358 (0.0583)
0.0461 (0.0619)
Street configuration
-0.2519*** (0.0586)
-0.2411*** (0.0590)
-0.2445*** (0.0553)
-0.2244*** (0.0548)
-0.2591*** (0.0742)
-0.2508*** (0.0750)
Adjacency to water bodies
-0.0307 (0.0554)
-0.0307 (0.0556)
-0.0219 (0.0524)
-0.0172 (0.0519)
-0.0624 (0.0699)
-0.06373 (0.0750)
Cross-level interactions
Floor area ratio×Tower apartment
-0.0332 (0.0921)
-0.0052 (0.0873)
-0.0404 (0.1157)
Floor area ratio×Single-family house
-0.8224 (0.7731)
-1.6275** (0.7369)
-0.6114 (0.9675)
Intercept 6.1286*** (0.3803)
6.2439*** (0.3957)
6.2249*** (0.3955)
5.0927*** (0.3661)
5.1643*** (0.3796)
5.1386*** (0.3771)
4.949*** (0.4690)
5.1463*** (0.4947)
5.1290*** (0.4949)
Wald Chi2 314.15*** 401.46*** 405.56***
327.05*** 419.83*** 436.30*** 247.49*** 302.06*** 303.76***
Log
likelihood -333.52 -324.93 -324.31 -314.94 -305.23 -302.81 -447.99 -442.17 -441.91
Degree of
freedom 16 19 21 16 19 21 16 19 21
Groups 46 46 46 46 46 46 46 46 46
Notes: 1) Standard errors in parentheses. 2)*p<0.10, * *p<0.05, ***p<0.01.

29
The regression results reveal the effects of neighborhood urban form variables on
residential electricity consumption. When other important covariates have been controlled for,
floor area ratio, which measures the physical density of residential neighborhoods, does not
appear to have a significant effect on annual electricity consumption (p>0.1 in Annual Model 2).
However, the positive effect becomes significant when I modeled the effect of floor area ratio on
summer electricity consumption (p<0.01). This is consistent with what might be expected in the
context of an exacerbated heat island effect in the summer. Additionally, the regression results of
Winter Model 2 show no statistically significant association between neighborhood density and
winter electricity consumption, which is consistent with the results from an existing study by
Wilson (Wilson 2013). As was previously stated, I also hypothesized that neighborhood density
has different effects on households located in different types of dwelling units. In Summer
Model 3, I find evidence of a significant negative interaction between floor area ratio and the
single-family house binary variable. Interestingly, when this interaction is accounted for, the
effect of neighborhood density on summer electricity use becomes negative and significant,
which indicates higher densities can somehow reduce electricity consumption for families in
single-family houses; this statistically significant negative effect of neighborhood density on
electricity consumption for single-family homes only exists in summer months.
Street configuration has a significant effect on annual, summer, and winter electricity
usage, which is consistent with existing studies and theories indicating that east-west street
orientation is more energy efficient since it results in more south-facing buildings with greater
passive solar gains (Erley and Jaffe 1979; Robinette 1983; Shishegar 2013; Ko 2013; Ko and
Radke 2014). Additionally, based on our regression results, there exists no statistically
significant relationship between a neighborhood’s adjacency to rivers and electricity

30
consumption in the households, as the adjacency variable is not significant in any of these
models; this is consistent with Ko & Radke’s results (Ko and Radke 2014).
Among household-level urban form variables, tree shading appears to have a statistically
significant impact on household electricity consumption. When controlled for other variables,
homes with tree shading are associated with lower electricity consumption in summer months;
this effect is also significant in winter month, most likely because trees located near housing
units block winds during the winter, thus reducing indoor heating energy consumption. Dwelling
type is a statistically significant predictor of household electricity consumption, as our regression
results for annual, summer, and winter electricity consumption all indicate that homes located in
single-family houses are likely to consume more electricity than homes located in slab
apartments. Our results also indicate that, while other important covariates are controlled for,
there are no statistically significant differences in electricity consumption between homes located
in tower apartments and slab apartments.
In addition to urban form variables, the size of the apartments/houses, household sizes,
average ages of adults, income levels, and the number of household electricity-intensive
appliances are also significant predictors of household electricity consumption, which is
consistent with existing theory. Our results also suggest that the size of apartments/houses and
household sizes are dominant factors influencing household electricity consumption, which is
similar to existing findings in different geographic contexts (Esmaeilimoakher et al. 2016;
Wilson 2013). In contrast, ages of apartments/houses and homeownership do not exhibit a
significant association with annual, summer, or winter electricity consumption, as is indicated in
our regression results. Interestingly, our results indicate that low-income households with
monthly per capita incomes less than 3000 RMB consume less electricity than their counterparts
31
in the medium income category, which is statistically significant and consistent in both winter
and summer months. However, there are no significant differences in electricity consumption
between the households in the high-income category with monthly per capita incomes greater
than 8000 RMB and those in the medium-income category. Additionally, there are no
statistically significant differences in electricity consumption among households located on
middle floors (floor level 2-8), those on high floors (floor level >8), or those on the top floor.
However, I do find evidence that households on the first floor may consume more electricity,
especially in winter months, which might result from limited solar access in winter months.
2.5. Discussion
The results of this study suggest clear effects of neighborhood-level urban form,
especially physical density measured by floor area ratio, on household electricity consumption. It
is interesting to note that the effect of neighborhood density on energy consumption may be
completely different in different seasons and (or) for households located in different types of
dwelling units. Our multi-level regression results suggest a positive relationship between density
(floor area ratio) at the neighborhood-level and summer electricity consumption, which supports
the theory that denser built environments significantly contribute to the heat island effect
(Giridharan, Ganesan, and Lau 2004; B Chun and Guldmann 2014; Tran et al. 2017). However,
the significant positive effect of density only exists for households located in slab and tower
apartments, which makes sense because slab and tower apartment are located in dense urban
neighborhoods. Thus, increasing physical density can exacerbate the heat island effect in these
neighborhoods, which in turn increases household cooling energy demands in the summer. On
the other hand, when it comes to single-family houses, the effect of physical density on
household electricity consumption during the summer becomes negative, which is still consistent

32
with the results of previous studies in the United States which are composed of single-family
houses (Stone and Norman 2006; Wilson 2013). Based on these studies, the hypothesized link
between density and electricity consumption is explained through a different mechanism in low-
density neighborhoods with single-family houses: Stone and Norman (Stone and Norman 2006)
claim that urban residential development with lower densities contribute more surface energy to
the formation of the heat island effect than higher density residential developments, since larger
lawns associated with low-density residential development are a significant contributor to
surface heating. Additionally, higher physical densities also contribute to more mutual shading
between buildings, which is a very important factor during the summer in terms of reducing
household energy consumption for single-family houses (Laura et al. 2012; Shaviv and Yezioro
1997). It is also worthwhile to note that I did not find any significant effect of neighborhood
density on household electricity consumption during winter months, which is consistent with the
results of Wilson’s study (Wilson 2013), even though electricity is the primary source for heating
homes in Ningbo. This might stems from the possible trade-offs of density effects of building
cooling energy demands: on the one hand, neighborhood with higher density has been associated
with lower thermal losses in winter months (Ewing and Rong 2008), which can in turn reduce
the heating loads in buildings; on the other hand, denser neighborhoods also suffer from less
solar gains in winter months.
According to our regression results, building age does not significantly influence
residential household electricity consumption; this result might stem from most of the
households I surveyed living in apartments that were built after China’s housing reform; since
that time, there have been very limited differences in insulation across new buildings.
Additionally, there exists no significant difference in electricity consumption for households
33
located in slab and tower apartments, which are the two dominant dwelling types in Chinese
cities; the effect of dwelling types on residential electricity consumption is lower compared to
the findings of previous studies. These findings may indicate that, because of unique features
associated with building age and dwelling type in Chinese cities, the effects of building
characteristics on residential energy consumption might be less noticeable in China, comparing
with findings from previous studies in other countries.
Furthermore, in contrast with existing research, the average age of adults is found to have
a negative relationship with household electricity consumption. This finding is consistent with
more nuanced results from studies about occupant electricity consumption behavior in Chinese
cities, which reveal that older occupants exhibit a more frugal behavior than their younger
counterparts (Chen, Wang, and Steemers 2013).
2.6. Conclusions
This study uses a unique dataset to examine the impact of urban form on residential
electricity consumption in Ningbo, China. The results suggest a clear role of urban form metrics
in affecting residential electricity consumption. In our sample mainly composed of apartment
homes, neighborhood density is positively associated household electricity consumption in
summer, while controlling for other important demographic, socioeconomic, behavior, and
property covariates. An important finding of this study is that, the effects of neighborhood
density on residential electricity are different in different seasons, and (or) for households located
in different types of buildings: neighborhood density could significant influence household
electricity consumption in summer, while I do not find any linkages between neighborhood
density and household electricity in winter. For households located in slab and tower apartments
34
in high-density neighborhoods, there exists a positive relationship between neighborhood density
and electricity consumption in summer, since increasing physical density would cause
exacerbated heat island effect in these neighborhoods. However, for single-family houses located
in low-density neighborhoods, increasing neighborhood density could significantly reduce
residential electricity consumption in summer, which is associated with less exposed surface,
reduced surface heating, and more mutual shading. Therefore, the urban form effects on
residential consumption should be distinctly considered for different seasons, and for different
types of housing stock and neighborhoods. In terms of controlling residential energy
consumption through the lens of urban form, heat island mitigation strategies might be very
important for Chinese residential neighborhoods in summer, which are mainly composed of slab
and tower apartments, with dense urban form. In addition, this study also reiterates the
importance of neighborhood street configuration (building orientation), tree shade in controlling
residential electricity consumption, and by extension, greenhouse gas emissions. The results of
this study could also help urban planners and policy makers to think more critically about
energy-efficient neighborhoods, in a developing country context.
35
REFERENCES
Anderson, W P, S K Pavlos, and J M Eric. 1996. “Urban Form , Energy and the Environm : A Review of Issues , Evidence and Policy.” Urban Studies 33(1): 7–35.
Ballas, D., and M. Tranmer. 2012. “Happy People or Happy Places? A Multilevel Modeling Approach to the Analysis of Happiness and Well-Being.” International Regional Science Review 35 (1): 70–102.
Banister, D, S Watson, and C Wood. 1997. “Sustainable Cities: Transport, Energy, and Urban Form.” Environment and Planning B-Planning & Design 24 (1): 125–143.
Camagni, R, M. Cristina, and P. Rigamonti. 2002. “Urban Mobility and Urban Form: The Social and Environmental Costs of Different Patterns of Urban Expansion.” Ecological economics 40: 199–216.
Chen, J., X. Wang, and K. Steemers. 2013. “A Statistical Analysis of a Residential Energy Consumption Survey Study in Hangzhou, China.” Energy and Buildings 66: 193–202.
Chun, B., and J. M. Guldmann. 2014. “Spatial Statistical Analysis and Simulation of the Urban Heat Island in High-Density Central Cities.” Landscape and Urban Planning 125: 76–88.
Chun, B., and S. Guhathakurta. 2015. “Daytime and Nighttime Urban Heat Islands Statistical Models for Atlanta.” Environment and Planning B: Planning and Design 44(2): 308–327.
Erley, D, and M Jaffe. 1979. Site Planning for Solar Access: A Guidebook for Residential Developers and
Site Planners. Washington, DC.
Esmaeilimoakher, P., T. Urmee, T. Pryor, and G. Baverstock. 2016. “Identifying the Determinants of Residential Electricity Consumption for Social Housing in Perth, Western Australia.” Energy and
Buildings 133, 403-413.
Ewing, R., and R. Cervero. 2001. “Travel and the Built Environment: A Synthesis.” Transportation
Research Record 1780: 87–114.
Ewing, R., and F. Rong. 2008. “The Impact of Urban Form on U.S. Residential Energy Use.” Housing
Policy Debate 19 (1): 1–30.
Faul, F., E. Erdfelder, A. Buchner, and A. Lang. 2009. “Statistical Power Analyses Using G*Power 3.1: Tests for Correlation and Regression Analyses.” Behavior Research Methods 41 (4): 1149–1160.
Ferhat, S., and M. Boutrahi. 2014. “The Residential Built Heritage of Algiers and Its Energy Behaviour: Case Study of the Building Number 3 Flats of the Aero-Habitat District.” WIT Transactions on
Ecology and the Environment 186: 39–53.
Giridharan, R., S. Ganesan, and S.S.Y. Lau. 2004. “Daytime Urban Heat Island Effect in High-Rise and High-Density Residential Developments in Hong Kong” Energy and Buildings 36 (6): 525–534.
Gorman, G., and J. Dajani. 1973. “Energy, Urban Form and Transportation Policy.” Transportation
Research 8 (4–5): 267–276.
Holden, E., and I. Norland. 2005. “Three Challenges for the Compact City as a Sustainable Urban Form:
36
Household Consumption of Energy and Transport in Eight Residential Areas in the Greater Oslo Region.” Urban Studies 42 (12): 2145–2166.
IPART. 2011. Determinants of Residential Energy and Water Consumption in Sydney and Surrounds:
Regression Analysis of the 2008 and 2010 IPART Household Survey Data. Sydney, NSW Australia.
Kaza, N. 2010. “Understanding the Spectrum of Residential Energy Consumption: A Quantile Regression Approach.” Energy Policy 38 (11): 6574–6585.
Kennedy, C., J. Steinberger, B. Gasson, Y. Hansen, T. Hillman, M. Havranek, D. Pataki, A. Phdungsilp, A. Ramaswami, and G. V. Mendez. 2009. “Greenhouse Gas Emissions from Global Cities.” Environmental Science & Technology 43 (19): 7297–7302.
Ko, Y. 2013. “Urban Form and Residential Energy Use: A Review of Design Principles and Research Findings.” Journal of Planning Literature 28 (4): 327–351.
Ko, Y, and J. D. Radke. 2014. “The Effect of Urban Form and Residential Cooling Energy Use in Sacramento, California.” Environment and Planning B: Planning and Design 41 (4): 573–593.
Laura, A., J. E. Taylor, X. Xu, and F. Cotana. 2012. “Inter-Building Effect : Simulating the Impact of a Network of Buildings on the Accuracy of Building Energy Performance Predictions.” Building and
Environment 58: 37–45.
Lee, S., and B. Lee. 2014. “The Influence of Urban Form on GHG Emissions in the U.S. Household Sector.” Energy Policy 68: 534–549.
Min, J., Z. Hausfather, and Q. Lin. 2010. “A High-Resolution Statistical Model of Residential Energy End Use Characteristics for the United States” 14 (5): 791–807.
Mindali, O., A. Raveh, and I. Salomon. 2004. “Urban Density and Energy Consumption: A New Look at Old Statistics.” Transportation Research Part A: Policy and Practice 38 (2): 143–162.
National Bureau of Statistics of China. 2015. China Statistical Yearbook 2014. Beijing: China Statistics Press.
Ndiaye, D., and K. Gabriel. 2011. “Principal Component Analysis of the Electricity Consumption in Residential Dwellings.” Energy and Buildings 43 (2–3): 446–453.
Norman, J., H. L. Maclean, M. Asce, and C. A. Kennedy. 2006. “Comparing High and Low Residential Density : Life-Cycle Analysis of Energy Use and Greenhouse Gas Emissions.” Journal of urban
planning and development 132(1): 10-21.
Orford, S. 2000. “Modelling Spatial Structures in Local Housing Market Dynamics: A Multilevel Perspective.” Urban Studies 37 (9): 1643–1671.
Ouyang, J., C. Wang, H. Li, and K. Hokao. 2011. “A Methodology for Energy-Efficient Renovation of Existing Residential Buildings in China and Case Study.” Energy and Buildings 43 (9): 2203–2210.
Perez-Lombard, L., J. Ortiz, and C. Pout. 2008. “A Review on Buildings Energy Consumption Information.” Energy and Buildings 40 (3): 394–398.
Quan, S. J., Q. Li., G. Augenbroe, J. Brown, and P. P. Yang. 2015. “Urban Data and Building Energy

37
Modeling : A GIS-Based Urban Building Energy Modeling System Using the Urban-EPC Engine.” In Planning Support Systems and Smart Cities, edited by Stan Geertman, Joseph Jr Ferreira, Goodspeed Robert, and John Stillwell, 447–469. Cham, Switzerland: Springer International Publishing.
Randolph, J. 2008. “Comment on Reid Ewing and Fan Rong’s “The Impact of Urban Form on U.S. Residential Energy Use.” Housinf Policy Debate 19 (1): 45.
Raudenbush, S. W., and A. S. Bryk. 2002. Hierarchical Linear Models: Applications and Data Analysis
Methods. Vol. 1. Sage Publications.
Robinette, G.O. 1983. Energy Efficiency Site Design. New York: Van Nostrand Reinhold.
Rode, P., C. Keim, G. Robazza, P. Viejo, and J. Schofield. 2014. “Cities and Energy: Urban Morphology and Residential Heat-Energy Demand.” Environment and Planning B: Planning and Design 41 (1): 138–162.
Romanos, M. C. 1978. “Energy-Price Effects on Metropolitan Spatial Structure and Form.” Environment
and Planning A 10 (1): 93–104.
Shaviv, E., and A. Yezioro. 1997. “Analyzing Mutual Shading among Buildings.” Solar Energy 59 (1–3): 83–88.
Shishegar, N. 2013. “Street Design and Urban Microclimate: Analyzing the Effects of Street Geometry and Orientation on Airflowand Solar Access in Urban Canyons.” Journal of Clean Energy
Technologies, 52–56.
Silva, M., V. Oliveira, and V. Leal. 2017. “Urban Form and Energy Demand.” Journal of Planning
Literature. doi:10.1177/0885412217706900.
Steemers, K. 2003. “Energy and the City: Density, Buildings and Transport.” Energy and Buildings 35 (1): 3–14.
Steenbergen, M. R., and B. S. Jones. 2002. “Modeling Multilevel Data Structures.” American Journal of
Political Science 46 (1): 218.
Stone, B., and J. M. Norman. 2006. “Land Use Planning and Surface Heat Island Formation: A Parcel-Based Radiation Flux Approach.” Atmospheric Environment 40 (19): 3561–3573.
Stone, B., and M. O. Rodgers. 2001. “Urban Form and Thermal Efficiency: How the Design of Cities Influences the Urban Heat Island Effect.” Journal of the American Planning Association 67 (2): 186–198.
Swan, L. G., and V. I. Ugursal. 2009. “Modeling of End-Use Energy Consumption in the Residential Sector : A Review of Modeling Techniques” 13: 1819–1835.
Taha, H. 1997. “Urban Climates and Heat Islands: Albedo, Evapotranspiration, and Anthropogenic Heat.” Energy and buildings 25 (96): 99–103.
Tran, D. X., F. Pla, P. Latorre-carmona, S. W. Myint, M. Caetano, and H. V. Kieu. 2017. “Characterizing the Relationship between Land Use Land Cover Change and Land Surface Temperature.” ISPRS

38
Journal of Photogrammetry and Remote Sensing 124. International Society for Photogrammetry and Remote Sensing, Inc. (ISPRS): 119–132.
Wilson, Bev. 2013. “Urban Form and Residential Electricity Consumption: Evidence from Illinois, USA.” Landscape and Urban Planning 115: 62–71.
Yang, T., and X. Zhang. 2016. “Benchmarking the Building Energy Consumption and Solar Energy Trade-Offs of Residential Neighborhoods on Chongming Eco-Island, China.” Applied Energy 180: 792–799.
Zhang, S., Y. Wu, H. Liu, R. Huang, P. Un, Y. Zhou, L. Fu, and J. Hao. 2014. “Real-World Fuel Consumption and CO2 (Carbon Dioxide) Emissions by Driving Conditions for Light-Duty Passenger Vehicles in China.” Energy 69: 247–257.
Zhao, X., N. Li, and C. Ma. 2012. “Residential Energy Consumption in Urban China: A Decomposition Analysis.” Energy Policy 41: 644–653.
Zheng, X., C. Wei, P. Qin, J. Guo, Y. Yu, F. Song, and Z. Chen. 2014. “Characteristics of Residential Energy Consumption in China: Findings from a Household Survey.” Energy Policy 75: 126–135.
39
CHAPTER 3. EXPLAINING SPATIAL VARIATIONS IN RESIDENTIAL ENERGY
USAGE INTENSITY IN CHICAGO: THE ROLE OF URBAN FORM AND
GEOMORPHOMETRY
3.1. Introduction
It is well established that energy use in buildings is one of the major sources of
greenhouse gas (GHG) emissions from cities, and most of the emissions are from building
operations (Roaf, Norman, MacLean, and Kennedy 2006; Perez-Lombard, Ortiz and Pout 2008;
Swan and Ugursal 2009). In developed countries, energy consumption in buildings has exceeded
other major sectors such transportation and as industrial use (Pe´rez-Lombard, Ortiz, and Pout
2008). For instance, in the United States, 40% of total energy is consumed in residential and
commercial buildings (21% for residential and 19% for commercial); the building sector has
become the largest energy consumption sector (EIA 2015). Meanwhile, there has been a growing
interest in the sustainability of energy resources in major metropolitan areas throughout the
world. Although building energy efficiency and renewable energy polices at metropolitan level
are pervasive across the United States and are somewhat effective to date, opportunities of future
energy efficiency may be enhanced, if the spatial and urban form dimensions of the new
developments are also considered.
Previous studies on building energy consumption by planning scholars mainly focus on
the effects of occupant behavior (e.g., Lutzenhiser. et al. 2012), adoption of energy-efficient
technologies (e.g., Andrews and Krogmann 2009; Lutzenhiser. et al. 2012), specific city-level
policies on building energy efficiency, such as benchmarking policy (e.g., Hsu 2014), as well as
urban form and development patterns (Ewing and Rong 2008; Wilson 2013; Ko and Radke 2014;

40
Li, Song, and Kaza 2018). A less studied area of urban building energy consumption is how
building energy usage intensity (EUI) pattern vary spatially and how this variation are associated
with demographic, scio-economic, structural, as well as urban form and geomorphometry10
factors. Additionally, identifying factors affecting residential energy consumption at
neighborhood level would potentially provide spatially targeted residential energy management
and efficiency policy, which can be coordinated with urban land-use planning and design.
The purpose of this paper is to explore the spatial complexity of residential EUI at the
neighborhood scale, so as to shed light on the role of urban form and geomorphometry on
residential energy efficiency. I first review current literature on factors affecting residential
energy consumption, especially urban form and geomorphometry relevant determinants. I
present our data collection and coding, urban form and geomorphometry measures, as well as
spatial regression methods. I then present the results for the study area in Chicago and set these
in the context of existing literature. In addition, I discuss the limitations of this study. Finally, I
conclude with potential policy implications.
3.2. Prior research
There has been a high degree of consensus among existing studies on disaggregated
residential energy consumption studies that larger housing units, in terms of floor area or
volume, consume more energy. This is consistent for both heating and cooling (Kavousian et al.
2012; Mardookhy at al. 2013; Filippin et al. 2013; Hamidi and Ewing 2012; Kaza 2010;
MacDonald and Livengood 2000). Housing type also plays an important role, as detached single-
family units tend to consume more energy than attached multi-family units (Jones et al. 2015;
10 Geomorphometry refers to land surface analysis by extracting surface parameters and objects. This study specifically uses three-dimensional building data and existing digital elevation model to explore the factors affecting urban solar radiation and microclimate (e.g., urban heat island effect).
41
Kaza 2010; Min et al. 2010). In addition, older, poorly insulated dwelling units generally
consume more (Hamidi and Ewing 2012; Min et al. 2010; Chen at al. 2012; Mardookhy et al.
2013; Tiedeman 2007; Belzer and Cohort 2005; Catalina et al. 2008; Filippin et al. 2013).
Besides physical characteristics, demographic correlates of building energy consumption include
income, tenure type, household size, existing of older residents, etc. (Jones et al. 2015; Hamidi
and Ewing 2010; Chen et al. 2013).
Previously, there have been relatively limited studies on the relationship between urban
density and building energy consumption since datasets to comprehensively study this
relationship are not available. Larivière and Lafrance (1999) model the relationship between
annual electricity consumption per capita and urban density using a sample at city level. The
authors conclude that cities with higher density use less electricity per capita. However, the
effect of population density on electricity consumption is less significant than that on gasoline
consumption (Larivière and Lafrance 1999), since there are other important factors at city level,
other than density, determine electricity consumption at city level. Cooper et al. (2001) examine
the tradeoffs of densification for both stationary (residential) and mobile (transportation) energy
use in Belfast and find that corridor-based densification land use policy can achieve significant
reductions in mobile energy consumption and modest reductions in stationary energy usage
linked to residential lay-out design. A widely cited study by (Holden and Norland 2005) finds
that housing density in residential area is negatively associated with household energy
consumption in eight residential areas in Greater Oslo Region, while controlling other important
covariates including housing type. Another interesting finding of this study is the difference in
energy consumption between single-family and multifamily housing units built after 1980 is
reduced.
42
In recent years, researchers are increasingly interested in evaluate how various urban
form elements affect residential energy consumption (Ko and Radke 2014; Wilson 2013; Ko
2013; Lee and Lee 2014; C Li, Song, and Kaza 2018; Chen, Matsuoka, and Liang 2017); most of
these studies suggest that urban form and surrounding land use play a moderate but important
role in influencing building energy consumption (Hsu et al. 2017; Steemers 2003; Li, Song, and
Kaza 2018). These studies have identified urban form features of residential developments, such
as neighborhood density, green space, tree canopy, street configuration, and street aspect ratio11
are closely related to household energy consumption (Ko and Radke 2014; Wilson 2013; Ko
2013; Lee and Lee 2014; Li, Song, and Kaza 2018; Chen, Matsuoka, and Liang 2017). The most
consistent connection between land use features and building energy consumption in the
literature is the presence of urban green space. Relevant studies also documented the positive
benefits of urban parks and gardens on urban temperatures, as well as heat island effects (Bowler
et al. 2010; Huang et al. 2008; Steeneveld et al. 2011) and building energy efficiency (Ca et al.
1998; Wong et al. 2011; Ko 2013). Some existing studies has identified the macro-level urban
form, such as density and compactness, are often associated with lower heating loads in winter
for buildings (Høyer and Holden 2003; Rode et al. 2014). Chen et al. (2017) suggest buildings in
a subtropical climate should be clustered to maximize the inter-building shadows, while
increasing non-built land use percentages in the adjacent areas, so as to reduce household energy
usage. Additionally, Kaza (2010), Hsu et al. (2017), Kontokosta (2015), and Scofield (2014)
have noticed that a key variable that is missing from existing energy consumption models is solar
insolation for buildings.
11 Aspect ratio is also referred to as H/W ratio. It measures the important geometrical detail about a street canyon, which is calculated as canyon height (H) divided by canyon width (W).
43
Despite the resurgence in research attention that is now devoted to the relationship
between urban form and building energy consumption, this relationship is still not very clear.
Existing research mainly focus on electricity consumption (Jones, Fuertes, and Lomas 2015; Ko
and Radke 2014; Wilson 2013; Li, Song, and Kaza 2018); there has been few studies exploring
the natural gas consumption in winter, which is mainly used for housing heating. Moreover, most
previous studies have ignored potential spatial autocorrelation between building energy
consumption of different neighborhoods (e.g., Chen et al., 2017). Factors that affect sub-
municipal variations in residential EUI are not well established. In addition, there have been few
studies analyzing the effects of building energy consumption by using urban geomorphometry,
which has already identified in previous literature to be a significant determinate of solar
insolation and natural ventilation (Coseo 2013; Chun and Guldmann 2014; Shi, Katzschner, and
Ng 2018; Nakata-Osaki, Souza, and Rodrigues 2018). Further studies are needed to exam to net
effects of solar radiation, heat island effects, and neighborhood ventilation (Ko 2013; Li, Song,
and Kaza 2018; Chen, Matsuoka, and Liang 2017).
Therefore, the purpose of our study is to advance the empirical understanding of how
urban form and geomorphometry shapes residential EUI. I attempt to explain the spatial
variations in residential electricity and gas EUI in terms of urban radiation intensity,
neighborhood ventilation, vegetation density, and associated urban heat island effects after
controlling for socioeconomic and demographic factors, housing type, and building
characteristics. Based on monthly energy usage data for different energy sources, three-
dimensional building dataset, Digital Elevation Model (DEM), Landsat TM satellite image, and
U.S. Census demographic information, I attempt to single out the importance of urban form and
geomorphometry in understanding energy usage patterns. Our study also aims to better

44
understand the other spatial determinants of tract-level residential energy consumption patterns
and to elucidate spatially explicit energy efficiency strategies.
3.3. Data and methods
3.3.1. EUI data
I obtained monthly breakdown of energy consumption data for the year 2010 form
Chicago City Data Portal12. The initial dataset contains 67,051 records grouped at census block
level including several different types of energy users (e.g., single-family, multi-family,
industrial, commercial, and municipal users), I only extracted information on energy usage for
residential use, I then aggregated annual and seasonal electricity consumption and gas
consumption data to census tracts. I aggregated the energy consumption data to census tract level
since this approach would provide a continuous surface to evaluate the spatial variations of
energy consumption intensity across the city (Chang, Parandvash, and Shandas 2010).
Additionally, I am able to integrate several important variables such as income, housing
characteristics and occupancy, which can be gathered at this level from U.S. census. It is also
worthwhile to mention that, the residential electricity in Chicago is solely provided by ComEd
with a consistent pricing scheme across the city; moreover, natural gas data from Natural Gas by
Accenture comprises 81% of all gas consumption in Chicago for 2010, also with consistent rates.
Thus, I did not consider energy price as a factor that causes spatial variations in electricity/gas
12The dataset can be downloaded at https://data.cityofchicago.org/Environment-Sustainable-Development/Energy-Usage-2010/8yq3-m6wp/data. Displays several units of energy consumption for households, businesses, and industries in the City of Chicago during 2010. The actual electricity and natural gas consumption data was aggregated from ComEd and Peoples Natural Gas by Accenture. Electrical and gas usage data comprises 88 percent of Chicago's buildings in 2010. The electricity data comprises 68 percent of overall electrical usage in the city while gas data comprises 81 percent of all gas consumption in Chicago for 2010. This dataset also contains selected variables describing selected characteristics of the Census block population, physical housing, and occupancy.
45
consumption across the city. The response variables of interest in this study include annual
electricity EUI, summer electricity EUI, and winter gas EUI13.
3.3.2. Urban form and geomorphometry measures
As mentioned in the previous section, although existing studies have revealed the
apparent relationship between urban geomorphometry variables (e.g., roughness length) and
solar insolation and mircoclimate (Gál and Unger 2009; Burghardt 2014; P. Coseo and Larsen
2014; Chun and Guhathakurta 2015; B. Chun and Guldmann 2014), few has extend this
relationship to building energy consumption. In this study, I attempt to examine this linkage by
including three variables that measure urban porosity, wind circulation, and solar insolation
respectively by using three-dimensional urban data.
The first geomorphometry variable is urban porosity, which is defined as the ratio
quantifying the open air volume in urban canopy layer. I constructed a 3D building database
using data from Chicago City Data Portal and Open Street Map and calculated this variable using
a GIS extension in ArcGIS10.5 (Burghardt 2014). The equation defining urban porosity is
(Burghardt 2014; Gál and Unger 2009):
Ph-var= (AThUCL-VB)/AThUCL
Where Ph-var is the urban porosity index, hUCL is the height of the urban canopy layer, AT
is total plot area. Then the average value for Ph-var is calculated for each census tract in our
sample.
The second geomorphometry variable I included in this study is roughness length, which
13 I only include winter gas EUI variable for gas consumption because residential gas in Chicago is mainly used for heating; In summer the EUI is quite low and annual EUI very close to winter EUI. I do not include winter electricity EUI since it is not mainly used for heating, thus I cannot effectively evaluate the role of urban from and geomorphometry in influencing EUI.

46
is widely used in urban climate studies measuring wind circulation of the 3D shape of urban
environment (Shi, Katzschner, and Ng 2017). Generally, a higher roughness length value
indicates lower wind speed (Burghardt, 2014; Gál and Unger, 2009). Similar to urban porosity
index, I calculated the roughness length index using a GIS extension in ArcGIS10.514(Burghardt
2014). The roughness length is computed as follows:
Z0 = (h-Zd) exp (- 0.4 / λF )
Zd = h (λp)0.6
λF = AF / AT
Where Z0 is the roughness length index, λF is frontal area ratio, which is measured as
the proportion of total frontal area of buildings inside plot area (AF) of the total plot area (AT).
Zd is zero-plane displacement height, which is calculated using building coverage ratio ( λp)
and volumetrically averaged building height.
Another geomorphometry variable I used in this study is solar insolation intensity (Hsu et
al. 2017) . This variable was calculated using area radiation analysis tool in ArcGIS10.5 solar
radiation toolbox. I created a building height raster data of Chicago15 and joined it to the digital
elevation model (DEM) of Cook County from U.S. Geological Survey and used the newly
generated DEM to calculate the area solar radiation in summer, winter, and the whole year. Then
I extract the residential land from the radiation map output by using the land use inventory from
14 It is worthwhile to note that the roughness length index should be calculated with a wind direction defined. I calculated this index using eight cardinal and ordinal directions. I got the roughness length index for each plot by averaging the value for each direction using equal weights and calculated the mean value for each census tract. 15 The building height raster data was created using the 3D building database complied form Chicago City Data Portal and Open Street Map.
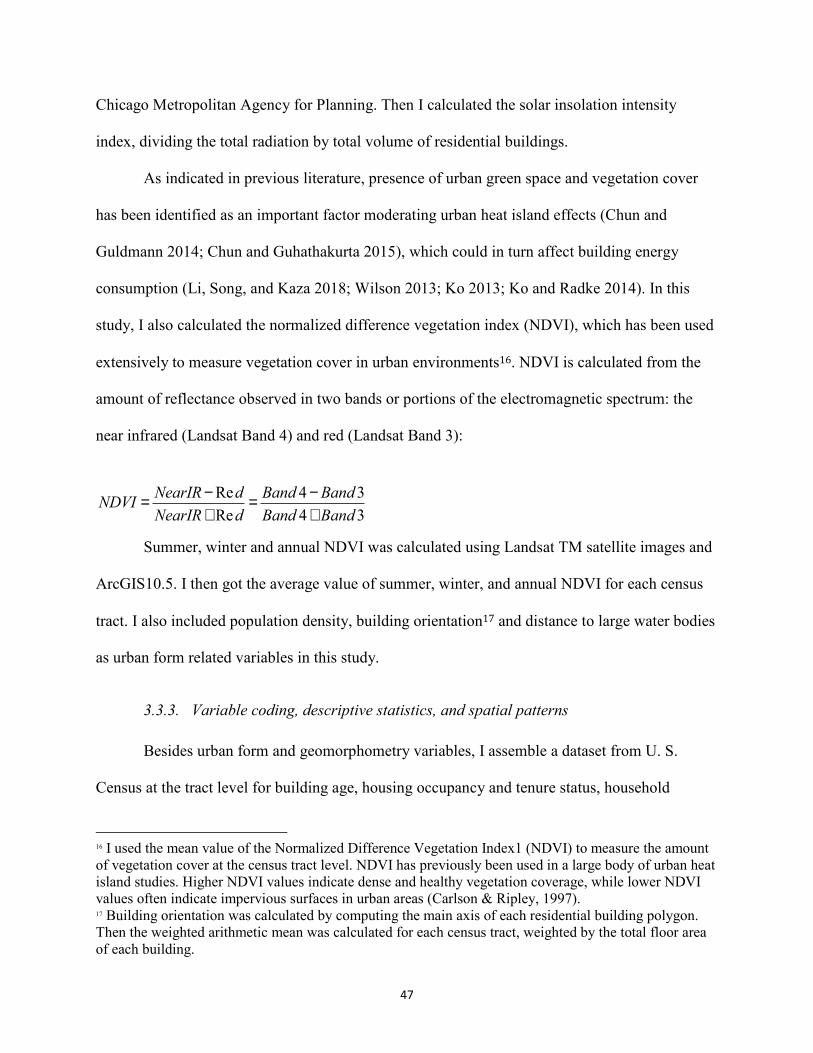
47
Chicago Metropolitan Agency for Planning. Then I calculated the solar insolation intensity
index, dividing the total radiation by total volume of residential buildings.
As indicated in previous literature, presence of urban green space and vegetation cover
has been identified as an important factor moderating urban heat island effects (Chun and
Guldmann 2014; Chun and Guhathakurta 2015), which could in turn affect building energy
consumption (Li, Song, and Kaza 2018; Wilson 2013; Ko 2013; Ko and Radke 2014). In this
study, I also calculated the normalized difference vegetation index (NDVI), which has been used
extensively to measure vegetation cover in urban environments16. NDVI is calculated from the
amount of reflectance observed in two bands or portions of the electromagnetic spectrum: the
near infrared (Landsat Band 4) and red (Landsat Band 3):
Summer, winter and annual NDVI was calculated using Landsat TM satellite images and
ArcGIS10.5. I then got the average value of summer, winter, and annual NDVI for each census
tract. I also included population density, building orientation17 and distance to large water bodies
as urban form related variables in this study.
3.3.3. Variable coding, descriptive statistics, and spatial patterns
Besides urban form and geomorphometry variables, I assemble a dataset from U. S.
Census at the tract level for building age, housing occupancy and tenure status, household
16 I used the mean value of the Normalized Difference Vegetation Index1 (NDVI) to measure the amount of vegetation cover at the census tract level. NDVI has previously been used in a large body of urban heat island studies. Higher NDVI values indicate dense and healthy vegetation coverage, while lower NDVI values often indicate impervious surfaces in urban areas (Carlson & Ripley, 1997). 17 Building orientation was calculated by computing the main axis of each residential building polygon. Then the weighted arithmetic mean was calculated for each census tract, weighted by the total floor area of each building.
NDVI = NearIR − Red
NearIR + Red= Band 4 − Band 3
Band 4 + Band 3
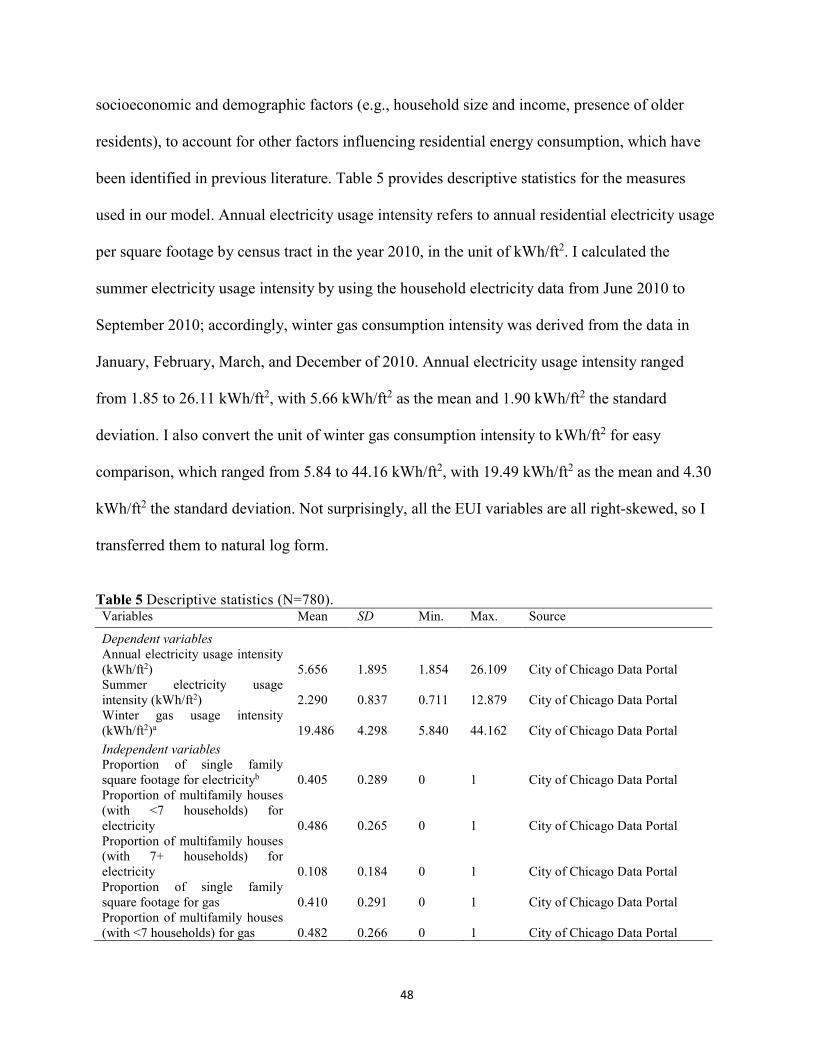
48
socioeconomic and demographic factors (e.g., household size and income, presence of older
residents), to account for other factors influencing residential energy consumption, which have
been identified in previous literature. Table 5 provides descriptive statistics for the measures
used in our model. Annual electricity usage intensity refers to annual residential electricity usage
per square footage by census tract in the year 2010, in the unit of kWh/ft2. I calculated the
summer electricity usage intensity by using the household electricity data from June 2010 to
September 2010; accordingly, winter gas consumption intensity was derived from the data in
January, February, March, and December of 2010. Annual electricity usage intensity ranged
from 1.85 to 26.11 kWh/ft2, with 5.66 kWh/ft2 as the mean and 1.90 kWh/ft2 the standard
deviation. I also convert the unit of winter gas consumption intensity to kWh/ft2 for easy
comparison, which ranged from 5.84 to 44.16 kWh/ft2, with 19.49 kWh/ft2 as the mean and 4.30
kWh/ft2 the standard deviation. Not surprisingly, all the EUI variables are all right-skewed, so I
transferred them to natural log form.
Table 5 Descriptive statistics (N=780). Variables Mean SD Min. Max. Source
Dependent variables
Annual electricity usage intensity (kWh/ft2) 5.656 1.895 1.854 26.109 City of Chicago Data Portal Summer electricity usage intensity (kWh/ft2) 2.290 0.837 0.711 12.879 City of Chicago Data Portal Winter gas usage intensity (kWh/ft2)a 19.486 4.298 5.840 44.162 City of Chicago Data Portal
Independent variables Proportion of single family square footage for electricityb 0.405 0.289 0 1 City of Chicago Data Portal Proportion of multifamily houses (with <7 households) for electricity 0.486 0.265 0 1 City of Chicago Data Portal Proportion of multifamily houses (with 7+ households) for electricity 0.108 0.184 0 1 City of Chicago Data Portal Proportion of single family square footage for gas 0.410 0.291 0 1 City of Chicago Data Portal Proportion of multifamily houses (with <7 households) for gas 0.482 0.266 0 1 City of Chicago Data Portal
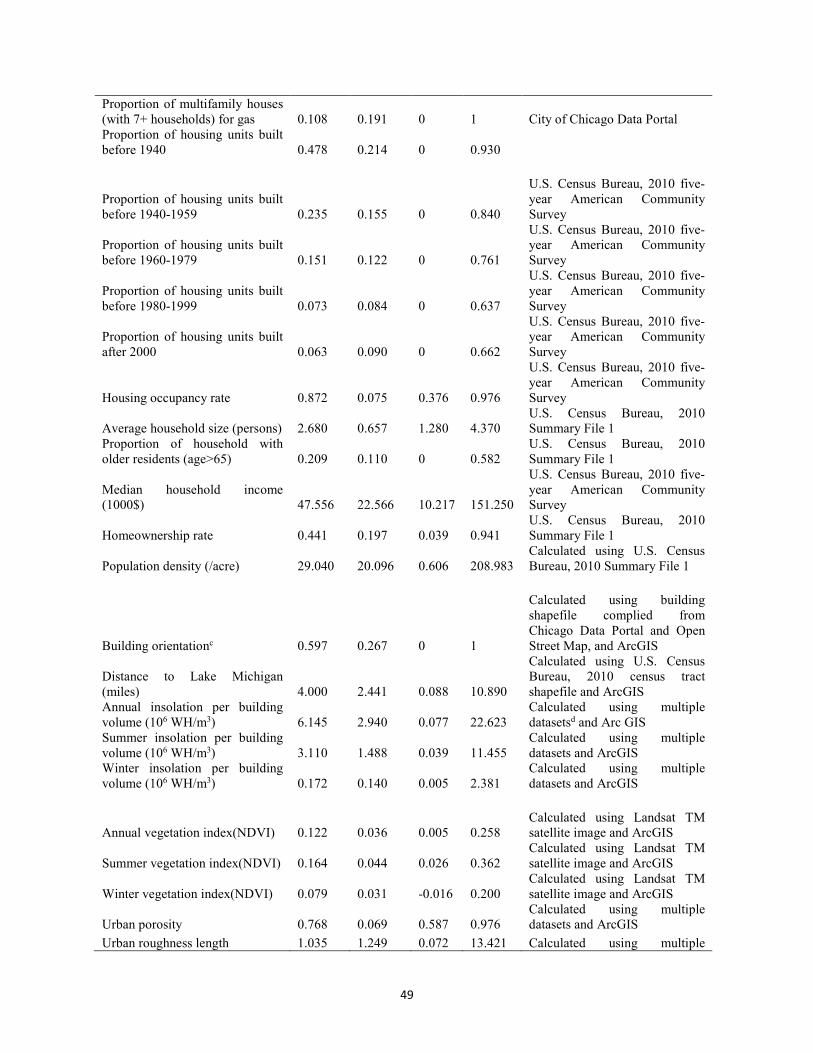
49
Proportion of multifamily houses (with 7+ households) for gas 0.108 0.191 0 1 City of Chicago Data Portal Proportion of housing units built before 1940 0.478 0.214 0 0.930
Proportion of housing units built before 1940-1959 0.235 0.155 0 0.840
U.S. Census Bureau, 2010 five-year American Community Survey
Proportion of housing units built before 1960-1979 0.151 0.122 0 0.761
U.S. Census Bureau, 2010 five-year American Community Survey
Proportion of housing units built before 1980-1999 0.073 0.084 0 0.637
U.S. Census Bureau, 2010 five-year American Community Survey
Proportion of housing units built after 2000 0.063 0.090 0 0.662
U.S. Census Bureau, 2010 five-year American Community Survey
Housing occupancy rate 0.872 0.075 0.376 0.976
U.S. Census Bureau, 2010 five-year American Community Survey
Average household size (persons) 2.680 0.657 1.280 4.370 U.S. Census Bureau, 2010 Summary File 1
Proportion of household with older residents (age>65) 0.209 0.110 0 0.582
U.S. Census Bureau, 2010 Summary File 1
Median household income (1000$) 47.556 22.566 10.217 151.250
U.S. Census Bureau, 2010 five-year American Community Survey
Homeownership rate 0.441 0.197 0.039 0.941 U.S. Census Bureau, 2010 Summary File 1
Population density (/acre) 29.040 20.096 0.606 208.983 Calculated using U.S. Census Bureau, 2010 Summary File 1
Building orientationc 0.597 0.267 0 1
Calculated using building shapefile complied from Chicago Data Portal and Open Street Map, and ArcGIS
Distance to Lake Michigan (miles) 4.000 2.441 0.088 10.890
Calculated using U.S. Census Bureau, 2010 census tract shapefile and ArcGIS
Annual insolation per building volume (106 WH/m3) 6.145 2.940 0.077 22.623
Calculated using multiple datasetsd and Arc GIS
Summer insolation per building volume (106 WH/m3) 3.110 1.488 0.039 11.455
Calculated using multiple datasets and ArcGIS
Winter insolation per building volume (106 WH/m3) 0.172 0.140 0.005 2.381
Calculated using multiple datasets and ArcGIS
Annual vegetation index(NDVI) 0.122 0.036 0.005 0.258 Calculated using Landsat TM satellite image and ArcGIS
Summer vegetation index(NDVI) 0.164 0.044 0.026 0.362 Calculated using Landsat TM satellite image and ArcGIS
Winter vegetation index(NDVI) 0.079 0.031 -0.016 0.200 Calculated using Landsat TM satellite image and ArcGIS
Urban porosity 0.768 0.069 0.587 0.976 Calculated using multiple datasets and ArcGIS
Urban roughness length 1.035 1.249 0.072 13.421 Calculated using multiple

50
datasets and ArcGIS
Notes: a The original unit for gas consumption in the dataset is therm. I convert it to kWh for easy comparison. b The square footage of each housing type associated with the electricity and gas data is different in certain tracts. Thus, I create this variable differently for electricity and gas.
c Building orientation refers to floor area weighted proportion of residential buildings that are within 15 degrees of east-west orientation. d These datasets include building shapfile complied from Chicago Data Portal and Open Street Map, Digital Evaluation Model from U.S. Geological Survey and land use inventory from Chicago Metropolitan Agency for Planning.
Figure 3 shows the spatial distribution of residential EUI and several urban form and
geomorphometry variables that I hypothesized to have effects on EUI. It is apparent that there
exists a positive spatial autocorrelation in EUI, suggesting that residential energy consumption
patterns are not randomly distributed across Chicago. It is unlikely that adjacent values of EUI
(clustered pattern) are the result of random spatial processes. As shown in Figure 3, census tracts
with similar EUI are clustered together, suggesting that energy consumption patterns may be
grouped by different neighborhoods. The existence of spatial dependence provides a rationale to
use spatial econometrics to better understand EUI patterns. The following section about model
specification will further justify the need to use spatial regression.
The variation in electricity usage intensity in Chicago clearly shows higher EUI over the
central areas of Chicago, including a few tracts near the downtown area, the suburb areas, and
the northwestern and southwestern edge of the city. Electricity and winter gas usage intensity
distribution across the city show similar patterns, except for several tracts to the north of
downtown and near the north edge of the city, where residential buildings may rely less on gas
for heating in winter. By overlaying the EUI map and population density map, I can spatially
corroborate the negative correlation between electricity EUI and population density by census
tract. In addition, there exist some positive relationships between EUI and annual insolation
intensity, vegetation index, and urban porosity. This makes sense because neighborhoods with
higher EUI are often times located in low density areas, which are associated with more

51
insolation and less building volume, more vegetation cover, and higher level of urban porosity.
Additionally, building orientation and urban roughness do not appear to have apparent spatial
relationship with EUI at the census tract level.
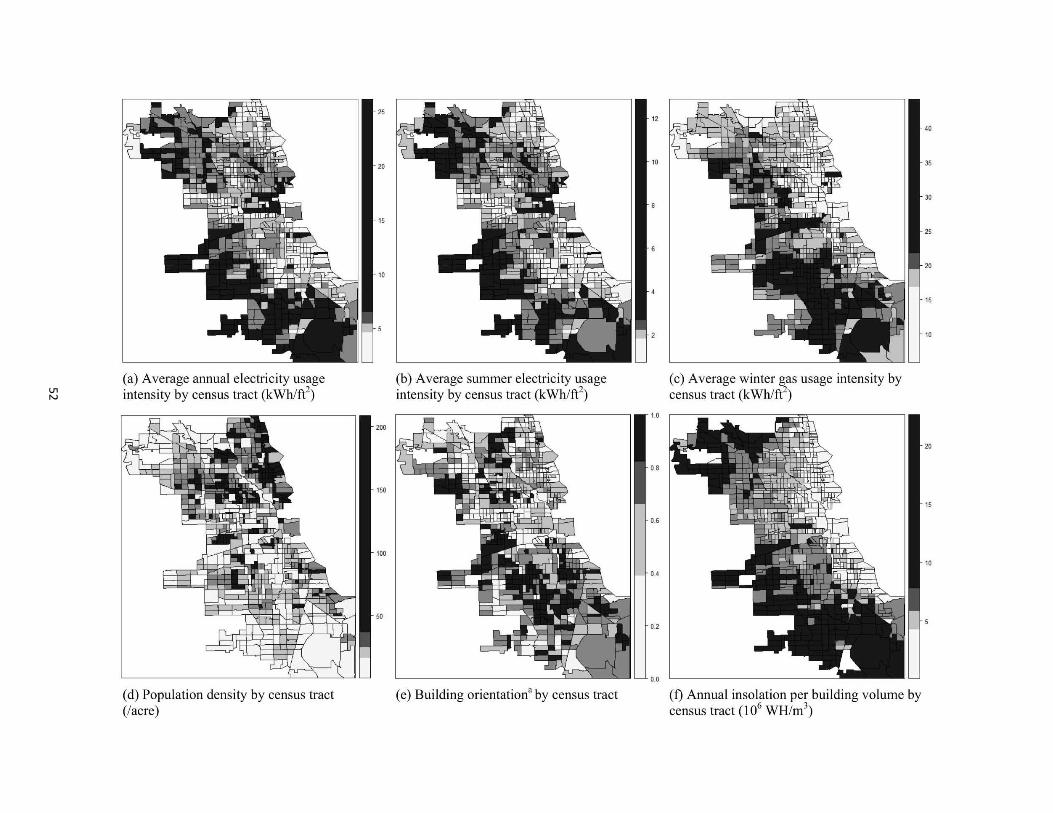
52
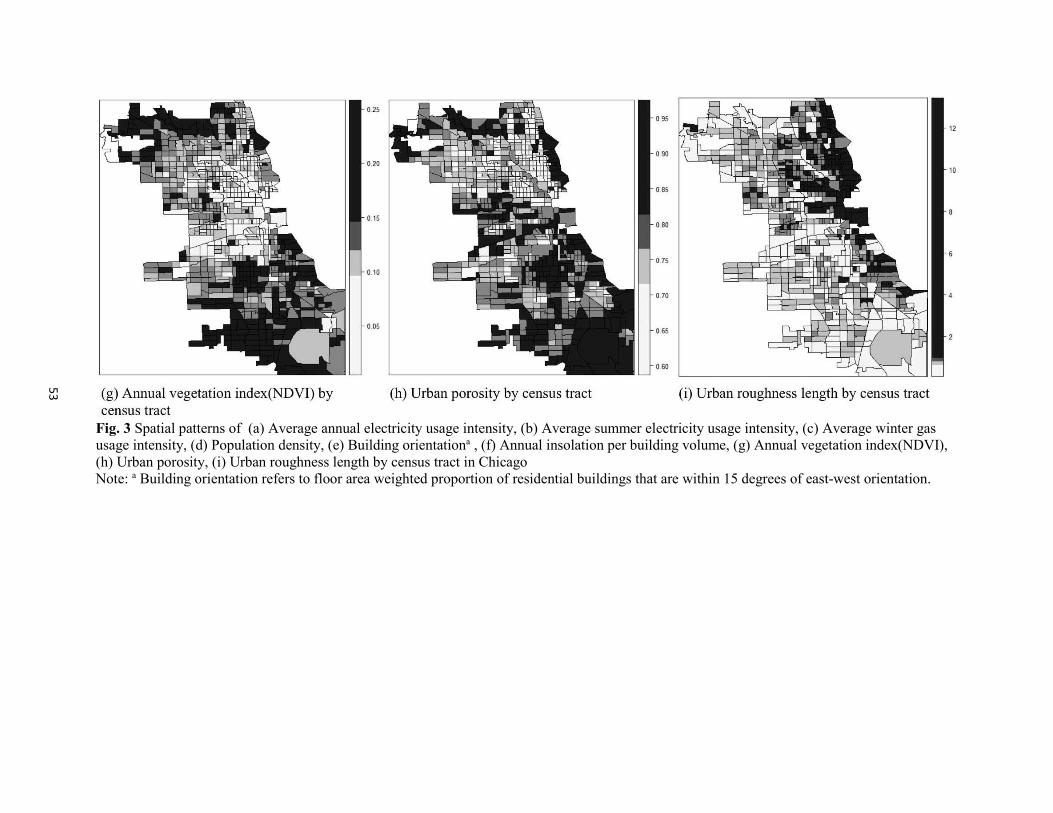
53
Fig. 3 Spatial patterns of (a) Average annual electricity usage intensity, (b) Average summer electricity usage intensity, (c) Average winter gas usage intensity, (d) Population density, (e) Building orientationa , (f) Annual insolation per building volume, (g) Annual vegetation index(NDVI), (h) Urban porosity, (i) Urban roughness length by census tract in Chicago
Note: a Building orientation refers to floor area weighted proportion of residential buildings that are within 15 degrees of east-west orientation.
54
3.3.4. Model specification
First, the Ordinary Least Square (OLS) regression models are estimated18. The
Moran’s I statistics indicate spatial autocorrelation exists in the residuals of all the
electricity and gas models19. Therefore there is a need to consider spatial regression
models. Then I applied Lagrange Multiplier statistics20 as a likely clue to further identify
the source of residual dependence. The test results indicate the Robust Lagrange
Multiplier statistics for standard error models are consistently significant for both
electricity and gas models (p <0.001), which further support the notion that there is
unresolved spatial heterogeneity in the error terms in both electricity and gas models. The
Spatial Error Model (SEM) for this study is specified as follows:
Ln(Y)= α +βX + ηWu+ ε
ε ~ Niid(0, σ2I)
Where Y is EUI variable for each census tract, X is the set of explanatory
variables including urban form and geomorphometry, as well as control variables of
socioeconomic and demographic factors, housing type, building characteristics, and ε is
the error term. W is the spatial weight matrix, which is based on first-order queen
contiguity in this instance.
18 Multicollinearity amongst explanatory variables was examined using the variation inflation factor (VIF). The collinearity statics (toloerace <1, VIF<10) suggests no significant multicollinearity issues with the OLS model. 19 The Moran’s I values the residuals for annual electricity, summer electricity, and winter gas models are 0.166, 0.147, and 0.193 respectively, which are all significant at the 0.001 level. 20 Lagrange Multiplier statistics is commonly used as a tool to select appropriate spatial models among spatial error models, spatial lag models, and the combination of spatial lag and spatial error models. The common features of these three types of these spatial models are discussed extensively in basic econometric literature.

55
From a theoretical standpoint, if the impacts of some explanatory variables not
only affect the dependent variable in the reference census tract, by also the dependent
variable in the proximal neighboring census tracts, The immediate neighbor influences
can be captured in the model by spatially lagged independent variables. In this case, some
urban form relevant variables regarding urban ventilation and vegetation might have this
type of influence on building energy consumption. For instance, a change in urban
ventilation in a census tract affects not only residential energy consumption in that census
tract, but also residential energy consumption among neighboring census tracts.
Therefore, I included spatially lagged independent variables for these urban form and
geomorphometry variables in our model and estimated the OLS models. I again
examined the residuals from the OLS using the Moran’s I statistic to test for spatial
autocorrelation among residuals and Lagrange Multiplier statistics as a likely clue for
model selection21. Finally I selected the Spatial Durbin Error Model (SDEM), which
accounts for spatial dependence among the error terms and the exogenous interaction
effect. The final model is specified as follows:
Ln(Y)= α +βX +γWX’+ ηWu+ ε
ε ~ Niid(0, σ2I)
Where Y is EUI variable for each census tract, X is the set of explanatory
21 After adding the spatially lagged terms of urban porosity, roughness length and NDVI, the Moran’s I values the residuals for annual electricity, summer electricity, and winter gas OLS models are 0.125, 0.109, and 0.207 respectively, which are all significant at the 0.001 level. Again, the Robust Lagrange Multiplier statistics for standard error models are consistently significant for electricity and gas models (p <0.001), which further support the notion that there is unresolved spatial heterogeneity in the error terms after spatial lagged terms are added.

56
variables including urban form and geomorphometry, as well as control variables of
socioeconomic and demographic factors, housing type, building characteristics. (p x 1) γ
vector represents the parameters for the lagged independent variables of urban porosity,
roughness length, and NDVI. Following (Call and Voss 2016), I allow that the set of
predictors X’ is a subset of the predictors X. It is also not a requirement that spatial
matrix W in equations (8) be the same, although in this study I assume a row
standardized first-order queen specification for each. The models were estimated using
the spdep package in R (R Development Core Team, 2014). Annual and seasonal EUI
variables are tested using SEM and SDEM respectively, including annual electricity,
summer electricity, and winter gas.
3.4. Findings
Spatial regression results for annual and summer electricity usage intensity, and
winter gas usage intensity presented in Table 6. In each case, base models (SEM1, SEM2,
SEM3) are spatial error models that include all the explanatory variables for the EUI
dependent variables; Extended models (SDEM1, SDEM2, SDEM3) include both
explanatory variables in the base models and lagged variables of NDVI, urban porosity,
and roughness length, adjusting for their neighboring influences on EUI. Based on the
Pseudo-R2 statistic of the electricity usage intensity models, summer electricity usage
models generally have more explanatory power than annual models, which might be
explained by the fact that a larger proportion of summer electricity are used for cooling.

57
Table 6 Annual and seasonal spatial regression results.
Variable EUI (Annual Electricity)
EUI (Summer Electricity)
EUI (Winter Gas)
SEM1 SDEM1 SEM2 SDEM2 SEM3 SDEM3
Proportion of single family square footage
0.217*** 0.201*** 0.275*** 0.263*** 0.127*** 0.126***
(0.059) (0.057) (0.059) (0.056) (0.045) (0.045)
Proportion of multifamily square footage (with 7+ households)
-0.055 -0.096* -0.170*** -0.215*** -0.482*** -0.491***
(0.060) (0.058) (0.059) (0.057) (0.047) (0.047)
Proportion of housing units built before 1940
-0.576*** -0.578*** -0.523*** -0.532*** 0.177** 0.185**
(0.102) (0.098) (0.102) (0.098) (0.082) (0.082)
Proportion of housing units built 1940-1959
-0.648*** -0.676*** -0.594*** -0.610*** 0.269*** 0.272***
(0.110) (0.106) (0.109) (0.105) (0.087) (0.088)
Proportion of housing units built 1960-1979
-0.310*** -0.284** -0.263** -0.234** 0.229** 0.241**
(0.119) (0.114) (0.118) (0.113) (0.096) (0.096)
Proportion of housing units built 1980-1999
-0.257* -0.268** -0.143 -0.140 -0.016 -0.020
(0.139) (0.137) (0.138) (0.136) (0.111) (0.112)
Housing occupancy rate 0.556*** 0.539*** 0.683*** 0.667*** 0.266*** 0.260**
(0.127) (0.125) (0.125) (0.123) (0.103) (0.105)
Average household size 0.064*** 0.085*** 0.054** 0.073*** 0.061*** 0.066***
(0.022) (0.020) (0.022) (0.020) (0.018) (0.018)
Proportion of household with older residents (age>65)
-0.046 -0.002 -0.135 -0.101 0.119* 0.123*
(0.089) (0.087) (0.088) (0.086) (0.071) (0.071)
Median household income -0.0004 -0.001 0.001 0.001 -0.001** -0.001**
(0.001) (0.001) (0.001) (0.001) (0.0005) (0.001)
Homeownership rate 0.071 0.038 0.070 0.049 -0.253*** -0.255***
(0.088) (0.086) (0.087) (0.085) (0.071) (0.071)
Population density -0.0001 -0.0002 -0.0002 -0.0003 -0.0005 -0.0005
(0.001) (0.001) (0.001) (0.001) (0.0005) (0.0005)
Building orientation -0.016 -0.013 -0.050* -0.042 0.008 0.006
(0.029) (0.027) (0.029) (0.027) (0.023) (0.023)
Distance to Lake Michigan (miles) 0.009 0.010* 0.014** 0.015*** 0.004 0.003
(0.006) (0.006) (0.006) (0.005) (0.006) (0.006)
Solar insolation index
Annual insolation intensity 0.033*** 0.039***
(0.005) (0.005)
Summer insolation intensity 0.062*** 0.075***
(0.011) (0.010)
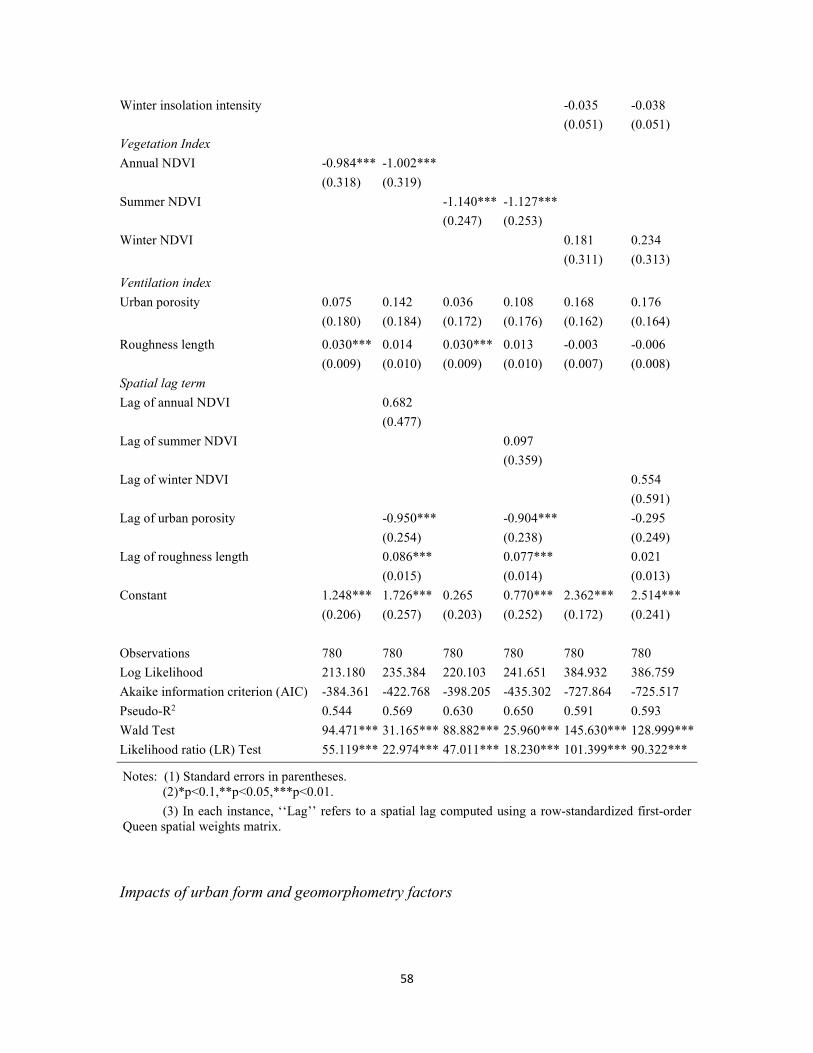
58
Winter insolation intensity
-0.035 -0.038
(0.051) (0.051)
Vegetation Index
Annual NDVI -0.984*** -1.002***
(0.318) (0.319)
Summer NDVI
-1.140*** -1.127***
(0.247) (0.253)
Winter NDVI
0.181 0.234
(0.311) (0.313)
Ventilation index
Urban porosity 0.075 0.142 0.036 0.108 0.168 0.176
(0.180) (0.184) (0.172) (0.176) (0.162) (0.164)
Roughness length 0.030*** 0.014 0.030*** 0.013 -0.003 -0.006
(0.009) (0.010) (0.009) (0.010) (0.007) (0.008)
Spatial lag term
Lag of annual NDVI 0.682
(0.477)
Lag of summer NDVI
0.097
(0.359)
Lag of winter NDVI 0.554
(0.591)
Lag of urban porosity
-0.950***
-0.904***
-0.295
(0.254)
(0.238)
(0.249)
Lag of roughness length
0.086***
0.077***
0.021
(0.015) (0.014) (0.013)
Constant 1.248*** 1.726*** 0.265 0.770*** 2.362*** 2.514***
(0.206) (0.257) (0.203) (0.252) (0.172) (0.241)
Observations 780 780 780 780 780 780
Log Likelihood 213.180 235.384 220.103 241.651 384.932 386.759
Akaike information criterion (AIC) -384.361 -422.768 -398.205 -435.302 -727.864 -725.517
Pseudo-R2 0.544 0.569 0.630 0.650 0.591 0.593
Wald Test 94.471*** 31.165*** 88.882*** 25.960*** 145.630*** 128.999***
Likelihood ratio (LR) Test 55.119*** 22.974*** 47.011*** 18.230*** 101.399*** 90.322***
Notes: (1) Standard errors in parentheses. (2)*p<0.1,**p<0.05,***p<0.01.
(3) In each instance, ‘‘Lag’’ refers to a spatial lag computed using a row-standardized first-order Queen spatial weights matrix.
Impacts of urban form and geomorphometry factors

59
The regression results reveal the effects of tract-level urban form and
geomorphometry variables on residential EUI. When other important covariates have
been controlled for, roughness length, which measures the intensity of wind circulation,
seems to have a significant effect on electricity usage intensity (p<0.01 in both SEM1 and
SEM2). While in the anticipated direction, this effect is not statistically significant for
winter gas usage intensity (p>0.1 in SEM3 and SDEM3). Similarly, solar radiation
intensity is significantly related to electricity usage intensity (p<0.01 in SEM1, SDEM1,
SEM2 and SDEM2), since excessive solar insolation might increase cooling loads in
summer, especially in low-density residential developments. Nevertheless, the opposite
effect of solar insolation is not significantly for winter gas usage intensity (p>0.1 in
SEM3 and SDEM3). As expected, NDVI, which measures the average density of
vegetation in each tract, is very strongly related to electricity usage intensity (p<0.01 in
both SEM1 and SEM2), but is not significantly related to gas usage intensity in winter.
Additionally, the regression results show no statistically significant association between
neighborhood porosity and EUI for both electricity and gas consumption. Our results
reveal that distance to large water bodies (Lake Michigan) has positive effects on summer
electricity usage intensity, which indicate the tract’s geographic proximity to Lake
Michigan would significantly reduce residential electricity intensity in summer. After
controlling other urban form and geomorphometry factors related to urban ventilation,
solar radiation, and vegetation level, building orientation do not appear to be significant
predictors of EUI. Population density is not significantly related to EUI either, which is
somehow consistent with previous findings, since studies have revealed that higher
population density is associated with lower household energy usage (Ko and Radke 2014;

60
Ewing and Rong 2008), but when it comes to energy intensity (e.g., electricity
consumption/ft2), population density is not significant (Chen, Matsuoka, and Liang
2017).
Extended models (SDEM1, SDEM2, SDEM3) in this study include some spatially
lagged independent variables, adjusting for neighboring influences on EUI. The porosity
level in a specific tract, for instance, may be similar to porosity level in neighboring
counties (spatial clustering), and may also be related to EUI in neighboring counties
(spatial spillover effects). In the case of Models SDEM1 and SDEM2, this appears to be
true, since spatially lagged porosity is negatively related to electricity usage intensity in
the neighboring tract. This indicates that, the porosity level in the neighboring tracts
could potentially reduce both annual and summer electricity usage intensity, a large
proportion of which is used for cooling. Nonetheless, I do not find significant
associations between spatially lagged porosity and winter gas usage intensity. Significant
positive association has been found for the spatially lagged roughness length and
electricity EUI, which indicates higher levels of wind circulation in the neighboring tract
could potentially reduce electricity usage intensity in the reference tract (p<0.01 in both
SEM1 and SEM2). It is also interesting to note that, when the lagged roughness length is
controlled for, the roughness length itself becomes insignificant, which somehow
indicates that, the wind circulation level in the neighboring tract is a deciding factor in
affecting the wind speed in the reference tract, which could in turn reduce electricity
usage intensity in residential buildings. Again, I do not find significant lagged effects of
roughness length on winter gas usage intensity. Additionally, little evidence in our results
61
indicates that NDVI have neighboring effect on EUI, since the lagged NDVI is not
significant in either electricity or winter gas usage models.
Impacts of other factors
In addition to urban form and geomorphometry variables, housing type, building
age, ratio of occupied housing units, household size are consistent predictors of EUI at
the tract level, which coincides with existing theory. A nuanced finding in the study is
that, when controlling other important covariates, census tracts with higher percentage of
older buildings are associated with lower electricity usage intensity, which might be
attributed to less usage of air conditioning and other high-consumption appliances (Baker
and Rylatt 2008; Chong 2012; Tiwari 2000). On the contrary, in the winter gas intensity
model, tracts with higher percentage of older buildings are associated with higher gas
usage intensity, which is consistent with existing theory that older homes generally
consume more energy for home heating because of insufficient thermal insulation.
Additionally, tracts with higher proportion of older residents (age>65) are associated with
higher gas usage intensity, probably due to the fact that they needs more natural gas for
home heating in winter, since older residents often times require warmer ambient
temperatures to feel comfortable. Interestingly, median income is not a significant
predictor of electricity usage intensity. The result of tracts with higher median income
being associated with lower gas usage intensity (p<0.05 in SEM3) is, however, not
expected. Nonetheless, one possible explanation is that the thermal insulation level of
residential buildings in higher income tracts is generally better, thus reducing gas usage
intensity. Finally, our results suggest a significant lower gas usage intensity in tracts with

62
more privately owned dwelling units, which is somehow consistent with findings from
other relevant studies (Ndiaye and Gabriel 2011).
3.5. Discussion
This study contribute to the literature by establishing spatially explicit knowledge
of various determinants of EUI at the census tract level, including urban form and 3D
geomorphometry variables measuring vegetation, solar insolation, and levels of natural
ventilation respectively, which have not been extensively studied. Previous studies have
established the linkage between urban ventilation variables (e.g., urban porosity,
roughness length) and urban climate (Gál and Unger 2009; Burghardt 2014; Coseo and
Larsen 2014; Chun and Guhathakurta 2015; Chun and Guldmann 2014). Our study
extends this linkage to the EUI in residential buildings, and also reveals their spatial
spillover effects.
I built our analytic approach incrementally, beginning with the spatial error model
(SEM) applied to the cross-sectional datasets of average EUI at the census tract level in
Chicago. The results of the spatial error models suggest clear effects of tract-level urban
form variables on EUI. It is interesting to note that these effects generated by NDVI,
natural ventilation, and insolation intensity only exist for electricity EUI, a large
proportion of which is used for cooling. Few urban form variables have significant
associations with gas usage intensity in winter, which is somehow consistent with
previous studies (Li, Song, and Kaza 2018; Wilson 2013).
I then extended these results by adding the spatially lagged variables that could
have neighboring effects on EUI. Overall, the addition of lagged variables of NDVI,
63
urban porosity, and roughness length can improve model fit for annual and summer
electricity EUI models, which indicates that urban form variables in the neighboring
tracts could help to explain the electricity EUI in its reference tract. This combination
yields a strong model fit (Pseudo-R2 =0.57 and 0.65 respectively).
The urban ventilation related lagged variables, including urban porosity and
roughness length, have consistent spillover effects on electricity usage intensity during
summer and the whole year, albeit with different magnitude, suggesting that the influence
of ventilation work through adjacent tracts in reducing cooling energy intensity,
especially in summer months. I did not include the spatial lag term for radiation intensity,
as there is no theoretical justification for doing so. Our lagged term for average NDVI,
however, suggests that the neighboring effects of vegetation density are not significant,
which somehow indicates that the influence of vegetation on microclimate does not
strength beyond the boundary of a specific tract to influence the EUI in its neighboring
tracts.
When considering building energy efficiency, this study suggests that the
consequence of compact development might be more complicated than generally
expected. Efforts to examine the pros and cons of compact residential development
should comprehensively consider housing type, solar insolation intensity, vegetation
amount, and ventilation level (Li, Song, and Kaza 2018; Ko 2013). According to the
results of this study, more compact residential developments are composed of less single-
family houses, which can potentially reduce EUI. Additionally, in the case Chicago, more
compact development is often times associated with less radiation intensity per building

64
volume, which can potentially decrease cooling EUI. On the contrary, compact
residential subdivisions are with lower NDVI, thus increasing cooling loads. Similar
effects can be found in urban ventilation, since more compact development are associated
with poorer natural ventilation, which in turn increase cooling EUI in summer. There is a
promising research opportunity in which one can isolate these pathways through which
compact urban from could affect building energy consumption, and explore the net effect
of compact development has on cooling and heating EUI in different climates.
There are still several limitations in this study. First, our data are aggregated to the
census tract level, which means it is impossible to control for the detailed household
characteristics or individual behavior, or to generalize to the individual or the household
level (Robinson 2011; Call and Voss 2016). Additionally, the process of aggregating data
will inevitably cause some loss of information or bias. Further, The modifiable areal unit
problem might be another issue. The inferences that are drawn in this study might differ
if the spatial unit changes, for example using a finer spatial resolution such as census
block. Nevertheless, several control variable (e.g., building age, tenure type) are not
available at this spatial scale, thus I cannot directly examine if our inferences are
consistent at a finer spatial scale. Finally, the external validity of this study is still limited
since it focuses on a single city in a single climate zone. Future research should evaluate
various urban forms in different climates, so as to find urban form strategies that produce
net benefits for building energy efficiency in each climate. In addition, Future studies
could include air temperature data, which is a more direct measure of urban heat island
effect, to explore the pathways in which various urban form and elements shape building
energy efficiency.
65
3.6. Conclusions
This study has examined the impacts of urban form and geomorphometry on EUI
in Chicago, using 2D and 3D spatial information. Spatial regression models were
estimated to explore the urban form and geomorphometry relevant drivers of residential
EUI at the census tract level, as well as their spillover effects. Our results suggest a clear
role of different urban form and geomorphometry elements in affecting residential
electricity usage intensity. In the electricity EUI models, urban porosity and roughness
length have consistent spillover effects on electricity usage intensity during summer and
the whole year. I found little evidence that NDVI has similar spillover effect, but it could
significantly reduce electricity usage intensity in its reference tract. Radiation intensity
has positive association electricity usage intensity, especially in summer. The expected
opposite effect of solar intensity is not significant for winter gas usage intensity. Our
results also reveal the significant effects of proximity to large water body (Lake
Michigan) in shaping summer electricity usage intensity. This study also provides a
nuanced finding that, when controlling other important covariates, census tracts with
higher percentage of older buildings are associated with lower electricity usage intensity
and higher gas usage intensity.
66
REFERENCES
Baker, K J., and R. M. Rylatt. 2008. “Improving the Prediction of UK Domestic Energy-Demand Using Annual Consumption-Data.” Applied Energy 85 (6): 475–482.
Burghardt, R. 2014. Development of an ArcGIS Extension to Model Urban Climate Factors (Doctoral dissertation). Retrieved from https://d-nb.info/1069689327/34.
Call, M. A., and P. R. Voss. 2016. “Spatio-Temporal Dimensions of Child Poverty in America, 1990–2010.” Environment and Planning A 48 (1): 172–191.
Chang, H., G. H. Parandvash, and Vivek A Shandas Nohad Toulan. 2010. “Spatial Variations of Single-Family Residential Water Consumption.” Urban Geography 31 (7): 953–972.
Chen, Y., R. H. Matsuoka, and T. Liang. 2017. “Urban Form, Building Characteristics, and Residential Electricity Consumption: A Case Study in Tainan City.” Environment and
Planning B: Urban Analytics and City Science. doi:10.1177/2399808317690150.
Chong, H. 2012. “Building Vintage and Electricity Use: Old Homes Use Less Electricity in Hot Weather.” European Economic Review 56 (5): 906–930.
Chun, B., and J. M. Guldmann. 2014. “Spatial Statistical Analysis and Simulation of the Urban Heat Island in High-Density Central Cities.” Landscape and Urban Planning 125: 76–88.
Chun, B., and S. Guhathakurta. 2015. “Daytime and Nighttime Urban Heat Islands Statistical Models for Atlanta.” Environment and Planning B: Planning and Design 44(2): 308–327.
Cooper, J., T. Ryley, and A. Smyth. 2001. “Energy Trade-Offs and Market Responses in Transport and Residential Land-Use Patterns: Promoting Sustainable Development Policy.” Urban Studies 38 (9): 1573–1588.
Coseo, P. J. 2013. Evaluating Neighborhood Environments for Urban Heat Island Analysis and Reduction (Doctoral dissertation). Retrieved from https://d-nb.info/1069689327/34.
Coseo, P. J., and L. Larsen. 2014. “How Factors of Land Use/Land Cover, Building Configuration, and Adjacent Heat Sources and Sinks Explain Urban Heat Islands in Chicago.” Landscape and Urban Planning 125: 117–129.
Ewing, R., and F. Rong. 2008. “The Impact of Urban Form on U.S. Residential Energy Use.” Housing Policy Debate 19 (1): 1–30.
Gál, T., and J. Unger. 2009. “Detection of Ventilation Paths Using High-Resolution Roughness Parameter Mapping in a Large Urban Area.” Building and Environment 44 (1): 198–206.
Holden, E., and I. Norland. 2005. “Three Challenges for the Compact City as a Sustainable Urban Form: Household Consumption of Energy and Transport in Eight Residential Areas in the Greater Oslo Region.” Urban Studies 42 (12): 2145–2166.
Hsu, D., T. Meng, A. Han, and D. Suh. 2017. “Further Opportunities to Reduce the Energy Use and Greenhouse Gas Emissions of Buildings.” Journal of Planning Education and
Research. doi:10.1177/0739456X17739674.

67
Jones, R. V., A. Fuertes, and K. J. Lomas. 2015. “The Socio-Economic, Dwelling and Appliance Related Factors Affecting Electricity Consumption in Domestic Buildings.” Renewable and
Sustainable Energy Reviews 43: 901–917.
Kaza, N. 2010. “Understanding the Spectrum of Residential Energy Consumption: A Quantile Regression Approach.” Energy Policy 38 (11): 6574–6585.
Ko, Y. 2013. “Urban Form and Residential Energy Use: A Review of Design Principles and Research Findings.” Journal of Planning Literature 28 (4): 327–351.
Ko, Y, and J. D. Radke. 2014. “The Effect of Urban Form and Residential Cooling Energy Use in Sacramento, California.” Environment and Planning B: Planning and Design 41 (4): 573–593.
Larivière, I., and G. Lafrance. 1999. “Modelling the Electricity Consumption of Cities: Effect of Urban Density.” Energy Economics 21 (1): 53–66.
Lee, S., and B. Lee. 2014. “The Influence of Urban Form on GHG Emissions in the U.S. Household Sector.” Energy Policy 68: 534–549.
Li, C., Y. Song, and N. Kaza. 2018. “Urban Form and Household Electricity Consumption: A Multilevel Study.” Energy and Buildings 158, 181–193.
Nakata-Osaki, C. M., L. C. L. Souza, and D. S. Rodrigues. 2018. “THIS – Tool for Heat Island Simulation: A GIS Extension Model to Calculate Urban Heat Island Intensity Based on Urban Geometry.” Computers, Environment and Urban Systems 67: 157–168.
Ndiaye, D., and K. Gabriel. 2011. “Principal Component Analysis of the Electricity Consumption in Residential Dwellings.” Energy and Buildings 43 (2–3): 446–453.
Robinson, W. S. 2011. “Ecological Correlations and the Behavior of Individuals.” International
Journal of Epidemiology 38(2), 337-341.
Shi, Y., L. Katzschner, and E. Ng. 2018. “Science of the Total Environment Modelling the Fine-Scale Spatiotemporal Pattern of Urban Heat Island Effect Using Land Use Regression Approach in a Megacity.” Science of the Total Environment 618: 891–904.
Steemers, K. 2003. “Energy and the City: Density, Buildings and Transport.” Energy and
Buildings 35 (1): 3–14.
Tiwari, P. 2000. “Architectural, Demographic, and Economic Causes of Electricity Consumption in Bombay.” Journal of Policy Modeling 22 (1): 81–98.
Wilson, Bev. 2013. “Urban Form and Residential Electricity Consumption: Evidence from Illinois, USA.” Landscape and Urban Planning 115: 62–71.
Yang, T., and X. Zhang. 2016. “Benchmarking the Building Energy Consumption and Solar Energy Trade-Offs of Residential Neighborhoods on Chongming Eco-Island, China.” Applied Energy 180: 792–799.
Zhang, S., Y. Wu, H. Liu, R. Huang, P. Un, Y. Zhou, L. Fu, and J. Hao. 2014. “Real-World Fuel

68
Consumption and CO2 (Carbon Dioxide) Emissions by Driving Conditions for Light-Duty Passenger Vehicles in China.” Energy 69: 247–257.
Zhao, X., N. Li, and C. Ma. 2012. “Residential Energy Consumption in Urban China: A Decomposition Analysis.” Energy Policy 41: 644–653.
Zheng, X., C. Wei, P. Qin, J. Guo, Y. Yu, F. Song, and Z. Chen. 2014. “Characteristics of Residential Energy Consumption in China: Findings from a Household Survey.” Energy
Policy 75: 126–135.
69
CHAPTER 4. GOVERNMENT RESPONSE TO CLIMATE CHANGE IN
CHINA: A STUDY OF FIRST-GENERATION PROVINCIAL AND
MUNICIPAL PLANS
4.1. Introduction
In recent decades, China continues to experience rapid urbanization of
unprecedented scope. The urbanization rate in China reached 53.73% in 2013 (National
Bureau of Statistics 2014). The rapid urbanization process will possibly lead to more
GHG emissions and make Chinese cities more vulnerable to climate change. According
to China’s National Assessment Report on Climate Change (2007), the surface
temperature in China will increase by 1.3-2.1°C by 2020 and 2.3-3.3°C by 2050. Annual
precipitation will increase by 2-3% by 2020 and 5-7% by 2050. In addition, Chinese
cities will face more severe natural hazards caused by climate change, such as floods and
droughts.
To meet the challenges brought about by climate change and by the resource and
energy challenges stemming from rapid urbanization in China, the Chinese government
has promulgated laws and regulations for cleaner energy production, energy savings, and
emission reductions nationwide. However, it was not until 2007 that policies or action
plans that deal specifically with climate change were put in place. Up until now, China
has adopted climate change policies and actions from the central to local government
level.
At the central government level, China’s national strategy for responding to
climate change was promulgated in 2007 as a major national policy guide. Subsequently

70
in 2008, the Climate Change Division of the National Development and Reform
Commission (NDRC)22 was founded as a central government organization to address
climate change in China. In 2009, the central government announced drastic goals to
reduce GHG emissions per unit of GDP in 2020 by 40% to 45% compared with 2005
levels (China Daily 2009). Since then, China began to take specific actions to combat
climate change nationally.
As of 2009, 27 provinces and autonomous regions23 in China had prepared plans
to respond to climate change. These provincial climate change plans were developed by
the provincial Development and Reform Commissions24. In 2010, the NDRC designated
Guangdong, Liaoning, Hubei, Shaanxi, and Yunnan Provinces, as well as the cities of
Tianjin, Chongqing, Shenzhen, Xiamen, Hangzhou, Nanchang, Guiyang, and Baoding, as
pilot sites to promote low carbon cities and provinces to combat climate change at the
subnational scale (NDRC 2010). In December of 2012, the NDRC announced another set
of 29 cities and provinces as the second wave of national low carbon pilot cities and
provinces (NDRC 2012).
22 The National Development and Reform Commission, previously known as State Planning Commission, is a powerful central governmental organization under Chinese State Council, which has broad administrative and planning control over national economic and social development. The major function of National Development and Reform Commission is to formulate and implement macroeconomic policies. It also has broad political power over the nation’s energy sector, climate change policy, regional planning, etc. 23 In Chinese terminology, autonomous regions refer to minority entities that have high populations of particular minority groups. Autonomous regions and provinces are first-level administrative subnational levels of government in China, which are directly under the administration of the central government. Currently there are five autonomous regions in China, which include Xinjiang, Inner Mongolia, Tibet, Ningxia, and Guangxi. 24 The Development and Reform Commission exists at multiple levels of government in China, including the central government, provincial government, municipal government, and county government. It is usually considered to have more power than other governmental sectors at the same horizontal level.
71
Since 2009, low carbon development has become a nationally adopted campaign
to respond to climate change at the local level (Zhang 2010). According to Li et al.
(2012), at least 74 cities in China have established the goal of developing low carbon
cities. Since low carbon development is and will continue to be pervasive in China, it is
important to analyze the range of strategies and policies currently adopted at municipal
and provincial levels.
In recent years, a body of formal provincial and municipal plans has grown in
China due to the subnational campaign of climate change planning. Evaluation of these
plans is quite necessary to examine whether subnational climate change planning is the
mainstream policy response to climate change in China and whether there are existing
issues and challenges. Analyzing these climate change plans in depth would also help to
better understand the current status of climate change governance in China. Meanwhile,
climate change plans at the subnational level have already received significant attention
in planning literature, focusing on the context of developed nations (Wheeler 2008;
Bulkeley 2010; Bassett and Shandas 2010; Tang et al. 2010, Baker et al. 2012; Baynham
and Stevens 2014).
The purpose of this study, therefore, is to provide a detailed work of climate
change planning at the subnational scale in China by reviewing existing plans. The
climate change plans in this study include the scopes of both climate change mitigation
and adaptation. It is worth mentioning that the majority of current city-level climate
change plans in China focus on climate change mitigation and are thus named “low-
carbon” plans, whereas provincial level climate plans usually involve both mitigation and
72
adaptation. I developed an evaluation protocol for climate change plans and applied it to
16 municipal and 26 provincial plans25 in China. Following this, I analysed policy actions
and strategies of these plans by using a detailed evaluation framework. The research
questions for this chapter are:
1) What are the main planning interventions taken by Chinese cities and provinces to
respond to climate change? What are the main issues with the first-generation subnational
climate change plans?
2) Which policy categories and key strategies are prioritized in provincial and municipal
climate change plans? Is the urban form and land use subcategory well identified?
Our results reflect the existing issues and challenges of climate action planning at
the subnational scale in China. Finally, I analyzed the results and provided strategic
recommendations to advance climate change planning in China.
4.2. A review of climate change planning and plan evaluation research
The earliest literature on local climate change policy and governance emerged in
the mid-1990s (Betsill and Bulkeley 2007; Bulkeley 2010). In recent years, a greater
amount of literature on climate planning beyond international and national levels has
begun to emerge. Recent studies have focused on using qualitative and quantitative
methods to assess or evaluate climate action plans (Wheeler 2008; Bassett and Shandas
2010; Tang et al. 2010; Baker et al. 2012; Ng 2012; Baynham and Stevens 2014). Among
these studies, Wheeler (2008) analyzed the first generation of local and municipal climate
change plans in the US in a systematic way based on planning documents and interviews.
25 The 26 provincial plans in our study include climate change plans of 22 provinces and four autonomous regions.
73
Bassett and Shandas (2010) continued to explore the local climate action plans built on
Wheeler’s work, focusing on the extent to which the local plans represent innovation in
planning. Tang et al. (2010) examined 40 climate action plans in the US by using their
conceptual model to analyze how well local jurisdictions recognize and prepare for
climate change. Ng (2012) provided a critical review of climate change strategy and
action agenda in Hong Kong and concluded that more concerted and comprehensive
efforts are needed. Baker et al. (2012) applied a quantitative and multi-criteria framework
to evaluate climate adaptation plans in Southeast Queensland of Australia and concluded
these plans would be ineffective in precipitating local government actions. Baynham and
Stevens (2014) recently used content analysis methods to evaluate mitigation and
adaptation content in official community plans in British Columbia, Canada. It is
interesting to note that a large proportion of the existing literature has focused on cities
and states in developed countries while research on climate change planning in China is
limited (Li et al., 2012; Li, 2013).
Meanwhile, a large body of widely cited studies concerning plan evaluation has
mainly focused on analyzing plans of natural hazard mitigation (Godschalk et al. 1999;
Nelson and French 2002; Brody 2003; Burby 2005; Tang et al. 2008; Berke et al. 2012)
and sustainability (Berke and Conroy 2000; Berke 2002; Conroy and Berke 2004) in
developed countries. These plan evaluation studies demonstrate that planning researchers
measure plan quality by analyzing the extent to which a plan articulates clear vision and
goals, provides a detailed fact base assessing risks and capabilities, includes a diverse
range of valid actions, offers strategies for implementation and monitoring, exhibits inter-
organizational coordination, and results from a participatory process involving
74
stakeholders (Godschalk et al. 1999; Burby et al. 2000; Brody 2003; Conroy and Berke
2004; Tang et al. 2008; Berke and Godschalk 2009; Berke et al. 2012). Current plan
quality evaluation theory and methods are relatively mature and have been used
frequently in the context of plans in developed countries. In recent years, these theories
and methods have been used in evaluating the content and quality of climate change plans
(eg., Tang et al. 2010; Baker et al. 2012; Baynham and Stevens 2014). To date, no
research has systematically evaluated subnational climate change plans in China. To
address this gap, this study seeks to adapt previous plan evaluation methods and
framework for climate change plans in China, and to test the validity of these well-
accepted plan evaluation concepts in a developing-nation context. In addition, our study
could potentially provide empirical evidence for plan quality and offer recommendations
for improving the quality of subnational climate change plans based on our evaluation
results.
4.3. Research approach
4.3.1. Site selection
To comprehensively analyze climate change plans in China, all of the 22
provinces and four autonomous regions with existing planning documents available are
included in our study. Tibet is not included in our study because I cannot obtain its
climate change planning documents. I also selected 16 cities (see Appendix 3) as case
studies. The first eight officially appointed low carbon pilot cities were all included in the
case study (Figure 4) because all of these cities have complete, existing planning
documents, which may best depict the first generation of municipal climate actions plans
in China. The other eight cities in this study are of various sizes and geographic locations,
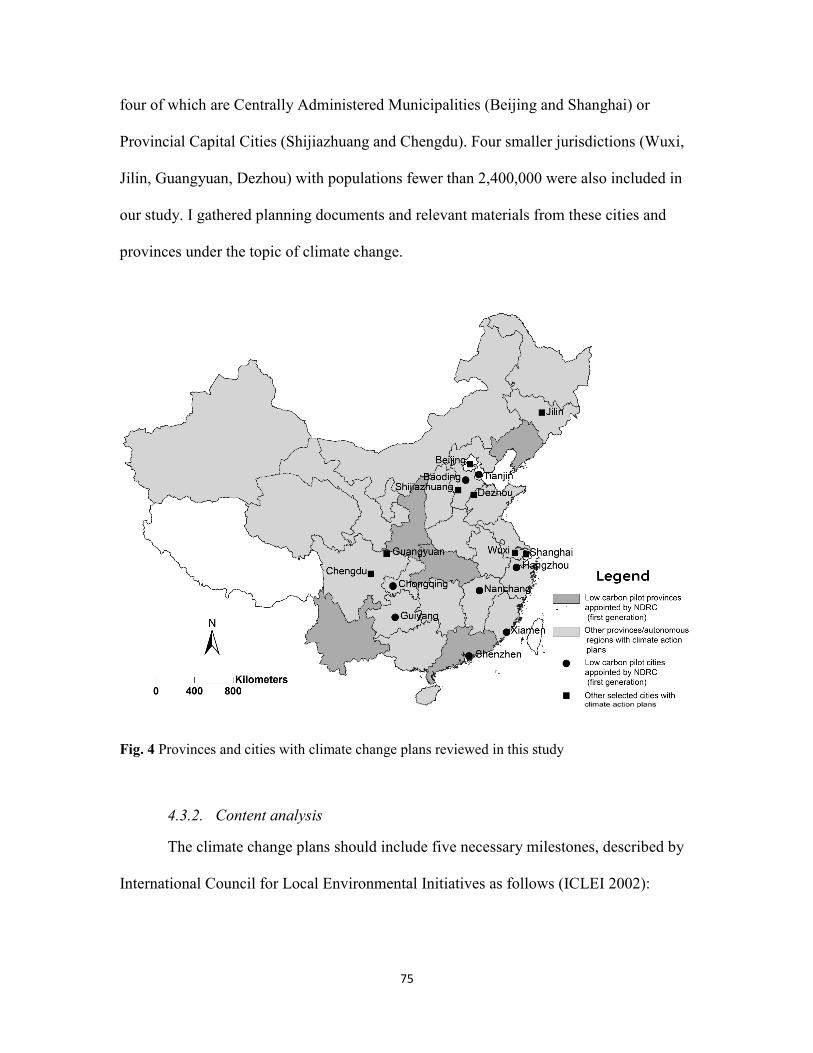
75
four of which are Centrally Administered Municipalities (Beijing and Shanghai) or
Provincial Capital Cities (Shijiazhuang and Chengdu). Four smaller jurisdictions (Wuxi,
Jilin, Guangyuan, Dezhou) with populations fewer than 2,400,000 were also included in
our study. I gathered planning documents and relevant materials from these cities and
provinces under the topic of climate change.
Fig. 4 Provinces and cities with climate change plans reviewed in this study
4.3.2. Content analysis
The climate change plans should include five necessary milestones, described by
International Council for Local Environmental Initiatives as follows (ICLEI 2002):

76
(1) Conducting a base year emissions inventory and forecast
(2) Setting a GHG emission reduction target
(3) Developing the local-level action plan
(4) Implementing the measures and policies in the action plan
(5) Monitoring progress and reporting results
In our study, based on ICLEI’s framework as well as previous studies of plan
evaluation, five climate change plan components (fact base; vision, goals and targets;
policy actions and strategies; implementation strategies; monitoring and review) were
used to evaluate the climate change plans. Evaluation concepts and criteria (Table 7)
were developed, primarily building on existing climate change plan studies by Tang et al.
(2010), Baker et al. (2012), and Baynham and Stevens (2014).
Table 7 Description of climate change plana document evaluation protocol. Plan component Evaluation concepts Carrying out evaluation
1. Fact base 2. Vision, goals,
and targets 3. Policy actions
and strategies
Current and future conditions regarding the cause and effect of climate change Both short-term and long-term vision of mitigation and adaptation Adequate and effective climate change solutions across a wide range of sectors to achieve mitigation and adaptation goals
1.1 Analysis of current and future GHG emissions. 1.2 Sector-specific GHG baseline inventory and forecast. 1.3 Information about climate change impacts, vulnerability, risks, and mitigation/adaptation capabilities. 2.1 Goals to mitigate and adapt to climate change. 2.2 Quantifiable objectives regarding GHG reduction 3.1 Policies and actions that could potentially mitigate or adapt to climate change. 3.2 The breadth and depth of key strategy identified in the framework in the sectors of energy, industry, transportation, buildings, land use (urban form), waste, lifestyle, water, and agriculture. 3.3 The integration of mitigation and adaptation strategies (e.g. gaining synergies, or avoiding maladaptation).

77
4. Implementation strategies
5. Monitoring and
review
Detailed and specific strategies on implementing the policy actions Systematic framework of monitoring and reviewing the progress and results
4.1 Identified funding and potential actors. 4.2 Timetables and priorities for implementing the actions. 5.1 Mitigation and adaptation progress monitoring/reviewing and annual GHG reduction report.
Note: aCity-level climate change plans in China are usually named “low carbon plans”.
Of all these components, policy actions and strategies represent the heart of a plan
(Brody 2003). Thus, I did an in-depth analysis of this component: First I identify sub-
categories of climate change policy/action based on previous literature in this field (Tang
et al. 2010; Baker et al. 2012; Baynham and Stevens 2014; Wheeler 2008). Following
these sub-categories, discrete policies/strategies were coded for each plan in the sample
by two independent coders. Policies and strategies were counted based on what are
proposed, not the intention of actions and policies. Additional sub-categories were
created in the coding process, if necessary, to more accurately reflect what the
local/provincial plans were proposing.
Then a list was made of key planning interventions that could potentially mitigate
or adapt to climate change. I developed this list based on critical analysis of the following
important sources:
(1) “Best practice” actions to address climate change recommended by member
cities of ICLEI
(2) Annual reports of China’s Policies and Actions for Addressing Climate
Change
(3) Existing best practice literature on climate action planning at regional and
local scales

78
Then I consolidated the strategies that are similar in content. Finally, I reclassified
the key strategies that have the same policy goals to form our evaluation framework.
Thus, 52 key strategies were identified in our framework. Then the two authors coded all
of the 52 key strategies in each plan independently on a 0-2 ordinal scale with a score of
0 indicating that the strategy is not included in the plan, 1 indicating that the strategy is
included without justification/detailed information, and 2 indicating that a strategy is
fully considered in the plan with justification and detailed information. Each plan was
coded three times by both of the authors. Then an intercoder reliability score was
computed, which indicates the percentage of items that were coded the same value by
both of the two coders. Intercoder reliability scores were 90.3% for provincial plans and
86.6% for city plans. Since both of the intercoder reliability scores range from 70% to
97% in the existing plan quality literature (Berke and Godschalk 2009), I deem that our
results are acceptable in terms of reliability. Following this, I calculated the breadth and
depth of each key strategy (Tang et al. 2010): The breadth measures the percentage of
plans that identified the relevant strategies for adoption; while the depth of each strategy
indicates how fully developed or justified it is. The indicators of breadth and depth are
calculated by the following equations:
BSi=
DSi=
Where BSi represents the breadth score of the ith indicator; Ni represents the
number of plans which include the ith indicator; N is the total number of plans in the

79
study; DSi is the depth score of the ith indicator; Si is the score that the ith indicator
receives (0= not mentioned; 1=generally mentioned; 2=justified/detailed).
Overall, our research approach enables us to grasp the main planning
interventions taken by Chinese cities and provinces to respond to climate change. It is
worth noting that our methods focus on the planning stage rather than the implementation
stage, although I covered some questions about implementation in our interview (Li and
Song, 2016), which are not included in this paper.
4.4. Findings
I present our results below. I create tables summarizing the climate change
planning networks that the cities and provinces have participated in and the main
approaches to climate action planning; I also provide a summary of the GHG inventories
and targets of the selected jurisdictions (see Appendix 2&3).
4.4.1. Plan content and process
Notably, climate change plans in our study are associated with some international
or national programs. Most cities (14 of 16) and some provinces26 (6 of 26) participate in
one or more climate change initiatives or networks. International programs in which the
case cities participate include the Low Carbon City Initiative by the World Wildlife Fund
and the Clinton Climate Initiative of the Large Cities Climate Leadership Group (C40).
Examples of national programs are the National Development and Reform Commission’s
Low Carbon Pilot City/Province Program, the Ministry of Housing and Urban-Rural
26 I counted autonomous regions as provinces in our findings since they are both of the same administrative subdivision level. When calculating the breadth scores for each strategy, autonomous regions were treated as provinces as well.
80
Development’s Low Carbon Eco-Demonstration City Project, and the Low Carbon City
China Alliance’s Low Carbon City China Program. It is worth noting that all of these
climate change initiatives or networks in China are relatively nascent, and there exists no
tradition of municipalities/provinces cooperating or learning from each other on climate
change issues, which is partly due to the difficulty in establishing formal horizontal
networks in China (Li and Wu 2012).
In addition to networking, the content of plans is essential for effective outcomes.
Most plans I reviewed have a comprehensive awareness of climate change impacts in
their specific region. For instance, earlier chapters of Guangdong’s plan systematically
assessed the temperature and precipitation change trends in the province and analyzed the
potential impacts on coastlines, water resources, agriculture, built environment, economic
development, and human health. Nevertheless, the assessment of climate change
vulnerability and mitigation/adaptation capabilities are rarely included in most of the
plans evaluated.
Developing a GHG inventory is an initial step in climate action planning. Without
a credible and reliable GHG inventory and forecast, a jurisdiction may encounter
difficulties in setting reasonable GHG reduction targets and cost-effective GHG
mitigation strategies. In our study, only a small proportion of case cities (6 of 16) have
created some sort of municipal GHG inventory. Other jurisdictions have not included any
baseline GHG inventories or forecasts in their low carbon plans. They have directly
proceeded to the development of their GHG reduction targets and action plans without
GHG inventories or forecasts.

81
Setting specific GHG reduction goals is also an essential part of climate action
plans. In our study, all the plans have goals of reducing local GHG emissions. Therefore,
all 16 cities and 26 provinces/autonomous regions studied have set targets for GHG
emissions reduction. Unlike the members of ICLEI, whose emission targets are set based
on the proportion of GHG reduction from the baseline, Chinese local jurisdictions usually
set their targets based on proportions of GHG reduction per unit of GDP or GHG
reduction per capita. Thus, their reduction targets are not absolute GHG reduction
amounts but rather GHG intensity targets related to indicators of economic output and
population.
Processes through which these plans are developed are also summarized: the
majority of planning documents I reviewed are prepared by the Development and Reform
Commission because of the pervasive national Low Carbon Pilot City/Province Program,
which is initiated by the National Development and Reform Commission.
Nongovernmental sectors are rarely mentioned in the plan creation process. Nevertheless,
there is one exception: in the process of developing Jilin City’s low carbon development
plan, the local university and outside consultants were highly involved. Notably, in none
of our case cities or provinces does a traditional municipal planning department play a
primary role in leading climate action planning. Furthermore, I find little evidence of
public meetings or stakeholder involvement from these planning documents.
Most of the plans do not include implementation strategies, as they do not identify
funding, potential actors or lay out timetables for implementation. It is also worthwhile to
mention that none of the jurisdictions has some form of follow-up monitoring, progress
evaluation, or GHG reduction results reporting process to date.
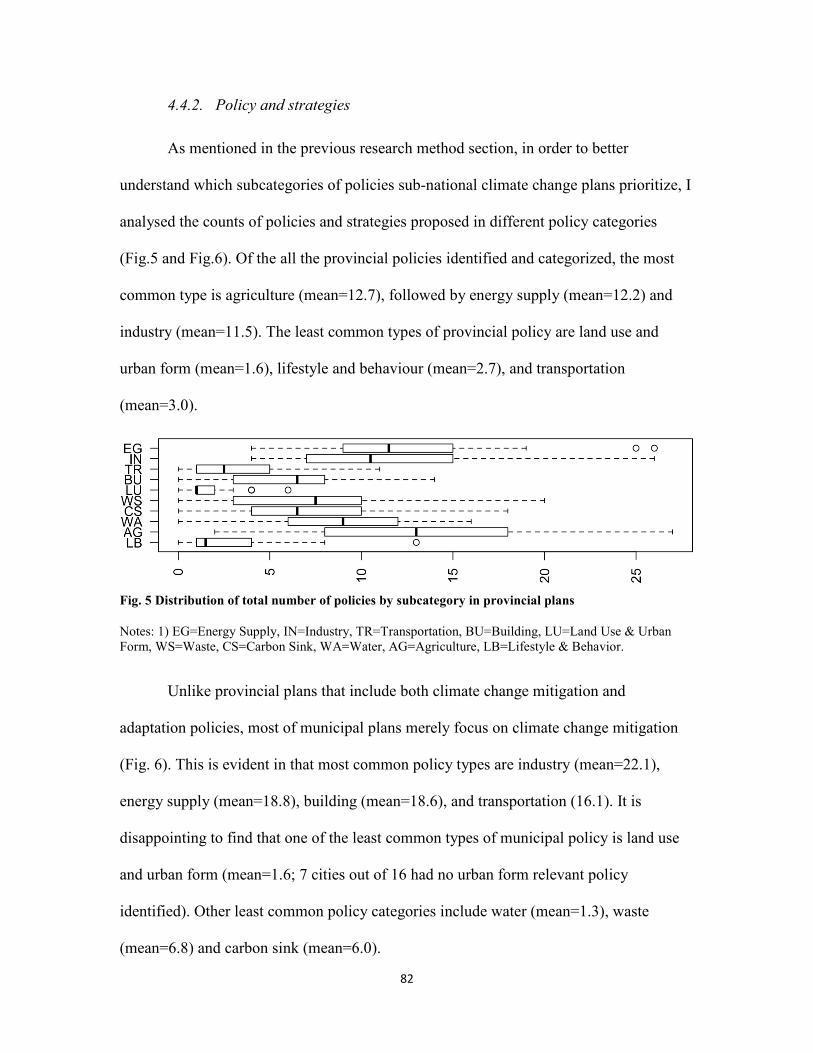
82
4.4.2. Policy and strategies
As mentioned in the previous research method section, in order to better
understand which subcategories of policies sub-national climate change plans prioritize, I
analysed the counts of policies and strategies proposed in different policy categories
(Fig.5 and Fig.6). Of the all the provincial policies identified and categorized, the most
common type is agriculture (mean=12.7), followed by energy supply (mean=12.2) and
industry (mean=11.5). The least common types of provincial policy are land use and
urban form (mean=1.6), lifestyle and behaviour (mean=2.7), and transportation
(mean=3.0).
Fig. 5 Distribution of total number of policies by subcategory in provincial plans
Notes: 1) EG=Energy Supply, IN=Industry, TR=Transportation, BU=Building, LU=Land Use & Urban Form, WS=Waste, CS=Carbon Sink, WA=Water, AG=Agriculture, LB=Lifestyle & Behavior.
Unlike provincial plans that include both climate change mitigation and
adaptation policies, most of municipal plans merely focus on climate change mitigation
(Fig. 6). This is evident in that most common policy types are industry (mean=22.1),
energy supply (mean=18.8), building (mean=18.6), and transportation (16.1). It is
disappointing to find that one of the least common types of municipal policy is land use
and urban form (mean=1.6; 7 cities out of 16 had no urban form relevant policy
identified). Other least common policy categories include water (mean=1.3), waste
(mean=6.8) and carbon sink (mean=6.0).

83
Fig. 6 Distribution of total number of policies by subcategory in municipal plans
Notes: EG=Energy Supply, IN=Industry, TR=Transportation, BU=Building, LU=Land Use & Urban Form, WS=Waste, CS=Carbon Sink, WA=Water, AG=Agriculture, LB=Lifestyle & Behavior.
Figures 7, 8 and 9 show the breadth of strategies in our evaluation framework for
the plans I reviewed. I do not report our findings related to depth in this paper since all
the depth scores are very low, and there are little variations between different strategies.
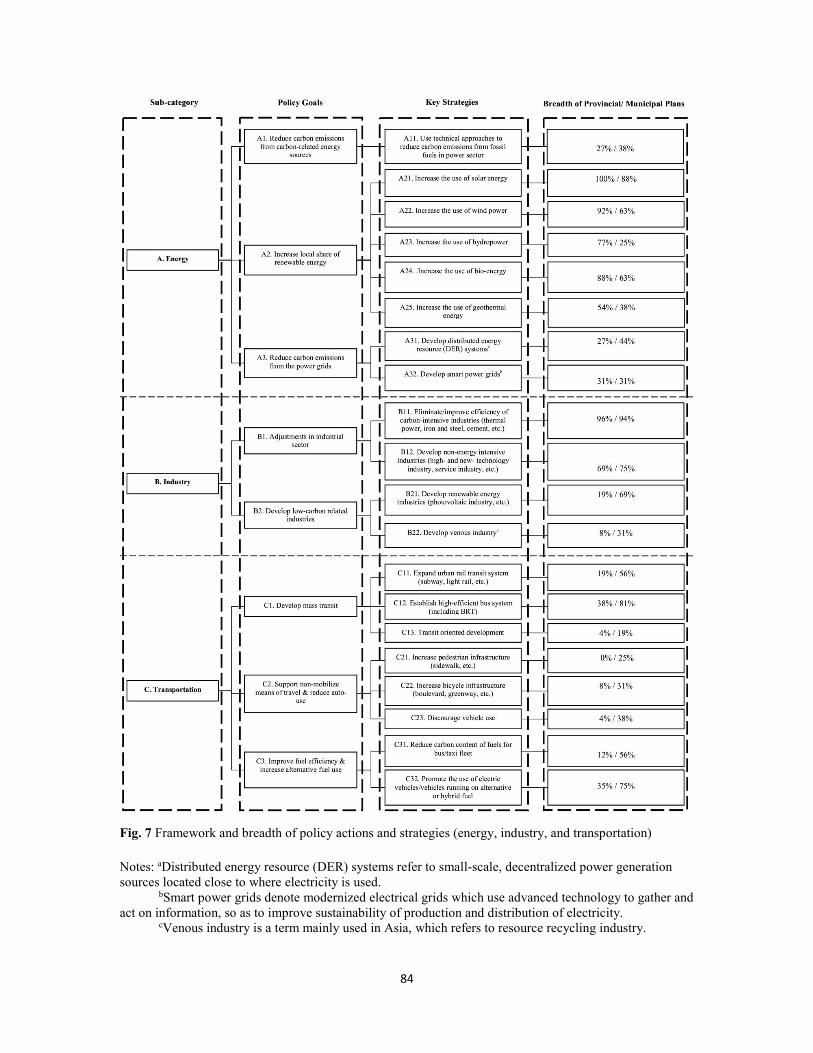
84
Fig. 7 Framework and breadth of policy actions and strategies (energy, industry, and transportation)
Notes: aDistributed energy resource (DER) systems refer to small-scale, decentralized power generation sources located close to where electricity is used. bSmart power grids denote modernized electrical grids which use advanced technology to gather and act on information, so as to improve sustainability of production and distribution of electricity. cVenous industry is a term mainly used in Asia, which refers to resource recycling industry.
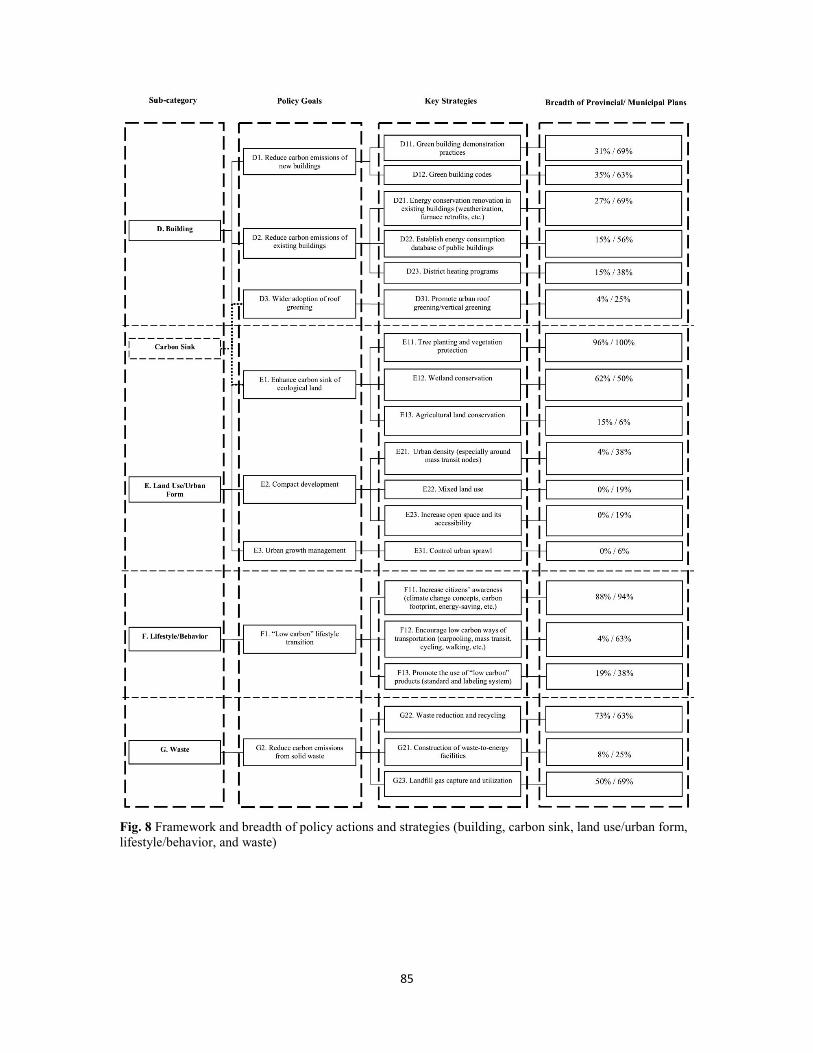
85
Fig. 8 Framework and breadth of policy actions and strategies (building, carbon sink, land use/urban form, lifestyle/behavior, and waste)
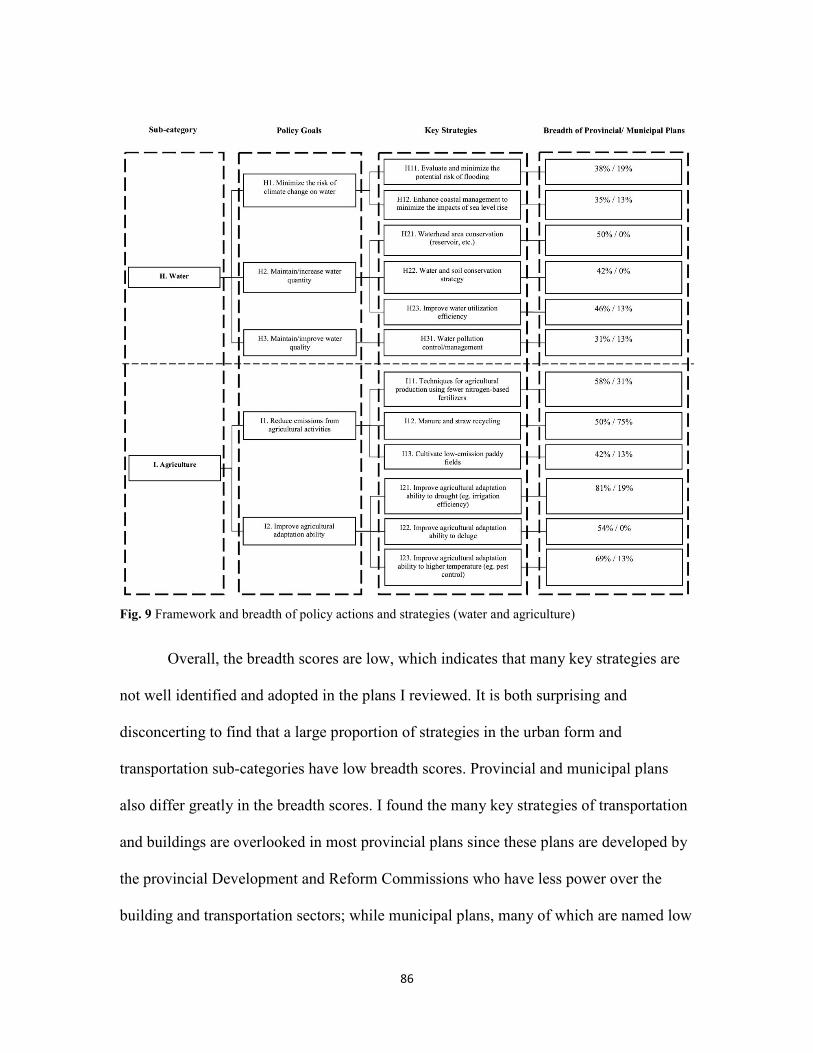
86
Fig. 9 Framework and breadth of policy actions and strategies (water and agriculture)
Overall, the breadth scores are low, which indicates that many key strategies are
not well identified and adopted in the plans I reviewed. It is both surprising and
disconcerting to find that a large proportion of strategies in the urban form and
transportation sub-categories have low breadth scores. Provincial and municipal plans
also differ greatly in the breadth scores. I found the many key strategies of transportation
and buildings are overlooked in most provincial plans since these plans are developed by
the provincial Development and Reform Commissions who have less power over the
building and transportation sectors; while municipal plans, many of which are named low
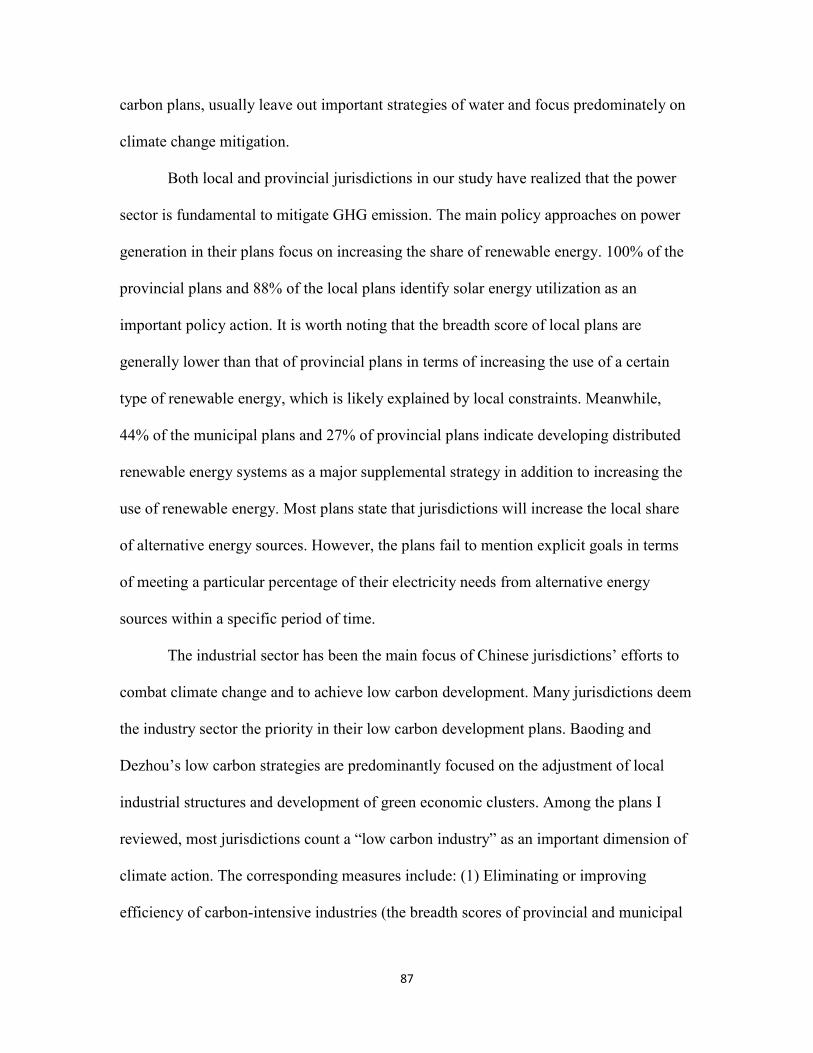
87
carbon plans, usually leave out important strategies of water and focus predominately on
climate change mitigation.
Both local and provincial jurisdictions in our study have realized that the power
sector is fundamental to mitigate GHG emission. The main policy approaches on power
generation in their plans focus on increasing the share of renewable energy. 100% of the
provincial plans and 88% of the local plans identify solar energy utilization as an
important policy action. It is worth noting that the breadth score of local plans are
generally lower than that of provincial plans in terms of increasing the use of a certain
type of renewable energy, which is likely explained by local constraints. Meanwhile,
44% of the municipal plans and 27% of provincial plans indicate developing distributed
renewable energy systems as a major supplemental strategy in addition to increasing the
use of renewable energy. Most plans state that jurisdictions will increase the local share
of alternative energy sources. However, the plans fail to mention explicit goals in terms
of meeting a particular percentage of their electricity needs from alternative energy
sources within a specific period of time.
The industrial sector has been the main focus of Chinese jurisdictions’ efforts to
combat climate change and to achieve low carbon development. Many jurisdictions deem
the industry sector the priority in their low carbon development plans. Baoding and
Dezhou’s low carbon strategies are predominantly focused on the adjustment of local
industrial structures and development of green economic clusters. Among the plans I
reviewed, most jurisdictions count a “low carbon industry” as an important dimension of
climate action. The corresponding measures include: (1) Eliminating or improving
efficiency of carbon-intensive industries (the breadth scores of provincial and municipal
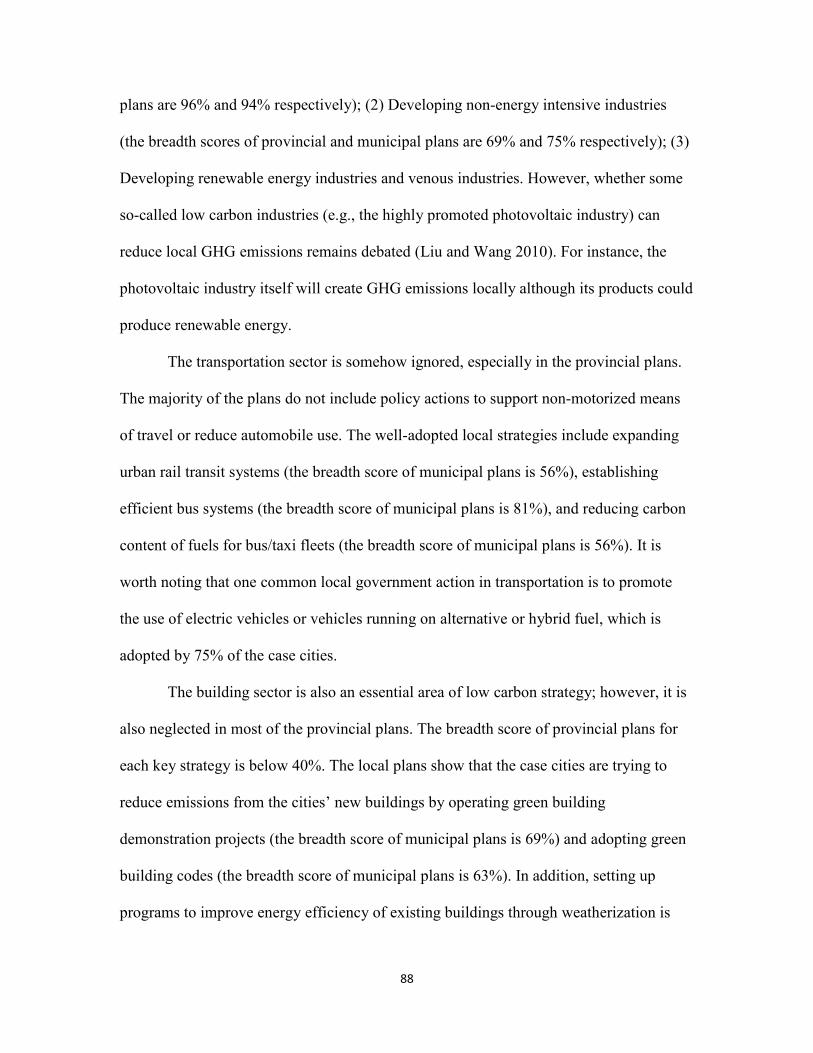
88
plans are 96% and 94% respectively); (2) Developing non-energy intensive industries
(the breadth scores of provincial and municipal plans are 69% and 75% respectively); (3)
Developing renewable energy industries and venous industries. However, whether some
so-called low carbon industries (e.g., the highly promoted photovoltaic industry) can
reduce local GHG emissions remains debated (Liu and Wang 2010). For instance, the
photovoltaic industry itself will create GHG emissions locally although its products could
produce renewable energy.
The transportation sector is somehow ignored, especially in the provincial plans.
The majority of the plans do not include policy actions to support non-motorized means
of travel or reduce automobile use. The well-adopted local strategies include expanding
urban rail transit systems (the breadth score of municipal plans is 56%), establishing
efficient bus systems (the breadth score of municipal plans is 81%), and reducing carbon
content of fuels for bus/taxi fleets (the breadth score of municipal plans is 56%). It is
worth noting that one common local government action in transportation is to promote
the use of electric vehicles or vehicles running on alternative or hybrid fuel, which is
adopted by 75% of the case cities.
The building sector is also an essential area of low carbon strategy; however, it is
also neglected in most of the provincial plans. The breadth score of provincial plans for
each key strategy is below 40%. The local plans show that the case cities are trying to
reduce emissions from the cities’ new buildings by operating green building
demonstration projects (the breadth score of municipal plans is 69%) and adopting green
building codes (the breadth score of municipal plans is 63%). In addition, setting up
programs to improve energy efficiency of existing buildings through weatherization is

89
also a common action adopted by the case cities (the breadth score of municipal plans is
69%). Nevertheless, this action is limited to the public sector in some cities. Xiamen, for
example, only has initiatives to “green the public and government buildings” (City of
Xiamen 2010). It is also notable that 38% of the municipal plans include actions to
promote district heating reform.
Other key mitigation strategies that jurisdictions have undertaken are in the sub-
categories of land use, lifestyle, and waste. Surprisingly, most plans do not underline land
use and urban form approaches to climate change. Among all the plans reviewed, the
compact development mode is rarely mentioned. A mere 4% of provincial plans and 38%
of municipal plans emphasize density. Moreover, mixed land-use is mentioned in only
19% of the local plans. Among all the local plans, only Hangzhou’s plan promotes
comprehensive land use approaches to achieve low carbon development that include
ecological land conservation, compact development, and urban sprawl control (City of
Hangzhou 2011). It is also interesting to note that many jurisdictions contemplate
encouraging “low carbon lifestyles” to respond to climate change. 88% of the provinces
and 94% of the case cities recommend educating citizens about low carbon concepts in
their plans. In addition, 63% of the cities have low carbon transit encouragement
programs, and 38% of the local jurisdictions have low carbon product promotion
strategies in their plans. In the aspect of waste management, relevant strategies focused
on solid waste. Many jurisdictions (73% of the provinces and 63% of the cities) consider
promoting waste reduction and recycling programs in order to save resources and reduce
emissions. Several local jurisdictions also consider constructing waste-to-energy facilities
(25%) or use landfills as an important energy source (69%).

90
Most of the local plans lack the dimension of adapting to climate change, while
provincial plans usually include climate adaptation chapters. Among the municipal plans,
only the plans for Beijing, Shanghai, Tianjin and Chongqing contain some notable
chapters of strategies for adapting to climate change, although many plans have common
strategies for urban forestry and tree planting, which can be seen as adaptation strategies.
It is worth noting that Chongqing has six dimensions in its adaptation chapter, dealing in
detail with agriculture, water, forestry, biodiversity, built environment, and human health
(City of Chongqing 2009). Tianjin focuses its adaptation strategies on coastlines,
agriculture, forestry, and hazard mitigation (City of Tianjin 2010). Many provincial plans
highlight strategies such as improving agricultural adaptation ability to drought (81%)
and warmer temperatures (69%). In addition, for plans that include climate adaptation
components, the climate adaption and mitigation components were developed separately
and arranged in different sections, with little evidence of integrated assessment of
policies and strategies for climate mitigation and adaptation to promote synergies and
avoid maladaptation.
4.5. Discussion: existing issues and challenges
China is currently experiencing rapid economic development with
industrialization, making GHG emission reductions in conjunction with sustaining
economic growth a significant challenge (Liu and Deng 2011). Clearly, there is a long
way to go for Chinese jurisdictions to find effective climate change solutions. Challenges
and critical issues are evident in climate change plans and planning to date.
Vague definition of what characterizes a low carbon city/region
Although developing low carbon cities/provinces is currently pervasive, the
definition of what characterizes a low carbon city in China remains unclear. Xin and

91
Zhang (2008) stated that low carbon city development refers to the development of a city
that is characterized by rapid economic growth, as well as low energy consumption and
CO2 emission. The Study Group of China Energy and Carbon Emissions (2009) defines a
low carbon city as being characterized by a low carbon economy, low carbon lifestyle,
and low carbon society. Liu and Deng (2011) argue that low carbon cities are
characterized by the dissociation of GHG emissions from economic development and
urbanization. Li et al. (2012) proposes the definition of a low carbon town with clear
targets and concrete actions planned to realize both with a considerable reduction of CO2
emissions intensity in the short term and transition to a low carbon economy and society
in the long term.
Based on our study, Chinese jurisdictions seem to deem the goal of the low
carbon city as low GHG per unit of GDP since their ultimate planning goal is to reduce
this indicator. Thus, the low carbon cities, in their vision, are not characterized by
absolute low GHG emissions but rather a relative indicator of emissions that is associated
with economic growth. For instance, the city of Xiamen’s vision of “a low carbon city” is
characterized by carbon emissions per unit of GDP 40% below 2005 by the year 2020
(City of Xiamen 2010). However, according to the plan, the absolute GHG amount in
Xiamen will increase, which is 68,640,000 tons by the year 2020, 4.28 times the amount
of emissions in 2005. Clearly, even if the city of Xiamen implemented its low carbon city
plan and realized its relative reduction target by the year 2020, it cannot be deemed a
“low carbon city” due to its large amount of GHG emissions.
Deficiency in the quality of GHG inventories and reduction targets

92
Although all the jurisdictions in our study have established relative reduction
targets for GHG mitigation, the lack of credible GHG inventories and forecasts has
undoubtedly made these reduction targets and relative strategies impossible to confirm
with evidence. In fact, the GHG inventory is a relatively new field that is highly technical
and requires a systematic set of data. More importantly, conducting more accurate GHG
inventories usually runs counter to the long-standing traditions of non-disclosure by
many sectors. In our study, only six cities have included some form of local GHG
inventories in their low carbon plans, some of which are not sector-specific and detailed
enough. Furthermore, few jurisdictions in our case study have forecasted the local GHG
mitigation efforts to help target setting and policy development.
In terms of the GHG reduction targets, none of plans has included absolute GHG
reduction targets. All cities and provinces have set the mitigation targets based on GHG
per unit of GDP in accordance with the national emission reduction targets by the central
government. However, as analyzed previously, reduction goals of GHG per unit of GDP
may not act as an effective target to reduce absolute carbon emission amounts. Moreover,
few jurisdictions have set long-term goals. Most plans reviewed only have short-term
goals for the year 2020. Many jurisdictions only have goals for 2015 because their
climate change plans are associated with the relevant twelfth five-year plan by the central
government.
Insufficient strategies and measures to respond to climate change
Based on our findings of this study, the climate action plans I read contain many
similar strategies and actions, which is quite evident in provincial-level plans. This is
partly because the central government has required each province to develop climate

93
change actions plans within a short time frame, which leads to the situation that most the
provincial plans simply follow the guidelines from the central government. For example,
existing plans highly recommend increasing the use of solar energy, improving efficiency
of carbon-intensive industry, etc. However, the traditional land use and urban form
strategies that are more relevant to urban planning are ignored. Moreover, I scarcely find
any local innovations in these documents, many of which have similar content to other
plans. In addition, as mentioned previously, most local plans do not cover climate change
adaptation; only the four Centrally Administered Municipalities emphasize adaptation in
their climate change plans since they are better positioned in terms of technical capacity.
Furthermore, none of the plans I reviewed has quantified the GHG reduction that
can be expected from successful implementation of proposed mitigation actions, which
echoes similar findings for plans in the US and Canada (Boswell et al. 2010; Baynham
and Stevens 2014). In fact, quantified GHG reduction amounts associated with mitigation
strategies should be included in climate action plans, especially considering that currently
some of the commonly adopted strategies in the climate action plans reviewed may not
work well to reduce GHG emissions in Chinese cities. For instance, a related study
indicated that high emission levels of coal-fired power plants will negate any gains made
by electric vehicles’ potential emission benefits in China (Huo et al. 2001). Since electric
vehicles still require the use of electricity mainly produced by coal-fired power plants, the
strategy of promoting electric vehicle use may not be a low carbon solution in Chinese
cities. In addition, as is indicated by the findings of chapter 2, in the context of Chinese
cities, increasing urban density might enhance heat island effect, which would increase
building energy consumption. Thus, the effectiveness of urban density policies should be

94
re-evaluated with potential trade-offs between transportation and building GHG
emissions.
Inadequate stakeholder engagement
Public participation is especially important for climate change issues because it is
the essential approach to advocate for a social movement to change people’s carbon
emitting behavior and to build resilience to climate change impacts (Blanco et al. 2009).
In addition, effective public participation programs would help make climate change
plans inherently more localized and contextual (Baker et al. 2012). Although the majority
of plans I reviewed have strategies for raising public awareness and educating citizens
about climate change concepts, I find little evidence of public participation and
stakeholder engagement in the plan creation process. Most of the plans were prepared by
local Development and Reform Commissions without a broad stakeholder constituency
involved, which confirms Li’s (2013) findings that the making of climate adaption
policies in China only includes government stakeholders and scientists and excludes
other affected stakeholders such as the local residents and smaller businesses. Relevant
interview results also indicate that there is a lack of understanding of stakeholder
participation among government officials (Li and Song 2015). In this sense, involving the
public and other relevant stakeholders in developing future climate action plans will be
an enormous challenge for Chinese jurisdictions.
Weak horizontal coordination
In effect, the current local climate change planning and policy formation are still
concentrated in limited agencies and departments within municipalities in different
climate change governance contexts (Betsill and Bulkeley 2006; Bulkeley and Kern 2006;
95
Wheeler 2008; Bulkeley et al. 2009; Baker et al. 2012; Kasa et al. 2012). Our results
confirmed this issue in the Chinese context: little evidence of horizontal coordination in
climate change planning stages was found since the plans are usually exclusively
developed by the Development and Reform Commission, whereas it requires all relevant
government sectors and some private sectors to implement them. Although the
Development and Reform Commission has more power and authority compared to other
government sectors, it is still difficult to coordinate implementation of climate change
actions, which are often deployed in a highly fragmented manner across a jurisdiction
(Bulkeley et al. 2009).
The horizontal networking and cooperating between jurisdictions is also currently
lacking. The central government has made significant efforts in establishing national pilot
programs to enhance local networking and learning among local governments on
addressing climate change issues. However, such horizontal network is generally not easy
to establish or act effectively based on the current centralized political system in China
(Li and Wu 2012). However, it is worth noting that networks and programs that operate
at various political levels have been recognized as critical to enhance local capabilities by
exchanging information and experience, providing access to expertise, etc (Betsill and
Bulkeley 2006, Bulkeley et al. 2009, Bulkeley 2013).
Top-down nature of climate change planning in China
Based on China’s current centralized and hierarchical political system, provinces,
autonomous regions, and municipalities need to seek the approval of the central
government to obtain support and legitimacy for subnational governance and
management (Li and Wu 2012). This is evident with current subnational climate change

96
planning in China in that cities and provinces are eager to become low carbon pilot cities
and provinces in order to get support and legitimacy from the central government. Based
on our study, central governmental incentives currently play an important role in shaping
provincial and municipal plans. This is in contrast to the findings of similar studies
conducted in developed countries, where the local and regional efforts on climate change
policy development have been deemed “bottom-up” approaches (Rabe 2004, Lutsey and
Sperling 2008; Wheeler 2008) or “multi-level governance” approaches (Betsill and
Bulkeley 2006; Betsill and Bulkeley 2007; Bulkeley et al. 2009; Kern and Bulkeley
2009; Bulkeley 2013).
That is, the Chinese government has set up a subnational climate change planning
framework that is characterized by the “top-down” approach. Some of the horizontal
coordination issues discussed in the previous section stem from this “top-down” planning
routine. The central government has used its power to establish the appropriate context
and environment for provincial and municipal action, which is important. However, given
the complicated nature of subnational politics and administration in China, coordination
of the power and needs between the central, provincial, and municipal government in
addressing climate change is still a huge challenge. In the current governmental setting,
the central government has power and responsibility for energy supply, infrastructure
investment, and planning, as well as the approval power for land acquisition and
management. It is worth noting that after economic reform, political power has somehow
devolved from the central government to provinces and municipalities, and a significant
degree of administrative power was delegated to local governments: individual localities
in China have become significant decision-making bodies on the use of their own

97
revenue (Li and Wu 2012). City governments has gained administrative resources such as
the ability to make comprehensive plans and effective power to control development
process, lease urban land and grant urban land use, and manage residential and
commercial development. Localities also have autonomy to some extent in setting local
tax rates and controlling local industrial, agricultural, energy, waste, and water sectors. A
typical example could be the local governments’ authority to levy tax on coal burning and
to subsidize cleaner energy sources (Koehn 2008). These local government powers are all
closely related to climate actions. However, one significant issue with the current system
is the difficulty with allocating local/provincial governmental power on climate change
issues due to the fact that economic growth is still the most important factor in assessing
the performance of subnational governments and their officials (Li 2013). The “top-
down” approach on climate change planning will still be constrained by this governance
bottleneck.
4.6. Conclusions
Chinese cities and provinces have begun to take important steps to reduce carbon
emissions and to combat climate change through climate change planning. Our review of
42 municipal and provincial plans provides a big picture of the current trend of
subnational climate action planning in China. The plan evaluation methods and
framework adapted from widely cited literature in developed country contexts is still
valid in terms of comprehensively analyzing the quality and contents of subnational
climate change plans in China. The results reveal that subnational plans set short-term
mitigation targets based on the proportion of GHG reduction per unit of GDP, which
generally coincides with the emission reduction targets set by the central government. A
large number of the plans are similar in content, without evidence of local innovation. In

98
addition, most of the plans have a comprehensive awareness of climate change impacts
but fail to assess local vulnerability and mitigation/adaptation capabilities. Sector-specific
GHG baseline inventories and forecasts are rarely present in either provincial or
municipal plans. Implementation strategies and follow-up monitoring/evaluation progress
are also currently lacking.
The planning interventions of the 42 jurisdictions cover a wide range of strategies,
which include changes in the built environment (e.g., urban form and land use,
transportation, buildings), natural environment (e.g., water, agriculture, carbon sinks),
economic sector (e.g., industry) and people’s behavior (e.g., lifestyle shifts). The current
climate action plans in Chinese jurisdictions focus predominantly on the industrial and
energy sectors, while the land use and urban form strategies for addressing climate
change are somewhat neglected. Moreover, most local plans pay little attention to the
dimension of adapting to climate change; little evidence was found regarding mitigation
and adaptation integration to identify synergies and avoid maladaptation.
99
REFERENCES
Baker, I., A. Peterson, G. Brown, and C. McAlpine. 2012. “Local Government Response to the Impacts of Climate Change: An Evaluation of Local Climate Adaptation Plans.” Landscape
and Urban Planning 107 (2): 127–136.
Bassett, E., and V. Shandas. 2010. “Innovation and Climate Action Planning.” Journal of the
American Planning Association 76 (4): 435–450.
Baynham, M., and M. Stevens. 2014. “Are We Planning Effectively for Climate Change? An Evaluation of Official Community Plans in British Columbia.” Journal of Environmental
Planning and Management 57 (4): 557–587.
Berke, P. 2002. “Does Sustainable Development Offer A New Direction for Planning? Challenges for the Twenty-first Century.” Journal of Planning Literature 17: 21–36.
Berke, P., and M. Conroy. 2000. “Are We Planning for Sustainable Development? An Evaluation of 30 Comprehensive Plans.” Journal of the American Planning Association 66 (1): 21–33.
Berke, P., and S. French. 1994. “The Influence of State Planning Mandates on Local Plan Quality.” Journal of Planning Education and Research 13 (4): 237–250.
Berke, P., and D. Godschalk. 2009. “Searching for the Good Plan: A Meta-Analysis of Plan Quality Studies.” Journal of Planning Literature 23 (3): 227–240.
Berke, P., G. Smith, and W. Lyles. 2012. “Planning for Resiliency: Evaluation of State Hazard Mitigation Plans Under the Disaster Mitigation Act.” Natural Hazards Review 13 (2): 139–149.
Betsill, M. 2001. “Mitigating Climate Change in US Cities: Opportunities and Obstacles.” Local
Environment 6 (4): 393–406.
Betsill, M., and H. Bulkeley. 2006. “Cities and the Multilevel Governance of Global Climate Change.” Global Governance 12 (2): 141–159.
Betsill, M., and H. Bulkeley. 2007. “Looking Back and Thinking Ahead: A Decade of Cities and Climate Change Research.” Local Environment 12 (5): 447–456.
Blanco, H., M. Alberti, R. Olshansky, S. Chang, S. M. Wheeler, J. Randolph, J. B. London, et al. 2009. “Shaken, Shrinking, Hot, Impoverished and Informal: Emerging Research Agendas in Planning.” Progress in Planning 72 (4): 195–250.
Boswell, M., A. Greve, and T. Seale. 2010. “An Assessment of the Link Between Greenhouse Gas Emissions Inventories and Climate Action Plans.” Journal of the American Planning
Association 46 (4): 112.
Brody, S. 2003. “Are We Learning to Make Better Plans? A Longitudinal Analysis of Plan Quality Associated with Natural Hazards.” Journal of Planning Education and Research 23 (2):191–201.
Bulkeley, H. 2010. “Cities and the Governing of Climate Change.” Annual Review of

100
Environment and Resources 35: 229–253.
Bulkeley, H. 2013. Cities and Climate Change. London: Routledge.
Bulkeley, H., and K. Kern. 2006. “Local Government and the Governing of Climate Change in Germany and the UK.” Urban Studies 43 (12): 2237–2259.
Bulkeley, H., H. Schroeder, K. Janda, J. Zhao, A. Armstrong, S. Y. Chu, and S. Ghosh. 2009.“Cities and Climate Change: The Role of Institutions, Governance and Urban Planning.” Paper presented at the World Bank Urban Research Symposium: Cities and
Climate Change, Marseille, June 28–30.
Burby, R. 2005. “Have State Comprehensive Planning Mandates Reduced Insured Losses from Natural Disasters?” Natural Hazards Review 6 (2): 67–81.
Burby, R., and P. May. 1997. Making Governments Plan. Baltimore, MD: Johns Hopkins University Press.
China Daily. 2009. China Targets Massive 40-45% Carbon Cut. [online] Available from: http://www.chinadaily.com.cn/cndy/2009-11/27/content_9060500.htm [Accessed 10 May 2014].
China’s National Assessment Report on Climate Change. 2007. Beijing: Science Press (in Chinese).
City of Chongqing. 2009. Chongqing Strategies for Responding to Climate Change. Chongqing: Author (in Chinese).
City of Hangzhou. 2011. Hangzhou Low Carbon City Development Plan for the Twelfth Five-
year Period. Hangzhou: Author (in Chinese).
City of Tianjin. 2010. Tianjin Strategies for Responding to Climate Change. Tianjin: Author (in Chinese).
City of Xiamen. 2010. Xiamen Low Carbon City Comprehensive Plan. Xiamen: Author (in Chinese).
Conroy, M., and P. Berke. 2004. “What Makes A Good Sustainable Development Plan? An Analysis of Factors that Influence Principles of Sustainable Development.” Environment
and Planning A 36: 1381–1396.
Dhakal, S., and M. Betsill. 2007. “Challenges of Urban and Regional Carbon Management and the Scientific Response.” Local Environment 12 (5): 549–555.
Donaghy, K. 2007. “Climate Change and Planning: Responding to the Challenge.” Town
Planning Review 78 (4): i–xiii.
Godschalk, D.R., T. Beatley, P. Berke, D. Brower, and E. J. Kaiser. 1999. Natural Hazard
Mitigation: Recasting Disaster Policy and Planning. Washington, DC: Island Press.
Huo, H., Q. Zhang, M. Q. Wang, D. G. Streets, and K. He. 2010. “Environmental Implication of Electric Vehicles in China.” Environmental Science & Technology 44 (13): 4856–4861.

101
ICLEI. 2002. What Is the Cities for Climate Protection (CCP) Campaign? [online] Available from: http://www.iclei.org/us/usccp.html [Accessed 26 December 2013].
Kasa, S., M. D. Leiren, and J. Khan. 2012. “Central Government Ambitions and Local Commitment: Climate Mitigation Initiatives in Four Municipalities in Norway and Sweden.” Journal of Environmental Planning and Management 55 (2): 211–228.
Kern, K., and H. Bulkeley. 2009. “Cities, Europeanization and Multi-level Governance: Governing Climate Change Through Transnational Municipal Networks.” JCMS: Journal of
Common Market Studies 47 (2): 309–332.
Koehn, P. 2008. “Underneath Kyoto: Emerging Subnational Government Initiatives and Incipient Issue-Bundling Opportunities in China and the United States.” Global Environmental
Politics 8 (1): 53–77.
Kousky, C., and S. Schneider. 2003. “Global Climate Policy: Will Cities Lead The Way?” Climate Policy 3 (4): 359–372.
Li, B. 2013. “Governing Urban Climate Change Adaptation in China.” Environment &
Urbanization 25 (2): 413–427.
Li, C., Z. Ma, Q. Zheng, T. Shao, and H. Zeng. 2011. “Comparative Studies on Low-Carbon City Development.” Urban Studies 18: 31–35 (in Chinese).
Li, Y., and F. Wu. 2012. “The Transformation of Regional Governance in China: The Rescaling of Statehood.” Progress in Planning 78 (2): 55–99.
Li, Z., S. Chang, L. Ma, P. Liu, L. Zhao, and Q. Yao. 2012. “The Development of Low-Carbon Towns in China: Concepts and Practices.” Energy 47 (1): 590–599.
Lindseth, G. 2004. “The Cities for Climate Protection Campaign (CCPC) and the Framing of Local Climate Policy.” Local environment 9 (4): 325–336.
Liu, J., and X. Deng. 2011. “Impacts and Mitigation of Climate Change on Chinese Cities.” Current Opinion in Environmental Sustainability 3 (3): 188–192.
Liu, W., and C. Wang. 2010. “Practice and Patterns of Low Carbon City Development.” China
Population Resources Environment 20: 17–22 (in Chinese).
Lutsey, N., and D. Sperling. 2008. “American’s Bottom-up Climate Change Mitigation Policy.” Energy Policy 36 (2): 673–685.
National Bureau of Statistics of China. 2014. Urban Statistical Yearbook of China. Beijing: China Statistic Press (in Chinese).
National Development and Reform Commission of People’s Republic of China. 2010. Announcement of the Plan to Develop Low Carbon Provinces and Low Carbon Cities. [online] Available from: http://www.gov.cn/zwgk/2010-08/10/content_1675733.htm (in Chinese) [Accessed 14 May 2014].
National Development and Reform Commission of People’s Republic of China. 2012.

102
Announcement of the Plan to Develop the Second National Low Carbon Pilot Cities and
Provinces. [online] Available from: http://www.ccchina.gov.cn/nDetail.aspx?newsIdD28162&TIdD60 (in Chinese) [Accessed 14 May 2014].
Nelson, A., and S. French. 2002. “Plan Quality and Mitigating Damage from Natural Disasters: A Case Study of the Northridge Earthquake with Planning Policy Considerations.” Journal of
the American Planning Association 68 (2): 194–207.
Ng, M. 2012. “A Critical Review of Hong Kong’s Proposed Climate Change Strategy and Action Agenda.” Cities 29 (2): 88–98.
Pamlin, D., S. Pahlman, and E. Weidman. 2009. A Five-Step-Plan for A Low Carbon Urban
Development. [online] Available from: assets.panda.org/downloads/wwf_ericsson_5_step_plan.pdf [Accessed 18 May 2014].
Rabe, B. 2004. Statehouse and Greenhouse: The Emerging Politics of American Climate Change
Policy. Washington, DC: Brookings Institution Press.
Ruth, M., and D. Coelho. 2007. “Understanding and Managing the Complexity of Urban Systems Under Climate Change.” Climate Policy 7: 317–336.
Study Group of China Energy and Carbon Emissions. 2009. 2050 China Energy and CO2
Emissions Report. Beijing: Science Press (in Chinese).
Tang, Z., M. K. Lindell, C. S. Prater, and S. D. Brody. 2008. “Measuring Tsunami Hazard Planning Capacity on the U.S. Pacific Coast.” Natural Hazards Review 9 (2): 91–100.
Tang, Z., S. D. Brody, C. Quinn, L. Chang, and T. Wei. 2010. “Moving from Agenda to Action: Evaluating Local Climate Change Action Plans.” Journal of Environmental Planning and
Management 53 (1): 41–62.
Wheeler, S. 2008. “State and Municipal Climate Change Plans: The First Generation.” Journal of
the American Planning Association 74 (4): 481–496.
While, A., A. Jonas, and D. Gibbs. 2010. “From Sustainable Development to Carbon Control: Eco-State Restructuring and the Politics of Urban and Regional Development.” Transactions of the Institute of British Geographers 35 (1): 76–93.
Xin, Z., and Y. Zhang. 2008. “Low Carbon Economy and Low Carbon City.” Urban Studies 15: 98–102 (in Chinese).
Zhang, J. 2010. “Reconsideration of the Trend of Low-Carbon City Development in China.” Planners 26 (5): 5–8 (in Chinese)

103
CHAPTER 5: CONCLUSION AND FUTURE RESEARCH
5.1. Summary
I have empirically linked neighborhood physical density, which is measured by
floor area ratio (FAR), to household residential electricity consumption. I find that
seasonality and dwelling type condition the effect of neighborhood densities on
electricity consumption. Neighborhood density could significantly influence household
electricity consumption during summer months, while I did not find any linkages
between neighborhood density and household electricity usage in winter months. For
households located in slab and tower apartments, there exists a positive relationship
between neighborhood density and electricity consumption in summer months since
increasing physical density exacerbates the heat island effect in these neighborhoods.
Nevertheless, for single-family houses located in low-density neighborhoods, increasing
neighborhood density could significantly reduce residential electricity consumption in
summer months, which can be explained by more mutual shading, decreased amount of
exposed surface, and reduced surface heating. This result is consistent with recent
simulation studies on urban density and building energy consumption (Quan and Yang
2014).
I also find empirical evidence that various urban form and geomorphometry
features affect residential electricity usage intensity: urban porosity and roughness length
have consistent spillover effects on electricity usage intensity. While I find little evidence

104
that NDVI has similar spillover effect, it could significantly reduce electricity usage
intensity in its reference tract. Additionally, insolation per building volume could
significantly increase electricity usage intensity, especially in summer months.
Nevertheless, these effects generated by ventilation, NDVI, and insolation do not appear
to exist for gas usage intensity in winter. Accounting for both spatial dependence among
residuals and spatial spillover of ventilation and vegetation variables, our final spatial
regression model explains up to 65% and 59% of variations in summer electricity and
winter gas usage intensity at the census tract level. Findings in Chapter 2 and 3 both
reveal that urban form and geomorphometry features have seasonally varied effects on
building energy consumption. My results indicate that the summer effects are often
significant, while winter effects are not.
I find the first-generation climate action plans in Chinese jurisdictions focus
predominantly on the industrial and energy sectors, while the important urban form and
land use strategies for mitigating climate change are somewhat neglected. The planning
interventions in the 42 municipal and provincial plans I evaluated cover a wide range of
strategies, which include changes in the built environment (e.g., land use and urban form,
buildings, transportation), natural environment (e.g., water, agriculture, carbon sink),
economic sector (e.g., industry) and people’s behavior (e.g., lifestyle shifts). Most local
plans pay little attention to climate change adaptation; little evidence was found regarding
mitigation and adaptation integration to identify synergies and avoid maladaptation. In
addition, most plans have the following issues/challenges: vague definition of what
characterizes a low carbon city/region, deficiency in the quality of GHG inventory and

105
reduction targets, inadequate stakeholder engagement, weak horizontal coordination, and
the top-down natural of climate change planning in China.
5.2. Policy Implications
This dissertation has several implications for policy and practice concerning
energy-efficient buildings and low-carbon cities. In order to promote low-carbon
buildings, incentives and policies are needed not only for buildings and households, but
also for neighborhood environments and urban form. For local policy makers and
planners, the effects of urban form (especially physical density) on building energy
consumption should be distinctly considered for different seasons and for different types
of housing stock and neighborhoods. Neighborhood design guidelines could also include
detailed seasonal strategies for different types of dwelling units. For instance, in terms of
controlling residential energy consumption through the lens of urban form, heat island
mitigation strategies should be very important for residential neighborhoods composed of
slab and tower apartments with a dense urban form in summer months. For low-density
single-family neighborhoods, regulating floor area ratio to ensure more mutual shading
between buildings, and external shading from trees might be effective measure to
improve building energy performance in summer.
This reach can also enable planners to think more critically about low-carbon
urban form and formulate spatially explicit policies to improve residential energy
efficiency through land use patterns. The findings of Chapter 3 indicate that local
planning efforts to mitigate climate change should include urban ventilation strategies.
Additionally, the spatial spillover effects should be carefully considered when developing
these strategies in summer. For instance, in order to reduce building electricity EUI, the
urban porosity level in adjacent neighborhoods should be kept high to promote the

106
intrusion of the cool air, especially in summer months. Meanwhile, the surface roughness
should be kept low to potentially formulate ventilation path in urban environments
(Barlag and Kuttler 1990; Gál and Unger 2009). Finally, regardless of the effectiveness
of current local planning efforts to increase building energy efficiency at the building or
household levels (e.g., building energy use benchmarking ordinance,
weatherization assistance programs), neighborhood-based urban form strategies should
become part of the policy mix to control EUI, as well as to mitigate and adapt to climate
change. Further, neighborhood-based spatial policy, such as area-based tree-canopy and
urban porosity requirement, as well as solar radiation management strategies, should be
added to current local climate actions plans.
At this point, it is far from clear how cities and regions can best mitigate climate
change and achieve low carbon development through planning. Findings in Chapter 4 has
the following implications for policy and practice:
The definition of a low carbon city/region should be clarified. Detailed guidelines
for developing subnational climate change plans with long-term, clarified and
standardized goals need to be put forward to improve the quality and consistency of
provincial and municipal plans. Both climate change mitigation and adaptation toolkits
are needed as guidance for Chinese jurisdictions. Moreover, because of the varying socio-
economic and urbanization stages of different jurisdictions in China, local jurisdictions
need more innovative policies, strategies, and tools that reflect local geographic and
socio-economic realities in order to better mitigate and adapt to climate change. Local
and provincial plans need to connect their mitigation actions with estimated GHG
reduction amounts, which would enhance the credibility of the plans and also ensure that

107
the given policy regimes would be likely to lead to the targeted regional/local GHG
reduction goals (Baynham and Stevens 2014). In addition, mitigation and adaption
policies and actions should be developed in an integrated manner with concerns about the
risks of maladaptation and identification of potential synergies.
Given the current “top-down” nature of climate change planning in China, higher
tiers of government could consider mandating the inclusion of climate change targets and
policies in local comprehensive plans. Such form of “planning mandate” has potential to
lead to better quality plans (Berke and French 1994; Burby and May 1997; Tang et al.
2010) and increase the chance of achieving desired planning outcomes (Burby and May
1997; Burby 2005; Baynham and Stevens 2014). In addition, incorporating climate
change into comprehensive plans may address the concerns of plan integration and
promote more efficient use of resources, as many comprehensive plans may already
include information, goals, policies, and implementation strategies directly relevant to
climate change. Local comprehensive plans can also serve as an effective means for
citizens and officials to create visions and develop goals and objectives to deal with
climate change issues locally. Furthermore, comprehensive plans could help to better
coordinate the actions of various local government sectors which may play important
roles in climate change (Burby 2005).
Meanwhile, local capacity to develop and evaluate climate change plans should be
enhanced. For Chinese jurisdictions, conducting reliable GHG inventories and
establishing efficient reduction targets are urgent endeavors. It is also imperative to
establish long-term systematic planning frameworks in which GHG mitigation progresses
are monitored and evaluated on a regular basis and actions can be revised if they do not

108
work well to combat climate change. Of course, technical capacity is not enough. Future
climate change planning in China should include community engagement and public
participation, which promote social and institutional learning, and might further lead to
cultural shifts on climate change issues.
Allocating local/provincial governmental power on climate change issues would
still be a significant challenge, but it might be achievable if the current bureaucratic
assessment system is reformed and the internalization of addressing climate change
issues is disconnected with economic growth (Li 2013). Vertical intergovernmental
coordination is extremely important in the Chinese context, in which reconciling central
and local interests would pave the way for implementation. Moreover, as is also indicated
in this study, horizontal coordination across different sectors of local government is
important to avoid the problem of “institutional silos” (Baker et al. 2012) since climate
change is a cross-sectoral issue for localities. It is necessary to develop an inter-
governmental framework for horizontal coordination. For instance, a local government
office or committee with defined leadership on climate change mitigation and adaptation
can be established to coordinate with all horizontal government units to designate policy
and action implementation to responsible agencies, and to oversee progress made by each
government unit.
5.3. Limitations and future research
There are still several limitations in Chapter 2 and Chapter 3. First, I do not
explicitly model different pathways through which urban physical density affects
residential energy consumption. As mentioned in chapter 2, urban form might influence
building energy consumption through different paths, which might include solar access,
external shading, natural ventilation, and the heat island effect (Ko 2013; Quan et al.
109
2015). For instance, subdivisions with higher physical density are associated with less
insulation intensity, more mutual shading, lower levels of ventilation and vegetation,
which would in turn affect building energy consumption. Future research could consider
constructing or refining my urban form and geomorphometry metrics and employ a path
model to quantify energy-related trade-offs among these effects. Second, Both models in
Chapter 2 and Chapter 3 merely include building age as a proxy for the building-level
energy efficiency measure. The explanatory power of the multilevel regression model in
Chapter 2 might be improved if we could include several detailed building-level
characteristics that affect energy efficiency such as building geometry, glazing ratio27 and
the insulation of walls and windows. There is also a promising research opportunity in
which one can explore urban form effects at household-, building-, and neighborhood-
levels using a three-level hierarchical model. Third, the external validity is still limited
since I only focus on two cites in a similar climate zone. Future research should evaluate
various options for density in the context of different urban forms in different climates, so
as to find urban form strategies that produce net benefits for building energy efficiency in
each climate. In addition, the empirical evidence of seasonally varied effects in Chapter 2
and 3 suggest that future building energy performance simulation should focus more on
seasonal effects of urban form on building energy consumption. Finally, It is also
worthwhile to investigate the potential tradeoffs of urban density on building and
transportation energy consumption, so as to fully understand the effectiveness of urban
densification on climate change mitigation.
27 Glazing ratio is also known as the window-to-wall ratio. It measures the percentage area determined by dividing a building's total glazed area by its exterior envelope wall area. It is an important variable affecting building energy efficiency.

110
There are also several limitations in chapter 4. First, I focus on first-generation
climate change plans in China, with a sample of plans which are mainly adopted by “pilot
cities” and provinces with strong political will. Future studies could include the second
generation of subnational climate plans and test if the findings in this study can be
generalized to plans in other cities that are not “pilot cities”. Second, I only code discrete
policies/strategies for each climate change plan. Future studies could consider the lock-in
risks (Ürge-Vorsatz et al. 2018) of the proposed actions and evaluating synergies and
trade-offs between policies/strategies in a quantitative way and based on emerging
studies in this filed. Third, this study focuses on the planning stage of subnational climate
change actions rather than the implementation stage. It would be interesting to examine
whether these plans and actions have implemented in some way, and whether the
proposed policies and strategies are effective and efficient in mitigating climate change.
Empirical studies are needed to further examine if climate change plans play any causal
role in reducing greenhouse emissions, or they merely codify existing actions and
outcomes that would have been achieved in any case (Millard-Ball 2013; Millard-Ball
2012).

111
REFERENCES
Barlag, A. B., and W. Kuttler. 1990. “The Significance of Country Breezes for Urban Planning.” Energy and Buildings 15 (3–4): 291–297.
Gál, T., and J. Unger. 2009. “Detection of Ventilation Paths Using High-Resolution Roughness Parameter Mapping in a Large Urban Area.” Building and Environment 44 (1): 198–206.
Ko, Y. 2013. “Urban Form and Residential Energy Use: A Review of Design Principles and Research Findings.” Journal of Planning Literature 28 (4): 327–351.
Millard-Ball, A. 2012. “Do City Climate Plans Reduce Emissions?” Journal of Urban Economics 71 (3): 289–311.
Millard-Ball, A. 2013. “The Limits to Planning Causal Impacts of City Climate Action Plans.” Journal of Planning Education and Research 33 (1): 5–19.
Quan, S. J., Q. Li., G. Augenbroe, J. Brown, and P. P. Yang. 2015. “Urban Data and Building Energy Modeling : A GIS-Based Urban Building Energy Modeling System Using the Urban-EPC Engine.” In Planning Support Systems and Smart Cities, edited by Stan Geertman, Joseph Jr Ferreira, Goodspeed Robert, and John Stillwell, 447–469. Cham, Switzerland: Springer International Publishing.
Quan, S. J. and P. P. Yang. 2014. “Computing Energy Performance of Building Density , Shape and Typology in Urban Context.” Energy Procedia 61: 1602–1605.
Ürge-Vorsatz, D. C. Rosenzweig, R. J. Dawson, R. S. Rodriguez, X. Bai, A. S. Barau, K. C. Seto, and S. Dhakal. 2018. “Locking in Positive Climate Responses in Cities.” Nature Climate
Change 8: 1. doi:10.1038/s41558-018-0100-6.

112
APPENDIX 1: HOUSEHOLD SURVEY INSTRUMENT
Date: ____________ Time: ____________ Questionnaire #____________ Neighborhood: _____________Neighborhood ID: _____________Surveyors: _______________ Part 1: 1) Household address: ___________________________________________________________ 2) How many floors are in this building? Do not include basements or parking levels. _________ (Answer must be in the range from 1 up to 100) 3) On which floor is this housing unit located? ________________ (Answer must be in the range from 1 up to 100)
4) Building type of this housing unit: _______________________
1. Tower apartment 2. Slab apartment 3. Single-family house 4. Other, please specify: _________________________________ 5) Electricity meter ID: __________________________________ (Please record the identification number of the electricity meter of the household. See picture below for reference)
Part 2: 6) How long has your household lived in this housing unit? 1. Less than a year 2. 1 to 2 years 3. More than 2 years 7) In what year was this housing unit built? __________________________________________ (Answer must be in the range from 1900 up to 2015; if the survey respondent cannot provide exact information, ask the property manager of the neighborhood where the housing unit is located) 8) What is the total floor area in this housing unit (in square meter)? ______________________ (Answer must be in the range from 1 up to 999) 9) This housing unit has _____________ bedrooms, __________ living rooms and dining rooms. (Answers must be counts in the range from 1 up to 10)

113
10) On average, how much is your monthly electricity bill (in RMB2)? Your best estimate is okay. ______________________ 11) What is the main space heating equipment for this household? _________________________ 1. Radiant Floor Heating using electricity 2. Radiant Floor Heating using natural gas 3. Electric heating facility (air conditioning, electric heater) Part 3: 12) Please provide the following information about the family members living in this housing unit:
Family Member
Sex Age Work or not
Family Member
Sex Age Work or not
1 6
2 7
3 8
4 9
5 10
13) Which of the following categories best describes the average monthly income for all the adults living in this housing unit? 1. Less than 3000 RMB per month 2. 3000 to 8000 RMB per month 3. More than 8000 RMB per month 14) Which of the following categories best describes the homeownership of your household for this housing unit? 1. Renter 2. Owner 15) Air-conditioner count in this housing unit: _____________________ 16) Refrigerator count in this housing unit: ________________________ 17) Washing machine count in this housing unit: ___________________ 18) Electric water heater count in this housing unit: _________________ 19) Gas water heater count in this housing unit: ____________________ 20) Solar power water heater count in this housing unit: ______________ 21) Computer count in this housing unit: __________________________ 22) Television count in this housing unit: __________________________ Part 4: Please indicate if your household has the following conditions or takes the following actions: 23) Turn off all the lights when you leave a room for more than thirty minutes. 1. Never 2. Sometimes 3. Always 24) Your household uses energy-saving bulbs for lighting. 1. None of the light bulbs in this housing unit are energy-saving bulbs. 2. Some of the light bulbs in this housing unit are energy-saving bulbs. 3. All the light bulbs in this housing unit are energy-saving bulbs. 25) Your household regularly maintains the air-conditioner(s) in this housing unit. (e.g. clean the condenser, change the air filter, etc.) 1. Never 2. Sometimes 3. Always 26) Your household sets the room temperature higher than 26°C when using the air-conditioner(s) in summer. 1. Never 2. Sometimes 3. Always

114
27) Your household turns off major household appliances (e.g. televisions, computers, wireless router, etc.) when they are not in use. 1. Never 2. Sometimes 3. Always 28) Does this housing unit have tree shade? 1. No 2. Yes 29) Is your neighborhood adjacent to water bodies (e.g. rivers, lakes, etc.)? 1. No 2. Yes
Notes: 1The complete survey instrument was initially in Chinese; for brevity, I only translated the main survey components to English as a reference. 2RMB is the official unit of official currency in China.
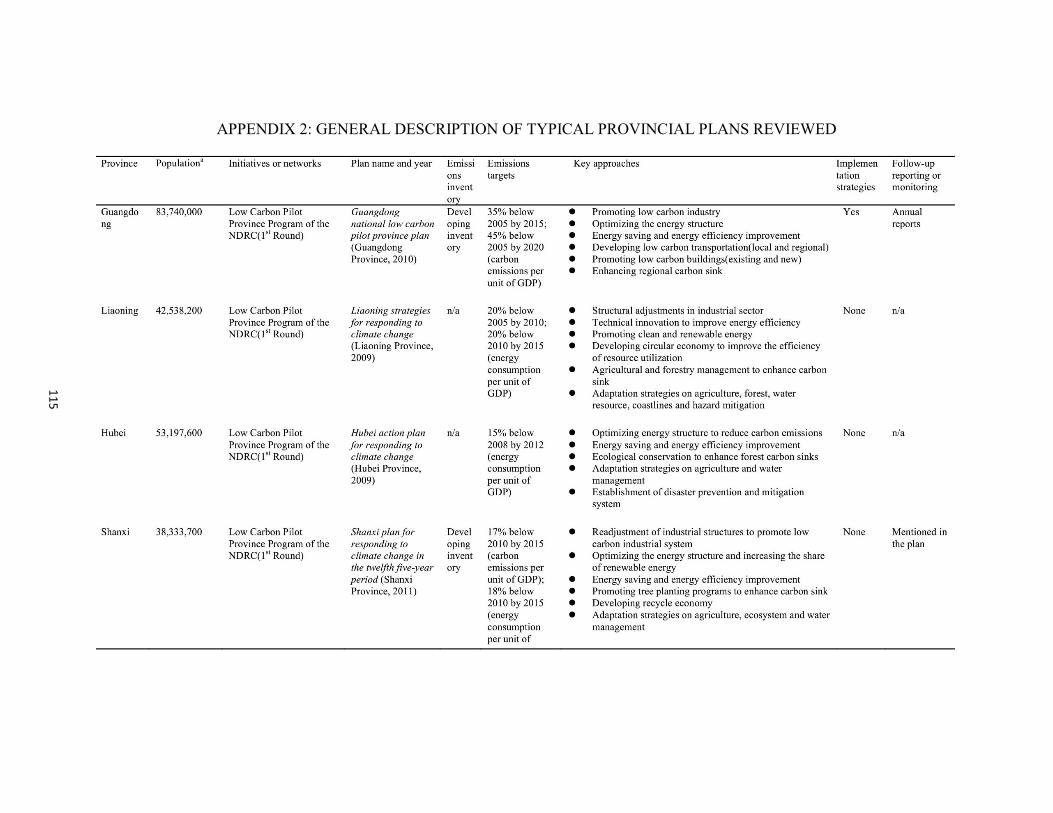
11
5
APPENDIX 2: GENERAL DESCRIPTION OF TYPICAL PROVINCIAL PLANS REVIEWED

11
6
Notes: n/a=not applicable aPopulation data are for the year 2009 from Urban Statistical Yearbook of China.
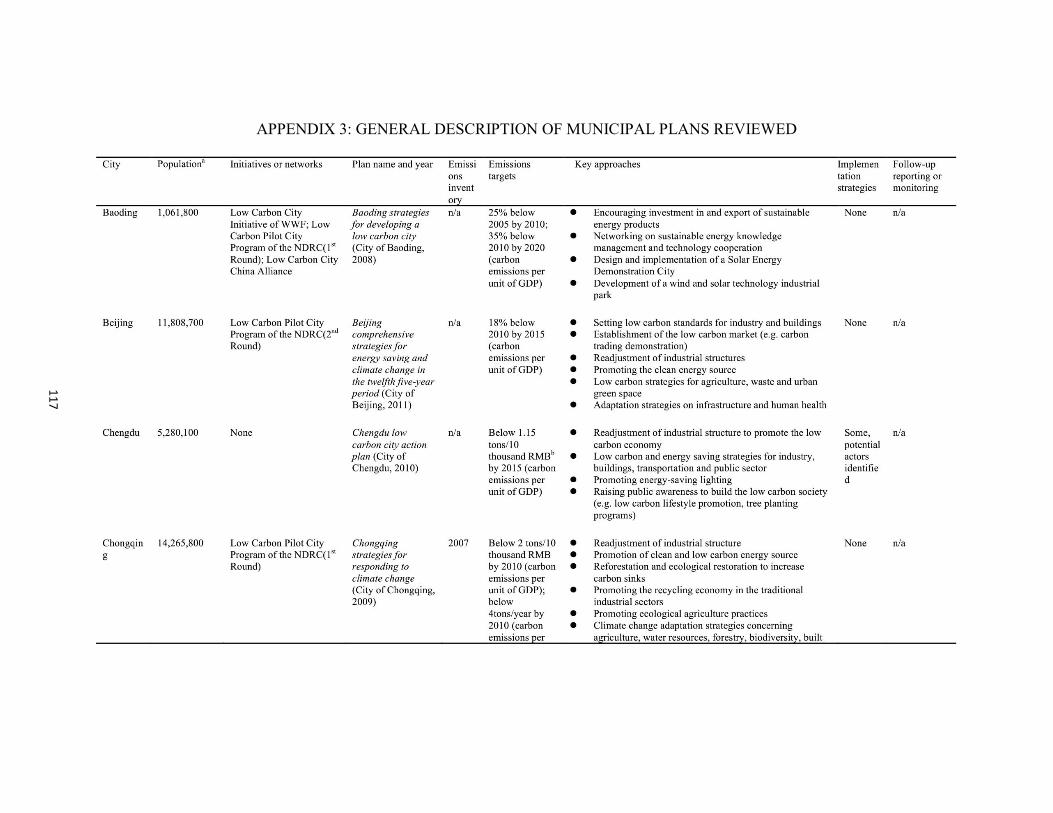
11
7
APPENDIX 3: GENERAL DESCRIPTION OF MUNICIPAL PLANS REVIEWED
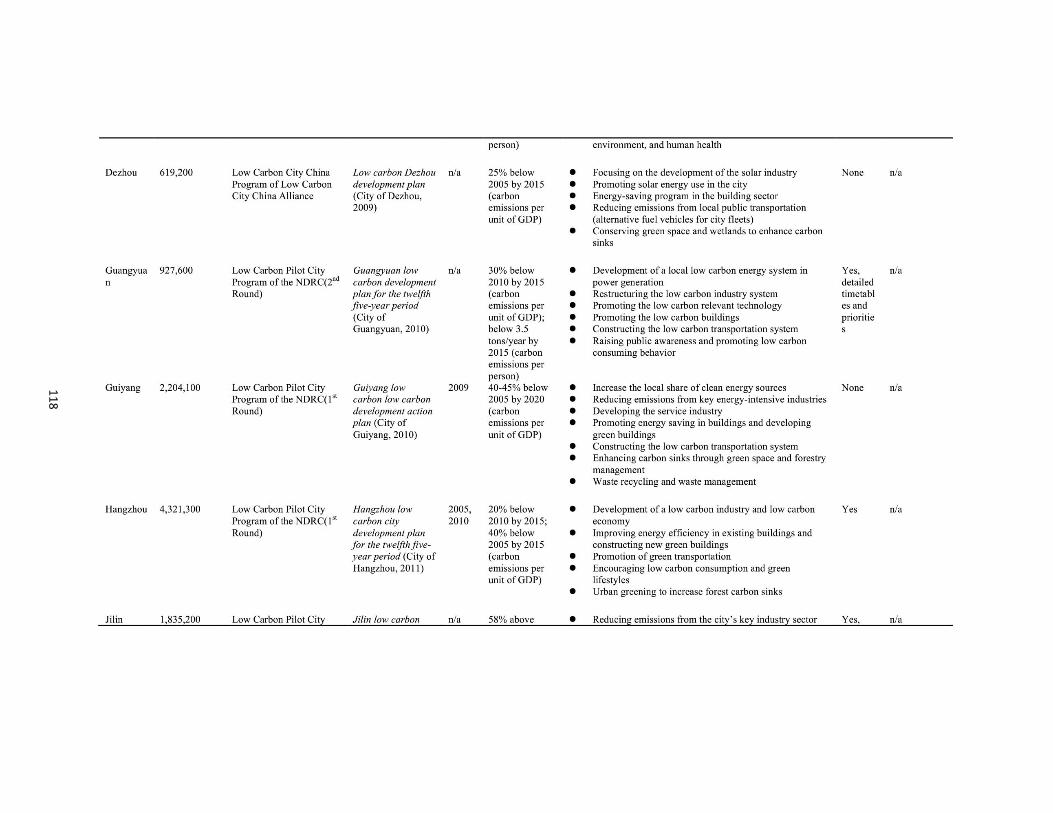
11
8
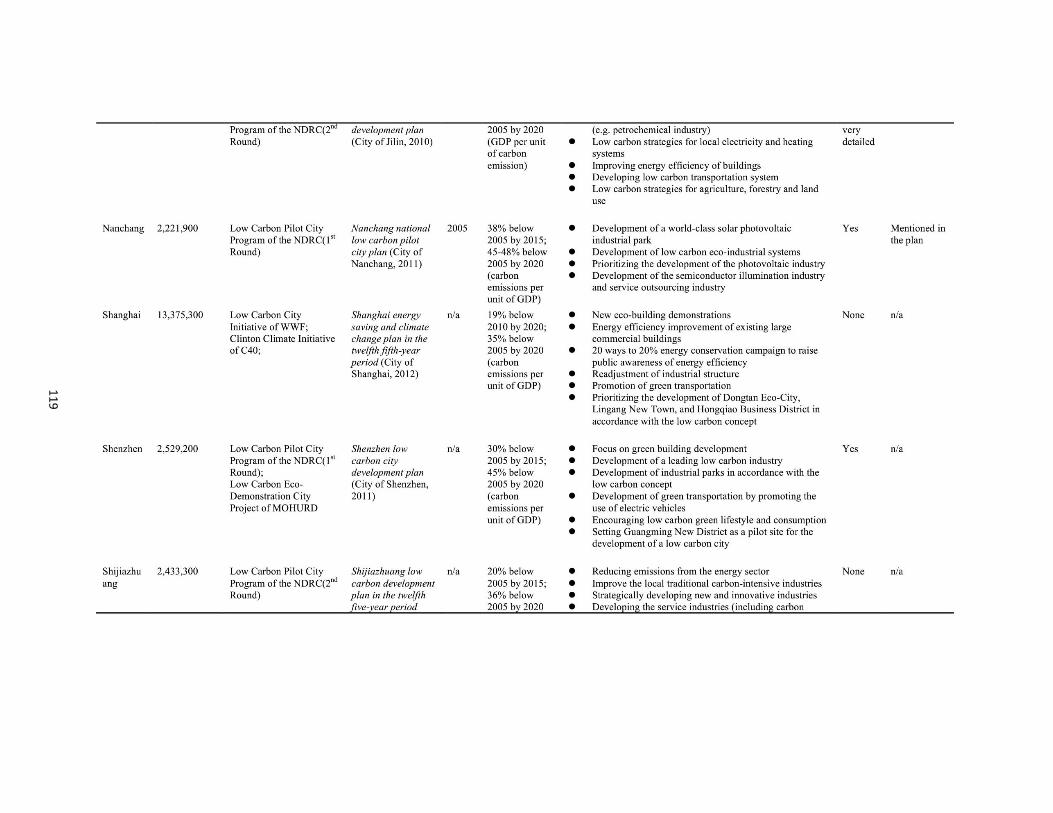
11
9

12
0
Notes: n/a=not applicable aPopulation data are for the year 2009 from Urban Statistical Yearbook of China. bRMB is the basic unit of the official currency of China.