essays in corporate finance - syracuse university
TRANSCRIPT

Syracuse University Syracuse University
SURFACE SURFACE
Dissertations - ALL SURFACE
5-14-2017
Essays in Corporate Finance Essays in Corporate Finance
Lea H. Stern Syracuse University
Follow this and additional works at: https://surface.syr.edu/etd
Part of the Business Commons
Recommended Citation Recommended Citation Stern, Lea H., "Essays in Corporate Finance" (2017). Dissertations - ALL. 680. https://surface.syr.edu/etd/680
This Dissertation is brought to you for free and open access by the SURFACE at SURFACE. It has been accepted for inclusion in Dissertations - ALL by an authorized administrator of SURFACE. For more information, please contact [email protected].

ABSTRACT
This dissertation consists of three chapters in corporate finance and private equity. Chapter 1,
“Incentives of Private Equity General Partners from Future Fundraising”, co-authored with Ji-
Woong Chung, Berk Sensoy and Michael Weisbach, studies the incentives of private equity
general partners (GPs). Lifetime incomes of GPs are affected by their current funds’ performance
not only directly, through carried interest profit-sharing provisions, but also indirectly by the
effect of the current fund’s performance on GP’s abilities to raise capital for future funds. In the
context of a rational learning model, which we show better matches the empirical relations
between future fundraising and current performance than behavioral alternatives, we estimate
that indirect pay for performance from future fundraising is of the same order of magnitude as
direct pay for performance from carried interest. Consistent with the learning framework,
indirect pay for performance is stronger when managerial abilities are more scalable and weaker
when current performance is less informative about ability. Specifically, it is stronger for buyout
funds than for venture capital funds, and declines in the sequence of a partnership’s funds. Total
pay for performance in private equity is both considerably larger and much more heterogeneous
than implied by the carried interest alone. Our framework can be adapted to estimate indirect pay
for performance in other asset management settings.
Uncertainty is ubiquitous in financial markets, and market participants form expectations and
learn about parameters, which may be the ability of general partners or the quality of a firm’s
governance structure. Assessing the quality of a firm's governance is valuable, which might
explain the recent growth of the governance industry. Yet, governance indices have been
criticized by researchers and practitioners alike, mainly on the grounds of overlooking firms'

heterogeneity and their specific governance needs. Chapter 2, “D&O Insurance and IPO
Performance: what can we learn from insurers?”, co-authored with Martin Boyer, provides new
insights into the ability of directors’ and officers’ (D&O) insurers to price risk, and in particular
risk related to governance characteristics. Therefore, learning by investors about governance
quality could be facilitated by providing investors with a market-based assessment of governance
as reflected in the D&O insurance premium. We investigate whether a firm’s D&O liability
insurance contract at the time of the IPO is related to insured firms’ first year post-IPO
performance. We find that insurers charge a higher premium per dollar of coverage to protect the
directors and officers of firms that will subsequently have poor first year post-IPO stock
performance. A higher price of coverage is also associated with a higher post-IPO volatility and
lower Sharpe ratio. Our results are robust to various econometric specifications and suggest that
even when the high level of information asymmetry inherent to the IPO context prevails, insurers
have information about the firms’ prospects that should be valuable to outside investors.
In Chapter 3, “A Learning-Based Approach to Evaluating Boards of Directors”, I develop a
general framework based on a theoretical model of learning to assess how investors react to the
appointment of new directors. Using predictions from a learning model, this chapter exploits the
cross-sectional variation in the learning-induced decline in stock return volatility over director
tenure to infer the marginal value of different kinds of directors. This new framework confirms
prior empirical findings and documents new results. For example, directors joining better
compensated boards have higher marginal value while the marginal value of a director joining an
entrenched board is muted. Furthermore, the estimates imply that governance related uncertainty
associated with the arrival of a new director accounts for 7% of return volatility, shedding light
on the extent to which governance matters.

ESSAYS IN CORPORATE FINANCE
by
Léa H. Stern
M.Sc., HEC Montréal, 2009
B.B.A., HEC Montréal, 2007
Dissertation
Submitted in partial fulfillment of the requirements for the degree of
Doctor of Philosophy in Business Administration
Syracuse University
May 2017

Copyright © Léa H. Stern 2017
All Rights Reserved

v
ACKNOWLEDGEMENTS
I would like to thank my advisor, David Weinbaum for his wise and friendly guidance
during my years at Syracuse University. I would also like to thank the members on my
dissertation committee for their advice throughout this process: Amber Anand, Ravi Shukla,
Yildiray Yildirim and Mike Weisbach. I am deeply grateful to Mike Weisbach, who has always
been the perfect mentor. He set the example and he set the bar, and I am incredibly fortunate to
have been his student.
I would like to thank Martin Boyer, who has been instrumental in my career and without
whom I would not have decided to pursue a Ph.D.
I would also like to thank Michel Benaroch for how helpful he has always been.
I would like to thank my amazing parents, Karl Ferdinand Stern and Catherine Stern. I
couldn’t be more proud of them and I thank them for their unwavering support and their
inspiring spirit.
Finally, I also want to thank my husband, Ronan Le Bras and my sons, Eitan and Eli, for
making this whole journey an incredibly fun one.

vi
TABLE OF CONTENTS
ABSTRACT ..................................................................................................................................... i
ACKNOWLEDGEMENTS ............................................................................................................ v
LIST OF TABLES .......................................................................................................................... x
LIST OF FIGURES ...................................................................................................................... xii
Chapter 1. Incentives of Private Equity General Partners from Future Fundraising ........... 1
1. Theoretical Framework ......................................................................................................... 10
1.1 Setup ............................................................................................................................... 10
1.1.1 Updating beliefs ...................................................................................................... 11
1.1.2 Follow-on fund size, conditional on raising a follow-on ........................................ 12
1.1.3 Probability of raising a follow-on ........................................................................... 12
1.2 Cross-sectional implications .......................................................................................... 13
1.2.1 Sensitivity of future fundraising to current performance across partnership types 13
1.2.2 Sensitivity of future fundraising to current performance in the sequence of funds
within a partnership............................................................................................................... 15
1.2.3 Sensitivity of future fundraising to the sequence of funds within a partnership .... 15
1.3 Lifetime compensation of GPs ....................................................................................... 16
1.4 Empirical Implementation .............................................................................................. 18
2. Data ....................................................................................................................................... 19
3. The Empirical Relations between Current Performance and Future Fundraising ................ 22
3.1 Estimates without sequence effects ................................................................................ 23

vii
3.2 Sequence-specific estimates ........................................................................................... 26
3.3 Measurement issues........................................................................................................ 29
4. Estimating Direct and Indirect Pay for Performance ............................................................ 30
4.1 Discounting future GP compensation ............................................................................ 31
4.2 Direct (explicit) pay for performance ............................................................................. 32
4.3 Indirect pay for performance from future fundraising ................................................... 33
4.3.1 Estimates ignoring sequence effects ....................................................................... 36
4.3.2 Estimates accounting for sequence effects ............................................................. 37
4.4 Factors Omitted from the Estimates ............................................................................... 39
5. Conclusion ............................................................................................................................ 42
Chapter 2. D&O Insurance and IPO Performance: what can we learn from insurers? ..... 63
1. Introduction ........................................................................................................................... 63
2. Directors’ and officers’ insurance: a primer ......................................................................... 66
2.1 Timing of D&O insurance information release.............................................................. 67
2.2 The pricing of D&O insurance coverage ....................................................................... 67
3. Hypotheses development, data and variables description ..................................................... 69
3.1 Hypotheses and data ....................................................................................................... 69
3.2 Description of variables ................................................................................................. 73
3.2.1 Dependent variables ................................................................................................ 73
3.2.2 Main independent variables .................................................................................... 74
3.3 Sample Statistics ............................................................................................................ 75
4. Analysis of results ................................................................................................................. 76

viii
4.1 Preliminary results.......................................................................................................... 76
4.2 The Predictive Power of D&O Insurance Rate-on-Line ................................................ 78
5. Robustness checks ................................................................................................................ 82
5.1 Likelihood of carrying D&O insurance and two-step regression .................................. 83
5.2 Simultaneous (feedback) effects of risk and return ........................................................ 85
6. Discussion and conclusion .................................................................................................... 85
Chapter 3. A Learning-Based Approach to Evaluating Boards of Directors ..................... 113
1. Introduction ......................................................................................................................... 113
2. Background and related literature ....................................................................................... 122
3. A learning model of board quality: theoretical framework and empirical implementation 124
3.1 Bayesian learning ......................................................................................................... 124
3.2 Empirical design ........................................................................................................... 125
3.2.1 Regression model .................................................................................................. 125
3.2.2 Data sources and descriptive statistics .................................................................. 126
4. Empirical relationship between volatility and director tenure ............................................ 127
4.1 Full sample ................................................................................................................... 127
4.2 Samples of plausibly exogenous director appointments .............................................. 130
4.3 Additional tests ............................................................................................................. 133
4.3.1 Young vs. seasoned boards ................................................................................... 133
4.3.2 All firm-months, ex-ante uncertainty and professional directors ......................... 134
4.3.3 Matched sample .................................................................................................... 136
4.4 The importance of directors ......................................................................................... 137

ix
4.4.1 How much do directors matter? ............................................................................ 137
4.4.2 Importance of directors and value creation ........................................................... 138
5. The marginal return to ability of directors .......................................................................... 140
5.1 Prior empirical evidence on board and director characteristics ................................... 140
5.2 Cross-sectional analysis ............................................................................................... 143
5.2.1 Director characteristics ......................................................................................... 144
5.2.2 Board characteristics ............................................................................................. 145
5.2.3 Firm level characteristics ...................................................................................... 147
6. Conclusion .......................................................................................................................... 148
Appendix 1-A: Interim IRR ........................................................................................................ 174
Appendix 2-A: Timeline of the D&O insurance acquisition and information release ............... 178
Appendix 2-B: Examples. ........................................................................................................... 179
Appendix 2-C: Definition of control variables. .......................................................................... 180
Appendix 3-A: Variable Definitions ........................................................................................... 185
Appendix 3-B: Learning Model .................................................................................................. 188
Appendix 3-C: SimScore ............................................................................................................ 192
Appendix 3-D: Estimating Director Related Uncertainty ........................................................... 194
LIST OF REFERENCES ............................................................................................................ 195
VITA ........................................................................................................................................... 209

x
LIST OF TABLES
Table 1-1 Descriptive Statistics .................................................................................................... 49
Table 1-2 Descriptive Statistics by Fund Sequence ...................................................................... 50
Table 1-3 Follow-on Fundraising Regressions ............................................................................. 55
Table 1-4 Follow-on Fundraising Regressions: Sequence Interactions ........................................ 56
Table 1-5 Sensitivity of GP Lifetime Revenue to Current Performance ...................................... 59
Table 1-6 Sensitivity of GP Lifetime Revenue to Current Performance: Sequence Interactions . 60
Table 2-1 Number of Canadian IPOs per year in sample: Year of IPO initiation and year of IPO
completion..................................................................................................................................... 89
Table 2-2 Summary statistics of the sample data set .................................................................... 89
Table 2-3 Separation and test between firms that have D&O insurance or not ............................ 90
Table 2-4 Marginal impact on the decision to purchase D&O insurance. .................................... 92
Table 2-5A OLS regression that measures the firms' first year excess return – Panel A ............. 93
Table 2-5B OLS regression that measures the firms' first year total return – Panel B ................. 95
Table 2-6 OLS regression that measures the firms' idiosyncratic risk in the first year post-IPO . 96
Table 2-7 OLS regression that measures the firms' stock volatility in the first year post-IPO .... 98
Table 2-8 OLS regression that measures the firms' return-to-risk ratio in the first year post-IPO
..................................................................................................................................................... 100
Table 2-9A OLS regression that measures the firms' first year return and risk assuming all the
information is incorporated in the price on the first day. ............................................................ 101
Table 2-9B OLS regression that measures the firms' first year return assuming all the information
is incorporated in the price on the first day, net of the first day. ................................................ 102

xi
Table 2-10A Two-step regression that measures the first year's stock return and return-to-risk
ratio by controlling for the purchase of insurance ...................................................................... 103
Table 2-10B Two-step regression that measures the first year's stock return by controlling for the
decision to reveal the D&O insurance premium and policy limit .............................................. 104
Table 2-11A Two-stage least square simultaneous regressions for the first year total return and
risk............................................................................................................................................... 105
Table 2-11B Three-stage least square simultaneous regressions for the first year total return and
risk............................................................................................................................................... 109
Table 3-1 Descriptive Statistics .................................................................................................. 153
Table 3-2A Volatility and Director Tenure – Panel A ................................................................ 155
Table 3-2B Volatility and Director Tenure – Panel B ................................................................ 156
Table 3-2C Volatility and Director Tenure – Panel C ................................................................ 157
Table 3-3A Exogenous Director Appointments – Panel A ......................................................... 159
Table 3-3B Exogenous Director Appointments – Panel B ......................................................... 160
Table 3-4A Additional Tests – Panel A ...................................................................................... 162
Table 3-4B Additional Tests – Panel B ...................................................................................... 163
Table 3-4C Additional Tests – Panel C ...................................................................................... 164
Table 3-5 Summary of Previous Empirical Evidence and Evidence from the Learning-based
Methodology ............................................................................................................................... 166
Table 3-6A Cross-sectional Tests – Panel A .............................................................................. 169
Table 3-6B Cross-sectional Tests – Panel B ............................................................................... 170
Table 3-6C Cross-sectional Tests – Panel C ............................................................................... 171
Table 3-6D Cross-sectional Tests – Panel D .............................................................................. 173

xii
LIST OF FIGURES
Figure 1-1 Ratio of indirect to direct pay for performance using discount rates: All Funds 12%,
Buyout 9%,Venture Capital 15%, Real Estate 9% ....................................................................... 45
Figure 1-2 Ratio of indirect to direct pay for performance using discount rates: All Funds 17%,
Buyout 14%,Venture Capital 20%, Real Estate 14% ................................................................... 46
Figure 1-3 Ratio of indirect to direct pay for performance using discount rates: All Funds 10%,
Buyout 11%,Venture Capital 8%, Real Estate 11% ..................................................................... 47
Figure 1-4 Ratio of indirect to direct pay for performance using discount rates: All Funds 16%,
Buyout 11%, Venture Capital 21%, Real Estate 11% .................................................................. 48
Figure 3-1 Volatility and Director Tenure .................................................................................. 150
Figure 3-2 Volatility and Average Board Tenure ....................................................................... 151
Figure 3-3 Learning Slopes and Firm Performance .................................................................... 152
Figure 3-4 Learning Slopes and Stock Performance .................................................................. 152

1
Chapter 1. Incentives of Private Equity General Partners from Future Fundraising
This is a pre-copyedited, author-produced PDF of an article accepted for publication in The
Review of Financial Studies following peer review. The version of record Chung, J., B. A.
Sensoy, L. H. Stern and M.S. Weisbach (2012), Pay for Performance from Future Fund Flows:
The Case of Private Equity, Review of Financial Studies, 25(11): 3259-3304 is available online
at: https://doi.org/10.1093/rfs/hhr141.
Compensation agreements in private equity (PE) partnerships typically give general partners
(GPs) a fixed management fee that is a percentage (usually 1.5% to 2.5%) of the amount of
capital committed to the fund, as well as a variable “carried interest” equal to a percentage of the
profits (almost always 20%). Many observers credit pay for performance from carried interest as
an important driver of the success of private equity firms (e.g., Jensen 1989; Kaplan and
Strömberg 2009). Others, especially in the popular press, argue that pay for performance from
carried interest is not strong enough to provide adequate incentives to GPs, especially because
fixed management fees alone are often a source of considerable income.1
Missing from these arguments is the fact that explicit compensation formulas provide
only part of the total pay for performance in private equity. GPs’ lifetime incomes depend on
their ability to raise capital in the future, which in turn depends on the performance of their
current funds. Consequently, GPs’ total pay for performance is also impacted by the indirect,
market-based pay for performance caused by the relation between today’s performance and
future fundraising.
1 See for example, “It’s the Fees, Not the Profits,” Wall Street Journal, Sept. 13, 2007.

2
Indirect pay for performance is not specific to private equity; it is a potentially
important source of incentives in many settings.2 Yet, despite the widespread theoretical interest
in indirect incentives and their importance to real-world organizations, little is known about their
actual magnitude or the nature of the economic forces that give rise to them. This gap in our
knowledge is important because understanding the magnitude of indirect pay for performance,
and how it varies over time and across firms, is essential to drawing inferences about managers’
motives.
This article seeks to understand the economic forces that lead to a relation between
performance and future fundraising in private equity, and to estimate the magnitude of the
resulting indirect pay for performance. We first present a rational learning model in which the
ability of a GP to earn profits is uncertain and rationally inferred by market participants. We
develop testable predictions from this model about the way a fund’s current performance affects
the partnership’s ability to raise subsequent funds. Using a database of fund sizes and returns, we
estimate the relations between fund performance and future fundraising, and evaluate the
predictions of our learning model relative to those of behavioral alternatives. We next provide an
approach that transforms the empirical relations between fund performance and future
fundraising into estimates of indirect pay for performance in private equity. We present estimates
of the magnitude of indirect pay for performance and the way in which it varies across types of
partnerships and over a given partnership’s life cycle. We present our estimates in both absolute
magnitude and, to gauge their relative importance, relative to the much-discussed direct (explicit)
2 Examples include promotion or elimination tournaments inside corporations (e.g., Lazear and
Rosen 1981; Rosen 1986; Han et al. 2009), the possibility that a CEO will be fired for poor
performance (e.g., Jensen and Murphy 1990; Hermalin and Weisbach 1998), and the possibility
that the careers of securities analysts depend on the accuracy of their forecasts (Hong and Kubik
2000; Hong et al. 2003). Market-based indirect pay for performance in other asset management
settings can also arise from a relation between current performance and future fund flows.

3
pay for performance from carried interest.3 Finally, we construct estimates of the total pay for
performance facing private equity GPs and show that these incentives are both much larger than
commonly believed, and also vary substantially across types of partnerships and over time within
a given partnership.
We begin by presenting a rational learning model in the spirit of Berk and Green (2004)
to formalize the logic by which good performance in the current fund could lead to higher future
incomes for GPs through an effect on expected future fundraising. In the model, a private equity
partnership potentially has an ability to earn (abnormal) returns for its investors, but this ability is
unknown. Given a performance signal, investors update their assessment of the GP’s ability and,
in turn, decide whether the GP is able to raise another fund and, if so, how much capital to
allocate to it (in the presence of diminishing returns to scale).
The rational learning framework predicts that both the likelihood of raising a follow-on
fund and the size of the follow-on if it is raised depend on current performance, and offers
intuitive cross-sectional predictions that have not been tested in the literature. First, when
abilities are more “scalable,” investors are willing to commit more capital for a given assessment
of managerial ability. Second, the more informative the fund’s performance (signal) about GPs’
abilities, the more sensitive future fundraising is to today’s performance. Third, holding
performance fixed, follow-on fundraising is more likely when the prior assessment of ability is
greater.
These predictions suggest that the future fundraising of buyout funds should be more
sensitive to performance than that of venture capital funds, both because buyout funds are more
3 It is sometimes argued in the literature that GPs’ indirect incentives are strong enough to
motivate their behavior (e.g., Gompers 1996; Gompers and Lerner 1999). Our work is the first to
estimate the strength of these incentives.

4
scalable (Metrick and Yasuda 2010), and because the variance of buyout returns is lower
(informativeness is higher) than that of venture capital returns. In addition, because ability is
known with more precision as a partnership ages, the performance of later funds should have less
impact on the assessment of ability and hence be less strongly related to future inflows of capital
than the performance of earlier funds. Thus the learning model predicts that the sensitivity of
future fundraising to performance should decline in the sequence of a partnership’s funds.
Finally, for a given performance, later sequence funds should be more likely to raise a follow-on
fund because the average assessment of ability will be higher in later sequence funds than in
earlier ones, for the simple reason of their survival.
Our estimates from a sample of buyout, venture capital, and real estate private equity
funds from 1969 to 2009 are consistent with these predictions, and favor the rational learning
model over behavioral alternatives of “naive reinvestment” or “return chasing.” For all types of
funds, we find that both the probability of raising a follow-on fund and the size of the follow-on if
one is raised are significantly positively related to the final performance of the current fund.4
These results suggest that even though final performance is generally not known with certainty at
the time of fundraising, there is more to whether a GP can raise another fund than simple naive
reinvestment. At least some limited partners (LPs) appear to have and use information about what
final fund performance is likely to be.5 These results complement Lerner, Schoar, and
4 While Kaplan and Schoar (2005) and subsequently others find a positive relation between
follow-on size and performance in tobit specifications with left-censoring at zero, such
specifications do not allow for separate identification of the effect of performance on the
likelihood of raising a follow-on fund. Consistent with our results, Hochberg, Ljungqvist, and
Vissing-Jorgensen (2010) find that intermediate fund performance is positively related to the
likelihood of raising a follow-on fund in a sample of venture capital funds.
5 In our tests, we use a fund’s ex post realized final performance (IRR) as our empirical proxy for
investors’ expectation at the time of subsequent fundraising about what final performance will

5
Wongsunwai’s (2007) findings that at the level of individual LPs, there is considerable
heterogeneity in the extent to which performance is taken into account in reinvestment decisions.
We also find that the relation between future fundraising and current performance is
strongest for buyout funds, which relative to venture capital funds are both more scalable and
likely have more informative returns. This relation is stronger for younger partnerships than for
older, so the sensitivity of future fundraising to current performance declines in the sequence of a
partnership’s funds. Controlling for performance, older partnerships are more likely to raise a
follow-on fund. All of these results match the predictions of the learning model.
In contrast, our findings are inconsistent with behavioral “return chasing” or “dumb
money” explanations for private equity fund flows, in which investors chase returns without
regard to their informativeness or disproportionately react to the performance of older, more
famous partnerships. These explanations predict, contrary to our results, either a flat or an
increasing sensitivity of future fundraising to current performance in the sequence of a
partnership’s funds.6
We next turn to estimating the magnitude of total pay for performance in private equity,
and evaluate the relative magnitudes of its direct (from contractual carried interest) and indirect
(from future fundraising) components. Our theoretical framework provides an explicit formula
for the sensitivity of GPs’ lifetime incomes to the return of the current fund. Our calculations use
this formula, our estimates of the sensitivity of future fundraising to current performance,
turn out to be. This is analogous to the common practice in asset pricing studies of using ex post
realized returns to proxy for ex ante expected returns. We discuss performance measurement
issues in detail in Section 3.3.
6 A declining sensitivity of fund size to performance as a partnership ages could be consistent
with return chasing if GPs are shutting out willing investors in order to avoid growing too large.
However, this alternative does not explain our finding that the likelihood that a follow-on fund is
raised at all also loses sensitivity to performance as the partnership ages.

6
parameters reflecting the characteristics of our sample of private equity funds, and estimates of
expected GP 5 revenue as a fraction of fund size from Metrick and Yasuda (2010).
For an average-sized first-time buyout fund in our sample ($417.5 million), we estimate
that for an extra percentage point of internal rate of return (IRR) to limited partners in the current
fund, general partners receive on average an extra $3.32 million7 in direct carried interest,
assuming a carried interest of 20%.8 For the same incremental percentage point of IRR in this
current fund, our estimates of the present value of expected incremental revenue from future
funds range from $4.27 million to $7.81 million, depending on whether we assume the GP
potentially runs up to three or up to five more funds, resulting in estimated ratios of present
values of indirect to direct pay for performance of 1.29 to 2.35. These estimates suggest that
indirect pay for performance from future fundraising is at least as large as direct pay for
performance from carried interest for first-time buyout funds.
We also perform the same calculations for venture capital and real estate funds. Expected
compensation from future fundraising is less sensitive to current performance for these types of
funds than for buyout funds, with venture capital funds displaying the least sensitivity. For an
average-sized first-time venture capital fund, our estimates of the ratio of indirect to direct pay
7 All dollar amounts and ratios are present values using annual discount rates of 9% for buyout
and real estate funds, and 15% for venture capital funds. Though the exact estimates of pay for
performance do vary with the chosen discount rate, our key cross-sectional conclusions are
robust to reasonable alternatives. 8 Carried interest rarely differs from 20%, especially during the post-1990 time period that covers
the bulk of our sample. In Gompers and Lerner’s (1999) sample of 419 venture capital funds
raised before 1992, 81% have carry between 20% and 21%. In Metrick and Yasuda’s (2010)
sample of 238 funds from 1993 to 2006, 95% of venture capital funds and 100% of buyout funds
have carry equal to 20%. In Robinson and Sensoy’s (2011b) sample of 837 funds from 1984 to
2010, carry is equal to 20% for 89% and 97% of venture capital and buyout funds, respectively,
and the average carry is 20.44% and 19.96%, respectively.

7
for performance range from 0.39 to 0.44, and for an average first-time real estate fund they range
from 1.37 to 1.96.
Consistent with the learning framework, the ratio declines in the sequence of funds for all
types of funds. The decline is fairly weak for buyout funds, sharper for real estate funds, and
sharpest for venture capital funds. Assuming the GP potentially runs up to five more future funds,
our estimates of the present values of the ratios of indirect to direct pay for performance for
buyout funds are 2.35 if the current fund is the first in a buyout partnership’s sequence, 2.10 if it
is the second fund in a buyout partnership’s sequence, and 1.75 if it is the third. For real estate
funds, the corresponding ratios are 1.96, 1.39, and 1.12, while for venture capital funds, they are
0.44, 0.35, and 0.18. Figure 1-1 depicts these patterns graphically, and Figures 1-2 to 1-4 show
that our cross-sectional conclusions are robust to reasonable alternative discount rates used to
compute present values.
Overall, our results are consistent with indirect pay for performance from future
fundraising in private equity being driven by rational learning about ability. They suggest that
indirect pay for performance is of the same order of magnitude as the often-discussed direct,
explicit pay for performance coming from carried interest. For the typical first-time private
equity fund, the estimates indicate that GP lifetime income increases by about $0.50 for every $1
increase in LP income in the current fund, double the $0.25 implied by a 20% in-the-money
carry alone. In short, total pay for performance in private equity is much stronger, by a factor of
about two, than implied by the carried interest alone. Consequently, discussions of the incentives
of private equity GPs that focus on carried interest alone are substantially incomplete.
Our estimates also imply that total pay for performance in private equity exhibits
substantially more heterogeneity than suggested by the carried interest alone. Given that carried

8
interest typically does not change much over time, the results imply that total pay for
performance in private equity declines as funds mature.9 Why does the carry remain relatively
flat over time despite the declining indirect pay for performance, instead of increasing to
compensate for career concerns over time, as models such as Gibbons and Murphy (1992)
predict? One possibility is that because of learning, low-ability agents are forced out of the
profession over time. The remaining high-ability agents could require lower total incentives,
possibly because learning-by-doing decreases the marginal cost of effort, or because effort and
ability are substitutes in generating profits from private equity investments. Another possibility is
that the carried interest reflects rent-splitting between GPs and LPs rather than agency problems.
In this case, the observed pay-performance relations are a consequence of this rent-splitting
together with learning about ability, rather than the solution to an agency problem. An important
topic for future research is to understand whether the pattern of explicit compensation over a
partnership’s life cycle is efficient, given the declining indirect pay for performance that we find.
Our work is related to the large literature, surveyed by Frydman and Jenter (2010),
studying the magnitude of the pay-performance incentives of CEOs. Important contributions to
this literature are Jensen and Murphy (1990) and Hall and Liebman (1998) for public company
CEOs, and Leslie and Oyer (2009) for CEOs of private equity portfolio companies. We are the
first to estimate the magnitude of the total pay-for-performance incentives of private equity
general partners.
9 Gompers and Lerner (1999) argue that the dynamics of GP compensation are also consistent
with learning, and are the first to show that the largest and most successful venture capital funds
do sometimes raise their carried interest above 20%. The average effect is, however, much too
small to compensate for the declining indirect pay for performance we document. They find that
the average carry among first-time venture capital funds is 20.5%, and 21.4% among
partnerships older than eight years.

9
Closely related to our work is a large literature, beginning with Ippolito (1992),
investigating mutual fund inflows and their strongly positive relation to historical performance.
Chevalier and Ellison (1997) find that the sensitivity of mutual fund flows to performance is
greater for younger funds, consistent with our results. Berk and Green (2004) rationalize many of
these findings with a learning model of investor behavior similar to our approach. However,
there is also considerable evidence that mutual fund investors chase returns in a manner difficult
to reconcile with rational theories (e.g., Frazzini and Lamont 2008 and Sensoy 2009). Our work
is also closely related to Chevalier and Ellison (1999), who find that younger mutual fund
managers are more likely to be terminated for poor performance than older ones, consistent with
our results. No prior work has attempted to quantify the total pay-for-performance relations
facing managers in other asset management settings in light of the flow- and termination-
performance relations in those industries. An additional contribution of this article is to provide
an approach and framework that can be readily adapted for use for these interesting topics for
future research.
The remainder of this article proceeds as follows. Section 1 lays out the theoretical
learning framework. Section 2 describes the data. Section 3 presents estimates of the effect of
current performance on future fundraising, and contrasts the predictions of the learning model
with those of behavioral alternatives. Section 4 transforms these estimates into pay-for-
performance sensitivities, using the formula derived in Section 1 as a basis for the calculations.
Section 5 discusses the implications of this work and concludes.
10
1. Theoretical Framework
In this section we present a theoretical framework based on rational learning in which
investors assign cash flows to private equity partnerships based on their perceptions of GPs’
abilities to earn profits. This framework provides intuitive cross-sectional predictions that
contrast with behavioral alternatives and guide our empirical tests. This framework also enables
us to derive a formula expressing GP total pay for performance (direct from carried interest plus
indirect from future fundraising) in terms of quantities we can estimate from the data. We
assume that investors observe signals about the performance of a partnership, and based on their
posterior estimate of GP ability decide whether the GP is able to raise another fund, and if so,
how much to invest in it. This capital allocation process leads to a strong relation between
performance in a current fund and GPs’ future compensation.
1.1 Setup
We assume that a particular GP currently manages a fund and could potentially manage
up to N more funds in the future (e.g., the GP will retire after managing N more funds). The GP
has ability to earn returns through private equity investing equal to θ.10 Ability θ is unobservable
and there is symmetric information, so all agents, including the GP, have the same estimate of its
value.11 We assume that θ is constant over time for a particular partnership, which abstracts
10 It is possible that GPs could be rewarded through future fundraising for either absolute or
relative (abnormal) returns. Our empirical analysis examines both possibilities. 11 The assumption that there is symmetric information about managers’ abilities dates to
Holmstrom (1999), and has been used in similar learning models by Gibbons and Murphy
(1992), Hermalin and Weisbach (1998, forthcoming), Berk and Green (2004), and others.
Implicitly, the idea is that anyone who can become a GP is smart, hard-working, well-educated,
and so on, but the key factor determining who can earn returns is an unobservable match
between the individual and the tasks associated with earning profits as a general partner.

11
away from issues of changing partnership composition, investment environments, or changing
ability over time due to health or other considerations. Before any returns are observed, the
commonly held prior assessment of θ is . 12
The parameter θ can be thought of as the ability to generate returns in absence of
decreasing returns to scale. With decreasing returns to scale, greater fund size erodes the ability
to translate θ into returns. To capture this idea, let the net return to LPs of the ith fund managed
by the GP be given by , where is the size (committed capital) of fund i,
is an increasing, convex, and differentiable function (representing the return cost of each
unit of capital) and is common knowledge, and . for all i, where s is the precision of
the distribution.
1.1.1 Updating beliefs
Under these assumptions, after observing the returns on i funds, the market’s updated
assessment of θ, θi, is given by:
for all i (DeGroot (1970) provides a derivation of this Bayesian updating formula). In other
words, θi is the expectation (posterior mean) of θ conditional on observing the returns on i funds.
12 The assessment represents the expected skill of a particular GP conditional on all observable
characteristics prior to any returns being observed. Different GPs will have different values of
and consequently raise initial funds of different sizes.
(1)

12
Note that because qi and c (.) are known to all, observing ri is equivalent to observing
.13
1.1.2 Follow-on fund size, conditional on raising a follow-on
Given that it is raised, the conditional expected return on fund i+1 is given by
. The equilibrium , denoted , is obtained by imposing the
equilibrium condition that investors allocate capital so that the expected return on fund i + 1 is
equal to their cost of capital, which for simplicity we normalize to zero. In equilibrium, then,
, and consequently is given implicitly by . For our purpose, it is more
convenient to invert this function. Define , so that .
1.1.3 Probability of raising a follow-on
We further assume that there is a minimum viable fund size, so funds smaller than this
size are not raised. This minimum size could occur as a result of, for example, a minimum
investment scale in the industry or a fixed cost of running a fund. Since the factors that determine
a fund’s minimum size change over time, a fund’s minimum viable size varies through time
following exogenous shocks to these parameters. That is, at the time a follow-on to fund i, fund
, is potentially raised, we assume there exists a such that the follow-on is not raised if
is such that . Because the shocks are not observed until the time fund is to be
13 While we speak of investors observing returns for convenience of exposition, in practice the
final performance of a private equity fund is generally not known with certainty at the time a
follow-on fund is raised. A more flexible interpretation of our model is that the “return” ri that
investors observe is actually a signal about what eventual performance will be. In our empirical
analysis, we use a fund’s actual final performance, known only ex post, as an empirical proxy for
the information about performance that investors have at time of fundraising. We discuss this
measurement issue in detail in Section 3.
13
(potentially) raised, the GP does not know ex ante (at the time fund i is raised) whether a given
return ri will suffice to pass the hurdle for raising fund .14 Denote by the ex ante
probability that fund will be raised if, ex post, the assessment of ability turns out to be .
1.2 Cross-sectional implications
This learning formulation characterizes the way in which fund returns affect future
fundraising and, consequently, the future expected compensation for the funds’ partners.
Conditional on the sequence of returns earned in the first i funds, the expected size of the next
fund is given by for , and zero for .
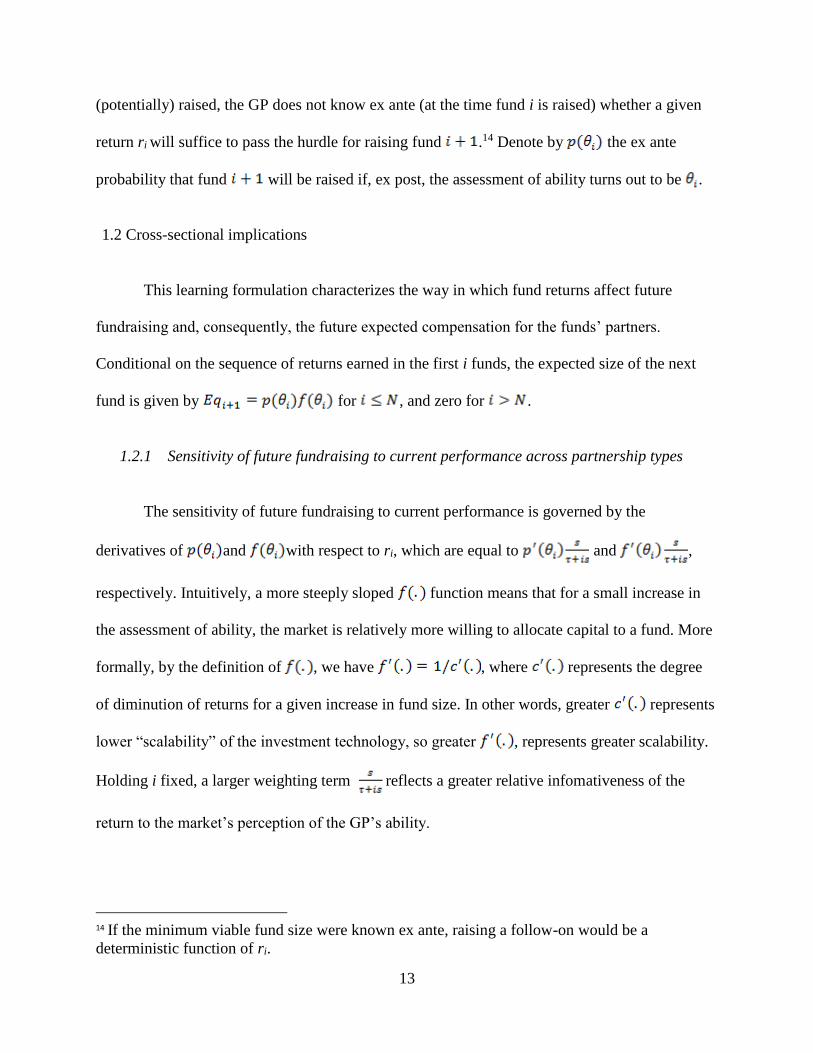
1.2.1 Sensitivity of future fundraising to current performance across partnership types
The sensitivity of future fundraising to current performance is governed by the
derivatives of and with respect to ri, which are equal to and ,
respectively. Intuitively, a more steeply sloped function means that for a small increase in
the assessment of ability, the market is relatively more willing to allocate capital to a fund. More
formally, by the definition of , we have , where represents the degree
of diminution of returns for a given increase in fund size. In other words, greater represents
lower “scalability” of the investment technology, so greater , represents greater scalability.
Holding i fixed, a larger weighting term reflects a greater relative infomativeness of the
return to the market’s perception of the GP’s ability.
14 If the minimum viable fund size were known ex ante, raising a follow-on would be a
deterministic function of ri.

14
We expect buyout funds to be more scalable, and hence have a larger , than other
types of funds, particularly venture funds. If a GP of a buyout partnership is shown to be talented
at increasing value by buying out companies, he can potentially employ the same skills to buy
out larger companies and increase their value, and hence make effective use of a larger pool of
capital. In contrast, if a venture capitalist has demonstrated that she is talented at investing in
startup companies, she is not able to increase fund size as much because the size of startup
investments is not scalable (and because, given the time-consuming value-added nature of the
private equity investing process, it is not feasible simply to increase the number of investments).
Metrick and Yasuda (2010) present evidence consistent with greater scalability of buyout
compared to venture capital. Further consistent is the observation that the largest buyout
investments in portfolio companies are on the order of tens of billions of dollars, whereas the
largest venture capital investments rarely exceed a few tens of millions of dollars. Moreover, the
most successful buyout funds, such as KKR and Blackstone, have steadily increased the size of
their funds to the point where the largest funds are between $15 and $20 billion in committed
capital, while the most successful Silicon Valley venture capitalists, such as Kleiner Perkins and
Sequoia, have remained at or under $1 billion in committed capital in a given fund.
We also expect that the informativeness of returns about ability is likely to be greater for
buyout funds than for venture capital funds. If a venture fund performs particularly well, this
performance likely comes from the success of a small number of investments in the fund’s
portfolio. As a result, there is likely to be a greater variance of returns to specific investments in
venture capital than in buyouts, implying a lower precision of the estimate of the fund-level
return. In addition, the cross-sectional standard deviation of fund returns (IRR) is much lower in

15
buyout (20.7% in our data) than in venture capital (52.5%), which also suggests greater
informativeness of buyout returns relative to venture capital returns.
It is less clear how should vary across types of funds. Nonetheless, it seems likely
that would be higher for buyout funds than for venture capital funds for similar scalability
reasons. In the buyout industry, marginal underperformers are potentially more likely to be shut
out of future fundraising completely because the more successful buyout partnerships can scale
up to absorb the demand of investors to a greater extent than is possible in the venture capital
industry. For all of these reasons, we expect the sensitivity of future fundraising to current
performance to be greater for buyout funds than venture capital funds.
1.2.2 Sensitivity of future fundraising to current performance in the sequence of funds
within a partnership
Holding fixed, both and are decreasing in i because of the
weighting term . Intuitively, as partnerships progress through time, the partnership’s
becomes known more precisely. The optimal updating rule therefore implies that subsequent s
do not change as much as earlier s for a given return. Consequently, in the data we expect to
observe the sensitivity of future fundraising to current performance to decline as a given
partnership manages subsequent funds.
1.2.3 Sensitivity of future fundraising to the sequence of funds within a partnership
Holding performance ri fixed, the updated assessment of ability will be greater when
the just-prior assessment of ability is higher. Because the probability of raising funds

16
throughout a partnership’s life depends on the market’s assessment of its ability, later sequence
funds will on average have higher prior assessments of ability than earlier sequence funds.
Consequently, in the data we expect to observe that holding performance fixed, later sequence
funds are more likely to raise a follow-on fund, so the probability of raising a follow-on fund
should increase with the sequence number of the current fund.
1.3 Lifetime compensation of GPs
Let be the fraction of the size of fund i that accrues as revenue to the GP with
performance of , including management fees, carried interest, and other income earned by the
fund, such as additional fees earned by funds for managing portfolio companies.15
The total expected revenue earned by the GP over his lifetime is then given by:
As stated above, this formulation assumes that the GP can run a maximum of N future
funds. If the GP ever fails to raise a follow-on fund, he is unable to raise any funds subsequently
and earns no subsequent income from managing private equity investments. For example, a third
fund cannot be raised unless a second fund is raised. Hence the expected revenue from the third
fund depends on the probability that the third fund is raised conditional on the assessment of
ability following the second fund ( ), multiplied by the probability that the second fund is
15 We refer to revenue and compensation synonymously throughout the article. While private
equity partnerships do have some costs that create a wedge between revenue and partner
compensation, many of these costs are more or less fixed and do not affect marginal
compensation. We discuss potential omitted marginal costs in Section 4.4.
(2)

17
raised ). We are interested in calculating the magnitude of the total pay-performance
relation facing general partners. This pay-for-performance relation is made up of a direct
component, from carried interest in the current fund, and an indirect component, from the greater
probability of raising future funds and greater future fund size conditional on raising future funds.
The total pay-performance relation is the sensitivity of total lifetime revenue to r1:
+
+
+
+
The terms above have natural interpretations. The first line represents the direct effect
from carried interest in the current fund. The subsequent lines together make up the indirect
component. The second line is the incremental expected revenue from the next fund. Intuitively,
improving performance has two effects on incremental revenue from the next fund. The first
term in brackets represents the increase in the probability that a follow-on fund will be raised
multiplied by the size of the follow-on fund conditional on one being raised. The second term in
brackets represents the probability of raising a follow-on multiplied by the increase in fund size
conditional on one being raised. Similarly, the third line is the incremental expected revenue
(3)

18
from the third fund. The three components in brackets represent, respectively, the increments to
expected fund size from the increase in probability of raising the second fund, the increase in
probability of raising the third fund, and the increase in size of the third fund. The weighting
terms, of the form , represent the extent to which an incremental change in r affects the
update of . The terms represent the expected fraction of future fund sizes that accrues to
the GPs as revenue.
1.4 Empirical Implementation
We test the predictions of our learning model against those of behavioral alternatives
using regressions that estimate the sensitivities to current performance of both the probability of
raising a follow-on fund, and the size of the follow-on fund conditional on raising one. These
equations also yield estimates of the and terms in Equation (3). We
estimate other terms in Equation (3) as follows: Incremental expected revenue to the GPs from
the current fund, , is based on the standard 20% carried interest, which, as Gompers and
Lerner (1999), Metrick and Yasuda (2010), and Robinson and Sensoy (2011b) document,
involves only a slight approximation. For the terms for future funds, we use the estimates
provided by Metrick and Yasuda (2010), who estimate the expected revenue to GPs as a fraction
of a fund’s size using simulations. For the and terms, we use the respective fund type-
and sequence-specific averages in our data: the fraction of funds that raise a follow-on, and the
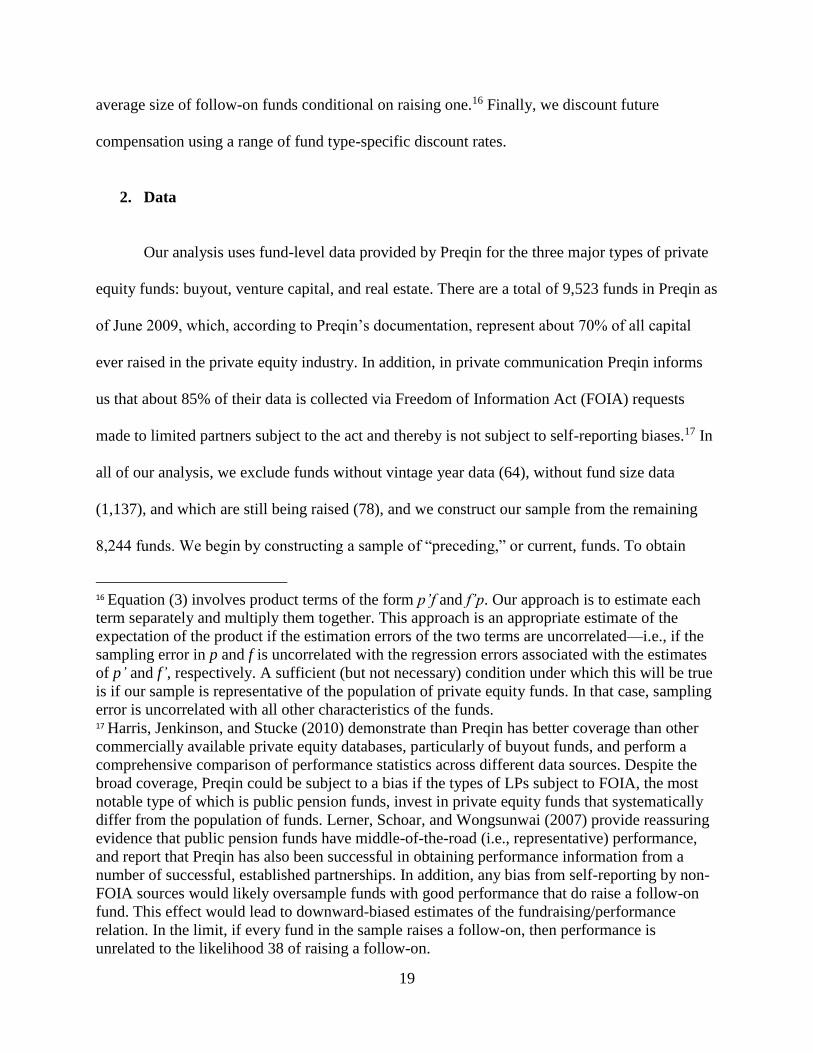
19
average size of follow-on funds conditional on raising one.16 Finally, we discount future
compensation using a range of fund type-specific discount rates.
2. Data
Our analysis uses fund-level data provided by Preqin for the three major types of private
equity funds: buyout, venture capital, and real estate. There are a total of 9,523 funds in Preqin as
of June 2009, which, according to Preqin’s documentation, represent about 70% of all capital
ever raised in the private equity industry. In addition, in private communication Preqin informs
us that about 85% of their data is collected via Freedom of Information Act (FOIA) requests
made to limited partners subject to the act and thereby is not subject to self-reporting biases.17 In
all of our analysis, we exclude funds without vintage year data (64), without fund size data
(1,137), and which are still being raised (78), and we construct our sample from the remaining
8,244 funds. We begin by constructing a sample of “preceding,” or current, funds. To obtain
16 Equation (3) involves product terms of the form p’f and f’p. Our approach is to estimate each
term separately and multiply them together. This approach is an appropriate estimate of the
expectation of the product if the estimation errors of the two terms are uncorrelated—i.e., if the
sampling error in p and f is uncorrelated with the regression errors associated with the estimates
of p’ and f’, respectively. A sufficient (but not necessary) condition under which this will be true
is if our sample is representative of the population of private equity funds. In that case, sampling
error is uncorrelated with all other characteristics of the funds. 17 Harris, Jenkinson, and Stucke (2010) demonstrate than Preqin has better coverage than other
commercially available private equity databases, particularly of buyout funds, and perform a
comprehensive comparison of performance statistics across different data sources. Despite the
broad coverage, Preqin could be subject to a bias if the types of LPs subject to FOIA, the most
notable type of which is public pension funds, invest in private equity funds that systematically
differ from the population of funds. Lerner, Schoar, and Wongsunwai (2007) provide reassuring
evidence that public pension funds have middle-of-the-road (i.e., representative) performance,
and report that Preqin has also been successful in obtaining performance information from a
number of successful, established partnerships. In addition, any bias from self-reporting by non-
FOIA sources would likely oversample funds with good performance that do raise a follow-on
fund. This effect would lead to downward-biased estimates of the fundraising/performance
relation. In the limit, if every fund in the sample raises a follow-on, then performance is
unrelated to the likelihood 38 of raising a follow-on.

20
estimates of the sensitivity of future fundraising to current performance, we require a sample of
funds for which performance (IRR) data are available. From this sample of funds, we follow
Kaplan and Schoar (2005) and drop funds with less than $5 million (in 1990 dollars) in
committed capital (nine funds), to reduce the influence of potentially extreme growth rates of
small funds on our results. In addition, to allow for sufficient time to ascertain whether a fund
raises a follow-on, we drop funds raised after 2005. Finally, when a private equity firm raises
multiple funds in a given year, we aggregate funds in that year and compute the fund-size-
weighted IRR. There are two exceptions to this rule. The first is a few cases in which the same
partnership manages, for example, both buyout and real estate funds. In these cases, we treat the
partnership for econometric purposes as two separate partnerships, one each for buyout and real
estate funds. The second (rare) exception is when the same partnership manages funds of the
same type but different geographical focus, such as a fund focusing on European buyouts and
another focusing on U.S. buyouts. In this case, we treat the European buyout funds and U.S.
buyout funds as two separate partnerships. This process leaves us with a sample of 1,745
preceding funds, consisting of 645 (37%) buyout funds, 851 (49%) venture capital funds, and
249 (14%) real estate funds. The preceding funds range from 1969 to 2005, with 91% in the
1990–2005 period. For each of these preceding funds, we determine whether there is a follow-on
fund in the full sample of 8,244 funds. We define a follow-on fund as the next fund raised by the
same partnership for which we have information on fund size (we do not require information on
the performance of the follow-on fund). If we do not observe a follow-on fund by the end of our
sample period (June 2009), or if the data indicate a follow-on fund but do not provide size
information, we treat this as if the partnership did not raise a follow-on fund. The working
assumption we use throughout the article is that the absence of a follow-on fund with size

21
information in the data means the partnership was unable to raise one.18 Of the 1,745 preceding
funds, 1,469 (84.2%) raise a follow-on fund. Table 1-1 presents descriptive statistics for this
sample of preceding and follow-on funds. Panel A reports that the sample represents 843 distinct
partnerships: 314 buyout, 412 venture capital, and 117 real estate. The distribution of number of
preceding funds per partnership is clearly skewed, with many partnerships having just one or two
preceding funds and a few substantially more (the maximum in the sample is twelve preceding
funds). Note that these are the numbers of preceding funds used in our analysis, not the actual
number of funds per partnership.
Panel B of Table 1-1 reports additional descriptive statistics. The mean (median)
preceding fund size is $497.9 ($210.0) million for all funds taken together, $866.4 ($380.0)
million for buyout funds, $217.7 ($125.0) million for venture capital funds, and $501.0 ($314.9)
million for real estate funds. These statistics show that buyout funds are typically larger than
venture capital funds, and that the distribution of private equity fund size is highly skewed. The
mean (median) preceding fund performance (IRR) is 15.1% (10.6%) for all funds taken together,
16.5% (14.3%) for buyout funds, 14.1% (5.8%) for venture capital funds, and 14.6% (14.1%) for
real estate funds. The mean (median) growth in fund size from preceding to follow-on fund,
conditional on raising a follow-on, is 92.4% (53.8%) for all funds taken together, 110.9% (70.0%)
for buyout funds, 78.6% (42.9%) for venture capital funds, and 89.7% (48.9%) for real estate
funds. The time between successive fundraisings averages 3.3 years for the entire sample, 3.8
years for buyout funds, 3.3 years for venture capital funds, and 2.4 years for real estate funds.
18 This assumption has the effect of downward-biasing our estimates of the relation between
current performance and future fundraising. Undoubtedly some partnerships do raise follow-on
funds that are missing from the data because the data are incomplete. Additionally, in practice,
partnerships sometimes dissolve even though the market would have been willing to provide
capital for a follow-on fund had the partnership desired one.

22
Table 1-2 reports the same fund characteristics broken out by the focal fund’s position in the
partnership’s sequence of funds in the full Preqin database. Table 1-2 shows that higher sequence
number funds are substantially larger than lower sequence number funds, both because they
represent successful partnerships and also because they tend to be located later in time when
funds were larger. The growth rate in fund size from preceding to follow-on funds tends to
decrease in the sequence of funds. The time between successive fundraisings generally decreases
in the sequence of funds, suggesting that older partnerships are more able to raise new funds on
the basis of their past track records and rely less on performance in the current fund. The
percentage of preceding funds that raise a follow-on is generally increasing in the sequence of
funds. All of these patterns are consistent with the learning framework developed in Section 1.
3. The Empirical Relations between Current Performance and Future Fundraising
In this section, we estimate the sensitivities of the probability of raising a follow-on fund,
and the size of the follow-on if one is raised, to current performance. All of our estimates in this
section use a fund’s realized final performance (IRR) as our measure of performance. We are
therefore using the realized final IRR as a proxy for investors’ expectation at the time of
subsequent fundraising about what final performance of the current fund will turn out to be, even
though final IRR is not generally known with certainty at that time. In other words, we use ex
post realized returns to proxy for ex ante expected returns, in keeping with common practice in
asset pricing studies. We discuss the measurement issues implicit in this proxy in more detail in
Section 3.3, and present results using the interim IRR available at the time of fundraising for
robustness in the Appendix.

23
3.1 Estimates without sequence effects
Table 1-3 reports estimates of the relation between future fundraising and current
performance that do not allow for the possibility that the sensitivities can vary in the sequence of
funds. In Table 1-3, columns labeled “(1)” use the IRR of the “current” (preceding) fund as the
sole regressor, and columns labeled “(2)” contain vintage year (of the preceding fund) fixed
effects to control for any market-wide, time-varying factors that potentially affect the ability to
raise a follow-on fund, and to control for systematic differences in fund performance across
different vintage years. These factors are likely to be important in light of the well-documented
cyclicality of the private equity market (e.g., Gompers and Lerner 1998). In all specifications, we
cluster standard errors at the partnership level, following Kaplan and Schoar (2005).19
Panel A of Table 1-3 presents marginal effects, evaluated at the mean of all independent
variables, from probit specifications predicting the probability of raising a follow-on fund as a
function of current (preceding) fund performance (IRR). The relation between current
performance and the likelihood of raising a follow-on is statistically significantly positive for all
fund types. The point estimates from the specifications with vintage year fixed effects are
slightly larger than those from the specifications without. The marginal effects for the “All
Funds” regressions imply that a one percentage point improvement in IRR relative to the sample
mean is associated with a 0.316–0.324 percentage point increase in the probability of raising a
follow-on fund. Consistent with the learning framework, the estimated marginal effects are larger
19 In addition, we estimate but to conserve space do not report specifications using as the
independent variable the preceding fund IRR minus the preceding fund’s benchmark IRR
provided by Preqin. Preqin defines the benchmark IRR as the average IRR of all funds of the
same type, vintage year, and geographic focus. Our results using this “risk-adjusted” measure of
IRR are virtually identical to those reported below.
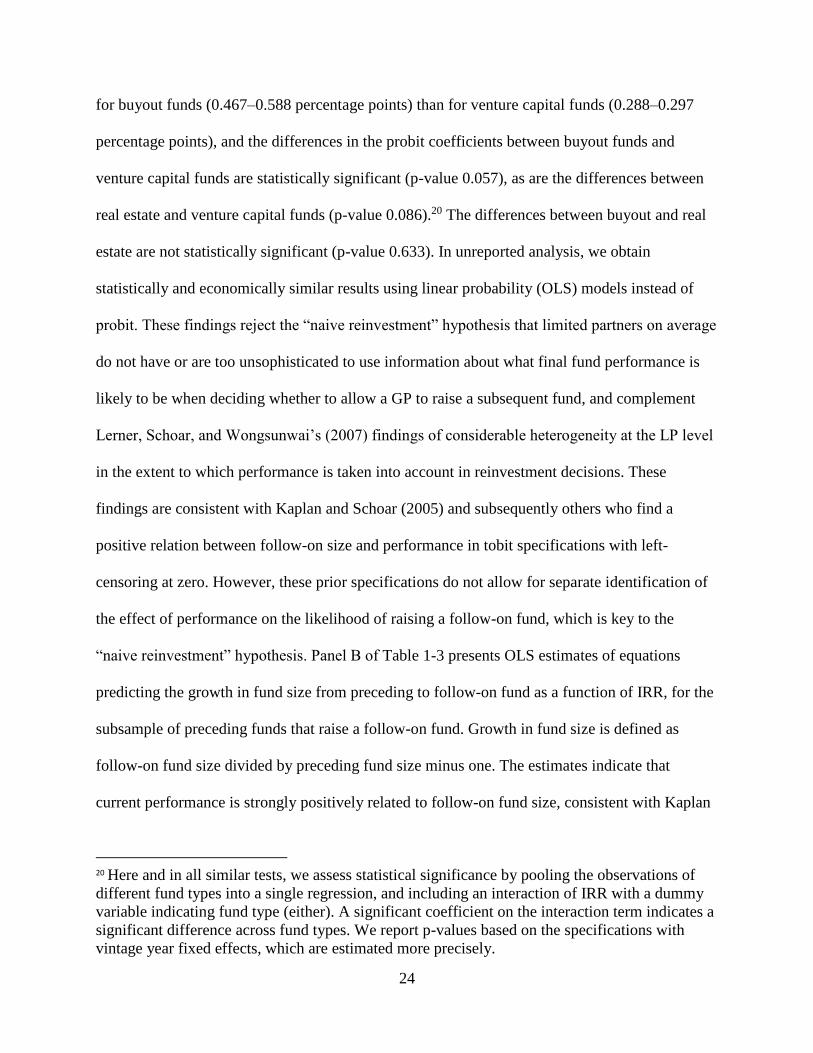
24
for buyout funds (0.467–0.588 percentage points) than for venture capital funds (0.288–0.297
percentage points), and the differences in the probit coefficients between buyout funds and
venture capital funds are statistically significant (p-value 0.057), as are the differences between
real estate and venture capital funds (p-value 0.086).20 The differences between buyout and real
estate are not statistically significant (p-value 0.633). In unreported analysis, we obtain
statistically and economically similar results using linear probability (OLS) models instead of
probit. These findings reject the “naive reinvestment” hypothesis that limited partners on average
do not have or are too unsophisticated to use information about what final fund performance is
likely to be when deciding whether to allow a GP to raise a subsequent fund, and complement
Lerner, Schoar, and Wongsunwai’s (2007) findings of considerable heterogeneity at the LP level
in the extent to which performance is taken into account in reinvestment decisions. These
findings are consistent with Kaplan and Schoar (2005) and subsequently others who find a
positive relation between follow-on size and performance in tobit specifications with left-
censoring at zero. However, these prior specifications do not allow for separate identification of
the effect of performance on the likelihood of raising a follow-on fund, which is key to the
“naive reinvestment” hypothesis. Panel B of Table 1-3 presents OLS estimates of equations
predicting the growth in fund size from preceding to follow-on fund as a function of IRR, for the
subsample of preceding funds that raise a follow-on fund. Growth in fund size is defined as
follow-on fund size divided by preceding fund size minus one. The estimates indicate that
current performance is strongly positively related to follow-on fund size, consistent with Kaplan
20 Here and in all similar tests, we assess statistical significance by pooling the observations of
different fund types into a single regression, and including an interaction of IRR with a dummy
variable indicating fund type (either). A significant coefficient on the interaction term indicates a
significant difference across fund types. We report p-values based on the specifications with
vintage year fixed effects, which are estimated more precisely.

25
and Schoar (2005).The coefficients are all positive and are all statistically significant except
those for venture capital funds. The magnitudes of the coefficients in the “All Funds” regressions
imply that a one percentage point increase in IRR is associated with a 0.623–0.663 percentage
point increase in fund growth. As in Panel A, the estimated effects for buyout funds (2.152–
2.314 percentage points) are considerably larger than those for venture capital funds (0.426–
0.492 percentage points), with real estate in between (1.723–1.955 percentage points). The
differences between buyout and venture capital, and between real estate and venture capital, are
statistically significant (p-values 0.016 and 0.062, respectively), while the differences between
buyout and real estate are not (p-value 0.635). Panel C of Table 1-3 reports estimates of similar
equations in which the dependent variable is the natural logarithm of follow-on fund size divided
by preceding fund size plus one. (We add one to avoid taking the logarithm of a number close to
zero.) Because the distribution of growth rates in the data is skewed, a logarithmic specification
is likely to fit the data better, which is confirmed by the fact that the R2 values in Panel C are
generally considerably higher than those in Panel B. The estimates again indicate that current
performance is strongly positively related to follow-on fund size.21 The coefficients are all
positive and statistically significantly different from zero. Similar to the results reported above,
the estimates are significantly larger for buyout than for venture capital, and for real estate than
for venture capital (p-values 0.004 and 0.024, respectively), while the difference between buyout
and real estate is statistically insignificant (p-value 0.858). Overall, the estimates in Table 1-3
confirm two of the main predictions from the learning framework. First, both the likelihood of
raising a follow-on fund and the size of that fund if one is raised are strongly positively related to
21 In unreported analysis, we test whether future fundraising is nonlinear in performance. We find
a statistically significantly negative coefficient on the square of IRR, indicating concavity, but
the effects are economically tiny.

26
performance in the current fund. Second, the sensitivity of future fundraising to current
performance is larger for buyout funds than for venture capital funds.
3.2 Sequence-specific estimates
The estimates presented in Table 1-3 do not consider a key prediction of the learning
framework, that the sensitivity of future fundraising to current performance is declining in the
sequence of funds managed by a given partnership. To test this prediction, in Table 1-4 we re-
estimate the equations from Table 1-3, including variables for the preceding fund’s sequence
number as well as the sequence number interacted with IRR.22 Panel A of Table 1-4 presents
estimates of equations predicting the probability of raising a follow-on fund. In Panel A, we
focus on linear probability models because of the difficulty of interpreting marginal effects of
interaction terms in probit specifications (and the potential bias in coefficient estimates resulting
from including fixed effects in probit specifications).23 As in Panel A of Table 1-3, we find that
current performance is positively related to the probability of raising a follow-on fund when all
fund types are pooled, for buyout funds separately, and for venture capital funds separately. The
coefficients are of similar magnitude to those in Table 1-3, and once again the difference
between the coefficients for buyout and for venture capital funds is statistically significant (p-
value 0.001). The coefficient on IRR for real estate funds is similar to the one reported in Table
22 As in Table 1-3, results are similar if we use the preceding fund’s benchmark-adjusted IRR.
The results are also unaffected by controlling for the time between successive fundraisings in the
fund growth specifications, which addresses the concern that the declining sensitivity in the
sequence may be confounded by the fact that older partnerships raise follow-on funds faster on
average (Table 1-2 Panel E).
23 See Ai and Norton (2003) and Greene (2000).

27
1-3 but is estimated less precisely, is not statistically significant, and is significantly different
from the coefficient for buyout funds but not from that for venture capital funds (p-values 0.006
and 0.708, respectively). For all funds taken together, and for buyout and venture capital funds
individually, the coefficients on sequence number in Panel A of Table 1-4 are positive and
statistically significant. The coefficients on the interaction of sequence number with IRR are
negative and statistically significant. This pattern of coefficients matches the predictions of the
learning framework of Section 1.
Higher sequence numbers are associated with funds that have done well historically and
hence have high current assessments of ability, so they are more likely to raise a follow-on
regardless of current performance. In addition, ability is estimated more precisely over time, so
the incremental effect of current performance on a fund’s ability to raise a follow-on fund grows
smaller over time. Panel B of Table 1-4 presents OLS regressions predicting growth in fund size
conditional on raising a follow-on fund, similar to those of Panel B of Table 1-3. The coefficients
on IRR are positive, statistically significant (with one exception), and generally larger in
magnitude than those in Panel B of Table 1-3. The coefficients on sequence number are all
positive but not statistically significant. With the exception of buyout funds, the coefficients on
the interaction of sequence number with IRR are negative and statistically significant. Panel C of
Table 1-4 presents estimates of similar equations in which the dependent variable is the natural
logarithm of growth in fund size plus two. As in Table 1-3, the R2 values indicate that these
specifications fit the data better than those of Panel B. The coefficients on IRR are all positive,
statistically significant, and larger in magnitude than those in Panel C of Table 1-3. The
coefficients on the interaction of sequence number with IRR are all negative and, with the
exception of buyout funds, statistically significant. In both Panels B and C, the coefficients

28
indicate that the sensitivity of fund growth to performance is greater (but not significantly so) for
first-time buyout funds than for first-time venture capital funds, and that the gap between them
grows quickly in the sequence of funds. For all fund types, Table 1-4 shows that the sensitivity
of future fundraising to current performance is significantly decreasing in the sequence number
of the current fund. For all funds taken together, and for venture capital funds individually, the
effects are statistically significant for both the probability of raising a follow-on fund and the
growth in fund size if a follow-on is raised. For buyout funds, the effect is significant only
through the probability of raising a follow-on, and for real estate, only through the growth in
follow-on fund size. All of our results continue to hold when controlling for vintage year fixed
effects, and all match the predictions of the learning model. In contrast, our findings are
inconsistent with a behavioral “return chasing” or “dumb money” explanation for private equity
fund flows, by which investors chase returns without regard to their informativeness or
disproportionately react to the performance of older, more famous partnerships. These
explanations predict, contrary to our results, either a flat or an increasing sensitivity of future
fundraising to current performance in the sequence of a partnership’s funds. Prior work,
beginning with Kaplan and Schoar (2005), finds as we do that follow-on fund size is positively
related to current performance, but this result alone cannot distinguish behavioral return chasing
from rational learning. Overall, the evidence in Tables 1-3 and 1-4 suggests that the rational
learning framework better describes the empirical relations between fundraising and performance
than behavioral “naive reinvestment” or “return chasing” explanations. Investors appear to utilize
information about what final fund performance is likely to be when deciding on whether a GP
can raise a subsequent fund, and the size of that fund conditional on raising it. Later sequence
funds are more likely to raise a follow-on fund controlling for performance, the sensitivity of

29
future fundraising to current performance is greater for buyout funds than for venture capital
funds, and this sensitivity declines in the sequence of a partnership’s funds. All of these findings
match the predictions of the learning framework.
3.3 Measurement issues
In all of the estimates presented above, we use the fund’s final IRR as the measure of the
fund’s performance. A concern with doing so is that a fund’s ultimate performance is not known
with certainty at the time the next fund is raised. The summary statistics presented in Table 1-1
show that the typical fund that raises a follow-on fund does so after three years of life, while
final fund performance is not known until the end of the fund’s life. An important question is
whether the fund’s final IRR is a reasonable proxy for the information about performance that a
fund’s investors use at time of subsequent fundraising in deciding whether and how much capital
to allocate to a partnership’s next fund. There are several reasons to believe that the answer is
“yes.” First, Hochberg, Ljungqvist, and Vissing-Jorgensen (2010) present a model in which a
fund’s current investors have soft information about the likely profitability of a fund’s
investments (obtained, for example, from close communication with the GPs), and use it when
deciding whether to allocate capital to the partnership’s next fund. This soft information about
performance is not reflected in the hard information about performance, “interim IRR,” available
at that time, and is not observable to the econometrician. Soft information becomes observable to
the econometrician only ex post, as it is reflected in the fund’s final IRR. Hochberg, Ljungqvist,
and Vissing-Jorgensen (2010) find evidence supporting this idea: The performance of the follow-
on fund (if one is raised) is strongly correlated with the first fund’s final IRR, but uncorrelated
with the interim IRR that was available at the time the follow-on was raised. Given this result, it

30
seems likely that a fund’s final IRR is a better proxy than its interim IRR for the information
about performance investors use in deciding whether to allocate capital to the partnership’s next
fund. Second, even if the interim IRR were the more desirable measure, in the Appendix we
show that interim IRR (at time of fundraising) and final IRR are highly correlated, with a
correlation coefficient of about 0.6. Similarly, Kaplan and Schoar (2005) find correlation
coefficients of about 0.8–0.9 between interim IRR at five years and final IRR, consistent with the
first few exits (or, in the case of venture capital, follow-on investments in portfolio companies)
being strongly indicative of a fund’s ultimate performance. Moreover, to the extent that interim
IRR is the preferable measure and is imperfectly correlated with final IRR, the standard errors-
in-variables effect implies that we will understate, not overstate, the sensitivity of future
fundraising to performance. Notwithstanding these arguments, in the Appendix we present
estimates of sensitivities of fundraising to performance in which we use the interim IRR at time
of fundraising as our measure of fund performance. While we have interim IRR data for only
somewhat less than half of our sample funds, we nonetheless obtain results similar to those
presented in this section.
4. Estimating Direct and Indirect Pay for Performance
In this section, we use the theoretical framework discussed in Section 1, together with the
regression estimates presented in Section 3, to estimate the magnitude of the total pay for
performance relation facing private equity GPs. We compare the magnitudes of its direct
component, from carried interest in the current fund, and its indirect component, from future
fundraising. We consider two measures of pay for performance: the incremental revenue to GPs

31
for an incremental dollar returned to LPs, and the incremental revenue to GPs for an incremental
percentage point improvement in IRR.
4.1 Discounting future GP compensation
Our estimates require a discount rate for future GP compensation. Unfortunately, the
literature has yet to converge on a set of widely agreed-upon estimates of the cost of capital for
different types of private equity funds, making it difficult to know what discount rate to use. The
main problem in estimating discount rates is the lack of objective market values at sufficient
frequency with which to compute a covariance of returns with public markets. At the same time,
in the literature, estimates of buyout betas tend to be close to one, and estimates of venture
capital betas tend to be in the range of two to three (Korteweg and Sorensen 2010, Driessen, Lin,
and Phalippou forthcoming). Metrick and Yasuda (2011) estimate that the beta of venture capital
is about two, leading to a cost of capital of about 15%, assuming a risk-free rate of 3% and a
market risk premium of 6%. A buyout beta of one then leads to a cost of capital of about 9%. We
use a discount rate of 9% for real estate as well. For calculations involving all funds taken
together, we use a weighted average of these costs of capital (weighted by the number of funds in
our sample), which works out to 12%. The results reported below in Tables 1-5 and 1-6 and
Figure 1-1 use these discount rates.24 Our main conclusions are robust to alternative choices of
discount rates based on the range of estimates reported in the literature, as discussed in Section
4.3 below and presented in Figures 1-2 to 1-4. Collectively, we believe Figures 1-1 to 1-4 do a
good job in spanning the range of beta estimates in the literature. In addition, by following the
24 We thank Andrew Metrick for suggesting these choices of discount rates.

32
approach described below, calculations analogous to the ones we present can be performed using
any potential discount rate.
4.2 Direct (explicit) pay for performance
In this subsection we estimate direct pay for performance in the current fund, which is
represented by the first term in equation (3) in Section 1. Our calculations assume that the fund
has the standard 20% carry, and we use the relevant means in our sample (by fund type and
sequence) as the baseline levels of performance and fund size. It is straightforward to perform
analagous calculations for different breakpoints of fund size and performance using the sample
distributions given in Table 1-2. Panel A of Table 1-5 shows that for first-time funds of all fund
types, the sample mean IRR is positive and greater than a potential hurdle rate of 8%, so the
carry is in the money. A 20% carry implies that GPs earn $0.25 (undiscounted) for an
incremental $1 earned for LPs.25 To calculate the incremental revenue to GPs for a percentage
point improvement in IRR, it is necessary to make further assumptions. We assume that the
fund’s capital is called in equal annual installments, and the distribution corresponding to each
capital call occurs T years later. The resulting IRR is algebraically equal to the IRR obtained by
assuming that there is a single capital call and a single distribution spaced T years apart, which
we take to be three years.
25 Our use of the standard 20% carry is motivated by evidence in the literature that carried
interest rarely differs from 20%, especially in recent times matching the bulk of our sample. In
Gompers and Lerner’s (1999) sample of 419 venture capital funds raised before 1992, 81% have
carry between 20% and 21%. In Metrick and Yasuda’s (2010) sample of 238 funds from 1993 to
2006, 95% of venture capital funds and 100% of buyout funds have carry equal to 20%. In
Robinson and Sensoy’s (2011b) sample of 837 funds from 1984 to 2010, carry is equal to 20%
for 89% and 97% of venture capital and buyout funds, respectively, and the average carry is
20.44% and 19.96%, respectively.

33
Under these assumptions, the net-of-fee total dollar return to limited partners in the first
fund, D, is given by , where r1 is the IRR (which is a net-of-fee measure) of
the first fund and is the size of the fund. Let R be the revenue earned by the GP. By the chain
rule, . Inverting D and differentiating yields:
We use this formula to convert incremental revenue per extra dollar returned to LPs to
incremental revenue per incremental percentage point of IRR, and vice versa. Panel A of Table
1-5 displays the direct pay for performance calculated using this formula with = 0.25,
corresponding to 20% carry, and the displayed sample parameters. For the average first time
fund in our sample (size $262.3 million), improving IRR from a baseline of 15.75% to 16.75%
results in $2.636 million in incremental revenue to the GP, or $1.876 million in present value.
For buyout funds the present value is larger, $3.323 million, reflecting both the larger average
size of buyout funds and the higher baseline level of performance. The present value for venture
capital funds is the smallest ($0.795 million), and real estate funds fall in the middle ($2.290
million).
4.3 Indirect pay for performance from future fundraising
We now turn to estimating indirect pay for performance arising from the effect of current
performance on future fundraising. This effect corresponds to the second and following lines in
equation (3) of Section 1. We require estimates of the terms, the and terms, and
the and terms in equation (3). The terms represent the expected
(4)

34
fraction of a fund’s size that accrues to GPs as compensation, through a combination of
management fees and carried interest. The appropriate values for are not obvious, and
depend on the fee structure as well as the entire distribution of returns. We rely on Metrick and
Yasuda (2010), who perform Monte Carlo simulations to estimate the distribution of using
details of the compensation terms of a recent sample of venture capital and buyout partnerships.
We use similar values for real estate funds (not covered by Metrick and Yasuda 2010) and the
overall sample of funds.
For the and terms, we use the type- and sequence-specific averages in our
sample. For example, suppose the fund of interest (current fund) is a first-time buyout fund. Then
and are the fraction of preceding buyout funds of sequence number 1 that raise a
follow-on fund in our sample, and the average size of the follow-on, conditional on raising one.
Panels F and C of Table 1-2 report that these values equal 76.5% and $685.7 million,
respectively. In this way, all of the p (.) and f (.) terms used in our calculations are provided in
Table 1-2.
It remains to obtain estimates of the and terms from the regression
coefficients in Tables 1-3 and 1-4. In all of our calculations, we use the coefficients from the
specifications without rather than with vintage year fixed effects, which lead to smaller estimates
of indirect pay for performance. We begin with the coefficients from Table 1-3. The marginal
effects from the probit regressions in Panel A are estimates of the change in probability of raising
a follow-on fund for an incremental change in current performance, and so are direct estimates of
under the constraint that the estimate is the same for all i—i.e., sequence effects are
ignored.

35
We use the coefficients from the logarithmic specifications in Panel C to obtain estimates
of the terms.26 In Panel C, the dependent variable is the natural logarithm of follow-
on fund size divided by preceding fund size plus one—i.e., . The estimated
regression coefficient, β, is an estimate of the derivative of this quantity with respect to ri, the
IRR of the preceding fund: . Rearranging, we have
Continuing the example of the first-time buyout fund, the expected incremental
compensation from the next fund is given in equation (3)
as . Metrick and Yasuda (2010) estimate an average
for buyout funds of 17.72%. The marginal effect in Panel A of Table 1-3 for a one
percentage point increment in IRR is equal to 0.00467, and the coefficient from Panel C of Table
1-3 is equal to 0.00524 (after, in both cases, converting decimal IRR to percentage). As
described above, = 76.5% and = $685.7 million. Panel A of Table 1-2 reports that
the average size of preceding buyout funds of sequence number 1 in our sample is =
$417.5 million. Putting it all together, the incremental expected compensation from the next
(second) fund for a one percentage point improvement in IRR in the current fund is equal to
26 A comparison of Panels B and C of Table 1-3 indicates that a logarithmic specification for
follow-on fund size fits the data better. Our estimates are higher, generally by about 10%, if we
use the coefficients from the raw growth specifications in Panel B instead.

36
0.1772 * [0.00467 * 685.7 + 0.765 * 0.00524 * (685.7 + 417.5)], or $1.351 million. This figure is
a present value as of the beginning of the life of the second fund (this is how Metrick and Yasuda
compute k), so we further discount for the average time between fundraisings (approximately
three years in our data) to convert to present value as of the beginning of the current fund. In this
way, we calculate the expected incremental compensation from the second, third, etc. follow-on
funds following equation (3) of Section 1, discounting each appropriately using the fund type–
specific discount rates discussed above, and assuming a three-year gap between successive
fundraisings. We then add the discounted expected incremental compensation from each future
fund to arrive at the total estimated indirect pay for performance.
4.3.1 Estimates ignoring sequence effects
Panel B of Table 1-5 displays estimates of indirect pay for performance using the
coefficients from Table 1-3 and the methodology described in Section 4.3, focusing on first-time
funds. We present results for the quartile breakpoints of k reported by Metrick and Yasuda
(2010), which are 15.75%, 17.72%, and 19.60% for buyout funds and 20.24%, 22.84%, and
26.11% for venture capital funds. For all funds taken together and for real estate funds, we use
15%, 20%, and 25%. As shown in equation (3), all of the estimates are proportional to k. We also
present results for different values of N, the maximum number of future funds the GP could
potentially run (e.g., before retirement). As discussed in Section 1, the estimates incorporate the
realistic feature that failure to raise a follow-on is a once and for all event, so dropping out is
permanent.
In the columns labeled δTR/δIRR, we present estimates of the present value of the
expected incremental revenue from future funds resulting from a one percentage point

37
improvement in current fund IRR, and in the columns labeled δTR/δD we use equation (4) to
convert these estimates into those resulting from an extra dollar returned to LPs. To gauge the
relative magnitudes of the present values of indirect and direct pay for performance, we present
their ratios in the rightmost columns of Panel B of Table 1-5. The ratios do not depend on
whether the performance measure is IRR or dollars because the term in brackets in equation (4)
drops out when taking the ratio. It is evident from Panel B of Table 1-5 that indirect pay for
performance from future fundraising is important in the private equity industry, and of the same
order of magnitude as direct pay for performance. The ratios range from a low of 0.42 for
venture capital funds with N = 3 and k = 20.24% to a high of 3.09 for buyout funds with N = 5
and k = 19.60%. The estimates of indirect pay for performance are largest for buyout funds and
smallest for venture capital funds, consistent with the patterns in Table 1-3.
4.3.2 Estimates accounting for sequence effects
The estimates presented in Table 1-4 suggest that the indirect incentives calculated in
Table 1-5 are likely to be strongly affected by the declining sensitivity of future fundraising to
current performance in the sequence of a partnership’s funds. The learning framework predicts
two channels through which sequence effects are likely to be important. First, holding the
sequence number of the “current” fund fixed, there is relatively less value from each potential
subsequent fund, and hence relatively less value from increasing N. Second, as a partnership ages
(the current fund becomes more advanced in the sequence of the partnership’s funds), indirect
pay for performance will decline. The indirect pay for performance estimates presented in Table
1-6 strongly support these ideas. We obtain these estimates by applying the methods described in
Section 4.2., taking sequence effects into account. Wherever we previously used a coefficient

38
from Table 1-3, we instead use the corresponding level effect coefficient plus the product of the
coefficient on the sequence interaction and the sequence number of the preceding fund, all from
Table 1-4. For example, when calculating the incremental compensation from the second follow-
on fund for buyout funds, the estimate of is given by (from Panel A of Table 1-4)
0.698 -0.091 * 2 = 0.516. In Panel A of Table 1-6, we calculate the (discounted) direct effect or
explicit pay for performance for different sequence number current funds. The effects per
incremental dollar returned to LPs are the same as in Table 1-5, but the effect per incremental
percentage point of IRR grows with fund sequence reflecting the growth in fund size with
sequence. In Panel B of Table 1-6, we estimate indirect pay for performance, holding k fixed at
its median values from Table 1-5. Two patterns are evident. The estimates are smaller than their
counterparts in Table 1-5, though still large, and decline with the sequence number of the current
fund. The decline is very strong for venture capital funds and fairly weak for buyout funds, for
which indirect pay for performance remains important well into a partnership’s sequence of
funds.
Figure 1-1 depicts the patterns in Table 1-6 graphically, and shows that for all funds
taken together and for venture capital funds, indirect pay for performance declines to virtually
zero by the time the partnership is managing its fourth fund, leaving only the direct component.
Overall, the estimates indicate that indirect pay for performance is a substantial component of the
total pay for performance relation facing private equity GPs, especially for funds early in a
partnership’s life. Figures 1-2 to 1-4 show that our key cross-sectional conclusions are robust to
alternative choices of discount rates. First, because GPs hold what is essentially an option on the
equity returns of their portfolio, the cost of capital may underestimate the riskiness of the GP
claim. For this reason, Figure 1-2 reports results using discount rates five percentage points

39
higher than our base cost of capital estimates. Second, based on the range of beta estimates in the
literature it is possible (but unlikely) that venture capital funds have in fact a lower cost of capital
than buyout funds. To assess the sensitivity of our conclusions to this possibility, Figure 1-3
reports results assuming the most extreme low venture capital beta estimate (0.86; Woodward
and Hall 2003) and high buyout beta estimate (1.3; Phallipou and Zollo 2005). Even with a lower
discount rate for venture capital than for buyout, indirect pay for performance is still larger for
buyout funds. Finally, Figure 1-4 uses high-end beta estimates of 3 for venture capital and 1.3 for
buyout. Figures 1-2 to 1-4 continue to show that indirect pay for performance is higher for
buyout funds compared to venture capital, and declines in the sequence of a partnership’s funds.
We believe that collectively Figures 1-1 to 1-4 do a good job spanning estimates of discount
rates in the literature. The figures show that while the magnitude of indirect pay for performance
declines with increased discount rates, the estimates remain considerable in magnitude.
Importantly, the figures show that our key cross-sectional conclusions are robust to alternative
choices of discount rates.
4.4 Factors Omitted from the Estimates
There are several factors that could affect the magnitude of our estimates that are not
explicitly modeled in the learning framework and which we do not have the data to estimate.27
First, we ignore costs. Fixed costs do not affect general partners’ pay for performance incentives.
However, costs do change as private equity funds grow and raise additional capital. In particular,
as future funds grow in size, partnerships may hire new partners who receive some share of the
27 One potential such effect we can test comes from the notion that good performance leads to
faster future fundraising. If so, GPs would get revenue from future funds earlier and potentially
manage more funds over a career. However, in the data there is no significant relation between a
fund’s performance and the time between fundraisings

40
revenue. Omitting this growth in the number of partners causes us to overestimate indirect pay
for performance. To estimate the magnitude of this effect would require data we do not have:
information on the number of partners, as well as the revenue-sharing arrangements between
partners as partnerships progress through time. To the extent that new partners added on to future
funds are likely to receive much lower shares of revenue than the original partners who were
responsible for good performance in the prior fund, the bias will be small.28
Another possibility is that a partnership’s carried interest percentage may respond to its
prior performance. Hochberg, Ljungqvist, and Vissing-Jorgensen (2010) provide evidence that
this adjustment sometimes happens when venture capital firms have extremely good
performance. However, the sensitivity of these adjustments to performance is small. Hochberg et
al.’s estimates (in their Table 1-6) imply that carried interest grows by about eight basis points
for an incremental one percentage point improvement in IRR. An eight basis point change is
0.4% of a base carry of 20%, so this effect causes our estimates to understate actual indirect pay
for performance very slightly, by about 0.4%.
The impact of good performance on the partners’ outside options could also influence
estimates of indirect pay for performance. Good performance in a fund likely positively affects a
partner’s human capital, which she could use to form a new partnership or to leave the private
28 Metrick and Yasuda (2011, p.27) report suggestive compensation numbers based on surveys of
venture capitalists. Their numbers indicate that, consistent with our intuition, more senior
partners (who presumably have been with the partnership since its earlier funds) earn
considerably more total compensation than junior partners, and five to 39 eight times as great a
share of the carried interest. We also note that while experienced general partners occasionally
leave one firm to join another existing firm, Alter (2009) finds that none of the experienced
venture capitalists in his sample do so. His evidence suggests that venture capital firms at least
only rarely hire experienced partners with whom they would have to share a large portion of the
revenue.

41
equity industry altogether and pursue other options. Since the value of these other options is
likely to be positively related to the fund’s performance, this effect leads our estimates to be
understated.29
Kaplan and Schoar (2005) find evidence of performance persistence, as do Chung (2010),
Hochberg et al. (2010), Phalippou (2010), and Robinson and Sensoy (2011a). Persistence would
result in somewhat higher carry dollars in the subsequent fund, suggesting that it may be
appropriate to use the upper range of the k estimates given by Metrick and Yasuda (2010) when
calculating indirect pay for performance. Our Figures 1-1 to 1-4 use the median k to be
conservative. Conversion to other values is straightforward as all estimates are linear in k.
Finally, in all of our calculations, we assume that the direct, explicit pay for performance
driven by the carried interest is “in the money,” so that GPs receive the full 20% of profits as
carried interest. While our calculations are appropriate for the average fund in our sample, whose
carry is in the money, this nonetheless represents an upper bound in the cross-section of funds,
since many funds’ performance is such that they earn no carried interest. This effect implies that
our estimates of direct pay for performance are an upper bound, and that for some funds the ratio
of indirect to direct pay for performance is much larger than for the average fund.
Overall, while costs that rise with fund size cause our estimates of the ratio of indirect to
explicit pay for performance to be overstated, all other omitted factors discussed above cause
them to be understated. Consequently, our conclusion that the indirect component of pay for
29 Alter (2009) reports that it is rare for the young California venture capitalists in his sample to
defect to raise their own funds, with a cumulative rate of 7% over every four-year block of time
in his data, less than 2% per year. If the rate for buyout partners is even lower than this, which
seems unlikely, our estimates of the difference between buyout and venture capital pay-
performance sensitivities would be slightly overstated.

42
performance in private equity is important and substantial in magnitude is likely to be robust to
refinements of our estimates. Moreover, such refinements are unlikely to overturn the support in
the data for the key cross-sectional differences implied by the learning model: that venture
capital funds have lower indirect pay for performance than buyout funds, and that pay for
performance declines in the sequence of a partnership’s funds.
5. Conclusion
In the private equity industry, the possibility of future fundraising provides substantial
indirect pay for performance incentives to general partners above and beyond the much-
discussed incentives from the explicit compensation system. Achieving high returns early on
allows a partnership to establish a reputation for being able to generate returns, which is valuable
as it allows partners to earn fees on larger funds in the future. We present a learning framework
that characterizes this process, and show that its predictions better match the fundraising
dynamics in the data than behavioral alternatives based on “naive reinvestment” or “return
chasing.” In particular, both the likelihood of raising a follow-on fund and the size of that fund if
one is raised are strongly positively related to current performance, the relations betwen future
fundraising and performance are stronger for buyout funds than for venture capital funds, and
these relations decline in the sequence of a partnership’s funds.
From the learning framework we derive an explicit formula that we use to transform our
estimates of the sensitivity of future fundraising to current performance into estimates of the size
of indirect pay for performance in private equity. Our estimates suggest that the indirect
component of pay for performance is of the same order of magnitude as the direct component
from carried interest. Indirect pay for performance is particularly important for buyout

43
partnerships compared to venture capital and for newer partnerships that have yet to establish a
reputation. Our results are all consistent with the learning framework, and suggest that learning
about ability is a key driver of indirect pay for performance in private equity.
This article contributes to the debate about the incentives of private equity general
partners and their effect on value creation. Despite the central importance of general partner
incentives to understanding the activities of private equity firms, we are the first to estimate how
large their total incentives (direct plus indirect) actually are. Our results suggest that total
performance-based compensation in private equity partnerships is larger, by a factor of about two,
than commonly discussed, because most discussions focus on the carried interest alone. Total
pay for performance in private equity is much larger and exhibits much more variation, both
across partnership types and in the sequence of funds, than suggested by the carried interest
alone.
While the indirect pay for performance that we find is consistent with our learning
framework, our results do not speak directly to whether the resulting total compensation system,
including the dynamics of carried interest, is efficient. Understanding whether the total pay-
performance relations in private equity, in particular the fact that the direct carried interest
typically does not increase much in the face of diminishing indirect pay for performance over
time, are efficient and reflect optimal contracting is an important topic for future research.
The analysis in this article could be applied to other forms of organization. Perhaps the
most straightforward application would be to other asset management settings, such as hedge
funds, mutual funds, and pension funds, because their explicit fee structures would allow for
similar calculation of the returns to managing a larger quantity of funds. Calculating the indirect

44
pay for performance implied by the flow-performance (and termination-performance) relations in
these settings would be an important addition to our understanding of these industries.
Most generally, our analysis provides empirical evidence consistent with the idea started
by Fama (1980) and Holmstrom (1999) that indirect pay for performance can be an important
source of incentives inside firms. An advantage of studying private equity is that it is possible to
quantify these incentives. Private equity is also an industry where incentives, both direct and
indirect, are particularly important. The extent to which indirect, market-based incentives are
important in other industries, both in absolute terms and relative to direct incentives, is likely to
be an important topic of future research.

45
Figure 1-1 Ratio of indirect to direct pay for performance using discount rates: All Funds 12%,
Buyout 9%,Venture Capital 15%, Real Estate 9%
This figure presents estimates of the ratio of the indirect to direct effect of an incremental
improvement in performance in the current fund on GP revenue. The indirect effect is the
estimated effect on expected revenue from future funds, while the direct effect comes from
carried interest in the current fund. The figure presents estimates computed using the formulas
provided in Section 4, sample parameters from Table 1-2, and regression coefficients from Table
1-4. Estimates are computed for all funds taken together, buyout funds, venture capital funds,
and real estate funds, for different assumptions about the current fund's placement in the
partnership's sequence of funds. All estimates assume N, the number of potential future funds, is
equal to five. Discount rates of 12%, 9%, 15%, and 9% are used for all funds taken together,
buyout funds, venture capital funds, and real estate funds, respectively. These discount rates
correspond to betas of 1 for buyout funds, 2 for venture capital funds, and 1 for real estate funds.
The discount rate for all funds is a sample-size weighted average of the type-specific discount
rates.

46
Figure 1-2 Ratio of indirect to direct pay for performance using discount rates: All Funds 17%,
Buyout 14%,Venture Capital 20%, Real Estate 14%
This figure presents estimates of the ratio of the indirect to direct effect of an incremental
improvement in performance in the current fund on GP revenue. The figure is identical to Figure
1-1 except that it uses different discount rates. Discount rates of 17%, 14%, 20%, and 14% are
used for all funds taken together, buyout funds, venture capital funds, and real estate funds,
respectively. These discount rates are five percentage point increments from those used in Figure
1-1.

47
Figure 1-3 Ratio of indirect to direct pay for performance using discount rates: All Funds 10%,
Buyout 11%,Venture Capital 8%, Real Estate 11%
This figure presents estimates of the ratio of the indirect to direct effect of an incremental
improvement in performance in the current fund on GP revenue. The figure is identical to Figure
1-1 except that it uses different discount rates. Discount rates of 10%, 11%, 8%, and 11% are
used for all funds taken together, buyout funds, venture capital funds, and real estate funds,
respectively. These discount rates correspond to betas of 1.3 for buyout funds, 0.86 for venture
capital funds, and 1.3 for real estate funds.

48
Figure 1-4 Ratio of indirect to direct pay for performance using discount rates: All Funds 16%,
Buyout 11%, Venture Capital 21%, Real Estate 11%
This figure presents estimates of the ratio of the indirect to direct effect of an incremental
improvement in performance in the current fund on GP revenue. The figure is identical to Figure
1-1 except that it uses different discount rates. Discount rates of 16%, 11%, 21%, and 11% are
used for all funds taken together, buyout funds, venture capital funds, and real estate funds,
respectively. These discount rates correspond to betas of 1.3 for buyout funds, 3 for venture
capital funds, and 1.3 for real estate funds.

49
Table 1-1 Descriptive Statistics
Descriptive statistics for the sample funds. Panel A reports the distribution of the
number of preceding funds per partnership. Panel B reports the distributions of
preceding fund size and performance, follow-on fund size conditional on raising a
follow-on, growth in fund size conditional on raising a follow-on (percentage
difference between preceding and follow-on size), the time between successive funds
(the time elapsed before raising a follow-on), and the percentage of preceding funds
that raise a follow-on. Preceding funds meet the following criteria: fund size and
performance (IRR) information is available, fund size is at least $5M in 1990 dollars,
and the fund is raised before 2006. The follow-on fund for each preceding fund (if
one is raised) is the next fund raised by the same private equity partnership.
Panel A: Descriptive statistics for the number of preceding funds per partnership
Fund Type Number of
partnerships Number of preceding funds per partnership
Mean Median Std Dev Min. Q1 Q3 Max.
All 843 2.07 1 1.65 1 1 3 12
Buyout 314 2.05 1.00 1.56 1.00 1.00 3.00 11.00
Venture Capital 412 2.07 1.00 1.75 1.00 1.00 2.00 12.00
Real Estate 117 2.13 2.00 1.47 1.00 1.00 3.00 9.00
Panel B: Descriptive statistics for fund size, performance, and fundraising
All Funds
Obs Mean Median Q1 Q3
Preceding fund size ($M) 1745 497.9 210.0 82.4 500.0
Preceding fund performance (IRR) 1745 15.1% 10.6% 0.5% 22.3%
Follow-on fund size conditional on raising
one ($M) 1469 792.2 314.0 136.0 728.4
Growth in fund size conditional on raising
a follow-on (%) 1469 92.4% 53.8% 0.0% 123.1%
Time between successive funds (years) 1469 3.3 3.0 2.0 4.0
Percentage of preceding funds that raise a
follow-on 84.2%
Buyout
Obs Mean Median Q1 Q3
Preceding fund size ($M) 645 866.4 380.0 169.2 900.0
Preceding fund performance (IRR) 645 16.5% 14.3% 5.9% 25.4%
Follow-on fund size conditional on raising
one ($M) 549 1465.3 632.6 289.3 1500.0
Growth in fund size conditional on raising
a follow-on (%) 549 110.9% 70.0% 21.7% 140.3%
Time between successive funds (years) 549 3.8 3.0 2.0 5.0
Percentage of preceding funds that raise a
follow-on 85.1%
Venture Capital
Obs Mean Median Q1 Q3
Preceding fund size ($M) 851 217.7 125.0 56.0 254.0
Preceding fund performance (IRR) 851 14.1% 5.8% -5.0% 17.6%

50
Follow-on fund size conditional on raising
one ($M) 681 283.9 181.0 80.0 368.0
Growth in fund size conditional on raising
a follow-on (%) 681 78.6% 42.9% -8.3% 113.6%
Time between successive funds (years) 681 3.3 3.0 2.0 4.0
Percentage of preceding funds that raise a
follow-on 80.0%
Real Estate
Obs Mean Median Q1 Q3
Preceding fund size ($M) 249 501.0 314.9 106.0 622.8
Preceding fund performance (IRR) 249 14.6% 14.1% 7.9% 21.9%
Follow-on fund size conditional on raising
one ($M) 239 694.2 425.0 145.0 817.3
Growth in fund size conditional on raising
a follow-on (%) 239 89.7% 48.9% -3.6% 100.6%
Time between successive funds (years) 239 2.4 2.0 1.0 3.0
Percentage of preceding funds that raise a
follow-on 96.0%
Table 1-2 Descriptive Statistics by Fund Sequence
Descriptive statistics by preceding and follow-on fund sequence number. Panel A presents
statistics for preceding fund size. Panel B presents statistics for preceding fund performance
(IRR). Panel C presents statistics for follow-on size conditional on raising a follow-on. Panel D
reports statistics for growth in fund size conditional on raising a follow on (in percent). Panel E
reports statistics for the number of years elapsed between successive fundraisings, conditional on
raising a follow-on. Panel F reports the percentage of preceding funds that raise a follow-on.
Panel A: Descriptive statistics for preceding fund size ($M)
All Funds Buyout
Sequence Obs Mean Median Q1 Q3 Obs Mean Median Q1 Q3
1 612 262.3 112.0 50.0 271.0 247 417.5 220.0 100.0 500.0
2 392 362.9 187.5 75.0 417.0 147 587.8 357.0 165.0 700.0
3 271 488.2 250.0 109.7 518.0 101 812.5 469.0 220.0 900.0
4 186 723.2 355.0 151.0 825.0 65 1397.5 825.0 400.0 1902.0
5 109 861.4 312.5 148.0 750.0 35 1807.4 750.0 331.5 2100.0
6 68 897.2 481.0 202.0 829.0 17 1978.0 1000.0 604.2 3496.9
7 41 921.7 444.0 238.0 917.0 11 2041.7 1425.7 470.0 3200.0
8 24 1265.3 787.5 345.5 1868.5 10 2354.4 1950.0 1324.8 3000.0
9 18 2184.3 900.0 305.0 3781.0 7 4483.4 5000.0 3085.0 5300.0
>=10 24 1536.3 848.9 400.5 1558.0 5 4427.9 5426.1 3272.0 5941.5
Total 1745 497.9 210.0 82.4 500.0 645 866.4 380.0 169.2 900.0
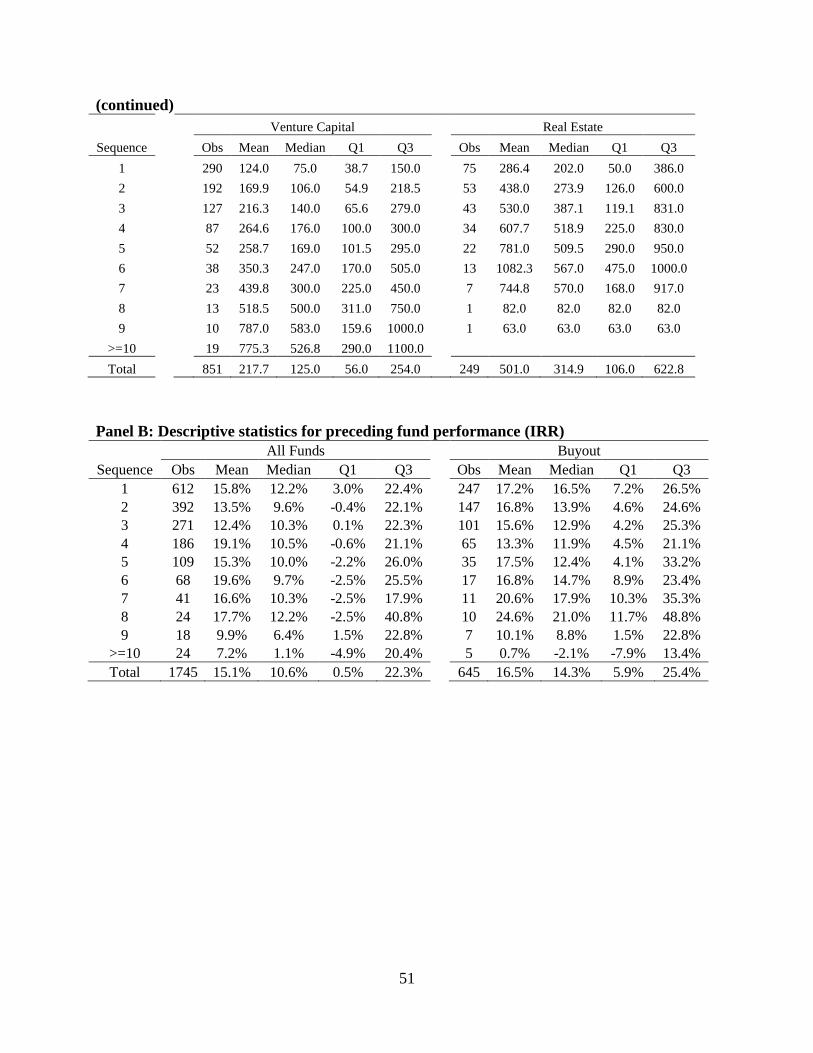
51
(continued)
Venture Capital Real Estate
Sequence
Obs Mean Median Q1 Q3 Obs Mean Median Q1 Q3
1 290 124.0 75.0 38.7 150.0 75 286.4 202.0 50.0 386.0
2 192 169.9 106.0 54.9 218.5 53 438.0 273.9 126.0 600.0
3 127 216.3 140.0 65.6 279.0 43 530.0 387.1 119.1 831.0
4 87 264.6 176.0 100.0 300.0 34 607.7 518.9 225.0 830.0
5 52 258.7 169.0 101.5 295.0 22 781.0 509.5 290.0 950.0
6 38 350.3 247.0 170.0 505.0 13 1082.3 567.0 475.0 1000.0
7 23 439.8 300.0 225.0 450.0 7 744.8 570.0 168.0 917.0
8 13 518.5 500.0 311.0 750.0 1 82.0 82.0 82.0 82.0
9 10 787.0 583.0 159.6 1000.0 1 63.0 63.0 63.0 63.0
>=10 19 775.3 526.8 290.0 1100.0
Total 851 217.7 125.0 56.0 254.0 249 501.0 314.9 106.0 622.8
Panel B: Descriptive statistics for preceding fund performance (IRR)
All Funds Buyout
Sequence Obs Mean Median Q1 Q3 Obs Mean Median Q1 Q3
1 612 15.8% 12.2% 3.0% 22.4% 247 17.2% 16.5% 7.2% 26.5%
2 392 13.5% 9.6% -0.4% 22.1% 147 16.8% 13.9% 4.6% 24.6%
3 271 12.4% 10.3% 0.1% 22.3% 101 15.6% 12.9% 4.2% 25.3%
4 186 19.1% 10.5% -0.6% 21.1% 65 13.3% 11.9% 4.5% 21.1%
5 109 15.3% 10.0% -2.2% 26.0% 35 17.5% 12.4% 4.1% 33.2%
6 68 19.6% 9.7% -2.5% 25.5% 17 16.8% 14.7% 8.9% 23.4%
7 41 16.6% 10.3% -2.5% 17.9% 11 20.6% 17.9% 10.3% 35.3%
8 24 17.7% 12.2% -2.5% 40.8% 10 24.6% 21.0% 11.7% 48.8%
9 18 9.9% 6.4% 1.5% 22.8% 7 10.1% 8.8% 1.5% 22.8%
>=10 24 7.2% 1.1% -4.9% 20.4% 5 0.7% -2.1% -7.9% 13.4%
Total 1745 15.1% 10.6% 0.5% 22.3% 645 16.5% 14.3% 5.9% 25.4%

52
(continued) Venture Capital Real Estate
Sequence Obs Mean Median Q1 Q3 Obs Mean Median Q1 Q3
1 290 14.0% 8.0% -1.6% 17.4% 75 17.5% 15.8% 10.9% 24.8%
2 192 10.6% 5.0% -4.9% 16.5% 53 14.6% 14.1% 8.2% 23.0%
3 127 10.1% 4.0% -6.9% 19.9% 43 11.6% 12.0% 6.9% 18.3%
4 87 26.1% 2.9% -7.2% 20.6% 34 12.2% 13.6% 6.3% 21.0%
5 52 14.2% 5.6% -8.6% 21.0% 22 14.6% 13.0% 7.7% 17.7%
6 38 22.5% 2.6% -5.2% 29.9% 13 15.0% 12.3% 5.6% 25.4%
7 23 16.8% 1.6% -6.9% 10.4% 7 9.6% 11.6% 5.8% 16.0%
8 13 12.1% 1.1% -8.5% 16.5% 1 21.5% 21.5% 21.5% 21.5%
9 10 7.2% 2.2% -1.0% 13.4% 1 35.0% 35.0% 35.0% 35.0%
>=10 19 8.9% 1.2% -2.7% 25.1%
Total 851 14.1% 5.8% -5.0% 17.6% 249 14.6% 14.1% 7.9% 21.9%
Panel C: Descriptive statistics for follow-on fund size conditional on raising a follow-on
($M)
All Funds Buyout
Sequence Obs Mean Median Q1 Q3 Obs Mean Median Q1 Q3
2 462 422.7 215.9 90.0 472.0 189 685.7 390.4 180.0 767.0
3 347 557.6 279.0 116.0 600.0 130 978.8 540.3 252.0 1000.0
4 231 772.2 404.0 165.0 855.7 89 1380.6 850.0 405.0 1550.0
5 163 1039.7 380.0 154.3 900.0 58 2070.4 855.0 392.0 2996.9
6 100 1543.2 474.1 223.5 950.0 34 3505.4 1326.0 473.3 5125.0
7 66 1030.3 464.2 252.9 917.0 17 1777.6 682.6 500.0 3100.0
8 38 1658.0 735.0 315.0 1500.0 11 3763.4 1900.0 1170.0 3000.0
9 23 1846.6 800.0 400.0 3085.0 10 3599.6 3433.0 1300.0 5150.3
10 16 1800.3 760.5 237.1 3386.0 6 3985.6 3600.0 3272.0 5941.5
>=11 23 3064.8 1100.0 290.0 2560.0 5 10789.5 12179.5 5426.1 15000.0
Total 1469 792.2 314.0 136.0 728.4 549 1465.3 632.6 289.3 1500.0

53
(continued)
Venture Capital Real Estate
Sequence Obs Mean Median Q1 Q3 Obs Mean Median Q1 Q3
2 201 175.3 114.2 57.2 225.0 72 422.6 304.6 100.0 675.1
3 167 232.3 154.0 73.0 318.0 50 549.2 326.4 150.0 772.2
4 101 273.4 191.0 116.1 375.0 41 680.2 537.9 145.0 846.0
5 72 295.4 199.5 104.0 412.0 33 852.0 530.0 290.0 950.0
6 44 360.9 247.0 172.5 527.5 22 875.2 506.5 340.0 900.0
7 36 442.4 315.0 234.0 469.2 13 1681.2 707.5 498.0 1325.0
8 21 517.0 400.0 300.0 750.0 6 1791.7 1065.0 594.0 1994.0
9 12 534.3 480.0 232.3 703.0 1 63.0 63.0 63.0 63.0
10 9 533.0 470.7 226.4 650.0 1 95.0 95.0 95.0 95.0
>=11 18 919.1 691.3 102.5 1450.0
Total 681 283.9 181.0 80.0 368.0 239 694.2 425.0 145.0 817.3
Panel D: Descriptive statistics for growth in fund size conditional on raising a follow-on
All Funds Buyout
Sequence Obs Mean Median Q1 Q3 Obs Mean Median Q1 Q3
1~2 462 112.6% 71.1% 19.0% 143.9% 189 119.7% 84.1% 38.5% 151.8%
2~3 347 83.3% 56.3% 0.0% 125.0% 130 99.9% 77.0% 17.4% 155.5%
3~4 231 92.4% 51.1% -0.2% 128.6% 89 122.7% 70.0% 30.8% 170.3%
4~5 163 40.7% 31.6% -32.8% 76.8% 58 52.5% 40.7% -10.5% 88.8%
5~6 100 125.7% 50.1% 12.0% 99.8% 34 146.8% 66.1% 45.7% 133.1%
6~7 66 62.6% 34.6% -35.8% 80.6% 17 39.8% 31.7% -37.5% 82.4%
7~8 38 150.0% 65.8% -14.8% 157.8% 11 277.5% 110.4% -8.2% 300.0%
8~9 23 53.3% 26.0% -48.7% 100.0% 10 102.5% 42.3% -48.7% 254.2%
9~10 16 22.9% 11.3% -60.1% 58.6% 6 51.2% 1.0% -55.2% 94.5%
>=11 23 125.4% -1.0% -55.8% 164.1% 5 246.7% 105.0% 13.1% 225.1%
Total 1469 92.4% 53.8% 0.0% 123.1% 549 110.9% 70.0% 21.7% 140.3%
(continued)
Venture Capital Real Estate
Sequence Obs Mean Median Q1 Q3 Obs Mean Median Q1 Q3
1~2 201 97.9% 62.7% 7.4% 140.6% 72 135.1% 60.8% 5.6% 127.6%
2~3 167 73.8% 39.6% -2.0% 113.6% 50 71.7% 51.8% -8.6% 88.7%
3~4 101 71.9% 33.3% -11.9% 115.1% 41 77.6% 50.0% -0.2% 100.0%
4~5 72 34.1% 25.4% -35.4% 62.5% 33 34.3% 26.2% -16.3% 87.5%
5~6 44 135.8% 48.9% 0.0% 90.4% 22 72.9% 29.9% -20.0% 72.2%
6~7 36 79.2% 37.6% -32.2% 79.4% 13 46.1% 25.0% -3.6% 65.6%
7~8 21 51.3% 35.2% -20.8% 100.0% 6 262.1% 109.9% 4.2% 181.8%
8~9 12 18.8% 12.7% -35.0% 80.9% 1 -23.2% -23.2% -23.2% -23.2%
9~10 9 0.9% 7.3% -65.0% 55.5% 1 50.8% 50.8% 50.8% 50.8%
>=11 18 91.7% -11.1% -74.8% 127.3%
Total 681 78.6% 42.9% -8.3% 113.6% 239 89.7% 48.9% -3.6% 100.6%

54
Panel E. Number of years elapsed between successive funds, conditional on raising a
follow-on
All Funds Buyout
Sequence Obs Mean Median Q1 Q3 Obs Mean Median Q1 Q3
1~2 462 3.93 4.00 2.00 5.00 189 4.43 4.00 3.00 6.00
2~3 347 3.42 3.00 2.00 4.00 130 3.73 4.00 3.00 5.00
3~4 231 3.23 3.00 2.00 4.00 89 3.48 3.00 2.00 5.00
4~5 163 2.89 3.00 2.00 4.00 58 3.36 3.00 2.00 4.00
5~6 100 2.78 3.00 1.00 4.00 34 3.06 3.00 2.00 4.00
6~7 66 2.62 2.00 1.00 4.00 17 3.00 3.00 2.00 4.00
7~8 38 2.32 2.00 1.00 3.00 11 2.36 3.00 1.00 3.00
8~9 23 2.52 2.00 2.00 3.00 10 2.60 2.00 2.00 3.00
9~10 16 2.19 2.00 1.00 3.50 6 2.67 2.50 1.00 4.00
>=11 23 1.91 2.00 1.00 3.00 5 2.20 2.00 1.00 3.00
Total 1469 3.33 3.00 2.00 4.00 549 3.75 3.00 2.00 5.00
(continued)
Venture Capital Real Estate
Sequence Obs Mean Median Q1 Q3 Obs Mean Median Q1 Q3
1~2 201 3.95 4.00 2.00 5.00 72 2.60 2.00 1.00 3.00
2~3 167 3.45 3.00 2.00 4.00 50 2.54 2.00 1.00 3.00
3~4 101 3.39 3.00 2.00 4.00 41 2.32 2.00 2.00 3.00
4~5 72 2.88 3.00 2.00 4.00 33 2.09 2.00 1.00 3.00
5~6 44 2.86 3.00 2.00 4.00 22 2.18 2.00 1.00 3.00
6~7 36 2.78 3.00 2.00 4.00 13 1.69 1.00 1.00 2.00
7~8 21 2.43 2.00 1.00 3.00 6 1.83 1.00 1.00 3.00
8~9 12 2.50 2.00 1.00 3.50 1 2.00 2.00 2.00 2.00
9~10 9 2.00 2.00 1.00 2.00 1 1.00 1.00 1.00 1.00
>=11 18 1.83 2.00 1.00 2.00
Total 681 3.34 3.00 2.00 4.00 239 2.35 2.00 1.00 3.00
Panel F: Percentage of preceding funds that raise a follow-on
Sequence All BO VC RE
1 75.5% 76.5% 69.3% 96.0%
2 88.5% 88.4% 87.0% 94.3%
3 85.2% 88.1% 79.5% 95.3%
4 87.6% 89.2% 82.8% 97.1%
5 91.7% 97.1% 84.6% 100.0%
6 97.1% 100.0% 94.7% 100.0%
7 92.7% 100.0% 91.3% 85.7%
8 95.8% 100.0% 92.3% 100.0%
9 88.9% 85.7% 90.0% 100.0%
>=10 95.8% 100.0% 94.7%
Total 84.2% 85.1% 80.0% 96.0%

55
Table 1-3 Follow-on Fundraising Regressions
Preceding fund-level regressions to explain follow-on fundraising. Panel A presents probit
regressions in which the dependent variable is 1 if a follow-on is raised and 0 otherwise.
Marginal effects are reported and z-scores are given in parentheses. Panels B and C present OLS
regressions for preceding funds that raise a follow-on fund. In Panel B, the dependent variable is
fund growth, defined as follow-on fund size divided by preceding fund size minus one. In Panel
C, the dependent variable is the natural logarithm of fund growth plus one. In all Panels,“All
Funds” regressions include fund type fixed effects and model (2) includes vintage year fixed
effects. Heteroskedasticity-robust standard errors are clustered at the PE firm level. In Panels B
and C, t-statistics are given in parentheses. *, **, and *** indicate statistical significance at the
10%, 5%, and 1% level, respectively.
Panel A: Probit regressions for the probability of raising a follow-on fund
All Funds Buyout
(1) (2) (1) (2)
Preceding fund IRR 0.316*** 0.324*** 0.467*** 0.588***
(4.788) (4.563) (4.814) (4.742)
Number of observations 1,745 1,622 645 560
Pseudo R2 0.084 0.146 0.087 0.140
(continued)
Venture Capital Real Estate
(1) (2) (1) (2)
Preceding fund IRR 0.297*** 0.288*** 0.187*** 0.393**
(3.337) (3.032) (2.671) (2.487)
Number of observations 851 786 249 115
Pseudo R2 0.043 0.128 0.073 0.166
Panel B: OLS regressions for growth in fund size conditional on raising a follow-on fund
All Funds Buyout
(1) (2) (1) (2)
Preceding fund IRR 0.663** 0.623** 2.314*** 2.152***
(2.088) (2.045) (4.119) (3.316)
Constant 0.984*** 1.590*** 0.675*** 2.034
(11.545) (2.770) (7.390) (1.569)
Number of observations 1,469 1,469 549 549
Adjusted R2 0.026 0.038 0.058 0.075
(continued)

56
Venture Capital Real Estate
(1) (2) (1) (2)
Preceding fund IRR 0.492 0.426 1.955*** 1.723***
(1.634) (1.413) (3.029) (2.724)
Constant 0.699*** 0.887*** 0.602*** -0.107***
(9.902) (4.489) (4.810) (-2.691)
Number of observations 681 681 239 239
Adjusted R2 0.021 0.027 0.014 0.036
Panel C: OLS regressions for log(fund growth + 1) conditional on raising a follow-on fund
All Funds Buyout
(1) (2) (1) (2)
Preceding fund IRR 0.177*** 0.161*** 0.524*** 0.466***
(2.813) (2.798) (5.065) (3.967)
Constant 0.991*** 1.126*** 0.926*** 1.114***
(52.650) (12.882) (45.103) (6.450)
Number of observations 1,469 1,469 549 549
Adjusted R2 0.039 0.070 0.050 0.081
(continued)
Venture Capital Real Estate
(1) (2) (1) (2)
Preceding fund IRR 0.139** 0.101** 0.572*** 0.503***
(2.553) (2.120) (3.280) (2.901)
Constant 0.886*** 1.003*** 0.853*** 0.662***
(59.797) (13.045) (23.575) (60.784)
Number of observations 681 681 239 239
Adjusted R2 0.033 0.088 0.024 0.073
Table 1-4 Follow-on Fundraising Regressions: Sequence Interactions
Preceding fund-level regressions to explain follow-on fundraising, with sequence interactions.
Panel A presents linear probability regressions in which the dependent variable is 1 if a follow-
on is raised and 0 otherwise. Panels B and C present OLS regressions for preceding funds that
raise a follow-on fund. In Panel B, the dependent variable is fund growth, defined as follow-on
fund size divided by preceding fund size minus one. In Panel C, the dependent variable is the
natural logarithm of fund growth plus one. In all Panels,“All Funds” regressions include fund
type fixed effects and model (2) includes vintage year fixed effects. Heteroskedasticity-robust
standard errors are clustered at the PE firm level. T-statistics are given in parentheses. *, **, and
*** indicate statistical significance at the 10%, 5%, and 1% level, respectively.

57
Panel A. Linear probability model for the probability of raising a follow-on fund
All Funds Buyout
(1) (2) (1) (2)
Preceding fund IRR 0.305*** 0.287*** 0.698*** 0.683***
(4.082) (4.141) (5.447) (4.925)
Preceding fund sequence number 0.033*** 0.035*** 0.048*** 0.048***
(7.425) (7.470) (5.724) (5.035)
Preceding fund IRR*Preceding fund
sequence # -0.051*** -0.051***
-0.091*** -0.075**
(-2.686) (-2.957) (-3.500) (-2.494)
Constant 0.738*** 0.927*** 0.650*** 0.802***
(32.868) (39.113) (18.709) (21.140)
Number of observations 1,745 1,745 645 645
Adjusted R2 0.072 0.124 0.110 0.135
(continued)
Venture Capital Real Estate
(1) (2) (1) (2)
Preceding fund IRR 0.214*** 0.199*** 0.227 0.144
(3.159) (3.427) (1.578) (1.055)
Preceding fund sequence number 0.030*** 0.035*** 0.004 -0.004
(5.849) (5.780) (0.287) (-0.338)
Preceding fund IRR*Preceding fund
sequence # -0.034** -0.039*** 0.004 0.041
(-2.019) (-2.777) (0.087) (0.888)
Constant 0.696*** 0.902*** 0.915*** 0.993***
(28.294) (43.013) (21.005) (58.993)
Number of observations 851 851 249 249
Adjusted R2 0.043 0.137 0.015 0.068
Panel B: OLS regressions for growth in fund size conditional on raising a follow-on fund
All Funds Buyout
(1) (2) (1) (2)
Preceding fund IRR 1.950*** 1.911*** 1.977** 1.537
(3.142) (3.079) (2.093) (1.640)
Preceding fund sequence number 0.040 0.050 0.016 0.011
(1.246) (1.565) (0.301) (0.247)
Preceding fund IRR*Preceding fund
sequence # -0.376** -0.375**
0.127 0.215
(-2.468) (-2.501) (0.355) (0.610)
Constant 0.813*** 1.333** 0.636*** 2.092*
(6.011) (2.322) (3.768) (1.657)

58
Number of observations 1,469 1,469 549 549
Adjusted R2 0.043 0.055 0.056 0.076
(continued)
Venture Capital Real Estate
(1) (2) (1) (2)
Preceding fund IRR 1.964*** 1.936*** 3.899*** 3.369***
(2.695) (2.619) (2.886) (2.611)
Preceding fund sequence number 0.034 0.056 0.036 0.011
(0.888) (1.539) (0.433) (0.131)
Preceding fund IRR*Preceding fund
sequence # -0.423** -0.433**
-0.708** -0.603*
(-2.464) (-2.536) (-2.103) (-1.704)
Constant 0.562*** 0.607*** 0.496 -0.183
(4.221) (2.588) (1.604) (-1.618)
Number of observations 681 681 239 239
Adjusted R2 0.060 0.067 0.018 0.039
Panel C: OLS regressions for log(fund growth + 1) conditional on raising a follow-on fund
All Funds Buyout
(1) (2) (1) (2)
Preceding fund IRR 0.400*** 0.388*** 0.580*** 0.466**
(5.390) (5.282) (2.761) (2.197)
Preceding fund sequence number -0.010** -0.007 -0.004 -0.006
(-2.037) (-1.534) (-0.333) (-0.696)
Preceding fund IRR*Preceding fund
sequence # -0.066*** -0.066***
-0.021 -0.001
(-3.062) (-3.237) (-0.305) (-0.014)
Constant 1.006*** 1.104*** 0.935*** 1.123***
(45.394) (13.539) (23.543) (6.858)
Number of observations 1,469 1,469 549 549
Adjusted R2 0.056 0.085 0.047 0.078
(continued)
Venture Capital Real Estate
(1) (2) (1) (2)
Preceding fund IRR 0.358*** 0.334*** 1.179*** 1.039***
(4.288) (3.800) (3.598) (3.219)
Preceding fund sequence number -0.014** -0.008 0.011 0.005
(-2.512) (-1.440) (0.506) (0.223)
Preceding fund IRR*Preceding fund
sequence # -0.063*** -0.066***
-0.221** -0.196**
(-2.831) (-3.057) (-2.477) (-2.064)
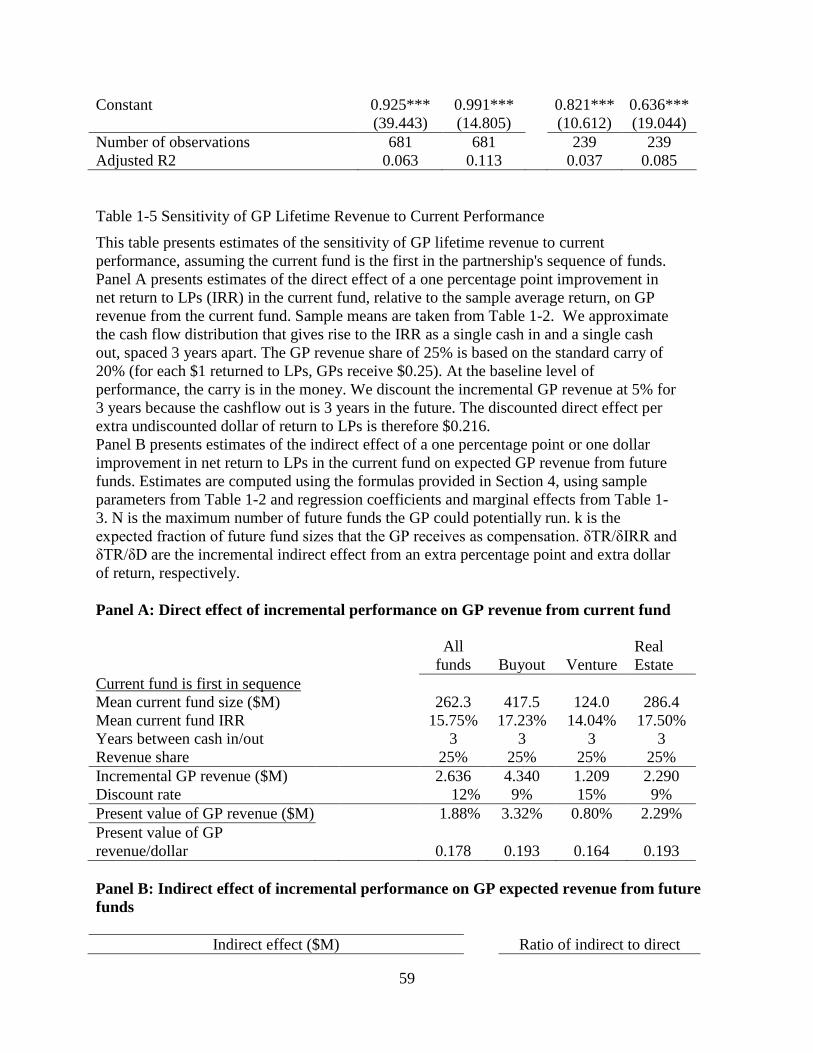
59
Constant 0.925*** 0.991*** 0.821*** 0.636***
(39.443) (14.805) (10.612) (19.044)
Number of observations 681 681 239 239
Adjusted R2 0.063 0.113 0.037 0.085
Table 1-5 Sensitivity of GP Lifetime Revenue to Current Performance
This table presents estimates of the sensitivity of GP lifetime revenue to current
performance, assuming the current fund is the first in the partnership's sequence of funds.
Panel A presents estimates of the direct effect of a one percentage point improvement in
net return to LPs (IRR) in the current fund, relative to the sample average return, on GP
revenue from the current fund. Sample means are taken from Table 1-2. We approximate
the cash flow distribution that gives rise to the IRR as a single cash in and a single cash
out, spaced 3 years apart. The GP revenue share of 25% is based on the standard carry of
20% (for each $1 returned to LPs, GPs receive $0.25). At the baseline level of
performance, the carry is in the money. We discount the incremental GP revenue at 5% for
3 years because the cashflow out is 3 years in the future. The discounted direct effect per
extra undiscounted dollar of return to LPs is therefore $0.216.
Panel B presents estimates of the indirect effect of a one percentage point or one dollar
improvement in net return to LPs in the current fund on expected GP revenue from future
funds. Estimates are computed using the formulas provided in Section 4, using sample
parameters from Table 1-2 and regression coefficients and marginal effects from Table 1-
3. N is the maximum number of future funds the GP could potentially run. k is the
expected fraction of future fund sizes that the GP receives as compensation. δTR/δIRR and
δTR/δD are the incremental indirect effect from an extra percentage point and extra dollar
of return, respectively.
Panel A: Direct effect of incremental performance on GP revenue from current fund
All
funds Buyout Venture
Real
Estate
Current fund is first in sequence
Mean current fund size ($M) 262.3 417.5 124.0 286.4
Mean current fund IRR 15.75% 17.23% 14.04% 17.50%
Years between cash in/out 3 3 3 3
Revenue share 25% 25% 25% 25%
Incremental GP revenue ($M) 2.636 4.340 1.209 2.290
Discount rate 12% 9% 15% 9%
Present value of GP revenue ($M) 1.88% 3.32% 0.80% 2.29%
Present value of GP
revenue/dollar 0.178 0.193 0.164 0.193
Panel B: Indirect effect of incremental performance on GP expected revenue from future
funds
Indirect effect ($M) Ratio of indirect to direct

60
effect
All Funds All Funds
N=3 N=5
k δTR/δIRR δTR/δD δTR/δIRR δTR/δD k N=3 N=5
15% 0.884 0.084 1.657 0.157 15% 0.471 0.883
20% 1.179 0.112 2.210 0.210 20% 0.628 1.178
25% 1.474 0.140 2.762 0.262 25% 0.785 1.472
Buyout Buyout
N=3 N=5
k δTR/δIRR δTR/δD δTR/δIRR δTR/δD k N=3 N=5
15.75% 3.650 0.212 8.259 0.480 15.75% 1.098 2.486
17.72% 4.107 0.239 9.293 0.540 17.72% 1.236 2.796
19.60% 4.542 0.264 10.278 0.597 19.60% 1.367 3.093
Venture Venture
N=3 N=5
k δTR/δIRR δTR/δD δTR/δIRR δTR/δD k N=3 N=5
20.24% 0.337 0.070 0.478 0.099 20.24% 0.423 0.601
22.84% 0.380 0.078 0.539 0.111 22.84% 0.478 0.678
26.11% 0.434 0.090 0.616 0.127 26.11% 0.546 0.775
Real Estate Real Estate
N=3 N=5
k δTR/δIRR δTR/δD δTR/δIRR δTR/δD k N=3 N=5
15% 1.827 0.154 3.117 0.263 15% 0.798 1.361
20% 2.435 0.205 4.156 0.350 20% 1.064 1.815
25% 3.044 0.257 5.195 0.438 25% 1.329 2.269
Table 1-6 Sensitivity of GP Lifetime Revenue to Current Performance: Sequence Interactions
This table presents estimates of the sensitivity of GP lifetime revenue to current
performance, for different assumptions about the placement of the current fund in the
partnership's sequence of funds. Panel A presents estimates of the direct effect of a one
percentage point improvement in net return to LPs (IRR) in the current fund, relative to
the sample average return, on GP revenue from the current fund. Sample means are
taken from Table 1-2. We approximate the cash flow distribution that gives rise to the
IRR as a single cash in and a single cash out, spaced 3 years apart. The GP revenue
share of 25% is based on the standard carry of 20% (for each $1 returned to LPs, GPs
receive $0.25). At the baseline level of performance, the carry is in the money. We
discount the incremental GP revenue at 5% for 3 years because the cashflow out is 3
years in the future. The discounted direct effect per extra undiscounted dollar of return
to LPs is therefore $0.216.

61
Panel B presents estimates of the indirect effect of an improvement in net return to LPs
in the current fund on expected GP revenue from future funds. Estimates are computed
using the formulas provided in Section 4, using sample parameters from Table 1-2 and
regression coefficients and marginal effects from Table 1-4 which take sequence
interactions into account. N is the maximum number of future funds the GP could
potentially run. k is the expected fraction of future fund sizes that the GP receives as
compensation. δTR/δIRR and δTR/δD are the incremental indirect effect from an extra
percentage point and extra dollar of return, respectively.
Panel A: Direct effect of incremental performance on GP revenue from current fund
All funds Buyout Venture
Real
Estate
Current fund is first in sequence
Mean current fund size ($M) 262.3 417.5 124.0 286.4
Mean current fund IRR 15.75% 17.23% 14.04% 17.50%
Incremental GP revenue ($M) 2.636 4.303 1.209 2.965
Discounted 1.876 3.323 0.795 2.290
Current fund is second in sequence
Mean current fund size ($M) 362.9 587.8 169.9 438.0
Mean current fund IRR 13.45% 16.83% 10.56% 14.56%
Incremental GP revenue ($M) 3.503 6.018 1.558 4.311
Discounted 2.493 4.647 1.024 3.329
Current fund is third in sequence
Mean current fund size ($M) 488.2 812.5 216.3 530.0
Mean current fund IRR 12.41% 15.62% 10.14% 11.59%
Incremental GP revenue ($M) 4.627 8.145 1.967 4.950
Discounted 3.293 6.290 1.294 3.822
Panel B: Indirect effect of incremental performance on GP expected revenue from future
funds
Indirect effect ($M) Ratio of indirect to direct effect
All Funds All Funds
k=20% N=3 N=5
Current
fund
sequence
δTR/δIRR δTR/δD δTR/δIRR δTR/δD
Current fund
sequence N=3
N=5
1 1.034 0.098 1.331 0.126 1 0.551 0.709
2 1.164 0.083 1.330 0.095 2 0.467 0.533
3 1.063 0.057 0.927 0.050 3 0.323 0.282
Buyout Buyout
k=17.72% N=3 N=5
Current
fund δTR/δIRR δTR/δD δTR/δIRR δTR/δD
Current fund
sequence N=3 N=5

62
sequence
1 4.271 0.248 7.807 0.454 1 1.285 2.349
2 6.048 0.251 9.779 0.406 2 1.301 2.104
3 8.223 0.252 11.007 0.338 3 1.307 1.750
Venture Venture
k=22.84% N=3 N=5
Current
fund
sequence
δTR/δIRR δTR/δD δTR/δIRR δTR/δD
Current fund
sequence N=3 N=5
1 0.309 0.064 0.350 0.072 1 0.389 0.440
2 0.332 0.053 0.354 0.057 2 0.324 0.346
3 0.250 0.032 0.229 0.029 3 0.193 0.177
Real Estate Real Estate
k=20% N=3 N=5
Current
fund
sequence
δTR/δIRR δTR/δD δTR/δIRR δTR/δD
Current fund
sequence N=3 N=5
1 3.139 0.265 4.482 0.378 1 1.371 1.957
2 3.163 0.183 4.639 0.269 2 0.950 1.394
3 2.790 0.141 4.291 0.217 3 0.730 1.123

63
Chapter 2. D&O Insurance and IPO Performance: what can we learn from insurers?
This is a pre-copyedited, author-produced PDF of an article accepted for publication in the
Journal of Financial Intermediation following peer review. The version of record Boyer, M.M.
and L. H. Stern (2014), D&O Insurance and IPO Performance: What Can we Learn from
Insurers? Journal of Financial Intermediation 23: 504-540.is available online at:
http://doi.org/10.1016/j.jfi.2014.05.001
1. Introduction
When a firm goes public, investors typically know very little about the cash flow
prospects of a firm. A high level of information asymmetry prevails during the initial public
offering of a firm. Investors are cognizant of governance risk, yet as of today, there is no easy
and reliable way to assess this particular type of risk. As representatives of the corporation,
directors and officers are personally liable30 for damages caused by the corporation’s actions, or
absence thereof. Having their personal wealth exposed to such an important liability risk induces
managers to request protection in the event a lawsuit is brought against them as representatives
of the corporation. This insurance, known as directors' and officers' liability insurance (D&O
insurance hereinafter), is extremely common in public corporations.31
The goal of this paper is to assess whether the information that insurers acquire in their
underwriting process is valuable for capital markets. To achieve this goal we use a sample of
30 A corporate director’s duty goes beyond a simple firm value maximizing paradigm to include a
fiduciary duty, a duty of loyalty and a duty of care.
31 According to different Towers-Watson surveys (that were in the past published by Tillinghast Towers-
Perrin, and before that by Watson-Wyatt), approximately 95% of public corporations in the United States
and 75% of public corporations in Canada provide such insurance to their managers.

64
Canadian firms that have become public through an initial public offering and that had the
opportunity to purchase D&O insurance before the IPO to cover their directors and officers in
the event of a costly lawsuit. Our results show that the higher a firm’s D&O insurance premium
per dollar of coverage (which is known as the rate-on-line in the insurance industry), the higher
the firm’s stock market volatility and idiosyncratic risk in the first year after the IPO, and the
lower its return. In other words, firms that insurers deem riskier at the time of the IPO have a
lower (higher) stock market return (risk or volatility) in the first year post-IPO. Our results
suggest that D&O insurers possess information that could be valuable to stock market
participants. The results are robust to many econometric specifications (simultaneous equations,
treatment effects) and robustness checks. Although further research is needed to formally test it,
the results in this paper imply that the price of D&O liability insurance may be used as an
assessment of a firm’s governance risk; such information could prove to be valuable to market
participants.
Our results provide new insights into the insurers’ ability to price risk. Baker and Griffith
(2007a) find that corporate governance is key in the insurance underwriting process and the main
focus of insurers’ risk evaluation. Insurers are interested in a firm’s “deep governance” features,
i.e. the culture within the firm as well as its executives’ character. Provided that insurers use the
correct technology to transform a firm’s characteristics into a D&O liability insurance premium,
the insurance contract should provide information on the firm’s prospects, the quality of its
management team and its “deep governance” features. Furthermore, insurers have the
appropriate incentives to correctly measure the expected cost of litigation so that the structure of
a D&O insurance contract could prove to be an unbiased measure of a firm’s governance risk. As
suggested by Griffith (2006), disclosing D&O insurance information to capital markets could be

65
used as an antidote for the failure of boards to properly monitor managerial behavior. A
“managerial character score” such as this one would be similar to credit ratings that are default
probability indicators.
The results in this paper have several financial economics implications. First, the positive
correlation between insurance pricing and stock market volatility reconciles economic theory
with empirical evidence by providing literature’s missing link: insurers charge a higher price ex
ante to firms that are riskier ex post. Second, our findings are of interest for the asset pricing
literature inasmuch as one believes that D&O insurance providers have a technology that allows
them to assess one type of risk. This means that the rate-on-line should be priced in the cross-
section of returns in such a way that a factor constructed to capture the excess return of firms
with a low rate-on-line over firms with a high rate-on-line should have a significant coefficient.
Because of the low number of observations, we are currently unable to perform such an
empirical asset pricing test.
Third, our results provide a potential evaluation tool for investors in firms in which
information asymmetry is important. This tool should be especially valuable when investors are
looking for a way to assess the management quality and the risk associated with governance
issues. A growing body of research suggests that a one-size-fits-all governance structure is
ineffective in improving firm performance (see Larcker and Tayan, 2013). It seems instead that
what matters are individual managerial characteristics and qualities. And as D&O insurance
prices reflect an insurer’s assessment of a firm’s “deep governance”, a firm’s rate-on-line should
therefore be related to its personal and personnel characteristics. Although our results point in
this direction, further research is needed to formally evaluate the extent to which D&O insurance
information may substitute commercial governance indices.
66
The volatility and return results complement each other and are two sides of the same coin.
If one was to interpret post-IPO volatility as a proxy for information asymmetry (or risk
unknown to the market at the time of the IPO), then it would follow that, as investors become
aware of additional risks after the IPO, realized returns drop. Both results suggest that insurers
have information that investors don't have and that they value. Our results speak to the risk
perceived by the insurance companies, provide a missing link in the literature, and complement
the results stemming from the managerial incentives in Chalmers et al. (2002), the study closest
to ours. Indeed, whereas Chalmers et al. (2002) find that insurers penalize abnormal insurance
coverage purchased at the time of the IPO, they cannot find a significant relationship between
post-IPO returns and the premium paid by firms. Moreover, they find a negative relationship
between post-IPO volatility and the price of coverage, which they find puzzling.
The remainder of the paper is organized as follows. Section 2 presents a short primer on
directors’ and officers’ insurance contracts. We develop the hypotheses and describe the data in
Section 3, and present the main results of the paper in Section 4. Section 5 is devoted to
robustness checks. Section 6 concludes with a discussion.
2. Directors’ and officers’ insurance: a primer
Directors’ and officers’ liability insurance contracts cover corporate directors and officers
against lawsuits brought against them as representatives of the corporation. Diverging interests
mixed with asymmetric information between managers (including both directors and officers)
and shareholders is the main source of conflict, and potentially the costliest. The insurance
company will reimburse the corporation and/or its managers for the costs of settling and
defending the lawsuit up to the policy limit, provided the firm’s directors and officers have acted

67
honestly and in good faith. In theory, should managers and their company have acted in a
fraudulent manner, the insurance company could decide not to honor the policy (see Weisdom et
al., 2006, for more details on the three distinct types of coverage that are included in D&O
insurance policies). Baker and Griffith (2008) argue that shareholders are the most likely firm
stakeholders to sue directors and officers, and that security class actions on the basis of
misrepresentation are the most costly type of lawsuits (also see the different Towers-Watson32
surveys). The threat of a class action lawsuit is so important that it prompts firms to significantly
invest in decreasing the potential cost of agency problems (see McTier and Wald, 2011).
2.1 Timing of D&O insurance information release
An important feature is the timing of information release in the Canadian investment
context since the release of D&O insurance information generally occurs much later after its
purchase. The figure in Appendix 2-A provides a typical timeline of the purchase and release of
D&O insurance information for the firms that are becoming public through an IPO. See
Appendix 2-B for examples of information that can be found in management proxies related to
the D&O insurance contract and that illustrate the timing of the purchase of D&O insurance and
information release.
2.2 The pricing of D&O insurance coverage
Insurance companies must accurately assess the potential cost of each policyholder since
they ultimately bear the full cost of any mistake. As a result, D&O insurance underwriters have
developed specific risk assessment tools that allow them to properly select clients and their
litigation risk. Underwriters use three sources of information: The written application that
contains a full array of documentation, the public financial and accounting data analysis, and
32 According to many of these surveys, 20% of U.S. firms had at least one lawsuit brought against their
directors in the previous ten years, of which half, and the most costly, came from shareholders.

68
interviews with the prospective insured’s senior management team.33 The information gathered
by the insurer about a potentially insured firm’s internal processes and structure is not divulged
to other market participants.34
As in the pricing of any insurance contract, insurers must assess the probability that a claim
will be paid as well as the severity of such a claim. Since the most costly D&O lawsuits originate
from the firms’ shareholders, they are then likely linked to stock market performance. Using the
Culture & Character approach of Baker and Griffith (2007a), we measure a firm’s potential cost
of litigation based on its financial information, the industry’s perspective and its governance risk
factors. Of particular interest is the fact that insurers appear to place the analysis of governance
characteristics into two categories: Culture, which refers to the stringency of the firm’s formal
and informal internal controls (how the information is disseminated in the firm), and Character,
which refers to the directors’ and officers’ attitude toward risk. In essence, Culture seeks to
identify the source of potential D&O litigation whereas Character aims at uncovering the
managers’ sense of ethics.
33 Baker and Griffith (2007a) provide a valuable in-depth account of the pricing approach used by D&O
underwriters using detailed interviews of 41 D&O insurance professionals (underwriters, actuaries,
brokers, risk managers, lawyers and claim process specialists). They also report that, in the United States,
the average settlement was $13.3 million for the period 1996-2001, $22.3 million for the period 2002-
2005 and $33 million in 2006-2007.
34 See Knepper and Bailey (1998) and Baker and Griffith (2007a) for more details on the underwriting
and auditing process of insurers. In the case of D&O insurance, the moral hazard hypothesis that is often
linked to having insurance was shown to be inconsequential by Bhagat et al. (1987) who find that the
decision to purchase D&O insurance does not decrease shareholder wealth.

69
3. Hypotheses development, data and variables description
3.1 Hypotheses and data
The main hypothesis we develop in this paper is that firms that are riskier in the eyes of
D&O insurance providers have a post-IPO stock return that is lower and more volatile.
Underpinning this question is the assertion that providers of D&O insurance use a plethora of
publicly unavailable information from which a premium emerges, much like a credit score. The
question we seek to answer is whether such information is valuable to investors.
As highlighted in Baker and Griffith (2007a), the risk assessment conducted by D&O
insurers is partly based on private information regarding the inner working and the governance
quality of the firms as well as on the D&O insurers’ risk underwriting technology that is insurer-
specific and not publicly known. Because they are usually absent from the offering prospectus,
information about D&O insurance coverage and premiums is not publicly known at the time of
the IPO, even though such information is revealed later in the life of the firm (see Appendix 2-A).
When such information reaches the market, it should be embedded immediately in the prices.
The null hypothesis is therefore that D&O insurance contract parameters have no power in
explaining future risk and returns. The alternative hypothesis is that D&O insurance contract
parameters have some ability to forecast a firm’s stock market risk and returns in the first year of
public life post-IPO.
H10: A firm’s D&O insurance rate-on-line at the time of the IPO has no power
in explaining the firm’s first year stock market risk and return.
H1A: A firm’s D&O insurance rate-on-line at the time of the IPO is linked to
higher stock market volatility and lower return in the first year of trading.

70
The measure we use to assess an insurer’s perception of a firm’s D&O liability risk is the
“rate-on-line”. The rate-on-line is calculated as the ratio of the total premium paid to the
maximum possible coverage (or the policy limit); it is essentially the price per unit of coverage.
Since firms that pay a higher rate-on-line are more susceptible to file a claim, their stock market
return in the first year post-IPO should be lower and more volatile. 35 If a D&O insurance
contract’s rate-on-line conveys information, then a corollary to hypothesis H1A should be that
the firm’s stock market performance after the information is revealed should be uncorrelated to
such information. The information gathered by insurers to form an opinion regarding the IPO
firm’s liability risk before the IPO date becomes known to market participants after the first year
post-IPO. This information should then be incorporated in the stock prices so that D&O
insurance information should not have any long-term predictive power.36
Our results show strong support for rejecting hypothesis H10 in favor of hypothesis H1A,
Consequently, we conclude that basic D&O insurance contract parameters have some power to
predict stock market returns and risk in the first year post-IPO.
35 Boyer and Tennyson (2008) and Boyer (2003, 2013) argue that similar to any insurance contract, D&O
insurance premiums depend on the frequency as well as on the severity of claims, as well as the cost of
risk and other expenses. Assuming that premiums are the product of frequency (f), severity (s) and a
proportional loading factor (m), and that severity can be measured by the policy limit, we believe that the
rate-on-line (the ratio of premium to policy limit) is a good proxy for the frequency of lawsuits. To see
why, let P=f*s*m so that P/S=f*m. If the loading factor is the same for all firms, then it will be picked-up
in the regression constant when we use the log of the rate-on-line as an independent variable. Given that
the different Towers-Watson surveys report that lawsuits are more likely to occur (and with more
severity) following a decrease in the stock price, the result is that the D&O insurance market is efficient if
the premium-to-coverage ratio is a function of the likelihood that the stock price will decline.
36 In a previous iteration of the paper, we tested whether the first year’s D&O insurance information had
any impact in explaining the second year’s return. In line with the efficient market hypothesis, we found
that it had no impact. These results are available from the authors upon request.

71
The use of Canadian data is dictated by data availability challenges. For instance, basic
D&O insurance contract characteristics are not publicly available for most U.S. firms (see
Griffith, 2006). That is why Chalmers et al. (2002) and Kalchev (2004) have relied on a broker’s
private book of business. A second strategy (see Linck et al., 2009) is to use the 27 firms
incorporated in the state of New York and the 12 S&P firms that voluntarily disclose enough
information to examine the determinants of D&O premiums paid by each company.
Unfortunately, these companies do not reveal how much coverage they purchased, thus limiting
the quality of the signal associated with the premium paid. A third alternative is to use excerpts
from the Towers-Watson surveys, as in Cao and Narayanamoothy (2011) and Fier et al. (2010)
who use only two survey years (2001 and 2002). A fourth approach is to use Canadian data as in
Core (1997, 2000), Boyer (2003), Park Wynn (2008), Gillan and Panasian (2009), Li et al.
(2011), Rees et al. (2011) and Boyer and Stern (2012) since Canadian firms typically disclose
their D&O insurance coverage and premium. Unlike most studies on D&O insurance that
examine large and well established firms (the notable exceptions being Chalmers et al., 2002,
and Boyer and Stern, 2012), we focus on firms that just went public through an initial public
offering (IPO).
Chalmers et al. (2002) find that firms with more coverage at the time of the IPO are more
likely to be sued for mispricing. However, the dataset used in Chalmers et al. (2002) does not
include only D&O liability insurance protection contracts. Their dataset includes IPO liability
insurance contracts (known also as Public Offering of Securities Insurance or POSI) that cover
the firm's managers as well as the investment bankers, the venture capitalists and the angel
investors who are seeking an exit. IPO liability insurance contracts are accordingly more

72
expensive.37 Also, in contrast to Chalmers et al. (2002) and Kaltchev (2006), our sample includes
firms that opted for no insurance, thus reducing the potential bias involved in using only firms
that purchased insurance from one particular insurance broker.
To gather data to test our hypothesis, we used the same approach as in Huson and
Pazzaglia (2007). Starting with the 2000-odd new securities issued in Canada over the period
1995-2010, we are left with 340 firms that correspond to the classic definition of an IPO (see
Huson and Pazzaglia, 2007, for more details). Financial data is collected from Compustat and
from SEDAR, the Canadian equivalent of EDGAR. As many firms’ first proxy circular or annual
reports are not available on SEDAR, and because there is much missing information in annual
reports and management proxies, the number of usable observations drops to 241. We then
removed the firms for which the first day of the D&O insurance contract is after the IPO
completion date (11 observations), and the firms that report the D&O insurance premium and
policy limit in the IPO prospectus (21 observations). The final dataset contains 209 observations.
The first column of Table 2-1 displays the number of initiated IPOs per year, whereas the second
column displays the number of completed IPOs per year.
[INSERT TABLE 1 ABOUT HERE]
Financial variables are collected as of the end of the first fiscal year post-IPO. The
governance and insurance information is collected in the first available management proxy. All
numbers are in Canadian dollars and a conversion to Canadian dollars as of the end of the firm’s
fiscal year was applied when needed.
37 For instance in the case of the Addax corporation (IPO completed on February 16th 2006), the
management proxy states that “The total 2006 premium payable is $374,500 for the D&O twelve month
cover and $505,000 for the POSI 72 month cover”.

73
3.2 Description of variables
3.2.1 Dependent variables
The dependent variables we use reflect the firm’s observed stock market risk and return
following the date of the IPO. Starting with our risk measurements, the Volatility variable is
calculated as the standard deviation of annualized daily returns. We expect firms that are deemed
riskier by insurers, as reflected by a higher rate-on-line, to have higher stock market volatility.
We also calculated the firm’s idiosyncratic risk of returns (Idiosyncratic) as in Ang et al. (2006)
and used the standard deviation of the residual of a daily three-factor Canadian Fama-French
model (see Francoeur et al., 2008, for the source of these factors).38
To evaluate the stock performance of firms we use the First year excess return as well as
the firm’s First year total return. If D&O insurance providers have private information regarding
the operations and governance of insured firms, firms that have a higher risk assessment measure
should have a lower return. First year excess return is equal to the First year total return of the
firm post-IPO minus the return on the S&P/TSX, Canada’s main stock market index, over the
same period. If D&O insurers are able to charge a higher premium to firms that will perform
poorly because of their revealed poor governance and opaque operations, then the relationship
between the first year excess return and our measure of D&O insurance risk will be negative.
We also combine the risk and return variables by calculating three quasi-Sharpe ratios:
Total Sharpe ratio, Excess Sharpe ratio, and Idiosyncratic Sharpe ratio. The first measure is
computed by dividing First year total return by Volatility; the second, by dividing First year
excess return by Volatility; and the third, by dividing First year total return by Idiosyncratic. If
38 Canadian factors are only available until 2009.

74
the rate-on-line is associated with higher volatility and lower returns, it should also be associated
with lower quasi-Sharpe ratios.
IPO issue prices were collected using the firms’ prospectus available on SEDAR. Values
were verified using the FPInfomart database. Subsequent stock market price information comes
from Bloomberg.
3.2.2 Main independent variables
The main variable of interest in this paper is the ratio of the total premium paid to the
maximum possible coverage (or the policy limit). This information is released in the first
management proxy after the firm becomes public39. As D&O insurance is considered by the
board of directors to be a part of the managerial compensation package, the information that is
released indicates the previous year’s protection (just as salary information relates to the
previous year’s compensation). In the paper, this rate-on-line measure is modified in two ways,
to make it more tractable. First, we use the natural logarithm of the ratio of the D&O premium to
$1,000 dollars of coverage (Ln_ROL) to reduce the impact of very large rate-on-lines on the
results. Second, we use the D&O premium divided by $1,000 dollars of coverage (Rate-on-line).
In both cases, a firm that pays a higher rate-on-line is hypothesized to be perceived by the insurer
as riskier since it is paying more per unit of coverage. We therefore test whether the rate-on-line
is related to stock market volatility and returns (as well as the quasi-Sharpe ratios) in the first
year of operations post-IPO.
The decision to purchase or not to purchase insurance is used in the first step regression
equation of the Heckman two-step procedure (see the Robustness section), to account for the
39 In some rare instances, the D&O insurance information is released in the prospectus. We thank a
referee for pointing out this issue; we therefore deleted from our final sample all firms that divulged their
D&O insurance information in their prospectus.
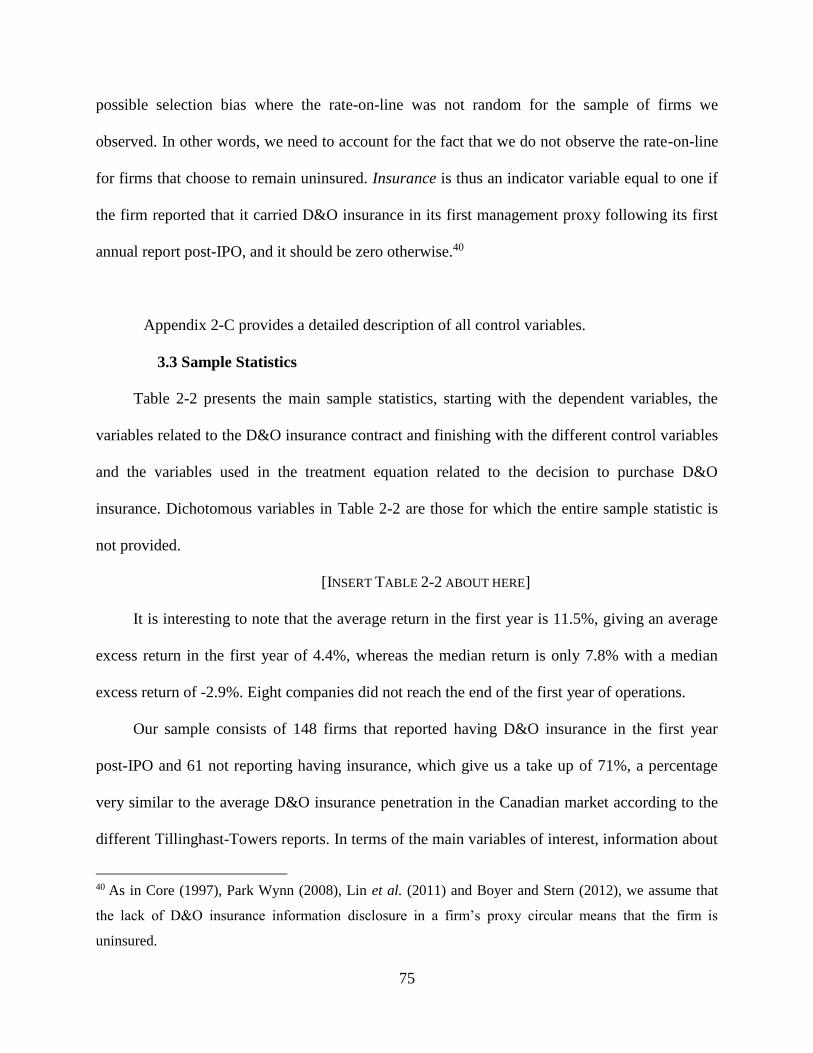
75
possible selection bias where the rate-on-line was not random for the sample of firms we
observed. In other words, we need to account for the fact that we do not observe the rate-on-line
for firms that choose to remain uninsured. Insurance is thus an indicator variable equal to one if
the firm reported that it carried D&O insurance in its first management proxy following its first
annual report post-IPO, and it should be zero otherwise.40
Appendix 2-C provides a detailed description of all control variables.
3.3 Sample Statistics
Table 2-2 presents the main sample statistics, starting with the dependent variables, the
variables related to the D&O insurance contract and finishing with the different control variables
and the variables used in the treatment equation related to the decision to purchase D&O
insurance. Dichotomous variables in Table 2-2 are those for which the entire sample statistic is
not provided.
[INSERT TABLE 2-2 ABOUT HERE]
It is interesting to note that the average return in the first year is 11.5%, giving an average
excess return in the first year of 4.4%, whereas the median return is only 7.8% with a median
excess return of -2.9%. Eight companies did not reach the end of the first year of operations.
Our sample consists of 148 firms that reported having D&O insurance in the first year
post-IPO and 61 not reporting having insurance, which give us a take up of 71%, a percentage
very similar to the average D&O insurance penetration in the Canadian market according to the
different Tillinghast-Towers reports. In terms of the main variables of interest, information about
40 As in Core (1997), Park Wynn (2008), Lin et al. (2011) and Boyer and Stern (2012), we assume that
the lack of D&O insurance information disclosure in a firm’s proxy circular means that the firm is
uninsured.

76
the Rate-on-line is available for 96 firms out of the original 209. Of the 113 firms for which no
rate-on-line is available, 61 did not purchase D&O insurance whereas the other 52 purchased
D&O insurance but did not give enough details to calculate the rate-on-line. These 52 firms must
be kept in the dataset regressions because the mere fact that they purchased insurance tells us
something about their behavior toward insurance.
4. Analysis of results
The theoretical econometric model has the following structure.
1- Firms decide to go public through an initial public offering;
2- Firms decide to purchase D&O insurance or not;
3- Insurers give firms that purchase D&O insurance a price per unit of coverage (rate-
on-line);
4- The stock market reacts to the flow of information during the year.
The variables that determine whether a firm goes public (step 1) are not measurable since
we do not have access to information for non-public firms. After deciding to go public, a firm
purchases a D&O insurance contract (or not) in step 2, an information that is available.
Regarding step 3, we observe a firm’s rate-on-line only if it purchased insurance. To control for
the potential selection bias in steps 2 and 3, we will conduct a classic Heckman two-step
procedure as a robustness check.
4.1 Preliminary results
Table 2-3 separates the observations presented in Table 2-2 between firms that have D&O
insurance and firms that do not, and offers some descriptive statistics. Of the 71% of IPO firms
that reveal they purchased D&O insurance before their IPO date, the average premium is
approximately $145,658 for an average coverage of $22 million. There is a very wide
77
distribution for the rate-on-line variable, which is reported as the premium paid per $1,000 of
coverage. The 95th percentile rate-on-line is more than 7 times larger than the 5th percentile rate-
on-line, with an average of $7.19 per $1,000 of coverage and a median of $5.27 per $1,000 of
coverage. This provides some justification for using a log-transformation of the rate-on-line.
[INSERT TABLE 2-3 ABOUT HERE]
When examining the decision to purchase insurance (the Insurance variable is equal to one
if the firm revealed carrying D&O insurance, and zero otherwise), the hypothesis is that this
decision should be influenced by financial and governance measures as well as other control
variables. It is interesting to see that none of the return variables differ in distribution as a
function of whether insurance is purchased or not. This provides a possible indication that the
mere fact of purchasing insurance or not conveys no information to the market.
In the second part of Table 2-3, we see that firms that take up insurance are in some respect
significantly different from firms that do not. For instance, firms that are larger (in terms of
market capitalization at the time of their IPO) are more likely to have D&O insurance. Firms that
have operations in the U.S. are also more likely to carry D&O insurance. As the U.S. relies more
on litigation to keep firms in line, it seems logical that the more important the presence in the
U.S., the more likely a lawsuit could occur so that carrying insurance becomes more likely. The
only other dimension over which insured and non-insured firms differ in means and median is in
terms of their corporate structure. It seems that income trusts are more likely to have no
insurance than common equity firms. Table 2-4 shows the results of a simple probit model
regarding the decision to purchase D&O insurance for different model specifications.
[INSERT TABLE 2-4 ABOUT HERE]

78
The results are consistent across model specifications, with four variables remaining
generally significant throughout: Duality, US_Presence, ITCE and Hard. It therefore seems that
firms that are more likely to purchase D&O insurance are those that have a chairman of the
board who is not the CEO, that have activities in the U.S. and that are incorporated as common
equity firms. Firm size, as measured by the natural logarithm of the firm’s market value of equity
(lnMVE_IPO), seems to have only a marginal impact on the decision to purchase D&O insurance
when controlling for other factors. These results are in line with most studies that examine the
demand for D&O insurance (see Rees et al., 2011, Core, 1997 and Boyer, 2003). Specification 2
will be the model used later as the Heckman’s selection regression (first stage) model since it is
the one that has the best goodness of fit.
4.2 The Predictive Power of D&O Insurance Rate-on-Line
Table 2-5 reports the results from OLS regressions where we examine the relationship
between the main independent variables (the log of the rate-on-line or the premium per $1,000 of
coverage) and the first year excess return (Panel A) and the total return (Panel B) post IPO. In
Panel A, the first regression model presents the results when we do not include the rate-on-line
variables in the regression. We see that only two variables have the power to explain the returns
in the first year post-IPO: return on assets and the type of incorporation. No other variable has
any explanatory power at the 5% level or better.
Model specifications 2 and 3 are very parsimonious and control only for basic financial and
governance variables in addition to either rate-on-line measures: Specification 2 uses the natural
log of the rate-on-line whereas Specification 3 uses the rate-on-line as the main independent
variable of interest. In the next set of two regressions, we add more financial and governance
control variables as well as variables related to the IPO (the fee ratio and the float).

79
Specifications 6 and 7 are similar to Specifications 4 and 5 with the difference that they control
whether the firm went public during a “hard market year” in the D&O insurance industry (i.e.,
when premium levels were high). Across all model specifications, the price per unit of D&O
insurance coverage (whether it is the log of the rate-on-line or simply the premium-to-coverage
ratio) is negatively and significantly related to the firm’s excess stock market return in the first
year after the IPO. Panel B shows regressions that predict first year total returns while
controlling for systematic risks using three Canadian Fama-French measures. Results are the
same in Panel B and in Panel A: the rate-on-line is negatively and significantly related to the
firm’s stock market return in the first year post IPO.
All results in both panels of Table 2-5 are consistent with the hypothesis that D&O liability
insurers have information at the time of the IPO that should be valuable to stock market
participants. Our results are economically significant. Using any model specification that uses
the natural logarithm of the rate-on-line in Panel B of Table 2-5, we can conclude that a 50%
increase in the rate-online (resp. a 10% increase) leads to an approximate 7.3% to 9.4% (resp.
1.7% to 2.2%) decrease in the one-year excess return post IPO.
[INSERT TABLE 2-5 ABOUT HERE]
We then turn to examine whether the rate-on-line is related to other stock performance
measures in the first year post-IPO: risk, and return per unit of risk. We use two measures of risk
in our OLS regressions. Volatility is the standard deviation of annualized daily returns, whereas
Idiosyncratic is the standard deviation of the residual of a daily three-factor Canadian Fama-
French model. We use the idiosyncratic risk to verify that our results on volatility are not
contaminated by market volatility. With respect to the return per unit of risk, we shall use
different quasi-Sharpe ratio measures by dividing a return measure by a risk measure.

80
Table 2-6 and Table 2-7 present the regression results for the two risk measurements. In
both tables, the first specification presents the regression results when no rate-on-line variable is
included. Specifications 2 & 3 control for financial variables and variables related to the firm’s
governance. The second set of two regressions controls for the same variables, but a dummy
variable to control for a hard insurance market is added. Finally, model specifications 6 & 7
show how our results hold with a more parsimonious model specification.
[INSERT TABLE 2-6 ABOUT HERE]
[INSERT TABLE 2-7 ABOUT HERE]
In all specifications, results show that the price of coverage is statistically and positively
related to the one-year ahead total return volatility and idiosyncratic risk. In addition, the results
are economically significant. Using Specification 4 in Table 2-7, the estimated coefficient for the
natural logarithm of the rate-on-line shows that if the rate-on-line of the average firm in our
sample was to increase by 50% (resp. 10%), the one-year post IPO volatility would increase by
2.8% (resp. 0.7%). Apart from the rate-on-line variables, only firm size (as measured by
lnMVE_IPO) and Float are significant at the 5% level or better in all model specifications in
both tables.
Results in Tables 2-6 and 2-7 are remarkably similar. Insurers appear to be able to charge a
higher price to IPO firms that will have more volatile stock returns in the first year following
their IPO. These results are in line with economic theory, in contrast with the results in Chalmers
et al. (2002). Although we cannot assert that insurers are better at anticipating volatility than
investors, we nevertheless believe that the metric provided by the rate-on-line could be very
useful to market participants.

81
Our final set of results combines the first year excess return and volatility to analyze
whether the excess Sharpe ratio (i.e. the ratio of the one-year excess return to volatility), the total
Sharpe ratio (i.e. the ratio of the one-year total return to volatility), or the idiosyncratic Sharpe
ratio (i.e. the ratio of the one-year total return to idiosyncratic risk) of our sample firms is
negatively related to the D&O insurance rate-on-line. Results are presented in Table 2-8. No
control variable seems to be consistently and significantly related to the excess Sharpe ratio of
our sample firms. The only variable that is significant in explaining the return per unit of risk is
the rate-on-line.
[INSERT TABLE 2-8 ABOUT HERE]
Again, our results strongly support the idea that the technology used by D&O insurers to
transform the firms’ liability risk characteristics into an insurance premium has some power in
explaining the firms’ first year basic stock market return characteristics. The data therefore
supports the hypothesis that insurers are able to anticipate the performance of firms in their first
year as a public company, even in a context where high information asymmetry prevails.
The results presented in Table 2-5 through Table 2-8 use information that one could argue
has already been incorporated by the investment banker in the offer price at the time of the IPO,
or that it has been quickly and immediately incorporated in the stock price at the end of the first
day. As a consequence, we could expect not to observe any link between known firm specific
characteristics and the stock return in the first year. This offers an explanation for the low level
of significance of most control variables in the regressions of Table 2-5 through 2-8.
In Table 2-9, we therefore present regression results that only use the information that is
unknown to investors at the time of the IPO: the rate-on-line, the return of market portfolio and
the first day return. We also include a dummy variable to control for a hard insurance market,

82
meaning that insurance policies are less affordable and that they come with more stringent
constraints. Panel A uses the first day return as an explanatory variable. In Panel B, the first day
return is included in the dependent variable. In Specifications 1 through 6, we use as our
dependent variable the first year total return net of the first day, while controlling for market
return. In Specifications 7 and 8, we use the excess return in the first year net of the first day as
our dependent variable.
[INSERT TABLE 2-9 ABOUT HERE]
In Panel A of Table 2-9, we see that the paper’s main hypothesis, that the rate-on-line
conveys valuable information, is supported since returns and returns per unit of risk are
negatively affected by both measures of the rate-on-line. The positive relationship between the
rate-on-line and risk is not as significant though.41 When we focus solely on the first year return
after the first day, as in Panel B of Table 2-9, then both measures of the rate-on-line remain
negatively and significantly related to the total return and to the excess return. The magnitude of
the coefficients of Ln_ROL and Rate-on-line in Panel B are similar to what we had in the
previous tables.
5. Robustness checks
This section reports the results of a series of robustness tests to see how sensitive our
empirical results are to various econometric specifications.42 First, we examine the possibility
that the decision to purchase D&O insurance conveys information to the market that is not
41 If we concentrate only on the firms that have a high enough idiosyncratic risk (for instance more than
2%), then the main results of the paper hold with a significance of better than 1% on our variables of
interest.
42 For brevity purposes, we mainly focus from this point forward on results related to return and to return
per unit of risk.
83
captured when we use an OLS regression. Indeed, given that we do not observe the rate-on-line
of firms which do not purchase insurance, the distribution of insured and non-insured firms is not
random and could therefore bias the results. We use a Heckman (1979) two step approach to
reduce the potential bias. The first step consists in a probit regression that measures a firm’s
propensity to purchase D&O insurance before its IPO. Similar to the regression results in Table
2-4, the dependent variable in this regression is Insurance. We model the firms’ decision to
purchase insurance using Specification 2 in Table 2-4. The second step in the Heckman two-step
procedure involves an OLS regression to determine the impact of the rate-on-line on the different
post-IPO dependent variables.
The second robustness analysis we conduct examines the consequences of a situation
where the stock market risk and return are jointly determined and where each feedbacks into the
other. We therefore modify the econometric models to simultaneously estimate the stock market
returns and risk in the first year post-IPO. The econometric technique used is either a two-stage
least square or three-stage least square regression to make sure that the results are not due to a
misspecification of the econometric model.
5.1 Likelihood of carrying D&O insurance and two-step regression
The first robustness check is to verify whether the choice of being insured or not creates a
significant selection bias in the sense that firms who choose to purchase insurance are
fundamentally different from those that do not. We control for the potential selection bias by
using a classic Heckman two-step approach in Table 2-10 (we only report the results from the
second stage regressions), in order to explain the first year excess return, the first year total
return, as well as the market excess quasi-Sharpe ratio (the selection regression model is omitted,
but available from the authors). The basic results of the paper hold: there is a negative and
84
significant relationship between the two measures of the rate-on-line and the firms’ total return,
excess return, and excess return per unit of risk in the first year post IPO.
[INSERT TABLE 2-10 ABOUT HERE]
As we see in Table 2-10, the two main variables of interest are significantly negatively
associated with the return of firms that went public through an initial public offering. Not only
do the selection bias regression results confirm the results presented in Table 2-5, the
coefficients’ value are extremely similar. This should tell us that the impact of the selection bias
is small. Even when we use market-adjusted quasi-Sharpe ratios as our dependent variable, the
results are similar to the results presented in Table 2-8. This again suggests that the selection bias,
if it exists, is relatively small and economically inconsequential (which is confirmed by the Wald
test). In unreported results, we find that the volatility results are also unchanged when
controlling for the selection bias, and the inclusion of the full set of control variables.
In Panel B of Table 2-10, we also report regression results where we explicitly control for
systematic differences which may exist between firms that purchase insurance and disclose the
policy limit and premium and those that purchase insurance but do not provide this information.
The econometric model therefore has three steps: the decision to purchase, the decision to reveal
all information, and the return in the first year. Using the inverse Mills ratio from probit model 2
from Table 2-4, we run a Heckman selection model where the first dependent variable takes the
value one for firms that disclose their policy limit and premium, and zero otherwise. The second
stage is an OLS regression with our return and risk measures as dependent variables, and where
the computed inverse Mills ratio variable is included as a control. Our results remain unchanged,
which suggests that the impact of the disclosure selection bias is small or even inexistent.

85
5.2 Simultaneous (feedback) effects of risk and return
The results of Table 2-11 take into account the potential simultaneous determination of risk
and return in the model since feedback effects could exist between risk (however measured) and
return. We test our main hypothesis using a two-stage least square (Panel A) as well as a three-
stage least square (Panel B) approach.
[INSERT TABLE 2-11 ABOUT HERE]
Correcting for the simultaneity of risk and return measures reduces the significance of the
coefficients of interest but does not alter the overall results. In both panels we corrected for the
selection bias and the feedback effect by including the inverse-Mills ratio in all of the regressions.
Overall results show that the price-to-coverage ratio is positively associated with risk and
negatively associated with returns. The main message of the paper is therefore supported using
many different econometric models.
We can therefore be confident that the paper’s main results presented in Tables 2-5 through
2-8 are robust, which means that the firms’ first year returns are significantly related to their
D&O insurance contracts’ rate-on-line. This suggests that insurers who offer D&O insurance
protection are able to process information at the time of the IPO that investors should find
valuable.
6. Discussion and conclusion
The primary objective of this paper is to examine whether insurers that provide firms and
their managers with protection against the event of costly litigation are able to effectively process
information that could be valuable to investors at the time of the firms’ initial public offering.
More precisely, firms that seek to protect their managers against costly liability lawsuits may

86
purchase protection from insurers that examine each firm’s governance structure, organizational
processes and its “character and culture” to arrive at a premium that reflects the firm’s risk of
lawsuits. Even though this audit is performed prior to the IPO date, investors only learn this
information much later, in the proxy statement, which is typically released a few months after the
end of the first fiscal year.
Whenever insurers decide to provide coverage to any policyholder, they assess the
probability and severity of claims they could potentially be asked to cover. D&O insurance
claims are generally related to lawsuits brought against the firm’s managers by shareholders or
other stakeholders. Lawsuits are more frequent when the stock has performed poorly, and a
lawsuit’s severity is greater when volatility is higher. Consequently, insurers that sell D&O
insurance must use an audit technology (known as risk underwriting in the insurance industry)
that yields a higher price of insurance when the expected loss is greater, whether this is due to a
higher frequency of losses (i.e. lower stock returns) or a higher severity of lawsuits (higher stock
volatility). The main results of this paper confirm this view of the D&O insurance world. We
find that firms that pay a high price for their directors’ and officers’ liability insurance coverage
tend to underperform in their first year since they are more likely to have a lower stock return
and a higher volatility. Our results connect the premium paid before the IPO with the volatility
post IPO, and thus provide a missing link in the literature. Our findings reconcile economic
theory with empirical evidence as insurers charge more ex ante to firms that are risker ex post.
Chalmers et al. (2002) found the opposite result, which was surprising.
Our results lend support to the hypothesis that D&O liability insurers have material
information about the internal structure of soon-to-be public firms that other investors do not

87
have.43 Given that the main determinant of the premium is the assessment of deep corporate
governance (Baker and Griffith, 2007a), our study provides support for the idea that D&O
insurance information could be a potential substitute to commercial governance indices. Further
research to formally test this hypothesis is on our research agenda. For American investors, the
information related to the purchase of D&O insurance is usually not available in the United
States (see Griffith, 2006). Even in cases where some information is available, as in the state of
New York (see Linck et al., 2009), only the premium information is provided, which is
insufficient to draw any reasonable conclusion on the firm’s risk.
The use of D&O insurance information as a tool to assess stock return and volatility falls
within the recent push to find a way to properly account for a firm’s governance structure (see
Rose, 2007, Bebchuk and Hamdani, 2009, Bebchuk and Weisbach, 2010, Adams et al., 2010,
and Larcker and Tayan, 2013, inter alia). As many governance factors are not properly specified
or are completely unavailable to the general investor (see Baker and Griffith, 2007a), one has to
wonder how much of the internal structure of the firm remains unknown to market participants.
That is why Holderness (1990), O’Sullivan (1997), Core (2000) and Boyer and Stern (2012)
argue that D&O insurance providers are more likely to be good firm monitors since they have a
monetary incentive to price the contract properly.
The results herein can be seen as a laboratory test that adds weight to calls for disclosure of
D&O insurance information (see Griffith, 2006). Mandating the revelation of basic D&O
insurance information (premium and coverage) could potentially be valuable to investors since it
43 In unreported results, we find that the predictive power of D&O insurance disappears after the first
year. The likely reason is that market participants slowly incorporate in stock prices the information that
was only available to insurers at the time of the IPO so that the information advantage of D&O insurers is
dissipated.

88
would provide them with an unbiased signal about a firm’s risk of litigation against its directors
and officers, perhaps because of some managerial mishaps or accidental incompetence. Since the
vast majority of Canadian and American corporations purchase liability insurance on behalf of
their directors and officers, it would seem efficient to have access to this risk measure.
Further research is necessary in order to specifically assess the welfare implications of
mandating such disclosure. Particular attention should be paid to the fact that the interests of
existing and new shareholders do not necessarily converge with respect to the disclosure of D&O
insurance information. Furthermore, the generalization to large U.S. listed firms is uncertain
since our results relate to the case of new Canadian firms that became public through an IPO.
These caveats notwithstanding, the questions we raise in this paper are relevant and timely given
the time and energy that investors and regulators devote to governance issues.

89
Table 2-1 Number of Canadian IPOs per year in sample: Year of IPO initiation and year of IPO
completion
For the firms in our sample, we present the number of IPOs initiated between 1995 and 2010,
and completed between 1995 and 2011.
Year IPO initiated IPO completed
1995 4 2
1996 11 12
1997 16 15
1998 5 6
1999 9 8
2000 10 12
2001 9 7
2002 25 27
2003 14 13
2004 26 26
2005 26 22
2006 20 23
2007 12 8
2008 2 8
2009 3 2
2010 15 10
2011 - 6
missing 2 2
Total 209 209
Table 2-2 Summary statistics of the sample data set
We present for each variable mentioned in the paper the number of available data points, the
mean, standard deviation and the value of the non-dummy variables for different distribution
points. The table separates the different variables with respect to the categories in which they
were presented in the paper.
Variable Obs Mean
Std.
Dev. Min 5% 25% Median 75% 95% Max
Dependent variables
First year total
return 199 0.115 0.562 -0.939 -0.673 -0.180 0.078 0.306 1.200 2.928
First year
excess return 199 0.044 0.544 -1.027 -0.762 -0.262 -0.029 0.246 1.032 2.830
Volatility 202 0.436 0.352 0.128 0.148 0.226 0.315 0.511 1.100 2.600

90
Idiosyncratic 186 0.0276 0.0224 0.0080 0.0092 0.0141 0.0198 0.0319 0.0685 0.1645
SharpeExcess 197 0.265 1.331 -2.265 -1.352 -0.652 -0.050 0.978 2.631 5.085
Main
independent
variables
Rate-on-line
(per $1000) 96 7.191 5.273 1.000 2.088 3.775 5.675 9.354 15.500 37.500
ln_ROL (per
$1000) 96 1.762 0.654 0.000 0.736 1.328 1.736 2.236 2.741 3.624
Insurance 209 0.708 0.456
Financial variables
FirstDayReturn 193 0.040 0.111 -0.152 -0.061 -0.010 0.011 0.074 0.235 0.867
MarketRet 207 0.077 0.190 -0.409 -0.281 -0.069 0.127 0.213 0.307 0.563
RiskFree 186 0.024 0.007 0.008 0.016 0.018 0.022 0.029 0.035 0.038
SMB 186 0.158 0.185 -0.173 -0.066 0.023 0.124 0.265 0.513 0.783
HML 186 0.051 0.273 -0.443 -0.248 -0.093 0.002 0.114 0.731 1.301
lnMVE_IPO 206 18.819 1.209 13.638 16.743 18.201 18.853 19.488 20.577 22.504
Growth 190 1.313 1.814 0.003 0.308 0.697 0.927 1.232 3.149 17.767
ROA 207 -0.004 0.199 -1.453 -0.277 -0.008 0.025 0.062 0.114 0.937
Debt_Ratio 207 0.374 0.240 0.003 0.011 0.175 0.350 0.535 0.828 0.995
Governance variables
Duality 209 0.273 0.446
Blockholder 209 0.722 0.449
Independence 209 0.708 0.164 0.182 0.429 0.600 0.714 0.818 1.000 1.000
ITCE 209 0.464 0.500
Other variables
Board_size 205 6.878 2.091 3 4 5 7 8 11 15
Risky_Industry 209 0.335 0.473
Age 205 25.97 29.92 0.000 0.323 5.000 14.000 38.40 97.17 130.00
IPOfeerat 188 0.0584 0.0215 0.0065 0.0438 0.0550 0.0600 0.0600 0.0675 0.3240
Float 204 0.546 0.320 0.048 0.140 0.243 0.495 0.887 1.000 1.023
Big5 185 0.686 0.465
US_Presence 209 0.536 0.500
US_Sales 198 0.208 0.310 0.000 0.000 0.000 0.000 0.403 0.860 1.000
Table 2-3 Separation and test between firms that have D&O insurance or not
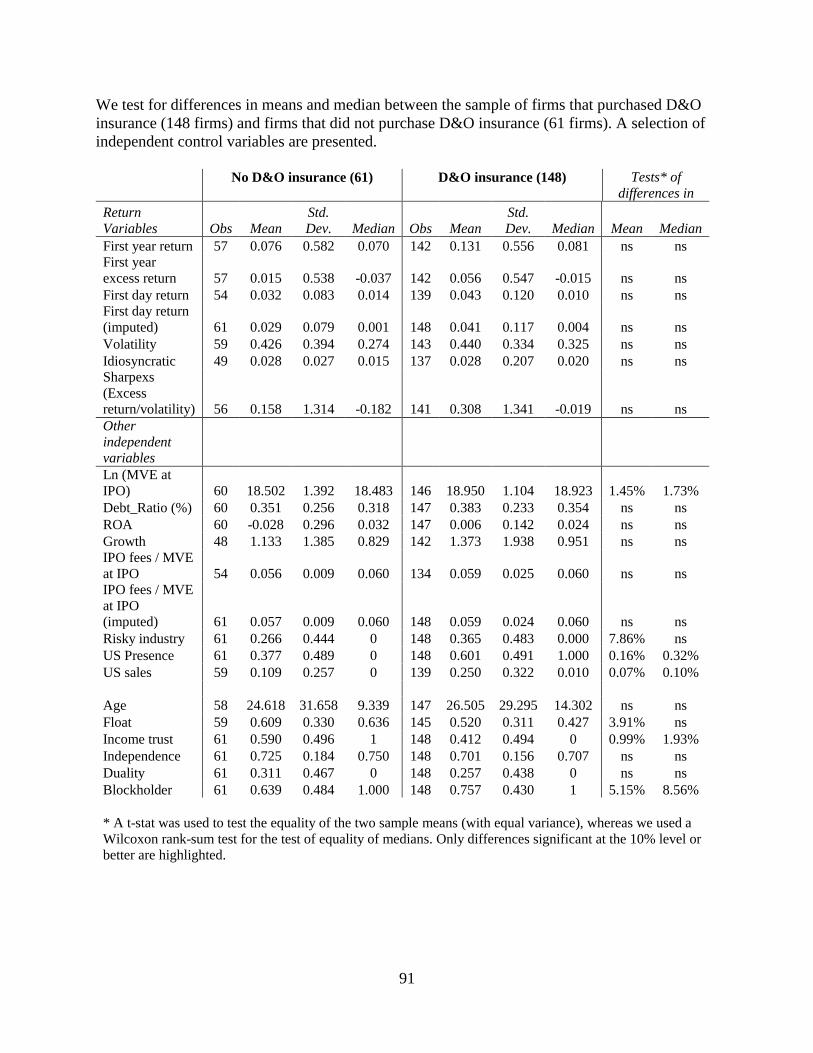
91
We test for differences in means and median between the sample of firms that purchased D&O
insurance (148 firms) and firms that did not purchase D&O insurance (61 firms). A selection of
independent control variables are presented.
No D&O insurance (61) D&O insurance (148) Tests* of
differences in
Return
Variables Obs Mean
Std.
Dev. Median Obs Mean
Std.
Dev. Median Mean Median
First year return 57 0.076 0.582 0.070 142 0.131 0.556 0.081 ns ns
First year
excess return 57 0.015 0.538 -0.037 142 0.056 0.547 -0.015 ns ns
First day return 54 0.032 0.083 0.014 139 0.043 0.120 0.010 ns ns
First day return
(imputed) 61 0.029 0.079 0.001 148 0.041 0.117 0.004 ns ns
Volatility 59 0.426 0.394 0.274 143 0.440 0.334 0.325 ns ns
Idiosyncratic 49 0.028 0.027 0.015 137 0.028 0.207 0.020 ns ns
Sharpexs
(Excess
return/volatility) 56 0.158 1.314 -0.182 141 0.308 1.341 -0.019 ns ns
Other
independent variables
Ln (MVE at
IPO) 60 18.502 1.392 18.483 146 18.950 1.104 18.923 1.45% 1.73%
Debt_Ratio (%) 60 0.351 0.256 0.318 147 0.383 0.233 0.354 ns ns
ROA 60 -0.028 0.296 0.032 147 0.006 0.142 0.024 ns ns
Growth 48 1.133 1.385 0.829 142 1.373 1.938 0.951 ns ns
IPO fees / MVE
at IPO 54 0.056 0.009 0.060 134 0.059 0.025 0.060 ns ns
IPO fees / MVE
at IPO
(imputed) 61 0.057 0.009 0.060 148 0.059 0.024 0.060 ns ns
Risky industry 61 0.266 0.444 0 148 0.365 0.483 0.000 7.86% ns
US Presence 61 0.377 0.489 0 148 0.601 0.491 1.000 0.16% 0.32%
US sales 59 0.109 0.257 0 139 0.250 0.322 0.010 0.07% 0.10%
Age 58 24.618 31.658 9.339 147 26.505 29.295 14.302 ns ns
Float 59 0.609 0.330 0.636 145 0.520 0.311 0.427 3.91% ns
Income trust 61 0.590 0.496 1 148 0.412 0.494 0 0.99% 1.93%
Independence 61 0.725 0.184 0.750 148 0.701 0.156 0.707 ns ns
Duality 61 0.311 0.467 0 148 0.257 0.438 0 ns ns
Blockholder 61 0.639 0.484 1.000 148 0.757 0.430 1 5.15% 8.56%
* A t-stat was used to test the equality of the two sample means (with equal variance), whereas we used a
Wilcoxon rank-sum test for the test of equality of medians. Only differences significant at the 10% level or
better are highlighted.
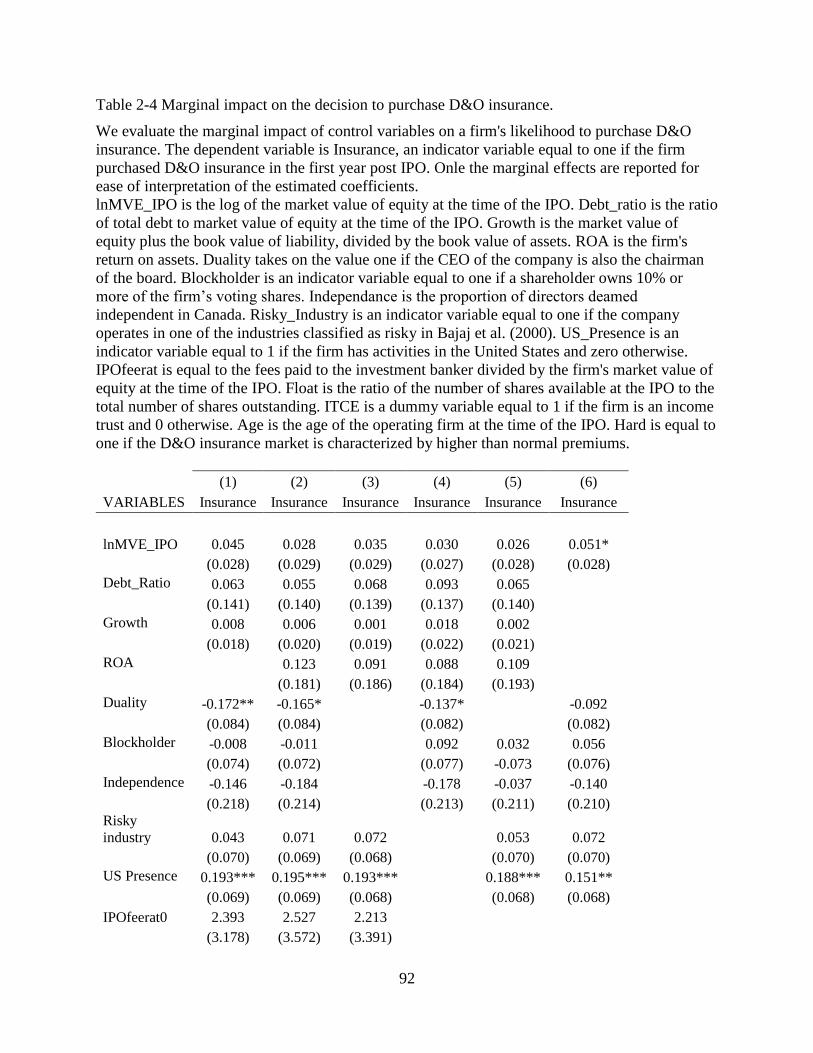
92
Table 2-4 Marginal impact on the decision to purchase D&O insurance.
We evaluate the marginal impact of control variables on a firm's likelihood to purchase D&O
insurance. The dependent variable is Insurance, an indicator variable equal to one if the firm
purchased D&O insurance in the first year post IPO. Onle the marginal effects are reported for
ease of interpretation of the estimated coefficients.
lnMVE_IPO is the log of the market value of equity at the time of the IPO. Debt_ratio is the ratio
of total debt to market value of equity at the time of the IPO. Growth is the market value of
equity plus the book value of liability, divided by the book value of assets. ROA is the firm's
return on assets. Duality takes on the value one if the CEO of the company is also the chairman
of the board. Blockholder is an indicator variable equal to one if a shareholder owns 10% or
more of the firm’s voting shares. Independance is the proportion of directors deamed
independent in Canada. Risky_Industry is an indicator variable equal to one if the company
operates in one of the industries classified as risky in Bajaj et al. (2000). US_Presence is an
indicator variable equal to 1 if the firm has activities in the United States and zero otherwise.
IPOfeerat is equal to the fees paid to the investment banker divided by the firm's market value of
equity at the time of the IPO. Float is the ratio of the number of shares available at the IPO to the
total number of shares outstanding. ITCE is a dummy variable equal to 1 if the firm is an income
trust and 0 otherwise. Age is the age of the operating firm at the time of the IPO. Hard is equal to
one if the D&O insurance market is characterized by higher than normal premiums.
(1) (2) (3) (4) (5) (6)
VARIABLES Insurance Insurance Insurance Insurance Insurance Insurance
lnMVE_IPO 0.045 0.028 0.035 0.030 0.026 0.051*
(0.028) (0.029) (0.029) (0.027) (0.028) (0.028)
Debt_Ratio 0.063 0.055 0.068 0.093 0.065
(0.141) (0.140) (0.139) (0.137) (0.140)
Growth 0.008 0.006 0.001 0.018 0.002
(0.018) (0.020) (0.019) (0.022) (0.021)
ROA
0.123 0.091 0.088 0.109
(0.181) (0.186) (0.184) (0.193)
Duality -0.172** -0.165*
-0.137*
-0.092
(0.084) (0.084)
(0.082)
(0.082)
Blockholder -0.008 -0.011
0.092 0.032 0.056
(0.074) (0.072)
(0.077) -0.073 (0.076)
Independence -0.146 -0.184
-0.178 -0.037 -0.140
(0.218) (0.214)
(0.213) (0.211) (0.210)
Risky
industry 0.043 0.071 0.072
0.053 0.072
(0.070) (0.069) (0.068)
(0.070) (0.070)
US Presence 0.193*** 0.195*** 0.193***
0.188*** 0.151**
(0.069) (0.069) (0.068)
(0.068) (0.068)
IPOfeerat0 2.393 2.527 2.213
(3.178) (3.572) (3.391)

93
Float 0.121 0.108 0.111
(0.155) (0.153) (0.153)
ITCE -0.157 -0.290** -0.280**
-0.208** -0.269***
(0.101) (0.117) (0.116)
(0.094) (0.083)
Age 0.001 0.001 0.001
(0.001) (0.002) (0.002)
Hard
0.230** 0.243** 0.0450 0.244** 0.291***
(0.108) (0.108) (0.0700) (0.102) (0.084)
Constant
PseudoR2 0.123 0.154 0.132 0.044 0.108 0.138
LL -88.485 -85.410 -87.653 -101.11 -94.306 -107.18 Observations 183 183 183 188 188 206 In all cases, the standard deviation is in parentheses. ***, **, and * indicate
significance at the 1%, 5%, and 10% levels, respectively. Model specification 2 is used as our first stage regression in our Heckman two-stage
regression
Table 2-5A OLS regression that measures the firms' first year excess return – Panel A
We evaluate the impact of price per unit of coverage on the firms' market-adjusted stock return in
the first year following the IPO. The dependent variable is the first year total return minus the
return of the market over the same year (FirstYearReturn - Mkt1Year). The two main variables
of interest are Rate-on-line, calculated as the premium per thousand dollars of maximum
coverage, and ln_ROL, the log of the Rate-on-line. We hypothesize that these two measures
should be negatively related to the firm's first year excess return.
FirstDayReturn is our control variable for underpricing and is computed as the first day return on
the close of the first trading day. LnMVE_IPO is the log of the firm's market value of equity at
the time of the IPO (issue price multiplied by number of outstanding shares). Growth is the
market value of equity plus the book value of liability, divided by the book value of assets.
DebtRatio is the ratio of total debt to assets. ROA is the firm's return on assets. IPOfeerat is the
ratio of the IPO fees paid per million dollars of market value of equity. Float is computed as the
ratio of the number of shares issued over the total number of shares outstanding. ITCE is a
dummy variable equal to 1 if the firm is an income trust. US_Sales is the percentage of sales
carried out in the US. Independence is the proportion of board members that are classified as
independent. Duality is equal to 1 if the CEO is also the Chairman of the board and zero
otherwise. Blockholder is equal to 1 if there is a major shareholder that holds more than 10% of
the shares after the IPO and 0 otherwise. Age is the age of the operation entity before the IPO.
Hard is a dummy variable equal to 1 to account for the period of time when D&O insurance
premium were abnormally high.
(1) (2) (3) (4) (5) (6) (7)
VARIABLES First year
excess
return
First year excess
return
First year excess
return
First year excess
return
First year excess
return
First year excess
return
First year excess
return

94
ln_ROL -0.124** -0.122* -0.129**
(0.059)
(0.063)
(0.060)
Rate-on-line
-0.0167***
-0.0177***
-0.0183***
(0.006) (0.006) (0.006)
FirstDayReturn 0.596
0.220 0.297 0.249 0.325
(0.429)
(0.395) (0.396) (0.400) (0.398)
lnMVE_IPO 0.033 0.028 0.022 0.031 0.022 0.025 0.016
(0.040) (0.042) (0.043) (0.045) (0.047) (0.049) (0.051)
Growth -0.011
0.008 0.008 0.004 0.004
(0.034)
(0.049) (0.048) (0.045) (0.044)
DebtRatio 0.205
0.323 0.316 0.326 0.318
(0.164)
(0.230) (0.232) (0.231) (0.232)
ROA 0.892*** 0.927** 0.967*** 0.800** 0.836** 0.768* 0.810*
(0.191) (0.362) (0.362) (0.391) (0.386) (0.422) (0.416)
IPOfeerat -1.245
-0.530 -0.518 -0.746 -0.697
(1.605)
(2.065) (2.066) (2.141) (2.134)
Float -0.063
-0.0841 -0.110 -0.104 -0.129
(0.149)
(0.257) (0.248) (0.272) (0.265)
ITCE -0.259**
-0.236 -0.231 -0.279* -0.268*
(0.108)
(0.145) (0.143) (0.160) (0.156)
US_sales -0.134
-0.160 -0.169 -0.146 -0.157
(0.115)
(0.183) (0.183) (0.180) (0.181)
Independence -0.211 -0.164 -0.188 -0.086 -0.113 -0.088 -0.117
(0.242) (0.295) (0.284) (0.358) (0.346) (0.368) (0.359)
Duality -0.132
-0.195 -0.213 -0.181 -0.201
(0.106)
(0.174) (0.176) (0.165) (0.167)
Blockholder -0.127* -0.016 -0.029 -0.040 -0.057 -0.04 -0.061
(-0.071) (0.095) (0.094) (0.113) (0.112) (0.110) (0.108)
Age 0.002
0.003 0.003 0.003 0.003
(-0.001)
(-0.003) (-0.003) (-0.003) (-0.003)
Hard -0.006
0.082 0.071
(-0.132)
(-0.196) (-0.197)
Constant -0.170 -0.146 -0.100 -0.208 -0.074 -0.081 0.037
(0.852) (0.836) (0.847) (0.958) (0.997) (1.049) (1.086)
Observations 167 93 93 87 87 87 87
R-squared 0.235 0.128 0.131 0.209 0.214 0.211 0.216
Coefficients are reported with their robust standard deviation in parentheses. ***, **, and * indicate
significance at the 1%, 5%, and 10% levels, respectively.

95
Table 2-5B OLS regression that measures the firms' first year total return – Panel B
We evaluate the impact of price per unit of coverage on the firms' total stock return in the first
year following the IPO. The dependent variable is the first year total return (FirstYearReturn ).
The two main variables of interest are Rate-on-line, calculated as the premium per thousand
dollars of maximum coverage, and ln_ROL, the log of the Rate-on-line. We hypothesize that
these two measures should be negatively related to the firm's first year total return.
FirstDayReturn is our control variable for underpricing and is computed as the first day return on
the close of the first trading day. MarketRet, RiskFree, SMB and HML are the one year total
returns of the Canadian market portfolio, the risk free rate and the two Fama-French size and
growth portfolios respectively. LnMVE_IPO is the log of the firm's market value of equity at the
time of the IPO (issue price multiplied by number of outstanding shares). Growth is the market
value of equity plus the book value of liability, divided by the book value of assets. DebtRatio is
the ratio of total debt to assets. ROA is the firm's return on assets. IPOfeerat is the ratio of the
IPO fees paid per million dollars of market value of equity. Float is computed as the ratio of the
number of shares issued over the total number of shares outstanding. ITCE is a dummy variable
equal to 1 if the firm is an income trust. US_Sales is the percentage of sales carried out in the US.
Independence is the proportion of board members that are classified as independent. Duality is
equal to 1 if the CEO is also the Chairman of the board and zero otherwise. Blockholder is equal
to 1 if there is a major shareholder that holds more than 10% of the shares after the IPO and 0
otherwise. Age is the age of the operation entity before the IPO. Big5 is a dummy variable equal
to 1 when one of the top-5 Canadian Banks was the lead underwriter. Hard is a dummy variable
equal to 1 to account for the period of time when D&O insurance premium were abnormally high.
(1) (2) (3) (4) (5) (6) (7)
VARIABLES
First
year total
return
First
year
total
return
First year
total
return
First year
total
return
First year
total return
First year
total
return
First year
total return
ln_ROL -0.180** -0.226*** -0.232***
(0.084)
(0.079)
(0.077)
Rate-on-line
-0.0251**
-0.0300***
-0.0297***
(0.010) (0.009) (0.009)
FirstDayReturn
0.140 0.319 0.310 0.477
(0.469) (0.462) (0.513) (0.522)
MarketRet 0.480** 0.564* 0.527* -0.008 -0.068 -0.270 -0.311
(0.207) (0.299) (0.293) (0.286) (0.287) (0.364) (0.362)
RiskFree 0.139 -6.457 -8.250 -1.467 -4.984 7.857 3.943
(5.697) (6.743) (6.960) (10.64) (10.40) (15.84) (15.85)
SMB 0.0783 -0.400 -0.416 -0.307 -0.287 -0.203 -0.189
(0.217) (0.336) (0.340) (0.327) (0.328) (0.290) (0.291)
HML -0.148 -0.177 -0.181 -0.513 -0.512 -0.577* -0.568*
(0.133) (0.203) (0.205) (0.316) (0.317) (0.331) (0.330)
lnMVE_IPO 0.114** 0.073 0.068 0.101* 0.089 0.072 0.061
(0.044) (0.062) (0.062) (0.056) (0.058) (0.055) (0.056)
Growth
0.021 0.018 0.010 0.008
(0.061) (0.060) (0.053) (0.053)
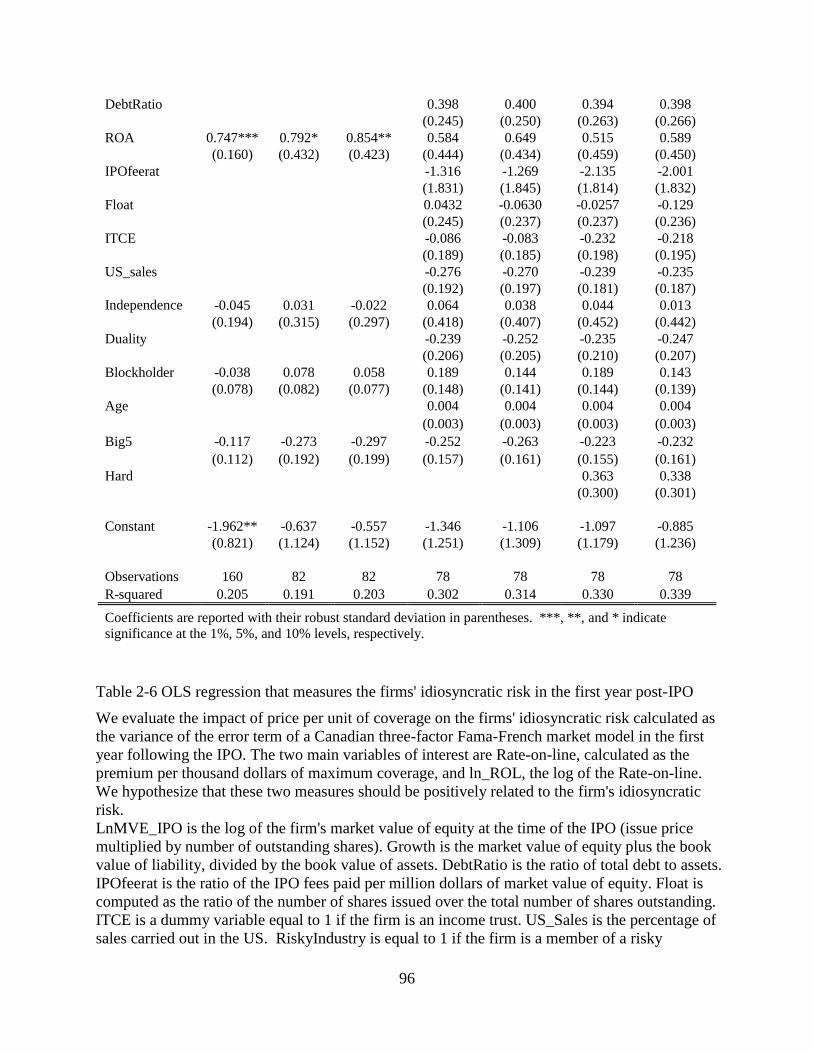
96
DebtRatio
0.398 0.400 0.394 0.398
(0.245) (0.250) (0.263) (0.266)
ROA 0.747*** 0.792* 0.854** 0.584 0.649 0.515 0.589
(0.160) (0.432) (0.423) (0.444) (0.434) (0.459) (0.450)
IPOfeerat
-1.316 -1.269 -2.135 -2.001
(1.831) (1.845) (1.814) (1.832)
Float
0.0432 -0.0630 -0.0257 -0.129
(0.245) (0.237) (0.237) (0.236)
ITCE
-0.086 -0.083 -0.232 -0.218
(0.189) (0.185) (0.198) (0.195)
US_sales
-0.276 -0.270 -0.239 -0.235
(0.192) (0.197) (0.181) (0.187)
Independence -0.045 0.031 -0.022 0.064 0.038 0.044 0.013
(0.194) (0.315) (0.297) (0.418) (0.407) (0.452) (0.442)
Duality
-0.239 -0.252 -0.235 -0.247
(0.206) (0.205) (0.210) (0.207)
Blockholder -0.038 0.078 0.058 0.189 0.144 0.189 0.143
(0.078) (0.082) (0.077) (0.148) (0.141) (0.144) (0.139)
Age
0.004 0.004 0.004 0.004
(0.003) (0.003) (0.003) (0.003)
Big5 -0.117 -0.273 -0.297 -0.252 -0.263 -0.223 -0.232
(0.112) (0.192) (0.199) (0.157) (0.161) (0.155) (0.161)
Hard
0.363 0.338
(0.300) (0.301)
Constant -1.962** -0.637 -0.557 -1.346 -1.106 -1.097 -0.885
(0.821) (1.124) (1.152) (1.251) (1.309) (1.179) (1.236)
Observations 160 82 82 78 78 78 78
R-squared 0.205 0.191 0.203 0.302 0.314 0.330 0.339
Coefficients are reported with their robust standard deviation in parentheses. ***, **, and * indicate
significance at the 1%, 5%, and 10% levels, respectively.
Table 2-6 OLS regression that measures the firms' idiosyncratic risk in the first year post-IPO
We evaluate the impact of price per unit of coverage on the firms' idiosyncratic risk calculated as
the variance of the error term of a Canadian three-factor Fama-French market model in the first
year following the IPO. The two main variables of interest are Rate-on-line, calculated as the
premium per thousand dollars of maximum coverage, and ln_ROL, the log of the Rate-on-line.
We hypothesize that these two measures should be positively related to the firm's idiosyncratic
risk.
LnMVE_IPO is the log of the firm's market value of equity at the time of the IPO (issue price
multiplied by number of outstanding shares). Growth is the market value of equity plus the book
value of liability, divided by the book value of assets. DebtRatio is the ratio of total debt to assets.
IPOfeerat is the ratio of the IPO fees paid per million dollars of market value of equity. Float is
computed as the ratio of the number of shares issued over the total number of shares outstanding.
ITCE is a dummy variable equal to 1 if the firm is an income trust. US_Sales is the percentage of
sales carried out in the US. RiskyIndustry is equal to 1 if the firm is a member of a risky
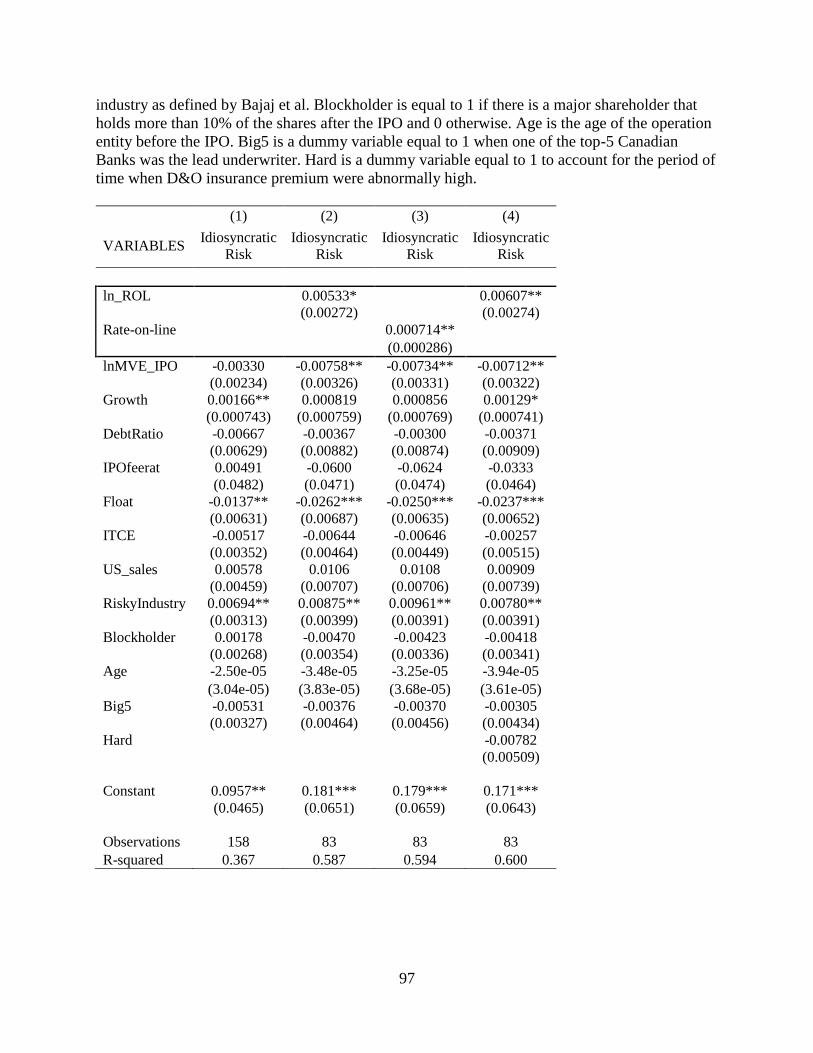
97
industry as defined by Bajaj et al. Blockholder is equal to 1 if there is a major shareholder that
holds more than 10% of the shares after the IPO and 0 otherwise. Age is the age of the operation
entity before the IPO. Big5 is a dummy variable equal to 1 when one of the top-5 Canadian
Banks was the lead underwriter. Hard is a dummy variable equal to 1 to account for the period of
time when D&O insurance premium were abnormally high.
(1) (2) (3) (4)
VARIABLES Idiosyncratic
Risk
Idiosyncratic
Risk
Idiosyncratic
Risk
Idiosyncratic
Risk
ln_ROL 0.00533* 0.00607**
(0.00272)
(0.00274)
Rate-on-line
0.000714**
(0.000286)
lnMVE_IPO -0.00330 -0.00758** -0.00734** -0.00712**
(0.00234) (0.00326) (0.00331) (0.00322)
Growth 0.00166** 0.000819 0.000856 0.00129*
(0.000743) (0.000759) (0.000769) (0.000741)
DebtRatio -0.00667 -0.00367 -0.00300 -0.00371
(0.00629) (0.00882) (0.00874) (0.00909)
IPOfeerat 0.00491 -0.0600 -0.0624 -0.0333
(0.0482) (0.0471) (0.0474) (0.0464)
Float -0.0137** -0.0262*** -0.0250*** -0.0237***
(0.00631) (0.00687) (0.00635) (0.00652)
ITCE -0.00517 -0.00644 -0.00646 -0.00257
(0.00352) (0.00464) (0.00449) (0.00515)
US_sales 0.00578 0.0106 0.0108 0.00909
(0.00459) (0.00707) (0.00706) (0.00739)
RiskyIndustry 0.00694** 0.00875** 0.00961** 0.00780**
(0.00313) (0.00399) (0.00391) (0.00391)
Blockholder 0.00178 -0.00470 -0.00423 -0.00418
(0.00268) (0.00354) (0.00336) (0.00341)
Age -2.50e-05 -3.48e-05 -3.25e-05 -3.94e-05
(3.04e-05) (3.83e-05) (3.68e-05) (3.61e-05)
Big5 -0.00531 -0.00376 -0.00370 -0.00305
(0.00327) (0.00464) (0.00456) (0.00434)
Hard
-0.00782
(0.00509)
Constant 0.0957** 0.181*** 0.179*** 0.171***
(0.0465) (0.0651) (0.0659) (0.0643)
Observations 158 83 83 83
R-squared 0.367 0.587 0.594 0.600

98
(5) (6) (7)
VARIABLES
Idiosyncratic
Risk
Idiosyncratic
Risk
Idiosyncratic
Risk
ln_ROL 0.00636**
(0.00242)
Rate-on-line 0.000764**
0.000785***
(0.000295) (0.000265)
lnMVE_IPO -0.00689** -0.00729** -0.00703**
(0.00328) (0.00281) (0.00284)
Growth 0.00127* 0.00142** 0.00141*
(0.000749) (0.000699) (0.000727)
DebtRatio -0.00310
(0.00901)
IPOfeerat -0.0388
(0.0461)
Float -0.0224*** -0.0183*** -0.0166***
(0.00615) (0.00527) (0.00490)
ITCE -0.00289 -0.00453 -0.00476
(0.00497) (0.00528) (0.00500)
US_sales 0.00937
(0.00735)
RiskyIndustry 0.00880** 0.00889** 0.00984***
(0.00387) (0.00336) (0.00333)
Blockholder -0.00364 -0.00328 -0.00262
(0.00328) (0.00309) (0.00299)
Age -3.68e-05
(3.54e-05)
Big5 -0.00315 -0.00208 -0.00216
(0.00427) (0.00429) (0.00428)
Hard -0.00719 -0.0101** -0.00965**
(0.00490) (0.00478) (0.00467)
Constant 0.170** 0.169*** 0.168***
(0.0652) (0.0539) (0.0547)
Observations 83 84 84
R-squared 0.606 0.581 0.586
Coefficients are reported with their robust standard deviation in parentheses. ***, **, and * indicate
significance at the 1%, 5%, and 10% levels, respectively.
Table 2-7 OLS regression that measures the firms' stock volatility in the first year post-IPO
We evaluate the impact of price per unit of coverage on the firms' stock market volatility in the
first year following the IPO. Volatility is calculated as the annualize standard deviation of daily
returns. The two main variables of interest are Rate-on-line, calculated as the premium per

99
thousand dollars of maximum coverage, and ln_ROL, the log of the Rate-on-line. We
hypothesize that these two measures should be positively related to the firm's stock volatility.
LnMVE_IPO is the log of the firm's market value of equity at the time of the IPO (issue price
multiplied by number of outstanding shares). Growth is the market value of equity plus the book
value of liability, divided by the book value of assets. DebtRatio is the ratio of total debt to assets.
IPOfeerat is the ratio of the IPO fees paid per million dollars of market value of equity. Float is
computed as the ratio of the number of shares issued over the total number of shares outstanding.
ITCE is a dummy variable equal to 1 if the firm is an income trust. US_Sales is the percentage of
sales carried out in the US. RiskyIndustry is equal to 1 if the firm is a member of a risky
industry as defined by Bajaj et al. Blockholder is equal to 1 if there is a major shareholder that
holds more than 10% of the shares after the IPO and 0 otherwise. Big5 is a dummy variable
equal to 1 when one of the top-5 Canadian Banks was the lead underwriter. Age is the age of the
operation entity before the IPO. Hard is a dummy variable equal to 1 to account for the period of
time when D&O insurance premium were abnormally high.
(1) (2) (3) (4) (5) (6) (7)
VARIABLES Volatility Volatility Volatility Volatility Volatility Volatility Volatility
ln_ROL 0.0556* 0.0702** 0.0823***
(0.0302)
(0.0308)
(0.0309)
Rate-on-line
0.00807**
0.00910**
0.0104***
(0.00361) (0.00386) (0.00362)
lnMVE_IPO
-
0.0857*** -0.109** -0.107* -0.100* -0.0976* -0.101** -0.0977**
(0.0226) (0.0541) (0.0548) (0.0533) (0.0542) (0.0476) (0.0484)
Growth 0.0327*** 0.00549 0.00615 0.0147 0.0147 0.0199* 0.0198*
(0.0109) (0.0108) (0.0111) (0.0109) (0.0112) (0.0103) (0.0108)
DebtRatio
-0.174 -0.165 -0.175 -0.167
(0.130) (0.129) (0.132) (0.131)
IPOfeerat
-1.113 -1.128 -0.585 -0.643
(0.708) (0.718) (0.733) (0.735)
Float -0.215*** -0.348*** -0.339*** -0.299*** -0.286*** -0.234*** -0.213***
(0.0742) (0.102) (0.0972) (0.0870) (0.0849) (0.0771) (0.0740)
ITCE -0.112* -0.159** -0.159** -0.0825 -0.0860 -0.123 -0.126*
(0.0595) (0.0697) (0.0681) (0.0831) (0.0806) (0.0774) (0.0731)
US_sales
0.132 0.134 0.102 0.105
(0.112) (0.112) (0.115) (0.114)
RiskyIndustry 0.0594 0.0990* 0.109* 0.0802 0.0920* 0.0978** 0.110**
(0.0388) (0.0579) (0.0555) (0.0546) (0.0521) (0.0465) (0.0447)
Blockholder 0.00727 -0.0663 -0.0621 -0.0559 -0.0500 -0.0556 -0.0473
(0.0437) (0.0451) (0.0436) (0.0411) (0.0406) (0.0405) (0.0395)
Age
-0.000673 -0.000646 -0.000765 -0.000733
(0.000479) (0.000454) (0.000475) (0.000460)
Big5
-0.0984 -0.0960 -0.0843 -0.0847 -0.0712 -0.0715
(0.0764) (0.0770) (0.0696) (0.0705) (0.0716) (0.0729)
Hard -0.153**
-0.155* -0.148* -0.187** -0.181**
(0.0662)
(0.0808) (0.0769) (0.0760) (0.0732)

100
Constant 2.247*** 2.856*** 2.830*** 2.653** 2.641** 2.532*** 2.514***
(0.449) (1.050) (1.063) (1.039) (1.054) (0.902) (0.915)
Observations 180 83 83 83 83 84 84
R-squared 0.453 0.612 0.617 0.633 0.637 0.609 0.613
Coefficients are reported with their robust standard deviation in parentheses. ***, **, and * indicate
significance at the 1%, 5%, and 10% levels, respectively.
Table 2-8 OLS regression that measures the firms' return-to-risk ratio in the first year post-IPO
We evaluate the impact of price per unit of coverage on different measures of the firms' return-
to-risk ratio (quasi-Sharpe ratios) in the first year following the IPO. The dependent variable are
one of the following: Excess Sharpe (First year excess return divided by Volatility), Total Sharpe
(First year total return divided by Volatility) and Idiosyncratic Sharpe (First year total return
divided by Idiosyncratic Risk). The two main variables of interest are Rate-on-line, calculated as
the premium per thousand dollars of maximum coverage, and ln_ROL, the log of the Rate-on-
line. We hypothesize that these two measures should be negatively related to the firm's return-to-
risk ratio.
FirstDayReturn is our control variable for underpricing and is computed as the first day return on
the close of the first trading day. MarketRet, RiskFree, SMB and HML are the one year total
returns of the Canadian market portfolio, the risk free rate and the two Fama-French size and
growth portfolios respectively. LnMVE_IPO is the log of the firm's market value of equity at the
time of the IPO (issue price multiplied by number of outstanding shares). Growth is the market
value of equity plus the book value of liability, divided by the book value of assets. DebtRatio is
the ratio of total debt to assets. ROA is the firm's return on assets. IPOfeerat is the ratio of the
IPO fees paid per million dollars of market value of equity. Float is computed as the ratio of the
number of shares issued over the total number of shares outstanding. ITCE is a dummy variable
equal to 1 if the firm is an income trust. US_Sales is the percentage of sales carried out in the US.
Independence is the proportion of board members that are classified as independent.
RiskyIndustry is equal to 1 if the firm is a member of a risky industry as defined by Bajaj et al.
Blockholder is equal to 1 if there is a major shareholder that holds more than 10% of the shares
after the IPO and 0 otherwise. Age is the age of the operation entity before the IPO. Big5 is a
dummy variable equal to 1 when one of the top-5 Canadian Banks was the lead underwriter.
Hard is a dummy variable equal to 1 to account for the period of time when D&O insurance
premium were abnormally high.
(1) (2) (3) (4) (5) (6) (7)
VARIABLES
Total
Sharpe
Ratio
Excess
Sharpe
Ratio
Excess
Sharpe
Ratio
Total
Sharpe
Ratio
Total
Sharpe
Ratio
Idiosyncratic
Sharpe Ratio
Idiosyncratic
Sharpe Ratio
ln_ROL -0.481** -0.472** -7.681**
(0.203)
(0.225)
(3.646)
Rate-on-line
-0.0579**
-0.0696**
-1.144***
(0.0247) (0.0263) (0.427)
FirstDayReturn 0.883 0.763 1.128 0.364 0.848 5.683 13.62

101
(1.025) (1.345) (1.343) (1.027) (0.982) (16.59) (15.79)
MarketRet -0.119
-0.551 -0.635 -9.775 -11.17
(0.595)
(0.782) (0.765) (13.02) (12.74)
RiskFree 5.508
-24.39 -35.84 -353.5 -543.3
(24.29)
(28.47) (27.77) (476.8) (461.8)
SMB 0.647
-0.213 -0.223 -4.169 -4.348
(0.553)
(0.726) (0.729) (11.84) (11.89)
HML -0.599
-0.994 -0.988 -17.19 -17.11*
(0.374)
(0.611) (0.597) (10.31) (10.09)
lnMVE_IPO 0.225** 0.133 0.109 0.171 0.153 2.781 2.492
(0.0952) (0.117) (0.113) (0.118) (0.117) (1.884) (1.858)
Growth 0.0391 0.0193 0.0237 0.0600 0.0553 1.104 1.023
(0.0694) (0.0885) (0.0835) (0.0957) (0.0922) (1.658) (1.598)
DebtRatio 0.801* 0.968 0.951 1.045 1.027 16.69 16.37
(0.482) (0.658) (0.662) (0.628) (0.629) (10.08) (10.10)
ROA 1.952*** 1.886 1.956 1.482 1.492 20.94 21.08
(0.441) (1.228) (1.197) (1.115) (1.083) (19.05) (18.52)
IPOfeerat -1.867 -3.205 -2.681 -4.467 -4.137 -70.46 -65.30
(3.795) (4.764) (4.707) (4.126) (4.136) (66.43) (66.56)
Float -0.280 -0.191 -0.352 -0.633 -0.815 -9.800 -12.75
(0.439) (0.810) (0.788) (0.652) (0.632) (10.47) (10.15)
ITCE -0.362 -0.607 -0.564 -0.0610 -0.0631 -1.415 -1.463
(0.354) (0.533) (0.531) (0.480) (0.467) (7.686) (7.476)
US_sales -0.481* -0.437 -0.417 -0.686* -0.670* -11.29* -11.02*
(0.269) (0.540) (0.540) (0.373) (0.373) (6.024) (6.005)
Independence 0.127 -0.288 -0.387 0.470 0.483 6.914 7.186
(0.618) (0.962) (0.954) (1.013) (0.984) (16.72) (16.23)
Duality -0.419* -0.555 -0.622 -0.706 -0.774* -12.34* -13.48*
(0.246) (0.454) (0.455) (0.428) (0.425) (7.201) (7.162)
Blockholder -0.0220 -0.162 -0.235 0.639* 0.593 10.76* 10.02
(0.219) (0.401) (0.407) (0.374) (0.361) (6.369) (6.165)
Age 0.00646* 0.00613 0.00556 0.00661 0.00632 0.116 0.112
(0.00355) (0.00673) (0.00674) (0.00594) (0.00579) (0.101) (0.0981)
RiskyIndustry -0.276 -0.334 -0.411 -0.532 -0.650 -9.396 -11.35
(0.236) (0.476) (0.483) (0.426) (0.438) (7.096) (7.294)
Big5 -0.378 -0.526 -0.515 -0.681** -0.727** -10.93** -11.71**
(0.263) (0.402) (0.401) (0.340) (0.343) (5.451) (5.514)
Hard 0.247 0.0274 -0.0259 0.000379 -0.0927 0.492 -1.036
(0.400) (0.446) (0.449) (0.557) (0.556) (9.045) (8.995)
Constant (1.854) -0.412 -0.157 -0.991 -0.442 -17.09 -8.007
(1.828) (2.244) (2.244) (2.149) (2.181) (34.53) (34.91)
Observations 144 82 82 78 78 78 78
R-squared 0.296 0.282 0.283 0.422 0.443 0.418 0.439
Coefficients are reported with their robust standard deviation in parentheses. ***, **, and * indicate
significance at the 1%, 5%, and 10% levels, respectively.
Table 2-9A OLS regression that measures the firms' first year return and risk assuming all the
information is incorporated in the price on the first day.

102
We evaluate the impact of price per unit of coverage on the firms' excess return, idiosyncratic
risk, volatility and quasi-Sharpe ratio in the first year following the IPO. The two main variables
of interest are Rate-on-line, calculated as the premium paid for one thousand dollar of maximum
possible coverage, and ln_ROL, the log of the Rate-on-line. We hypothesize that these two
measures should be negatively related to the excess return and the Sharpe ratio, and positively
related to the idiosyncratic risk and the volatility. FirstDayReturn is the firm's stock return on the
first day post IPO. Hard is a dummy variable equal to 1 when the D&O insurance market is
expensive for the firms seeking insurance.
(1) (2) (3) (4) (5) (6) (7) (8)
VARS
First year
excess
return
First year
excess
return
First
year total
return
First year
total return
Idiosyncratic
Risk
Idiosyncratic
Risk
Excess
Sharpe
Ratio
Excess
Sharpe
Ratio
ln_ROL -0.156*** -0.138** 0.00169 -0.452**
(0.0586)
(0.0604)
(0.00309)
(0.182)
Rate-on-line
-
0.0205***
-0.0184***
0.000360
-0.0525**
(0.00615) (0.00593) (0.000508) (0.0221)
FirstDayRet. 0.434 0.479 0.305 0.340 0.0246 0.0244 0.838 0.981
(0.301) (0.316) (0.333) (0.356) (0.0225) (0.0228) (0.858) (0.901)
MarketRet
0.734*** 0.717***
(0.275) (0.271)
RiskFree
1.642 0.557
(8.736) (8.597)
SMB
-0.336 -0.352
(0.291) (0.293)
HML
-0.0478 -0.0495
(0.189) (0.190)
Constant 0.323** 0.192** 0.302 0.218 0.0227*** 0.0231*** 1.016*** 0.587**
(0.133) (0.0939) (0.212) (0.190) (0.00582) (0.00435) (0.376) (0.236)
Observations 94 94 89 89 96 96 93 93
R-squared 0.041 0.043 0.101 0.104 0.022 0.027 0.052 0.044
Table 2-9B OLS regression that measures the firms' first year return assuming all the information
is incorporated in the price on the first day, net of the first day.
We evaluate the impact of price per unit of coverage on the firms' stock market return net of the
return on the first day. In all Models we control for the market return in the first year post IPO,
but we only control for the risk free rate and the two Fama-French size and growth portfolios in
Models 1 through 4. In Models 7 & 8, the market return is deducted from the dependent variable.
The two main variables of interest are Rate-on-line, calculated as the premium paid for one
thousand dollar of maximum possible coverage, and ln_ROL, the log of the Rate-on-line. We

103
hypothesize that these two measures should be negatively related to the return net of the first
day.
MarketRet, RiskFree, SMB and HML are the one year total returns of the Canadian market
portfolio, the risk free rate and the two Fama-French size and growth portfolios respectively.
Hard is a dummy variable equal to 1 when the D&O insurance market is expensive for the firms
seeking insurance.
(1) (2) (3) (4) (5) (6) (7) (8)
VARIABLES
Return
net of 1st
day
Return net
of 1st day
Return
net of
1st day
Return net
of 1st day
Return
net of 1st
day
Return net
of 1st day
Excess
return net
of 1st
day
Excess
return net
of 1st day
ln_ROL -0.122** -0.106* -0.139** -0.134**
(0.0561)
(0.0580)
(0.0584)
(0.0577)
Rate-on-line
-0.0156**
-0.0156**
-0.0203***
-0.0188***
(0.00592) (0.00635) (0.00563) (0.00602)
MarketRet 0.155 0.150 0.672** 0.653** 0.531** 0.503*
(0.359) (0.356) (0.295) (0.292) (0.256) (0.256)
RiskFree 23.27 21.75 3.022 1.910
(15.22) (15.22) (8.887) (8.760)
SMB -0.171 -0.182 -0.167 -0.179
(0.279) (0.280) (0.290) (0.291)
HML -0.238 -0.235
-
0.00931 -0.0178
(0.208) (0.211) (0.195) (0.197)
Hard 0.467** 0.452*
0.149 0.151
(0.229) (0.229)
(0.151) (0.149)
Constant -0.578 -0.634 0.134 0.0887 0.188 0.0878 0.240* 0.137
(0.463) (0.453) (0.219) (0.199) (0.152) (0.130) (0.127) (0.0894)
Observations 86 86 86 86 91 91 91 91
R-squared 0.158 0.158 0.079 0.084 0.085 0.093 0.022 0.027
Coefficients are reported with their robust standard deviation in parentheses. ***, **, and * indicate significance at the 1%,
5%, and 10% levels, respectively.
Table 2-10A Two-step regression that measures the first year's stock return and return-to-risk
ratio by controlling for the purchase of insurance
We evaluate the impact of price per unit of coverage on the firms' stock market return in the first
year following the IPO controlling for the information imbedded in the purchase of insurance or
not (model 2 in Table 4). The dependent variable is the return in excess of the market in Models
1 and 2, the total return in Models 3 through 6, and the total return net of the market return
divided by the one year volatility in Models 7 and 8. The two main variables of interest are Rate-
on-line, calculated as the premium-to-coverage ratio, and ln_ROL, the log of the Rate-on-line.
We hypothesize that these two measures should be negatively related to the first year return.
FirstDayReturn is our control variable for underpricing and is computed as the first day return on
the close of the first trading day. MarketRet, RiskFree, SMB and HML are the one year total

104
returns of the Canadian market portfolio, the risk free rate and the two Fama-French size and
growth portfolios respectively. LnMVE_IPO is the log of the firm's market value of equity at the
time of the IPO (issue price multiplied by number of outstanding shares).
(1A) (2A) (3A) (4A) (5A) (6A) (7A) (8A)
VARIABLES
First year
excess
return
First year
excess
return
First year
total
return
First year
total
return
First year
total
return
First
year
total
return
Return-
to-Risk
ratio
Return-to-
Risk ratio
ln_ROL -0.165*** -0.136** -0.131** -0.504**
(0.0634)
(0.0608)
(0.0621)
(0.199)
Rate-on-line
-0.0274**
-0.0205*
-0.0202
-0.0840**
(0.0126) (0.0122) (0.0135) (0.0339)
FirstDayReturn 0.762 0.831 0.790 0.868 0.877 0.949* 1.834 2.043
(0.496) (0.532) (0.539) (0.547) (0.556) (0.565) (1.339) (1.404)
MarketRet
0.385 0.401 0.441 0.454
(0.321) (0.337) (0.346) (0.382)
RiskFree
-0.264 -0.267 -0.247 -0.250
(0.278) (0.282) (0.276) (0.281)
SMB
-0.273 -0.259 -0.184 -0.175
(0.233) (0.257) (0.268) (0.314)
HML
1.482 0.532 2.006 1.058
(10.07) (9.679) (10.21) (9.820)
lnMVE_IPO 0.0678 0.0662 0.0795 0.0781
0.159 0.154
(0.0515) (0.0538) (0.0487) (0.0495)
(0.108) (0.109)
Constant -0.857 -0.909 -1.083 -1.121 0.402 0.345 -1.698 -1.856
(1.113) (1.227) (1.003) (1.046) (0.287) (0.381) (2.237) (2.316)
Observations 128 128 128 128 128 128 129 129
Coefficients are reported with their robust standard deviation in parentheses. ***, **, and *
indicate significance at the 1%, 5%, and 10% levels, respectively. The first stage regression
(i.e., the decision to puchase insurance or not) is given by Model 2 in Table 4. In none of
the regression models presented in this Table can we reject the hypothesis that the two
equation are independent.
Table 2-10B Two-step regression that measures the first year's stock return by controlling for the
decision to reveal the D&O insurance premium and policy limit
We evaluate the impact of price per unit of coverage on the firms' stock market return in the first
year following the IPO controlling for the information imbedded in the purchase of insurance or
not (model 2 in Table 4) and the decision to reveal the premium paid and the coverage chosen.
The dependent variable is the return in excess of the market in Models 1 and 2, and the total
return in Models 3 and 4. The two main variables of interest are Rate-on-line, calculated as the
premium-to-coverage ratio, and ln_ROL, the log of the Rate-on-line. We hypothesize that these
two measures should be negatively related to the first year return.
FirstDayReturn is our control variable for underpricing and is computed as the first day return on
the close of the first trading day. MarketRet, RiskFree, SMB and HML are the one year total

105
returns of the Canadian market portfolio, the risk free rate and the two Fama-French size and
growth portfolios respectively. IMR is the inverse-Mills ratio calculated from the insurance
purchase decision regression of Model 2 in Table 4.
(5A) (6A) (7A) (8A)
VARIABLES First year
excess return
First year
excess return
First year total
return
First year total
return
ln_ROL -0.160** -0.114*
(0.0636)
(0.0584)
Rate-on-line
-0.0245**
-0.0155*
(0.0108) (0.00885)
FirstDayReturn 0.534 0.608 0.562 0.635
(0.579) (0.572) (0.597) (0.596)
MarketRet
0.240 0.242
(0.321) (0.322)
RiskFree
-0.264 -0.260
(0.252) (0.253)
SMB
-0.382* -0.365
(0.230) (0.230)
HML
0.588 0.0708
(9.638) (9.450)
lnMVE_IPO 0.0481 0.0461 0.0586 0.0569
(0.0640) (0.0643) (0.0557) (0.0563)
IMR -0.245 -0.256 -0.0724 -0.0834
(0.286) (0.299) (0.291) (0.299)
Constant -0.282 -0.346 -0.509 -0.554
(1.438) (1.458) (1.183) (1.215)
Observations 126 126 122 122
Coefficients are reported with their robust standard deviation in parentheses. ***,
**, and * indicate significance at the 1%, 5%, and 10% levels, respectively. The
first stage regression (i.e., the decision to reveal the D&O insurance premium and
coverage is given by InsDetails= Growth + ROA + Blockholder + Debtratio +
Float + Riskyindustry + us + Age + Big5. In none of the regression models
presented in this Table can we reject the hypothesis that the two equations are
independent.
Table 2-11A Two-stage least square simultaneous regressions for the first year total return and
risk
We evaluate simultaneously the impact of price per unit of coverage on the firms' stock market
return and risk in the first year following the IPO. The dependent variables are the first year total
return and the first year idiosyncratic risk in Models 1 and 2, and volatility in Model 3 and 4. The
two main variables of interest are Rate-on-line, calculated as the premium-to-coverage ratio, and
ln_ROL, the log of the Rate-on-line. We hypothesize that both measures should be negatively
related to the first year return and positively to the first year risk.

106
FirstDayReturn is our control variable for underpricing and is computed as the first day return on
the close of the first trading day. MarketRet, RiskFree, SMB and HML are the one year total
returns of the Canadian market portfolio, the risk free rate and the two Fama-French size and
growth portfolios respectively. LnMVE_IPO is the log of the firm's market value of equity at the
time of the IPO (issue price multiplied by number of outstanding shares). IPOfeerat is the ratio of
the IPO fees paid per million dollar of market value of equity. Float is computed as the ratio of
the number of shares issued over the total number of shares outstanding. ITCE is a dummy
variable equal to 1 if the firm is an income trust. US_Sales is the percentage of sales carried out
in the US. Independence is the proportion of board members that are classified as independent.
Duality is equal to 1 if the CEO is also the Chairman of the board and zero otherwise. Growth is
the market value of equity plus the book value of liability, divided by the book value of assets.
DebtRatio is the ratio of total liabilities to the market value of equity at the time of the IPO.
Risky_Industry is an indicator variable equal to one if the company operated in one of the
industries classified as risky in Bajaj et al. (2000). Age is the number of years separating
inception from the announcement of the IPO. Blockholder is a dummy variable equal to one if a
shareholder holds 10% or more of the firm's stock. Big5 is a dummy variable equal to 1 when
one of the top-5 Canadian Banks was the lead underwriter. Hard is a dummy variable equal to
one in the years where the D&O insurance market is expensive. IME is the inverse-Mills ratio of
the probit regression explaining the purchase of insurance (Model 2 of Table 4).
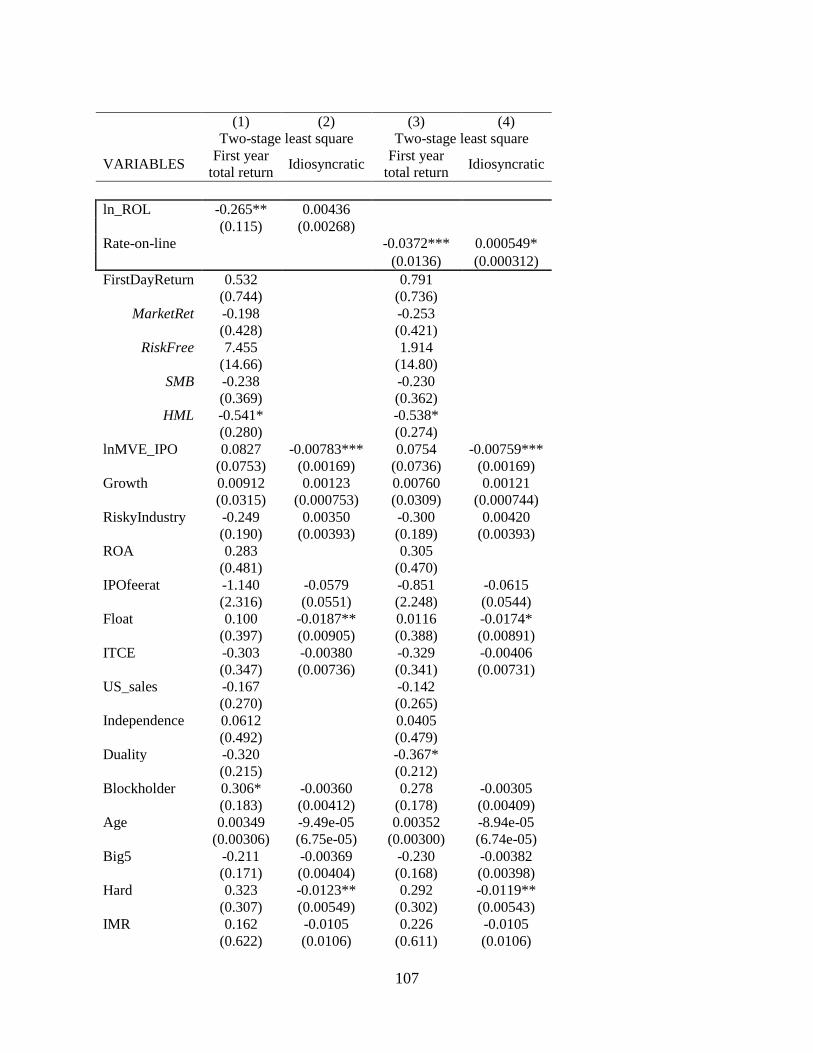
107
(1) (2) (3) (4)
Two-stage least square Two-stage least square
VARIABLES First year
total return Idiosyncratic
First year
total return Idiosyncratic
ln_ROL -0.265** 0.00436
(0.115) (0.00268)
Rate-on-line
-0.0372*** 0.000549*
(0.0136) (0.000312)
FirstDayReturn 0.532
0.791
(0.744)
(0.736)
MarketRet -0.198
-0.253
(0.428)
(0.421)
RiskFree 7.455
1.914
(14.66)
(14.80)
SMB -0.238
-0.230
(0.369)
(0.362)
HML -0.541*
-0.538*
(0.280)
(0.274)
lnMVE_IPO 0.0827 -0.00783*** 0.0754 -0.00759***
(0.0753) (0.00169) (0.0736) (0.00169)
Growth 0.00912 0.00123 0.00760 0.00121
(0.0315) (0.000753) (0.0309) (0.000744)
RiskyIndustry -0.249 0.00350 -0.300 0.00420
(0.190) (0.00393) (0.189) (0.00393)
ROA 0.283
0.305
(0.481)
(0.470)
IPOfeerat -1.140 -0.0579 -0.851 -0.0615
(2.316) (0.0551) (2.248) (0.0544)
Float 0.100 -0.0187** 0.0116 -0.0174*
(0.397) (0.00905) (0.388) (0.00891)
ITCE -0.303 -0.00380 -0.329 -0.00406
(0.347) (0.00736) (0.341) (0.00731)
US_sales -0.167
-0.142
(0.270)
(0.265)
Independence 0.0612
0.0405
(0.492)
(0.479)
Duality -0.320
-0.367*
(0.215)
(0.212)
Blockholder 0.306* -0.00360 0.278 -0.00305
(0.183) (0.00412) (0.178) (0.00409)
Age 0.00349 -9.49e-05 0.00352 -8.94e-05
(0.00306) (6.75e-05) (0.00300) (6.74e-05)
Big5 -0.211 -0.00369 -0.230 -0.00382
(0.171) (0.00404) (0.168) (0.00398)
Hard 0.323 -0.0123** 0.292 -0.0119**
(0.307) (0.00549) (0.302) (0.00543)
IMR 0.162 -0.0105 0.226 -0.0105
(0.622) (0.0106) (0.611) (0.0106)

108
Constant -0.446 0.178*** -0.241 0.175***
(1.157) (0.0315) (1.149) (0.0313)
Observations 86 86 86 86
R-squared 0.297 0.581 0.317 0.589
(5) (6) (7) (8)
Two-stage least square Two-stage least square
VARIABLES First year
total return Volatility
First year
total return Volatility
ln_ROL -0.265** 0.0786*
(0.115) (0.0456)
Rate-on-line
-0.0372*** 0.00948*
(0.0136) (0.00531)
FirstDayReturn 0.532
0.791
(0.744)
(0.736)
MarketRet -0.198
-0.253
(0.428)
(0.421)
RiskFree 7.455
1.914
(14.66)
(14.80)
SMB -0.238
-0.230
(0.369)
(0.362)
HML -0.541*
-0.538*
(0.280)
(0.274)
lnMVE_IPO 0.0827 -0.111*** 0.0754 -0.107***
(0.0753) (0.0287) (0.0736) (0.0287)
Growth 0.00912 0.0189 0.00760 0.0183
(0.0315) (0.0128) (0.0309) (0.0127)
RiskyIndustry -0.249 0.0628 -0.300 0.0750
(0.190) (0.0669) (0.189) (0.0669)
ROA 0.283
0.305
(0.481)
(0.470)
IPOfeerat -1.140 -0.764 -0.851 -0.840
(2.316) (0.936) (2.248) (0.926)
Float 0.100 -0.293* 0.0116 -0.268*
(0.397) (0.154) (0.388) (0.152)
ITCE -0.303 -0.0621 -0.329 -0.0676
(0.347) (0.125) (0.341) (0.125)
US_sales -0.167
-0.142
(0.270)
(0.265)
Independence 0.0612
0.0405
(0.492)
(0.479)
Duality -0.320
-0.367*
(0.215)
(0.212)
Blockholder 0.306* -0.0657 0.278 -0.0557
(0.183) (0.0700) (0.178) (0.0696)

109
Age 0.00349 -0.00144 0.00352 -0.00134
(0.00306) (0.00115) (0.00300) (0.00115)
Big5 -0.211 -0.0683 -0.230 -0.0722
(0.171) (0.0687) (0.168) (0.0678)
Hard 0.323 -0.210** 0.292 -0.202**
(0.307) (0.0933) (0.302) (0.0924)
IMR 0.162 -0.147 0.226 -0.147
(0.622) (0.181) (0.611) (0.180)
Constant -0.529 0.178*** -0.333 0.175***
(1.034) (0.0294) (1.027) (0.0293)
Observations 86 86 86 86
R-squared 0.294 0.581 0.314 0.589
Coefficients are reported with their standard deviation in parentheses.
***, **, and * indicate significance at the 1%, 5%, and 10% levels,
respectively. The first stage regression from which the inverse-Mills
ratio is calculated is drawn from Model 2 in Table 4. In none of the
regression models presented in this Table can we reject the hypothesis
that the equations are independent.
Table 2-11B Three-stage least square simultaneous regressions for the first year total return and
risk
We evaluate simultaneously the impact of price per unit of coverage on the firms' stock market
return in the first year following the IPO. The dependent variables are the first year total return
and the first year idiosyncratic risk. The two main variables of interest are Rate-on-line,
calculated as the premium-to-coverage ratio, and ln_ROL, the log of the Rate-on-line. We
hypothesize that both measures should be negatively related to the first year return and positively
to idiosyncratic risk.
FirstDayReturn is our control variable for underpricing and is computed as the first day return on
the close of the first trading day. Mkt1Year is the market return during the first year of the IPO.
LnMVE_IPO is the log of the firm's market value of equity at the time of the IPO (issue price
multiplied by number of outstanding shares). IPOfeerat is the ratio of the IPO fees paid per
million dollar of market value of equity. Float is computed as the ratio of the number of shares
issued over the total number of shares outstanding. ITCE is a dummy variable equal to 1 if the
firm is an income trust. US_Sales is the percentage of sales carried out in the US. Independence
is the proportion of board members that are classified as independent. Duality is equal to 1 if the
CEO is also the Chairman of the board and zero otherwise. Growth is the market value of equity
plus the book value of liability, divided by the book value of assets. DebtRatio is the ratio of total
liabilities to the market value of equity at the time of the IPO. Risky_Industry is an indicator
variable equal to one if the company operated in one of the industries classified as risky in Bajaj
et al. (2000). Age is the number of years separating inception from the announcement of the IPO.
Blockholder is a dummy variable equal to one if a shareholder holds 10% or more of the firm's
stock. Hard is a dummy variable equal to one in the years where the D&O insurance market is
expensive. InvMills is the inverse Mills' ratio obtained from Specification 2 in the Probit
regression table.

110
(1) (2) (3) (4)
Three-stage least square Three-stage least square
VARIABLES
First year
total
return
Idiosyncratic First year
total return Idiosyncratic
ln_ROL -0.280*** 0.00436*
(0.0962) (0.00245)
Rate-on-line
-0.0381*** 0.000549*
(0.0113) (0.000285)
FirstDayReturn 0.505
0.724
(0.587)
(0.583)
MarketRet -0.0971
-0.147
(0.337)
(0.334)
RiskFree 3.631
-0.767
(11.56)
(11.73)
SMB -0.398
-0.384
(0.291)
(0.287)
HML -0.437**
-0.438**
(0.221)
(0.217)
lnMVE_IPO 0.0832 -0.00783*** 0.0739 -0.00759***
(0.0628) (0.00154) (0.0615) (0.00154)
Growth 0.00734 0.00123* 0.00658 0.00121*
(0.0265) (0.000688) (0.0260) (0.000679)
RiskyIndustry -0.326** 0.00350 -0.374** 0.00420
(0.157) (0.00359) (0.156) (0.00359)
ROA -0.000589
0.0326
(0.380)
(0.373)
IPOfeerat -1.126 -0.0579 -0.830 -0.0615
(1.945) (0.0503) (1.889) (0.0496)
Float 0.0921 -0.0187** 0.000393 -0.0174**
(0.332) (0.00826) (0.325) (0.00814)
ITCE -0.265 -0.00380 -0.285 -0.00406
(0.288) (0.00671) (0.283) (0.00668)
US_sales -0.159
-0.137
(0.213)
(0.210)
Independence 0.167
0.143
(0.388)
(0.380)
Duality -0.294*
-0.334**
(0.169)
(0.168)
Blockholder 0.339** -0.00360 0.306** -0.00305
(0.153) (0.00376) (0.148) (0.00373)
Age 0.00339 -9.49e-05 0.00334 -8.94e-05
(0.00255) (6.17e-05) (0.00251) (6.15e-05)
Big5 -0.214 -0.00369 -0.226 -0.00382
(0.143) (0.00369) (0.141) (0.00363)
Hard 0.248 -0.0123** 0.221 -0.0119**
(0.251) (0.00501) (0.247) (0.00495)
IMR 0.0507 -0.0105 0.110 -0.0105

111
(0.507) (0.00970) (0.500) (0.00966)
Constant -1.068 0.199*** -0.902 0.197***
(1.367) (0.0325) (1.348) (0.0325)
Observations 78 78 78 78
R-squared 0.332 0.649 0.355 0.651
(5) (6) (7) (8)
Three-stage least
square Three-stage least square
VARIABLES
First year
total
return
Volatility First year
total return Volatility
ln_ROL -0.274*** 0.0786*
(0.0964) (0.0416)
Rate-on-line
-0.0375*** 0.00948*
(0.0114) (0.00485)
FirstDayReturn 0.442
0.663
(0.594)
(0.590)
MarketRet -0.112
-0.162
(0.341)
(0.338)
RiskFree 4.565
0.103
(11.70)
(11.86)
SMB -0.398
-0.384
(0.294)
(0.290)
HML -0.421*
-0.425*
(0.223)
(0.219)
lnMVE_IPO 0.0801 -0.111*** 0.0713 -0.107***
(0.0629) (0.0262) (0.0617) (0.0262)
Growth 0.00647 0.0189 0.00578 0.0183
(0.0265) (0.0117) (0.0260) (0.0116)
RiskyIndustry -0.313** 0.0628 -0.361** 0.0750
(0.158) (0.0610) (0.157) (0.0610)
ROA 0.0621
0.0919
(0.384)
(0.377)
IPOfeerat -1.204 -0.764 -0.908 -0.840
(1.948) (0.855) (1.891) (0.845)
Float 0.0795 -0.293** -0.0103 -0.268*
(0.333) (0.140) (0.325) (0.139)
ITCE -0.259 -0.0621 -0.279 -0.0676
(0.289) (0.114) (0.284) (0.114)
US_sales -0.148
-0.128
(0.215)
(0.212)
Independence 0.170
0.147
(0.392)
(0.384)
Duality -0.279
-0.320*
(0.171)
(0.170)

112
Blockholder 0.331** -0.0657 0.300** -0.0557
(0.153) (0.0639) (0.149) (0.0636)
Age 0.00336 -0.00144 0.00333 -0.00134
(0.00255) (0.00105) (0.00251) (0.00105)
Big5 -0.214 -0.0683 -0.227 -0.0722
(0.144) (0.0627) (0.141) (0.0619)
Hard 0.263 -0.210** 0.236 -0.202**
(0.253) (0.0851) (0.249) (0.0843)
IMR 0.0556 -0.147 0.114 -0.147
(0.510) (0.165) (0.503) (0.165)
Constant -1.047 2.908*** -0.886 2.879***
(1.371) (0.553) (1.351) (0.554)
Observations 78 78 78 78
R-squared 0.332 0.619 0.356 0.620
Coefficients are reported with their standard deviation in parentheses. ***,
**, and * indicate significance at the 1%, 5%, and 10% levels,
respectively. The first stage regression from which the inverse-Mills ratio
is calculated is drawn from Model 2 in Table 4. In none of the regression
models presented in this Table can we reject the hypothesis that the
equations are independent.

113
Chapter 3. A Learning-Based Approach to Evaluating Boards of Directors
Using predictions from a learning model, this paper exploits the cross-sectional variation in the
learning-induced decline in stock return volatility over director tenure to infer the marginal value
of different kinds of directors. This new framework confirms prior empirical findings and
documents new results. For example, directors joining better compensated boards have higher
marginal value while the marginal value of a director joining an entrenched board is muted.
Furthermore, the estimates imply that governance related uncertainty associated with the arrival
of a new director accounts for 7% of return volatility, shedding light on the extent to which
governance matters.
1. Introduction
Boards of directors are critical pillars in corporate governance. They are legally
responsible for governing the firm and protecting the interests of shareholders. Yet, inasmuch as
corporate directors are not perfect agents, providers of capital may find it beneficial to assess
them.. There has been a debate going back to Smith (1776) and Berle and Means (1932) about
whether boards of directors are monitors of, or are tools of management.44 How does one
measure whether boards of directors make a difference in the fortunes of a typical corporation? If
they do make a difference, how can we quantify the extent to which boards affect value? Are
there systematic patterns in effectiveness between certain kinds of boards?
44 Smith (1776) wrote: “The Directors of [joint stock] companies, however, being the managers of other people’s
money rather than their own, it cannot be expected that they should watch over it with the same anxious vigilance
[as owners]… Negligence and profusion, therefore, must always prevail, more or less, in the management of the
affairs of such a company.” ([1937] p.700). One hundred fifty-six year later, Berle and Means (1932) argued:
“…control will tend to be in the hands of those who select the proxy committee and by whom, the election of
directors for the ensuing period will be made. Since the proxy committee is appointed by existing management, the
latter can virtually dictate their successors.” (p. 87).

114
These questions have been front and center in the governance debate for over a decade
and have been addressed to some extent. The literature however often yields conflicting evidence
and it is difficult to draw conclusions due to methodological issues. 45 Understanding the
importance of boards and what the constituents of a well performing board are is still an open
question.
This paper attempts to shed some light on this issue by proposing a novel approach based
on a theoretical model of learning, which yields a general method to assess how the market
reacts to the appointments of directors. The model relies on the idea that the arrival of new
directors creates uncertainty and through their actions, newly appointed directors provide
information to investors who update their assessment of their ability to contribute to the
generation of cash flows. As investors become more acquainted with their new board, they
update their assessment of the board’s quality to a lesser extent. The resolution of governance-
related uncertainty leads to a decline in stock return volatility.
The formal model of this process is borrowed from Pan, Wang and Weisbach (2015) who
study learning about management and derive their stylized model based on the work of Pastor
and Veronesi (2003). The model as applied to boards yields intuitive testable predictions about
the relationship between stock return volatility and director tenure which motivate the empirical
analysis. First, if directors do not purely engage in window-dressing but do in fact affect firm
value, investors should react to their appointment and stock return volatility should subsequently
decline over their tenure. Furthermore, stock return volatility should decline faster at the
beginning of their tenure when uncertainty is highest. Second, the model predicts that volatility
should decline by different amounts for different kinds of directors. In other words, the
45 See Hermalin and Weisbach (2003) and Adams, Hermalin and Weisbach (2010).

115
magnitude of the decline in volatility over a director’s tenure is related to her marginal return to
ability. Support for these predictions is found in the data.
The focus on the second moment of stock returns stems from the observation that
whereas the first moment provides the market’s assessment of the anticipated effect of a director
upon her arrival, this is a very uncertain valuation at time zero. To wit, having a low expected
value does not necessarily imply that a particular director is irrelevant. Hence, the mean does not
provide a complete picture of the extent to which directors matter. Studying the second moment
of returns provides a new and complementary lens through which to examine the importance of
boards.
The increase in return volatility upon the arrival of directors is driven by the conjunction
of two effects: that director ability is relevant and that it is uncertain. Importantly, how much
uncertainty there is about a director decreases at a predetermined rate due to Bayes’ rule. This
rate is faster for higher ex-ante levels of uncertainty. The model therefore provides a theoretical
framework to assess which directors matter more: after controlling for the ex-ante uncertainty
about the ability of a new director, the cross-sectional variation in the magnitude of the learning-
induced decline in return volatility provides an estimate of the marginal return to ability of
different kinds of directors. For example, the results suggest that if the current board is
entrenched, investors expect an incoming director’s ability to sway the fortunes of the firm to be
muted.
In addition, the model is useful to quantify the fraction of return volatility imputable to
the uncertainty about the firm's board and to compare it to the uncertainty about management.
The empirical analysis uses a sample of 18,579 directors on the boards of 2,228 firms,
taken from the intersection of S&P 1,500 firms in BoardEx, CRSP and Compustat during the

116
2000-2014 period. The estimates indicate that when a director joins a board, stock return
volatility jumps by 13% on average and subsequently declines over the next few years. This
implies that learning about directors lowers volatility, presumably by reducing governance-
related uncertainty. Interpreted in light of the learning model, the decline in return volatility over
the course of director tenure provides empirical support for the assumption that investors expect
board members to be relevant in their valuation of the firm.
An important concern with this interpretation is the potential endogeneity of director
appointments. To wit, firms could reshuffle their boards in times of crisis, when volatility tends
to be especially high. In particular, we might expect periods of turmoil to be accompanied by a
transition in leadership. Therefore, all estimates exclude directors appointed within a year around
a CEO turnover. For this subsample of director appointments, which is the one used in the
regressions, the median (mean) ratio of the average return volatility over the three month period
prior to the arrival of a new director to the average return volatility over the two year period
preceding the director appointment is 0.94 (1.00). This suggests that for this sample, return
volatility does not appear to be especially high in the period leading to the appointment.
To alleviate the endogeneity concern further, the documented patterns still hold when
restricting the sample to exogenous director appointments. First, results hold for a sample of
appointments specifically designed to satisfy the new board independence-listing requirement set
by the stock exchanges in the early 2000s. Many firms had to initiate board changes to comply
with these new requirements and these appointments are unlikely to coincide systematically with
a time when the firm’s fundamental volatility is high. Second, results hold for directors
appointed to replace a board member who either passed away or retired. A board member is
defined as retiring if she is over 70 and/or was sitting on multiple boards and left all her boards

117
within two years. Restricting the sample to directors appointed to replace a director who passed
away or who retired yields a sample of board turnovers that are likely exogenous to firm
conditions.
The concern of potentially endogenous turnover is most valid when the firm is going
through turmoil. Therefore, a further restriction that is imposed is that these appointments occur
when the firm has had good stock return performance and low return volatility over the past year.
A similarity score is used to compare the individual profiles of the departing directors
who left due to deaths or retirements to the profile of the directors replacing them. Requiring that
the departing and incoming directors share a similar profile helps further ensure that the firm did
not appoint a particular director due to a major shift in strategy46.
A series of additional tests are designed to rule out the possibility that the documented
volatility patterns are a byproduct of potentially endogenous director appointments. These tests
also help to disentangle the investor learning hypothesis put forth in this paper from potential
alternative explanations.
First, stock return volatility patterns for young boards are compared to those of mature
boards. There is presumably more governance related uncertainty for younger boards than there
is for more seasoned boards. If the decline in stock return volatility reflects the resolution of
governance related uncertainty, we should observe a stronger decline for these younger boards.
Consistent with this idea, stock return volatility declines sharply over the average board tenure
for relatively young boards while it does not for mature boards (controlling for firm age and
board size). In contrast, if the documented volatility patterns were due to the endogenous nature
46 Note that the firms’ exposure to systematic risk does not appear to change over the learning period: plots of the
firms’ market, SMB and HML betas over director tenure do not show any specific pattern.

118
of director appointments there would be no reason to expect different patterns based on the
average tenure of board members.
A potential alternative explanation for the decline in return volatility rests on the
assumption that directors come on the board having little idea how to do their job thus creating a
lot of noise around their decisions. As directors get better at their job over time, they develop
skills which allow them to produce better decisions in the interest of the firm, which may drive
the decline in return volatility. The findings contrasting young and mature boards is difficult to
reconcile with this director learning alternative hypothesis though. If anything, it should be easier
for new directors to learn to do their job if the board is more mature and can more effectively
coach a newly appointed director. The director learning alternative explanation is addressed
directly in additional tests below.
Second, if the documented volatility pattern reflects investors learning about incoming
directors, we should observe an attenuated decline in volatility for directors who are well-known
to market participants. The data shows that this is the case: the decline in return volatility is
sharply muted for well-known directors.
The alternative director learning explanation is grounded in the idea that as directors get
better over time, they develop skills to produce better decisions in the interest of the company
which reduces return volatility. This paper exploits the fact that some directors are better
equipped than others to produce better decisions when joining new boards: directors with board
experience in the same industry who have held multiple previous directorships will arguably be
quicker to adjust to the production function of a particular firm, thereby predicting a smaller
decline in return volatility over their tenure. The investor learning hypothesis predicts the
opposite: directors with industry expertise who have a rich history of directorships should be a

119
wealth of resources for the board and therefore be more relevant for firm value. The data
supports the investor learning hypothesis: controlling for how much the market knows about
them, “professional” directors are associated with larger declines in stock return volatility over
their tenure.
Third, the analysis is run using all firm-months instead of using the first years of director
tenure to test the volatility-tenure relationship. This exercise is designed to ensure that the results
are not inflated by zooming in on a narrow window. The results indicate that volatility declines
significantly over the first three years following the arrival of new directors, but does not outside
this window.
Finally, a matched sample confirms that the drop in volatility exceeds what is observed
for firms that do not experience the arrival of a director. These findings are consistent with the
notion that the spike and subsequent decline in stock return volatility following director
appointments reflect the uncertainty about how much a new director will sway the fortunes of
their firm.
The model has implications about the fraction of overall volatility attributable to the
uncertainty about the board. Borrowing the methodology developed in Pan et al. (2015), the
estimates imply that the uncertainty about a new director’s ability accounts for about 7% of
overall stock return volatility on average. These estimates indicate that the arrival of corporate
directors generates substantial uncertainty.
Next, the learning slope is computed for each director-firm pair, by estimating the
average decline in volatility over the course of their tenure, over and above the variation in
volatility predicted by firm level covariates and macroeconomic factors. Performance (as
measured by the firm’s return on assets and abnormal stock returns three years post appointment)

120
clearly improves following the appointment of high learning slope directors, (i.e. directors with
learning slopes in the top decile), while it tends to stagnate for directors with learning slopes in
the bottom decile. The diverging performance paths for top and bottom learning slope deciles
provides suggestive evidence that the decline in return volatility reflects not only the extent to
which a director can make a difference but also the extent to which they participate in value
creation.
This learning-based framework can be used to revisit the literature on boards and test new
hypotheses on the importance of different governance attributes. The last section of the paper
studies how some director, board or firm characteristics affect the volatility-tenure relationship,
thereby testing which governance characteristics are important and under which circumstances.
The results suggest that chairmen and chairs of the compensation and audit committees
are expected to be more important contributors than the average director. This is not the case for
any of the other committee chairs. These findings shed new light on the channels through which
board members impact firm value. There is no evidence that independent directors have a
stronger effect on average. However, consistent with evidence in Masulis et al. (2012) and
Faleye et al. (2012), independent directors with industry expertise do. In addition, investors
expect independent directors joining firms with high monitoring needs to make a difference.
Female directors do not contribute to firm value as much as their male counterparts on
average. There is however evidence that as in the case of independent directors, female directors
make a difference when the firm’s monitoring needs are acute, which is consistent with evidence
in Adams et al. (2009) and Adams et al. (2012). Busy directors, directors with more board
experience and those with work experience in the industry have higher marginal value.

121
Boards dominated by a powerful CEO (i.e. CEOs with at least five years of tenure who
cumulate the titles of CEO, President and Chairman of the board) are de facto potentially more
entrenched. The results based on the learning-induced changes in return volatility indicate that
the ability to make a difference for entrenched boards is muted, consistent with Coles, Daniel
and Naveen (2014), who find that co-opted boards are less effective monitors. Among other
proxies, Coles, Daniel and Naveen (2015) use the percentage of directors with long tenures as a
proxy for groupthink. The authors find that groupthink is detrimental for firm value in dynamic
industries. Consistent with their finding, groupthink mutes directors’ marginal value. This result
supports growing voices in the market for the need of board refreshment.47 In addition, directors
joining small boards are more important and boards with a high Board Pay Slice, i.e. boards that
compensate their directors generously relative to their CEO, play a larger role.
Finally, the results indicate that directors matter more in small firms, in firms that have
had poor performance and in firms that operate in more complex industries. This last finding
corroborates the evidence in Coles, Daniel and Naveen (2015) who show that groupthink is
particularly detrimental in dynamic industries.
This paper contributes to the literature by providing evidence that providers of capital
expect corporate directors to play a role in the fortunes of their firm. Not all directors are equal
though and this paper proposes a new framework to estimate the importance of various
governance attributes. In addition, the estimates allow for a direct comparison of the extent to
which governance related uncertainty affects stock return volatility relative to management
uncertainty. More broadly, this paper also relates to the literature on learning in financial market.
47 In a speech from April 2015, Patrick S. McGurn, executive vice president and special counsel at ISS stressed the
importance of board refreshment in governance assessments.

122
2. Background and related literature
Part of the literature on boards of directors is summarized in Table 3-5. Early empirical
work focused on how board characteristics affect firm profitability. One of the questions most
often raised addresses the composition of the board and in particular whether more independent
directors increases firm performance or value (e.g. Hermalin and Weisbach, 1991; Bhagat and
Black, 2000). Much of the literature on boards examines the relationship between board
characteristics and board actions. For example, researchers extensively studied how the
composition of the board or its size impacts CEO turnover (Weisbach, 1988; Yermack, 1996;
Wu, 2000), takeover probabilities (Shivdasani, 1993), or CEO compensation (Core et al., 1999).
More recently, the literature has evolved to focus on the role of director networks and ties
(Barnea and Guedj, 2007; Kuhnen, 2009; Fracassi and Tate, 2012). Empirical studies have also
looked at the dynamics of board composition (Shivdasani and Yermack, 1999; Baker and
Gompers, 2000). Theoretical work includes Hermalin and Weisbach (1998) who use a model of
bargaining power between the board and the CEO, in which the structure of the board and its
actions are derived endogenously. Harris and Raviv (2008) present a model that determines the
optimal control of corporate boards as a function of the importance of insiders’ and outsiders’
information and the extent of agency problems.
Given the potentially endogenous nature of board turnovers, researchers have looked at
plausibly exogenous director appointments or departures (see among others Nguyen and Nielsen,
2010, Falato, Kadyrzhanova and Lel, 2014 and Ahern and Dittmar, 2012). A substantial part of
the literature, reviewed in Yermack (2006), studies abnormal returns around director
appointments. Recent articles using this methodology include Adams et al. (2012) who examine
market reactions to female directors’ appointments. They find that gender is value-relevant as on

123
average, the market reacts positively to the appointment of female directors, particularly for
firms that need more monitoring. Masulis et al. (2012) show that appointments of independent
directors with industry expertise are associated with a significant positive abnormal return, while
appointments of independent director without industry expertise are not. Fich and Shivdasani
(2006) find that the market reacts positively to the departure of busy directors.
Richardson et al. (2003) use a sample of directors with multiple directorships and find
evidence that supports the idea that directors are important in explaining firms' governance,
financial, disclosure and strategic policy choices. Larcker et al. (2013) investigate the role of
directors by studying the effects of social networks. They show that boards are important in
shaping firm performance whereas Fernau (2013) finds that the variation in firm performance is
partially attributable to director fixed effects. The study conducted by Schwartz-Ziv and
Weisbach (2013) provides an opportunity to understand the workings of boards and shows that
they do play an active management role when necessary.
In a recent paper, Denis, Denis and Walker (2015) build on the intuition in Hermalin and
Weisbach (2014) and show that in addition to the monitoring and advising roles put forth in the
literature, corporate boards also have an assessment responsibility: they have to learn about the
quality of the CEO and his match with the firm. Using spinoff transactions to explore the
formation of boards, the authors find that board composition depends on the need for CEO
assessment. Their results provide empirical evidence that learning about managerial competence
is an important determinant of the structure of corporate boards.
In this paper, the assessment is performed not by the board but by investors, who learn
about new directors. Using a Bayesian learning model, this paper provides estimates of the value
of directors and studies the value relevance of director attributes and board characteristics. The

124
theoretical framework derived in this paper draws on the work by Harris and Holmström (1982),
Murphy (1986), Gibbons and Murphy (1992), and Holmström (1999) in the context of learning
about managerial ability. Using a sample of CEO turnovers, Pan et al. (2015) implement the
logic set up by Pastor and Veronesi (2003) to study learning about CEO ability. These two
papers together lay the groundwork for the examination of the dynamics of stock return volatility
following a change in the composition of the board.
3. A learning model of board quality: theoretical framework and empirical implementation
3.1 Bayesian learning
Appendix 3-B develops the theoretical framework of rational learning that motivates the
empirical hypotheses in this paper. It is based on Pan et al. (2015) who study learning about
management. It features market participants who update their beliefs about the ability of newly
appointed directors. The model serves the purpose of characterizing the relationship between
uncertainty surrounding the appointment of new directors and stock price volatility.
The model generates the following predictions:
1) Volatility decreases in a convex manner over director tenure.
2) Return volatility increases with uncertainty about ability.
3) Return volatility increases with the marginal return to ability of directors.
By testing these predictions, the goal of this article is to uncover what drives learning
about director ability, thereby shedding light on the importance of corporate boards.

125
3.2 Empirical design
3.2.1 Regression model
The predictions from the learning model are tested using regression models that estimate
the relation between the tenure of a newly appointed director and stock return volatility. The
regression model is characterized by the following equation:
(1)
where is a board fixed effect for board k of firm i,
is a function of director j's tenure, allowing for a decreasing and
convex relationship between volatility and tenure as predicted by the model,
is a set of firm level control variables,
is the calendar-month fixed effect.
The null hypothesis is that tenure and volatility are not related (H0: is insignificant).
The alternative hypothesis is that the governance-related component of stock return volatility
decreases as the market learns about the ability of a director (H1: is significantly negative).
Regressions include board fixed effects to account for unobservable board and director
characteristics. For example, directors with higher ability may self-select to serve on larger firms
and the dynamics of information sharing and groupthink may vary across different board
compositions. Board fixed effects control for such time-invariant board and director
characteristics. Regressions with board fixed effects thus estimate learning about director ability
from the time-series variation in volatility within a particular composition of the board. In
addition, all regressions include a month fixed effect to account for macroeconomic factors that
affect the volatility of all firms. Standard errors are clustered at the firm level.

126
3.2.2 Data sources and descriptive statistics
The sample consists of 2,228 firms from the intersection of S&P 1,500 firms in BoardEx,
CRSP and Compustat from 2000 to 2014. It comprises 18,579 directors and 13,074 new director
appointments.
The relationship between director tenure and stock return volatility is estimated in
monthly regressions following director appointments using two measures of volatility. Realized
volatility is the standard deviation of daily returns within a month. Idiosyncratic volatility is the
standard deviation of the residuals of a Fama-French three-factor model as in Ang et al. (2006).
Appendix 3-A reports the definition of all variables.
Table 3-1 presents summary statistics. Panel A reports director and board summary
statistics at the firm-year level. The average board consists of 9.4 directors, 12% of whom are
women. On average, 19% of board members have experience as CEO of a public company and
10% have previously had a directorship in the same industry. The average director is 61 years
old and has been a director for 6.5 years. There is a new director on average every two years.
The average director stays for over eleven years. On average, 79% of board members are
independent. A board is “entrenched” if the CEO combines the titles of Chairman and President
and has been in office for at least five years. Using this definition, 35% of boards are considered
entrenched. Coles et al. (2015) use the percentage of directors with tenure greater than nine
years as a proxy for groupthink. In this sample, 43% of board members are prone to groupthink.
On average, 15% of board members sit on three or more boards. Board Pay Slice is defined as
127
the sum of independent directors’ compensation over CEO total compensation, and averages
25%.48
Statistics for the two volatility measures and betas are reported at the firm-month level in
Panel B of Table 3-1. Average monthly realized (idiosyncratic) volatility is 11.7% (8.6%). Firm
level financial statistics are reported at the firm-year level in Panel C.
[Insert Table 3-1]
4. Empirical relationship between volatility and director tenure
4.1 Full sample
The model implies that as the market learns about directors, its update of its assessment
of their quality is reduced, and hence stock return volatility declines. This decline occurs as
governance-related uncertainty dissipates as investors become more acquainted with their board.
Figure 3-1 graphs the relationship between monthly average idiosyncratic volatility and director
tenure for three samples of newly appointed directors. Panel A shows the volatility pattern for all
newly appointed directors. In Panel B, only directors appointed solo are included (i.e. no other
director are appointed over the six months period around their appointment). In Panel C, there
are no other director appointments at least two years before and two years after the new director
joins. For the three samples, volatility sharply increases at time zero, i.e. the arrival of new
directors.
If directors are relevant for firm value, their arrival adds a random variable to the firm’s
value and as investors discover what that random variable is, return volatility declines. The spike
48 This is consistent with figures for the average S&P500 firm which spent $2.2 million in 2012 in basic board
compensation and $10.7 million on average to compensate its CEO. Source: http://www.bloomberg.com/news/2013-
05-30/board-director-pay-hits-record-251-000-for-250-hours.html

128
in volatility suggests that the arrival of a new director may be viewed as a positive shock to the
uncertainty about future profitability. The higher uncertainty pushes up volatility through a
mechanism described in Pastor and Veronesi (2003). The idea is that when there is a new
director, the effect of any news is amplified as the market updates both the effect of the news and
their assessment of the director’s quality, and consequently their expectation of future events and
their effect on firm value. This upswing is followed by a decline in volatility, as the uncertainty
progressively resolves and investors no longer update their valuation of the firm according to
their assessment of the new director's ability.
[Insert Figure 3-1]
Three functional forms of director tenure are specified to determine whether the empirical
relation between volatility and director tenure is consistent with the theoretical framework: a
quadratic regression model, a logarithmic specification and a reciprocal specification. The
convexity of the volatility-tenure relationship can be verified with all three specifications. Two
restrictions are imposed in all specifications: appointments must not overlap with a CEO
turnover within a year and directors must remain on the board for at least five years to ensure
that the decline in volatility is not driven by the high volatility in firms with high director
turnover. Panel A of Table 3-2 presents regression results for the three functional forms and for
the two volatility measures. All new director appointments satisfying the above two restrictions
are included. All regressions estimate the volatility-tenure relation over the first five years of
tenure. In Panel B, the tenure variables are interacted with an indicator variable equal to one
when directors are appointed solo, i.e. no other directors are appointed during the six months
period around their appointment. In Panel C, the tenure variables are interacted with an indicator

129
variable equal to one when there is no other directors appointed during the two year period
preceding the appointment as well as during the two year period following the appointment.
All regressions control for firm level factors that affect the firm’s return volatility. The
coefficient estimates for the control variables are significant in the expected direction. In
addition, when the dependent variable is realized volatility, the regressions include the market
beta, SMB beta and HML beta to control for factors that affect the volatility in average dividend
growth.
In Panel A, the estimated coefficients on Tenure are negative and statistically significant
for both measures of volatility, regardless of the functional form used. The coefficients on
Tenure2 are positive and statistically significant, which indicates that volatility declines at a
faster rate at the beginning of director tenure. There is therefore a negative and convex
relationship between stock return volatility and director tenure in the data, which is in line with
the predictions of the learning model.
[Insert Table 3-2, Panel A]
In Panel B, the estimated coefficients on Tenure are negative and almost always
statistically significant. They are also larger in absolute value when compared to those in Panel A
and the estimated coefficients on the interaction terms are positive. This suggests that directors
appointed solo are associated with a smaller decline in volatility over their tenure on average.
This is not surprising and supports the view that more directors joining adds more uncertainty.
However, the estimated coefficients on the interaction terms are not statistically significant,
suggesting that even single appointments are meaningful.
[Insert Table 3-2, Panel B]

130
Similar results are shown in Panel C of Table 3-2, where the tenure variables are
interacted with an indicator variable equal to one when there is no other directors appointed
during the two year period preceding the appointment as well as during the two year period
following the appointment.
[Insert Table 3-2, Panel C]
The results in the three panels of Table 3-2 indicate that investors behave according to the
predictions of the learning model when updating their assessment of a new director's ability.
4.2 Samples of plausibly exogenous director appointments
A potential alternative interpretation for the results derived above is that firms may
appoint new directors in times of crisis, when volatility is high. For example, poor firm
performance may prompt the need to bring a fresh perspective on the board. In addition, board
changes frequently occur concurrently with management turnover (see Hermalin and Weisbach,
1988 and Denis and Sarin, 1999), which may also coincide with a period of high volatility. It is
therefore important to identify changes in board composition that are unlikely to occur as a
response to corporate turbulences to ensure that the patterns documented in the previous section
hold for exogenous director appointments.
In the tests below, only director appointments occurring when the firm is performing well
in a low volatility environment are included. Specifically, the firm’s stock return performance
the year preceding the appointment must exceed that of the S&P 500 and its average monthly
stock return volatility over the three months preceding the appointment must be inferior to its
average monthly return volatility over the previous two years. Director appointments must not
overlap with a CEO turnover within a year and directors must remain on the board for at least
five years.

131
The first subsample of exogenous director appointments is constructed by selecting
appointments that were specifically designed to ensure that the board would satisfy the new
board independence requirements. Governance reforms in the early 2000s led the NASDAQ and
NYSE exchanges to impose stricter listing requirements regarding the independence of corporate
boards.
The introduction of new exchange listing requirements has been used in the literature to
study the effect of board structure on firm value (Wintocki, 2007; Duchin et al. 2010), CEO
compensation (Chhaochharia et al. 2009), and firm transparency (Armstrong et al. 2014).
The sample of exogenous appointments is constructed by restricting appointments to
those that resulted in the board complying with the new 50% independence requirement when it
did not prior to that director's appointment. A director appointment therefore qualifies for this
sample if the director joins the board between 2002 and 2005 and the firm previously did not
comply with the 50% independence requirement.
The second exogenous sample consists of newly appointed directors who replace
directors who passed away or who retired. To construct the retiree replacement sample, a new
director is included if she joins the board within six months following the departure of a director
who is older than 70. Fracassi and Tate (2012) show that director retirements are typically not
related to firm conditions. This sample is augmented with directors who served simultaneously
on multiple boards and left all of their boards within two years49. These directors arguably left
the boardroom for reasons exogenous to the situation of one particular firm. Directors who
retired due to health reasons before reaching the maximum age requirement would be included in
this subsample. Director deaths are identified in BoardEx.
49 Not including these directors does not affect the results.

132
Panel A of Table 3-3 shows regression results for the various subsamples of exogenous
director appointments. For brevity, only results with the quadratic functional form and
idiosyncratic volatility are shown, but the results also hold for the logarithmic and reciprocal
specifications and realized volatility. Specification 1 in Table 3-3 provides regression results for
the two subsamples pooled together. Specification 2 uses only the exchange mandated
appointments while Specification 3 uses only the replacement directors. The results are
unaltered: volatility decreases over the tenure of newly appointed directors and does so at a
decreasing rate.
[Insert Table 3-3, Panel A]
To confirm that the documented relation between director tenure and volatility is not
affected by the endogeneity of director appointments, Specifications 3 to 6 use the full sample of
director appointments and Tenure is interacted with an indicator variable for each exogenous
appointment type. The estimated coefficients on the interaction terms are insignificant. This
suggests that there is no significant difference in the volatility-tenure relationship between the
full sample and the exogenous samples. The results in the previous section are therefore unlikely
to be driven by the potential endogeneity of director appointments.
Panel B of Table 3-3 reports regression results for the subsamples of exogenous director
appointments when the departing and replacing directors have a high similarity score. Such a
score is constructed by looking at six attributes: gender, generation, job expertise, level of board
experience, previous directorship in the same industry and job experience in the same industry.
Two directors are considered to have a similar profile if they share at least four attributes out of
the six, which is the median score for all incoming-departing director pairs for death or
retirement replacements when the firm operates in an environment of good stock return
133
performance and low return volatility. Appendix 3-C provides details on the construction of the
similarity score. Panel B of Table 3-3 uses only exogenous appointments occurring when the
firm is performing well, its stock return volatility is low, the appointment does not overlap with a
CEO turnover and the departing and incoming directors have a very similar profile. The
conclusion from this exercise remains the same: volatility declines over the tenure of newly
appointed directors.
[Insert Table 3-3, Panel B]
4.3 Additional tests
The evidence above is consistent with learning-induced declines in volatility and supports
the hypothesis that directors make a difference in the fortunes of their firm. Importantly, this
pattern does not appear to be the product of the potential endogeneity of director appointments.
Follow-on tests provide additional evidence that investors learn about incoming directors.
4.3.1 Young vs. seasoned boards
If the decline in stock return volatility reflects the resolution of governance related
uncertainty, we should observe a stronger decline for young boards than for seasoned boards.
Consistent with this idea, stock return volatility declines sharply over the average board tenure
for relatively young boards but does not decline for mature boards, even after controlling for firm
age and board size. If the documented volatility patterns were due to the endogenous nature of
director appointments or to directors learning about their job, rather than investors learning about
directors, there would be no reason to expect different patterns based on the average tenure of
board members. If anything, we should expect it to be easier for directors to learn to do their job
if the board is more mature and can more effectively coach a newly appointed director.

134
Panel A of Table 3-4 shows the estimated coefficients for the volatility and average board
tenure relationship for all boards in Specification 1, for young boards in Specification 2 and for
seasoned boards in Specification 3. Boards are categorized into terciles based on the average
tenure of their members. Young (seasoned) boards are defined as those whose members' average
tenure is in the first (third) tercile.
[Insert Table 3-4, Panel A]
Figure 3-2 graphs firm volatility as a function of average director tenure for young and
seasoned boards in Panels A and B, respectively. It shows a distinct decline in volatility as young
boards become more mature. In contrast, there is no apparent relation between average board
tenure and volatility for seasoned boards.
[Insert Figure 3-2]
4.3.2 All firm-months, ex-ante uncertainty and professional directors
Specification 1 in Panel B of Table 3-4 shows regression results using all firm-months as
opposed to restricting the sample to the first years of director tenure. First 3 yrs is an indicator
variable equal to one for the first three years of tenure and is interacted with Tenure. The purpose
of this exercise is to broaden the analysis to ensure that the relation between return volatility and
tenure is not inflated when the estimation is restricted to the first years of tenure.
The coefficients on the interaction term is negative and significant. Therefore, volatility
declines significantly more over the first three years of tenure than over other periods. Note that
the estimated coefficient on Tenure is insignificant, which indicates that volatility does not
significantly decrease over tenure outside the first three year window.
[Insert Table 3-4, Panel B]

135
Learning by market participants should be more important when prior uncertainty about
the new director is high. This is an intuitive prediction derived from the model. To test whether
the decline in volatility is reduced when the new director is well-known, High uncertainty is an
indicator variable equal to one for directors who do not have previous board experience and do
not have experience as CEO. Low uncertainty is an indicator variable equal to one for directors
who have experience as the CEO of a public firm and have served on at least four corporate
boards prior to joining this one.
Because the ex-ante uncertainty of a director is constant, regressions using the level of
ex-ante uncertainty include firm fixed effects rather than board fixed effects. Specifications 3 and
4 in Panel B of Table 3-4 show that stock return volatility declines significantly more over
director tenure for directors characterized by high ex-ante uncertainty. Although the estimated
coefficient on the interaction term does not satisfy traditional levels of significance, it is positive
which shows that well-known directors are associated with smaller declines in return volatility
over their tenure. Because low initial uncertainty corresponds to more visible directors, this
exercise rules out the interpretation that larger declines in volatility reflect more visible directors.
Specification 5 in Panel B of Table 3-4 reports regression results for “professional”
directors. The director learning alternative explanation is grounded in the idea that directors
come on the board having little idea how to do their job, thus creating a lot of noise around
their decisions. Directors get better over time and develop skills to produce better decisions in
the interest of the company. The analysis exploits the fact that some directors are better equipped
than others to produce better decisions when joining new boards: directors with experience in the
industry who have held previous directorships will arguably be quicker to adapt to the production
function of a particular firm and should be associated with a smaller decline in return volatility

136
over their tenure. The investor learning hypothesis predicts the opposite: controlling for how
much the market knows about these directors, directors with industry expertise with a history of
directorships should be a wealth of resources for the board and should be more relevant for firm
value. Controlling for the level of ex-ante uncertainty about the ability of directors (using
director age, number of previous boards, number of previous jobs and whether the director has
been a CEO of a public company), Specification 5 in Panel B of Table 3-4 supports the investors
learning hypothesis: professional directors are associated with bigger declines in stock return
volatility over their tenure.
4.3.3 Matched sample
A matched sample test is performed to ascertain that the drop in volatility exceeds what
would be observed in firms that do not experience the arrival of new directors. Firms are
matched based on industry and size. Each firm belongs to one of ten industries based on the
Fama-French ten-industry classification. Each firm in the treated group is assigned to a control
firm, which is the closest in size (assets) and operates in the same industry. The control firm
must not experience a director appointment at least one year prior and one year after the
appointment of a director in the treated firm.
Regressions similar to those in Panel A of Table 3-2 are run for the matched sample. If
the decline in volatility for the treated firms indeed reflects learning about incoming directors by
market participants, we should not observe a systematic decline in volatility for the control firms.
Results are reported in Panel C of Table 3-4. As expected, there is no decline in the stock return
volatility of control firms following the appointment of directors on the board of treated firms.
[Insert Table 3-4, Panel C]

137
4.4 The importance of directors
4.4.1 How much do directors matter?
Pan et al. (2015) estimate that around a CEO turnover, the uncertainty about the new
CEO accounts for about a quarter of overall stock return volatility. This section uses Pan et al.'s
estimate as a benchmark. CEOs undoubtedly have more impact on firm value than directors. But
how much more is an open question. How do investors perceive the importance of directors
relative to that of the CEO?
This section directly relies on the methodology derived in Pan et al. (2015), which is
summarized in Appendix 3-D. It uses estimates of the average decline in volatility over director
tenure, the average volatility in corporate dividends (σ) and the average volatility at the time
directors joins (Vol0).
The average estimated decline in volatility over the first three years of tenure is 1.5%, the
average volatility of corporate dividends (σ) is 23% and the average realized annual volatility
when a director joins (Vol0) is 38%. Therefore, on average the uncertainty about new directors
accounts for about 7% ( of return volatility when
there is a new director, which implies that on average, the governance related uncertainty
associated with the arrival of a new director is about a third of the uncertainty associated with
new leadership (Pan et al., 2015). The authors however do not account for learning about
directors, which may potentially affect their estimates of learning about the CEO, in particular
when new directors join the board around CEO turnover.

138
4.4.2 Importance of directors and value creation
The results derived above are consistent with the predictions of the learning model and
imply that directors are relevant for firm value. While the model is agnostic about the sign and
cannot speak to whether a larger decline in volatility implies that the director will be a “better”
director, this is potentially an interesting question in itself. How does the average performance of
firms after the appointment of directors for whom we observed a large decline in volatility over
their tenure compare to the performance of those that appointed directors associated with small
decline in volatility? The learning slope is a metric for each incoming director measuring the
average decline in volatility over the first years of her tenure.
Pan et al. (2015) construct learning slopes for CEOs and although the intuition is similar
here, the execution is different. Specifically, whereas Pan et al. regress return volatility on CEO
tenure in individual regressions for the first 36 months in office and use the estimated coefficient
on tenure as a measure of the learning slope, idiosyncratic volatility is regressed on tenure
controlling for factors expected to affect the level of volatility:
(2)
With the idiosyncratic volatility of firm i at time t,
the board fixed effect for board k of firm i,
a vector of firm level covariates: ln(assets), M/B, ROA, dividend payer,
leverage,
the tenure of director j on the board of firm i at time t,
the calendar-month fixed effect.
Residual volatility is then defined as :

139
(3)
Residual volatility is then regressed on tenure in individual regressions for each director-
firm pair for the first three years of director tenure. This procedure produces estimates of the
average decline in volatility over the tenure of the director, over and above the variation in
volatility predicted by firm covariates and macroeconomic factors:
(4)
The coefficient estimates are multiplied by (-1) for ease of interpretation and
normalized by their cumulative distribution function to yield a ranking between 0 and 1. They
are referred to as the learning slope for each director, for each board she joins.
Figure 3-3 shows the performance paths as measured by return on assets for high learning
slope vs. low learning slope directors. Performance clearly improves following the appointment
of directors in the top learning slope decile, while it tends to deteriorate for directors in the
bottom learning slope decile.
[Insert Figure 3-3]
Similarly, Figure 3-4 reports the performance paths for high and low learning slope
directors as measured by the abnormal stock return performance relative to the firm’s industry
over the three year period following their appointment. Again, directors with high learning slope
are associated with improved performance. Taken together, these results provide suggestive
evidence that high learning slope directors are not only more important, as the learning model
suggests, but are actually better agents for shareholders.
[Insert Figure 3-4]
The results in this section indicate that governance-related uncertainty accounts for a
substantial percentage of overall stock return volatility. Furthermore, there is suggestive

140
evidence supporting the idea that larger declines in volatility can not only be interpreted as
directors making a bigger difference, but also that this difference has positive effects. Taken
together, these findings suggest that directors matter and are not simple rubber stampers. These
results have important implications for governance research inasmuch as they help us better
understand the value of board members and provide an estimate of the overall importance of
governance in corporations.
5. The marginal return to ability of directors
5.1 Prior empirical evidence on board and director characteristics
Hermalin and Weisbach (2003), Yermack (2006) and Adams et al. (2010) provide
surveys of the literature on boards of directors. One of the most studied features related to board
composition is the degree of board independence. Weisbach (1988) shows that CEO turnover is
more sensitive to firm performance for more outsider-dominated boards. However, Hermalin and
Weisbach (1991) and Bhagat and Black (2000) report no relation between the percentage of
outside directors and firm value (as measured by Tobin’s Q) or accounting measures of
performance. On the other hand, Brickley, Coles and Terry (1994) find a positive association
between the percentage of outside directors and announcement returns following the adoption of
poison pills. Their findings are consistent with the hypothesis that outside directors act in the best
interest of shareholders. Harris and Raviv (2008) propose a model in which insider-dominated
boards may be optimal. Overall, the evidence in the literature on the value of independent
directors is mixed.
Concerns about the size of corporate boards are described in Lipton and Lorsch (1992)
and in Jensen (1993). Yermack (1996) and Wu (2000) provide detailed evidence that smaller

141
boards are beneficial for firm value. These papers document that small boards are more likely to
replace CEOs based on poor performance and that smaller boards are associated with increased
CEO pay-for-performance.
A number of studies have examined the effect of CEO power on the ability of the board
to perform its role. Hermalin and Weisbach (1998) argue that CEOs are likely to increase their
bargaining power vis-à-vis the board over the course of their tenure, as their perceived ability is
higher given that they repeatedly passed the replacement option test. Shivdasani and Yermack
(1999) find that powerful CEOs, as measured by the extent to which they are involved in the
board nomination process, are able to select less independent boards. Baker and Gompers (2000)
find similar results when CEO power is proxied by CEO tenure. Coles et al. (2014) show that co-
opted boards are less effective monitors, as evidenced by lower pay-for-performance and lower
sensitivity of CEO turnover to performance.
The literature has also studied the effect of personal director attributes on either firm
value or some measure of performance or board actions. In particular, a number of empirical
studies examine the effect of director gender. The evidence on the value of female board
members is mixed. Adams and Ferreira (2009) show that women are better monitors, although
increased monitoring comes at the cost of lower firm performance. On the other hand, using data
on mandatory announcements of director appointments, Adams, Gray and Nowland (2012) find
that investors value female directors more than their male counterparts and Schwartz-Ziv (2015)
shows that gender-balanced boards are more active. In particular, she finds that a critical mass of
at least three female directors on a board changes the board dynamics, especially in times when
the CEO is being replaced. Using the 2003 law on female board representation in Norway, Ahern
and Dittmar (2012) find that the quota was associated with deteriorating performance.

142
Researchers have studied the effect of the number of current directorships and provided
mixed evidence as to whether busy directors are beneficial or detrimental to firm value. On the
one hand, additional board seats bring experience and business connections that are potentially
useful resources to be passed on to the firm’s management. On the other hand, overly committed
board members do not have time to be effective monitors or deeply understand the business.
Their contribution is therefore potentially adversely affected. Ferris et al. (2003) report positive
announcement returns to the appointments of busy directors. In contrast, Fich and Shivdasani
(2006) find that investors react positively to the departure of busy directors, thus suggesting that
busyness is not a desirable director attribute. Core et al. (1999) show that busy outside directors
are associated with increased CEO compensation. Recently, Field, Lowry and Mkrtchyan (2013)
shed some light on the subject by providing evidence that the firm’s life cycle is an important
factor to consider when examining the value effect of busy directors. The authors argue that
while large established firms benefit relatively more from monitoring than advising services on
the part of directors, young firms derive more value from their network and experience. In line
with this argument, the authors show that busy directors are beneficial for younger firms because
they rely more on advising than monitoring, and detrimental for large corporations because they
require the opposite.
This succinct review of the literature on board attributes highlights that the way the
literature traditionally studies boards of directors is to select a board or director attribute,
examine its effect on firm value or some measure of performance or board action and conclude
that boards or directors with this attribute are better or worse than those without. In this paper,
the analysis relies on the learning-based framework to revisit part of this literature and offers
new results on the importance of some governance attributes. Specifically, this paper exploits the

143
cross-sectional variation of the learning-induced changes in return volatility following the arrival
of new directors. The learning model implies that a higher marginal return to ability is associated
with larger declines in stock return volatility. Therefore, examining the effect of firm, board and
individual attributes on the volatility-tenure relationship is a convenient novel approach to
studying the importance of directors. A summary of the findings is included in Table 3-5,
alongside a comparison with the results previously derived in the literature.
[Insert Table 3-5]
5.2 Cross-sectional analysis
The learning framework proposed in this paper offers an alternative method to measure
the expected contribution of different kinds of directors and boards. The model shows that the
uncertainty about director ability decreases at a predetermined rate over time due to Bayes' rule,
and that this rate is faster for higher ex-ante levels of uncertainty. Hence, after controlling for ex-
ante uncertainty, cross-sectional analysis of declines in return volatility provides estimates of
directors' marginal return to ability. In other words, the magnitude of the decline in volatility
over the tenure of a director reflects her marginal value. Panels A and B of Table 3-6 report
regression results with interaction variables to document the effect of director attributes on the
decline in volatility following director appointments. Controls for ex-ante uncertainty include
director age, number of previous jobs, number of previous board seats and whether the director
has experience as the CEO of a public company. Directors appointed within a year around a
CEO turnover are excluded. The median (mean) ratio of the average return volatility over the
three month period prior to the arrival of a new director to the average return volatility over the
two year period preceding the director appointment is 0.94 (1.00). This sample of director
appointments is thus unlikely to coincide with fundamental shifts in strategy.
144
5.2.1 Director characteristics
5.2.1.1 Position on the board
In Specification 1 in Panel A, the coefficient estimate on the interaction term is negative
and significant. This suggests that investors expect chairmen to be important elements of the
board and have more impact on firm value than the average director. Note that CEOs are not
included in the sample and that directors appointed within a year of a CEO turnover are
removed. This result is therefore not attributable to chairmen cumulating the CEO and chairman
functions.
[Insert Table 3-6, Panel A]
Specification 2 investigates the role of independent directors. The literature on director
independence provides mixed evidence regarding the effect of independent directors on firm
value. Researchers have therefore looked at alternative settings (Choi et al., 2007) and alternative
definitions of independence (Fracassi and Tate, 2012). In this sample, independent directors (as
traditionally defined in the literature) are not expected to matter more, as evidenced by the
insignificant coefficient on the interaction term. However, Specification 3 provides evidence that
independent directors with industry expertise do have a stronger effect on value, consistent with
evidence in Masulis et al. (2012) and Faleye et al. (2012). In addition, Specification 4 shows that
when the firm has high monitoring needs, independent directors are expected to be more
important. Firms with high monitoring needs are large firms with an entrenched board.
Specification 5 provides insights into which board committees are more important by
looking at the volatility-tenure relationship for committee chairs. Chairs of the audit and
compensation committees appear to be particularly relevant.
5.2.1.2 Personal attributes

145
Panel B of Table 3-6 reports the effect of personal attributes on the learning-induced
decline in volatility. Adams and Ferreira (2009) show that female directors are better monitors.
However, they find that the additional monitoring comes at the cost of lower firm performance,
especially for well-governed firms which do not need extensive monitoring. The results from the
learning-based approach suggest that for the average firm, female board members do not
contribute to firm value as much as their male counterparts. However, similarly to the case of
independent directors, female directors appear to be especially important when the firm has high
monitoring needs, as evidenced by the negative and significant interaction term in Specification
2. This result provides evidence that female directors are particularly valuable when the need for
monitoring services is acute.
[Insert Table 3-6, Panel B]
The literature on busy directors provides mixed evidence (Fich et al., 2006 and Ferris et
al., 2003). Using the learning-based approach, the results indicate that busy directors are on
average more important contributors.
Specifications 4 and 5 show that directors with previous board experience in the same
industry and directors with work experience in the same industry have higher marginal value.
5.2.2 Board characteristics
This section relies on the premise that different types of boards have varying marginal
contributions to firm value. In other words, some firms may provide their directors with an
environment conducive to leveraging their ability as board members, while others may impede
directors to engage fully, play their role and make a difference. For example, investors may be
skeptical when a new director joins an entrenched board as they might not expect him to be able
monitor management effectively. CEOs who have been in place for multiple years gained more

146
bargaining power over their board (see Hermalin and Weisbach, 1998), so that the balance of
power rests in favor of the CEO. Fracassi and Tate (2012) consider CEOs who cumulate the
titles chairman of the board and president to be powerful CEOs. The results indicate that
investors in firms with captured boards, which are prone to more agency costs, expect their
directors to face obstacles in their ability to sway the fortunes of the firm.
[Insert Table 3-6, Panel C]
Coles et al. (2015) use the fraction of directors with long tenures as a proxy for
groupthink, and find that groupthink has a negative effect on firm value for firms in dynamic
industries. Consistent with their findings, this proxy for groupthink is associated with decreased
marginal value.
Investors should expect directors in firms that provide generous compensation to its
board members relative to its CEO to contribute more. To test this hypothesis, the variable Board
Pay Slice is constructed by dividing the sum of independent director compensation by CEO total
compensation. High BPS is an indicator variable equal to one for boards in the top BPS quartile.
The negative significant coefficient on the interaction term suggests that directors joining better
compensated boards are expected to have significantly more impact. Yermack (1996) and
Eisenberg et al. (1998) show that smaller boards are associated with higher firm value. Large
Board is an indicator variable equal to one for boards with more than ten members, which is the
sample mean. The results based on the learning framework suggest that directors sitting on large
boards are associated with lower marginal value.
These findings depict how board characteristics affect investors' expectations regarding
the contribution of their directors. In particular, the results in this section highlight that market
participants believe that corporate directors are more important when their boards are small, not

147
entrenched, not prone to groupthink and compensate their directors generously relative to the
CEO.
5.2.3 Firm level characteristics
Panel D of Table 3-6 reports the effect of firm level attributes. Large Firm is an indicator
variable equal to one for firms with total assets in the top quartile. The positive coefficient on the
interaction term in Specification 1 shows that directors are less relevant in large firms.
[Insert Table 3-6, Panel D]
Directors arguably play a more central role for firms experiencing poor performance.
Poor performance is an indicator variable equal to one for firms with a stock return performance
inferior to that of the S&P500 over the one year period preceding the appointment. The estimates
indicate that directors are more important for firms with weak performance.
The learning-induced decline in volatility varies with industry complexity. The
technology (consumer durables) industry is arguably a relatively more (less) complex and human
capital intensive industry which faces greater (fewer) sources of risk. Firms in the technology
(consumer durables) industry exhibit larger (smaller) valuation updates upon the arrival of new
directors, thereby suggesting that directors are especially (less) valuable for firms that operate in
more (less) complex environments.
Using the learning-based framework, this section revisited part of the literature on boards
and confirmed prior findings. It shed new light on the importance of some governance attributes.
The results are summarized in Table 3-5.

148
6. Conclusion
This paper is based on the idea that part of a firm's stock return volatility is related to the
uncertainty about its governance. As governance-related uncertainty dissipates, the governance
component of volatility declines. By relying on the theory to relate the decline in volatility to the
marginal return to ability of directors, this article explores the importance of governance
attributes.
The estimates provide empirical support for the view that directors matter. Results
suggest that governance related uncertainty accounts for about 7% of stock return volatility when
a new director joins the board, which is a third of the estimate for new leadership estimated by
Pan et al. (2015). The learning-based decline in volatility documented in this paper is shown not
to be driven by endogeneous director appointments and is independent from learning about the
CEO. Going beyond the overall decline in volatility to study whether directors make a difference,
the learning-based approach can be used to estimate the importance of different kinds of
directors and boards.
Chairmen, chairs of the audit and compensation committees, busy directors, independent
directors with industry expertise and those joining firms with high monitoring needs have higher
marginal returns to ability. While female directors do not have as much impact as their male
counterparts on average, the evidence suggests that they are particularly important when the
firm's monitoring needs are acute.
Large boards, entrenched boards and boards prone to groupthink impede their directors'
ability to influence the firm’s actions, while directors joining better compensated boards are
expected to be more important. Directors are more important when their firms recently
experienced poor performance, in small firms and firms that operate in more complex industries.

149
The findings in this paper help delineate the channels through which directors can make a
difference. In addition, the findings highlight that the importance of various governance
attributes is highly context-specific. Taking the heterogeneity in firms' governance optimization
problem into account is a necessary step to expand our understanding of the role governance.
The learning-based framework may provide a potentially fruitful approach to examine this issue.

150
Figure 3-1 Volatility and Director Tenure

151
Figure 3-2 Volatility and Average Board Tenure
Boards are categorized into terciles based on the average tenure of their members

152
Figure 3-3 Learning Slopes and Firm Performance
This figure shows the performance path for the directors with high learning slopes (highest
deciles) and those with low learning slopes (smallest deciles)
Figure 3-4 Learning Slopes and Stock Performance
This graph shows for each month of tenure, the average forward looking one year stock return
relative to the firm's industry.

153
Table 3-1 Descriptive Statistics
This table provides summary statistics for board characteristics, volatility and beta variables as well as
firm financial attributes. Board characteristics and financial attributes are at the firm-year level whereas
market variables are at the firm-month level. The definition of all variables is in Appendix 3-A.
Panel A: Director and Board Characteristics
Obs Mean
Std.
Dev. 25% Median 75%
Tenure
24,870 6.45 3.50 3.96 6.07 8.46
Time between appointments
20,866 1.83 1.28 1.05 1.50 2.17
Time stay on board
24,870 11.26 4.44 8.26 10.87 13.91
Female
24,805 0.12 0.14 0.00 0.10 0.19
Age
21,928 61 6 58 62 65
Independent
24,870 0.79 0.19 0.71 0.84 0.93
Board size
24,870 9.38 2.62 7.50 9.00 11.00
Nomination member
23,678 0.42 0.32 0.00 0.43 0.61
Compensation member
23,678 0.52 0.26 0.38 0.50 0.67
Audit member
23,678 0.56 0.23 0.42 0.59 0.68
Member all three committees
23,678 0.12 0.24 0.00 0.00 0.14
Network size
24,847 850 528 476 753 1101
Busy
24,870 0.15 0.19 0.00 0.09 0.22
Entrenched board
19,474 0.35 0.47 0.00 0.00 1.00
Board Pay Slice
6,499 0.25 0.30 0.07 0.15 0.34
Other public directorships, total
24,870 3.19 1.52 2.02 3.00 4.04
Other public directorships, current
24,870 1.99 0.81 1.43 1.87 2.37
Tenure superior 9 years (groupthink)
24,870 0.43 0.30 0.20 0.43 0.62
CEO experience
24,870 0.19 0.20 0.00 0.15 0.31
CFO experience 0.07 0.12 0.00 0.00 0.14

154
24,870
Professional directors
24,870 0.05 0.11 0.00 0.00 0.18
Previous directorship in same industry
24,870 0.10 0.17 0.00 0.00 0.15
Panel B: Market Variables
Obs Mean
Std.
Dev. 25% Median 75%
Realized volatility
290,015 11.43 8.06 6.41 9.30 13.84
Idiosyncratic volatility
290,015 8.44 6.42 4.51 6.74 10.31
Market beta
290,015 1.05 1.04 0.57 1.01 1.48
SMB beta
290,015 0.64 1.57 -0.18 0.51 1.34
HML beta
290,015 0.22 2.08 -0.70 0.19 1.13
Panel C: Firm Level Variables
Obs Mean
Std.
Dev. 25% Median 75%
Firm age
23,016 23.06 18.71 10.00 18.00 33.00
G-index
10,391 9.39 2.56 8.00 9.00 11.00
Ln (assets)
24,864 7.66 1.76 6.42 7.54 8.76
Dividend payer
24,334 0.54 0.50 0 1 1
Leverage
24,773 0.19 0.19 0.02 0.15 0.29
M/B
24,843 3.41 52.37 1.42 2.15 3.49
ROA
24,862 0.04 0.14 0.01 0.04 0.08

155
Table 3-2A Volatility and Director Tenure – Panel A
This table reports regression results for the volatility-director tenure relation estimated with three
functional forms for two measures of stock return volatility, realized volatility and idiosyncratic volatility.
The first five years of director tenure are used in all specifications. The sample does not include CEOs
and excludes all directors appointments overlapping with a CEO turnover over a one year period. All
model specifications include board fixed effects as well as month fixed effects. Standard errors are
clustered at the firm level. The definition of all variables is in Appendix 3-A.
(1)
Idiosyncratic
Volatility
(2)
Realized
Volatility
(3)
Idiosyncratic
Volatility
(4)
Realized
Volatility
(5)
Idiosyncratic
Volatility
(6)
Realized
Volatility
Tenure -0.099*** -0.119**
(-2.622) (-2.503)
Tenure2 0.018** 0.022**
(2.407) (2.289)
Ln(1+tenure) -0.045** -0.050**
(-2.546) (-2.337)
-1/(1+tenure) -0.135** -0.152**
(-2.501) (-2.341)
Ln(assets) -0.940*** -1.064*** -0.942*** -1.067*** -0.942*** -1.066***
(-5.814) (-5.232) (-5.821) (-5.242) (-5.820) (-5.241)
Dividend Payer -1.154*** -1.314*** -1.152*** -1.313*** -1.153*** -1.313***
(-4.040) (-3.937) (-4.032) (-3.928) (-4.034) (-3.930)
Leverage 1.558*** 1.801*** 1.555*** 1.797*** 1.555*** 1.797***
(3.751) (3.640) (3.734) (3.624) (3.738) (3.627)
MB 0.001*** 0.001*** 0.001*** 0.001*** 0.001*** 0.001***
(2.654) (2.593) (2.673) (2.616) (2.667) (2.610)
ROA -1.343*** -1.481*** -1.342*** -1.480*** -1.343*** -1.481***
(-4.077) (-3.866) (-4.066) (-3.855) (-4.071) (-3.860)
Market Beta 0.964*** 0.964*** 0.964***
(12.123) (12.119) (12.121)
SMB Beta 0.418*** 0.418*** 0.418***
(20.345) (20.340) (20.343)
HML Beta 0.077*** 0.077*** 0.077***
(2.896) (2.897) (2.897)
Constant 17.108*** 18.981*** 17.197*** 19.093*** 17.015*** 18.887***
(13.630) (12.178) (13.672) (12.227) (13.503) (12.084)
Observations 428,746 428,746 428,746 428,746 428,746 428,746
R-squared 0.285 0.555 0.285 0.555 0.285 0.555
Board fixed effect yes yes yes yes yes yes
Month fix. effect yes yes yes yes yes yes
Robust t-statistics in parentheses
*** p<0.01, ** p<0.05, * p<0.1

156
Table 3-2B Volatility and Director Tenure – Panel B
Panel B: Director appointments not accompanied by another appointment around arrival
This table reports regression results for the volatility-director tenure relation estimated with three
functional forms for two measures of stock return volatility. It documents the effect of director
appointments not accompanied by another director appointment six month around the appointment. The
first five years of director tenure are used in all specifications. The sample does not include CEOs and
excludes all directors appointments overlapping with a CEO turnover over a one year period. All model
specifications include board fixed effects as well as month fixed effects. Standard errors are clustered at
the firm level. The definition of all variables is in Appendix 3-A.
(1)
Idiosyncratic
Volatility
(2)
Realized
Volatility
(3)
Idiosyncratic
Volatility
(4)
Realized
Volatility
(5)
Idiosyncratic
Volatility
(6)
Realized
Volatility
Tenure -0.114*** -0.128**
(-2.660) (-2.511)
Tenure2 0.018** 0.022**
(2.435) (2.313)
Single appointment -0.047 -0.032 -0.101 -0.104 0.099 0.106
(-0.820) (-0.434) (-1.250) (-1.066) (1.609) (1.439)
Single
appointment*Tenure 0.022 0.013
(0.939) (0.438)
Ln(1+tenure) -0.107* -0.109
(-1.815) (-1.559)
Single appointment*Ln(1+tenure) 0.092 0.088
(1.307) (1.021)
-1/(1+tenure) -0.314** -0.361**
(-2.089) (-2.116)
Single appointment*-1/(1+tenure) 0.267 0.311
(1.570) (1.569)
Ln(assets) -0.940*** -1.064*** -0.943*** -1.067*** -0.942*** -1.067***
(-5.814) (-5.231) (-5.823) (-5.243) (-5.826) (-5.244)
Dividend Payer -1.153*** -1.314*** -1.152*** -1.312*** -1.154*** -1.314***
(-4.035) (-3.933) (-4.030) (-3.926) (-4.037) (-3.933)
Leverage 1.558*** 1.801*** 1.556*** 1.797*** 1.556*** 1.798***
(3.749) (3.639) (3.733) (3.624) (3.739) (3.628)
MB 0.001*** 0.001*** 0.001*** 0.001*** 0.001*** 0.001***
(2.662) (2.597) (2.691) (2.630) (2.694) (2.636)
ROA -1.342*** -1.481*** -1.342*** -1.480*** -1.343*** -1.482***
(-4.078) (-3.867) (-4.071) (-3.859) (-4.081) (-3.870)
Market Beta 0.964*** 0.964*** 0.964***
(12.123) (12.120) (12.124)
SMB Beta 0.418*** 0.418*** 0.418***
(20.345) (20.343) (20.349)
HML Beta 0.077*** 0.077*** 0.077***

157
(2.897) (2.897) (2.897)
Constant 17.134*** 18.999*** 17.269*** 19.165*** 16.974*** 18.842***
(13.681) (12.219) (13.759) (12.312) (13.445) (12.022)
Observations 428,746 428,746 428,746 428,746 428,746 428,746
R-squared 0.285 0.555 0.285 0.555 0.285 0.555
Board fixed effect yes yes yes yes yes yes
Calendar month fix.
effect yes yes yes yes yes yes
Robust t-statistics in parentheses
*** p<0.01, ** p<0.05, * p<0.1
Table 3-2C Volatility and Director Tenure – Panel C
Panel C: Director Appointments, no other appointments over two year period
This table reports regression results for the volatility-director tenure relation estimated with three
functional forms for two measures of stock return volatility. It documents the effect of directors
appointments not accompanied by another director appointment over the one year period prior to and the
one year period following the appointment. The first five years of director tenure are used in all
specifications. The sample does not include CEOs and excludes all directors’ appointments overlapping
with a CEO turnover over a one year period. All model specifications include board fixed effects as well
as month fixed effects. Standard errors are clustered at the firm level. The definition of all variables is in
Appendix 3-A.
(1)
Idiosyncratic
Volatility
(2)
Realized
Volatility
(3)
Idiosyncratic
Volatility
(4)
Realized
Volatility
(5)
Idiosyncratic
Volatility
(6)
Realized
Volatility
Tenure -0.098** -0.114**
(-2.465) (-2.365)
Tenure2 0.018** 0.022**
(2.404) (2.286)
Single appointment2yrs -0.007 0.006 -0.048 -0.054 0.042 0.052
(-0.131) (0.094) (-0.659) (-0.598) (0.751) (0.743)
Single
appointment2yrs*Tenure -0.001 -0.009
(-0.030) (-0.309)
Ln(1+tenure) -0.06 -0.064
(-1.437) (-1.271)
Single appointment2yrs*Ln(1+tenure) 0.031 0.028
(0.477) (0.350)
-1/(1+tenure) -0.211** -0.255**
(-1.987) (-2.069)
Single appointment2yrs*-1/(1+tenure) 0.157 0.213
(1.060) (1.181)
Ln(assets) -0.940*** -1.064*** -0.943*** -1.067*** -0.943*** -1.068***
(-5.819) (-5.235) (-5.826) (-5.247) (-5.827) (-5.248)
Dividend Payer -1.154*** -1.314*** -1.153*** -1.313*** -1.154*** -1.314***

158
(-4.040) (-3.938) (-4.033) (-3.930) (-4.038) (-3.935)
Leverage 1.558*** 1.801*** 1.555*** 1.797*** 1.556*** 1.799***
(3.751) (3.641) (3.735) (3.626) (3.740) (3.631)
MB 0.001*** 0.001*** 0.001*** 0.001*** 0.001*** 0.001***
(2.653) (2.591) (2.679) (2.621) (2.684) (2.630)
ROA -1.343*** -1.482*** -1.342*** -1.480*** -1.342*** -1.481***
(-4.078) (-3.867) (-4.067) (-3.856) (-4.074) (-3.864)
Market Beta 0.964*** 0.964*** 0.964***
(12.123) (12.120) (12.123)
SMB Beta 0.418*** 0.418*** 0.418***
(20.345) (20.342) (20.346)
HML Beta 0.077*** 0.077*** 0.077***
(2.896) (2.897) (2.897)
Constant 17.109*** 18.971*** 17.227*** 19.124*** 17.032*** 18.910***
(13.683) (12.223) (13.753) (12.312) (13.519) (12.104)
Observations 428,746 428,746 428,746 428,746 428,746 428,746
R-squared 0.285 0.555 0.285 0.555 0.285 0.555
Board fixed effect yes yes yes yes yes yes
Calendar month fixed
effect yes yes yes yes yes yes
Robust t-statistics in parentheses
*** p<0.01, ** p<0.05,
* p<0.1

159
Table 3-3A Exogenous Director Appointments – Panel A
Panel A: Exogenous appointments, good performance, low volatility
This table reports regression results for the volatility-director tenure relation using samples of exogenous
director appointments. The first five years of director tenure are used in all specifications. In all
regressions, only director appointments occurring when the firm is performing well in a low volatility
environment are included. Specifically, the firm’s stock return performance the year preceding the
appointment must exceed that of the S&P 500 and its average monthly stock return volatility over the six
months preceding the appointment must be inferior to its average monthly return volatility over the
previous two years. Specification 1 restricts the sample to directors appointed to meet the new exchange
independence requirement as well as directors appointed to replace directors who either retired or passed
away. Specification 2 includes only exchange mandated directors and Specification 3 only replacement
directors. In Specifications 4, 5 and 6, the full sample is used in the regression and indicator variables
corresponding to the type of appointment are used. CEOs are excluded and the samples also exclude all
directors appointments overlapping with a CEO turnover over a one year period. All model specifications
include board fixed effects as well as month fixed effects. Standard errors are clustered at the firm level.
The definition of all variables is in Appendix 3-A.
Dependent var.: Idio. Vol. (1) (2) (3) (4) (5) (6)
Tenure -0.550** -0.650** -0.196 -0.101*** -0.100*** -0.099***
(-2.131) (-2.194) (-0.253) (-2.676) (-2.670) (-2.633)
Pooled exogenous -0.100
(-1.495)
Pooled exogenous*Tenure 0.022
(0.734)
Exchange mandated -0.090
(-1.263)
Exchange mandated*Tenure 0.017
(0.538)
Retirement/death
replacement -0.261
(-1.556)
Retirement/death replacement*Tenure 0.087
(0.941)
Tenure2 0.070* 0.072 0.075 0.018** 0.018** 0.018**
(1.722) (1.556) (0.609) (2.431) (2.431) (2.407)
Ln(assets) -1.065** -0.880** -4.568** -0.940*** -0.940*** -0.940***
(-2.387) (-2.072) (-2.497) (-5.813) (-5.813) (-5.812)
Dividend Payer -1.324** -1.603** -0.732 -1.154*** -1.154*** -1.155***
(-2.343) (-2.562) (-1.081) (-4.040) (-4.039) (-4.043)
Leverage 1.715 0.774 6.015* 1.557*** 1.557*** 1.558***
(1.303) (0.536) (1.981) (3.747) (3.748) (3.752)
MB -0.007 -0.006 -0.082 0.001*** 0.001*** 0.001***
(-1.565) (-1.311) (-1.341) (2.651) (2.651) (2.653)
ROA 0.378 -1.054 6.221*** -1.342*** -1.342*** -1.343***
(0.315) (-0.855) -4.774 (-4.076) (-4.076) (-4.078)
Constant 16.884*** 15.945*** 50.645*** 17.111*** 17.112*** 17.104***
(4.384) (4.551) (3.687) (13.633) (13.635) (13.627)

160
Observations 18,035 15,965 2,415 428,746 428,746 428,746
R-squared 0.322 0.31 0.436 0.285 0.285 0.285
Board fixed effect yes yes yes yes yes yes
Calendar month fixed effect yes yes yes yes yes yes
Robust t-statistics in parentheses
*** p<0.01, ** p<0.05, *
p<0.1
Table 3-3B Exogenous Director Appointments – Panel B
Panel B: This table reports regression results for the volatility-director tenure relation using a sample of
exogenous director appointments. The first five years of director tenure are used in all specifications. In
all regressions, only director appointments occurring when the firm is performing well in a low volatility
environment are included. Specifically, the firm’s stock return performance the year preceding the
appointment must exceed that of the S&P 500 and its average monthly stock return volatility over the six
months preceding the appointment must be inferior to its average monthly return volatility over the
previous two years. In addition, the departing director and replacement director must share a very similar
profile, i.e. a SimScore ≥ 4. Specification 1 restricts the sample to directors appointed to meet the new
exchange independence requirement as well as directors appointed to replace directors who either retired
or passed away. Specification 2 includes only exchange mandated directors and Specification 3 only
replacement directors. CEOs are excluded and the samples also exclude all directors appointments
overlapping with a CEO turnover over a one year period. All model specifications include board fixed
effects as well as month fixed effects. Standard errors are clustered at the firm level. The definition of all
variables is in Appendix 3-A.
Dependent var. Idio. Vol. (1) (2) (3)
Tenure -0.571**
(-2.078)
Tenure2 0.078
(1.626)
Ln(1+tenure) -0.803**
(-2.112)
-1/(1+tenure) -1.137*
(-1.865)
Ln(assets) -0.962* -0.978* -0.977*
(-1.722) (-1.733) (-1.732)
Dividend Payer -1.280 -1.295 -1.298
(-1.468) (-1.488) (-1.489)
Leverage 0.495 0.505 0.491
(0.284) (0.289) (0.280)
MB -0.017*** -0.017*** -0.017***
(-2.981) (-3.023) (-3.021)

161
ROA 0.84 0.806 0.782
(0.745) (0.709) (0.686)
Constant 15.474*** 15.518*** 14.554***
(3.453) (3.432) (3.154)
Observations 10,964 10,964 10,964
R-squared 0.305 0.305 0.305
Board fixed effect yes yes yes
Calendar month fixed
effect yes yes yes
Robust t-statistics in parentheses
*** p<0.01, ** p<0.05, * p<0.1

162
Table 3-4A Additional Tests – Panel A
Panel A: This table reports regression results for the volatility-director tenure relation using the average
board tenure for all board in Specification 1, for young boards (average board tenure, tercile 1) in
Specification 2 and seasoned boards (average board tenure, tercile 3) in Specification 3. CEOs are
excluded and the samples also exclude all directors appointments overlapping with a CEO turnover over a
one year period. All model specifications include board fixed effects as well as month fixed effects.
Standard errors are clustered at the firm level. The definition of all variables is in Appendix 3-A.
Dependent var. Idio. Vol. (1) (2) (3)
Average board tenure -0.127*** -0.326* -0.004
(-4.563) (-1.814) (-0.050)
Average board tenure2 0.005*** 0.072** -0.001
(3.443) (2.497) (-0.280)
Board size -0.109*** -0.038 -0.044
(-5.190) (-1.110) (-1.021)
Firm age 0.823*** 1.438*** -0.072
(26.278) (9.775) (-1.228)
Ln(assets) -1.082*** -0.847*** -0.563*
(-10.604) (-3.979) (-1.941)
Dividend Payer -1.508*** -0.898*** -1.009***
(-11.742) (-3.098) (-3.281)
Leverage 1.594*** 1.579*** 1.429*
(4.598) (2.672) (1.663)
MB 0.000** 0.001 0.001***
(2.236) (1.012) (6.951)
ROA -3.675*** -1.260*** -2.191***
(-8.784) (-3.616) (-2.644)
Constant 6.221*** 12.118*** 14.332***
(6.660) (4.732) (6.949)
Observations 1,656,575 419,320 409,427
R-squared 0.343 0.213 0.249
Board fixed effect yes yes yes
Calendar month fixed effect yes yes yes
Robust t-statistics in parentheses
*** p<0.01, ** p<0.05, * p<0.1
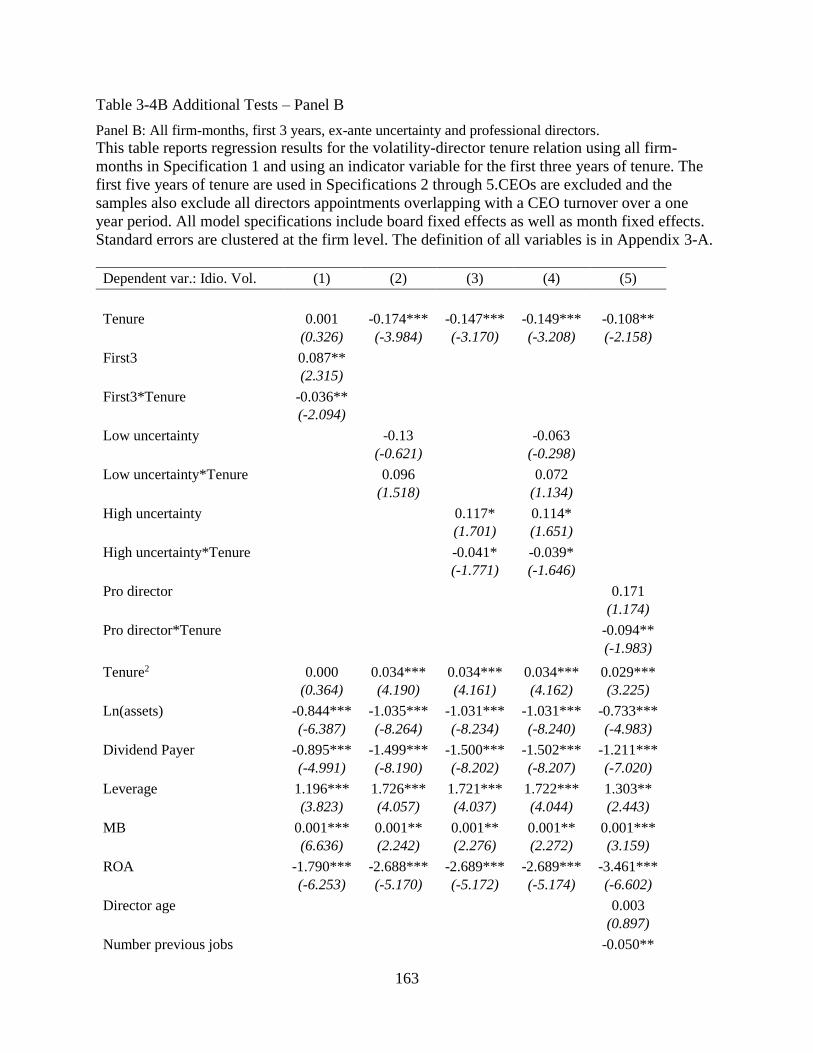
163
Table 3-4B Additional Tests – Panel B
Panel B: All firm-months, first 3 years, ex-ante uncertainty and professional directors.
This table reports regression results for the volatility-director tenure relation using all firm-
months in Specification 1 and using an indicator variable for the first three years of tenure. The
first five years of tenure are used in Specifications 2 through 5.CEOs are excluded and the
samples also exclude all directors appointments overlapping with a CEO turnover over a one
year period. All model specifications include board fixed effects as well as month fixed effects.
Standard errors are clustered at the firm level. The definition of all variables is in Appendix 3-A.
Dependent var.: Idio. Vol. (1) (2) (3) (4) (5)
Tenure 0.001 -0.174*** -0.147*** -0.149*** -0.108**
(0.326) (-3.984) (-3.170) (-3.208) (-2.158)
First3 0.087**
(2.315)
First3*Tenure -0.036**
(-2.094)
Low uncertainty -0.13 -0.063
(-0.621) (-0.298)
Low uncertainty*Tenure 0.096 0.072
(1.518) (1.134)
High uncertainty 0.117* 0.114*
(1.701) (1.651)
High uncertainty*Tenure -0.041* -0.039*
(-1.771) (-1.646)
Pro director 0.171
(1.174)
Pro director*Tenure -0.094**
(-1.983)
Tenure2 0.000 0.034*** 0.034*** 0.034*** 0.029***
(0.364) (4.190) (4.161) (4.162) (3.225)
Ln(assets) -0.844*** -1.035*** -1.031*** -1.031*** -0.733***
(-6.387) (-8.264) (-8.234) (-8.240) (-4.983)
Dividend Payer -0.895*** -1.499*** -1.500*** -1.502*** -1.211***
(-4.991) (-8.190) (-8.202) (-8.207) (-7.020)
Leverage 1.196*** 1.726*** 1.721*** 1.722*** 1.303**
(3.823) (4.057) (4.037) (4.044) (2.443)
MB 0.001*** 0.001** 0.001** 0.001** 0.001***
(6.636) (2.242) (2.276) (2.272) (3.159)
ROA -1.790*** -2.688*** -2.689*** -2.689*** -3.461***
(-6.253) (-5.170) (-5.172) (-5.174) (-6.602)
Director age 0.003
(0.897)
Number previous jobs -0.050**

164
(-2.286)
Number previous boards -0.001
(-0.153)
Experience CEO public company 0.077
(1.045)
Constant 17.895*** 18.787*** 18.750*** 18.749*** 16.204***
(11.888) (20.160) (20.137) (20.135) (13.798)
Observations 1,388,539 419,220 419,220 419,220 235,380
R-squared 0.262 0.351 0.351 0.351 0.36
Board fixed effect yes yes yes yes yes
Calendar month fixed effect yes yes yes yes yes
Robust t-statistics in parentheses
*** p<0.01, ** p<0.05, *
p<0.1
Table 3-4C Additional Tests – Panel C
Panel C: Matched Sample
This table reports regression results from estimating the volatility-director tenure relation for a
matched sample. Specifications replicate those of Panel A of Table 3-2 but for a matched
sample. Each firm for each of the three original samples is matched to the firm closest in size,
based on total assets, that belongs to the same industry. Industries are based on the Fama-French
10 industry classification. Control firms must not experience a director appointment at least one
year before and one year after the appointment of a director in the sample firm. In these
regressions, all variables are control firm variables, except for the tenure variables, which track
the tenure of the new director in the sample firm. The first five years of director tenure are used
in all specifications. The sample does not include CEOs and excludes all directors appointments
overlapping with a CEO turnover over a one year period. All model specifications include board
fixed effects as well as month fixed effects. Standard errors are clustered at the firm level. The
definition of all variables is in Appendix 3-A.

165
(1)
Idiosyncratic
Volatility
(2)
Realized
Volatility
(3)
Idiosyncratic
Volatility
(4)
Realized
Volatility
(5)
Idiosyncratic
Volatility
(6)
Realized
Volatility
Tenure -0.007 -0.013
(-0.158) (-0.236)
Tenure2 0.005 0.004
(0.614) (0.422)
Ln(1+tenure) 0.049 0.024
(1.089) (0.444)
-1/(1+tenure) 0.086 0.036
(0.864) (0.301)
Ln(assets) -0.840*** -0.783*** -0.840*** -0.783*** -0.840*** -0.783***
(-7.251) (-5.676) (-7.251) (-5.676) (-7.255) (-5.678)
Dividend Payer -1.783*** -1.813*** -1.783*** -1.813*** -1.783*** -1.813***
(-11.035) (-9.863) (-11.031) (-9.861) (-11.028) (-9.860)
Leverage 1.060*** 1.073*** 1.059*** 1.073*** 1.059*** 1.072***
(2.970) (2.773) (2.967) (2.771) (2.966) (2.771)
MB 0.001 0.001 0.001 0.001 0.001 0.001
(0.793) (1.071) (0.802) (1.075) (0.804) (1.076)
ROA -2.988*** -3.264*** -2.990*** -3.266*** -2.992*** -3.267***
(-7.755) (-7.156) (-7.761) (-7.160) (-7.766) (-7.163)
Market Beta 1.118*** 1.118*** 1.118***
(24.236) (24.236) (24.234)
SMB Beta 0.461*** 0.461*** 0.461***
(20.773) (20.773) (20.773)
HML Beta 0.110*** 0.110*** 0.110***
(5.681) (5.679) (5.679)
Constant 16.868*** 18.216*** 16.911*** 18.247*** 16.982*** 18.270***
(17.646) (15.747) (17.706) (15.819) (17.377) (15.468)
Observations 386,981 386,981 386,981 386,981 386,981 386,981
R-squared 0.283 0.539 0.283 0.539 0.283 0.539
Board fixed effect yes yes yes yes yes yes
Calendar month fix.
Eff. yes yes yes yes yes yes
Robust t-statistics in parentheses
*** p<0.01, ** p<0.05, * p<0.1

166
Table 3-5 Summary of Previous Empirical Evidence and Evidence from the Learning-based
Methodology
Study
Finding
Evidence from
Learning-based
Approach
Position on the Board
Chairman Nguyen and Nielsen
(2010)
Larger stock price reaction to death of
chairman
Chairman has
higher marginal
value
Audit
member
Nguyen and Nielsen
(2010)
Larger stock price reaction to death of
audit committee member
Chair of audit
committee has
higher marginal
value
Compensat.
member N/A N/A
Chair of
compensation
committee has
higher marginal
value
Nominating
member
Nguyen and Nielsen
(2010)
Larger stock price reaction to death of
nominating committee member
No significant
effect
Independent
directors
Bhagat and Black
(2000);
Hermalin and
Weisbach (1991)
No relation between % outside
directors and Tobin's Q/accounting
measures
Independent
directors with
industry expertise
and independent
directors joining
firms with high
monitoring needs
have higher
marginal value
Duchin, Matsesaka,
Ozbas (2010)
Independent directors improve
performance when their information
cost is low
Weisbach (1988)
Boards dominated by outside
directors more likely to replace CEO
in bad times
Masulis, Ruzzier, Xiao
and Zhao (2012)
Positive correlation between the
presence of independent directors
with industry expertise and firm
performance
Gillan, Hartzell and
Starks (2011)
Powerful boards are substitute for the
market of corporate control

167
Director Characteristics
Gender
Adams and Ferreira
(2009)
Female directors are better
monitors, but at the cost of lower
firm performance
Female directors
have lower
marginal value
on average.
However, when
the need for
monitoring
services is acute,
female directors
have higher
marginal value
Matsa and Miller
(2012);
Ahern and Dittmar
(2012)
Female directors are associated with
decreased firm value and
profitability
Busyness
Fich and Shivdasani
(2006)
Busy directors are associated with
lower firm value
Busy directors
have higher
marginal value
Core, Holthausen and
Larcker (1999)
Busy outside directors are
associated with increased CEO
compensation
Ferris, Jagannathan
and Pritchard (2003)
Positive announcement returns to
appointments of busy directors
Falato, Kadyrzhanova
and Lel (2014)
Busy directors are detrimental to
board monitoring quality and
shareholder value
Field, Lowry and
Mkrtchyan (2013)
Busy directors are beneficial for
small young firms but detrimental
for large firms
Board Level Characteristics
Entrenched
boards
and powerful
CEOs
Hermalin and
Weisbach (1998)
Model predicts increased CEO
bargaining power vis-a-vis the board
over CEO tenure
Boards with
powerful CEOs
have lower
marginal value
Shivdasani and
Yermack (1999)
More powerful CEOs are able to
select a less independent board
Fracassi and Tate
(2012)
Powerful CEOs appoint directors with
ties to the CEO resulting in weaker
monitoring
Groupthink Coles, Daniel and
Naveen (2015)
Groupthink has a negative effect on
firm value for firms in dynamic
industries
Directors joining
boards prone to
groupthink (with
a high percentage
of directors with
long tenure) have
lower marginal
value

168
Board size
Yermack (1996);
Eisenberg, Sundgren
and Wells (1998)
Inverse association between board
size and Tobin's Q
Smaller boards
have higher
marginal value
Board Pay Slice N/A N/A
Better
compensated
boards have
higher marginal
value
Firm Level Characteristics
Firm size N/A N/A
Directors have
higher marginal
value in small
firms
Prior
performance
Mace (1971) Interview evidence that boards'
activiness is limited to crisis situations Directors have
higher marginal
value when the
firm has recently
performed poorly
Larcker, So and
Wang (2013)
Board network resources are most
valuable for firm with poor
performance
Industry Coles, Daniel and
Naveen (2015)
Groupthink is more detrimental for
firms in more dynamic industries
Directors have
higher marginal
value in complex
and human
capital intensive
industries

169
Table 3-6A Cross-sectional Tests – Panel A
Panel A: Position on the board
This table reports regression results using interaction variables to identify director attributes that
affect the volatility-director tenure relation. Individual terms for committee chairs, control
variables, including controls for the ex-ante level of uncertainty are included but not reported for
brevity. CEOs are excluded and the samples also exclude all directors appointments overlapping
with a CEO turnover over a one year period. All model specifications include firm fixed effects
as well as month fixed effects. Standard errors are clustered at the firm level. The definition of
all variables is in Appendix 3-A.
Dependent variable: Idiosyncratic volatility (1) (2) (3) (4) (5)
Tenure -0.058 -0.082* -0.104* -0.137** -0.06
(-1.537) (-1.658) (-1.725) (-2.071) (-1.473)
Tenure2 0.009 0.009 0.019** 0.002 0.016**
(1.314) (1.297) (2.512) (0.273) (2.005)
Independent -0.232** -0.304** -0.441***
(-2.168) (-2.157) (-2.839)
Independent*Tenure 0.022 0.046 0.096*
(0.617) (0.901) (1.835)
Job experience same industry 0.055
(0.255)
Job experience same industry*Tenure -0.041
(-0.572)
Independent*Job experience same industry 0.411*
(1.925)
Independent*Job experience same industry*Tenure -0.134*
(-1.868)
Chairman 0.345**
(2.431)
Chairman*Tenure -0.081*
(-1.783)
High monitoring needs -0.668*
(-1.872)
High monitoring needs*Tenure 0.276***
(2.888)
Independent*High monitoring needs 0.905***
(2.707)
Independent*High monitoring
needs*Tenure -0.216**
(-2.228)
Nomination committee chair*Tenure -0.044
(-0.553)
Audit committee chair*Tenure -0.157***
(-4.368)
Compensation committee chair*Tenure -0.086**

170
(-2.290)
Governance committee chair*Tenure -0.06
(-0.813)
Risk committee chair*Tenure 0.253
(1.293)
Social committee chair*Tenure 0.062
(0.636)
Strategy committee chair*Tenure 0.217
(1.251)
Technology committee chair*Tenure 0.024
(0.158)
Constant 17.231*** 17.393*** 17.275*** 18.708*** 19.967***
(14.517) (14.561) (14.393) (12.895) (17.792)
Observations 369,321 369,321 369,321 170,499 330,506
R-squared 0.352 0.352 0.353 0.349 0.348
Firm fixed effect yes yes yes yes yes
Calendar month fixed effect yes yes yes yes yes
Robust t-statistics in parentheses
*** p<0.01, ** p<0.05, * p<0.1
Table 3-6B Cross-sectional Tests – Panel B
Panel B: Personal attributes
This table reports regression results using interaction variables to identify director attributes that
affect the volatility-director tenure relation. Control variables are included but not reported for
brevity. CEOs are excluded and the samples also exclude all directors appointments overlapping
with a CEO turnover over a one year period. All model specifications include firm fixed effects
as well as month fixed effects. Standard errors are clustered at the firm level. The definition of
all variables is in Appendix 3-A.
Dependent variable: Idiosyncratic
volatility (1) (2) (3) (4) (5)
Tenure -0.072* -0.06 -0.026 -0.05 -0.049
(-1.861) (-1.233) (-0.608) (-1.303) (-1.271)
Tenure2 0.009 0.002 0.009 0.009 0.009
(1.311) (0.288) (1.166) (1.242) (1.191)
Female -0.171** -0.163
(-2.223) (-1.525)
Female*Tenure 0.066** 0.068*
(2.391) (1.792)
High monitoring needs 0.144
(1.037)
High monitoring needs*Tenure 0.092***
(3.095)
Female*High monitoring needs 0.207

171
(1.172)
Female*High monitoring needs*Tenure -0.104*
(-1.757)
Busy 0.119*
(1.770)
Busy*Tenure -0.042*
(-1.830)
Board experience same industry 0.156
(1.535)
Board experience same industry*Tenure -0.054*
(-1.739)
Job experience same industry 0.156
(1.376)
Job experience same industry*Tenure -0.113***
(-3.296)
Director Age 0 -0.002 0.002 0 0
(-0.140) (-0.677) (0.600) (-0.108) (-0.154)
Number previous jobs -0.040* -0.050** -0.027 -0.040* -0.03
(-1.882) (-2.207) (-1.311) (-1.889) (-1.401)
Number previous boards 0.002 -0.001 -0.001 0.001 0.001
(0.228) (-0.053) (-0.125) (0.098) (0.156)
Experience CEO public firm 0.07 0.073 0.011 0.069 0.067
(1.044) (1.129) (0.194) (1.030) (1.000)
Constant 17.246*** 18.454*** 20.989*** 17.210*** 17.186***
(14.513) (12.898) (20.357) (14.502) (14.469)
Observations 369,321 170,499 266,480 369,321 369,321
R-squared 0.352 0.349 0.331 0.352 0.352
Firm fixed effect yes yes yes yes yes
Calendar month fixed effect yes yes yes yes yes
Robust t-statistics in parentheses
*** p<0.01, ** p<0.05, * p<0.1
Table 3-6C Cross-sectional Tests – Panel C
Panel C: Board characteristics
This table reports regression results using interaction variables to identify board attributes that
affect the volatility-director tenure relation. Control variables are included but not reported for
brevity. CEOs are excluded and the samples also exclude all directors appointments overlapping
with a CEO turnover over a one year period. All model specifications include firm fixed effects
as well as month fixed effects. Standard errors are clustered at the firm level. The definition of
all variables is in Appendix 3-A.
Dependent variable: Idiosyncratic
volatility (1) (2) (3) (4)

172
Tenure -0.092** -0.026 -0.133*** -0.047
(-2.279) (-0.395) (-3.179) (-0.999)
Tenure2 0.008 0.009 0.009 0.002
(1.136) (0.718) (1.320) (0.240)
Groupthink 0.057
(0.623)
Groupthink*Tenure 0.063***
(2.904)
High BPS 1.288*
(1.862)
High BPS*Tenure -0.530**
(-2.444)
Large board -0.492***
(-4.883)
Large Board*Tenure 0.115***
(4.723)
High monitoring needs 0.177
(1.302)
High monitoring needs*Tenure 0.075***
(2.735)
Director Age 0 -0.007* 0 -0.002
(-0.094) (-1.869) (-0.110) (-0.683)
Number previous jobs -0.040* -0.063*** -0.039* -0.050**
(-1.902) (-2.865) (-1.859) (-2.218)
Number previous boards 0.002 0.005 0.002 -0.001
(0.238) (0.531) (0.269) (-0.061)
Experience CEO public firm 0.068 0.031 0.071 0.07
(1.024) (0.510) (1.058) (1.091)
Constant 17.364*** 11.394*** 17.284*** 18.424***
(14.675) (6.122) (14.743) (12.863)
Observations 369,321 113,998 369,321 170,499
R-squared 0.353 0.355 0.353 0.349
Firm fixed effect yes yes yes yes
Calendar month fixed effect yes yes yes yes
Robust t-statistics in parentheses
*** p<0.01, ** p<0.05, * p<0.1
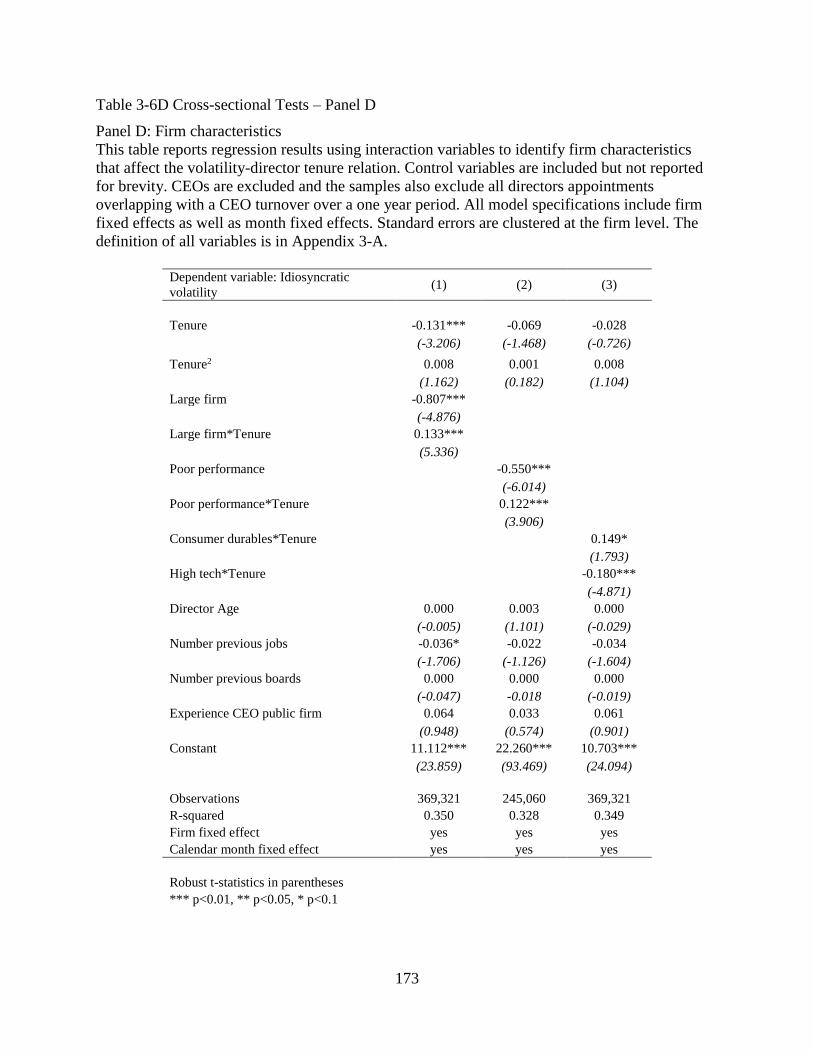
173
Table 3-6D Cross-sectional Tests – Panel D
Panel D: Firm characteristics
This table reports regression results using interaction variables to identify firm characteristics
that affect the volatility-director tenure relation. Control variables are included but not reported
for brevity. CEOs are excluded and the samples also exclude all directors appointments
overlapping with a CEO turnover over a one year period. All model specifications include firm
fixed effects as well as month fixed effects. Standard errors are clustered at the firm level. The
definition of all variables is in Appendix 3-A.
Dependent variable: Idiosyncratic
volatility (1) (2) (3)
Tenure -0.131*** -0.069 -0.028
(-3.206) (-1.468) (-0.726)
Tenure2 0.008 0.001 0.008
(1.162) (0.182) (1.104)
Large firm -0.807***
(-4.876)
Large firm*Tenure 0.133***
(5.336)
Poor performance -0.550***
(-6.014)
Poor performance*Tenure 0.122***
(3.906)
Consumer durables*Tenure 0.149*
(1.793)
High tech*Tenure -0.180***
(-4.871)
Director Age 0.000 0.003 0.000
(-0.005) (1.101) (-0.029)
Number previous jobs -0.036* -0.022 -0.034
(-1.706) (-1.126) (-1.604)
Number previous boards 0.000 0.000 0.000
(-0.047) -0.018 (-0.019)
Experience CEO public firm 0.064 0.033 0.061
(0.948) (0.574) (0.901)
Constant 11.112*** 22.260*** 10.703***
(23.859) (93.469) (24.094)
Observations 369,321 245,060 369,321
R-squared 0.350 0.328 0.349
Firm fixed effect yes yes yes
Calendar month fixed effect yes yes yes
Robust t-statistics in parentheses
*** p<0.01, ** p<0.05, * p<0.1

174
Appendix 1-A: Interim IRR
In this Appendix, we present estimates of future fundraising as a function of a fund’s
interim, as opposed to final, IRR (see the discussion in Section 3.3). Preqin provides interim IRR
data for a subset of our main sample of preceding funds, but the time series of interim IRRs for a
given fund is almost always incomplete (so it is not possible for us to use these data to estimate,
for example, hazard models to predict future fundraising). Similarly, Preqin provides cash flow
data for another (partially overlapping) subset, making it possible for us to compute interim IRRs,
but the cash flow data for a given fund generally appear to be incomplete. Using these two
sources of interim IRR data, we obtain interim IRR at the time of next fundraising for 801 of our
1,745 preceding funds (using the Preqin interim IRR when both are available because the cash
flow data are often incomplete). For preceding funds that do not raise a follow-on fund, we use
the interim IRR after three years of life, matching the average time between successive
fundraisings in our data.
Panel A of Table A-1 shows that the correlation between this interim IRR for a fund and
the fund’s final IRR is high. The correlation is 0.607 for all funds taken together, 0.551 for
buyout funds, 0.618 for venture capital funds, and 0.228 for real estate funds. In Panel B we
estimate probit regressions to explain whether a follow-on fund is raised, analogous to Panel A
of Table 2-3. The estimated marginal effects are all positive and significant with the exception of
real estate funds. For all fund types, the difference between the marginal effects reported in Panel
B of Table A-1 and those reported in Panel A of Table 2-3 are statistically insignificant. In Panel
C of Table A-1 we estimate regressions predicting (log) fund growth from preceding to follow-
on fund, analogous to those reported in Panel C of Table 2-3. Again, all of the estimated

175
coefficients are positive, all are significant except for buyout funds that narrowly miss
significance, and none are statistically significantly different from the analogous coefficients
reported in Panel C of Table 2-3.
Overall, the evidence presented in Table A-1 suggests that, even if interim IRR were the right
way for the econometrician to summarize the information set used by investors in assessing
performance at the time of next fundraising (which is questionable, see the discussion in Section
3.3), our results are unlikely to be materially biased by using the fund’s final IRR instead, and by
doing so we gain the advantage of a substantially greater number of observations and enhanced
statistical power.
Table A-1: Correlation between Interim and Final IRRs and Follow-on Fundraising
Regressions with Interim IRRs
Panel A presents correlations between interim IRR at time of fundraising and final IRR for all
preceding funds for which interim IRR data are available. For preceding funds that do not raise a
follow-on, we use the interim IRR after three years (the sample average time to next fundraising).
Panels B and C present preceding fund-level regressions to explain follow-on fundraising using
this interim IRR. Panel B presents probit regressions in which the dependent variable is 1 if a
follow-on is raised and 0 otherwise. There are no estimates for real estate funds because the
dependent variable is always equal to one when interim IRR is available. Marginal effects are
reported and z-scores are given in parentheses. Panel C presents OLS regressions for preceding
funds that raise a follow-on fund. In Panel C, the dependent variable is the natural logarithm of
fund growth plus one. In Panels B and C,“All Funds” regressions include fund type fixed effects
and model (2) includes vintage year fixed effects. Heteroskedasticity-robust standard errors are
clustered at the PE firm level. In Panel C, t-statistics are given in parentheses. *, **, and ***
indicate statistical significance at the 10%, 5%, and 1% level, respectively.

176
Panel A: Correlation between Interim IRR at time of fundraising and Final IRR
All Funds Buyout
Correlation 0.607 0.551
Number of observations 801 304
(continued)
Venture Capital Real Estate
Correlation 0.618 0.228
Number of observations 433 64
Panel B: Probit regressions for the probability of raising a follow-on fund
All Funds Buyout
(1) (2) (1) (2)
Preceding fund interim IRR 0.383*** 0.459*** 0.484*** 0.574***
(3.165) (3.400) (3.361) (3.437)
Number of observations 801 715 304 255
Pseudo R2 0.076 0.124 0.096 0.142
(continued)
Venture Capital Real Estate
(1) (2) (1) (2)
Preceding fund interim IRR 0.345* 0.399** 0.159 1.048*
(2.117) (2.229) (1.486) (1.738)
Number of observations 433 383 64 18
Pseudo R2 0.055 0.140 0.034 0.198
Panel C: OLS regressions for log(fund growth + 1) conditional on raising a follow-on fund
All Funds Buyout
(1) (2) (1) (2)
Preceding fund interim IRR 0.126*** 0.099*** 0.203** 0.217**
(3.549) (2.860) (2.090) (2.202)
Constant 0.947*** 1.108*** 0.934*** 1.125***
(39.406) (5.390) (32.746) (4.432)
Number of observations 651 651 251 251
Adjusted R2 0.042 0.116 0.013 0.123
(continued)
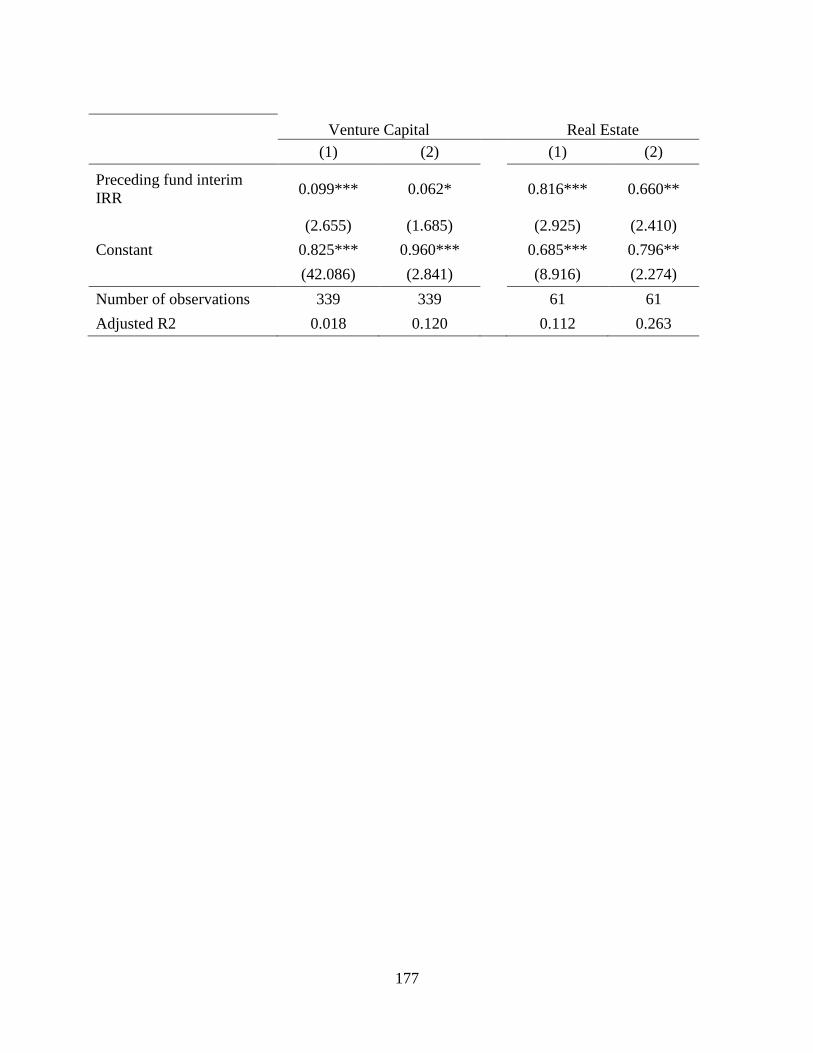
177
Venture Capital Real Estate
(1) (2) (1) (2)
Preceding fund interim
IRR 0.099*** 0.062*
0.816*** 0.660**
(2.655) (1.685) (2.925) (2.410)
Constant 0.825*** 0.960*** 0.685*** 0.796**
(42.086) (2.841) (8.916) (2.274)
Number of observations 339 339 61 61
Adjusted R2 0.018 0.120 0.112 0.263

178
Appendix 2-A: Timeline of the D&O insurance acquisition and information release
Firm operates as a private enterprise
D&O insurance purchased or not (no public information) as a private enterprise (the insurer conducts an audit
and negotiates with the firm the coverage and premium)
Firm decides to go public
Firm contacts investment banker and decides whether to purchase D&O insurance as a "new" public firm (no
public information). The Offering prospectus that includes a pro-forma annual statement, the date of the IPO
and the offering price is made public
IPO
End of fiscal year (not necessarily 12 months after the IPO)
First annual report as a public firm is released
First management proxy is released. This is usually the first occurrence of public information about D&O
insurance. The information relates to the previous year in all instances in the dataset.

179
Appendix 2-B: Examples.
Two examples of how the information related to the D&O insurance contract is release and appears in
management proxies to illustrate the timing of D&O insurance purchase.
“Associated Brands (IPO on November 15th 2002): the management proxy dated May 5th
2003 states that “directors and officers ... are covered under a directors’ and officers’
insurance policy that provides aggregate coverage to the insured individuals of $15
million, subject to a $150,000 deductible on securities claims and a $75,000 deductible
on other claims. The premium paid by the Fund for this coverage for the period from
November 1, 2002 to October 31, 2003 was $180,965.”
“Bridgewater Systems Corporation (IPO on December 14th 2007): the management
proxy dated May 13th 2008 states that "The Corporation maintains directors’ and
officers’ liability insurance coverage with a deductible of $25,000 for each non-securities
claim and $50,000 for each securities claim with a $10 million limit in aggregate.
Coverage includes errors, omissions or breach of fiduciary duty by the directors and
officers during the discharge of their legal duties. The Corporation’s annual premium is
$73,576 (plus tax) which covers a twelve month period from December 1, 2007 to
December 1, 2008.''

180
Appendix 2-C: Definition of control variables.
Unless noted otherwise, all independent variables are measured using accounting information
available in the firms’ first annual report post-IPO.
Financial variables
We use FirstDayReturn as a control variable to account for the possible underpricing of IPO shares
on the first day of trading to attract risk-averse investors (for a more thorough discussion, see Ritter, 1987,
inter alia). This variable is computed as the price at the end of the first day divided by the offer price.50
MarketRet is the one-year post-IPO return of the stock market as calculated by the total return of
Canada’s main stock index. It should be positively correlated with the stock market return. RiskFree, SMB
and HML are the risk free rate, and the two Canadian Fama-French size and growth portfolios (available
until 2009 only) respectively.
We measure firm size by the log of the firm’s market value of equity at the time of the IPO
(lnMVE_IPO). Large firms should be less volatile and have less idiosyncratic risk, and have higher
returns because more investors will scrutinize the activities of larger firms. We use a firm’s market value
of equity at the time of the IPO to make sure that this measure of size is not confounded with stock
market returns. The lnMVE_IPO variable is calculated as the log of the product of the offer price by the
number of shares outstanding on the day of the IPO.
assetsofvaluebook
sliabilitieofvaluebookIPOoftimeatequityofvaluemarketGrowth
(see Core, 1997)
measures a firm’s growth opportunities. A firm with a high growth ratio should be more profitable if the
50 For 16 firms, we do not have the price on the first day post-IPO (but only 3 of those have an
IPO completion date post 1996, and only 1 gives us the information to calculate the rate-on-line).
Instead of dropping the observation from our analysis, we decided to first assign a value of 0 for
the first day return, and second to use the impute command in Stata using the first year return,
the market return and the firm’s industry to impute the return on the first day.

181
growth options turn out to be in the money. Consequently, we expect high growth firms to have higher
first year returns on average. We also expect firms experiencing higher growth to have more volatile
returns. ROA is the return on assets computed asAssetsTotal
NetIncome. We expect firms with a higher ROA to
have a better stock market performance.
Finally, the last financial variable we use is the firm’s book leverage (or Debt_Ratio), which
isAssetsTotal
sLiabilitieTotal. Stock market volatility and idiosyncratic risk should be lower if debt holders are
exercising a greater level of monitoring. On the other hand, the more levered is the firm the higher should
be its stock return volatility since it is more at risk of going bankrupt. The net effect is undetermined.
Governance variables
We collected several variables related to governance: CEO and chairman of the board duality,
board composition and independence as well as the presence of a blockholder. We also control for the
corporate structure.
Duality is an indicator variable taking on the value one if the chairman of the board is also the
company’s chief executive officer and zero otherwise. This particular feature of a board is usually viewed
as an entrenchment red flag. If entrenchment is an issue then Duality could be associated with low
volatility and a low idiosyncratic risk (because the CEO/COB does not want to risk bankruptcy), and low
returns (if firm resources are spent on negative NPV projects). Because Duality affects both risk and
return in the same direction, we do not expect to see much impact on the Sharpe ratio variables.
Blockholder is an indicator variable equal to one if a shareholder owns 10% or more of the firm’s
voting shares according to its first proxy statement. Similar to debtholders, blockholders should have
more at stake in monitoring the firm. Consequently, Volatility and Idiosyncratic is expected to be lower
when a blockholder is present.

182
Independence is the percentage of unrelated directors on the board of directors as reported in the
firms’ proxy statements. The presence of a more independent board could increase returns if it prevents
the entrenchment of management and if it reduces the likelihood of cash flow misappropriation.
The ITCE variable is an indicator variable equal to one if the company is an income trust and zero
otherwise. We include this variable since Halpern (2004), Gillen (2005), Zetzsche (2005) and Huson and
Pazzaglia (2007) argue that income trusts are riskier than stock companies from a governance standpoint.
Boyer and Stern (2012) find that firms incorporated as income trusts pay more to protect their directors
and officers, ceteris paribus. Income trusts are required to pass along more of their operating cash flows
to their investors, which reduces volatility as well as returns since earnings are typically not reinvested,
which makes capital gains infrequent. Volatility and Idiosyncratic should also be lower since income
trusts distribute more dividends, and are typically older and more mature firms than stock companies. The
relationship between ITCE and the Sharpe ratio is therefore undetermined as the numerator and the
denominator are expected to be lower if the firm is an income trust.
Other variables
Risky_Industry is an indicator variable equal to one if the firm belongs to one of the ten two-digit
SIC codes risky industries as identified in Bajaj et al. (2000). Firms that belong to one of these ten risky
industries that were deemed riskier based on the number of cases settled as well as the average settlement
amount should have more volatile stock returns and risk, and higher returns on average. Firms operating
in risky industries should also be more likely to purchase D&O insurance if only because of the higher
frequency of lawsuits.
Age measures the number of years since the start of the company’s operations at the time of the
IPO announcement. We expect this variable to have a negative relationship with stock market volatility
and idiosyncratic risk since the more mature firms becoming public should have more stable cash flows,
everything else equal.

183
The service offered by the investment banker at the time of the IPO is represented by the variable
IPOfeerat, which is calculated as the total fees paid at the time of the IPO divided by the product of the
offer price and the number of shares issued.51 We expect firms that purchase a higher level of service to
have higher returns in the first year and lower volatility and idiosyncratic risk.
Float is the ratio of the number of shares issued at the IPO on the total number of shares
outstanding after the IPO. We expect that firms that have a higher float should have less volatile market
returns because more investors are likely to follow the firm, therefore disseminating the appropriate
information to the markets52. With respect to the decision to purchase D&O insurance or not, Float should
be positively correlated with the decision to purchase. The reason is that the more shares are issued, the
greater the probability of litigation and the greater should be the expected loss conditional on a claim
arising (see Gutiérrez, 2003, and Boyer, 2003) since minority shareholders are the most likely originator
of lawsuits against managers. At the same time, a greater float means that the “firm’s entrepreneur” has
gotten rid of a larger portion of the firm, which should be a bad signal to markets. If such adverse
selection is present, stock returns should be negatively related to the float.
US_Presence is a dummy variable equal to one if the firm reports any activity in the United States
(sales, assets, etc.). The variable was collected by reading annual reports for the year following the IPO.
51 For 21 firms, we do not have the fee paid. Since we felt that the cost of dropping these observations was
too high (10% of our sample), we instead decided to impute a value for the fee ratio. 40% of the firms pay
an IPO fee of exactly 6%, and 90% of the firms paid a fee ratio between 4.5% and 7%. We first opted to
assign a value of 6% to the missing IPOfeerat variable values. We also calculated the predicted fee using
the first day return, the log of the market value of the firm at the time of the IPO, whether the firm is
incorporated as an income trust and the number of shares issued at the time of the IPO (a regression that
has an adjusted R2 of 78%), and then calculated the IPOfeerat variable value using the same
aforementioned rule (or assigned value 2% if the imputed value is negative). In all cases, the results are
sensibly the same.
52 It could also be the case that a higher float implies more differences of opinion which would generate
more trading and more volatility. In this case, the net effect of Float on Volatility and Idiosyncratic is
undetermined. We thank a referee for suggesting this possibility.

184
The United States being a more fertile environment for potential litigation (Clarkson and Simunic, 1994,
Heys and Berenblut, 2012), we expect this variable to be positively correlated with the decision to
purchase D&O insurance. A related measure to US_Presence is US_Sales that is measured as the ratio of
sales that a firm reports doing in the United States to total sales. Sales in the United States should increase
stock returns since it is a proxy for the potential growth in sales and profitability of the company.
Hard is a dummy variable equal to one if the year the firm completed its IPO is deemed to be a
hard market year by D&O insurance experts, and zero otherwise. A hard market is characterized by lower
policy amounts with higher prices. We used the annual premium index available in the Towers Perrin
reports to compute the ten year average premium and labeled as ‘hard’ all years above the ten year
average. This resulted in years 2002 through 2006 to be considered a hard market, which is in line with
the general consensus of D&O insurance market specialists.
Big5 is a dummy variable equal to one if the lead IPO underwriter is one of the five main
investment bankers in Canada. The five largest underwriters represent 70% of the Canadian market.
Investment banker reputation is used as a proxy for the level of information asymmetry during the IPO
process.

185
Appendix 3-A: Variable Definitions
All board and director variables are from BoardEx, financial variables are from Compustat and market
variables are from CRSP.
Director
Attributes
Tenure Time since a director joined a board (in years). Constructed from BoardEx start
and end role dates.
First3 Indicator variable equal to one each month of the first three years of the director's
tenure
Director age Age of the director (in years)
Female Indicator variable equal to one if the director is female. From BoardEx and
manually collected
Independent Indicator variable equal to one if the director is independent
Chairman Indicator variable equal to one if the director is the chairman of the board
Busy Indicator variable equal to one if the director serves simultaneously on three or
more boards
Experience CEO
public firm
Indicator variable equal to one if the director is or has previously been CEO of a
public corporation
Board exp same
industry
Indicator variable equal to one if the director is serving or has previously served
on the board of a firm in the same industry. Industries are based on the Fama-
French ten-industry classification
Job exp same
industry
Indicator variable equal to one if the director is working or has previously worked
for a firm in the same industry. Industries are based on the Fama-French ten-
industry classification
Number
previous boards Number of previous directorships held
Low uncertainty Indicator variable equal to one for directors who have experience as the CEO of a
public firm and have served on at least four corporate boards
High uncertainty Indicator variable equal to one for directors who do not have previous board
experience and do not have experience as CEO
Pro director Indicator variable equal to one for directors who have held at least four previous
directorships and have held directorships in the same industry
Single
appointment
Director appointed solo, i.e. no other directors were appointed during the six
month period around her appointment
Single
appointment2yrs
Director appointments for which there are no other appointments during the two
year period around her appointment

186
Exchange
mandated
Appointments designed to meet the new exchange independence requirement.
Director arrival results in the board complying with the new 50% independence
requirement when it did not prior to that director's appointment. A director
appointment therefore qualifies for this sample if the director joins the board
between 2002 and 2005 and the firm previously did not comply with the 50%
independence requirement. These appointments must occur when the firm's stock
return has outperformed the S&P500 over the year preceding the appointment and
the firm's average monthly stock return volatility over the six month period
preceding the appointment is lower than the average over the two years preceding
the appointment
Retirement/death
replacement
Appointments within six months following the departure of a director who was
over 70 years old, or of a director who served simultaneously on multiple boards
and left all of her directorships within three years, or who passed away. These
appointments must occur when the firm's stock return has outperformed the
S&P500 over the year preceding the appointment and the firm's average monthly
stock return volatility over the six month period preceding the appointment is
lower than the average over the two years preceding the appointment
Pooled
exogenous Includes exchange mandated appointments and retirement/death replacements
SimScore Similarity score for each incoming-departing director pair. See Appendix 3-C for
details
Appendix 3-A (continued)
Board
Attributes
Avg board
tenure Average tenure of the directors of a board in a given month (in years)
Avg board
tenure square Square of Average board tenure
Young boards Boards are ranked based on the average tenure of their members, each month.
Young boards are those in the first tercile
Seasoned boards Boards are ranked based on the average tenure of their members, each month.
Young boards are those in the third tercile
Gender diverse
board Indicator variable equal to 1 if at least one woman serves on the board
Board size Number of directors on the board
Large board Indicator variable equal to 1 if board size is larger than the sample mean
Entrenched Indicator variable equal to 1 if the CEO has been in office for 5 or more years and
cumulates the titles of CEO, Chairman and President
Groupthink Percentage of directors on the board with tenure greater than 9 years
Board Pay Slice Ratio of total independent directors compensation over CEO compensation
(salary + bonus)
High Board Pay
Slice Indicator variable equal to 1 if Board Pay Slice is in the top quartile

187
Firm Level
Variables
Ln(assets) Natural logarithm of total firm assets (item AT in Compustat)
Dividend payer Indicator variable to one if the firm pays dividends (item DVC in Compustat)
Leverage Long-term debt over total assets (item DLTT/AT in Compustat)
MB Market to book ratio: Stock price at year end*common shares outstanding over
total common equity ((PRCC_C*CSHO)/CEQ in Compustat)
ROA Return on assets: net income over total assets (NI/AT in Compustat)
Firm age Age of the firm measured as the number of years since the first appearance of the
firm in CRSP, as in Fama and French (2004)
High monitoring
needs Indicator variable equal to one for large firms with entrenched boards
Poor
performance
Indicator variable equal to one for firms with a stock return performance inferior
to that of the S&P500 over the one year period preceding the appointment
Large firm Indicator variable equal to one if the firm's assets is in the top quartile
Market
Variables
Idiosyncratic
volatility
Variance of the residuals of a daily Fama-French three factor model as in Ang et
al. (2006), aggregated monthly, winzorized at the 1% cutoff
Realized
volatility
Standard deviation of daily stock returns, aggregated monthly, winzorized at the
1% cutoff
Market beta Estimated coefficient on the excess market return in a daily Fama-French three
factor model, aggregated monthly
SMB beta Estimated coefficient on the SMB factor in a daily Fama-French three factor
model, aggregated monthly
HML beta Estimated coefficient on the HML factor in a daily Fama-French three factor
model, aggregated monthly

188
Appendix 3-B: Learning Model
The learning model is based on the theoretical work of Pastor and Veronesi (2003). The
setup is similar to the stylized model in Pan, Wang and Weisbach (2015). In the model, the
ability of directors refers to their capacity to facilitate the generation of cash flows. When newly
appointed directors join a board, their personal aptitude and capacity to influence this particular
board are uncertain, as is the degree of complementarity between their expertise and that of
current board members. The uncertainty surrounding the ability of new board members resolves
over time as these parameters are gradually revealed to the market. In the model, dividend
growth follows a geometric Brownian motion:
where is dividend for firm i at time t,
is the sum of directors’ unobserved abilities, which affects the
average dividend growth rate,
σ is dividend growth volatility.
Director j has the ability to contribute to the generation of cash flows for firm i. This
ability is unknown and unobservable but subject to learning. The ability of each director is
assessed by investors over time. For each firm, the sum of directors' assessed abilities may be
thought of as investors' assessment of the quality of the board. The ability of a director may
depend on firm characteristics. For example, a director with relevant industry expertise may
contribute more to firm value for a firm which operates in that particular industry.
It is assumed that there is symmetric information (see Holmström, 1999; Gibbons and
Murphy, 1992; Berk and Green, 2004 and Chung, Sensoy, Stern and Weisbach, 2012 for
symmetric information about managers' abilities). Assuming that follows a truncated normal
(A1)

189
distribution with prior mean and variance and that director abilities are independent and
identically distributed, individual assessed ability at time t is normally distributed:
The sum of assessed abilities also follows a normal distribution:
Under these assumptions, Bayesian updating by market participants leads to posterior
assessments of directors' ability (Pastor and Veronesi, 2003):
The revised assessment of ability is a function of two terms: and the expression in
brackets. Agents observe a higher-than-expected signal about the ability of a group of directors
when is positive, and revise their expectations upwards accordingly. This
revision depends on , which is the ratio of uncertainty about directors to uncertainty about the
firm's dividends. This implies that conditional on the realization of the signal, the larger the
uncertainty about directors, the larger the revision of assessed ability. Therefore, the Bayesian
learning framework predicts a positive relationship between the uncertainty about the ability of
directors and the magnitude of the revision of assessed ability. Bayesian updating generates
posterior variance of the assessment of ability of the form:
The posterior variance of assessment of directors' ability does not depend on the
realization of the signal but has a negative and convex relationship with t. Therefore, the model
(A3)
(A4)
(A5)
(A6)
(A2)
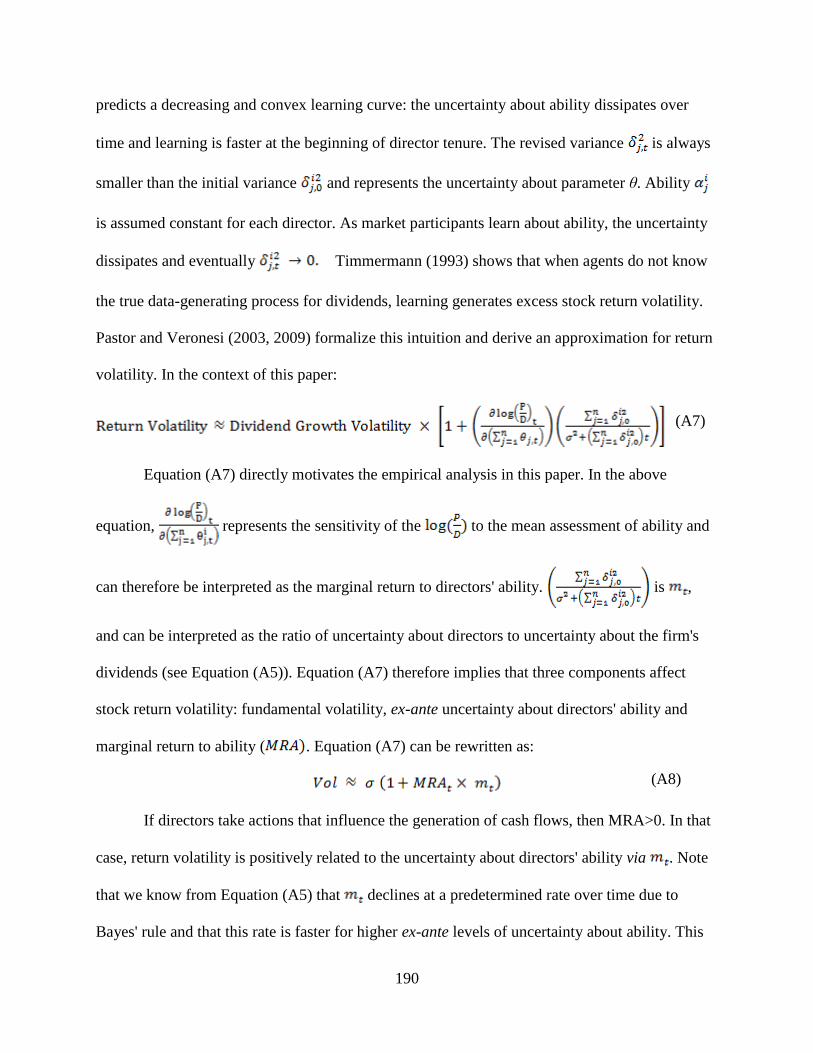
190
predicts a decreasing and convex learning curve: the uncertainty about ability dissipates over
time and learning is faster at the beginning of director tenure. The revised variance is always
smaller than the initial variance and represents the uncertainty about parameter θ. Ability
is assumed constant for each director. As market participants learn about ability, the uncertainty
dissipates and eventually Timmermann (1993) shows that when agents do not know
the true data-generating process for dividends, learning generates excess stock return volatility.
Pastor and Veronesi (2003, 2009) formalize this intuition and derive an approximation for return
volatility. In the context of this paper:
Equation (A7) directly motivates the empirical analysis in this paper. In the above
equation, represents the sensitivity of the to the mean assessment of ability and
can therefore be interpreted as the marginal return to directors' ability. is ,
and can be interpreted as the ratio of uncertainty about directors to uncertainty about the firm's
dividends (see Equation (A5)). Equation (A7) therefore implies that three components affect
stock return volatility: fundamental volatility, ex-ante uncertainty about directors' ability and
marginal return to ability ( . Equation (A7) can be rewritten as:
If directors take actions that influence the generation of cash flows, then MRA>0. In that
case, return volatility is positively related to the uncertainty about directors' ability via . Note
that we know from Equation (A5) that declines at a predetermined rate over time due to
Bayes' rule and that this rate is faster for higher ex-ante levels of uncertainty about ability. This
(A7)
(A8)

191
implies that after controlling for ex-ante uncertainty, cross-sectional analysis of declines in
volatility provides estimates of directors' marginal value. In other words, the extent of the decline
in volatility depends on the marginal value of that director.
In sum, the model presented above implies that if directors do not engage in window-
dressing but do in fact make a difference in the fortunes of the companies onto which boards
they sit, then we should observe a decline in volatility over director tenure. Moreover, the decline
should be more pronounced when directors are more value relevant. By exploiting the empirical
analysis stemming from these predictions, this article offers a new methodological approach to
evaluating corporate boards.

192
Appendix 3-C: SimScore
SimScore counts the number of shared characteristics from a pool of six characteristics for
incoming-departing director pairs when the departing director left due to death or retirement and
the firm operates in an environment of good stock return performance and low return volatility at
the time of appointment. All variables are constructed from BoardEx data and supplemented with
manual data collection when necessary. An incoming-departing director pair gets one point for
each characteristic in common, for a total of six possible points.
Gender from BoardEx, supplemented with manual collection.
Generations depression babies (born before
1926)
mature generation (born 1927-
1945)
baby boomers (born 1946-1964)
generation X (born 1965-1980)
generation Y (born after 1981)
Job expertise based on the directors’ job history in BoardEx. Word searches are
used to define eleven categories:
management
academia
politics
military
human resources
technology
science
marketing
law
finance
consulting
Board experience indicator variable equal to one for directors who have held a
minimum of two public directorships.
Industry directorship indicator variable equal to one for directors who have held
directorships in the same industry as the firm they are joining/leaving.
Industry work
experience
indicator variable equal to one for directors who have worked in the
industry of the firm they are joining/leaving.

193
SimScore summary statistics
Mean 3.49
25% 3
Median 4
75% 4
Std dev 1.22
Min 0
Max 6

194
Appendix 3-D: Estimating Director Related Uncertainty
The methodological approach in this paper allows estimating the percentage of overall volatility
imputable to the uncertainty surrounding the ability of directors at the time of their appointment
(δ0/Vol0). This section directly relies on the methodology derived in Pan et al. (2015). It involves
estimates of the average decline in volatility over director tenure, the average volatility in
corporate dividends (σ) and the average volatility at the time directors joins (Vol0).
From the return volatility approximation (see Appendix B for details):
let be the percentage excess volatility. Then, , and the
percentage change in excess volatility from time 0 to time t is .
The marginal return to ability is hypothesized constant over time, therefore, . Then,
. When t = 3, the percentage of overall volatility
attributable to the uncertainty about new directors, .

195
LIST OF REFERENCES
Adams, R. B., and D. Ferreira (2009) Women in the Boardroom and their Impact on Governance
and Performance. Journal of Financial Economics 94 (2): 291-309.
Adams, R. B., S. Gray, and J. Nowland (2012). Does Gender Matter in the Boardroom?
Evidence from the Market Reaction to Mandatory New Director Announcements. Working
Paper.
Adams, R. B., B. E. Hermalin, and M. S. Weisbach (2010) The Role of Boards of Directors in
Corporate Governance: A Conceptual Framework and Survey. Journal of Economic
Literature 48: 58-107.
Ai, C., and E. Norton. (2003) Interaction Terms in Logit and Probit Models. Economics Letters
80:123–29.
Alter, A. (2009) The Organization of Venture Capital Firms. Working Paper.
Ang, A., R. J. Hodrick, Y. Xing, and X. Zhang (2006) The Cross-Section of Volatility and
Expected Returns. Journal of Finance 61: 259-299.
Armstrong C. S., J. E. Core, and W. R. Guay (2014) Do Independent Directors Cause
Improvements in Firm Transparency? Journal of Financial Economics 113: 383-403.
Bajaj, M., S. Mazumdar, and A. Sarin (2000) Securities Class Action Settlements: an Empirical
Analysis. Santa Clara Law Review 43: 1001-1033.
Baker, M., and P. Gompers (2000) The Determinants of Board Structure and Function in
Entrepreneurial Firms. Harvard Business School Working Paper.

196
Baker, T., and S.J. Griffith (2007a) Predicting Corporate Governance Risk: Evidence from the
Directors' and Officers' Liability Insurance Market. University of Chicago Law Review 74:
1-58.
Baker, T., and S.J. Griffith (2007b) The Missing Monitor in Corporate Governance: The
Directors’ and Officers’ Liability Insurer. Georgetown Law Journal 95:
Baker, T., and S.J. Griffith (2008) How the Merits Matter: Directors’ and Officers’ Insurance
and Securities Settlements. University of Pennsylvania Law Review 157: 755-832.
Barnea, A., and I. Guedj (2007) CEO Compensation and Director Networks. Working paper,
Claremont McKenna College.
Beatty, R.P., and J.R. Ritter (1986) Investment Bank Reputation and the Underpricing of Initial
Public Offerings. Journal of Financial Economics 15: 213-232.
Beaver, W. H. (1968) The Information Content of Annual Earnings Announcements. Journal of
Accounting Research 6: 67-92.
Bebchuk, L.A., A. Cohen, and A. Ferrell (2009) What Matters in Corporate Governance? Review
of Financial Studies 22: 783-827.
Bebchuk, L. A., and A. Hamdani (2009) The Elusive Quest for Global Governance Standards.
University of Pennsylvania Law Review 157 (4): 1263-1317.
Bebchuk L.A., and M.S. Weisbach (2010) The State of Corporate Governance Research. Review
of Financial Studies 23: 939-961.
Berk, J., and R. Green (2004) Mutual Fund Flows and Performance in Rational Markets. Journal
of Political Economy 112: 1269-1295.
Berle A. A., and G. Means (1932) The Modern Corporation and Private Property. Second
Edition Harcourt, Brace and World, New York, 1967.

197
Bhagat, S., and B. Black (2000) Board Independence and Long-Term Firm Performance.
University of Colorado working paper.
Bhagat S., and B. Bolton (2008) Corporate Governance and Firm Performance. Journal of
Corporate Finance 14: 257-273.
Bhagat, S., J.A. Brickley, and J.L. Coles (1987) Managerial Indemnification and Liability
Insurance: The Effect on Shareholder Wealth. Journal of Risk and Insurance 54: 721-736.
Blades, J. (2006) A Different Outlook: D&O Underwriters are Putting Companies under more
Scrutiny Than in the Past. Best's Review: 107-108.
Boyer, M.M. (2003, 2013) Directors’ and Officers’ Insurance and Shareholders’ Protection.
CIRANO Scientific Series, No.2003s-64.
Boyer, M.M. and L.H. Stern (2012) Is Corporate Governance Risk Valued? Evidence from
Directors’ and Officers’ Insurance. Journal of Corporate Finance 18: 349-372.
Boyer, M.M., and S. Tennyson (2008) Directors’ and Officers’ Liability Insurance, Corporate
Risk and Risk Taking: New Panel Data Evidence on the Role of Directors’ and Officers’
Liability Insurance. Working Paper.
Cao, Z. and G.S. Narayanamoorthy (2011) The Effect of Litigation Risk on Management
Earnings Forecasts. Contemporary Accounting Research 28: 125-173.
Chalmers, J.M.R., L.Y. Dann and J. Harford (2002) Managerial Opportunism? Evidence from
Directors’ and Officers’ Insurance Purchases. Journal of Finance 57: 609-639.
Chevalier, J., and G. Ellison. (1997) Risk–Taking by Mutual Funds as a Response to Incentives.
Journal of Political Economy 105:1167–1200.
Chevalier, J., and G. Ellison. (1999) Career Concerns of Mutual Fund Managers. Quarterly
Journal of Economics 114:389–432.

198
Chhaochharia V. and Y. Grinstein (2009) CEO Compensation and Board Structure. Journal of
Finance 64: 231–261.
Chung, J., B. A. Sensoy, L. H. Stern, and M. S. Weisbach (2012) Pay for Performance from
Future Fund Flows: The Case of Private Equity. Review of Financial Studies 25: 3259-3304.
Choi, J. J., S. W. Park, and S. S. Yoo (2007) The Value of Outside Directors: Evidence from
Corporate Governance Reform in Korea. Journal of Financial and Quantitative Analysis 42:
942-962.
Clarkson, P. and D. Simunic (1994) The Association between Audit Quality, Retained
Ownership and Firm-Specific Risk in United States vs. Canadian IPO markets. Journal of
Accounting and Economics 17: 207-228.
Coles, J. L., N. D. Daniel, L. Naveen (2014) Co-opted Boards. Review of Financial Studies 27(6):
1751-1796.
Coles, J. L., N. D. Daniel, L. Naveen (2015) Board Groupthink. Working paper.
Connor, G. and R. Korajczyk (1986) Performance Measurement with the Arbitrage Pricing
Theory: A new Framework Analysis. Journal of Financial Economics. 15:373-394.
Core, J. E. (1997) On the Corporate Demand for Directors’ and Officers’ Insurance. Journal of
Risk and Insurance, 64: 63-87.
Core, J.E. (2000) The Directors’ and Officers’ Insurance Premium: An Outside Assessment of
the Quality of Corporate Governance. Journal of Law, Economics and Organization, 16: 449-
477
Core, J., R. Holthausen and D. Larcker (1999) Corporate Governance, Chief Executive Officer
Compensation and Firm Performance. Journal of Financial Economics 51: 371-406.

199
Daniel, N., J. McConnell and L. Naveen (2013) The Role of Non-Domestic Directors in U.S.
Firm. Working Paper, Drexel University, Purdue University, and Temple University.
DeGroot, M. H. (1970) Optimal Statistical Decisions. New York: MacMillan.
Denis, D., D. Denis and M. Walker (2015) CEO Assessment and the Structure of Newly Formed
Boards. Review of Financial Studies 28: 3338-3366.
Denis, D. and A. Sarin (1999) Ownership and Board Structures in Publicly Traded Corporations.
Journal of Financial Economics 52: 187-224.
Driessen, J., Lin, T., Phalippou, L. forthcoming. A New Method to Estimate Risk and Return of
Non-traded Assets from Cash Flows. Journal of Financial and Quantitative Analysis.
Duarte, J., A. Kamara, S. Siegel, and C. Sun (2012) The Common Components of Idiosyncratic
Volatility. Working paper.
Duchin, R., J. Matsusaka, and O. Ozbas (2010) When are Outside Directors Effective? Journal
of Financial Economics 96: 195-214.
Eisenberg, T., S. Sundgren, and M. T. Wells (1998) Larger Board Size and Decreasing Firm
Value in Small Firms. Journal of Financial Economics 48: 35-54.
Falato, A., D. Kadyrzhanova and U. Lel (2014) Distracted directors: Does board busyness hurt
shareholder value? Journal of Financial Economics: 113: 404-426.
Faleye, O., R. Hoitash, and U. Hoitash (2012) Industry Expertise on Corporate Boards.
Northeastern U. D’Amore-McKim School of Business Research Paper No. 2013-04.
Fama, E. F. (1980) Agency Problems and the Theory of the Firm. Journal of Political Economy
88:288–307.
Fama, E. F., and K. R. French (1993) Common Risk Factors in the Returns of Stocks and Bonds.
Journal of Financial Economics: 33: 3-56.

200
Fama, E. F., and K. R. French (2004) Newly Listed Firms: Fundamentals, Survival Rates, and
Returns. Journal of Financial Economics 73: 229-169.
Fernau, E. (2013) Executive Attributes, Director Attributes, and Firm Performance. Working
paper.
Ferris, S., M. Jagannathan and A. Pritchard (2003) Too Busy to Mind the Business? Monitoring
by Directors with Multiple Board Appointments. Journal of Finance 58: 1087-1111.
Fich, E. M., and A. Shivdasani (2006) Are Busy Boards Effective Monitors? Journal of Finance
61: 689-724.
Field, L., M. Lowry, and A. Mkrtchyan (2013) Are Busy Boards Detrimental? Journal of
Financial Economics 109: 63-82.
Fier, S., J. Gable, K.A. McCullough and N. Mansfield (2010) The Directors and Officers
Insurance Marketplace: An Empirical Examination of Supply and Demand in Uncertain
Times. Working Paper.
Fracassi, C. and G. Tate (2012) External Networking and Internal Firm Governance. Journal of
Finance 67: 153-194.
Francoeur, C., R. Labelle and B. Sinclair-Desgagné (2008) Gender Diversity in Corporate
Governance and Top Management. Journal of Business Ethics 81(1), 83-95.
Frazzini, A., and O. Lamont. (2008) Dumb Money: Mutual Fund Flows and the Cross-Section of
Stock Returns. Journal of Financial Economics 88:299–322.
Frydman, C., and D. Jenter. (2010) CEO Compensation. Annual Review of Financial Economics
2:75–102.
Gibbons, R. and K. J. Murphy (1992) Optimal Incentive Contracts in the Presence of Career
Concerns: Theory and Evidence. Journal of Political Economy 100: 468-505.

201
Gillan, S. L., J. C. Hartzell and L. T. Starks (2011) Tradeoffs in Corporate Governance:
Evidence from Board Structures and Charter Provisions. Quaterly Journal of Finance 1: 667-
705.
Gillan, S. and C. Panasian (2009) Reassessing what matters in Corporate Governance: Evidence
from the Market for Directors’ and Officers’ Liability Insurance. Working Paper.
Gillen, M. (2005) Income Trust Unitholder Liability: Risks and Legislative Response. Canadian
Business Law Journal 42: 325-345.
Gompers, P. (1996) Grandstanding in the Venture Capital Industry. Journal of Financial
Economics 42:133–56.
Gompers, P. A., J. Ishii and A. Metrick (2003) Corporate Governance and Equity Prices. The
Quarterly Journal of Economics 118: 107-155.
Gompers, P., and J. Lerner. (1998) What Drives Venture Capital Fundraising? Brookings Papers
on Economic Activity – Microeconomics: 149–92.
Gompers, P., and J. Lerner. (1999) An Analysis of Compensation in the U.S. Venture Capital
Partnership. Journal of Financial Economics 51: 3–44.
Greene, W. H. (2000) Econometric Analysis, 4th ed. Upper Saddle River, NJ: Prentice Hall.
Griffith, S.J. (2006) Uncovering a Gatekeeper: Why the SEC Should Mandate Disclosure of
Details Concerning Directors' and Officers' Liability Insurance Policy. University of
Pennsylvania Law Review 154: 1147-1208.
Gutiérrez, M. (2003) An Economic Analysis of Corporate Directors’ Fiduciary Duties. Rand
Journal of Economics 34: 516-535.
Hall, B., and J. Liebman. (1998) Are CEOs Really Paid Like Bureaucrats? Quarterly Journal of
Economics 113: 653–691.

202
Han, B., D. Hirshleifer, and J. Persons. (2009) Promotion Tournaments and Capital Rationing.
Review of Financial Studies 22: 219–55.
Harris, R., T. Jenkinson, and R. Stucke. (2010) A White Paper on Private Equity Data and
Research. Working Paper, UAI Foundation Consortium.
Harris, M. and A. Raviv (2008) A Theory of Board Control and Size. Review of Financial
Studies 21: 1797-1832.
Heckman, J. (1979). Sample Selection Bias as a Specification Error. Econometrica 47: 153-161.
Heys, B.A and M.L. Berenblut (2012) Trends in Canadian Securities Class Actions (2011
Update): Pace of Filings Grows, Pace of Settlements Slows. NERA Economic Consulting
Publication.
Hermalin, B. E. and M. S. Weisbach (1991) The Effects of Board Composition and Direct
Incentives on Firm Performance. Financial Management 20: 101-112.
Hermalin, B. E. and M. S. Weisbach (1998) Endogenously Chosen Boards of Directors and
Their Monitoring of the CEO. American Economic Review 88: 96-118.
Hermalin, B. E. and M. S. Weisbach (2003) Boards of Directors as an Endogenously Determined
Institution: A Survey of the Economic Literature. Federal Reserve Bank of New York
Economic Policy Review 9: 7-26.
Hermalin, B. E., and M. S. Weisbach (2012) Information Disclosure and Corporate Governance.
Journal of Finance 67: 195.233.
Hermalin, B. E. and M. S. Weisbach (2017) Assessing Managerial Ability: Implications for
Corporate Governance. The Handbook of the Economics of Corporate Governance.
203
Hochberg, Y., A. Ljungqvist, and A. Vissing-Jorgensen. (2010) Informational Hold-Up and
Performance Persistence in Venture Capital. Working Paper, Northwestern University and
New York University.
Holderness, C.G. (1990) Liability Insurers as Corporate Monitors. International Review of Law
and Economics 10: 115 -129.
Holmström, B. (1999) Managerial Incentive Problems: A Dynamic Perspective. Review of
Economic Studies 66: 169-182.
Hong, H., and J. Kubik. (2003) Analyzing the Analysts: Career Concerns and Biased Earnings
Forecasts. Journal of Finance 58: 313–51.
Hong, H., J. Kubik, and A. Solomon. (2000) Security Analysts’ Career Concerns and Herding of
Earnings Forecasts. RAND Journal of Economics 31: 121–44.
Huson, M.R. and F. Pazzaglia (2007) Choice of Organizational Form as a Trade-Off between Fit
and Market Timing. Working Paper.
Ippolito, R. (1992) Consumer Reaction to Measures of Poor Quality: Evidence from the Mutual
Fund Industry. Journal of Law and Economics 35: 45–70.
Jensen, M. C., and K. J. Murphy. (1990) Performance Pay and Top-Management Incentives.
Journal of Political Economy 98: 225–64.
Kaltchev, G.D. (2006) Dynamic Panel Models with Directors’ and Officers’ Liability Insurance
Data. In B.H. Baltagi (Editor), Panel Data Econometrics: 351-360.
Kaplan, S. N., and A. Schoar. (2005) Private Equity Performance: Returns, Persistence, and
Capital Flows. Journal of Finance 60: 1791–823.
Kaplan, S. N., and P. Strömberg. (2009) Leveraged Buyouts and Private Equity. Journal of
Economic Perspectives 23: 121–46.

204
Karpoff, J. M., R. Schonlau and E. Wehrly (2015) Do Takeover Defenses Deter Takeovers?
Working Paper.
Knepper, W. and D.A. Bailey (1998) Liability of Corporate Officers & Directors, Seventh
Edition, Matthew Bender edition.
Korn/Ferry International (2008) 33rd Annual Board of Directors study.
Korteweg, A., and M. Sorensen. (2010) Risk and Return Characteristics of Venture Capital-
Backed Entrepreneurial Companies. Review of Financial Studies 23: 3728–3772.
Kuhnen, C. (2009) Business Networks, Corporate Governance and Contracting in the Mutual
Fund Industry. Journal of Finance 64: 2185-2220.
Larcker, D. F., E. C. So, and C. C. Y. Wang (2013) Boardroom Centrality and Firm Performance.
Journal of Accounting & Economics 55: 225–250.
Larcker, D.F. and B. Tayan. (2013) Where Experts Get it Wrong: Independence vs. Leadership
in Corporate Governance. Rock Center for Corporate Governance. Working Paper.
Lazear, E. P., and S. Rosen. (1981) Rank-Order Tournaments as Optimum Labor Contracts.
Journal of Political Economy 89: 841–864.
Lerner, J., A. Schoar, and W. Wongsunwai. (2007) Smart Institutions, Foolish Choices? The
Limited Partner Performance Puzzle. Journal of Finance 62: 731–764.
Leslie, P., and P. Oyer. (2009) Managerial Incentives and Value Creation: Evidence from Private
Equity. Working Paper, Stanford University.
Lin, C., M.S. Officer and H. Zou (2011) Directors’ and officers’ liability insurance and
acquisition outcomes. Journal of Financial Economics 102: 507-525.

205
Linck, J.S, J.M. Netter and T. Yang (2009) The Effects and Unintended Consequences of the
Sarbanes-Oxley Act on the Supply and Demand for Directors. The Review of Financial
Studies 22(8): 3287-3328.
Mace, M.L. (1971) Directors: Myth and Reality. Boston: Harvard University.
Masulis, R. W., C. Ruzzier, S. Xiao, and S. Zhao (2012) Do Independent Expert Directors Matter?
Working Paper.
Masulis, R. W., C. Wang and F. Xie (2012) Globalizing the Boardroom – The Effects of Foreign
Directors on Corporate Governance and Firm Performance. Journal of Accounting and
Economics 53: 527-554.
McGurn, P. S. (2015) Keynote speech at The Eight Annual Academic Conference on Corporate
Governance at Drexel University. Speech on April 17th 2015.
McTier, B.C. and J.K. Wald (2011) The Causes and Consequences of Securities Class Action
Litigation. Journal of Corporate Finance 17: 649-665.
Metrick, A., and A. Yasuda. (2010) The Economics of Private Equity Funds. Review of
Financial Studies 23: 2303–2341.
Metrick, A., and A. Yasuda. (2011) Venture Capital and the Finance of Innovation. New York:
Wiley & Sons.
O’Sullivan, N. (1997) Insuring the Agents: The Role of Directors’ and Officers’ Insurance in
Corporate Governance. Journal of Risk and Insurance 64: 545-556.
Pan, Y., T. Y. Wang and M. S. Weisbach (2015) Learning about CEO Ability and Stock Return
Volatility. Review of Financial Studies 28: 1623-1666.
Park Wynn, J. (2008) Legal Liability Coverage and Voluntary Disclosure. The Accounting
Review 83: 1639-1669.

206
Pastor, L. and P. Veronesi (2003) Stock Valuation and Learning about Profitability. Journal of
Finance 58 (5): 1749-1790.
Pastor, L. and P. Veronesi (2009) Learning in Financial Markets. Annual Review of Financial
Economics. 1361-1381.
Phalippou, L. (2010) Venture Capital Funds: Flow-Performance Relationship and Performance
Persistence. Journal of Banking and Finance 34: 568–577.
Phalippou, L., and M. Zollo. (2005) What Drives Private Equity Performance? Working Paper,
University of Amsterdam.
Rees, R., D. Radulescu and P. Egger (2011) Corporate Governance and Managerial Incentives:
Evidence from the Market for D&O Insurance. Working paper.
Richardson, S. A., A. I. Tuna, and P. D. Wysocki (2003) Accounting for Taste: Board Member
Preferences and Corporate Policy Choices. MIT Sloan Working Paper No. 4307-03.
Ritter, J. (1984) The ‘hot issue’ market of 1980. Journal of Business 57: 215–240.
Ritter, J. (1987) The costs of going public. Journal of Financial Economics 19: 269-282.
Ritter, J. (1991) The long-run performance of initial public offerings. Journal of Finance 46: 3-
27.
Robinson, D., and B. Sensoy. (2011a) Cyclicality, Performance Measurement, and Cash Flow
Liquidity in Private Equity. Working Paper, Duke University and Ohio State University.
Robinson, D., and B. Sensoy. (2011b) Do Private Equity Fund Managers Earn Their Fees?
Compensation, Ownership, and Cash Flow Performance. Working Paper, Duke University
and Ohio State University.
Rose, P. (2007) The Corporate Governance Industry. Journal of Corporation Law: 32(4)

207
Rosen, S. (1986) Prizes and Incentives in Elimination Tournaments. American Economic Review
76: 701–716.
Sensoy, B. (2009) Performance Evaluation and Self-Designated Benchmark Indexes in the
Mutual Fund Industry. Journal of Financial Economics 92: 25–39.
Shivdasani, A. (1993) Board Composition, Ownership Structure, and Hostile Takeovers. Journal
of Accounting and Economics 16: 167-198.
Shivdasani, A. and D. Yermack (1999) CEO Involvement in the Selection of New Board
Members: An Empirical Analysis. Journal of Finance 54: 1829-1854.
Schwartz-Ziv, M. (2015) Gender and Board Activeness: The Role of a Critical Mass. Working
Paper.
Schwartz-Ziv, M. and M. S. Weisbach (2013) What do Boards Really Do? Evidence from
Minutes of Board Meetings. Journal of Financial Economics 108: 349-366.
Smith, A. (1776) An Inquiry into the Nature and Causes of The Wealth of Nations. New York:
Modern Library.
Timmermann, A. G. (1993) How Learning in Financial Markets Generates Excess Volatility and
Predictability in Stock Returns. Quaterly Journal of Economics 108: 1135-1145.
Weisbach, M. S. (1988) Outside Directors and CEO Turnover. Journal of Financial Economics
20: 431-460.
Weisdom, G.H., L.B. McCord and M.S. Williams (2006) What Board Members Need to know
About D&O Insurance. Consulting to Management 17: 48-53.
Wintoki, M. (2007) Corporate boards and regulation: The Effect of the Sarbanes–Oxley Act and
the Exchange Listing Requirements on Firm Value. Journal of Corporate Finance 13: 229-
250.

208
Woodward, S., and R. Hall. (2003) Benchmarking the Returns to Venture. Working Paper,
Stanford University.
Wu, Y. (2000) Honey, I Shrunk the Board. University of Chicago Working Paper.
Yermack, D. (1996) Higher Market Valuation of Companies with a Small Board of Directors.
Journal of Financial Economics 40: 185-211.
Yermack, D. (2006) Board Members and Company Value. Financial Markets Portfolio
Management 20:33-47.

209
VITA
Léa H. Stern
429 Paccar Hall, Foster School of Business
University of Washington, WA, 98195
Education Ph.D. in Business Administration Expected 2017
Syracuse University, Whitman School of Management, Syracuse, NY
Ph.D. Finance student 2009-2011
The Ohio State University, Fisher College of Business, Columbus, OH
M.Sc. Finance 2007 – 2009
HEC Montréal, Montréal, Canada
B.B.A. Finance 2004 – 2007
HEC Montréal, Montréal, Canada
Professional Experience
Acting Assistant Professor of Finance 2016 – present
Foster School of Business, University of Washington
Teaching Assistant 2013-2016
Whitman School of Management, Syracuse University
Research Assistant
Fisher School of Business, The Ohio State University 2009-2011
Best Paper Awards
Outstanding Paper Award, International Conference on Asia-Pacific Financial Markets, 2012
Wharton-WRDS Award for Best Paper on Empirical Finance, WFA meetings, 2011
Bank of Canada Best Paper Award, Northern Finance Association Conference, 2010
Doctoral and M.Sc. Research Grants Doctoral Award, Social Sciences and Humanities Research Council of Canada, 2009 – 2015
Summer Research Grant, Whitman Research Committee, 2013-2015
Master Award, Social Sciences and Humanities Research Council of Canada, 2008 – 2009
Research Grant, HEC Montréal, Finance Department, 2007
Other Grants AFA Doctoral Student Travel Grant, 2015

210
Awards of Excellence Women in Finance Association, 2009
National Bank of Canada, 2008
Standard Life-Edouard Montpetit, 2008
Special distinctions Mercure Excellence Profile, HEC Montréal, 2007
Honors Profile, HEC Montréal, 2007