essay 1: an analysis of the impact of dyslexia on risk … · 2015-01-22 · dyslexia and...
TRANSCRIPT
Journal of Behavioral Studies in Business
Dyslexia and allocation decisions, page 1
An analysis of the relationship between dyslexia, risk perception and
401(k) allocation decisions
Daria Newfeld
Dominican University
ABSTRACT
Recent behavioral research has documented that factors such as representativeness,
overconfidence, loss aversion, naiveté, wealth, age and gender all impact a person’s risk perception
and asset allocation decisions. Through the use of a simulated 401(k) asset allocation exercise, this
preliminary case study examines whether dyslexia, a specific learning disability which is
neurobiological in origin, influences these critical investment decisions.
Keywords: Investment, Behavioral Finance, Neuro Finance, Dyslexia, Learning Disabilities
Copyright statement: Authors retain the copyright to the manuscripts published in AABRI journals.
Please see the AABRI Copyright Policy at http://www.aabri.com/copyright.html.

Journal of Behavioral Studies in Business
Dyslexia and allocation decisions, page 2
INTRODUCTION
In recent years, following the decline in popularity (and for many firms, the financial
feasibility of) defined benefit retirement plans, 401(k) plan allocations have become one of the
primary financial decisions faced by working individuals in the United States. As of 2001, 45
million Americans held 401(k) plans totaling $1.75 trillion in assets (Holden and VanDerhei, 2001).
In light of the importance of these decisions it is interesting to investigate how investors make these
allocation decisions. According to the traditional finance paradigm, these investors, acting as
perfectly rational, risk adverse, utility maximizing agents in a perfect market with no transaction
costs or informational asymmetries will select the optimal portfolio by simultaneously minimizing
risk and maximizing return. Unfortunately, we do not live in this perfect world; instead as the field
of behavioral finance has shown, market frictions, both economic and emotional, influence our
decisions. Behavioral research has documented that biases such as representativeness,
overconfidence and fear can influence an investors risk perception; while, factors such as gender,
naivety, regret and loss aversion can influence asset allocation decisions.
In general, financial theory holds that people make investment decisions by analyzing the
risk of an investment alternative, and then deciding whether or not to purchase the asset based on
their risk tolerance and/or the degree to which the asset will provide a diversification benefit for
their current portfolios. Therefore, an individual’s risk perception plays a key role in his/her
investment decisions. Representativeness is an over-reliance on stereotypes. This bias causes
investors to view recent trends as representative of the underlying process and thus form inaccurate
expectations and risk perceptions. The representativeness bias has been shown to contribute to
inaccurate assessments of investment value and risk (De Bont and Thaler, 1985; Shefrin and
Statmen, 1995). Anchoring is a related bias whereby people rely too heavily on one piece of
available information and fail to accurately update their expectations as new information becomes
available. De Bont (1993) used this heuristic to explain why investor’s forecasts of an assets value
tend to center around their initial purchase price. Overconfidence has also been shown to impact
risk perception. The overconfidence bias is the tendency for people to overvalue their own
knowledge, abilities and contributions. This heuristic can lead investors to underestimate risk and
overestimate their ability to beat the market (Daniel et al., 1998)Psychology literature has long held
that women tend to be more risk adverse then men (Byrnes, 1999). With respect to financial
decisions, Olsen and Cox (2001) found that female finance professionals (CFAs and CFPs) placed
greater weight on downside risk than did their male colleagues. They also documented that women
appear to be more sensitive to ambiguity and uncertainty with respect to their investments. While
the impact of downside risk is heightened in women, its influence is not limited to them alone.
Koonce et al. (2004) find that higher potential loss outcomes lead to greater risk perceptions.
Just as risk perception can be influenced by behavioral biases, so too can asset allocation.
Sunden and Surette (1998) found that women hold a larger proportion of their retirement portfolios
in lower risk assets. Wang (1994) documented that as a consequence of this belief, financial
advisors often steer their female clients towards less risky investments. Naivety is another oft
sighted determinant of asset allocation. It is a common assumption that it is preferable to hold a
“diversified portfolio,” but since the ability to effectively choose such a portfolio eludes many, they
naively diversify by dividing their funds evenly across the available asset choices. This phenomena
has been studied by Benartzi and Thaler (2001) and Hubner and Jiang (2006). Regret and loss
aversion have also been shown to influence investment selection. According to prospect theory,
Journal of Behavioral Studies in Business
Dyslexia and allocation decisions, page 3
investors weigh losses twice as much as gains of a similar magnitude and thus will attempt to avoid
the regret associated with a loss (Kahneman and Tversky , 1979, 1992; Shefrin, 2002).
As this brief in summary indicates behavioral finance can be divided into two broad lines of
research both of which highlight the intersection of finance and psychology. One aspect of the
behavioral finance literature explores irrationalities that are common to all investors. Example in
this strain include: anchoring, representativeness, over confidence and the other biases discussed
above. The second line of inquiry examines the differences between groups for example,
sophisticated versus naive investors, and gender differences. This paper belongs to the second
category of the behavioral finance literature.
This paper expands upon this strain of literature by examining how dyslexia, a specific
learning disability which impacts a person’s capacity to successfully interpret and perform both
written and mathematical functions, is related to the risk perception and allocation decisions of
afflicted individuals. This preliminary study attempted to answer this question by comparing the
results of a simulated 401(k) investment allocation exercise across a matched sample of dyslexic
and mainstream subjects. Subjects were given “info sheets” for the asset allocation choices similar
to those provided by a firm’s HR department. The subjects were asked to judge the risk of each
investment alternative and select their optimal asset allocation from the list provided. The main
hypothesis being tested is that while dyslexics may be able to more accurately estimate the risk of
each investment alternative graphically, as a consequence of their assumed mathematical deficits,
they should experience greater difficulty performing the calculations necessary to derive the
optimal portfolio allocation and will thus resort to naïve diversification strategies.
Definition of Dyslexia and its Prevalence
Dyslexia is a specific learning disability that is neurobiological in origin. “It is characterized
by difficulties with accurate and/or fluent word recognition and by poor spelling or decoding
abilities.” (Lyon, 2003) There seems to be a common misconception that dyslexia only impacts a
person’s ability to learn to read; however, this is not true. Kay and Yeo (2003) note that several of
the cognitive features of dyslexia such as: working and long-term memory retrieval weakness,
difficulty memorizing step-by-step procedures and, sequencing difficulties can affect peoples’
success in mathematics and therefore potentially their investment decisions. Dyslexics often
experience difficulty memorizing number facts (such as multiplication tables) as well as correctly
“doing math operations” (IDA fact sheet, 2008). While conservative estimates of the prevalence of
dyslexia range between 3 and 6% of the general population (Singelton, 1999) the International
Dyslexia Association believes that 15-20% of the worldwide population may be afflicted (IDA fact
sheet, 2008).
In order to investigate how dyslexia is related to asset allocation, one must first establish
how these decisions are made by the mainstream population. The literature review in section 2
examines the decision making processes with respect to risk perception and asset allocation
decisions. Section 3 describes the hypothesis development by highlighting the potential differences
between the risk perception and asset allocation decision-making process of dyslexics as compared
to the mainstream population. Section 4 outlines the data collection and study design. Section 5
describes the results. Section 6 presents the conclusions and interpretations of the study and section
7 outlines possible extensions.

Journal of Behavioral Studies in Business
Dyslexia and allocation decisions, page 4
LITERATURE REVIEW
Problem Solving Methodologies
According to Vessey (1991), all problems can be broken into three components: the problem
presentation, the problem solving task and mental representation. Problem presentation is the
format in which the information is presented to the individual. The problem solving task is the
question which the individual seeks to resolve. The mental representation is the way that the
problem is conceptualized in the subject’s working memory as a function of both the problem
representation and task. For the purposes of this essay, the problem presentation refers to the format
of the financial data. The problem solving task is to analyze the risk of the asset in question to
determine whether or not one wishes to invest.
Once one has identified the problem, in our case whether or not to undertake an investment
opportunity, he or she must determine which problem solving methodology to employ. Vessey
(1991) describes the two basic problem solving methodologies: perceptual and analytical. The
perceptual or holistic approach to problem solving is based on the idea that subjects examine the
entire problem directly rather than explicitly examining each element (Amer, 1991). This approach
allows the subject to make associations based on perceived relationships in the data (Vessey, 1991).
Conversely, a subject using an analytic or linear problem solving methodology would begin by
decomposing the problem into its component parts and examining each sequentially (Amer, 1991).
This information processing strategy requires subjects to extract discrete values which are then used
in computational data analysis (Vessey, 1991).
Financial data are commonly presented either in graphic or tabular form. Normally graphs
illustrate trends in performance, while actual performance statistics, such as accounting statements,
are reported in tabular form. A good deal of research has been conducted on the impact that data
representation has on the problem solving methodology employed. Vessey (1991) explicitly
distinguishes between judgment and choice. As he explains it, judgment requires the subject to
make a decision concerning a number of alternatives in a set while choice requires one to select the
most preferable alternative. With respect to financial decisions, risk perception is a judgment while
asset allocation is a choice. Rosen and Rosenkoetter (1976) show that as a consequence of this
division, judgments tend to result from a holistic approach whereas choices result from an
analytical process. This finding implies that while subjects derive their risk perceptions by
examining trends in performance, their actual asset allocation decisions are more likely to stem
from direct data analysis.
The Impact of Data Presentation Formats
We have all heard the expression, “a picture is worth a thousand words”. To this end Larkin
and Simon (1987) document that graphs emphasize the relationships between data points because
they preserve the geometric and topological relations of the data. Briggs et al. (1988) argue that
graphical representations are preferable for tasks which require spatial reasoning such as looking for
patterns in data. It has also been shown that graphs are preferable for summarizing data, showing
trends and relationships over time and detecting deviations in the data (Jarvenpaa and Dickson,
1988). On the other hand, tabular based representations are superior for symbolic tasks which
require data extraction and calculation (Vessey and Galletta, 1991). Since tables are symbolic
representations of discrete data, they facilitate the analytical processes (Vessey, 1991). Taking these

Journal of Behavioral Studies in Business
Dyslexia and allocation decisions, page 5
findings into account, it has been theorized that graphical representations should be preferable for
depicting spatial data and making judgments (i.e. risk perception), while tabular representations
should be superior for tasks involving symbolic logic where the subject is required to make a choice
(i.e. asset allocation). This is the essence of the theory of cognitive fit proposed by Vessey (1991).
The theory of cognitive fit argues that the method by which information is presented to a
subject can influence the way that this information is processed. According to this theory the
individual problem solvers’ information processing is more efficient and effective when they are
able to employ the appropriate mental representations (i.e. graphs for spatial tasks and tables for
symbolic tasks). Empirical tests of this theory have had mixed results. Amer (1991) examines the
impact of graphical vs. tabular data representations on a subject’s ability to determine whether a
firm had violated its debt covenant (a choice). The subjects were given information concerning the
firm’s debt position, size, liquidity, earnings and interest coverage presented in tabular and 3
different graphical representations: bar graphs, polygon display and facial simulation. He found
significantly different decision accuracy across the different data representations with the polygon
and face graphics producing the worst results. In a similar study conducted by Frownfelter-Lohrke
(1998), subjects were asked to predict the firm’s financial position in the coming year (a spatial
task), as well as forecast the firm’s EPS in the following year (a symbolic task) using graphic,
tabular and combined data. Her findings do not support the theory of cognitive fit with regard to
decision accuracy; however, both of these decisions can be classified as judgments and her results
do show that the graphical group completed the spatial task fastest while the tabular group
completed the symbolic task slowest as one would predict when examining the tasks from a
judgment/choice perspective.
Risk Perception
As discussed above, people derive their risk perceptions by examining trends in
performance; therefore, visual biases which influence the interpretation of trends should impact a
subject’s risk perception. Raghubir and Das (2003) investigate whether people exhibit biases when
examining stock information in graphic form. They hypothesize that people sample the local
maxima and minima of a series and use this as a source of information to make investment related
judgments. Because stocks with longer (shorter) runs have higher (lower) maxima and lower
(higher) minima they are perceived as being more risky. The use of an information source as a tool
for making a judgment depends on the presence and “diagnosticity” of alternative information
sources (Feldman and Lynch, 1988). Local maxima and minima is one source of information a
person can use to judge the overall return and risk of a stock. If local maxima (minima) are over-
sampled relative to local minima (maxima) the trend line would be biased upward (downward)
causing the subject to increase (decrease) the perception of the risk. Consistent with this idea,
Raghubir and Das (2003) find that stocks with longer runs are perceived as riskier.
Behavioral biases have also been shown to impact risk perception. Koonce et al. (2004)
hypothesize that investors view risk as a function of both behavioral and statistical based
components. They propose that individuals judge the risk of financial items by considering both the
likelihood of positive and negative outcomes as well as their degree of worry and controllability.
Their study focuses specifically on the impacts of potential loss outcomes, and Slovic’s measures of
dread and the unknown. The potential loss outcome refers to the range of possible losses. Higher
(lower) potential loss outcomes lead to greater (lesser) perceived risk. According to Slovic (1987)
risk perceptions are a function of “dread” and the “unknown”. Dread captures the degree of control

Journal of Behavioral Studies in Business
Dyslexia and allocation decisions, page 6
a person has over the item as well as the amount of worry and catastrophic potential associated with
it, while the unknown refers to how well the item and/or its impact are understood by the subject.
Koonce et al. (2004) found that subjects’ quantified loss outcome expectations were influenced by
their risk ratings resulting from the dread and unknown measures. Specifically they note that the
potential loss outcome has an indirect effect on perceived risk via its influence on the subject’s
feeling of dread associated with the financial item in question. Their results are robust to the use of
either low context qualitative disclosures such as press releases and brokerage reports as well as
more detailed reports such as SEC required filings.
Another commonly researched behavioral phenomena is the representative heuristic. The
representative heuristic, as defined by Kahnemann and Tversky (1974) is the tendency for a subject
to rely too heavily on stereotypes or “available” information when making decisions regardless of
the size of the sample and, to seek out information that supports their point of view and discount
information which runs contrary to it. With regards to financial decisions, these tendencies can lead
people to infer that current short term trends will continue into the long term, ignoring the tendency
for reversion to the mean, and often resulting in biased judgments. To illustrate this phenomenon,
DeBont (1992) finds that long-term earnings forecasts by securities analysts tend to be biased in the
direction of recent success.
Asset Allocation Decisions
Bodie and Crane (1997) present a list of commonly accepted investment principles
promulgated by investment advisors and academics alike. They argue that funds saved for
retirement should primarily be invested in equities and long term fixed income securities. It is also
suggested that investors diversify their total portfolio across asset classes with the equity portion
diversified across industries and companies. With respect to age, they sight the popular adage that
the proportion of peoples’ equity holdings should be 100% minus their age. In general it is thought
that the recommended fraction of equity holdings should increase with wealth and marital status
(when both partners are employed) and decline with age. The commonly sighted argument for the
equity-wealth relationship is that wealthier individuals are more capable of bearing the increased
risk associated with equities (Agnew et al.,2003; Bodie and Crane, 1997; Bahandan and Deves,
2008). The marriage-equity relationship is based on the idea that married couples are able to
shoulder the risk of equity holdings because they can diversify across labor market shocks (Bodie
and Crane, 1997).
Based on a survey of 916 TIAA-CREFF members, Bodie and Crane (1997) find that age
and net wealth do in fact impact equity holding as the theories suggest. A similar study by Agnew
et al. (2003) supports these findings. Based on a study of trading activity of 6,778 401(k) plan
participants, they find that equity allocations are higher among males, higher income, and married
investors and lower among older investors. More recently, Bhandari and Deaves (2008) find that
the stock-bond mix is impacted by gender, age and income with younger, higher earning males
holding the largest proportion of equity. The age-equity relationship is studied by Ameriks and
Zeldes (2001) who classify this relationship as non-monotonic, initially increasing then decreasing
over an individual’s investment life cycle. Bhandari and Deaves (2008) argue that this relationship
exists because while investors tend to decrease their equity holding as they age, they increase their
equity exposure as they approach retirement because the returns associated with the higher risk of
the equity increases their ability to retire sooner.
Journal of Behavioral Studies in Business
Dyslexia and allocation decisions, page 7
As discussed previously, mean-variance theory holds that investors should maximize their
expected utility of wealth subject to a given level of risk tolerance. An efficient allocation is
produced when investors construct a portfolio which produces the highest expected return for a
given level of risk. According to this line of reasoning, an investor should not be concerned with
the number of assets in his (her) portfolio, but rather its risk-return profile, as such, the fraction of
equity funds offered should not affect the chosen allocation as long as the offerings are sufficiently
diverse. However, Benartzi and Thaler (2001) show that when faced with a list of potential
investment opportunities, their survey participants tended to naively diversify by simply dividing
their contributions evenly across the offered funds i.e.: choose an allocation of 1/n where n= the
total number of funds available. They document that, as a consequence of this tendency, the
proportion of the investor’s portfolio allocated toward stocks (bonds) is highly correlated with the
number of equity (debt) offerings available and may thus result in investment choices which are
more (less) risky then the subject intended1. More recently, Huberman and Jiang (2006)
investigated this phenomenon on a sample of 600 401(k) plans. They identified and investigated
two versions of the 1/n hypothesis: the classic version examined by Benartzi and Thaler (2001)
whereby individuals simply allocated their contributions equally across all funds offered, and the
“framing” version whereby participants tend to use more funds when their plan offers them more
and allocate proportionally more money to equity funds when the fraction of equity offerings is
greater. Huberman and Jiang (2006) found that, consistent with the first version, 1/3 of participants
allocated their money evenly across the funds that they chose. On the other hand they note that
investors typically chose to invest in 3-4 funds regardless of the number available which is
inconsistent with the second interpretation.
A recent study by Bahndan and Deaves (2008) evaluated the investment allocation acumen
of 1,992 Canadian defined contribution pension fund members based on their asset allocation
consistency (AAC). The participants AAC was determined based on a set of two asset allocation
exercises with varying choices. In the first trial, the participants were asked to allocate their funds
across a corporate bond fund, a government bond fund, and a stock fund. The second trial choices
were a bond fund, a growth stock fund, and a value stock fund. The allocations were defined as
AAC if the proportion of debt and equity holding remained the same across the two trials as
opposed to fluctuating as a consequence of the division of debt and equity choices as one would
expect for an investor following a naïve 1/n strategy. The authors found investors with higher
income, and greater investment experience were AAC. While their findings also indicated that
female participants were less likely to be AAC, this finding can be explained by the fact that the
females in the sample also tended to have lower levels of wealth and have less investment
experience. They also found that being AAC is associated with a higher sensitivity to risk taking
with aging, such that the equity exposure of an AAC investor declines by roughly 1% per year as
advocated by the 100% minus your age rule for debt-equity allocations.
HYPOTHESIS DEVELOPMENT
According to traditional financial theory, people should construct their 401(k) allocations by
first examining the risk and return of each investment alternative; then, using that information,
create a portfolio which maximizes expected return relative to their own degree of risk tolerance.
Let’s begin by analyzing each component of this question. Recall that Vessey (1991) states that
1 It should be noted that Benartzi and Thaler (2001) do not claim that the 1/n fund selection strategy is
necessarily inefficient since the allocation may still lie on the efficient frontier.

Journal of Behavioral Studies in Business
Dyslexia and allocation decisions, page 8
each problem can be broken down into three components: the problem presentation, the problem
solving task and the mental representation of the problem. In the case of 401(k) planning the
problem presentation usually takes the form of “info sheets” which are distributed by a company’s
HR department and contain graphical and/or tabular presentations of risk and return for the
investment in question. The problem solving task faced by the individual is two fold: first he or she
must analyze the risk of each alternative, then choose an appropriate allocation. The individual’s
mental representation, or conceptualization of the allocation question in their working memory, is
formed as a function of these two elements. The problem solving methodology employed by the
individual and his/her ability to accurately solve the problem are fundamentally linked to the
problem presentation and mental representation respectively.
As discussed above graphical representations are preferable for depicting spatial data, such
as patterns and trends, and facilitating judgments such as risk perception (Jarvenpaa and Dickerson,
1988). On the other hand, tabular representations are superior for tasks which require discrete data
analysis and computation (Vessey and Galletta, 1991), such as the choice of an optimal 401(k)
allocation. Taking this into account, in a perfectly rational world, one would expect an individual to
analyze the risk of each investment alternative graphically then choose their allocations by
computing the variance-covariance matrix to form the optimal portfolio2 using tabular data. Now,
consider how dyslexia may impact this process.
Several studies have explored the visual-spatial abilities of dyslexics with mixed results, due
in part to ambiguities in their respective methodologies. In an article describing the neurological
manifestations of dyslexia Stein (2001) argues that dyslexics are holistic (perceptual) rather than
linear (analytical) thinkers who have a distinct ability to “see the big picture.” He goes so far as to
propose that this ability may explain why dyslexia has survived through human evolution despite
the fact it puts the affected individuals at a distinct disadvantage in other areas. Using an unusual
method, von Karolyi et al. (2003) found that dyslexics exhibit superior visual spatial ability at the
global level as compared to the control group. Their subjects were asked to examine line drawings
of figures and determine whether the represented objects could exist in a 3 dimensional space. In
order to distinguish between possible and impossible objects, one must examine the figure in its
entirety (globally) to recognize conflicting or ambiguous connections3. They found that their
dyslexic subjects performed superior to the control group both in term of accuracy and speed.
Bacon et al. (2007) investigated the strategies employed by subjects in a syllogistic task. They
found that while most non-dyslexic subjects rely on a verbal approach, the majority of dyslexic
participants employed a spatial approach. Interestingly, they note comparable performance when
analyzing abstract content, but poorer performance on the part of the dyslexic participants when
examining visually concrete materials. This finding is very telling for our purposes because graphs
can be characterized as an abstract form of data representation while tables are concrete.
Dyslexics experience difficulty with number sequencing, memorizing number facts and,
“doing math operations” (Kay and Yeo, 2003; IDA fact sheet, 2008). They are also susceptible to
working memory retrieval deficits (Kay and Yeo, 2003). As a consequence of these factors, it is
hypothesized that dyslexics will have difficulty forming an accurate mental representation of risk
2 Or by examining the betas of the various potential portfolio components to accomplish the same
goal 3 An example of an impossible figure is the “Ascending and Descending” work by MC Escher
where subjects appear to be climbing up and down a winding staircase.

Journal of Behavioral Studies in Business
Dyslexia and allocation decisions, page 9
and return when they are presented with data in tabular form. If one cannot accurately conceptualize
data, then it is impossible to correctly interpret or apply it.
Hypothesis 1: Dyslexics are worse than their peers at accurately assessing the risk of an
asset when the data are presented in tabular form.
On the other hand, dyslexics are holistic learners with superior visual-spatial skills (Stein, 2001;
von Karolyi et al. 2003) therefore; they should have an advantage when it comes to interpreting
data presented in graphical form.
Hypothesis 2: Dyslexics are as good as, if not superior to, their peers at accurately
assessing the risk of an asset when the data are presented in graphical form.
With respect to the 401(k) asset allocation decision making process these hypotheses would suggest
that while dyslexics may be able to accurately estimate the risk of each investment alternative, as a
consequence of their potential mathematical deficits, they should experience great difficulty
performing the calculations necessary to derive the optimal portfolio allocation.
Hypothesis 3: Dyslexics are less able to accurately select the optimal portfolio allocation
consistent with their degree of risk tolerance when presented with data in
tabular form.
So how do dyslexics make their portfolio allocations? Probably the same way that the vast
majority of the population does, by relying on rules of thumb and naïve diversification strategies4!
The two most oft sited forms of naïve diversification are the framing and conditional 1/n
hypotheses (Benartzi and Thaler, 2001; Huberman and Jiang, 2006). Under the framing version,
individuals simply invest an equal proportion of their portfolios into each of the available
investment alternatives. The conditional version is slightly more sophisticated, and not necessarily
inefficient. Investors resorting to it will choose a subset of the available investment alternatives and
allocate their portfolio evenly across those.
I hypothesize that if a dyslexic person is presented with tabular data only and told to select
an “optimal allocation by diversifying across the investment alternatives” as Vanguard’s website
suggests; he or she is likely to resort of the framing version of 1/n and allocate equally across the
alternatives. This result would probably arise from pure frustration at looking at seemingly
meaningless numbers and a naïve understanding of the term diversity as “spreading risk”.
Hypothesis 4: Dyslexics are likely to rely on the framing version of the 1/n heuristic when
presented with data in tabular form.
SURVEY DESIGN
This case study examines relationship of dyslexia to an individual’s risk perception and
asset allocation decisions across various informational presentations. The subjects, students a large
4 Since all of the participants in this study are college students and thus approximately the same age,
none of the age based theories are examined

Journal of Behavioral Studies in Business
Dyslexia and allocation decisions, page 10
Midwestern university, were divided into two groups: dyslexic students (defined as students
identified by the university’s disabilities services department who have been documented with a
specific reading disability) and a matched control sample of mainstream students. The matching
sample will be constructed to mirror the dyslexic sample as closely as possible on the basis of
gender, academic standing and, number of finance, accounting and/or economics classes taken.
Subjects were asked to imagine that they have just started a new job and are setting up their
401(k) plan allocations5. Since the subjects will have a wide variety of academic and practical
backgrounds, they will be provided with a brief (1 page6) introduction to stocks, bonds, mutual
funds and 401(k) planning similar to information readily obtained on Fidelity and Vanguard’s
401(k) websites7. A copy of this introduction is in Appendix 1. While the number of actual 401(k)
allocation choices range from 4-59 (Iyengar and Kamenica, 2008), the number of choices provided
in the experimental literature range from 2-19;8 consistent with this, subjects were presented with 5
investment choices. The following investment alternatives where selected from Vanguard’s
website:
Each subject was provided with a set of 5 “info sheets”, one for each investment alternative.
A sample info sheet appears in Appendix 1. These info sheets are modeled after those distributed by
firms HR departments for the purpose of setting up 401(k) contributions and allocations. A brief
perusal of these materials shows that they typically contain graphical and/or tabular displays of 10
years worth of annual and either monthly or quarterly prices, as well as a brief description of the
funds’ strategy, objectives and fees.
A great deal of research has been done concerning whether investors’ evaluation of risk and
expectations of returns are influenced by the format in which information is presented. Since
traditional mean-variance theory holds that asset allocation decisions are made by maximizing
returns relative to risk, it is important to establish that each is stated as clearly as possible. With
respect to graphical displays of risk, Cleveland and McGill (1986) find that line graphs, bar charts,
5 While 401(k) contributions are obviously an equally important decision with regards to retirement
planning, they will not be studied in this essay. This essay uses risk tolerance as a control variable
to examine the impact of dyslexia on risk perception and asset allocation; however, contribution
decisions are inextricably linked to risk tolerance and thus will not add any additional value to this
study. 6 Dyslexic subjects were offered the opportunity to have this information presented to them
verbally. 7 The purpose of this paper is to examine the impact of dyslexia on asset allocation decisions;
therefore, the tax implications of the 401(k) contributions was not be covered in either the
introductory information provided to the subjects or in the study itself.
8 (Benartzi and Thaler, 2001; Koonce et al., 2004; Weber et al,. 2005; Sundali and Guerrero, 2006)
Vanguard Fund Name Vanguard Fund Symbol Fund Name used in Study
Prime Money Market Fund VMMXX Money Market Fund
Long Term Bond Index VBLTX Long Term Bond Fund
500 Index General Stock Fund VFINX Stock Fund
REIT Index General Stock Fund VGSIX Real Estate Fund
Global Equity International Fund VHGEX International Fund

Journal of Behavioral Studies in Business
Dyslexia and allocation decisions, page 11
histograms and dot charts are most effective at accurately communicating the magnitude of risk.
Similarly, Hollands and Spence (1992) show that trends are best analyzed with line graphs. With
respect to other information, Weber et al. (2005) find that knowledge of name and asset type also
impacts a person’s perception of risk and expected returns. Consistent with these findings, the info
sheets used in this case study contain names and descriptions of the strategy and objectives of the
fund in question taken directly from Vanguard’s website and all visual representations of risk and
return are in the form of line graphs.
In order to examine the impact of information presentation on the dyslexic subjects risk
perceptions and asset allocations the cross subject information conditions vary as follows:
Condition 1: Subjects’ info sheets contain only graphical presentations of risk and return
Condition 2: Subjects’ info sheets contain only tabular presentations of risk and return
Based on this information subjects were first asked to analyze the risk of each investment
alternative then, construct a portfolio for their hypothetical 401(k). Following Weber et al. (2005),
the impact of the information presentation on a subject’s risk perception will be analyzed through
both volatility estimates and rankings. The subjects were asked to estimate the volatility of each
alternative by predicting the median, upper bound (10th percentile) and lower bound (90th
percentile) values of a $100 investment in each alternative after one year. Their estimates are then
compared to the cross-sectional volatility forecasts calculated using the sample data based on the
Pearson and Tukey’s three point approximation:
Let subject i’s return projections for investment opportunity j be:
median value
lower bound (10th%)
upper bound (90th%)
)100/(3)100/(4.)100/(3.:
)()100/(3)100/(4.)100/(3.int)(
9.05.01.0
229.025.021.0
ijijijij
ijijijijij
YYYmeanWhere
meanYYYpoVol
Assuming log normal returns, mean and standard derivations of the quarterly and annual returns for
each alternative over the 10 year period covered were calculated in the info sheets and use them to
compute the historic volatility of asset j as follows:
t
j
tt
j
ehistmeanWhere
eehistVol
)(:
)1()(22
According to hypothesis 1, the dyslexic subjects should be less able to interpret the data presented
in tabular form. If the subjects were unable to recognize the trends and volatility which document
the asset’s risk they may have simply resorted to guessing; therefore, this hypothesis was tested by
examining the dispersion of their predictions.
5.0
ijY
1.0
ijY
9.0
ijY

Journal of Behavioral Studies in Business
Dyslexia and allocation decisions, page 12
Testing Hypothesis 1
Ho: The dyslexic sub-group’s volatility estimates will be less or equally widely dispersed
relative to the control group under condition 2 than under condition 1.
Ha: The dyslexic sub-group’s volatility estimates will be more widely dispersed relative to the
control group under condition 2 than under condition 1.
Next, the subjects were asked to rank the risk of each investment opportunity on a scale of 1(no
risk) to 9 (highest risk). Their estimates to the logarithm of asset’s historical volatility were
compaired: jhistVol )(100ln
According to hypothesis 2, the dyslexic subjects should be as accurate if not superior to the controls
at identifying the risk of the assets when presented with data in graphical form.
Testing Hypothesis 2
Ho1: The dyslexic sub-group’s risk estimates will be less than or equally accurate relative to the
control group under condition 1
Ha1: The dyslexic sub-group’s risk estimates will be more accurate relative to the control group
under condition 1
Ho2: The dyslexic sub-group’s risk estimates will be more accurate relative to the control group
under condition 2
Ha2: The dyslexic sub-group’s risk estimates will be less than or equally accurate relative to the
control group under condition 2
Finally, the subjects were instructed to construct their portfolio allocations by specifying which
investments they would like to include in their 401(k) as well as the percentage allocated to each
investment alternative.
In order to account for the impact of risk tolerance on each subject’s optimal allocation
decision, the Garbel-Lytton 13 item assessment was administered. Factor analysis indicates that the
assessment measures 3 components of risk tolerance: investment risk, risk comfort and experience
and speculative risk with several questions corresponding to each dimension (Garbel and Lytton,
1999, 2003). The validity of this particular test was examined in two separate studies, the original
study in 1999 which established the technique and a follow-up study in 2003 which re-examined its
effectiveness. The 1999 study consisted of a sample of 1,075 subjects employed as either faculty or
staff at a southern state university. The sample was found to be representative of the population on
most 4-year college campuses and had thus obtained higher education, income and socioeconomic
levels on average than the general population. The resulting scores from this sample range from 20
to 63 with a mean score of 37, a standard deviation of 6.4 and a reliability estimate of .78 (Garbel
and Lytton, 1999). Litwin (1995) established the minimum recommended target reliability estimate
at .7. Since the Garbel-Lytton 13 item assessment’s reliability estimate exceeds this threshold it
should accurately reflect a subject’s degree of financial risk tolerance. The follow-up study was
conducted via email to a more broadly distributed population and consisted of 378 respondents. The
scores for this sample ranged from 16 to 41 with a mean of 28.83, a standard deviation of 4.49 and
a reliability estimate of .7 (Garbel and Lytton, 2003). This second study examined the reliability
and perceived validity of the technique by documenting a statistically significant positive (negative)

Journal of Behavioral Studies in Business
Dyslexia and allocation decisions, page 13
empirical relationship between the subject’s score and the percentage of their equity (debt) holdings
(Garbel and Lytton, 2003).
According to hypothesis 3, dyslexics will be less able to select a portfolio allocation
consistent with their degree of risk tolerance when presented with data in tabular form. Whether
dyslexia is related to the subject’s allocation decisions by examining the efficiency of their
allocations relative to the mean-variance efficient allocation and the subject’s degree of risk
tolerance was the focus of hypothesis 3.
Testing Hypothesis 3
Ho1: The dyslexic sub-group’s Sharpe Ratios will be smaller or equal to the control group’s under
condition 1
Ha1: The dyslexic sub-group’s Sharpe Ratios will be larger than the control group’s under
condition 1
Ho2: The dyslexic sub-group’s Sharpe Ratios will be larger than the control group’s under
condition 2
Ha2: The dyslexic sub-group’s Sharpe Ratios will be smaller or equal to the control group’s under
condition 2
Ho3: The dyslexic sub-group’s RARs will be larger or equal to the control group’s under
condition 1
Ha3: The dyslexic sub-group’s RARs will smaller than the control group’s under condition 1
Ho4: The dyslexic sub-group’s RARs will be smaller than the control group’s under condition 2
Ha4: The dyslexic sub-group’s RARs will be larger or equal to the control group’s under
condition 2
Ho5: The dyslexic sub-group’s allocations will not plot on the efficient frontier under condition 1
Ha5: The dyslexic sub-group’s allocations will plot on the efficient frontier under condition 1
Ho6: The dyslexic sub-group’s allocations will plot on the efficient frontier under condition 2
Ha6: The dyslexic sub-group’s allocations will not plot on the efficient frontier under condition 2
Ho7: The higher the dyslexic subgroup’s degree of risk tolerance, the higher the standard
deviation of their portfolio allocation. This result will hold to a greater or equal degree under
condition 2 than under condition 1
Ha7: The higher the dyslexic subgroup’s degree of risk tolerance, the higher the standard
deviation of their portfolio allocation. This result will hold to a greater or equal degree under
condition 1 than under condition 2
Finally, it was examined whether dyslexics were more likely to rely on naïve diversification
strategies. This strategy says that individuals invest an equal proportion of their portfolios into each
of the available investment alternatives. Since there are 5 investment alternatives in this study, a
subject following this approach would allocate 20% of his portfolio to each. It was expected that
the dyslexic subjects would be more likely to rely on this heuristic, especially when presented with
only tabular data.
Testing Hypothesis 4
Ho1: An equal or smaller proportion of the dyslexic subgroup will allocate 20% to each
investment alterative under condition 2

Journal of Behavioral Studies in Business
Dyslexia and allocation decisions, page 14
Ha1 A greater proportion of the dyslexic subgroup will allocate 20% to each investment
alterative under condition 2
Ho2: A greater proportion of the dyslexic subgroup will allocate 20% to each investment
alterative under condition 1
Ha2: An equal or smaller proportion of the dyslexic subgroup will allocate 20% to each
investment alterative under condition 1
At the conclusion of the exercise, the subjects were asked to fill out a questionnaire detailing their
thought process for each decision. This questionnaire should help to flesh out the results by
providing the participants a chance to explain their strategies.
RESULTS
Survey Participants
Fliers were sent via email to 130 dyslexic students registered with the Office of Services for
Students with Disabilities at a large Midwestern university. During the first two weeks 2 people
responded so follow up emails were sent. The final sample size consists of 10 students: 5 dyslexic9
and 5 controls. Due to the small sample size this became a pilot case study. The control sample was
selected to match the dyslexic sample as closely as possible on the basis of gender, major, year in
school, and the number of finance, economics and accounting courses taken. Both samples consist
of: 2 juniors, 2 seniors and 1 graduate student. Two of the dyslexic sample (and their corresponding
control matches) are education majors, 2 are liberal arts majors and 1 is an engineering major. Two
of the participants (and their corresponding matches) have taken economics classes; none have
taken any finance or accounting courses. Seven of the participants were female, 3 were male. An
exact match for subject 2 could not be located, a dyslexic, senior, male liberal arts major who has
taken two economics classes. His control match is a female who meets all of the other criteria. The
dyslexic sample subjects received $20 compensation; the control subjects received $10.
Two dyslexic subjects and their matching controls were given graphic data. Three of the
dyslexic subjects and their matching controls were given tabular data. There is no specific reason
for this random 3-2 split across conditions 1 and 2.
The dyslexic sample averaged 28.2 minutes to complete the study, the control sample
averaged 26.6 minutes. In general the participants under condition 2 (tabular data) took longer to
complete the study than those under condition 1 (graphic data). Under condition 1 the dyslexic
(control) sample averaged 23 (21) minutes, while the condition 2 dyslexic (control) sample
averaged 35 (30). There appears to be no correlation between the amount of time spent on this study
and the results in any section.
The subjects were asked to rate their math skills on a scale of 1(poor) – 10 (excellent). The
averages for the dyslexic and control samples were 5.4 and 5 respectively. The rating break downs
were relatively consistent across the sub-groups. The condition 1 dyslexic (control) sample rating
averaged 6.5 (7) and the condition 2 dyslexic (control) sample rating averaged 4.67 (3.67). There
appears to be no consistent correlation between the subject’s math skills and their performance in
any section of this study.
9 A response rate of 3.8%.

Journal of Behavioral Studies in Business
Dyslexia and allocation decisions, page 15
Volatility Estimates
The subject’s estimates of each asset’s cross-sectional volatility, calculated using Pearson
and Tukey’s three point approximation, were compared to the historic annual volatility of each
investment opportunity over the 10 year sample period. Subject 8, a dyslexic subject under
condition 2 failed to provide dollar estimates for the stock, real estate and international funds. The
aggregate estimates for these funds are based on the remaining 2 participants in that subgroup. The
results are shown in Table 1 and Graph Set 1 in Appendix 2.
All subjects grossly under estimated the volatility of every investment alternative. Based on
the estimates given, none of the subgroups were able to correctly assess the relative volatility of the
funds. The aggregate control group came the closest; however, they over estimated the volatility of
the international fund relative to the stock fund. The dyslexic and control samples under condition 1
provided roughly the same estimate of the relative volatilities. These estimates were more accurate
than those of their condition 2 counterparts. Within condition 2, the control sample was more
accurate than the dyslexic sample. The dyslexic sample under condition 2 was the worst
performing sub-group.
Hypothesis 1 predicts that the dyslexic sub-group’s volatility estimates would be more
widely dispersed relative to the control group under condition 2 than under condition 1. The
dyslexic subsample’s standard deviation of estimates are higher for all funds under condition 2 than
under condition 1, but less high than the control sample under condition 2. This finding provides
mild support for hypothesis 1.
Risk Estimates
The subjects were asked to rank the risk of each investment opportunity on a scale of 1(no
risk) to 9 (highest risk). This was compared to the logarithm of asset’s historical volatility. The
results are shown in Table 2 and Graph set 2 in Appendix 2. The sample in aggregate over-
estimated the risk of all the funds. The aggregate dyslexic sample over-estimated the risk of the
money market, long term bond and real estate funds but under-estimated the risk of the stock and
international funds. The aggregate control sample, on the other hand, under-estimated the risk of the
stock, real estate and international funds and over-estimated the risk of the money market and long-
term bond funds. The dyslexic sample on average was more accurate than the control at identifying
the risk of the money market, stock and international funds; however, the standard deviation of their
responses was also greater. Both the dyslexic and control samples under condition 2 more
accurately estimated the risk of the money market and long term bond funds, while their condition 1
counterparts were more accurate with respect to the stock fund. The only points of deviation
between the sub-samples were the real estate and the international funds. The risk of real estate fund
was more accurately estimated by the dyslexics under condition 1 and the controls under condition
2 and visa versa for the international fund.
Hypothesis 2 predicts that the dyslexic sub-group’s risk estimates will be more accurate
relative to the control group under condition 1 and less accurate under condition 2. These
hypothesis are not supported by the data. None of the subgroups were consistently more accurate
than the others.
Journal of Behavioral Studies in Business
Dyslexia and allocation decisions, page 16
Allocations
The subjects were asked to construct their portfolio allocations by specifying which
investments they would like to include as well as the percentage allocated to each investment
alternative. The influence of dyslexia on subjects’ allocation decisions is determined by examining
the efficiency of their allocations relative to the mean-variance efficient allocation and the subject’s
degree of risk tolerance. The portfolio Sharpe ratios were calculated for all allocations on both a
quarterly and annual basis using both the average and end of period returns on the 10 year constant
maturity Treasury bond over the sample period to proxy for the risk free rate of return. The quality
of the allocations is analyzed in table 3 in Appendix 2.
The Sharpe ratio10
captures how well the return of the portfolio compensates the investor for
the risk taken; the higher the Sharpe ratio the better the selected allocation (Sharpe, 1966). All of
the sample allocations have negative Sharpe ratios. The best allocation was chosen by subject 3, a
dyslexic under condition 1. Despite this, in aggregate the control sample allocations were superior
to those of the dyslexic sample. The control sample’s allocations under condition 2 outperform their
condition 1 counterparts. The dyslexic sample on the other hand selected better allocations under
condition 1 then under condition 2. Likewise the dyslexic condition 1 subsample outperformed
their matched controls.
Hypotheses 3-1&2 predict that the dyslexic sub-group’s Sharpe Ratios will be larger relative to the
control groups’ under condition 1 and smaller under condition 2. The results support these
hypotheses.
Like the Sharpe ratio, the return adjusted risk (RAR)11
is a measure of performance. The
RAR adjusts the return of an asset or portfolio to match the return of the market portfolio (Liano
and Sanchini, 2009). This measure allows one gage the performance of portfolio based on risk. If
the RAR is less (more) than the risk of the market then the portfolio has out (under) preformed
relative to the market (Liano and Sanchini, 2009). The RARs for the sample portfolios were
calculated using the 10 year constant maturity Treasury bond to proxy for the risk free rate and the
S&P500 returns to proxy for the market return. The RARs indicate that, in aggregate; the portfolios
constructed by the sample out-performed the market on an annual basis but under preformed on a
quarterly basis. Based on an analysis of the RARs, the dyslexic samples’ allocations out preformed
those of the control sample in aggregate. The control sample’s allocations under condition 1
outperform their condition 2 counterparts. The reserve was true for the dyslexic subsamples.
Surprisingly, the aggregate dyslexic subsample under condition 2 preformed the best.
Hypotheses 3-3 &4 say that the dyslexic sub-group’s return adjusted risks will be larger
relative to the control groups’ under condition 2 and smaller condition 1. The results do not support
these hypotheses.
The minimum variance frontier was calculated using the quarterly and annual sample data
from Vanguard. The capital market line was calculated using both the average and end of period
10
p
fp RRRatioSharpe
11
fp
fm
pRR
RRRAR

Journal of Behavioral Studies in Business
Dyslexia and allocation decisions, page 17
returns on the 10 year constant maturity Treasury bond over the sample period12
. The sample
allocations are plotted relative to the minimum variance frontier and the capital market line in graph
3 in Appendix 3.
None of the selected allocations lie on either the capital market line or the efficient portion
of the minimum variance frontier. Only two allocations lie on the frontier at all. These allocations,
which lie on the lower half of the frontier, were selected by control subjects under condition 1. This
finding is inconsistent with hypothesis 3-5&6 which predicted that the dyslexic sub-group’s
allocations will plot on the efficient frontier under condition 1 but not under condition 2; although
in aggregate the allocations of the dyslexic subjects do lie closer to the frontier under condition 1
than under condition 2.
Hypothesis 3-7 states that the dyslexic subgroup’s allocations will be more consistent with
their degree of risk tolerance under condition 1then under condition 2. This relationship is
documented in Graph 4 in Appendix 3. The results indicate that this relationship holds nearly
equally well for the dyslexic and control samples. This provides mild support for hypothesis 3-7.
Allocation Strategies
The subject’s allocations are shown in Graph 5 and in table 4 in appendix 3. None of the
subjects chose to allocate their investment evenly across all 5 funds. The aggregate dyslexic
subsample under condition 1 came the closest. These results do not support hypothesis 4 which
suggests that the dyslexic subjects under condition 2 are more likely to rely on the 1/n naïve
diversification strategy.
According to the questionnaire: 5 participants choose assets to minimize their risk, 3 choose
assets to maximize their return, 2 chose assets with a mix of return estimates and 2 chose assets that
“moved against one another.” None of the participants stated that they tried to accomplish both
simultaneously. Paradoxically, the subjects who said they picked portfolios to minimize risk chose
allocations with a higher average standard deviation than those who didn’t (8.67% vs. 7.76%).
Similarly, the participants who picked portfolios to maximize return selected portfolios with a lower
average annual return than those who didn’t follow this strategy (1.82% vs. 1.86%). In aggregate
the best portfolio allocation was chosen by those subjects who concentrated more on minimizing
the risk of their portfolio.
CONCLUSIONS AND INTERPRETATIONS
Based on a matched sample of 5 dyslexic and mainstream students at the University of
Nebraska-Lincoln, this pilot case study examines how dyslexia effects the risk perception and
allocation decisions of afflicted individuals through the use of a simulated 401(k) investment
allocation exercise. The main hypothesis being tested is that while dyslexics may be able to
accurately estimate the risk of each investment alternative graphically, as a consequence of their
assumed mathematical deficits, they should experience greater difficulty performing the
calculations necessary to derive the optimal portfolio allocation and thus resort to naïve
diversification strategies. The results of this study indicate that the dyslexic subjects risk perception
and allocation choices were almost universally inferior to their peers. Of course all of these results
12
For consistency, only graphs based on the average annual Treasury bond returns are shown in the
paper. The graphs documenting the other forms of treasury data can be found in appendix 3.

Journal of Behavioral Studies in Business
Dyslexia and allocation decisions, page 18
must be considered in light of the small sample size and resulting sub-sample sizes. Also, the
allocations of the controls given tabular data were superior to those given graphical data. This result
is counterintuitive and requires further study.
Following Weber et al. (2005), the impact of the information presentation on a subject’s risk
perception was analyzed using both volatility estimates and rankings. None of the subjects were
able to correctly estimate the volatility of the funds irrespective of their dyslexic status. On the
other hand, consistent with Weber et al (2005), the participants (both dyslexic and control) who
received graphic data did a better job at estimating a risk ranking. This result was true for both the
control and dyslexic subjects though less so for the latter. This finding is troubling because the
dyslexic community often advocates the use of graphic data representations to “level the playing
field,” and yet this does not seem to have been sufficient in this case.
This study shows that dyslexic subjects will not automatically revert to the 1/n naive
diversification strategy. The participants who received graphic data chose better allocations than
their control matches, but these allocations were not as good as those selected by the controls given
tabular data.
The findings suggest that dyslexic individuals should seek investment advice when selecting
their 401(k) asset allocations. If no investment advice is available they should rely on graphical data
to choose their portfolio allocations.
SUGGESTIONS FOR FUTURE RESEARCH
Due to the small sample size this study’s finding are rather inconclusive; sure the dyslexics
did badly, but so did everyone else! Without a larger sample it is impossible to determine whether
or not any true patterns emerge. The optimal sample size would be 120 subjects, 30 per sub-group.
In order to increase the response rate, automating the study and emailing it to the potential
participants would be preferred. One potential explanation for the atrocious response rate is that
this study was combined with an educational study which required at least a 1 hour time
commitment from the subjects. Hopefully unbundling the two will also increase participation.
Participation should also be increased if compensation could be increasedvia a grant.
REFERENCES
Agnew, J., Balduzzi, P., and Sunden, A. (2003) Portfolio Choice and Trading in a Large 401(k)
Plan, American Economic Review 93, 193–215
Amer, T. 1991. “An Experimental Investigation of Multi-cue Financial Information Display and
Decision Making.” Journal of Information Systems. (Fall): 18-34.
Ameriks, John, and Stephen P. Zeldes. “How Do Household Portfolio Shares Vary With Age?”
Working paper, Columbia University, 2000.
Benartzi, S., and R. Thaler, 2001, Naive Diversification Strategies in Defined Contribution Saving
Plans, American Economic Review
Beyond Greed and Fear: Understanding Behavioral Finance and the Psychology of Investing,
Boston, MA: Harvard Business School Press, Revised version published 2002, New York:
Oxford University Press
Bhandari, G. and Deaves, R., Misinformed and informed asset allocation decisions of self-directed
retirement plan members. Journal of Economic Psychology. v29. 473-490.

Journal of Behavioral Studies in Business
Dyslexia and allocation decisions, page 19
Bodie, Zvi, and Dwight B. Crane. 1997. Personal investing: Advice, theory and evidence. Financial
Analysts Journal 53(6): 13–23.
Bondt, Werner F. M. and Richard Thaler, 1985, Does the stock market overreact? Journal of
Finance 40, 793-805.
Byrne, (1999) Social Exclusion, Buckingham:Open University Press Ditch, J. et al (1996) A
synthesis of National Family Policies 1994, York: European Observatory on National
Family Policies, University of York
Frownfelter-Lohrke, C. (1998). “The effects of differing presentations of general purpose financial
statements on users’ decisions”, Journal of Information Systems, 12(2), pp 99-107.
Holden, Sarah, and Jack VanDerhei. (2001). `Contribution Behavior of 401(k) Plan Participants.`
ICI Perspective 7(4): 1-20 , and EBRI Issue Brief 238: 1-20.
Huberman, Gur, and Wei Jiang. 2006. “Offering versus Choice in 401(K) Plans: Equity Exposure
and Number of Funds.” Journal of Finance, 61(2): 763–801.
Jarvenpaa, S.L., Dickson, G.W. (1988), "Graphics and managerial decision making: research based
guidelines", Communications of the ACM, Vol. 31 No.6, pp.764-74.
Kahneman, D., & Lovallo, D. (1993). Timid choices and bold forecasts: A cognitive perspective on
risk-taking. Management Science, 39, 17-31.
Kahneman, D., & Tversky, A. (1979). Prospect theory: An analysis of decisions under risk.
Econometrica, 47, 313-327.
Koonce, L., M. Lipe, and M. McAnally. 2005. Judging the risk of financial instruments: Problems
and potential remedies. The Accounting Review 80 (3): 871-95.
Larkin, J. & Simon, H. (1987) Why a diagram is (sometimes) worth ten thousand words. Cognitive
Science, 11:65-99.
Kartono Liano and Alexandre Sanchini. (2009), Return-adjusted risk, Journal of Financial
Education 34 (Fall), 94-100
Lyon, G.R., Shaywitz, S.E., & Shaywitz, B.A. (2003). A definition of dyslexia. Annals of
Dyslexia, 53, 1-15.
Olsen, R. A., & Cox, C. M. (2001). The influence of gender on the perception and response to
investment risk: The case of professional investors. The Journal of Psychology and
Financial Markets, 2, 29-36.
Rosen, L. D., & Rosenkoetter, P. (1976). An eye fixation analysis of choice of judgment with
multiattribute stimuli. Memory and Cognition, 4, 747–752.
Sharpe, W. F. (1966). "Mutual Fund Performance". Journal of Business 39 (S1): 119–138
Shlomo Benartzi & Richard H. Thaler, 2001. "Naive Diversification Strategies in Defined
Contribution Saving Plans," American Economic Review, American Economic Association,
vol. 91(1), pages 79-98, March.
Slovic, P. (1987). Perception of risk. Science, 236, 280-285.
Stein, John (2001-01). "The magnocellular theory of developmental dyslexia.". Dyslexia 7 issue1:
12-36
Sundén, Annika and Brian J. Surette. 1998. "Gender Differences in the Allocation of Assets in
Retirement Savings Plans," American Economic Review Papers and Proceedings 88(2)
Vessey, Iris (1991). Cognitive Fit: A Theory-Based Analysis of the Graphs Versus Tables
Literature. Decision Sciences 22,(2), 219-240.
Vessey, Iris, Galletta, Dennis (1991). Cognitive Fit: An Empirical Study of Information
Acquisition. Information Systems Research, 2(1), 63-84.
von Karolyi et al, Brain and Language (2003) 85 427–431

Journal of Behavioral Studies in Business
Dyslexia and allocation decisions, page 20
Wang, P. 1994. Brokers still treat men better than women. Money, 23, 108-110.
Weber, E.U., Siebenmorgen, N. and Weber, M. (2005), Communicating Asset Risk: How Name
Recognition and the Format of Historic Volatility Information Affect Risk Perception and
Investment Decisions, Risk Analysis 25, 597--609.
APPENDIXES
Appendix 1: Simulated 401(k) Allocation Exercise
Imagine that it is your first day at a new job. Your supervisor has taken you to the HR department
to get you set up. As part of this process, the HR person has handed you the following packet of
information and asked you to set up your 401(k).
Step 1: Read the Introduction to 401(k) Investments.
Step 2: Complete the Garbel-Lytton 13 item Assessment of Risk Tolerance.
Step 3: Use the info sheets provided to fill out the Risk Assessment Sheet for each investment
alternative.
Step 4: Select an allocation for your 401(k) based on your analysis of the risk of each investment
alternative. You will do so by filling out the Allocation Sheet.
Step 5: Fill out the methodology and demographic questionnaire
Your firm offers 5 investment choices:
Money Market Fund
Long Term Bond Fund
Stock Fund
Real Estate Fund
International Fund
The following info sheets will provide you with 10 years worth of annual and quarterly return data
for each fund as well as a brief description of fund’s strategy and objectives.
Introduction to 401(k) Investments
A 401(k) is a type of retirement savings plan. The plan works by authorizing your employer to
deduct a certain pre-specified amount of money from your paycheck to invest for retirement. You
can decide how this money is invested by choosing from a list of investment options provided by
your company. Your investment choices will consist of a list of stock, bond and mutual funds. You
can choose to invest in as many or as few funds as you wish and allocate as much or as little as you
wish to each fund. The only requirement is that your total allocation must add up to 100%.
A stock represents a share of ownership in a company (ex, a share of IBM). Common stock holders
(investors) participate in the gains of the company through share price appreciation and dividend
distributions. Dividends can take the form of either cash payouts or additional stock distributions
from the company to the shareholders. Stock ownership allows for unlimited gains if the company

Journal of Behavioral Studies in Business
Dyslexia and allocation decisions, page 21
-30.00%
-20.00%
-10.00%
0.00%
10.00%
20.00%
30.00%
Mar-
99
Mar-
00
Mar-
01
Mar-
02
Mar-
03
Mar-
04
Mar-
05
Mar-
06
Mar-
07
Mar-
08
Mar-
09
Quarterly Returns
does well; however, there is also the chance that you could loose your entire investment if the firm
goes bankrupt.
A bond is like a loan that you make to the company which specifies how you are to be paid back
over time. More specifically, a bond is a debt security which obligates the company to pay the bond
holder interest in periodic installments known as coupon payments, as well as the face value of the
bond at its maturity (end date). Debt ownership allows for limited gains since the maximum return
that you can receive is specified by the coupon rate. As with a stock investment, there is a chance
that you could loose your entire investment in bonds if the company goes bankrupt.
In general, stocks pay a higher rate of return than bonds since their payments are more uncertain.
Stocks and bonds from larger domestic companies tend to be safer than those of smaller domestic or
international firms. The safest types of bonds are those sold by the US treasury. These bonds have
zero default risk meaning that you are guaranteed to earn the quoted return. Overall the more risky
the investment, the higher the rate of return paid.
Mutual funds collect money from several investors and invest this money in a pool of stocks and
bonds. Each investor shares proportionally in the gains and losses of the fund. Mutual funds offer
investors the advantages of diversification and professional portfolio management.
Sample Asset Description
Money Market Fund- Condition 1
Product Summary: This is the most conservative type of mutual fund. Its its goal is to maintain the
$1 value of its shares while providing income. This fund invests in high-quality, short-term
securities. It is an appropriate place for savings that you want to preserve, but also want to earn
income on. This fund has typically offered higher yields than bank accounts. It provides convenient
access to your savings because you can write checks or transfer money electronically to and from
your bank account.

Journal of Behavioral Studies in Business
Dyslexia and allocation decisions, page 22
-60.00%
-40.00%
-20.00%
0.00%
20.00%
40.00%
60.00%
1995 2000 2005 2010
Annual Returns Relative to Benchmark
Money MarketFundMoney MarketAverage
Money Market Fund- Condition 2
Product Summary: This is the most conservative type of mutual fund. Its goal is to maintain the $1
value of its shares while providing income. This fund invests in high-quality, short-term securities.
It is an appropriate place for savings that you want to preserve, but also want to earn income on.
This fund has typically offered higher yields than bank accounts. It provides convenient access to
your savings because you can write checks or transfer money electronically to and from your bank
account.
Year
Money Market Fund
Money
Market
Average
First
Quarter
Second
Quarter
Third
Quarter
Fourth
Quarter
Year-
End
Return
Year-
End
Average
2009 0.33% 0.12% — — — —
2008 0.96% 0.59% 0.56% 0.64% 2.77% 2.04%
2007 1.26% 1.28% 1.29% 1.21% 5.14% 4.49%
2006 1.05% 1.17% 1.29% 1.29% 4.88% 4.20%
2005 0.55% 0.67% 0.80% 0.95% 3.01% 2.37%
2004 0.19% 0.19% 0.30% 0.42% 1.11% 0.60%
2003 0.28% 0.23% 0.20% 0.19% 0.90% 0.44%
2002 0.46% 0.45% 0.39% 0.35% 1.65% 1.00%
2001 1.43% 1.14% 0.90% 0.63% 4.17% 3.44%
2000 1.41% 1.52% 1.61% 1.61% 6.29% 5.70%
1999 1.18% 1.16% 1.23% 1.35% 5.01% 4.49%

Journal of Behavioral Studies in Business
Dyslexia and allocation decisions, page 23
Risk Assessment Sheet (One for each Fund under both conditions)
1. What is your best estimate of the average value of a $100 investment in this fund after one
year? Assume average economic conditions.
2. Suppose next year is a bad economic year, what is your best estimate of the value of that
same $100 value in that case?
3. Suppose next year is a great economic year, what is your best estimate of the value of that
same $100 value in that case?
4. Rank risk of this investment on a scale of 1(no risk) to 9(highest risk)
401(k) Allocation Sheet
Now that you have reviewed all of the available data you must make your 401(k) asset allocation
decision. You can choose to invest in as many or as few funds as you wish and allocate as much or
as little as you wish to each fund. The only requirement is that your total allocation must add
up to 100%.
Money Market
Fund
Long-Term Bond
Fund
Stock
Fund
Real Estate
Fund
International
Fund
Do your percentages add up to 100%?
Methodology and Demographic Questionnaire
Circle all the apply or explain in the space provided
There are no right or wrong answers!
Remember all information provided will remain strictly confidential
1. What strategy did you use to estimate the risk of each asset?
A) I looked for trends in the graphical (tabular) data
B) I examined the volatility of each asset using the graphical (tabular) data
C) I examined the performance of each asset relative to its benchmark using the graphical
(tabular) data
D) Other:
2. How did you decide on your final allocation?

Journal of Behavioral Studies in Business
Dyslexia and allocation decisions, page 24
A) I looked for assets that moved against each other using the graphical (tabular) data
C) I choose assets with a different mix of risk estimates
E) I divided my allocation evenly across the asset choices
F) I choose to allocate more to certain assets to maximize my return
G) I choose to allocate more to certain assets to minimize my risk
H) Other:
3. Rate your math skills on a scale of 1(poor) - 10(excellent):
4. I am a:
Freshman Sophomore Junior Senior Grad Student
5. I am a:
Male Female
6. What is your major?
Business Engineering Liberal Arts Sciences Education
7. Have you ever taken an accounting, finance or economics class and if so how many?
8. Do you currently, or have you ever owned any shares of stock?
Yes No
9. Do you currently, or have you ever owned any fixed income investments (ex bonds)?
Yes No
10. Do you currently, or have you ever invested in a 401(k) plan? Yes No

Journal of Behavioral Studies in Business
Dyslexia and allocation decisions, page 25
Appendix 2
Table 1: Aggregate Volatility Estimates
MM LTB INDEX REIT GLOBAL
vol(hist)j 64.47% 192.53% 274.56% 841.48% 738.75%
Panel A: Mean Estimates
Dyslexic 26.06% 34.20% 28.35% 28.45% 42.50%
Control 39.09% 30.68% 47.24% 40.10% 108.58%
Dyslexic Graphic 29.41% 31.93% 34.24% 36.72% 39.73%
Dyslexic Tabular 23.82% 35.71% 22.46% 20.18% 45.27%
Control Graphic 29.01% 31.07% 33.97% 36.57% 36.76%
Control Tabular 45.81% 30.43% 56.09% 42.45% 156.47%
Panel B: Standard Deviation of
Estimates
Dyslexic 8.86% 3.77% 13.80% 14.14% 7.96%
Control 14.89% 3.71% 27.24% 6.55% 158.46%
Dyslexic Graphic 0.94% 0.78% 1.91% 1.66% 1.56%
Dyslexic Tabular 11.74% 4.43% 20.72% 18.00% 12.52%
Control Graphic 0.34% 0.65% 2.32% 2.46% 5.99%
Control Tabular 16.56% 5.21% 34.47% 7.88% 203.97%
Graph Set 1: Volatility Estimates
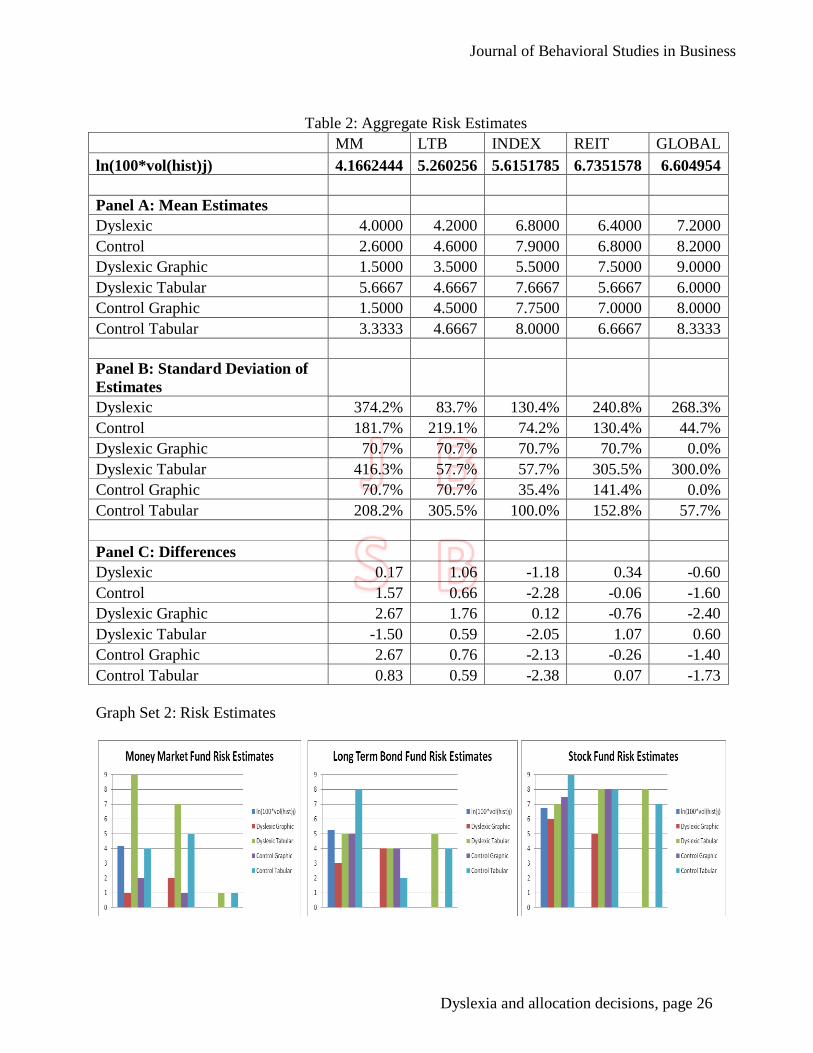
Journal of Behavioral Studies in Business
Dyslexia and allocation decisions, page 26
Table 2: Aggregate Risk Estimates
MM LTB INDEX REIT GLOBAL
ln(100*vol(hist)j) 4.1662444 5.260256 5.6151785 6.7351578 6.604954
Panel A: Mean Estimates
Dyslexic 4.0000 4.2000 6.8000 6.4000 7.2000
Control 2.6000 4.6000 7.9000 6.8000 8.2000
Dyslexic Graphic 1.5000 3.5000 5.5000 7.5000 9.0000
Dyslexic Tabular 5.6667 4.6667 7.6667 5.6667 6.0000
Control Graphic 1.5000 4.5000 7.7500 7.0000 8.0000
Control Tabular 3.3333 4.6667 8.0000 6.6667 8.3333
Panel B: Standard Deviation of
Estimates
Dyslexic 374.2% 83.7% 130.4% 240.8% 268.3%
Control 181.7% 219.1% 74.2% 130.4% 44.7%
Dyslexic Graphic 70.7% 70.7% 70.7% 70.7% 0.0%
Dyslexic Tabular 416.3% 57.7% 57.7% 305.5% 300.0%
Control Graphic 70.7% 70.7% 35.4% 141.4% 0.0%
Control Tabular 208.2% 305.5% 100.0% 152.8% 57.7%
Panel C: Differences
Dyslexic 0.17 1.06 -1.18 0.34 -0.60
Control 1.57 0.66 -2.28 -0.06 -1.60
Dyslexic Graphic 2.67 1.76 0.12 -0.76 -2.40
Dyslexic Tabular -1.50 0.59 -2.05 1.07 0.60
Control Graphic 2.67 0.76 -2.13 -0.26 -1.40
Control Tabular 0.83 0.59 -2.38 0.07 -1.73
Graph Set 2: Risk Estimates

Journal of Behavioral Studies in Business
Dyslexia and allocation decisions, page 27
Table 3: Aggregate Portfolio comparisons
Panel A: Sharpe Ratios
Annual Avg
SR
Annual End
SR
Quarterly Avg
SR
Quarterly End
SR
Dyslexic -0.443471259 -0.413674021 -0.217917644 -0.185021297
Control -0.312577217 -0.278770195 -0.179210738 -0.176462384
Dyslexic Graphic -0.324932645 -0.303452994 -0.181036116 -0.17920619
Dyslexic Tabular -0.522497002 -0.487154706 -0.242505329 -0.188898036
Control Graphic -0.37332086 -0.338750668 -0.205567909 -0.202812096
Control Tabular -0.272081455 -0.238783213 -0.161639291 -0.15889591
Panel B: Return Adjusted
Risk13
Annual End
RAR
Quarterly Avg
RAR
Quarterly End
RAR
S&P 500 STD 20.45% 0.72% 1.16%
Dyslexic 11.1% 6.1% 6.1%
Control 15.7% 7.0% 7.0%
Dyslexic Graphic 14.4% 7.2% 7.2%
Dyslexic Tabular 8.9% 5.4% 5.4%
Control Graphic 11.2% 5.8% 5.8%
Control Tabular 18.7% 7.8% 7.9%
13
S&P 500 data was downloaded from StandardandPoor.com. The annualized data was only
available for end of each year.
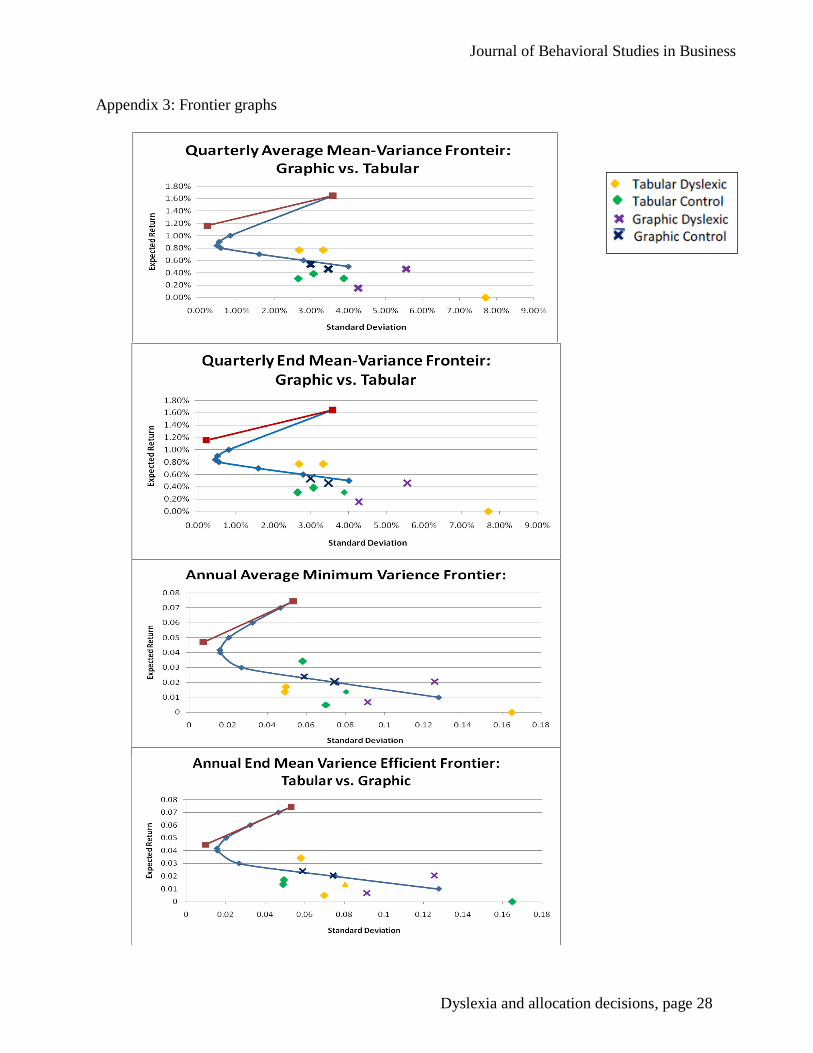
Journal of Behavioral Studies in Business
Dyslexia and allocation decisions, page 28
Appendix 3: Frontier graphs
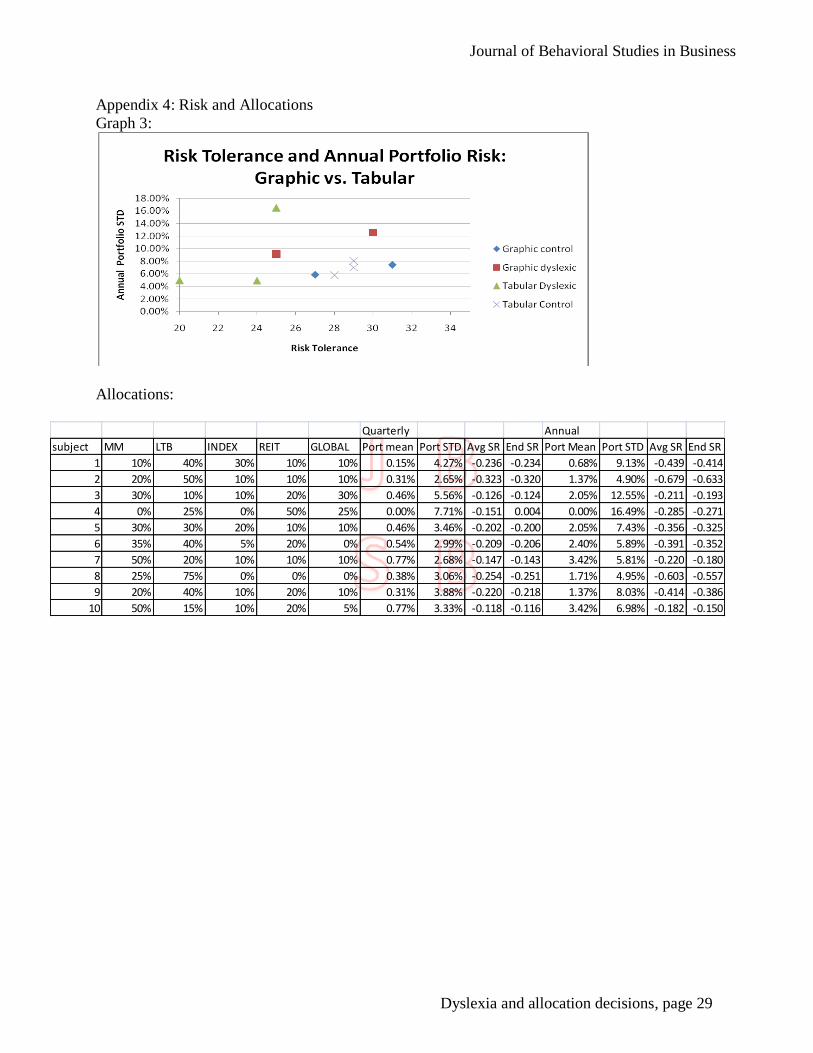
Journal of Behavioral Studies in Business
Dyslexia and allocation decisions, page 29
Appendix 4: Risk and Allocations
Graph 3:
Allocations:
Quarterly Annual
subject MM LTB INDEX REIT GLOBAL Port mean Port STD Avg SR End SR Port Mean Port STD Avg SR End SR
1 10% 40% 30% 10% 10% 0.15% 4.27% -0.236 -0.234 0.68% 9.13% -0.439 -0.414
2 20% 50% 10% 10% 10% 0.31% 2.65% -0.323 -0.320 1.37% 4.90% -0.679 -0.633
3 30% 10% 10% 20% 30% 0.46% 5.56% -0.126 -0.124 2.05% 12.55% -0.211 -0.193
4 0% 25% 0% 50% 25% 0.00% 7.71% -0.151 0.004 0.00% 16.49% -0.285 -0.271
5 30% 30% 20% 10% 10% 0.46% 3.46% -0.202 -0.200 2.05% 7.43% -0.356 -0.325
6 35% 40% 5% 20% 0% 0.54% 2.99% -0.209 -0.206 2.40% 5.89% -0.391 -0.352
7 50% 20% 10% 10% 10% 0.77% 2.68% -0.147 -0.143 3.42% 5.81% -0.220 -0.180
8 25% 75% 0% 0% 0% 0.38% 3.06% -0.254 -0.251 1.71% 4.95% -0.603 -0.557
9 20% 40% 10% 20% 10% 0.31% 3.88% -0.220 -0.218 1.37% 8.03% -0.414 -0.386
10 50% 15% 10% 20% 5% 0.77% 3.33% -0.118 -0.116 3.42% 6.98% -0.182 -0.150
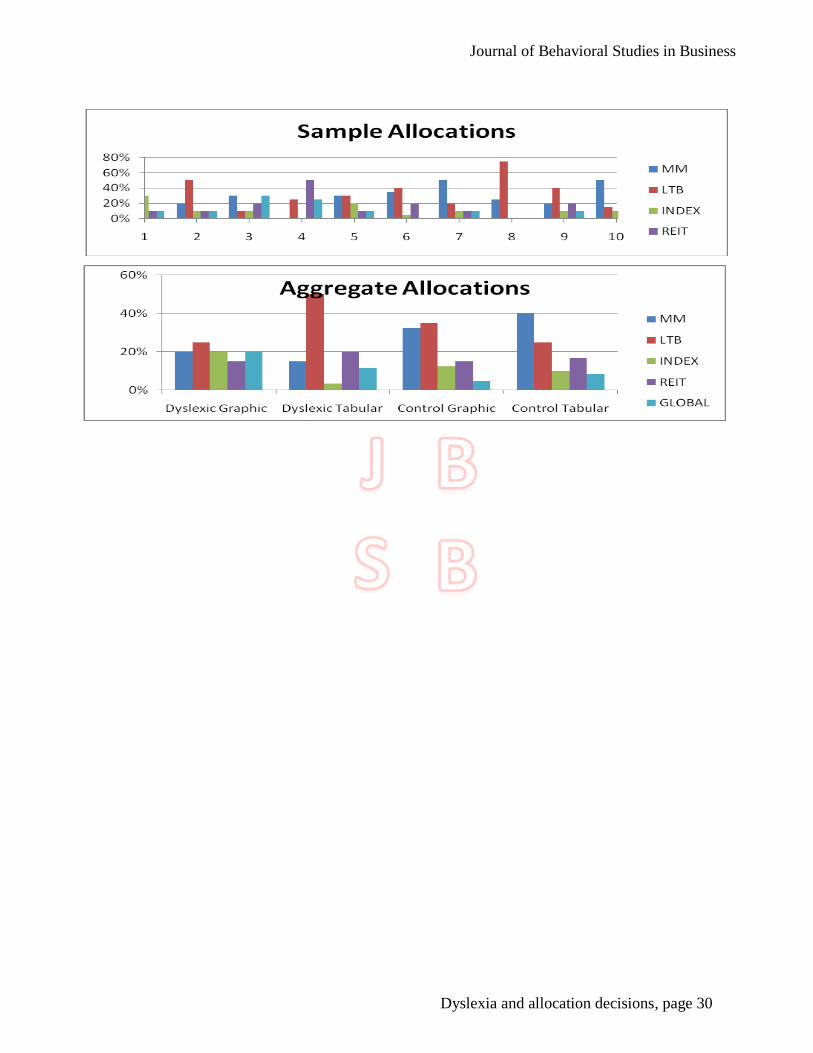
Journal of Behavioral Studies in Business
Dyslexia and allocation decisions, page 30