essar oil limited - greenbusinesscentre.comgreenbusinesscentre.com... · essar oil facilities at...
TRANSCRIPT

ESSAR OIL LIMITED –Excellence in Energy Management-2017
1

Essar Oil Facilities at Vadinar site
EOL 20 MMTPA Refinery
11.8 Complexity
Oil Terminal - Jetty and SBM Operations
CPP (Captive Power Plant) – 600 MW
2

VGO MHC
DHDT
DCU
ISOM
CDU 2
CDU
CN
Blending
Mangala
HMU - I
HMU-2
Ultra Heavy
Crude
ARU/
SRUSulfur
Vadinar Refinery Process Flow
3

• Tallest crude column (90 metres height, 76 trays)
CDU – 18 MMTPA
• Low pressure steam ejectors & vacuum
VDU
• Converted to CDU from VBU.
• Capable to process ultra heavy crude on standalone basis.
CDU-II- 2 MMTPA
• Very high pressure hydro treatment
• Capable of producing Euro V diesel
DHDT- 4.0 MMPTA
• 6 Coker drums
• One of the largest Coker unit in the world
DCU- 7.5 MMTPA
• First refinery to use Coal fired Boilers for meeting Steam and power demands of the refinery
CPP (Captive power plant)
• 2 Stage Regenerators
• Running on Maximizing Middle Distillate Mode
FCCU- 3.9 MMTPA
• Producing Reformate with 101 RON
NHT/CCR- 1.5/0.9 MMTPA
• Capable to processing feed with 5% Benzene and 10% C7+
ISOM Unit- 0.7 MMTPA
• Converted to Mild Hydrocracker in Sept’2015 Turnaround Shutdown
VGO-MHC- 6.5 MMTPA
4
UNIQUE DESIGN FEATURES

Specific Energy Consumption of EOL
Refinery’s SEC monitored in terms of MBN (MBTU/KBBL/NRGF – as perCHT method). It has reduced from 63.84 to 58.69
5
63.8462.77
58.69
55
60
65
2014-15 2015-16 2016-17
MB
N
MBN (MBTU/KBBL/NRGF )

Comparison of Specific Energy Consumption with Indian Refineries:
6Data Source : Ready Reckoner Jun’17 on www.ppac.org.in
58
.7 64
.8 72
.3
72
.5
74
.8
78
.9
79
.6
80
.5
81
.4
84
.4
86
.3
87
.9
90
.3
92
.5 11
1.1
11
4.2
11
7.9
11
8.5
20.0
40.0
60.0
80.0
100.0
120.0
140.0
MB
N
SEC of Indian Refineries FY 2016-17
Note: Reliance, HMEL & BORL MBN data not available
Specific Energy Consumption of EOL -Comparison with other Indian Refineries

Specific Energy Consumption of EOL-Global Benchmarking
Data Source : Global benchmarking study conducted by Solomon for EOL.
92.00
80.01
78.0032
10
1
2
3
4
75.00
80.00
85.00
90.00
95.00
2013 2014 2016
Qu
arti
le
EII
1
Refinery’s SEC monitored in terms of EII (Energy Intensity Index)It has reduced from 92.00 to 78.00

LIST OF EnCON PROJECTS IN LAST 3 YEARS (with investment)
S.No PROJECT TITLE YEARSAVINGS
(Million Rs)INVESTMENT (Million Rs)
1HSD tank side stream mixture provision and stopping high capacity pump for circulation Saving: 133 MWH/Month
16-17 2.03 0.50
2Replacement of total 500 conventional lamps with high efficiency LED lamps• Power saving of 82.26 KWH
16-17 2.00 2.94
3PIT- Higher Capacity blending pumps replaced with lower capacity pumps • 40 MWH/Month
16-17 2.64 0.87
4PIT - Impeller trimming for MS-III to Dispatch transfer pumps • saving - 11 kwh
16-17 0.53 0.08
8

LIST OF EnCON PROJECTS IN LAST 3 YEARS (with investment)
S.No
PROJECT TITLE YEARSAVINGS
(Million Rs)INVESTMENT (Million Rs)
5VFD drive installation in both boilers bottom ash submerged drag Chain conveyor• Saving 3.78 KWH
16-17 0.18 0.05
6
Steam trap management Amount for energy conservation invested in 1) Steam trap survey.2) High performance steam trap procurement.
16-17 11.65 0.16
7
Vacuum Gas Oil Mild Hydrocracking (VGO MHC) catalyst replacement.
After partial catalyst replacement conversion increased which also led to specific Energy reduction.
16-17 879.25 500.00
9

LIST OF EnCON PROJECTS IN LAST 3 YEARS (with investment)
S.No PROJECT TITLE YEARSAVINGS
(Million Rs)INVESTMENT (Million Rs)
8
DCU - Replacement of MF overhead condenser• HP STEAM load has reduced by 5.96 T/HR • Saving - HPS 4.71 Gcal/hr
16-17 36.55 10.00
9
CDU-2 Pre heat improvement through Pinch study• FO Saving is 0.102 Tons/Hr, • Net savings : 1 Gcal/hr
16-17 8.08 42.42
10
Provision of Aerodynamic blade fin fan cooler in cooling tower. Replacement of fan blades of 5 utility cooling tower fans done during the year, 2 nos. balance• Saving 21.2 KWH/Fan i.e. 105 KWH/Hr
16-17 5.07 3.25
10

LIST OF EnCON PROJECTS IN LAST 3 YEARS (with investment)
S.No
PROJECT TITLE YEARSAVINGS
(Million Rs)INVESTMENT (Million Rs)
11 Cooling Tower stoppage 15-16 5.78 1.00
12Installation of liquid ring compressor in DCU unit
15-16 87.53 40.00
13Use of Hydrogen rich sat gas as HMU feed resulted in increased yield and reduction in fuel gas requirement
15-16 434.45 60.50
14 Low speed motor installation in CPP. 15-16 2.04 0.20
15Air compressor IGV set point changed.
15-16 5.78 0.05
16Feed preheat temperature increasedin CDU-I by heat integration.
14-15 129.95 0.45
11

LIST OF EnCON PROJECTS IN LAST 3 YEARS (without investment)
SrNo
PROJECT TITLE YEARSAVINGS
(Million Rs)
1Vacuum Residue (VR) run down temperature increase in CDU-2 unit.saving - 0.21 Gcal /hr
16-17 2.58
2Stoppage of Additional Lean Amine pump in DHDT unitPower saving of 185.2 KWH
16-17 8.94
3Blow down optimization in FCCU unit. Saving - .0.11 Gcal/Hr
16-17 5.93
4CPP - Optimisation of running drives through operational changes Additional running drives were stopped.
16-17 84.76
5Steam consumption reduction. By increasing amine concentration.Saving - 8 ton/hr
16-17 42.05
12

LIST OF EnCON PROJECTS IN LAST 3 YEARS (without investment)
S.No. PROJECT TITLE YEARSAVINGS
(Million Rs)
6One pump stopped in DM water transfer service by Pressure reduction.
15-16 1.79
7In Sulphur Recovery Unit, LP condenser Two fans of 22KW stopped.
15-16 0.23
8Cold VR from PIT to DCU one pump stopped.
15-16 1.84
9VGO Pressure Recovery Turbine-1 strainer replaced to improve the reliability and thus save energy
15-16 11.30
10Main Air blower amps reduced by 10 amps optimizing the IGV opening/closing blow off valve
15-16 0.54
13

LIST OF EnCON PROJECTS IN LAST 3 YEARS (without investment)
S.No. PROJECT TITLE YEARSAVINGS
(Million Rs)
11Lighting optimized in Mini HMU as the unit is in idle condition
15-16 0.54
12
In DCU, one condensate pump stoppedand 15 M3/hr cold condensate consumption reduced by using stripped water consumption.
15-16 0.31
13In DCU, LCGO side stripper MP steam reduced
15-16 3.80
14Low pressure operation in debutanizer of FCC
15-16 7.05
14

LIST OF EnCON PROJECTS IN LAST 3 YEARS (without investment)
S.No. PROJECT TITLE YEARSAVINGS (Million
Rs)
15DESAL condensate heat recovered to heat DM water and it reduced Cooling tower Heat load
14-15 18.73
16Base Refinery Acid Flare routed to Train-I Flare header
14-15 14.79
17Raw Water Treatment Plant DMF feed pump impeller trimmed
14-15 0.38
18Condensate Polishing Unit feed pump run load factor optimized
14-15 0.61
15

TOTAL SAVINGS
16
S.No. YearWith Investment
(Million Rs)Without Investment
(Million Rs)
1 16-17 947.98 144.26
2 15-16 535.58 27.40
3 14-15 129.95 34.51
Total Savings 1613.51 206.17
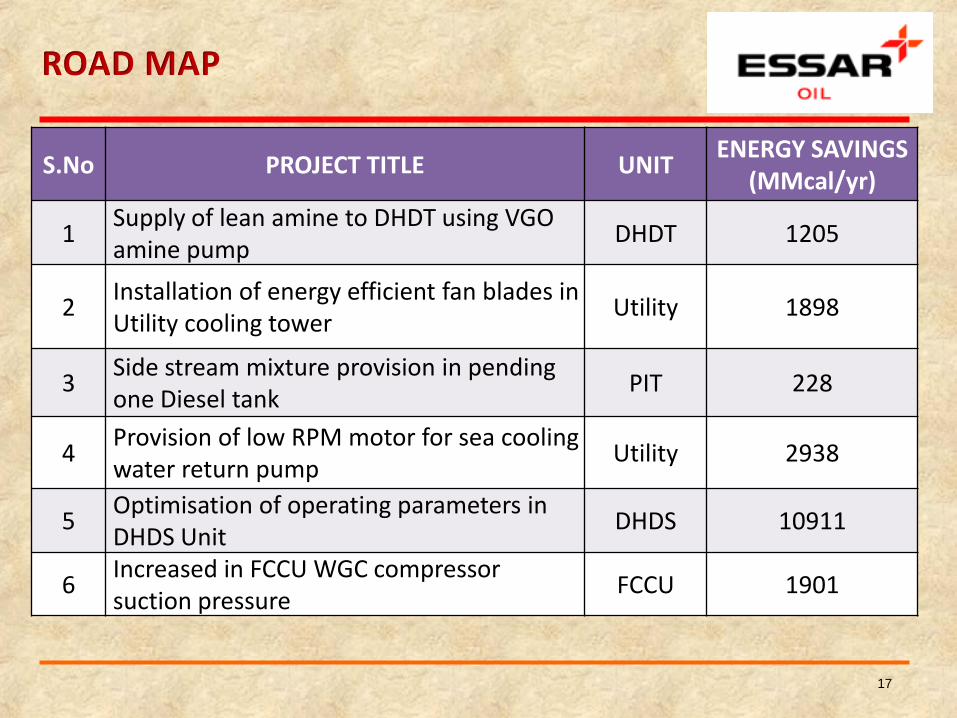
ROAD MAP
S.No PROJECT TITLE UNITENERGY SAVINGS
(MMcal/yr)
1Supply of lean amine to DHDT using VGO amine pump
DHDT 1205
2Installation of energy efficient fan blades in Utility cooling tower
Utility 1898
3Side stream mixture provision in pending one Diesel tank
PIT 228
4Provision of low RPM motor for sea cooling water return pump
Utility 2938
5Optimisation of operating parameters in DHDS Unit
DHDS 10911
6Increased in FCCU WGC compressor suction pressure
FCCU 1901
17
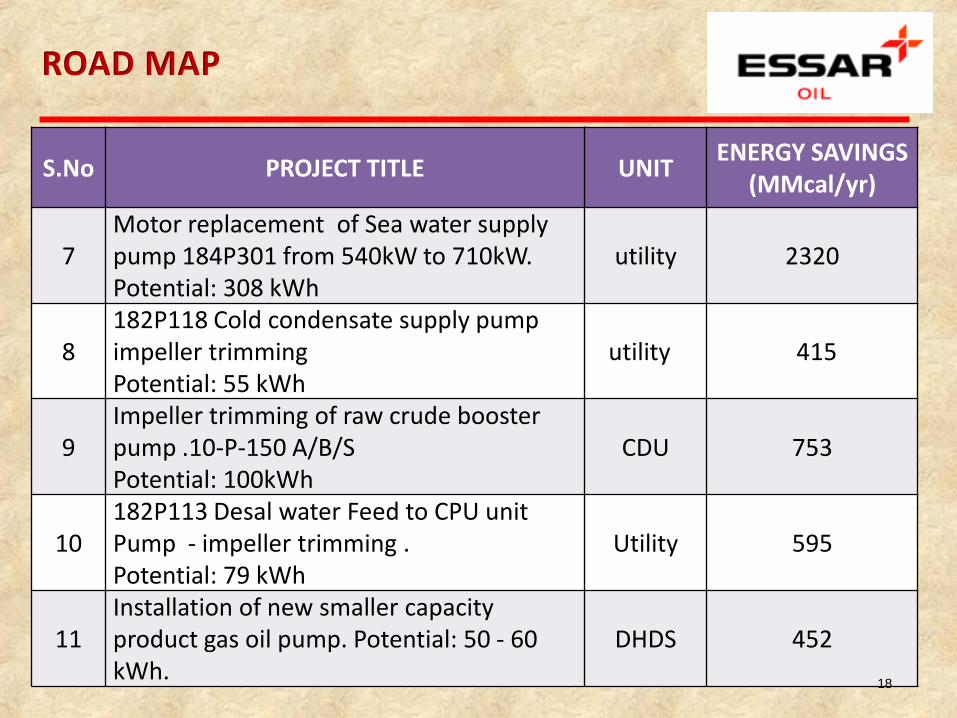
ROAD MAP
S.No PROJECT TITLE UNITENERGY SAVINGS
(MMcal/yr)
7Motor replacement of Sea water supply pump 184P301 from 540kW to 710kW. Potential: 308 kWh
utility 2320
8182P118 Cold condensate supply pump impeller trimmingPotential: 55 kWh
utility 415
9Impeller trimming of raw crude booster pump .10-P-150 A/B/S Potential: 100kWh
CDU 753
10182P113 Desal water Feed to CPU unit Pump - impeller trimming . Potential: 79 kWh
Utility 595
11Installation of new smaller capacity product gas oil pump. Potential: 50 - 60 kWh.
DHDS 452
18

ENERGY SAVING INNOVATIVE PROJECTS
1. DCU - Replacement of MF overhead condenser (E-100-C)
The Issue
• Main Fractionator one of the three condensers was fouled and was resulting in higher O/L temperature and increased molecular weight of the off gas and reduced liquid yield.
• As a result of the above steam required for the turbine of the off gas compressor was increasing.
Modification done
• Fouled condenser was replaced with new one during the available opportunity. This resulted in reduction of steam requirement for the turbine by 5.96 MT/Hr.
19
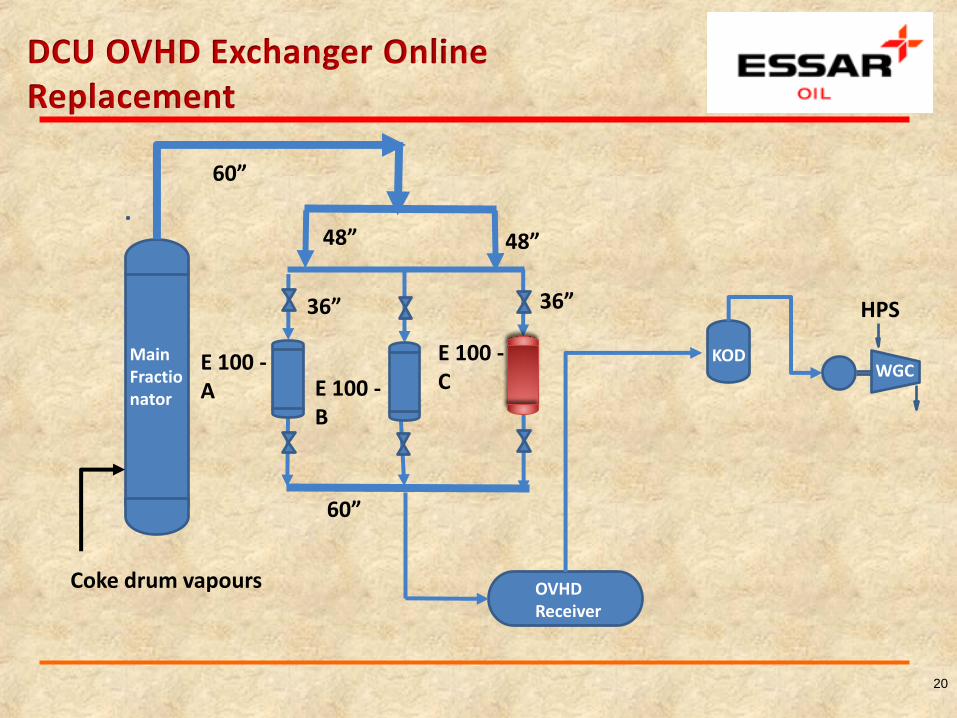
DCU OVHD Exchanger Online Replacement
20
Main Fractionator
KOD
OVHD Receiver
HPS
E 100 -A E 100 -
B
WGCE 100 -C
60”
48”
36”
60”
48”
36”
Coke drum vapours

ENERGY SAVING INNOVATIVE PROJECTS
Energy Saving 4.71 MMkcal/Hr
Investment 10 Million INR.
Improvement 36.5 Million INR
Payback 3.30 Months
• Energy savings effect
21

ENERGY SAVING INNOVATIVE PROJECTS
2. CDU-2 Pre heat improvement
The Issue
• Higher fuel consumption in CDU-02 heater resulting in higher skin
temperature of Atmospheric heater.
Existing Facility
• CDU-02 is designed for processing ultra-heavy crude at 70 Deg. C enters
CDU-02 B/L and after passing through exchanger train it is fad to the
heater at around 260 Deg.C for further heating the crude up to
fractionation temperature (350 Deg.C)
22

23
Crude
VR Quench to column FV
EFJK
Crude to heater
FVTV
VR from Pump
NEW
QR
LM NP
CDU-2 Pinch study
EFJK LM NP QR
Crude to heater
VR Quench to column
VR to MP Generation
VR from Pump
RCO
Crude
Old Config
Modified
VR to MP Generation
240 C
240 C
275 C
290 C

ENERGY SAVING INNOVATIVE PROJECTS
Modification donePinch analysis of the system was carried out. Result of the study suggested opportunity of utilising VR run down heat to pre heat the crude 2 Nos. of new exchangers were provided for crude V/S VR heat recovery the modification resulted in pre heat improvement of 15 Deg.C equivalent to 1.0 Gcal of heat which otherwise would have been lost to fin fan.
24
Energy savings effect
Energy Saving 1.0 MMkcal/Hr
Investment 42.42 Million INR.
Improvement 8.08 Million INR
Payback 5.25 Years

Implementation of ISO 50001:2011
25

S.No PROJECT DESCRIPTION YEAR
1PM analyser in CDU,VDU,CDU-II,FCCR and hooked up the same with CPCB server
2016
2Online BOD analyser installed at treated water line and hook up the same with CPCB server
2016
34 Ground water Recharge well-constructed inside the refinery at strategic locations for ground water recharge
2016
4Disposal of 1.4 MT Used Radiography Film from Refinery first time to actual user
2016
5Disposal of 190MT Oily Sludge by co-processing at M/s Ultratech Cement, Kovaya
2016
6 Detailed yearly Marine Monitoring by National Institute of Oceanography 2016
7 Disposal of 2315 MT Spent Ni-Co-Mo Catalyst 2016
81836 of plants were planted near Hazardous shed, near NKC,HMU,Northside area of Security control room to Fire station and South side of Crane over 1.53 acres of land
2016
26

S.No PROJECT DESCRIPTION YEAR
9 100 % ETP oily sludge is utilized in delayed coker unit 2015
10 100 % spent carbon utilized in power plant as a fuel 2015
11 Hook-up Stack, Ambient and Effluent Online analyser with CPCB server 2015
12LED display board installed at main gate for displaying Online data of ambient air quality, stack emission, effluent quality monitoring.
2015
13Measures have been taken like refilling printer toner cartridge to reduce e-waste generation
2015
27
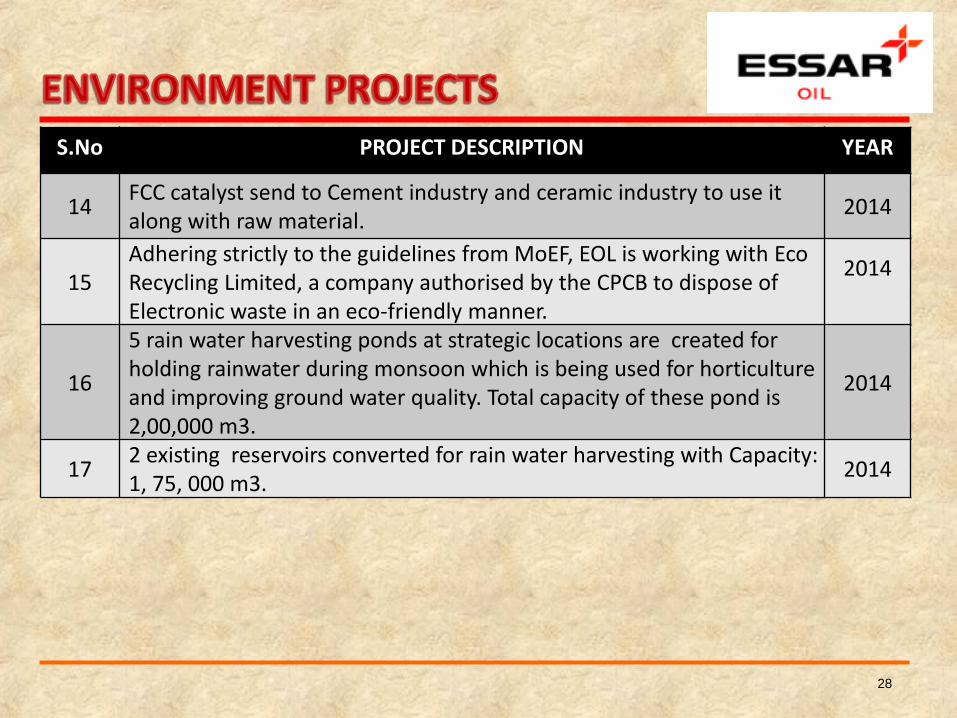
S.No PROJECT DESCRIPTION YEAR
14FCC catalyst send to Cement industry and ceramic industry to use it along with raw material.
2014
15Adhering strictly to the guidelines from MoEF, EOL is working with Eco Recycling Limited, a company authorised by the CPCB to dispose of Electronic waste in an eco-friendly manner.
2014
16
5 rain water harvesting ponds at strategic locations are created for holding rainwater during monsoon which is being used for horticulture and improving ground water quality. Total capacity of these pond is 2,00,000 m3.
2014
172 existing reservoirs converted for rain water harvesting with Capacity: 1, 75, 000 m3.
2014
28

GREEN BELT AT ESSAR
29
Horticulture at Refinery (1064 Acres)
Type Description Total No.
Gre
en
Be
lt(8
47
Acre
s)
Mango trees 1,07,137
Pomegranate trees 1,960
Forest Species 1,91,298
Total Plants 3,00,395
Land
scape
(21
7 A
cres)
Refinery Landscape area(m2)
3,37,443
Avenue & Mass Plantation (m2)
3,59,955
Township & city based (m2)
1,82,204
Total Landscape 8,79,602

RENEWABLE ENERGY UTILIZATION
Solar photovoltaic cell in security
watch tower in remote location.
Small windmill installed to provide
lights to security cabin
Solar Operated Traffic Flasher Lights
installed near Refinery Main gate &
Township gate.
Solar Heater provided at Oil Club.
Emission free- electrically powered
Golf Carts and Fuel Free- Bicycles are
used in the Refinery.
Bio gas plant based on canteen food
waste.
Day light harvesting in warehouse.
30
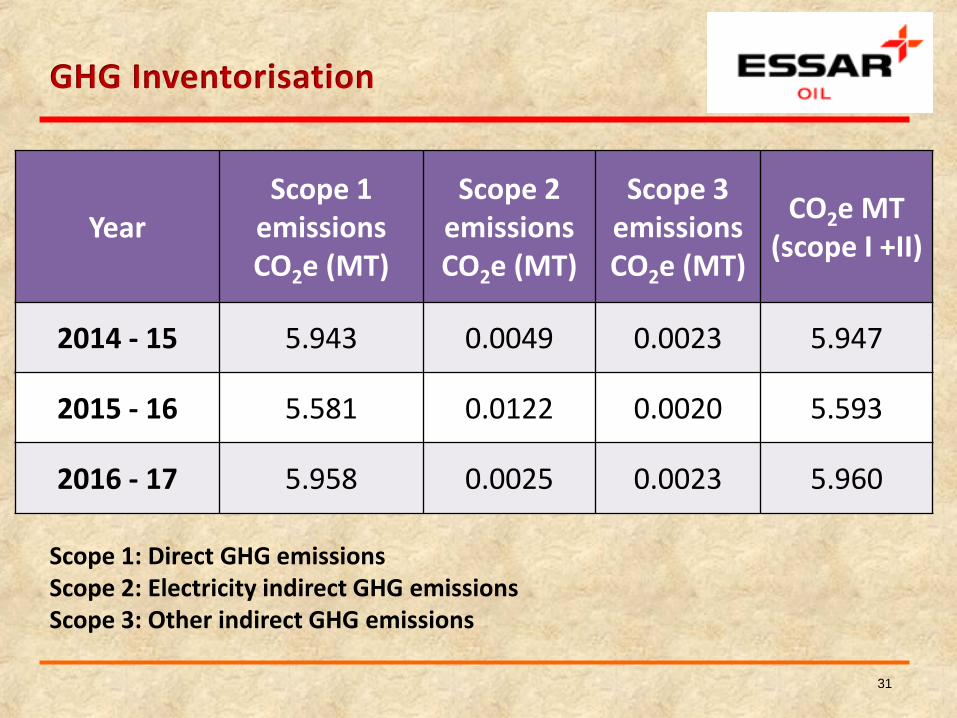
GHG Inventorisation
YearScope 1
emissions CO2e (MT)
Scope 2 emissions CO2e (MT)
Scope 3 emissions CO2e (MT)
CO2e MT (scope I +II)
2014 - 15 5.943 0.0049 0.0023 5.947
2015 - 16 5.581 0.0122 0.0020 5.593
2016 - 17 5.958 0.0025 0.0023 5.960
31
Scope 1: Direct GHG emissionsScope 2: Electricity indirect GHG emissionsScope 3: Other indirect GHG emissions

Utilization of waste material as fuel-Bio Gas plant
Bio-gas plant is installed to dispose Kitchen waste, which also produce
Natural gas and manure. Natural gas is utilized as fuel in Kitchen and
manure in Greenbelt.
Capacity : 500 kg/Day kitchen waste
Bio Gas generation about 50 m3 / day equivalent to 20 Kg of LPG.

Utilization of waste material as fuel-Spent Carbon Disposal
Project Title :-
Disposal of Spent Carbon by reusing it as Alternate Fuel
in CPP coal based Boiler.
Spent catalyst disposal method:-
Spent Carbon is generated from Kerosene Merichem Unit, Sulphur
Recovery Unit and Utilities.
Normal mode of the Disposal is outside parties by incineration. It was
decided to dispose it by using as a fuel in CPP coal based Boilers
Total savings per year = Rs. 39,24,000

Utilization of waste material as fuel-Spent Carbon DisposalSavings due to disposal as fuel in CPP
Incineration cost saving Rs. 15000/MT (if not used in power plant)
• Average spent carbon generation is 200 MT/ year
• Rs. 15000 x 200 MT = Total Rs. 30,00,000
• Incineration cost saving = Rs. 30,00,000
Fuel cost saving 1 MT of spent carbon is equivalent to 1.4 MT of coal as per
Calorific Value.
• Average spent carbon generation is 200 MT/ year
• Fuel cost saving = Rs. 9,24,000
• 200 MT x 1.4 = 280 MT of coal
• Cost of coal = Rs. 3300/ MT
Total saving 280 MT x 3300 = Rs. 9,24,000
Total savings per year = Rs. 30,00,000 + Rs. 9,24,000 = Rs. 39,24,000
34
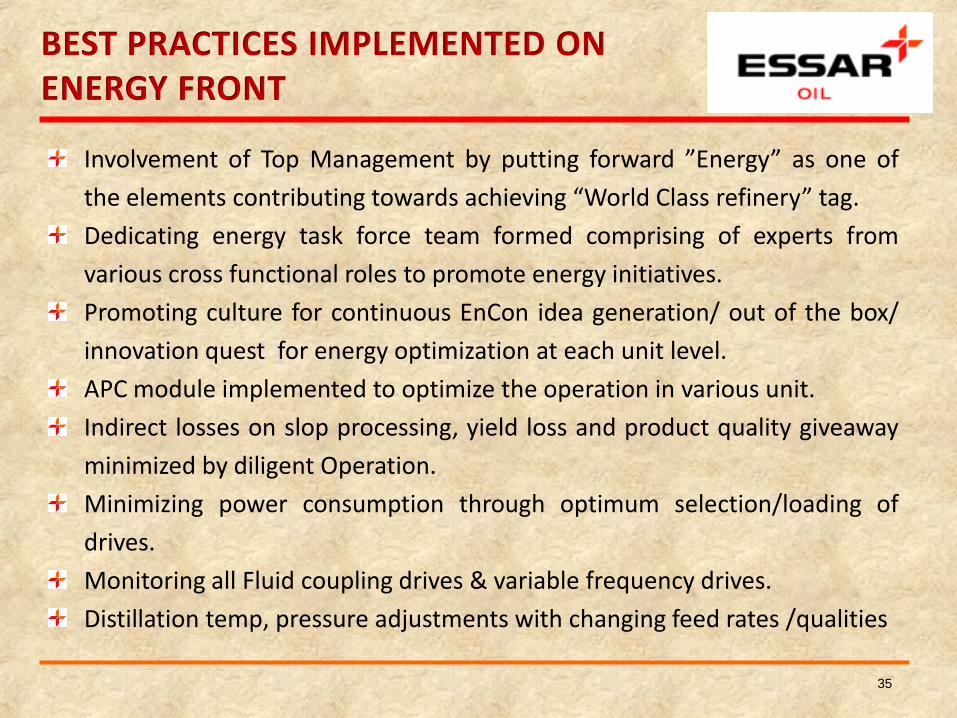
Involvement of Top Management by putting forward ”Energy” as one of
the elements contributing towards achieving “World Class refinery” tag.
Dedicating energy task force team formed comprising of experts from
various cross functional roles to promote energy initiatives.
Promoting culture for continuous EnCon idea generation/ out of the box/
innovation quest for energy optimization at each unit level.
APC module implemented to optimize the operation in various unit.
Indirect losses on slop processing, yield loss and product quality giveaway
minimized by diligent Operation.
Minimizing power consumption through optimum selection/loading of
drives.
Monitoring all Fluid coupling drives & variable frequency drives.
Distillation temp, pressure adjustments with changing feed rates /qualities
BEST PRACTICES IMPLEMENTED ON ENERGY FRONT
35

Close monitoring of high energy intensive equipment performance, e.g.
Furnaces & Boilers, rotating equipments distillation columns.
Carrying out a comprehensive Hydrocarbon Loss Audit.
Online monitoring of all Flare valves to minimize flare loss.
Third party audit (Energy, F&L, Electrical) in Refinery.
Prepared Energy mapping of each unit.
Developed energy Metrics of each unit.
Low grade heat utilization.
Outsourcing steam traps management to minimize steam losses.
Improved accuracy of loss estimation.
BEST PRACTICES IMPLEMENTED ON ENERGY FRONT
36

BEST PRACTICES IMPLEMENTED ON ENERGY FRONT
37
Encouragement/ Information
Idea Generation –MOC Portal
GRM/Energy/
HSEF
ENCON Team
RLT
INFORMATION: Energy Intensive
equipment Specific consumption
Steam, power, fuel Flaring & Loss Pump/Turbine Efficiency Critical operating
parameters & deviation ENCOURAGEMENT : GEM Dec month
celebration Energy Awareness
sessions Quiz Leaflet circulation
Daily report & monitoring Target Setting for Fuel,
Power, Steam Legal compliance ISO 50001 compliance Brain storming sessions.
World Class Energy Team Monthly performance
presentation

38
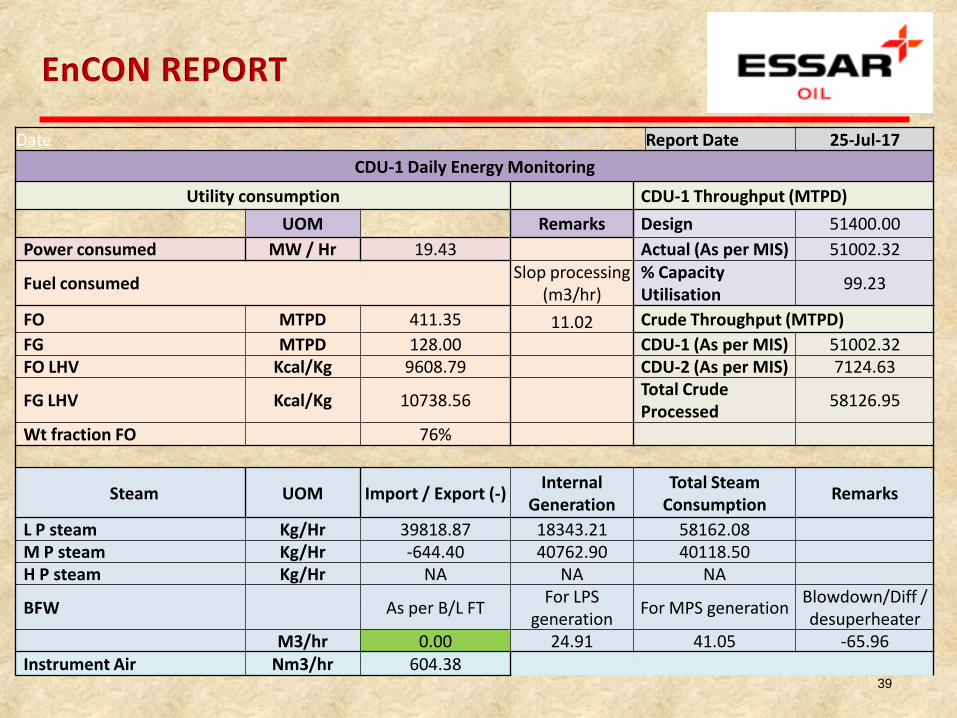
EnCON REPORT
39
Date 25-Jul-17 26-Jul-17 Report Date 25-Jul-17
CDU-1 Daily Energy Monitoring
Utility consumption CDU-1 Throughput (MTPD)
UOM Remarks Design 51400.00
Power consumed MW / Hr 19.43 Actual (As per MIS) 51002.32
Fuel consumedSlop processing
(m3/hr)% Capacity Utilisation
99.23
FO MTPD 411.35 11.02 Crude Throughput (MTPD)
FG MTPD 128.00 CDU-1 (As per MIS) 51002.32FO LHV Kcal/Kg 9608.79 CDU-2 (As per MIS) 7124.63
FG LHV Kcal/Kg 10738.56Total Crude Processed
58126.95
Wt fraction FO 76%
Steam UOM Import / Export (-) Internal
GenerationTotal Steam
ConsumptionRemarks
L P steam Kg/Hr 39818.87 18343.21 58162.08M P steam Kg/Hr -644.40 40762.90 40118.50H P steam Kg/Hr NA NA NA
BFW As per B/L FTFor LPS
generationFor MPS generation
Blowdown/Diff / desuperheater
M3/hr 0.00 24.91 41.05 -65.96Instrument Air Nm3/hr 604.38

40
Heater MonitoringParameters (Target) UOM CDU heater A CDU heater B VDU heater A VDU heater BDesign Thermal efficiency % 89.50 89.50 89.50 89.50Net Thermal efficiency % 87.14 86.12 89.1 89.41Stack loss Kcal/Kg of fuel 1027.85 1132.81 845.05 828.24Total Fuel flow FO (KG/hr) 6985.54 11795.73 2056.46 1472.45
FG (NM3/Hr) 2211.25 2042.42 856.20 856.20Heater Inlet Flow m3/hr 1411.99 1420.18 805.47 705.88FD fan Air flow Kg/Hr 79730.64 96149.70 72133.25 65077.80Draft MMWC -5.48 -4.31 -7.05 -3.91O2 in flue gas (Target-3.5) % 1.87 1.67 2.46 2.14CIT Deg C 270.02 270.02 359.57 359.57COT Deg C 367.00 367.00 410.25 410.99Combustion Air Temp Deg C 229.57 309.02 212.25 190.89Flue gas Temp (APH I/L) Deg C 467.01 483.46 334.34 333.18ID fan Suction temp Deg C 170.68 170.31 177.36 191.80Stack Temperature(Target-180/185/187/180)
Deg C 237.85 273.14 183.4 175.55
Avg Stack damper opening % 43 45 -4 26Specific Consumption
Power KWH / DayKWH /
MT Unit FeedKWH /
MT Crude T'put% SRFT Power /
MT Unit feed% SRFT Power/ MT Crude T'put
Target 8.9Actual 466224 9.141 8.021 0.07861% 0.06898%
Fuel (FO+FG) MTPDMT fuel/
MT Unit feedMT fuel/
MT Crude T'put% SRFT Fuel / MT Unit feed
% SRFT fuel / MT Crude T'put
Target 1.00 0.87Actual 539.35 0.011 0.009 1.044% 0.916%
Steam Kg/hrKg Steam/
MT Unit feedKg Steam/
MT Crude T'put% SRFT/
MT Unit feed% SRFT/
MT Crude T'putLPS Target
LP 58162.08 27.37 24.01 0.183% 0.161%MPS Target 17.00
MP 40118.50 18.88 16.56 0.138% 0.121%HPS Target
HP NA NA NA
Unit Energy % SRFT/ MT unit Feed
1.444% Unit Energy % SRFT / MT Crude T'put 1.267%

41
Arpankumar PanchalManager, Process(M) [email protected]
Nitinkumar ChokshiGM, Lead Encon & Process(M) [email protected]