ess1 social class
DESCRIPTION
ESS1 Social ClassTRANSCRIPT

Computing Social Class Indices This report and system of computing Social Class Indices have been approved for inclusion on the ESS data website by the CCT. All such scales and systems of computation are subject to academic criticism and all users considering this information should critically evaluate it prior to its use. Title/ Description: Social Class in Europe. European Social Survey 2002/3. NTNU Social Research Ltd., Trondheim 2005 Authors: Håkon Leiulfsrud, Ivano Bison & Heidi Jensberg Institutions : Department of Sociology & Political Science, Norwegian University of Technology and Science, Norway. Department of Sociology and Social Research, University of Trento, Italy Email: [email protected] Summary of documentation: The report presents an updated picture of European class structure and also provides SPSS syntaxes (enabled for copy-paste) for the construction of the following class schemes, based on ESS Round 1 data: Goldthorpe/Erikson/Portocarero class schemes (EGP) Wright class schemes Esping Andersen post-industrial class scheme Treiman index International Socio Economic Index (ISEI) Link to full documentation: Please see document under “Report”
i
NTNU LOGO
Håkon Leiulfsrud, Ivano Bison & Heidi Jensberg
SOCIAL CLASS IN EUROPE European Social Survey 2002/3
NTNU Social Research Ltd and
Department of Sociology & Political Science Norwegian University of Technology and Science, Norway
and Department of Sociology and Social Research
University of Trento, Italy

ii
NTNU Samfunnsforskning/NTNU Social Research Ltd., 2005 ISBN 82-7570-161-9

iii
Preface The aim of this report is to promote class- and stratification research in European survey research in general, and European Social Survey (ESS) in particular. Our goal is also to encourage European researchers to use a broader range of class schemes and to present a guide on how to use these models. As a result of this project we are able to present an updated picture of European class structure and answer questions on how social class corresponds to various welfare indicators. Four class models are highlighted, including Goldthorpe/Erikson/Portocarero’s, Wright’s, and Esping Andersen’s class schemes. We may not necessarily reach the same solutions that Erikson/Goldthorpe/Portocarero or Wright would have obtained if they had done the same operationalizations themselves. Regardless of this, we do believe that this is as close as we can get to the original class models. The original version of Erikson/Goldthorpe/Portocarero typology (also known as EGP classes) is closely related to Harry Ganzeboom’s spss-program. Without changing the logic of his spss-program, we have done a number of technical adjustments to refrain from an inflation of low-skilled service employees into service class I (i.e. avoiding a problem in several applications of the model in the past). However, none of the technical adjustments significantly changes the results. The most significant difference, as fare as the EGP classes are concerned, is related to the choice of theoretical framework. In the original version, based on a Neo-Weberian theory of stratification, routine non manual employees (class IIIb) are regarded as member of the working class. In Goldthorpe’s more recent contract theoretical framework the same group are treated as a part of the working class (modified labour contract). The status of class IIIb as a part of the middle class or the working class also varies among researchers that use the EGP-model. Wright’s typologies are developed to match his original control/power model; based on 1) ownership, authority and work autonomy and 2) his later (exploitation) model where autonomy is replaced with skill and expert assets. The construction of Wright’s typologies is based on a number of second best options and adjustments to ESS. Nevertheless, we end up with more or less the same results if we compare the original model and our version. It is also argued that our version of Wright’s first class scheme, with additional sub-categories based on skill, enables us to make a number of interesting observations about class relations left out in competing class schemes.

iv
Esping Andersen’s typology was developed in Barcelona in collaboration between Gøsta Esping Andersen and Ivano Bison in 2000. The reconstruction and development of Wright’s class schemes has mainly been done in collaboration between Håkon Leiulfsrud and Heidi Jensberg. Our analysis is based on the 21 countries that are represented in the ESS- 2002/3 data set in December 2004. Unfortunately, it does not include France due to crucial limitations in the occupational coding of the French survey (only including isco-88 codes at 2 digit level). The Norwegian 2002/3 Survey does not include information about the occupations of self-employees. The standardized version of EGP can therefore not be applied in the Norwegian case without some revisions (a modified syntax for Norway where farmers are excluded as a distinct category). We are grateful for the support we have received from Knut Kalgraff Skjåk at the Norwegian Social Science Services (NSD) in Bergen and from our colleague, Kristen Ringdal. The collaboration between Ivano Bison and Håkon Leiulfsrud in Madison in the last months of 2004 changed the character of the project from a technical report to a comprehensive research project, including substantial results and evaluations of the class models. We are also grateful for comments and advice from Erik Olin Wright (University of Wisconsin, Madison) and Mark Western (University of Queensland, Australia) related to technical aspects of how to translate skill level from occupations. Professor Wright has also read and made useful comments on a number of aspects of the report including the problem of managers in the EGP scheme and in his models. We would also like to extend our gratitude to Peggy Hager and Tom Andersen in Madison, Wisconsin for their language check and to Unni Ovesen in Trondheim for her technical assistance in transforming the manuscript into a report. Our final thanks go to Erik Bihagen (University of Stockholm) and Rory Fitzgerald (City University London) for their valuable comments that helped us to polish the text theoretically and methodologically. Håkon Leiulfsrud Ivano Bison Heidi Jensberg Trondheim/Madison Trento Trondheim September 2005
v
Contents
PREFACE III List of Tables – Main text vi List of Figures – Main text vii
A. Introduction 1
B. From social class in general to class schemes 3
C. Constructing Classes 7 C.1. EGP Class Scheme 7 C.2. Wright’s Class Schemes 10 C.3. Esping Andersen’s Class Scheme 13 C.4. Empirical overlap and differences between the four class schemes 15
C. 4.1. EGP vs. Wright (exploitation model) 15 C. 4.2. EGP vs. Esping Andersen 19 C. 4.3. Wright’s power model vs. EGP/ESP/Wright 19 C.4.4 Class and isco-88 21
C. 5. Comparing class schemes – some final comments and warnings 22 D. 5. Classes in Europe – A brief overview 23 D.1 National patterns of stratification 28
E. Class schemes with alternative strengths 37 E.1 Class and social status 37 E.2. Economic capital and employment indicators 38 E.3. Political Capital 40
F. Conclusion 40
G. References 43
Appendix 45 List of tables - Appendix 45
Appendix I – General tables (1.1-8.4) 48
Appendix II – EGP classes (9.1-9.4) 92
Appendix III – Wright tables (10.1-10.6) 97
Appendix IV - Economic indicators (11-12.d) 102
Appendix V - SPSS Class Schemes Programs adjusted to ESS data File 2002/3 107
vi
List of Tables – Main text
Table 1. Criteria used in constructing alternative class typologies ............................................ 5
Table 2. EGP Classes ................................................................................................................. 8
Table 3. Wright’s class schemes (early model based on power/control and later model based on exploitation of skill and organizational assets) ........................................................... 11
Table 4. Wright’s power/control model (original version) and our new version with additional sub categories based on skill ............................................................................................ 13
Table 5. Esping Andersen’s post-industrial class scheme........................................................ 14
Table 6 EGP vs. WR (column and row percentages)............................................................... 17
Table 7. EGP Classes. Aggregated data for 21 countries (excluding France). Economically active population (including weights) .............................................................................. 24
Table 8 Wright’s class scheme (WR) based on skill and organizational assets (exploitation model). Aggregated data for 21 countries (excluding France. Economically active population (including weights)......................................................................................... 25
Table 9. Esping Andersen’s post-industrial stratification scheme (ESP). Aggregated data for 21 countries (excluding France. Economically active population (including weights) ... 26
Table 10. Revised version of Wright’s class scheme based on ownership, hierarchy and autonomy (WR_P). Aggregated data for 21 countries (excluding France. Economicaly active population (including weights) .............................................................................. 27
Table 11. Percentage workers in Europe according to Wright and Goldthorpe’s class schemes. Minimum- and maximum operationalizations. Weights included. .................................. 36
Table 12. Economic capital. Empirical performance of each class scheme. Eta Squares........ 39
Table 13. Anova Regression Models ....................................................................................... 39

vii
List of Figures – Main text
Figure 1: Workers in the original EGP scheme (class V – VI – VIIa) vs workers (low-skilled) in Wright’s exploitation model (EXP_I). Percentage of workers in 20 European countries and Israel 2002/3 .............................................................................................................. 29
Figure 2: Workers in Goldthorpe’s contract model (class IIIb – V – VI – VIIa) vs workers (low-skilled) in Wright’s exploitation model (EXP_I). Percentage of workers in 20 European countries and Israel 2002/3 .............................................................................. 30
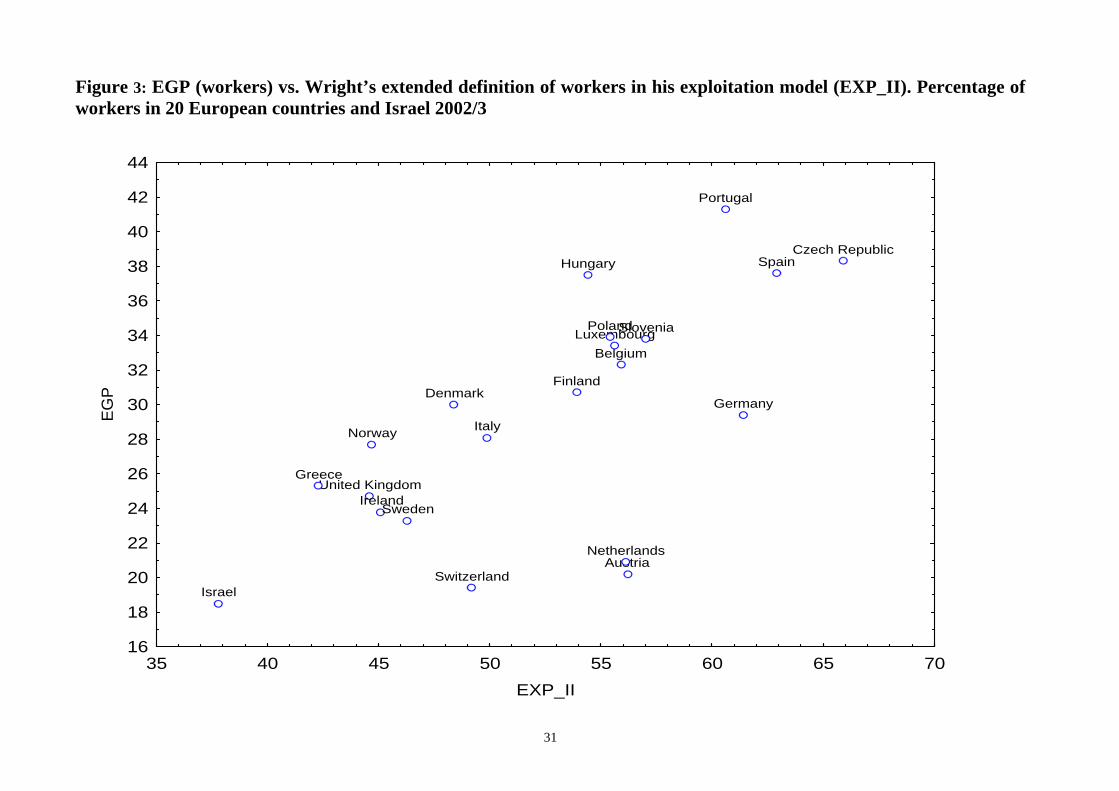
Figure 3: EGP (workers) vs. Wright’s extended definition of workers in his exploitation model (EXP_II). Percentage of workers in 20 European countries and Israel 2002/3 .... 31
Figure 4: Goldthorpe’s contract model (class IIIb – V – VI – VIIa) vs. Wright’s extended definition of workers in his exploitation model (EXP_II). Percentage of workers in 20 European countries and Israel 2002/3 .............................................................................. 32
Figure 5: The European Working Class according to the original EGP Class Scheme and Wright’s Power Model (WR-P). Percentage of workers in the 20 European countries and Israel 2002/3..................................................................................................................... 33
Figure 6: The European Working Class according to Goldthorpe’s Contract Model (class IIIb – V – VI – VIIa) and Wright’s Power Model (WR-P). Percentage of workers in the 20 European countries and Israel 2002/3 .............................................................................. 34

1
A. Introduction The concept of ‘social class’ has always been contested. Many repudiate the idea of class as an ideological relic of industrial society (Bell 1976; Beck 1992; Lash 1999; Kingston 2000). Others are still truly fascinated with how class continues to shape our lives, our mode of thinking and everyday practices (Bourdieu 1984; Rosenlund 2000; Devine 2004; Devine et al 2004; New York Times 2005). Those still identifying themselves in class terms may have various interpretations, including primary references to differences in work situation, social background, money, education or simply referring to something people have/don’t have – class (Marshall et al 1988; Skeggs 1997). A common argument among sociologists is that modern citizens may have unequal life chances without a priori constituting social classes as collective actors or institutions (see e.g. Pakulski & Waters 1996; Kingston 2000). Others have problems identifying what used to be traditional class differences with relevant class distinctions of today. Basic questions such as who are workers and/or belong to the middle class today are by no means self-evident. Neither is it self-evident among social scientists what is the primary source of class relations (production, consumption, life chances, or a combination of these factors). For a good overview of class as a theoretical and empirical concept see Calvert (1982) and Scott (2002). Regardless of these challenges we still find a whole industry of researchers preoccupied with class- and stratification analysis in Europe and elsewhere (Rose & Pevalin 2001). Why? The simple answer is that social class, understood as systematic inequalities in opportunity- and power structures, still matters. Even if welfare capitalism has contributed to equalize the distribution of welfare and life chances this is still highly correlated to social class (c.f. Esping Andersen 1999: 29-30). The more complex answer is that class- and stratification research is framed in alternative ‘research programs’ with alternative ontological, epistemological and methodological positions (c.f. Guba 1990). Class- and stratification researchers may share a number of common interests in terms of research issues, but they are also divided into different sub-fields and research traditions. Class- and stratification research today is highly specialized. The statistical and methodological tools are much more advanced than in the 1960s and 1970s. The amount of data available, including cross national and intra-national data, are also much more favourable than in the past. Attempts are currently being made within the European Union to form a joint European social class standard (EseC Matrix). Regardless whether this classification will be used as the future

2
standard of European Social Survey (ESS) our claim is that it is crucial that we continue to use more than one standard. There are at least five good reasons for this:
1) Most available standards are not simply classifications, but framed in more or less developed theoretical frameworks with specific focus and aims. If we restrict ourselves to just one standard we ignore the merits of the alternative standards.
2) A farewell to previous standards makes it increasingly hard to follow general trends over time and to relate to previous research.
3) It is not self-evident what we gain from one class model unless this is accompanied by a robust empirical and theoretical adjudication. Most of the comparisons between rival models have been rather limited in their focus and scope.
4) Some class models perform better overall than others, but no model is ideal for all kinds of purposes.
5) It is crucial to have alternative models to promote alternative interpretations, particularly if only one standard is institutionalized for the European Union.
The general aim of this report is to facilitate future analyses of social class and social stratification among those using the European Social Survey. The report presents readers with technical tools on how to use alternative class schemes. It also includes an updated analysis of social class in Europe and gives the reader a first impression of what can be gained using alternative class schemes. The report is organized in six parts. In the next part (B) we give a brief description of the theoretical discussions and framework of contemporary class analyses. This is followed up with a description of how we have operationalized the class schemes initially developed by Erikson, Goldthorpe and Portocarero (EGP-classes), Wright (his first control/power model and later exploitation model) and Esping Andersen (post-industrial classification scheme). Whereas the construction of EGP and Esping Andersen’s schemes are mainly of technical nature, the reconstruction of Wright’s class schemes is also a genuine contribution in its own right. This is particularly true for our development and improvement of Wright’s first class scheme, developed in the 1970’s, based on power/control (C). The following section (D & E) includes a portrait of the European class structure as well as an evaluation of how well the various models perform as research tools. In the concluding parts, some general remarks about the value of the ESS-data and the class models are presented (F). We have deliberately chosen to play down the technical aspects of the class schemes in the main part of the report.

3
Most of the technical information on how we have constructed the classes can be found in Appendix V. The report includes a large number of tables that are only briefly referred to in the main text (see Appendix I). The data presented will be included in a number of planned articles written by the authors. Status based models may give us valuable information about the nature of class schemes. For this reason and in the interest of many users ‘Treiman’s Status Index’ as well as ‘International Socio-Economic Index’ (ISEI) are included (see Appendix I, Tables 5.1-5.4 and Appendix V). B. From social class in general to class schemes Social class for social scientists are not fixed or static categories. A common aim for those involved in class analysis is to have tools to study general aspects of society, including changes in the economic and social structure. Social class in this perspective refers to social categories formed and lived by individuals, families and organizations in society. What used to be typical institutional and cultural traits of workers or the middle classes in the 1950’s or 1960’s are interesting in this perspective, but not necessarily very useful for our understanding of contemporary class distinctions. Class relations have an inherently relational logic that changes over time in the same way as economic relations, including production and technology changes. Major societal changes may also have profound impact on class relations, just as class relations may shape societies very differently over time. For a number of reasons it may be convenient to stick to official socio-economic standards typically based on occupations or social status or a combination of the two approaches. Official statistics provide researchers and a broader public with a lot of valuable information about inequality and opportunity structures based on official classes. It typically represents, at least within nations, a joint standard that researchers from different research fields easily can relate to despite different theoretical frameworks and research agendas. The standard objection from class researchers is that most of these official class models tend to be ad hoc and relatively weak as theoretical tools. Even if the explanatory power may be relatively high, at least for certain kinds of questions, it is hard to have a classification without some kind of theory guiding the research (c.f. Bourdieu 1990, 1995; Wright 1997; Erikson & Goldthorpe 1992; Goldthorpe 2000). One commonality for the class schemes presented in this report is that they all are theoretically derived. Even if some of the models have similarities with previous and official models in the United Kingdom, Sweden and elsewhere (c.f. e.g. the EGP scheme), the theoretical framework and questions addressed tend to represent an alternative and more critical perspective of society. Instead of just

4
mapping various aspects of social inequality, including standard of living, working conditions, social mobility, issues about social relations, power, exploitation and the reproduction of social cleavages, are systematically researched. The theoretical focus and vocabulary varies between different schools of class researchers. Marxists tend to put greater emphasis on ownership and class relations where the key distinction is between owners/employers and employees. Since the late 1970’s Marxist scholars have paid special attention to the problem of the ‘(new) middle classes’, and class groupings in dual and ‘contradictory’ class positions (Wright 1978; Carchedi 1977). Instead of assuming that managers a priori share the same interests as capitalists, Wright and Carchedi claim that this is an empirical question. In some cases class interests may be homologous, in others it may be quite the opposite. This does not only hold true for managers, but also experts and small employers/self- employees. One of the main reasons why social scientists initially paid so much attention to Wright’s first class model, developed in the late 1970’s, was his problematization of the ‘middle classes’ as a sociological category. Even if similar kinds of problematizations can be found among sociologists since the 1930’s (e.g. Geiger 1932; Lockwood 1958; Dahrendorf 1959; Bell 1976) it was first introduced into class research in the 1970’s (see e.g. Poulantzas 1973, 1975, Przeworski 1977). Instead of thinking of what is the internal, often contradictory dynamic of classes, the interest is now back to social classes as common experiences and life chances. It may also be argued that the production perspective, with special emphasis on the labour process, got lost in mainstream class research after the 1990’s. Many class researchers, particularly those inspired by Max Weber, including Ralf Dahrendorf (1959), David Lockwood and John H. Goldthorpe (Goldthorpe et al 1968; Erikson & Goldthorpe 1992; Goldthorpe & Marshall 1992), were initially inspired by Marxist theories, but also sceptical to the Marxian theoretical framework. The standard argument is that the Marxist class schemes (including Wright’s) are too heavily based on the economy, too deterministic and trapped in a worldview where history is ultimately the history of class (c.f. Goldthorpe & Marshall 1992). The focus upon the middle classes as ‘contradictory class positions’ is not emphasized. Researchers inspired by Max Weber, or more accurately the ‘British School of Class and Stratification’, tend to play down the distinctions between owners and managers and merge them into the top class (es). They also tend to be sceptical to treat class relations as a priori antagonistic or based on exploitation (see Goldthorpe & Marshall 1992; Goldthorpe 2000). In more recent work Goldthorpe (2000) propose a theoretical reformulation with a more explicit focus upon the labour contract and (service relations vs more traditional labour contracts) with a number of similarities to

5
Wright’s approach (including rational choice models of action and behaviour) Regardless of the many similarities with Wright, Goldthorpe’s (2000: 210) claim is, nevertheless, that his model is in an intermediate position between ‘the more extreme versions of both the exploitation and efficiency arguments’. Some of the debate between the different schools of class analyses is based on theoretical grounds, others on practical reasons. Goldthorpe may for example accept the idea of work and labour seen from rational actors defending their interests’ point of view. He is nevertheless not willing to view the contractual relations ‘as being fundamentally either in harmony or in conflict’ (ibid: 211). Whereas Wright argue in favour of a strong version of power and exploitation, Goldthorpe’s position is to reduce it to potential economic and ideological conflicts within more restricted organizational constraints (ibid: 211). Table 1. Criteria used in constructing alternative class typologies Ownership Management Occupation/skill
(credentials) Career prospects
Sector industrial/post-industrial society
Erikson, Goldthorp, Portocarero (EGP)
Included but mainly of importance to single out capitalists (class I)
Included but mainly of importance to single out top managers (class I)
Crucial. The EGP is heavily based on occupational codes (iscoco/Ganzebooms’ program).
Supplementary criteria to include jobs with a typical middle-class trajectory (Ganzeboom).
Not included. Differences primarily rooted in industrial society (manual/ non-manual jobs)
WRIGHT Power/control model (WR_P)
Crucial distinction between owners and employees (including managers)
Crucial. Distinguish between managers/ supervisors based on power (jbspv, wkdcsin, orgwrk)
Work autonomy based on work tasks (wkdcorg). Skill level not included in original model but added in our version
No No
WRIGHT Exploitation model (WR_EXP)
Crucial. See above.
Crucial. See above.
Skill/experts credent. Based on evaluation of occupations (iscoco & occr)
No No
Esping Andersen (ESP)
Secondary importance
Crucial. Owner/managers merged.
Based on occupational coding overlapping with EGP (iscoco)
Yes. Resembles EGP
Distinguishes between primary- Fordist- and Post Industrial Occupations

6
At the operational level Goldthorpe and others have, at least in the past, claimed that it is hard to make meaningful analysis of the captains of industry (top capitalists) in small-scale surveys. Even if it may make sense for Weberians to separate owners from managers and managers from experts, it is often argued that these distinctions may be of less importance in concrete analysis of life chances and mobility research (see e.g. Marshall et al 1997: 24-28). Instead of referring to a general production-oriented theory of class conflicts and social change, critics of Marxian class theory put greater emphasis on power resources and life chances. It is believed that these power resources are grounded in work relations as well as market power, i.e. possibilities to sell labour for a higher cost than the average wage within an occupational group. The main emphasis in most class analysis inspired by Max Weber, is either on authority and hierarchical position (Dahrendorf 1959) or expert power and cultural capital (c.f. Parkin 1979). The role of power in analysis of division of labour is not unique to class analysis (see e.g. Ruechemeyer 1986), but certainly a crucial part in all of the class models presented in this report. The original version of the class scheme of Erikson, Goldthorpe and Portocarero go well with the post-Weberian tradition described above. Esping Andersen’s (1992) class scheme at least partly fits the same description even though the theoretical language and emphasis on economic relations is influenced by a Marxian and institutional theoretical framework. Wright’s project is rooted within the Marxian tradition at the same time as several of the distinctions he uses to single out the ‘middle classes’ (including hierarchy/authority and skill/credentials) clearly resembles criteria used by Weberian class researchers (see Wright 1997: 29ff; Marshall et al 1988; Esping Andersen 1993:12-13). In a more recent version of Goldthorpe’s work we se a shift from power resources to contract relations (Goldthorpe 2000: chapter 10). To what extent the four class schemes may be regarded as qualitatively different or partly overlapping is ultimately a question of whether we focus upon the overall theoretical framework or the criteria used in the technical construction of the class models. A first glance at the operational dimensions indicates a high degree of thematic overlap between the models (see Table 1). All of the class schemes have a focus on power relations and education/skill, and are framed in a perspective of work and industrial relations. The original EGP class scheme has a more explicit focus on overall living conditions, life chances and socio-political orientation (c.f. Erikson & Goldthorpe 1992; Goldthorpe & Marshall 1992; Marshall et al 1997). Wright’s two class models are primarily designed for those interested in the study of industrial relations, power relations and ideological cleavages

7
within and between different social strata. Esping Andersen’s model resembles the EGP class scheme as a tool to study welfare and social inequality. It is however, like Wright, also rooted in economic relations. Whereas Wright’s models are designed to study power and/or exploitation relations in general, Esping Andersen’s project is to highlight what he sees as alternative economic spheres and class relations in the post-industrial area. One of Esping Andersen’s main criticisms against both Goldthorpe (1982) and Wright (1985) is that the theories are ‘nested in an institutionally ‘naked world’ an Adam Smithian world of unfettered markets’ (Esping Andersen 1993:8). C. Constructing Classes There is no simple solution on how we may ensure full compatibility between ESS-2002/3 and previous studies done by Erikson/Goldthorpe/Portocarero, Wright, Esping Andersen, or other researchers in the ESS-area. We are mainly left with more or less good solutions. This has not only represented a major obstacle for us, but also halted the debate and exchange between alternative schools of class- and stratification for many years. The art of reconstructing class schemes is not only a question of technical issues, but equally important a contribution in the development of the models as such. C.1. EGP Class Scheme The EGP classes are based on the work situation (authority and autonomy at work) as well as market situation (including income, degree of income security, career prospects and source of income) of the respondents. Additional criteria used are distinctions between owners, employers and employees; between firms with more or less than 10 employees; and between manual and non-manual occupations. Seven classes emerge based on the indicators above. Class I and II are labelled the ‘service class’, VI and VII the ‘working class’ and III and V are referred to as ‘intermediate’ class positions. In some analyses, class V (supervisors and lower technicians) are included in the working class, in others not. In the original version of the EGP-scheme lower grade routine non manual employees (class IIIb) is treated as lower middle class. In Golthorpe’s contract theory, based on regulation of employment, class IIIb is considered as a part of the working class. Class V, on the other hand, is considered as a part of the middle class (between a “service relation” and a “labour contract”). A description of Goldthorpe and his colleague’s class scheme is presented in Table 2. The EGP-classes (which can be seen as a development of Goldthorpe’s

8
early class scheme) is currently the European standard in intergenerational mobility research (see e.g. Erikson and Goldthorpe 1992; Breen 2004). The practical use of the EGP model in the original neo Weberian school of thought or as an economic contract theory, is ultimately a theoretical choice. Key questions/variables necessary to construct EGP classes are included in the core questions of the ESS (see Appendix V). Our operationalization of the EGP class scheme is based on the spss-program of Harry Ganzeboom, made available at his web page (http://www.fss.uu.nl/soc/hg/isko88/). We have done a number of small adjustments in his original spss-program to facilitate analyses for the European Social Survey, ISSP and previous cross-national surveys. While trying to be faithful to the logic and intentions made by the inventors of the EGP scheme and Ganzeboom, we have also tried to improve the technical quality of Ganzeboom’s program. Table 2. EGP Classes I Service class I (higher-grade professionals, administrators, and officials; managers in
large industrial establishments; large proprietors). Salariat (top class). II Service class II (lower-grade professionals, administrators, and officials; higher grade
technicians; managers in small industrial establishments; supervisors of non-manual employees). Salariat (top class).
IIIa Routine non manual (routine non-manual employees, higher grade - administration and commerce). Intermediate class.
IIIb Routine non manual employees, lower grade (sales and services). Intermediate class in orginal EGP model. Modified labour contract and associated with the working class in Goldthorpe’s contract theoretical model.
IVa Self-empl with employees (small proprietors, artisans, etc, with employees). Intermediate class.
IVb Self-empl with no empoyees (small proprietors, artisans, etc, with no employees). Intermediate class.
IVc Self-empl. Farmers etc (farmers and small holders; other self-employed workers in primary production). Intermediate class. In some applications located in a separate agrarian strata with agricultural workers (VIIb).
V Manual supervisors/Lower grade technicians (lower grade technicians; supervisors of manual workers). At the bottom of intermediate class. Sometimes merged together with the working class in the original model. Mixed contract relation Goldthorpe’s contract theory, albeith part of an intermediate class.
VI Skilled workers. Working class. VIIa Unskilled workers (not in agriculture, etc). Working class. VIIb Farm labours (agricultural and other workers in primary production). Working class.
In some applications located in separate agrarian strata with farmers (IVc).
9
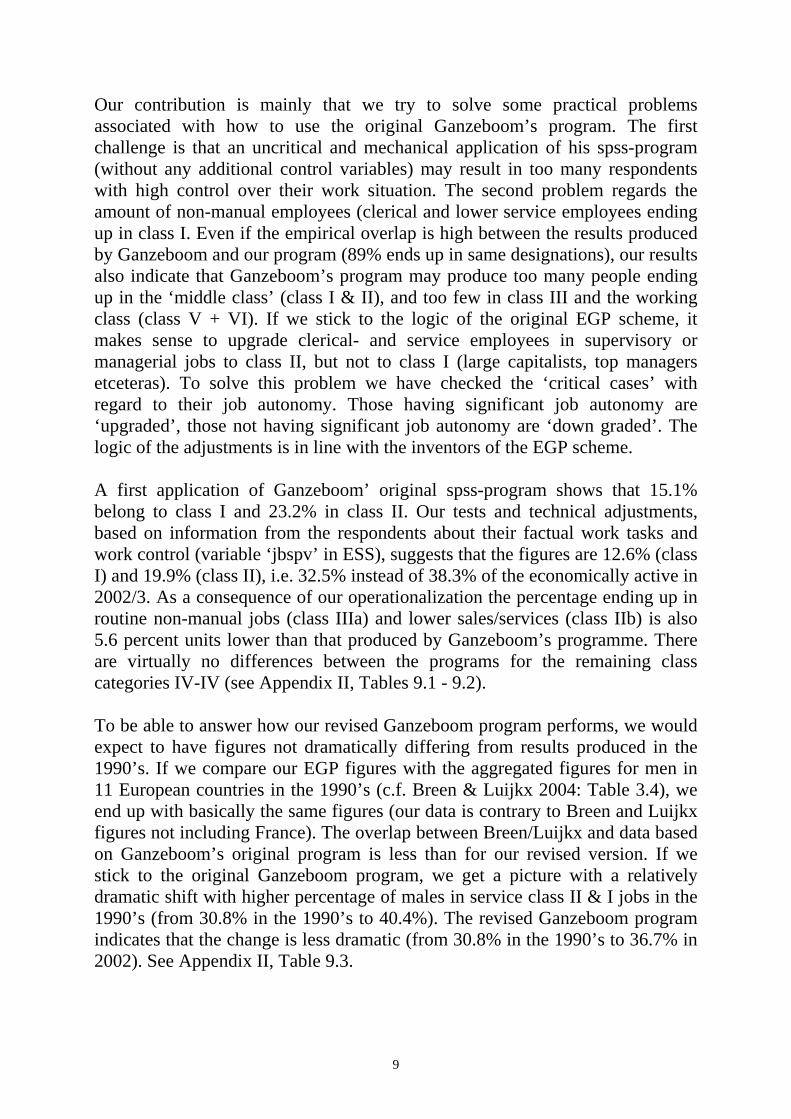
Our contribution is mainly that we try to solve some practical problems associated with how to use the original Ganzeboom’s program. The first challenge is that an uncritical and mechanical application of his spss-program (without any additional control variables) may result in too many respondents with high control over their work situation. The second problem regards the amount of non-manual employees (clerical and lower service employees ending up in class I. Even if the empirical overlap is high between the results produced by Ganzeboom and our program (89% ends up in same designations), our results also indicate that Ganzeboom’s program may produce too many people ending up in the ‘middle class’ (class I & II), and too few in class III and the working class (class V + VI). If we stick to the logic of the original EGP scheme, it makes sense to upgrade clerical- and service employees in supervisory or managerial jobs to class II, but not to class I (large capitalists, top managers etceteras). To solve this problem we have checked the ‘critical cases’ with regard to their job autonomy. Those having significant job autonomy are ‘upgraded’, those not having significant job autonomy are ‘down graded’. The logic of the adjustments is in line with the inventors of the EGP scheme. A first application of Ganzeboom’ original spss-program shows that 15.1% belong to class I and 23.2% in class II. Our tests and technical adjustments, based on information from the respondents about their factual work tasks and work control (variable ‘jbspv’ in ESS), suggests that the figures are 12.6% (class I) and 19.9% (class II), i.e. 32.5% instead of 38.3% of the economically active in 2002/3. As a consequence of our operationalization the percentage ending up in routine non-manual jobs (class IIIa) and lower sales/services (class IIb) is also 5.6 percent units lower than that produced by Ganzeboom’s programme. There are virtually no differences between the programs for the remaining class categories IV-IV (see Appendix II, Tables 9.1 - 9.2). To be able to answer how our revised Ganzeboom program performs, we would expect to have figures not dramatically differing from results produced in the 1990’s. If we compare our EGP figures with the aggregated figures for men in 11 European countries in the 1990’s (c.f. Breen & Luijkx 2004: Table 3.4), we end up with basically the same figures (our data is contrary to Breen and Luijkx figures not including France). The overlap between Breen/Luijkx and data based on Ganzeboom’s original program is less than for our revised version. If we stick to the original Ganzeboom program, we get a picture with a relatively dramatic shift with higher percentage of males in service class II & I jobs in the 1990’s (from 30.8% in the 1990’s to 40.4%). The revised Ganzeboom program indicates that the change is less dramatic (from 30.8% in the 1990’s to 36.7% in 2002). See Appendix II, Table 9.3.

10
We would once again like to remind the readers that the adjustments made are basically technical improvements. None of the adjustments violates any of the previous theoretical and operational criteria used by the architects of the original EGP model. The alternative, i.e. a mechanical adaptation of Ganzeboom’s program, would not only produce biased results with regard to the increase of the service class, (as several researchers have been doing over the years), but also violate the model. C.2. Wright’s Class Schemes An alternative class approach with a more explicit focus on the work process, including power, authority and skill, is presented by Wright (1978). This power/control model is based on relations in the production domain (ownership-non ownership; management-non-management; high job autonomy-low job autonomy). The work process perspective can also be found in Wright’s (1985, 1997) later class model based on relations of exploitation (ownership vs. non-ownership; management vs. non-management; skill/experts vs. low-skill workers). ESS-2002/3 includes most of the key-variables necessary to construct both of these models. Wright put more emphasis on the distinction between employers and employees compared to EGP-model. Self-employed, in both of Wright’s models, are referred to as capitalists (10+ employees), small capitalists (1-9 employees) and petty bourgeoisie (no employees). The employees are like the EGP model stratified according to hierarchy and skill/autonomy. Whereas the original EGP is mainly based on assumptions of life chances associated with occupations, Wright places his emphasis on what people, regardless of formal titles, do at work. Workers in Wright’s ‘power/control model’ are represented as those with low autonomy, with limited possibilities of influencing the work process, and low degree of authority. In his revised class scheme, based on exploitation, autonomy is replaced with skill (organizational credentials). Low-skilled workers are now seen as the core of the working class. Skilled workers are in his exploitation model assumed to have a higher market value than the regular working class. They may either be seen as an intermediate class category or as an extension of the working class. The managers and the experts resemble the service classes in the EGP model, and are also believed to be the most privileged among the employees. The intermediate strata of employees in Wrights models are the ones with substantial skills (educational assets) and/or supervisory functions over co-workers (see Table 3).

11
Table 3. Wright’s class schemes (early model based on power/control and later model based on exploitation of skill and organizational assets) Power/control model (Wright 1978) Exploitation model (Wright 1985, 1997) Capitalists (10+ employees) Capitalists (10+ employees) Small capitalists (w. 2-9 employees) Small capitalists (w. 2-9 employees) Self-employed (no employees) Self-employed (no employees) Managers Managers (expert, skilled unskilled) Supervisors Supervisors Semi-autonomous employees (high autonomy/not mgr/superv.)
Experts (professionals, highly educated, not mgr/sup)
Skilled workers (semi-professionals and skilled occupations, not mgr/superv).
Working class Low-skilled workers (not mgr/superv). One of the main challenges for those interested in constructing Wright’s class model(s) in ESS 2002/3 is the lack of information on management/non management relations, including questions on overall decision-making power and hierarchical positions in the work organisation. Our first challenge refers to two missing variables, hierarchical position and decision-making. These are crucial dimensions in Wrights class model based on power as well as in his exploitation model (see Table 1). The second challenge is the transformation of isco-88 codes into experts, semi experts (skilled) and low-skilled employees. Occupations are of secondary importance in his power model, but like the EGP scheme, play a significant role in Wright’s exploitation model. The third challenge is related to Wright’s ‘power model’ and the problem of not having fully comparable measures of autonomy over time. The first problem is ‘solved’ by using ESS-2002/3 questions on employment status (employees, supervisory functions & number of subordinates) and degree of decision-making. The decision-making dimension is based on four ESS variables (‘wkdcsin’, ‘employed’, ‘jbspv’ and ‘orgwrk’) related to what the respondents do in their daily jobs. Those having subordinates and substantial authority at work are treated as managers. Respondents with subordinates and medium degree of work authority are classified as supervisors. Those having a substantial influence over the work directions and their own work, but are not formally managers, are regarded as supervisors. The ESS-2002/3 questions on decision-making are not ideal and will be improved in the second wave of ESS (in 2004/5). Nevertheless various tests comparing the share of managers (expert managers/supervisors, skilled managers/supervisors and low- skilled managers/supervisors) show almost overlapping results regardless if we use Wright’s full battery of questions on decision-making (c.f. Wright 1985,

12
Appendix II) or more crude measurements (see Appendix III, Table 10.2 in this report). These results are based on adjusting Norwegian class data and variables from 1996 (second round of Wright’s project in Norway) to data and variables obtained from ESS-2002/3. Our second challenge has been to construct a spss program that translates different occupational categories (isco-88 as well as the previous Nordic Occupational Classification) into Wright’s expert, semi-skilled and low-skilled categories. This problem has mainly been solved by using previous SPPS syntaxes developed by Erik Olin Wright (1997: 82, Table 2.4) and us in collaboration with Øyvind Dahl. It should also be added that we have consulted Wright regarding the ‘critical cases’ to minimize the problem of the skill level associated with different occupational groups in isco-88 (4 digit level). The third challenge, related to work autonomy, was solved by using the ESS-variable ‘wkdcorg’ (‘Allowed to decide how daily work is organized’ with values from 0, no influence to 10 complete control). In Wright’s original class scheme those having high autonomy and/or certain intermediate autonomy were classified as ‘autonomous’. Even if the ESS-question is essentially the same as in the Wright project, previous data also included additional information from the respondents exemplifying their job tasks. At least in theory, that made data from the Wright class project more reliable. After comparing the autonomy distribution among different class categories in Norway in 1995/6 and 2002 we decided to set the autonomy level to 8+. This is in line with the original idea of Wright to only include those with high autonomy to semi-autonomous employees. It also corresponds well with the autonomy levels we find for different class categories in Norway in 1995/1996 and 2002 (see Appendix III, Table 10.2). For the purpose of this report we have made two versions of Wright’s exploitation model (‘WR’ and ‘WR_SIMP’). The WR version is based on more comprehensive information (see above). The WR_SIMP version is an easy to construct typology but, in the case of ESS, does unfortunately not enable us to differentiate between managers and supervisors. It may, however, be a clever solution for those having limited information about decision-making in similar studies (see Wright 1997: 88-90). Comparisons between Norwegian 1995/6 data based on the full battery of Wright variables and WR_SIMP also show a very high degree of overlap (see Appendix III, Table 10.1). As already observed by Wright (ibid.), making class models based on three variables (formal hierarchy, supervision and decision-making) may both be cost effective and productive. Our operationalization of Wright’s ‘power/control model’ corresponds to his class scheme from the late 1970’s and also includes elements from his

13
exploitation model (skill level). Skilled employees includes experts and skilled in Wright’s exploitation model. Low-skilled is in both versions represented by non-skilled and semi-skilled employees.
Table 4. Wright’s power/control model (original version) and our new version with additional sub categories based on skill Original version (Wright 1978). Seven categories
New version with eleven categories (WR_P)
Capitalists Capitalists Small capitalists Small capitalists Self-employed Self-employed Managers Managers (skilled/low-skilled) Supervisors Supervisors (skilled/low- skilled) Semi-autonomous employees Semi-aut. empl. (skilled/low- skilled). Working class Working class (skilled/low- skilled) There are several reasons for making additional sub-categories based on skill among employees. In the original version of Wright’s class scheme managers, semi-autonomous employees and workers appear with a high degree of socio-economic heterogeneity within the class categories. This, for obvious reasons, makes it harder to locate differences and cleavages within the middle classes. In Wright’s original model, skill is left out as a crucial assets in negotiations with employers (c.f. Erikson & Goldthorpe 1992; Wright 1997). Skill as ‘symbolic capital’ and a capacity to navigate in alternative social spheres, including the realm of production, is accordingly left out. A good reason for making additional subcategories is also that autonomy and skill combined gives us a better idea of how skills are evaluated in concrete organizations and work settings. C.3. Esping Andersen’s Class Scheme Gøsta Esping Andersen holds a relatively relaxed attitude to traditional class theory (Marxist as well as Weberian). Contrary to those who argue in favour of general models of class and stratification, his main argument is that class relations are mediated via regulatory institutions such as the welfare state, collective wage bargaining systems, educational systems, family systems and firms. Contemporary class relations are in his perspective neither reducible to a traditional industrial society model (Fordism) nor to a service-society model, but represent a blend of alternative economic and social logics and schisms

14
(including the issue of social closure and more or less excluded categories in the labour market). One of his main theses is that the division of labour today ‘may give birth to new axes of stratification’ (Esping Andersen 1993:12). Along an essentially horizontal axis of class, he criticizes one-dimensional criteria of hierarchy, autonomy, human capital assets and trust as common attributes of the ‘new class’. Esping Andersen’s alternative is to create a typology where, in his perspective, relevant distinctions between managers and experts/semi professionals do not get lost. He also opposes the idea of merging skilled workers in manufacturing with skilled workers in essentially service relations. The same argument is repeated for unskilled workers in different kinds of work spheres (ibid. p.14). Along a vertical axis of stratification, his argument is that the career structure and identity associated with traditional Fordist jobs may differ significantly from post-industrial service jobs. In his perspective it is hardly a surprise that women, due to their overrepresentation in the service economy, have different opportunity structures, compared to men, traditionally favoured by the idea of an ‘adequate Fordist wage’ (ibid. p 17). Instead of either reducing women to an appendix of their husband’s and family roles (c.f. Goldthorpe) or essentially as the low-skilled workers (c.f. Wright) Esping Andersen’s argument is that new gender relations force us to rethink class relations in general. In his institutionalist perspective it is an open question as to how class and gender relations manifest themselves as job and opportunity structures. Table 5. Esping Andersen’s post-industrial class scheme 1. Primary sector occupations (farmers, etceteras) 2. Fordist hierarchy (a) managers and proprietors (includes executive personnel and the ‘petit bourgeoisie). (b) clerical, administrative (non managerial) and sales workers engaged in basically routine tasks of control, distribution and administration. (c) skilled/crafts manual production workers, including low level ‘technical’ workers. (d) unskilled and semi-skilled manual production workers, also including transport workers and other manual occupations engaged in manufacture and distribution, such as packers, truck drivers, haulers, etc. 3. Post-Industrial Hierarchy (a) professionals and scientists. (b) technicians and semi-professionals (school teachers, nurses, social workers, laboratory workers, technical designers, etc. (c) skilled service workers (cooks, hairdressers, policemen, etc). (e) unskilled service workers or service proletariat (cleaners, waitresses, bartenders, baggage porters, etc). (Source: Esping Andersen 1993: 24-25).

15
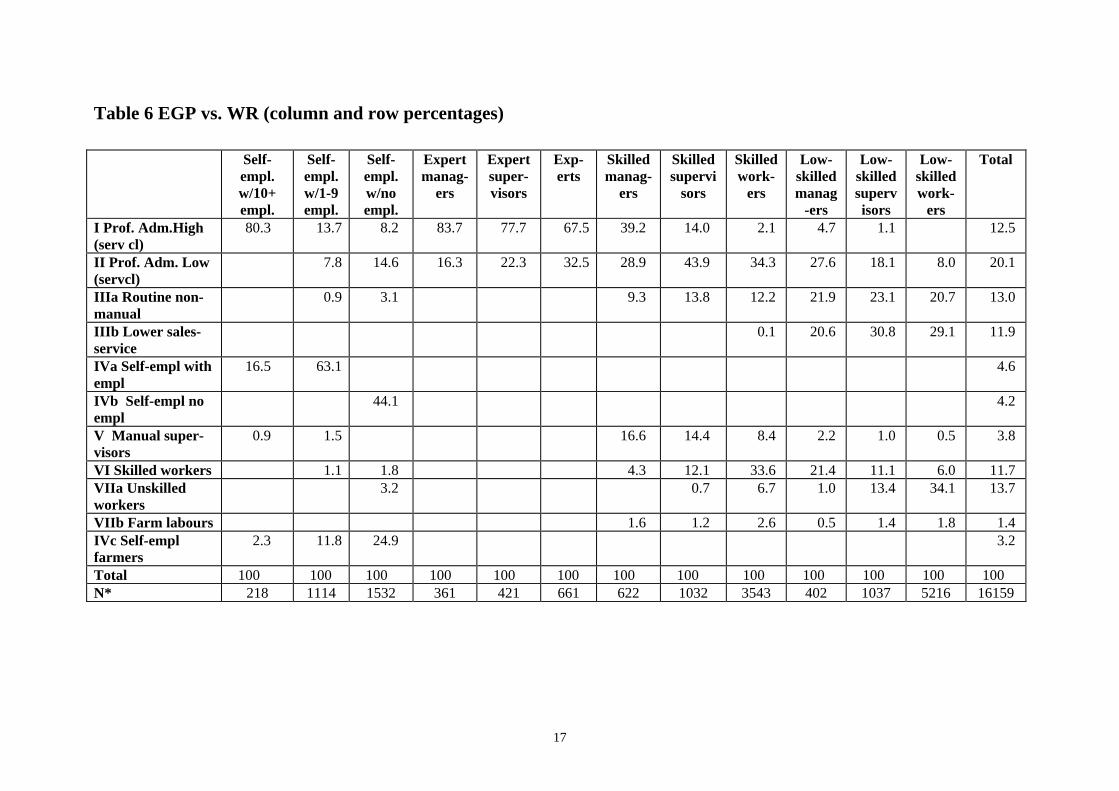
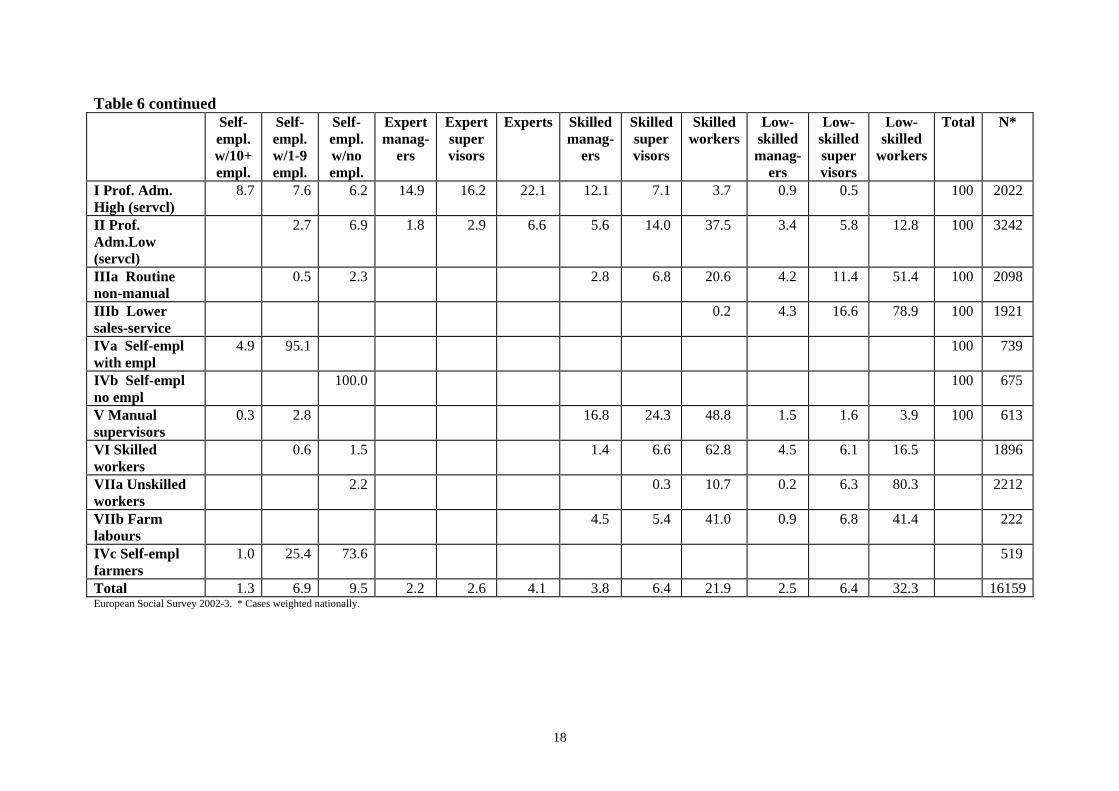
As can be seen in Table 5, both the Fordist (industrial) and the post-industrial hierarchy combine a command/authority structure and a human capital structure. It is assumed that the post-industrial command structure is more floating than the Fordist hierarchy. It is also assumed that the distinction between professionals and semi-professionals/service workers is based on delegation and divisions of tasks rather than a Fordist command model (ibid. p. 25). The fate of the ‘outsiders’, or surplus population, is not dealt with in the class scheme as such. Esping Andersen’s class scheme is operationalized according to the same criteria as in his original model (for technical specifications see Appendix V). C.4. Empirical overlap and differences between the four class schemes A brief look at the cross-tables comparing the four class schemes gives us a unique possibility to investigate similarities and differences. C. 4.1. EGP vs. Wright (exploitation model) Higher controllers in EGP (class I) are mainly represented by capitalists, managers and experts in Wright’s (1985) class scheme based on control of skill and organizational assets (exploitation model). Almost half of the lower controllers (class II in EGP) are either skilled workers (37.5%) or low-skilled workers (12.8%) in Wright’s scheme (see Table 6). Categories described as intermediate classes in the original EGP scheme (routine non manual, lower sales service and manual supervisors) are either classified as skilled workers (class IIIa and V), or as low-skilled workers, by Wright. 51.5% of routine non-manual employees (class IIIa in EGP) and 78.9% of lower sales service (class IIIb) are low-skilled workers, in Wright’s model. There is a high degree of overlap between Wright and EGP when it comes to skilled workers, albeit as much as 20.7 percent units end up as self-employed, supervisors or managers in Wright’s scheme. An additional 16.5 percent unit of skilled workers in EGP end up as low-skilled workers in Wright’s scheme. Unskilled workers (VIIa) in EGP, however, also end up as low-skilled workers in Wright’s exploitation model (see Table 6). In summary, this suggests a picture where there is a high degree of overlap in the location of the top and bottom of the class structure (class I and class V, VI), but a significant discrepancy in the analyses of the lower service class (class II) and service employees (class III). A substantial percentage of those ending up as workers in the original EGP scheme end up as managers and supervisors in

16
Wrights schemes. Following Wright it also appears as if the service class is more heterogeneous than one might expect in terms of power resources at work (see Table 6). Because the definition of managers is essentially the same in EGP and Wright (people with delegated power over important organizational decisions) we may either observe that the inventors of the EGP scheme or Wright are wrong in some operational assumptions. In the case of the EGP scheme, this ultimately boils down to the content of occupational rubrics, and to what extent these reveal the actual authority in concrete jobs. In the case of Wright, the critical question is how well his authority indicators (including the one we have used in the ESS) works. One, may at least hypothetically, suspect that some respondents may put too much authority into their work tasks and thereby inflate their real responsibilities. One way to figure out what model is closest to the factual distribution of managers is to conduct methodological experiments checking out the relative consequences of different operational practices (see Wright 2005).
17
Table 6 EGP vs. WR (column and row percentages) Self-
empl. w/10+ empl.
Self- empl. w/1-9 empl.
Self- empl. w/no empl.
Expert manag-
ers
Expert super-visors
Exp-erts
Skilled manag-
ers
Skilled supervi
sors
Skilled work-
ers
Low- skilled manag
-ers
Low- skilled supervisors
Low- skilled work-
ers
Total
I Prof. Adm.High (serv cl)
80.3 13.7 8.2 83.7 77.7 67.5 39.2 14.0 2.1 4.7 1.1 12.5
II Prof. Adm. Low (servcl)
7.8 14.6 16.3 22.3 32.5 28.9 43.9 34.3 27.6 18.1 8.0 20.1
IIIa Routine non-manual
0.9 3.1 9.3 13.8 12.2 21.9 23.1 20.7 13.0
IIIb Lower sales-service
0.1 20.6 30.8 29.1 11.9
IVa Self-empl with empl
16.5 63.1 4.6
IVb Self-empl no empl
44.1 4.2
V Manual super-visors
0.9 1.5 16.6 14.4 8.4 2.2 1.0 0.5 3.8
VI Skilled workers 1.1 1.8 4.3 12.1 33.6 21.4 11.1 6.0 11.7 VIIa Unskilled workers
3.2 0.7 6.7 1.0 13.4 34.1 13.7
VIIb Farm labours 1.6 1.2 2.6 0.5 1.4 1.8 1.4 IVc Self-empl farmers
2.3 11.8 24.9 3.2
Total 100 100 100 100 100 100 100 100 100 100 100 100 100 N* 218 1114 1532 361 421 661 622 1032 3543 402 1037 5216 16159
18
Table 6 continued Self-
empl. w/10+ empl.
Self- empl. w/1-9 empl.
Self- empl. w/no empl.
Expert manag-
ers
Expert super visors
Experts Skilled manag-
ers
Skilled super visors
Skilled workers
Low- skilled manag-
ers
Low- skilled super visors
Low- skilled
workers
Total N*
I Prof. Adm. High (servcl)
8.7 7.6 6.2 14.9 16.2 22.1 12.1 7.1 3.7 0.9 0.5 100 2022
II Prof. Adm.Low (servcl)
2.7 6.9 1.8 2.9 6.6 5.6 14.0 37.5 3.4 5.8 12.8 100 3242
IIIa Routine non-manual
0.5 2.3 2.8 6.8 20.6 4.2 11.4 51.4 100 2098
IIIb Lower sales-service
0.2 4.3 16.6 78.9 100 1921
IVa Self-empl with empl
4.9 95.1 100 739
IVb Self-empl no empl
100.0 100 675
V Manual supervisors
0.3 2.8 16.8 24.3 48.8 1.5 1.6 3.9 100 613
VI Skilled workers
0.6 1.5 1.4 6.6 62.8 4.5 6.1 16.5 1896
VIIa Unskilled workers
2.2 0.3 10.7 0.2 6.3 80.3 2212
VIIb Farm labours
4.5 5.4 41.0 0.9 6.8 41.4 222
IVc Self-empl farmers
1.0 25.4 73.6 519
Total 1.3 6.9 9.5 2.2 2.6 4.1 3.8 6.4 21.9 2.5 6.4 32.3 16159 European Social Survey 2002-3. * Cases weighted nationally.
19
C. 4.2. EGP vs. Esping Andersen Comparing the results generated by the EGP model and those of Esping Andersen confirms the picture that service class I mainly consist of professionals and to lesser degree managers/capitalists. In line with the findings above, the lower service class once again appears to be a rather heterogeneous category (20.2% are managers/professionals, 21.7% technicians, 27.6% semi professionals, 5.4% skilled servants and 25.1% lower clerical/sales employees according to Esping Andersen’s scheme). The intermediate strata in the original EGP model mainly correspond with Esping Andersen’s lower, clerical sales and to lesser extent semi-professionals. The same holds true for the operationalizations of skilled and non-skilled workers (see Appendix I, Table 3.2). The parallels and overlap between the original EGP and Esping Andersen’s model are more striking than the discrepancies. The top and bottom of the class structure can be described in similar ways. The main difference appears to be lower managers/professionals (service class II) that represent a more heterogeneous category in Esping Andersen’s scheme. His post-industrial class model is also more empirically descriptive than any of the competing class schemes. C. 4.3. Wright’s power model vs. EGP/ESP/Wright Wright’s power model, like his exploitation model, follows the same patterns vs. EGP (original version). Once again we see a picture where the higher service class is represented by capitalists, managers and experts. The lower service class end up as a heterogeneous class category (including a substantial group, 29.5%, of high skilled employees with low or only intermediate work autonomy). Half of those in class III in original EGP are defined as workers in Wright’s power model (routine non manual = 49.9% and lower sales services = 62%). This is neither supporting the idea that class III should be regarded as working class nor middle class. It does, however, support our previous claim that this class stratum is heterogeneous in terms of skill, authority and work autonomy. The same may also be said about class V (manual supervisors/lower grade technicians) where four out of ten are neither supervising nor having high work autonomy. As we move down the EGP hierarchy we find a higher overlap between workers in EGP and in the power model. Two thirds (65.8%) of skilled workers in the original version of EGP are working class in Wright’s power model. Three out of four in classes VIIa (74.2%) and VIIb (73.4%) are workers in the power and control model (see Appendix I, Table 3.6). If we compare the power model with Esping Andersen’s class scheme we see a picture where three fourths of unskilled workers with low autonomy are in the Fordist sector. Skilled workers on the other hand are evenly distributed in the Fordist and

20
post-industrial hierarchy. One of the main questions that arises in comparisons between the two schemes is how two locate low-skilled and skilled/semi-professional women in the post-industrial sphere (including welfare state jobs) as subordinate (hierarchy and skill perspective) or more empowered (autonomy perspective). The main difference between the results obtained by Wright’s exploitation model and our revised version of his power model is related to the status of skilled and low-skilled workers (i.e. those not being in managerial and supervisory functions). Three fourths of the skilled workers have low/intermediate work autonomy end up thereby in the working class in the power model. In a corresponding way one fourth of the unskilled workers are moved into semi-autonomous employees. Half of those in Wright’s expert category do not fulfil our work autonomy requirements and are moved to the working class (as skilled workers). If we merge unskilled and skilled workers into the working class, two thirds (66.9%) of the workers in his exploitation model remain workers in the revised power model. As a consequence, the relative size of the European working class drops from 50.5% in Wright’s exploitation model to 40.3% in the revised power model (see Appendix I, Table 3.4). Disagreements on how to approach non-manual routine jobs, where women are overrepresented, have for a long time resulted to very different conclusions in the class schemes. Treating routine non-manual jobs as a part of the middle class (original EGP and Esping Andersen) reduces the working class significantly, particularly for women. Treating these jobs as essentially working class increases the share of workers in general and female workers in particular. Aggregated data for men in nine European countries and Israel show that 40.6% end up in the working class in the EGP scheme (see Appendix II, Table 9.3). Comparable figures for men are 36.4% if we stick to Wright’s power model and 46.7% in his exploitation model (skilled & unskilled workers. Goldthorpe’s more recent contract theory, where lower grade routine non manual employees are said to have modified working contract, changes the picture somewhat. What used to be interpreted as a relatively small working class in the original EGP model is replaced with a larger working class in Goldthorpe’s contract theory. As a logical consequence of this the working class of Wright and Goldthorpe are now more overlapping than in the past.

21
C.4.4 Class and isco-88 So far we have mainly focused upon differences and similarities between class schemes based on hierarchy, ownership, skill and autonomy. A more comprehensive analysis where we look at occupations represented in each class category may change some of the conclusions (see Appendix I, Tables 2.1-2.4). One third of the higher service class are legislators, senior officials and managers (isco-88 code 1). The reminding two thirds are professionals or associate professionals (isco-88 codes 2-3). Those located in the lower service class are mainly professionals (isco code 2), or even more often technicians and associate professionals (isco-88 code 3). Less than one out of ten of the lower service class are managers/senior officials according to isco-88. Both class IIIa and IIIb in the EGP class scheme are associate professionals, clerks and service workers. Employers (class IVa) in most cases end up as service class, but a substantial share is also located in traditional working class jobs. The same holds true for self-employed without employees. The working class in the original EGP scheme is mainly represented in manual and elementary jobs (isco-88 codes 6-9). One in five workers in the same class scheme, however, work in clerical, sales- and service jobs (isco-88 codes 4-5). Wright’s classes appear as more heterogeneous than EGP if we use occupations as a reference point (see Appendix I, Tables 2.2-2.3). Employers and self-employees are represented in all of the main categories of isco-88. Experts end up, for obvious reasons, in expert jobs (isco-88 codes 1-3). Managers and supervisors are found along the whole spectrum of isco-codes, even if they are overrepresented in traditional middle class jobs. Skilled workers are in Wright’s terminology both professionals/semi-professionals (isco-88 codes 2-3) and craft workers (isco-88 code 7), and to lesser extent service- and sale jobs (isco-88 code 5). Low-skilled workers in Wright’s models are not primarily located in traditional manual jobs, but in clerical and service jobs (isco-88 codes 4-5). To what extent occupational homogeneity or heterogeneity is an advantage in constructing class typologies is an open question. Neither EGP nor the Wright schemes can be reduced to occupations, even if it turns out to be an important element in the operationalization of the class schemes. It should also be emphasized that occupational based classifications are seldom consistent over time (with regard to occupation), gender neutral (there is normally more differentiation and information about male occupations), objective (the content of work tasks varies over time, between organizations and sectors, as well as countries) or very informative with regard to work relations (decision-making, work autonomy, etceteras).
22
C. 5. Comparing class schemes – some final comments and warnings Those interested in comparing class schemes face at least three sets of obstacles related to: 1) differences and similarities between the overall theoretical rationales of the research programs, 2) the indicators (variables) used, and 3) the technical operationalizations made. The first and second challenges remind us that none of the class schemes available can be treated as ‘social facts’. They represent alternative theoretical solutions aimed at measuring social relations of power and inequality and/or exploitation. A straightforward comparison between the indicators used may show a high degree of resemblance (c.f. EGP and Wright’s exploitation model where credentitials and organizational assets are important), at the same time as their theoretical universe is very different. The third challenge related to technical operationalizations is unfortunately seldom discussed or problematized. Wright (1985, 1997) is one of the few researchers that openly discuss the problem of empirical demarcation lines. His comparisons between Sweden and the USA also suggest that the technical aspects may generate larger discrepancies within class schemes than between class schemes. This is also a crucial problem in the construction of our class variables. Our reference points have mainly been previous data from the late 1990’s (Norway). The construction of Wright’s classes has been done comparing separate indicators (skill, autonomy, employer/employee ratios) as well as general class distributions (checked for gender). In critical cases, such as ‘authority’ and ‘work autonomy’ we have compared the distributions over time; based on Norwegian (‘Wright’) data from 1995/6 and the ESS data for Norway (see Appendix III). We have also compared our final results with previous studies (Breen & Luijkz 2004; Esping Andersen 1993). The data included in Appendix II and III shows a high degree of empirical overlap between our result based on ESS and previous research. None of this, however, fully proves that respondents ending up in the various class categories are ‘identical’. It does, however, suggest that there is a high degree of resemblance within the class schemes over time. We have also tried to be as loyal as possible to the theoretical rationales of the various schemes.
23
D. 5. Classes in Europe – A brief overview Given the differences in conceptual framework, it is hardly a surprise that we may find rather different interpretations of class relations in Europe. This may be a problem for some, or a starting point to reflect upon alternative ways to evaluate issues of social change, work relations and social inequality. The class schemes presented also share a number of commonalities with a heavy emphasis on work relations. The EGP class scheme and Esping Andersen’s scheme aim more explicitly at addressing issues of social closure (i.e. the relative stability of class as common and shared life experiences over time) than Wright. This is, however, also an issue highlighted by Wright (1997) in his study of intergenerational mobility, family class and social network. Another commonality is the obsession with the ‘new middle classes’. All of the architects of the class schemes have also spent considerable time discussing issues of gender and class. As already indicated above, it appears that primarily occupationally based class schemes, such as EGP, show a relatively high degree of stability since the 1980’s, at least when it comes to men. Roughly one fourth of the male population in Europe is located in the working class in the 1980’s and 1990’s, according to Breen & Luijkx estimations. This is also close to the figures we find for the same countries (minus France) in ESS 2002 (see Appendix II, Table 9.3). Data for the Nordic countries (Wright project) suggests significant reduction of the working class (particularly unskilled workers) in the 1980’s and beginning of the 1990’s, but less dramatic changes if we compare the Nordic data from the mid 1990’s with ESS 2002 (see Appendix III, Tables 10.4). Similar patterns can also be found in Great Britain (see Appendix III, Tables’ 10.5-6). In this section we will give a picture of the European class demography. We will also give a portrait of the relationship between gender and class. Tables 6-9 below are based on aggregated data for 21 countries (more detailed data broken down by country is included in Appendix I). If we stick to Goldthorpe’s contract theory we got a picture where 4:10 (37.4%) ends in the working class (IIIb, VI & VII), 3:10 (32.5%) in the service class and 3:10 in the intermediate strata primarily dominated by service employees (11.7%) and the petty bourgeoisie (12.7%).
24
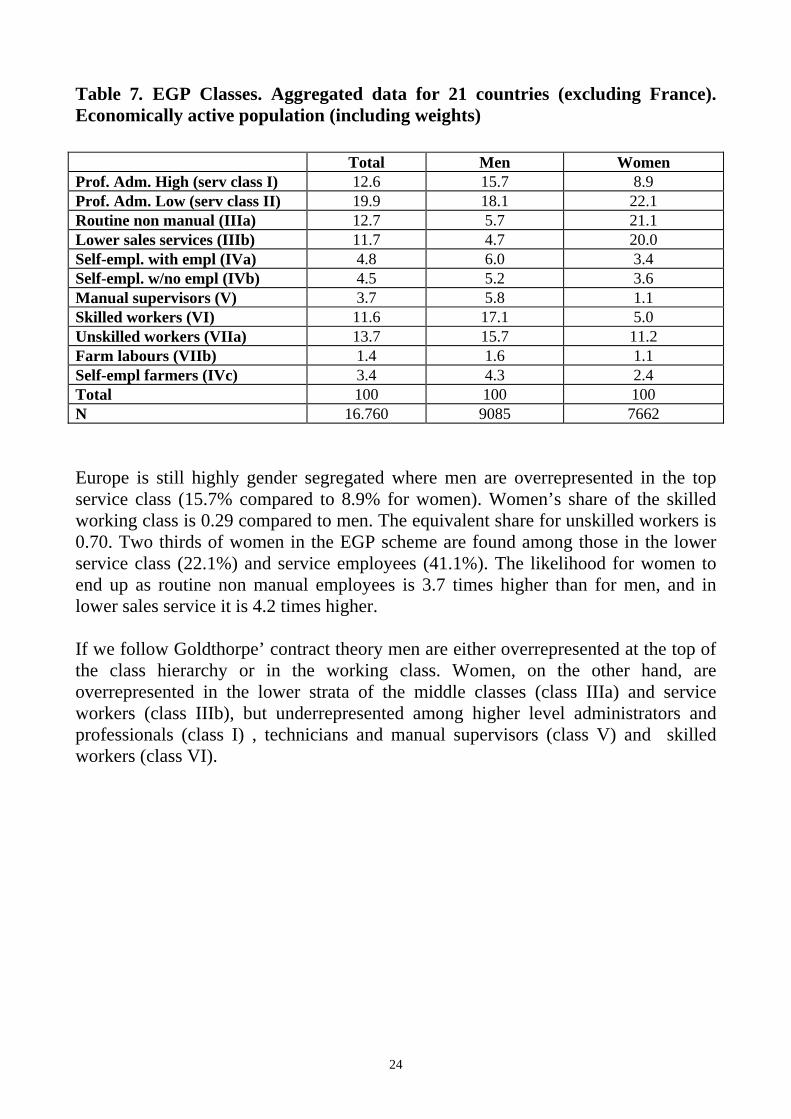
Table 7. EGP Classes. Aggregated data for 21 countries (excluding France). Economically active population (including weights) Total Men Women Prof. Adm. High (serv class I) 12.6 15.7 8.9 Prof. Adm. Low (serv class II) 19.9 18.1 22.1 Routine non manual (IIIa) 12.7 5.7 21.1 Lower sales services (IIIb) 11.7 4.7 20.0 Self-empl. with empl (IVa) 4.8 6.0 3.4 Self-empl. w/no empl (IVb) 4.5 5.2 3.6 Manual supervisors (V) 3.7 5.8 1.1 Skilled workers (VI) 11.6 17.1 5.0 Unskilled workers (VIIa) 13.7 15.7 11.2 Farm labours (VIIb) 1.4 1.6 1.1 Self-empl farmers (IVc) 3.4 4.3 2.4 Total 100 100 100 N 16.760 9085 7662 Europe is still highly gender segregated where men are overrepresented in the top service class (15.7% compared to 8.9% for women). Women’s share of the skilled working class is 0.29 compared to men. The equivalent share for unskilled workers is 0.70. Two thirds of women in the EGP scheme are found among those in the lower service class (22.1%) and service employees (41.1%). The likelihood for women to end up as routine non manual employees is 3.7 times higher than for men, and in lower sales service it is 4.2 times higher. If we follow Goldthorpe’ contract theory men are either overrepresented at the top of the class hierarchy or in the working class. Women, on the other hand, are overrepresented in the lower strata of the middle classes (class IIIa) and service workers (class IIIb), but underrepresented among higher level administrators and professionals (class I) , technicians and manual supervisors (class V) and skilled workers (class VI).

25
Table 8 Wright’s class scheme (WR) based on skill and organizational assets (exploitation model). Aggregated data for 21 countries (excluding France. Economically active population (including weights) Total Men Women Capitalists 1.3 1.9 0.7 Small capitalists 6.9 8.8 4.6 Self empl (no empl) 9.6 11.6 7.2 Expert managers 2.2 3.0 1.3 Expert supervisors 2.6 3.2 1.8 Experts 4.0 4.4 3.6 Skilled managers 3.9 4.5 3.2 Skilled supervisors 6.6 6.7 6.5 Skilled workers 22.0 24.2 19.4 Low-skilled managers 2.5 2.5 2.4 Low-skilled supervisors 6.4 4.6 8.5 Low-skilled workers 32.0 24.6 40.8 Total 100 100 100 N 16.334 8892 7422 Wright’s class model not only confirms what we already know about a gender segregated labour market (OECD 2003), it is also suggest a pattern where women are underrepresented in positions associated with power and rewarding organizational assets. Women are overrepresented among low-skilled workers (40.8%) or to be found among skilled workers (19.4%). Men, on the other hand, are less often to be found among low-skilled workers (24.6%) and overrepresented in managerial, supervisory and ownership relations. In this perspective it is no surprise to find a higher proportion of women in the working class (60.2% for women) compared to men (48.8%). According to Wright’s skill and organizational asset perspective, only 39.8 % of women and 51.2% of men end up in the ‘middle classes’.

26
Table 9. Esping Andersen’s post-industrial stratification scheme (ESP). Aggregated data for 21 countries (excluding France. Economically active population (including weights) Total Men Women 1. Primary sector occupations Farmers 3.4 4.3 2.4 Farm workers 1.4 1.6 1.1 2. Fordist hierarchy (a) Managers I 5.6 7.5 3.3 (a) Managers II 3.4 4.6 2.1 (a) Petit bourgeoisie 1.9 2.9 0.7 (b) Clerical occupations 14.5 8.1 22.2 (b) Sales occupations 9.6 7.3 12.4 (c) Skilled manual workers 12.3 20.0 3.0 (d) Unskilled manual workers 8.8 12.3 4.5 3. Post-industrial hierarchy (a) Professionals 9.5 11.1 7.6 (b) Technicians 4.6 6.0 3.1 (b) Semi-professionals 10.0 4.4 16.7 (c) Skilled service workers/servants 4.9 4.6 5.3 (d) Unskilled service workers/servants 10.0 5.2 15.6 Total 100 100 100 N 16757 9074 7666 Esping Andersen’s class scheme is less clear when it comes to the distinctions between workers and the middle class. His main idea is also that the Fordist class logic in Wright’s class model and the EGP model is too general and insensitive to differences between the agrarian sector, the Fordist sector (dominated by industry) and the post-industrial sector (dominated by services). Esping Andersens’ class scheme supports the idea that men are overrepresented at the top and bottom of the Fordist sector (traditional economy). Women, on the other hand, are in intermediate positions in the Fordist economy (clerical and sales) or professional jobs, semi-skilled and low-skilled jobs in the post-industrial sector (including the welfare state). The proportion ending up in the working classes are essentially the same as in the EGP model, but the logic of class structuration is believed to be more sector dependent and gendered.

27
Our revised version of Wright power model suggests a overlapping picture when it comes to ownership and authority relations, but a somewhat deviating picture if we look at the destiny of experts, skilled workers and unskilled workers. In the revised power model, where job autonomy is introduced, the working class drops to 40.3% (compared to 54% in Wright’s exploitation model). The relative differences between men and women are here less pronounced (38.3% males and 42.2% women now end up in the working class).
Table 10. Revised version of Wright’s class scheme based on ownership, hierarchy and autonomy (WR_P). Aggregated data for 21 countries (excluding France. Economicaly active population (including weights) Total Men Women Capitalists 1.5 2.1 0.8 Small capitalists 8.7 10.8 6.1 Self-empl (no empl) 12.9 14.4 11.2 Managers (exp/skilled) 5.7 6.9 4.2 Managers (low-skilled) 2.3 2.3 2.2 Supervisors (exp/skilled) 8.6 9.3 7.7 Supervisors (low-skilled) 6.0 4.3 7.9 Semi-autonomous (exp/skilled) 7.0 6.5 7.6 Semi-autonomous (low- skilled) 7.0 4.9 9.6 Workers (skilled & low aut) 17.4 20.2 14.0 Workers (low-skill & low aut) 22.9 18.1 28.6 Total 100 100 100 N 17.515 9535 7959 A higher percentage of women are in the middle class due to high work autonomy, and a lower percentage of men are located in the middle class because they lack work autonomy. Among workers and semi-autonomous employees we still find a differentiation of credentials related to gender, but it is an open question what role these credentials play in the reward system of organizations. As will be shown later (see section E) educational credentials may matter, but less so if they are not converted into the actual work tasks.

28
D.1 National patterns of stratification
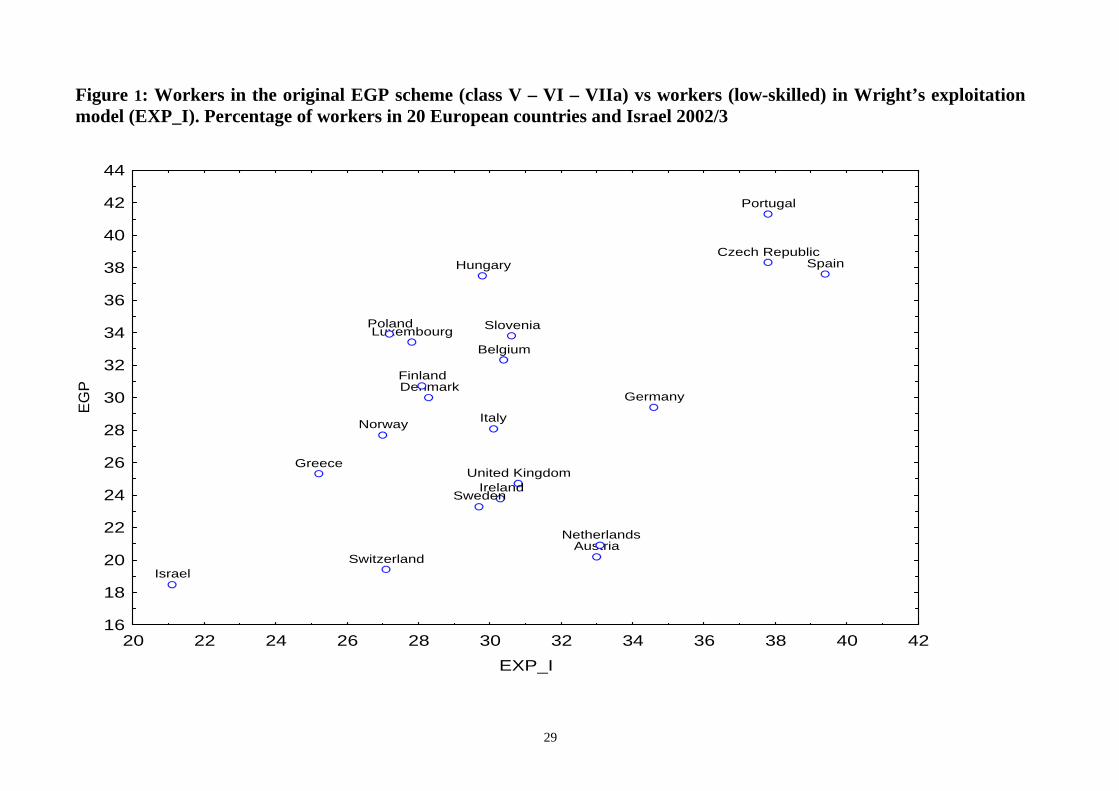
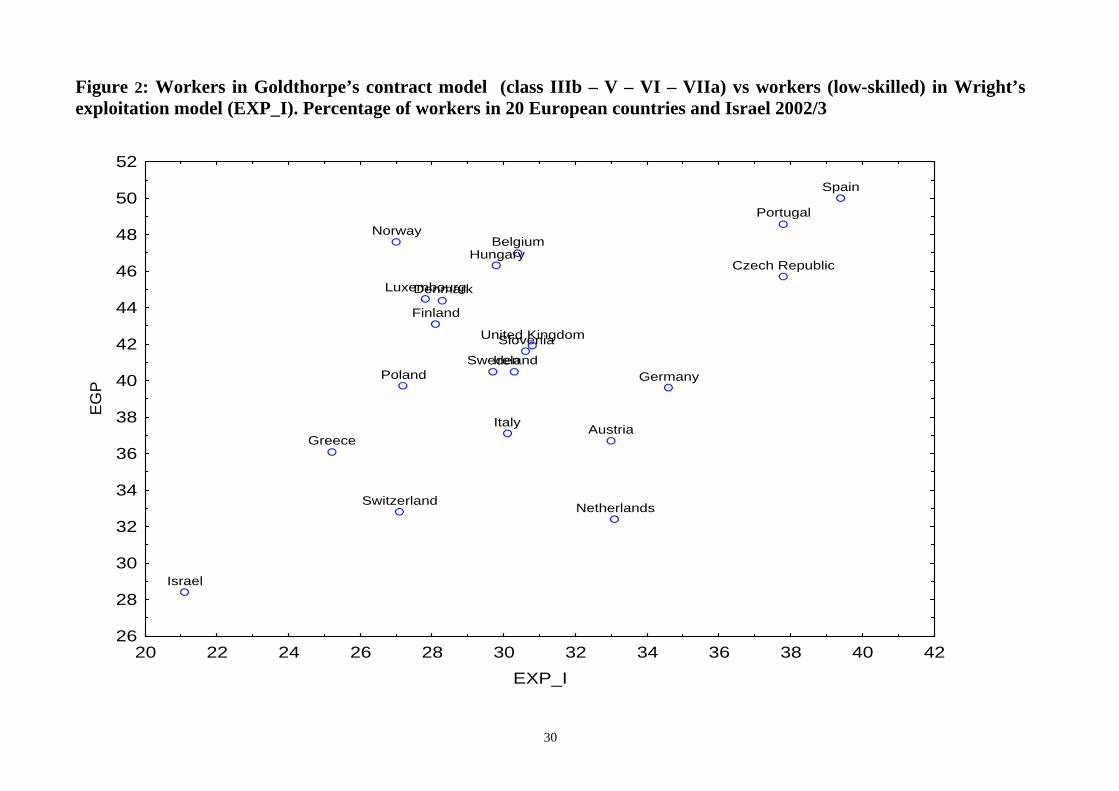
An initial picture how the class schemes translate into national contexts is presented below. Instead of breaking down the class schemes into more detailed categories, we restrict the empirical focus to the working class. This is not because the residual categories – the middle classes – are uninteresting, but a practical consequence of limited space (a more elaborated picture including data on the middle classes is presented in Appendix I, Tables 1- 4). Our result suggests a number of interesting findings. A first observation is that some European countries are more working class than others. A second observation is that choice of class schemes may give rather different results in different countries. A third observation is that the distinctions between working class and middle classes needs to be developed further in order to make a sociologically meaningful diagnosis of similarities and differences between nations. If we use the original EGP or Esping Andersen’s class schemes, Portugal, Spain, the Czech Republic and Hungary have the highest share of workers, followed by Poland, Luxembourg, Slovenia and Belgium (above the average for the countries included). The countries with the lowest share of workers, according to the original EGP scheme, are Switzerland, Austria and the Netherlands, followed by Sweden, Ireland, United Kingdom and Greece. Norway, Italy, Denmark, Finland and Germany are here closest to the European average. The percentages in the working class increases if we use Goldthorpe’s contract theory. Except of Norway, where the working class increases above the European average, the the same picture emerges if we use Goldthorpe’s contract approach. The relative size of the working class is more floating in Wright’s exploitation model than the EGP scheme(s) or the power model. If we restrict the analysis to low-skilled workers (see figure 1) it varies between 25.2% (Greece) and 39.4% (Germany) with an average of 32%. If we use a more extended version of the working class (including skilled workers/semi-professionals) the figure varies between 42.3% (Greece) and 65.9% (Czech Republic), with an average of 54% (see Table 11). The relation between Wright and alternative versions of EGP is illustrated in Figures 1a-2b below. These figures clearly demonstrates that the relative size of the working class is related to the operational choice and theoretical framework. In other words, the differences are not only between Wright and Goldthorpe, but alternative operationalizations of the working class suggested by Wright and Goldthorpe.
29
Figure 1: Workers in the original EGP scheme (class V – VI – VIIa) vs workers (low-skilled) in Wright’s exploitation model (EXP_I). Percentage of workers in 20 European countries and Israel 2002/3
Austria
Belgium
Switzerland
Czech Republic
GermanyDenmark
Spain
Finland
United KingdomGreece
Hungary
Ireland
Israel
Italy
Luxembourg
Netherlands
Norway
Poland
Portugal
Sweden
Slovenia
20 22 24 26 28 30 32 34 36 38 40 42EXP_I
16
18
20
22
24
26
28
30
32
34
36
38
40
42
44
EG
P
30
Figure 2: Workers in Goldthorpe’s contract model (class IIIb – V – VI – VIIa) vs workers (low-skilled) in Wright’s exploitation model (EXP_I). Percentage of workers in 20 European countries and Israel 2002/3
Austria
Belgium
Switzerland
Czech Republic
Germany
Denmark
Spain
Finland
United Kingdom
Greece
Hungary
Ireland
Israel
Italy
Luxembourg
Netherlands
Norway
Poland
Portugal
SwedenSlovenia
20 22 24 26 28 30 32 34 36 38 40 42EXP_I
26
28
30
32
34
36
38
40
42
44
46
48
50
52
EG
P
31
Figure 3: EGP (workers) vs. Wright’s extended definition of workers in his exploitation model (EXP_II). Percentage of workers in 20 European countries and Israel 2002/3
Austria
Belgium
Switzerland
Czech Republic
GermanyDenmark
Spain
Finland
United KingdomGreece
Hungary
Ireland
Israel
Italy
Luxembourg
Netherlands
Norway
Poland
Portugal
Sweden
Slovenia
35 40 45 50 55 60 65 70EXP_II
16
18
20
22
24
26
28
30
32
34
36
38
40
42
44
EG
P

32
Figure 4: Goldthorpe’s contract model (class IIIb – V – VI – VIIa) vs. Wright’s extended definition of workers in his exploitation model (EXP_II). Percentage of workers in 20 European countries and Israel 2002/3
Austria
Belgium
Switzerland
Czech Republic
Germany
Denmark
Spain
Finland
United Kingdom
Greece
Hungary
Ireland
Israel
Italy
Luxembourg
Netherlands
Norway
Poland
Portugal
SwedenSlovenia
35 40 45 50 55 60 65 70EXP_II
26
28
30
32
34
36
38
40
42
44
46
48
50
52
EG
P
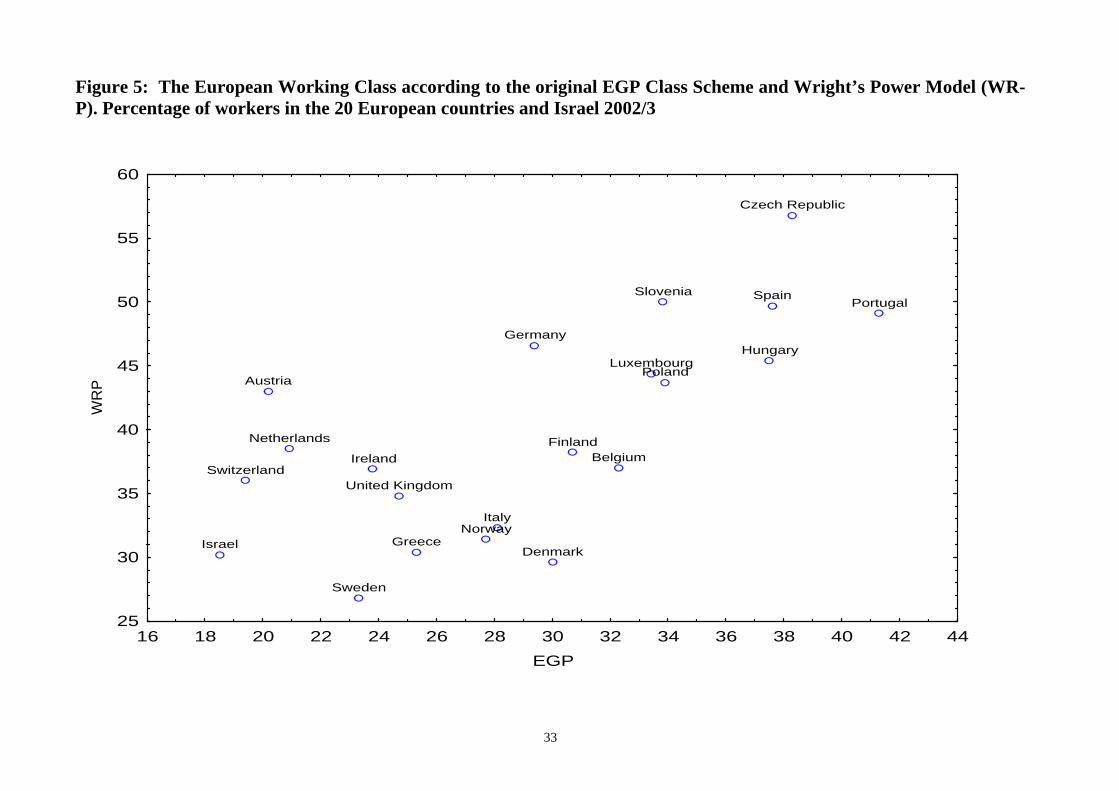
33
Figure 5: The European Working Class according to the original EGP Class Scheme and Wright’s Power Model (WR-P). Percentage of workers in the 20 European countries and Israel 2002/3
Austria
BelgiumSwitzerland
Czech Republic
Germany
Denmark
Spain
Finland
United Kingdom
Greece
Hungary
Ireland
Israel
Italy
Luxembourg
Netherlands
Norway
Poland
Portugal
Sweden
Slovenia
16 18 20 22 24 26 28 30 32 34 36 38 40 42 44EGP
25
30
35
40
45
50
55
60
WR
P
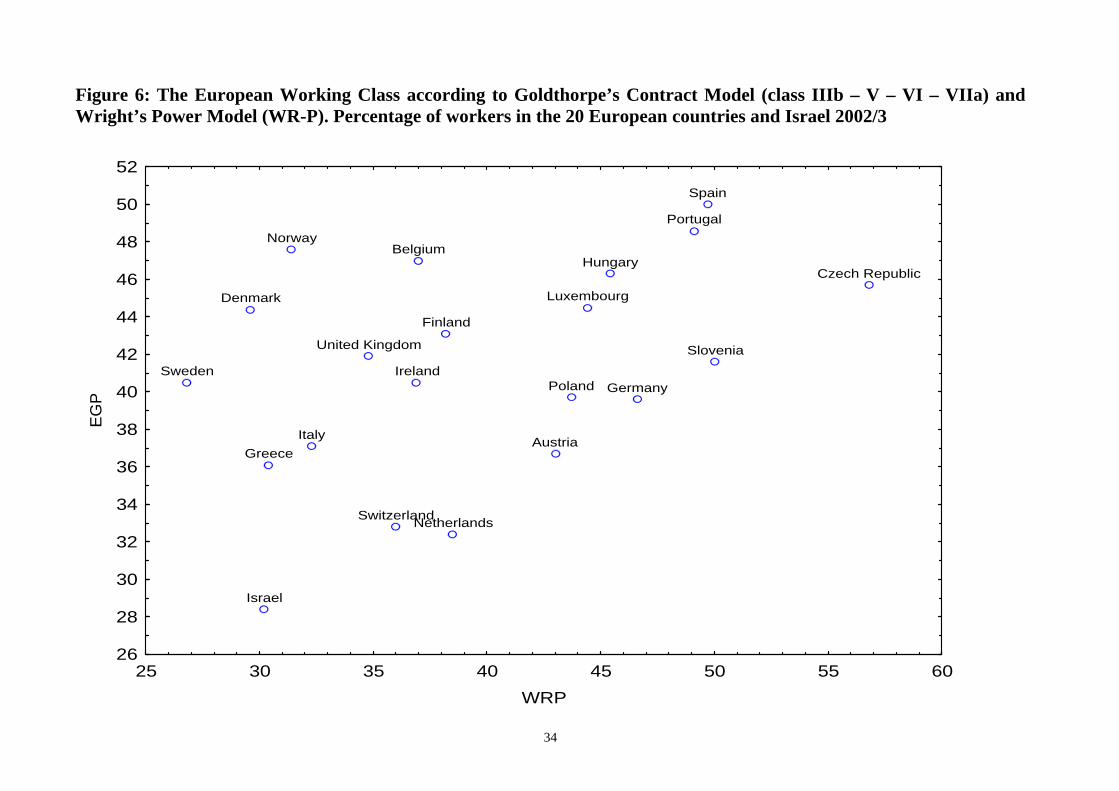
34
Figure 6: The European Working Class according to Goldthorpe’s Contract Model (class IIIb – V – VI – VIIa) and Wright’s Power Model (WR-P). Percentage of workers in the 20 European countries and Israel 2002/3
Austria
Belgium
Switzerland
Czech Republic
Germany
Denmark
Spain
Finland
United Kingdom
Greece
Hungary
Ireland
Israel
Italy
Luxembourg
Netherlands
Norway
Poland
Portugal
SwedenSlovenia
25 30 35 40 45 50 55 60WRP
26
28
30
32
34
36
38
40
42
44
46
48
50
52
EG
P

35
The share of workers is for obvious reasons reduced if we only include low- skilled workers into the working class in Wright’s exploitation model. In 14 out of 21 cases the overlap with the original version of EGP is high. In four countries (Switzerland, Sweden, Ireland and United Kingdom) we still observe a larger working class if we stick to Wright’s exploitation model. In the four remaining cases, Poland, Luxembourg, Hungary and Portugal, Wright’s stricter definition of the working class produces a significantly lower proportion of workers than the EGP scheme (see Figure 1). Data based on Wrights exploitation model confirms the impression we got from the original EGP scheme with high shares of workers in Spain, Portugal and the Czech Republic. Greece, United Kingdom, Ireland, Sweden, and to lesser extent Switzerland, are also well above the European average with a larger middle class in Wright’s class scheme. The most striking observation is, nevertheless, not the overlap, but the difference in the results. Some of the most middle class countries according to the original EGP scheme (including the Netherlands and Austria) are becoming more working class than the European average in Wright’s exploitation scheme. Germany no longer represents the European average, but has one of the largest shares of workers in Europe. Less surprisingly, the differences in results increases if we play down the relative importance of skill/educational credentials and introduce a power perspective based on authority and work autonomy. With an autonomy dimension we find a higher percentage of workers in all nations except of Denmark and Germany. With the exception of the Nordic countries, Italy and Greece, the percentage of workers varies significantly between the models (even if we restrict Wright’s working class to low-skilled workers)

36
Table 11. Percentage workers in Europe according to Wright and Goldthorpe’s class schemes. Minimum- and maximum operationalizations. Weights included Based on Wrights class models EGP/Goldthorpe contract
model WR (exploitation model) WR_P (power model) (modified version of
Ganzebom) Country
Low skilled work- ers
Skilled work- ers
Sum Low skill/ low auto- nomy
Skill, but low auto- nomy
Sum Class VI-VII (origi- nal EGP)
Class V-VII (origi- nal EGP)
Class IIIb V-VIIa (con- tract model)
Norway* 27.0 17.7 44.7 18.1 13.3 31.4 25.4 28.7 43.4 Sweden 29.7 16.6 46.3 17.5 9.3 26.8 21.1 24.0 40.6 Finland 28.1 25.8 53.9 19.1 19.1 38.2 30.7 32.5 39.9 Denmark 28.3 20.1 48.4 17.1 12.5 29.6 27.1 31.1 41.5 United Kingdom
30.8 13.8 44.6 23.3 11.5 34.8 21.9 25.7 42.6
Germany 34.6 26.8 61.4 25.3 21.3 46.6 25.7 30.0 31.4 Netherlands 33.1 23.0 56.1 21.2 17.3 38.5 17.2 21.8 28.2 Switzerland 27.1 22.1 49.1 17.6 18.4 36.0 15.7 20.4 33.2 Luxembourg 29.8 27.8 57.6 22.2 22.2 44.4 27.8 33.4 25.0 Austria 27.9 27.3 55.2 23.6 19.4 43.0 16.9 20.8 31.9 Belgium 23.8 28.9 52.7 19.2 17.8 37.0 28.3 32.8 44.1 Ireland 30.3 14.8 45.1 22.4 14.5 36.9 20.8 25.0 44.2 Spain 39.4 23.5 62.9 30.2 19.5 49.7 39.8 42.5 48.0 Italy 30.1 19.8 49.9 19.4 12.9 32.3 26.0 29.4 38.4 Portugal 37.8 22.8 60.6 28.7 20.4 49.1 40.0 42.7 48.1 Greece 25.2 17.1 42.3 17.1 13.3 30.4 25.1 26.4 36.0 Czech Republic
27.8 28.1 65.9 30.5 26.3 56.8 36.6 41.3 41.5
Hungary 29.8 24.6 54.4 22.7 22.7 45.4 37.5 40.6 38.5 Poland 27.2 28.2 55.4 20.6 23.1 43.7 31.5 35.0 30.4 Slovenia 32.0 22.0 54.0 24.4 25.6 50.0 26.7 33.2 36.1 Israel** 21.1 16.7 37.8 15.1 15.1 30.2 15.6 18.9 22.6 Total 32.0 22.0 54.0 22.9 17.4 40.3 26.7 30.4 37.3 * The Norwegian survey does not include occupational data for self-employed and is, therefore, not fully comparable with EGP-syntax data from other nations. The EGP figures obtained in table 11 is in the Norwegian case based on a revised EGP-syntax ** We have included Israel in the aggregated figure, but excluded Israel in the national analyses. According to our ESS-data Israel has an exceptionally low share of workers (skilled and low-skilled).

37
Summing up: We find more overlapping figures between Wright and EGP/Esping Andersen if we restrict the analysis to unskilled workers, significant difference if we stick to Wright’s extended working class definition, and a more mixed and complicated picture if we rely on a more work process oriented models (c.f. the power model). What is an obvious conclusion from one perspective is not necessarily the one and only conclusion. E. Class schemes with alternative strengths Even if it may be argued that class schemes are an essential tool in analyses of social structure and social change, most social scientist would pay attention to what could be gained using a class perspective compared to other modes of explanations, including more conventional stratification indicators. Two sets of traditionally class-related issues are relatively well covered in ESS 2002/3, economic capital and political capital. In ESS, economic capital translates into questions such as family income, but also whether people can control their job, get a similar or better job, start their own business and the risk of unemployment. Political capital is covered in a number of ESS questions such as interest in media, politics, political preferences, and activities in political organizations. We are here limiting ourselves to two variables: a) general interest in politics and b) perception of politics as something easy or difficult to understand. As each of these issues is part of extensive research, we will only limit the presentation to some preliminary findings and observations. Before doing so, let us once again come back to a hidden dimension in the class schemes, the issue of social status. E.1 Class and social status Instead of arguing in favour of models that sum up individuals’ economic, educational and other attributes, some class researchers would see social status as an outcome of employment positions and relations in labour market and firms. As it is shown in Table 12, we also find relatively strong correlations for the EGP model and Esping Andersen’s model with the Treiman scale and the International Socio-Economic Index (ISEI). The service class (the two top classes in EGP) are both high prestige locations following Treiman prestige scores (62.6 on average for class I and 51.7 for class II). Skilled workers have a Treiman score of 35.1 and unskilled workers a score as low as 26.2. It is however interesting to observe the low scores of the routine service employees in the EGP scheme (43.3% for class IIIa and as low as 31.6 for IIb).

38
Despite some anomalies with the intermediate EGP groups (read class III) the correlation between EGP and Treiman’s prestige scores is substantial (Eta2 = 0.709). The same patterns of strong correlations may also be observed if we look at Esping Andersen’s scheme (Eta2 = 0.681). To the extent Treiman and other status indicators are used in the construction of the EGP scheme, it shows a preference to professionals rather than managers and decision-makers. Wright’s class scheme based on educational credentials and organizational assets is also strongly correlated to social prestige as measured by Treiman (Eta2 = 0.406). Even if these values are lower than EGP and Esping Andersen’s model, it is still significant, once again with experts and managers at the top and low-skilled workers and managers at the bottom. If we were to use Treiman as a guide, it would hardly make sense to collapse skilled and unskilled workers into the working class, as we do in the power model. This operation does however make more sense if we look at the ISEI index and, as will be shown, more substantial economic capital (see Appendix I, Table 5.1-4 and Table 10, below). Wright’s exploitation model is more strongly related to prestige, as it measured by the ISEI index, than his previous power model. E.2. Economic capital and employment indicators Even if all the class schemes are sensitive to issues of economic life chances, we see a fairly distinct pattern where the power model does a good job explaining career moves (getting a new job, or starting a new business). We also observe a pattern where the issue of work autonomy is of secondary importance in both the EGP model and the model of Esping Andersen (see Table 12). Unfortunately, we have no data about individual income in the first wave of ESS. Family income may be interesting for many purposes, but it does not give us any information about job related wage differences. Regardless of this, all of the class schemes show significant differences in standardized family income between those at the top and the bottom of the class structure. The notion that class society has disappeared in terms of economic rewards is, in other words, not supported. Contrary to what we just observed, if we restricted the analyses to social status (Treiman) we find a pattern where skill is recognized by employers in terms of high work autonomy are significantly different from just having good organizational credentials in general. Low-skilled workers with high autonomy also have a higher family income than high-skilled workers/semi-professionals with low work autonomy. Even if these results are very preliminary, they support the sociological theses that class is not only assets in general, but related to how various organizational assets are recognized and rewarded in different firms and sectors of the economy (see also Bourdieu 1984 for similar mode of argumentation). The Eta Squares presented in Table 12 only give us a rough idea of how the class schemes perform empirically. Tests where we have used statistically more

39
appropriate regression analyses controlling for country, age, gender and education, indicate large national differences in standardized household income as well as a heavier educational effect in Wright’s models (see Appendix V, Tables 12a-d). Just like the other schemes, it is not educational credentials alone that matters, but how these credentials are converted and acknowledged in concrete work situations. Once we control for country specificities, our tests suggests that the class schemes more or less perform equally well when it comes to class based income differentiation, as shown in Table 13.
Table 12. Economic capital. Empirical performance of each class scheme. Eta Squares Treiman ISEI Contr job Similar job Start own
business Family income
Family income
EGP 0.709 0.737 0.158 0.019 0.045 0.136 0.144 WR 0.406 0.334 (0.364) 0.026 0.080 0.095 0.098 ESP 0.681 0.718 0.151 0.018 0.036 0.125 0.132 WR_P 0.336 0.459 (0.727) 0.168 0.292 0.299 0.294 For more information see Appendix I, Tables 5.1-5.4. Table 13. Anova Regression Models
Dep. Var. = Equivalent family Income Ind. Var. = Sex, Eta, Land, Class Scheme. Partial Eta Square by models Base EGP WR_DM WR_P ESP Corrected Model
.338 .377 .373 .368 .376
Intercept .007 .010 .015 .013 .009 gndr .005 .003 .001 .002 .003 age .001 .000 .000 .000 .001 age2 .000 .000 .000 .000 .000 edulvl .088 .020 .048 .059 .025 land .246 .238 .242 .241 .241 Class effect .056 .048 .041 .055 Adj R square .337 .376 .372 .367 .375
40
More elaborated data on class and unemployment experiences are presented in Appendix I, Table 6.1-6.4. It basically confirms the picture thus far that the top classes have less experience with unemployment compared to low-skilled workers, including service workers. E.3. Political Capital Even if many sociologists and political scientists may observe weaker associations between class and party political preferences/voting we still observe significant class cleavages in the interest and understanding of politics. Class 1 in the EGP model are e.g. twice as likely to say they are interested in politics or understand the game of politics compared to low-skilled workers. With the exception of lower sales workers and manual supervisors we find a dropping interest in politics as we go from top to bottom of the EGP ladder. Experts and managers are also overrepresented among those interested in politics in Wright’s class schemes. In these kinds of analyses, class distinctions based on skill or educational credentials clearly matters (for more details see Appendix I, Tables 7.1-4). Previous analysis on the Nordic countries confirms the idea of new political divisions and cleavages based on symbolic capital and hierarchy. In this context, social class represents more than just interest and ability to read the political game. It is also strongly related to disinterest and alienation with politics as a part of a broader citizenship repertoire (see Leiulfsrud 2004). Contrary to what is often referred to as the death of class politics and class based ideologies, we are fairly confident that class continues to be a crucial factor. To what extent and how social class is articulated in terms of political capital is simply too important to be ignored. European Social Survey is, in this respect, a gold mine for those interested in exploring questions on politics, political trust and political capital in a national and comparative perspective. F. Conclusion Our analysis suggest that the overall data quality of the ESS is high, but not without problems. In the case of France we had to take it out due to lack of detailed occupational data. In the Norwegian case we have to operate with a modified version of EGP, with no possibilities to distinguish farmers. More detailed analysis (nominal regression analyses not published here), controlling for age, gender, education and country, also reminds us, that country specific circumstances (sample problems or nation traits of work relations) may have a significant impact how we interpret the results. It makes a lot of sense to use alternative models depending upon what kinds of questions we are interested in. Having access to different class models also allows the researchers to do alternative interpretations of ongoing social changes in Europe.

41
This is an important argument, but unfortunately often ignored in the current discussion on class and class analysis. One of the main differences between the class schemes at the operational level is the issue of routine and non-hierarchical non-manual employees. Locating most of them in the working class increases the size of the working class and leaves us with a picture where a clear majority of women are workers (Wright). Locating the very same categories in intermediate class positions and the middle classes reduces the share of workers and leaves us with a picture that a minority of women are in the working class. This is not a difference between Marxists and Weberian models as such (both camps have for a long time had those advocating in favor of a distinction between manual and non manual labour), but a disagreement between Wright and others as to how to deal with modern work relations dominated by white-collar work. In Wright’s interpretations, the distinction between manual and non-manual is outdated and inadequate as a dimension to understand modern working life (see Wright 1985: 157ff). In the original EGP model it is still believed to mirror historical and institutional differences in life chances and political attitudes. In the new contract theory of Goldthorpe, however, he acknowledge that lower level white collar employees may be see as part of the working class. Comparisons between the EGP model and the two class models developed by Wright suggest that similar definitions of managers, operationalized in different ways, may produce different results. More serious experiments are simply needed to determine issues such as this. Following Wright (2005) one could e.g. give questionnaires to people in a number of different work settings and then observe what they actually do. The discrepancies would here be of particular interest. It also seems likely that the discrepancies between formal occupation and what people actually do, vary a lot between firms, sectors and nations. We argue that our variable ‘WR’ is as close as we can get to Wright’s exploitation model. We also argue that a revised version of Wright’s class scheme (‘WR_P’) based on ownership, authority and work autonomy should be reintroduced in to class research. The strength as well as the weakness of the proposed Wright schemes is that it brings in questions on ability to influence decisions about work. Despite the fact that current variables do a reasonably good job, it will be a significant improvement to have Wright’s original filter question on decision-making included in future ESS surveys. The current ‘wkdcsin’ variable does not fully allow us to separate between ability to influence your own work or the work process in general. Wright’s original filter question on decision-making focuses more heavily upon decision-making in the context of the organisation. A more thorough examination of de facto work relations, as opposed to assumed power and authority, is not only of crucial importance in the case of Wright’s class schemes, but all of class models in this report. The second wave of ESS surveys (in

42
2004) includes a substantial number of strategic questions/variables about work relations. These data will be of great use for those interested in testing class models and analysing the relevance of social class in Europe.

43
G. References Beck, U. (1992): Risk Society: Towards a New Modernity. London: Sage. Bell, D. (1976): The Coming of Post Industrial Society. Harmondsworth: Penguin. Bourdieu, P. (1984): Distinction. A Social Critique of the Judgement of Taste. Cambridge. MA: Harward University Press. Bourdieu, P. (1992): ‘Radical Doubt’ in P. Bourdieu & L. Wacquant (Eds): An Invitation to Reflexive Sociology. Chicago: University of Chicago Press. Bourdieu, P. (1995): Sociology in Question. London: Sage Publications. Breen, R. (Ed.): Social Mobility in Europe. Oxford: Oxford University Press. Breen, R & R. Luijkx (2004): ‘Social Mobility in Europe between 1970 and 2000’ in R. Breen (Ed.) Social Mobility in Europe. Oxford: Oxford University Press. Calvert, P. (1982): The Concept of Class: An Historical Introduction. London: Hutchinson. Carchedi. G. (1977). The Economic Identification of Social Class. London: Rutledge & Kegan Paul. Dahrendorf, R. (1959): Class and Class Conflict in Industrial Society. Stanford CA: Stanford University Press. Devine, F. (2004): Class Practices: How parents help their children get good jobs. Cambridge: Cambridge University Press. Devine, F., M. Savage, R. Crompton & J. Scott (Eds) (2004): Rethinking Class: Identities, Cultures and Lifestyles. London: Palgrave. Erikson, R. and J. H. Goldthorpe (1993): The Constant Flux. Oxford: Oxford University Press. Esping Andersen, G. (1992, Ed.): Changing Classes: Stratification and Mobility in Post-Industrial Societies. London: Sage. Esping Andersen, G. (1999): Social Foundations of Post Industrial Economies. Oxford: Oxford University Press. Geiger, T. (1932): Die soziale Schichtung des deutschen Volkes. Stuttgart: Enke Verlag. Goldthorpe, J. H. (1982): ‘On the Service Class: Its Formation and Future’ in A. Giddens & M. Mackenzie (Eds): Social Class and the Division of Labour. Cambridge: Cambridge University Press. Goldthorpe, J. (2000): ‘Social Class and the Differentiation of Employment Contracts’ in his On Sociology: Numbers, Narrativies and the Integration of Research and Theory (pp 206-229). Oxford: Oxford University Press. Goldthorpe, J. H. and G. Marshall (1992): ‘The Promising Future of Class Analysis: A Response to Recent Crititiques’. Sociology 26: 381- 400. Guba. E.G. (1990): The Paradigme Dialogue. Newbury Park: Sage Publications Kingston, P. W. (2000): The Classless Society. Stanford-Ca: Stanford University Press. Lash, S. (1999): Another Modernity. A Different Rationality. Oxford: Blackwell Publishers.
44
Leiulfsrud, H. (2004): ‘Where have all the classes gone - long time passing?’ in R. Blom & J. Nikula (Eds): Plussat ja miinukset: Yhteiskuntatutkimuksen arviont. Lumikki-kustannus. Tampere. Lockwood, D. (1958): The Blackcoated Worker. London: George Allen and Unwin. Marshall, G, D. Rose, H. Newby & C. Vogler (1988): Social Class in Modern Britain. London: Unwin Hyman. Marshall, G, A. Swift and S. Roberts (1997): Against the Odds? Social Class and Social Justice in Industrial Societies. Oxford: Oxford University Press. New York Times (2005): ‘Class Matters’. Series of articles on class in America published May 15 to June 5, 2005. OECD (2003): OECD Employment Outlook. Paris: OECD. Pakulski, J. & M. Waters (1996): The Death of Class. London: Sage Publications. Parkin, F. (1979): Marxism and Class Theory: A Bourgeois Critique. London: Tavistock Publications. Poulantzas, N. (1973): Political Power and Social Classes. London: New Left Books. Poulantzas, N. (1975): Classes in Contemporary Capitalism. London: New Left Books. Przeworski (1977): ‘From Proletariat into Class: The process of class formation from Karl Kautsky’s The Class Struggle to Recent Debates. Politics & Society 10:2. Rose, D & D. J. Pevalin (2001): The National Socio-economic Classification: Unifying Official and Sociological Approaches to the Conceptualisation and Measurement of Social Class. ISER Working Papers No 2001-4. Institute for Social and Economic Research, University of Essex. Rosenlund, L. (2000): Social Structure and Social Change. Applying Pierre Bourdieu’s Approach and Analytical Framework. Doctoral Dissertation. Stavanger University College. Rueschemeyer, D. (1986): Power and the Division of Labour. Standford-Ca: Stanford University Press. Scott, J. (2002): ‘Social Class and Stratification in Late Modernity’. Acta Sociologica. Vol 45: 23-35. Skeggs, B. (1997): Formations of Class and Gender: Becoming Respectable. London: Sage. Wright, E. (1978): Class, Crises and the State. London: New Left Books. Wright, E. O. (1985): Classes. London: New Left Books. Wright, E. O. (1997): Class Counts: Comparative studies in class analyses. Cambridge: Cambridge University Press. Wright, E. O. (2005): ‘A few comments on comparative class schema paper’. Personal correspondence with H. Leiulfsrud. Dept. of Sociology, University of Wisconsin-Madison (April 17, 2005).
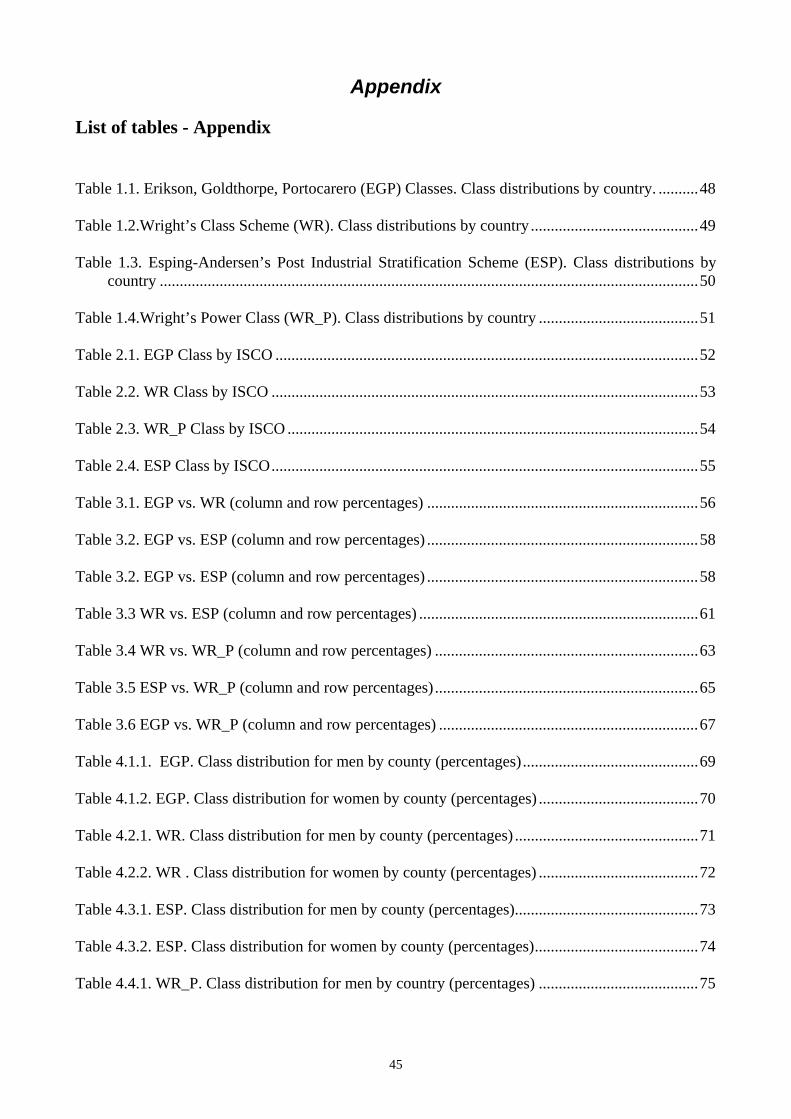
45
Appendix List of tables - Appendix
Table 1.1. Erikson, Goldthorpe, Portocarero (EGP) Classes. Class distributions by country. ..........48
Table 1.2.Wright’s Class Scheme (WR). Class distributions by country ..........................................49
Table 1.3. Esping-Andersen’s Post Industrial Stratification Scheme (ESP). Class distributions by country .......................................................................................................................................50
Table 1.4.Wright’s Power Class (WR_P). Class distributions by country ........................................51
Table 2.1. EGP Class by ISCO ..........................................................................................................52
Table 2.2. WR Class by ISCO ...........................................................................................................53
Table 2.3. WR_P Class by ISCO .......................................................................................................54
Table 2.4. ESP Class by ISCO...........................................................................................................55
Table 3.1. EGP vs. WR (column and row percentages) ....................................................................56
Table 3.2. EGP vs. ESP (column and row percentages) ....................................................................58
Table 3.2. EGP vs. ESP (column and row percentages) ....................................................................58
Table 3.3 WR vs. ESP (column and row percentages) ......................................................................61
Table 3.4 WR vs. WR_P (column and row percentages) ..................................................................63
Table 3.5 ESP vs. WR_P (column and row percentages)..................................................................65
Table 3.6 EGP vs. WR_P (column and row percentages) .................................................................67
Table 4.1.1. EGP. Class distribution for men by county (percentages)............................................69
Table 4.1.2. EGP. Class distribution for women by county (percentages) ........................................70
Table 4.2.1. WR. Class distribution for men by county (percentages) ..............................................71
Table 4.2.2. WR . Class distribution for women by county (percentages) ........................................72
Table 4.3.1. ESP. Class distribution for men by county (percentages)..............................................73
Table 4.3.2. ESP. Class distribution for women by county (percentages).........................................74
Table 4.4.1. WR_P. Class distribution for men by country (percentages) ........................................75

46
Table 4.4.2. WR _P. Class distribution for women by country (percentages)...................................76
Table 5.1-3. Alternative class models and economic indicators (means)..........................................77
Table 5.4. Wright’s power model and economic indicators (means) ................................................80
Table 5.5 EGP and household income...............................................................................................81
Table 5.6 Wright (WR_DM) and household income.........................................................................82
Table 5.7. Wright power model (WR_P) and household income......................................................83
Table 5.8. Esping Andersen’s class model (ESP) and household income.........................................84
Table 6.1-3. Alternative class models and unemployment experiences ............................................85
Table 6.4. Wright’s power based class scheme and unemployment experiences..............................86
Table 7.1-3. Alternative class models and political capital. Interest in politics, understanding of politics (percentages) and political activity (mean) ...................................................................87
Table 7.4. Wright’s power based class scheme and political capital. Interest in politics, understanding of politics (percentages) and political activity (mean) .......................................89
Table 8.1-3. Alternative class models and subjective health indicators (means) ..............................90
Table 8.4. Alternative class models and subjective health indicators (means)..................................91
Table 9.1. Ganzeboom’s EGP Classes versus ours. Distributions based on 21 ESS countries 2002/3 (weighted) ..................................................................................................................................92
Table 9.2. EGP Trento by EGP Ganzeboom original. European Social Survey 2002/3 . 21 countries (weighted) ..................................................................................................................................93
Table 9.3 EGP classes in 11 countries 1960-2002 (aggregated data for men). Data from Breen & Luijks (1960-1990’s) and ESS (2002/3, minus France) ............................................................94
Table 9.3.1 EGP and Wright classes in 10 countries in 2002. Aggregated data. Percentage male workers.......................................................................................................................................94
Table 9.4 EGP classes in 10 European countries. Frequencies based on our program and Ganzeboom’s EGP program. ESS Total ...................................................................................95
Table 10.1. Alternative versions of Wright’s class models. Data from the Norwegian class project 1995/6 and ESS 2002 (weights not included). Economically active. ........................................97
Table 10.2 Work autonomy in Norway 1995/6. Data from Norwegian Class Project ......................98
Table 10.3 Work autonomy in Norway 2002. Data from European Social Survey .........................99

47
Table 10.4: The class structure in Sweden, Norway, Finland and Denmark in the 1980’s and 1990’s. Economically active 18-65 years. Wright Project Data...........................................................100
Table 10.5: The class structure in the USA, United Kingdom and Germany in the 1980’s and 1990’s. Economically active 18-65 years. Wright Project Data ..............................................100
Table 10.6: The class structure in Sweden, Norway, Finland, United Kingdom 2002. Economically active 18-65 years. ESS Data...................................................................................................101
Table 11. Response rate to the ESS question on household income in different countries .............102
Table 12a. Equivalent family income (dependent variable). Controlled for sex, country and EGP class (independent variables). ESS 2002/3. Anova Regression..............................................103
Table 12b. Equivalent family income (dep var). Controlled for sex, country and Wright’s exploitation model (independent variables). ESS 2002/3. Anova Regression ........................104
Table 12c. Equivalent family income (dep var). Controlled for sex, country and class – Wrigh’s power model (indep, var). ESS 2002/3. Anova Regression ....................................................105
Table 12d. Equivalent family income (dependent variable). Controlled for sex, country and Esping Andersen’s class scheme (independent variable.). ESS 2002/3. Anova Regression ...............106

48
Appendix I – General tables (1.1-8.4)
Table 1.1. Erikson, Goldthorpe, Portocarero (EGP) Classes. Class distributions by country. I
Prof. Adm. High
II Prof. Adm. Low
IIIa Routine
non-manual
IIIb Lower sales
service
IVa Self-
empl w/ empl
IVb Self-
empl no empl.
V Manual
supervisors
VI Skilled workers
VIIa Unskill-
ed workers
VIIb Farm
labours
IVc Self-empl
farmers
Sum N*
Austria 11.6 19.3 22.0 16.5 3.3 2.2 3.9 8.3 8.0 .6 4.4 100.0 363 Belgium 15.7 23.3 5.0 14.7 3.3 3.6 4.5 14.5 13.3 .5 1.7 100.0 421 Switzerland 17.8 21.5 16.5 13.4 3.1 3.7 4.7 8.9 5.8 1.0 3.4 100.0 381 Czech Republic 7.9 19.6 13.8 7.4 3.2 6.0 4.7 17.4 16.2 3.0 .9 100.0 470 Germany 10.8 22.1 19.4 10.2 3.3 3.1 4.3 13.3 11.8 .6 1.0 100.0 3621 Denmark 14.1 22.7 11.6 14.4 2.5 1.8 4.0 12.3 13.7 1.1 1.8 100.0 277 Spain 8.2 19.4 4.3 12.4 4.7 5.8 2.7 13.6 21.3 4.9 2.9 100.0 1408 Finland 14.2 22.2 7.1 12.4 3.1 2.7 1.8 14.7 14.2 1.8 5.8 100.0 225 United Kingdom
19.6 17.9 12.7 17.2 1.8 4.4 3.8 8.8 12.1 1.0 .7 100.0 2771
Greece 8.1 11.1 6.7 10.8 8.1 12.7 1.3 11.9 12.1 1.1 16.2 100.0 371 Hungary 11.9 16.8 8.0 8.8 6.0 6.0 3.1 15.6 18.8 3.1 2.0 100.0 352 Ireland 16.7 16.7 7.7 16.7 5.4 4.2 4.2 8.3 11.3 1.2 7.7 100.0 168 Israel 23.5 28.4 11.5 9.9 4.1 2.9 3.3 6.6 8.6 .4 .8 100.0 243 Italy 7.9 17.1 12.4 9.0 12.7 6.5 3.4 9.1 15.6 1.3 5.1 100.0 2384 Luxembourg 16.7 22.2 11.1 11.1 5.6 .0 5.6 11.1 16.7 .0 .0 100.0 18 Netherlands 17.7 29.7 13.0 11.5 4.2 .9 4.6 7.1 9.2 .9 1.1 100.0 784 Norway (stand) 15.0 24.8 11.7 19.9 5.8 11.7 10.2 1.0 100.0 206 Norway (revised)
13.3 21.9 10.3 17.6 3.9 7.7 5.2 10.3 9.0 0.9 -- 100.0 233
Poland 10.6 17.6 9.1 5.8 3.9 5.0 3.5 14.3 16.1 1.1 13.1 100.0 1333 Portugal 8.6 10.7 11.6 7.3 7.3 7.7 2.7 17.7 20.9 1.4 4.1 100.0 440 Sweden 15.2 27.7 9.2 17.2 2.5 2.7 2.9 10.1 10.3 .7 1.6 100.0 447 Slovenia 15.6 19.5 14.3 7.8 5.2 1.3 6.5 15.6 11.7 1.3 1.3 100.0 77 Total 12.6 19.9 12.7 11.7 4.8 4.5 3.7 11.6 13.7 1.4 3.4 100.0 16760 European Social Survey 2002-3. * Cases weighted nationally.
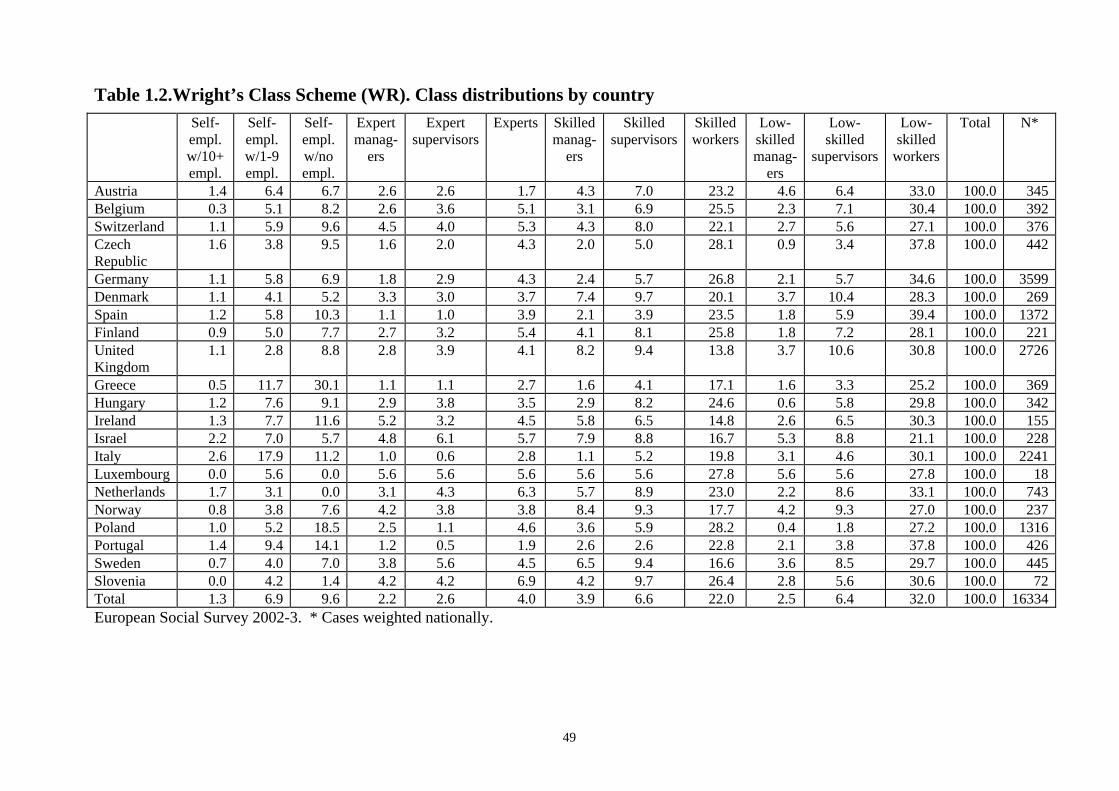
49
Table 1.2.Wright’s Class Scheme (WR). Class distributions by country Self-
empl. w/10+ empl.
Self- empl. w/1-9 empl.
Self- empl. w/no empl.
Expert manag-
ers
Expert supervisors
Experts Skilled manag-
ers
Skilled supervisors
Skilled workers
Low- skilled manag-
ers
Low- skilled
supervisors
Low- skilled
workers
Total N*
Austria 1.4 6.4 6.7 2.6 2.6 1.7 4.3 7.0 23.2 4.6 6.4 33.0 100.0 345 Belgium 0.3 5.1 8.2 2.6 3.6 5.1 3.1 6.9 25.5 2.3 7.1 30.4 100.0 392 Switzerland 1.1 5.9 9.6 4.5 4.0 5.3 4.3 8.0 22.1 2.7 5.6 27.1 100.0 376 Czech Republic
1.6 3.8 9.5 1.6 2.0 4.3 2.0 5.0 28.1 0.9 3.4 37.8 100.0 442
Germany 1.1 5.8 6.9 1.8 2.9 4.3 2.4 5.7 26.8 2.1 5.7 34.6 100.0 3599 Denmark 1.1 4.1 5.2 3.3 3.0 3.7 7.4 9.7 20.1 3.7 10.4 28.3 100.0 269 Spain 1.2 5.8 10.3 1.1 1.0 3.9 2.1 3.9 23.5 1.8 5.9 39.4 100.0 1372 Finland 0.9 5.0 7.7 2.7 3.2 5.4 4.1 8.1 25.8 1.8 7.2 28.1 100.0 221 United Kingdom
1.1 2.8 8.8 2.8 3.9 4.1 8.2 9.4 13.8 3.7 10.6 30.8 100.0 2726
Greece 0.5 11.7 30.1 1.1 1.1 2.7 1.6 4.1 17.1 1.6 3.3 25.2 100.0 369 Hungary 1.2 7.6 9.1 2.9 3.8 3.5 2.9 8.2 24.6 0.6 5.8 29.8 100.0 342 Ireland 1.3 7.7 11.6 5.2 3.2 4.5 5.8 6.5 14.8 2.6 6.5 30.3 100.0 155 Israel 2.2 7.0 5.7 4.8 6.1 5.7 7.9 8.8 16.7 5.3 8.8 21.1 100.0 228 Italy 2.6 17.9 11.2 1.0 0.6 2.8 1.1 5.2 19.8 3.1 4.6 30.1 100.0 2241 Luxembourg 0.0 5.6 0.0 5.6 5.6 5.6 5.6 5.6 27.8 5.6 5.6 27.8 100.0 18 Netherlands 1.7 3.1 0.0 3.1 4.3 6.3 5.7 8.9 23.0 2.2 8.6 33.1 100.0 743 Norway 0.8 3.8 7.6 4.2 3.8 3.8 8.4 9.3 17.7 4.2 9.3 27.0 100.0 237 Poland 1.0 5.2 18.5 2.5 1.1 4.6 3.6 5.9 28.2 0.4 1.8 27.2 100.0 1316 Portugal 1.4 9.4 14.1 1.2 0.5 1.9 2.6 2.6 22.8 2.1 3.8 37.8 100.0 426 Sweden 0.7 4.0 7.0 3.8 5.6 4.5 6.5 9.4 16.6 3.6 8.5 29.7 100.0 445 Slovenia 0.0 4.2 1.4 4.2 4.2 6.9 4.2 9.7 26.4 2.8 5.6 30.6 100.0 72 Total 1.3 6.9 9.6 2.2 2.6 4.0 3.9 6.6 22.0 2.5 6.4 32.0 100.0 16334 European Social Survey 2002-3. * Cases weighted nationally.
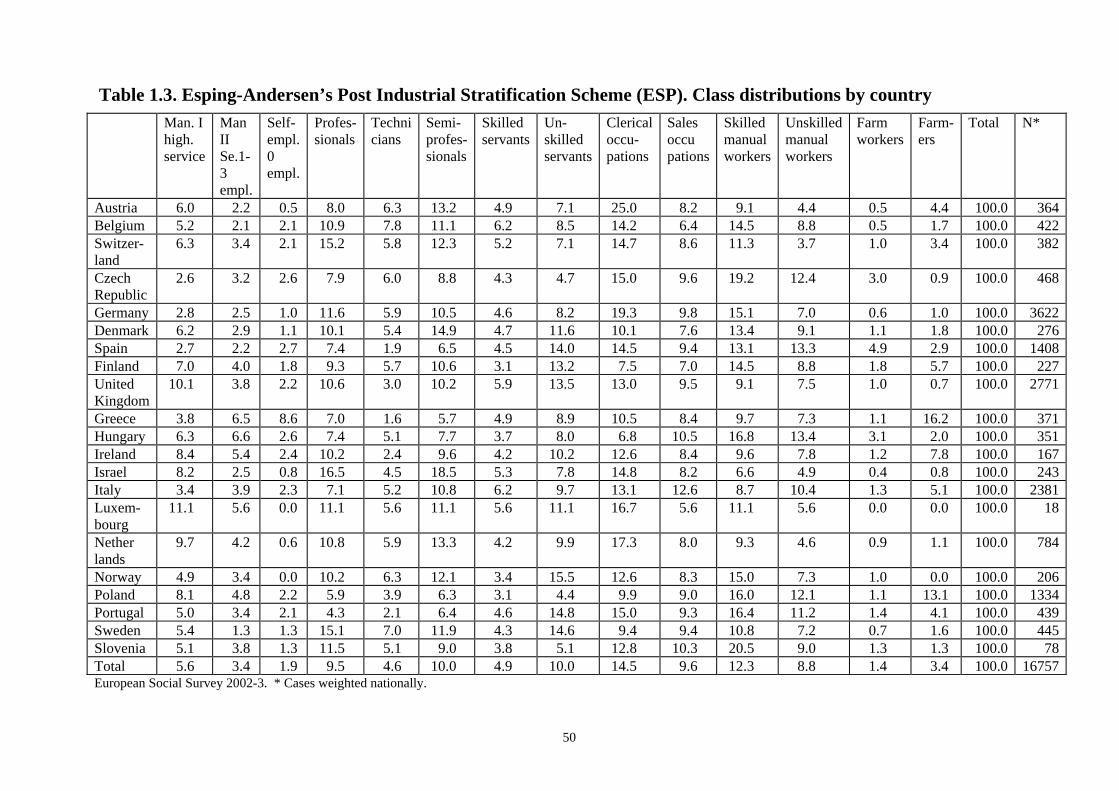
50
Table 1.3. Esping-Andersen’s Post Industrial Stratification Scheme (ESP). Class distributions by country Man. I
high. service
Man II Se.1-3 empl.
Self-empl. 0 empl.
Profes-sionals
Techni cians
Semi-profes-sionals
Skilled servants
Un-skilled servants
Clerical occu-pations
Sales occu pations
Skilled manual workers
Unskilled manual workers
Farm workers
Farm-ers
Total N*
Austria 6.0 2.2 0.5 8.0 6.3 13.2 4.9 7.1 25.0 8.2 9.1 4.4 0.5 4.4 100.0 364 Belgium 5.2 2.1 2.1 10.9 7.8 11.1 6.2 8.5 14.2 6.4 14.5 8.8 0.5 1.7 100.0 422 Switzer-land
6.3 3.4 2.1 15.2 5.8 12.3 5.2 7.1 14.7 8.6 11.3 3.7 1.0 3.4 100.0 382
Czech Republic
2.6 3.2 2.6 7.9 6.0 8.8 4.3 4.7 15.0 9.6 19.2 12.4 3.0 0.9 100.0 468
Germany 2.8 2.5 1.0 11.6 5.9 10.5 4.6 8.2 19.3 9.8 15.1 7.0 0.6 1.0 100.0 3622 Denmark 6.2 2.9 1.1 10.1 5.4 14.9 4.7 11.6 10.1 7.6 13.4 9.1 1.1 1.8 100.0 276 Spain 2.7 2.2 2.7 7.4 1.9 6.5 4.5 14.0 14.5 9.4 13.1 13.3 4.9 2.9 100.0 1408 Finland 7.0 4.0 1.8 9.3 5.7 10.6 3.1 13.2 7.5 7.0 14.5 8.8 1.8 5.7 100.0 227 United Kingdom
10.1 3.8 2.2 10.6 3.0 10.2 5.9 13.5 13.0 9.5 9.1 7.5 1.0 0.7 100.0 2771
Greece 3.8 6.5 8.6 7.0 1.6 5.7 4.9 8.9 10.5 8.4 9.7 7.3 1.1 16.2 100.0 371 Hungary 6.3 6.6 2.6 7.4 5.1 7.7 3.7 8.0 6.8 10.5 16.8 13.4 3.1 2.0 100.0 351 Ireland 8.4 5.4 2.4 10.2 2.4 9.6 4.2 10.2 12.6 8.4 9.6 7.8 1.2 7.8 100.0 167 Israel 8.2 2.5 0.8 16.5 4.5 18.5 5.3 7.8 14.8 8.2 6.6 4.9 0.4 0.8 100.0 243 Italy 3.4 3.9 2.3 7.1 5.2 10.8 6.2 9.7 13.1 12.6 8.7 10.4 1.3 5.1 100.0 2381 Luxem-bourg
11.1 5.6 0.0 11.1 5.6 11.1 5.6 11.1 16.7 5.6 11.1 5.6 0.0 0.0 100.0 18
Nether lands
9.7 4.2 0.6 10.8 5.9 13.3 4.2 9.9 17.3 8.0 9.3 4.6 0.9 1.1 100.0 784
Norway 4.9 3.4 0.0 10.2 6.3 12.1 3.4 15.5 12.6 8.3 15.0 7.3 1.0 0.0 100.0 206 Poland 8.1 4.8 2.2 5.9 3.9 6.3 3.1 4.4 9.9 9.0 16.0 12.1 1.1 13.1 100.0 1334 Portugal 5.0 3.4 2.1 4.3 2.1 6.4 4.6 14.8 15.0 9.3 16.4 11.2 1.4 4.1 100.0 439 Sweden 5.4 1.3 1.3 15.1 7.0 11.9 4.3 14.6 9.4 9.4 10.8 7.2 0.7 1.6 100.0 445 Slovenia 5.1 3.8 1.3 11.5 5.1 9.0 3.8 5.1 12.8 10.3 20.5 9.0 1.3 1.3 100.0 78 Total 5.6 3.4 1.9 9.5 4.6 10.0 4.9 10.0 14.5 9.6 12.3 8.8 1.4 3.4 100.0 16757 European Social Survey 2002-3. * Cases weighted nationally.
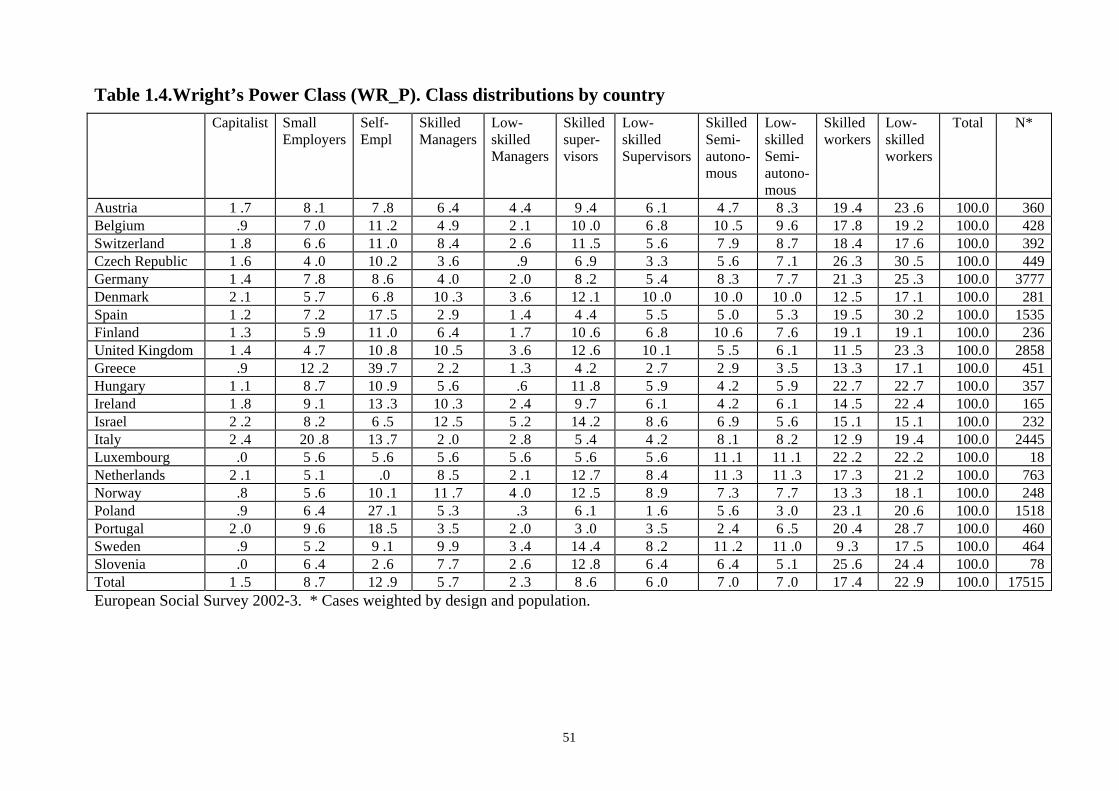
51
Table 1.4.Wright’s Power Class (WR_P). Class distributions by country Capitalist Small
EmployersSelf- Empl
Skilled Managers
Low- skilled Managers
Skilled super-visors
Low- skilled Supervisors
Skilled Semi- autono-mous
Low- skilled Semi- autono-mous
Skilled workers
Low- skilled workers
Total N*
Austria 1 .7 8 .1 7 .8 6 .4 4 .4 9 .4 6 .1 4 .7 8 .3 19 .4 23 .6 100.0 360 Belgium .9 7 .0 11 .2 4 .9 2 .1 10 .0 6 .8 10 .5 9 .6 17 .8 19 .2 100.0 428 Switzerland 1 .8 6 .6 11 .0 8 .4 2 .6 11 .5 5 .6 7 .9 8 .7 18 .4 17 .6 100.0 392 Czech Republic 1 .6 4 .0 10 .2 3 .6 .9 6 .9 3 .3 5 .6 7 .1 26 .3 30 .5 100.0 449 Germany 1 .4 7 .8 8 .6 4 .0 2 .0 8 .2 5 .4 8 .3 7 .7 21 .3 25 .3 100.0 3777 Denmark 2 .1 5 .7 6 .8 10 .3 3 .6 12 .1 10 .0 10 .0 10 .0 12 .5 17 .1 100.0 281 Spain 1 .2 7 .2 17 .5 2 .9 1 .4 4 .4 5 .5 5 .0 5 .3 19 .5 30 .2 100.0 1535 Finland 1 .3 5 .9 11 .0 6 .4 1 .7 10 .6 6 .8 10 .6 7 .6 19 .1 19 .1 100.0 236 United Kingdom 1 .4 4 .7 10 .8 10 .5 3 .6 12 .6 10 .1 5 .5 6 .1 11 .5 23 .3 100.0 2858 Greece .9 12 .2 39 .7 2 .2 1 .3 4 .2 2 .7 2 .9 3 .5 13 .3 17 .1 100.0 451 Hungary 1 .1 8 .7 10 .9 5 .6 .6 11 .8 5 .9 4 .2 5 .9 22 .7 22 .7 100.0 357 Ireland 1 .8 9 .1 13 .3 10 .3 2 .4 9 .7 6 .1 4 .2 6 .1 14 .5 22 .4 100.0 165 Israel 2 .2 8 .2 6 .5 12 .5 5 .2 14 .2 8 .6 6 .9 5 .6 15 .1 15 .1 100.0 232 Italy 2 .4 20 .8 13 .7 2 .0 2 .8 5 .4 4 .2 8 .1 8 .2 12 .9 19 .4 100.0 2445 Luxembourg .0 5 .6 5 .6 5 .6 5 .6 5 .6 5 .6 11 .1 11 .1 22 .2 22 .2 100.0 18 Netherlands 2 .1 5 .1 .0 8 .5 2 .1 12 .7 8 .4 11 .3 11 .3 17 .3 21 .2 100.0 763 Norway .8 5 .6 10 .1 11 .7 4 .0 12 .5 8 .9 7 .3 7 .7 13 .3 18 .1 100.0 248 Poland .9 6 .4 27 .1 5 .3 .3 6 .1 1 .6 5 .6 3 .0 23 .1 20 .6 100.0 1518 Portugal 2 .0 9 .6 18 .5 3 .5 2 .0 3 .0 3 .5 2 .4 6 .5 20 .4 28 .7 100.0 460 Sweden .9 5 .2 9 .1 9 .9 3 .4 14 .4 8 .2 11 .2 11 .0 9 .3 17 .5 100.0 464 Slovenia .0 6 .4 2 .6 7 .7 2 .6 12 .8 6 .4 6 .4 5 .1 25 .6 24 .4 100.0 78 Total 1 .5 8 .7 12 .9 5 .7 2 .3 8 .6 6 .0 7 .0 7 .0 17 .4 22 .9 100.0 17515 European Social Survey 2002-3. * Cases weighted by design and population.

52
Table 2.1. EGP Class by ISCO I
Prof. Adm. High
II Prof. Adm. Low
IIIa Routine non-manual
IIIb Lower sales service
IVa Self-empl with empl
IVb Self-empl no empl
V Manual supervisors
VI Skilled workers
VIIa Unskill-ed workers
VIIb Farm labours
IVc Self-empl farmers
N*
1 Legislators Senior officials, Managers
1090 326 0 0 369 134 0 0 0 8 26 1953
2 Professionals 1710 1802 0 0 0 0 0 0 0 0 0 3512 3 Technicians and Associate professionals
204 2305 1029 0 99 121 0 0 0 0 0 3758
4 Clerks 6 80 1377 719 50 34 0 15 67 0 0 2348 5 Service - Shop and Sale workers
6 37 0 1941 138 214 159 323 64 0 0 2882
6 Skilled agr. and fishery workers
5 0 0 0 0 0 0 0 0 159 644 808
7 Craft workers 14 0 0 0 162 210 590 1469 223 0 0 2668 8 Plant/machine operators & assemblers
5 0 0 0 26 59 60 399 984 20 1 1554
9 Elementary occupations
1 1 59 0 6 29 0 176 1232 71 28 1603
Total 3041 4551 2465 2660 850 801 809 2382 2570 258 699 21086 European Social Survey 2002-3. * Cases weighted nationally.
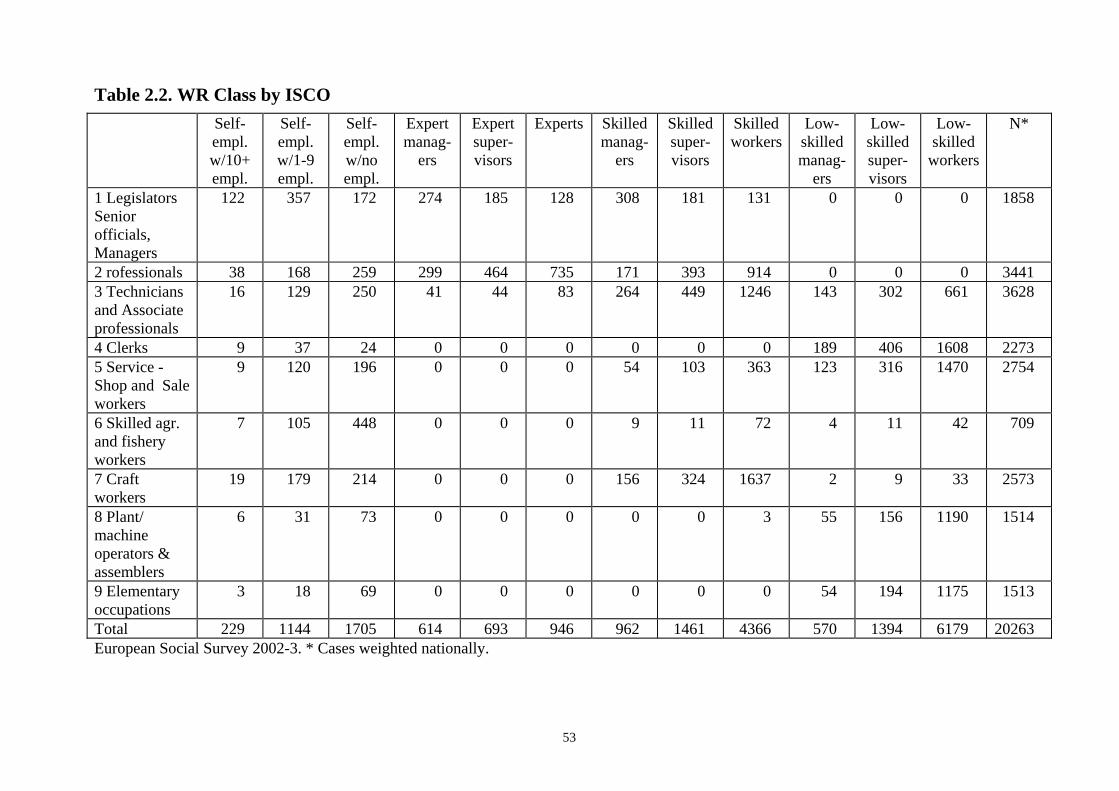
53
Table 2.2. WR Class by ISCO Self-
empl. w/10+ empl.
Self- empl. w/1-9 empl.
Self- empl. w/no empl.
Expert manag-
ers
Expert super-visors
Experts Skilled manag-
ers
Skilled super-visors
Skilled workers
Low- skilled manag-
ers
Low- skilled super-visors
Low- skilled
workers
N*
1 Legislators Senior officials, Managers
122 357 172 274 185 128 308 181 131 0 0 0 1858
2 rofessionals 38 168 259 299 464 735 171 393 914 0 0 0 3441 3 Technicians and Associate professionals
16 129 250 41 44 83 264 449 1246 143 302 661 3628
4 Clerks 9 37 24 0 0 0 0 0 0 189 406 1608 2273 5 Service - Shop and Sale workers
9 120 196 0 0 0 54 103 363 123 316 1470 2754
6 Skilled agr. and fishery workers
7 105 448 0 0 0 9 11 72 4 11 42 709
7 Craft workers
19 179 214 0 0 0 156 324 1637 2 9 33 2573
8 Plant/ machine operators & assemblers
6 31 73 0 0 0 0 0 3 55 156 1190 1514
9 Elementary occupations
3 18 69 0 0 0 0 0 0 54 194 1175 1513
Total 229 1144 1705 614 693 946 962 1461 4366 570 1394 6179 20263 European Social Survey 2002-3. * Cases weighted nationally.

54
Table 2.3. WR_P Class by ISCO Capitalist Small
Employ-ers
Self- Empl
Skilled Managers
Low- skilled Managers
Skilled supervisors
Low- skilled Super-visors
Skilled Semi- autono-mous
Low- skilled Semi- autono-mous
Skilled workers
Low- skilled workers
N*
Legislators Senior officials, Managers
131 326 160 374 0 266 0 82 0 106 0 1445
Professionals 47 189 256 275 0 535 0 485 2 644 0 2433 Technicians and Associate professionals
21 186 323 201 86 375 213 346 227 757 326 3061
Clerks 5 50 39 0 145 0 336 0 396 0 916 1887 Service - Shop and Sale workers
18 269 287 32 68 81 215 79 233 254 949 2485
Skilled agr. and fishery workers
6 161 631 9 2 7 3 13 2 78 22 934
Craft workers 20 212 288 98 0 202 7 217 5 1181 34 2264 Plant/machine operators & assemblers
10 52 94 0 41 0 126 0 147 2 862 1334
Elementary occupations
3 59 135 0 58 0 143 0 213 0 901 1512
Total 261 1504 2213 989 400 1466 1043 1222 1225 3022 4010 17355 European Social Survey 2002-3. * Cases weighted by design and population.
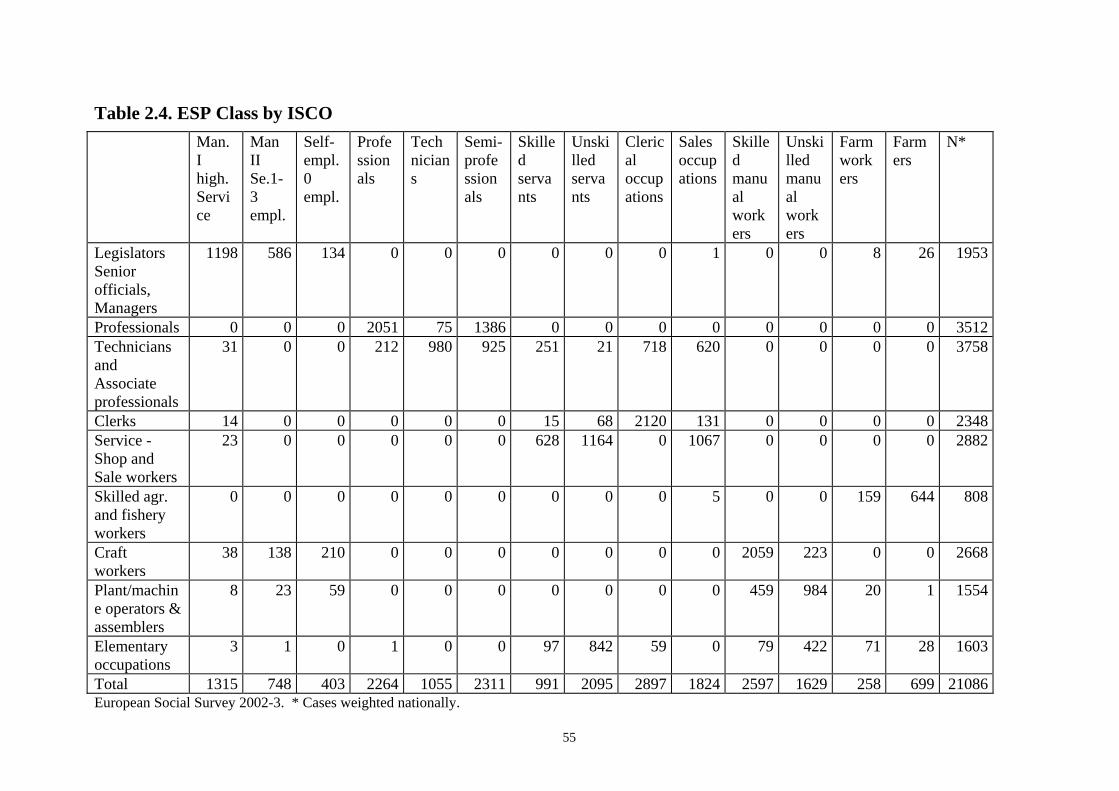
55
Table 2.4. ESP Class by ISCO Man.
I high. Service
Man II Se.1-3 empl.
Self-empl. 0 empl.
Professionals
Technicians
Semi-professionals
Skilled servants
Unskilled servants
Clerical occupations
Sales occupations
Skilled manual workers
Unskilled manual workers
Farm workers
Farmers
N*
Legislators Senior officials, Managers
1198 586 134 0 0 0 0 0 0 1 0 0 8 26 1953
Professionals 0 0 0 2051 75 1386 0 0 0 0 0 0 0 0 3512 Technicians and Associate professionals
31 0 0 212 980 925 251 21 718 620 0 0 0 0 3758
Clerks 14 0 0 0 0 0 15 68 2120 131 0 0 0 0 2348 Service - Shop and Sale workers
23 0 0 0 0 0 628 1164 0 1067 0 0 0 0 2882
Skilled agr. and fishery workers
0 0 0 0 0 0 0 0 0 5 0 0 159 644 808
Craft workers
38 138 210 0 0 0 0 0 0 0 2059 223 0 0 2668
Plant/machine operators & assemblers
8 23 59 0 0 0 0 0 0 0 459 984 20 1 1554
Elementary occupations
3 1 0 1 0 0 97 842 59 0 79 422 71 28 1603
Total 1315 748 403 2264 1055 2311 991 2095 2897 1824 2597 1629 258 699 21086 European Social Survey 2002-3. * Cases weighted nationally.
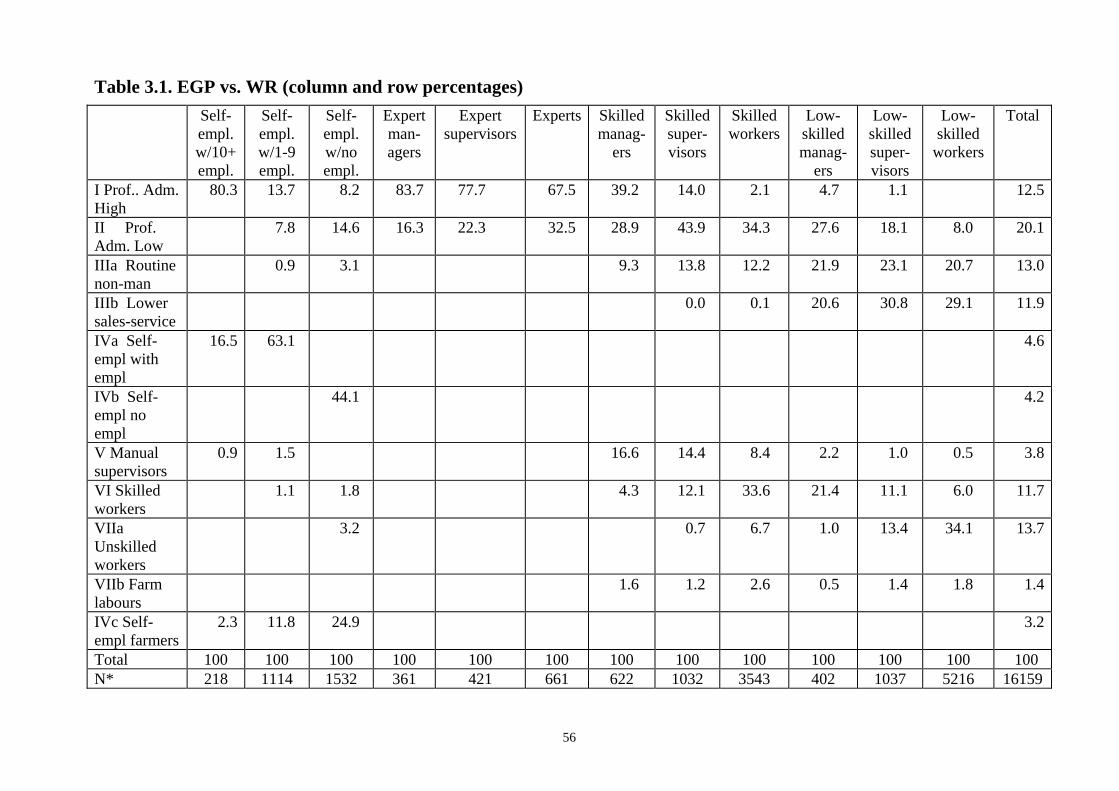
56
Table 3.1. EGP vs. WR (column and row percentages) Self-
empl. w/10+ empl.
Self- empl. w/1-9 empl.
Self- empl. w/no empl.
Expert man-agers
Expert supervisors
Experts Skilled manag-
ers
Skilled super-visors
Skilled workers
Low- skilled manag-
ers
Low- skilled super-visors
Low- skilled
workers
Total
I Prof.. Adm. High
80.3 13.7 8.2 83.7 77.7 67.5 39.2 14.0 2.1 4.7 1.1 12.5
II Prof. Adm. Low
7.8 14.6 16.3 22.3 32.5 28.9 43.9 34.3 27.6 18.1 8.0 20.1
IIIa Routine non-man
0.9 3.1 9.3 13.8 12.2 21.9 23.1 20.7 13.0
IIIb Lower sales-service
0.0 0.1 20.6 30.8 29.1 11.9
IVa Self-empl with empl
16.5 63.1 4.6
IVb Self-empl no empl
44.1 4.2
V Manual supervisors
0.9 1.5 16.6 14.4 8.4 2.2 1.0 0.5 3.8
VI Skilled workers
1.1 1.8 4.3 12.1 33.6 21.4 11.1 6.0 11.7
VIIa Unskilled workers
3.2 0.7 6.7 1.0 13.4 34.1 13.7
VIIb Farm labours
1.6 1.2 2.6 0.5 1.4 1.8 1.4
IVc Self-empl farmers
2.3 11.8 24.9 3.2
Total 100 100 100 100 100 100 100 100 100 100 100 100 100 N* 218 1114 1532 361 421 661 622 1032 3543 402 1037 5216 16159
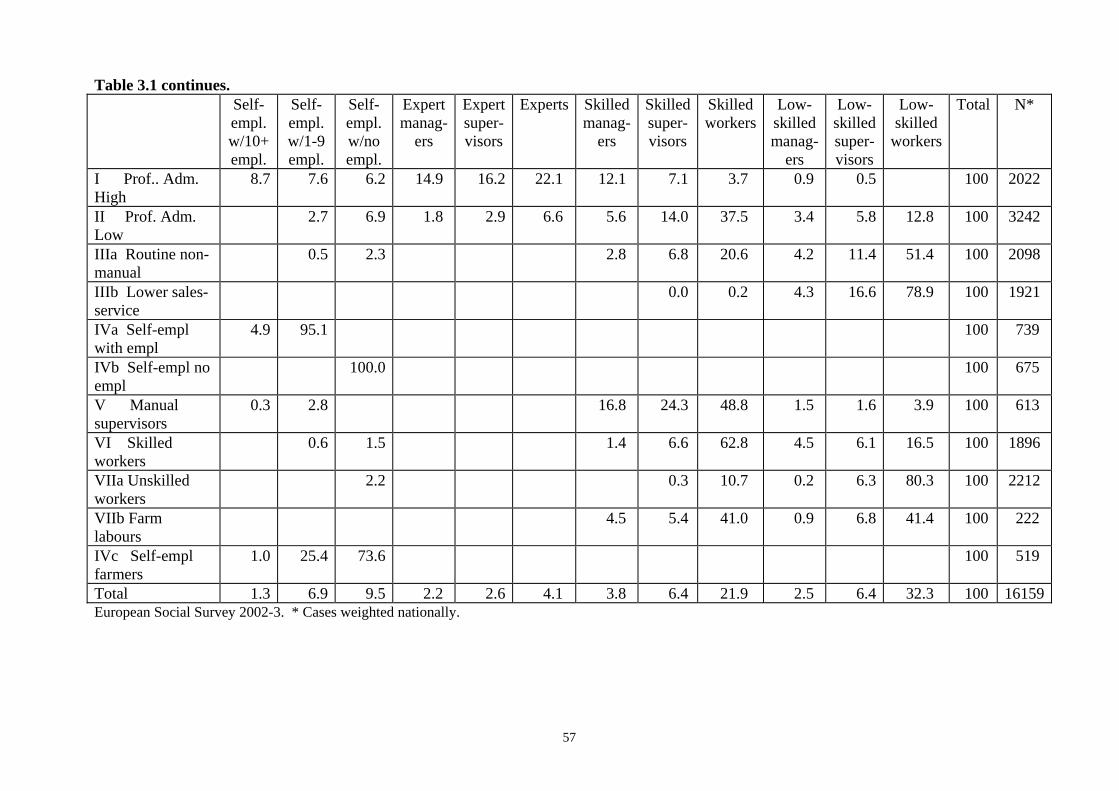
57
Table 3.1 continues. Self-
empl. w/10+ empl.
Self- empl. w/1-9 empl.
Self- empl. w/no empl.
Expert manag-
ers
Expert super-visors
Experts Skilled manag-
ers
Skilled super-visors
Skilled workers
Low- skilled manag-
ers
Low- skilled super-visors
Low- skilled
workers
Total N*
I Prof.. Adm. High
8.7 7.6 6.2 14.9 16.2 22.1 12.1 7.1 3.7 0.9 0.5 100 2022
II Prof. Adm. Low
2.7 6.9 1.8 2.9 6.6 5.6 14.0 37.5 3.4 5.8 12.8 100 3242
IIIa Routine non-manual
0.5 2.3 2.8 6.8 20.6 4.2 11.4 51.4 100 2098
IIIb Lower sales-service
0.0 0.2 4.3 16.6 78.9 100 1921
IVa Self-empl with empl
4.9 95.1 100 739
IVb Self-empl no empl
100.0 100 675
V Manual supervisors
0.3 2.8 16.8 24.3 48.8 1.5 1.6 3.9 100 613
VI Skilled workers
0.6 1.5 1.4 6.6 62.8 4.5 6.1 16.5 100 1896
VIIa Unskilled workers
2.2 0.3 10.7 0.2 6.3 80.3 100 2212
VIIb Farm labours
4.5 5.4 41.0 0.9 6.8 41.4 100 222
IVc Self-empl farmers
1.0 25.4 73.6 100 519
Total 1.3 6.9 9.5 2.2 2.6 4.1 3.8 6.4 21.9 2.5 6.4 32.3 100 16159 European Social Survey 2002-3. * Cases weighted nationally.

58
Table 3.2. EGP vs. ESP (column and row percentages) Man. I
high. service
Man II Se.1-3 empl.
Self- empl.
0 empl.
Prof-essionals
Techn-icians
Semi-pro-
fession-als
Skilled servants
Un-skilled serv-ants
Cler-ical
occupations
Sales occupations
Skilled manual workers
Un-skilled manual workers
Farm wor-kers
Far-mers
Total
I Prof. Adm. High
78.9 9.6 69.7 6.9 4.5 2.1 0.2 0.9 2.0 12.6
II Prof. Adm. Low
42.9 26.9 93.1 55.1 22.0 1.6 19.8 20.1 19.9
IIIa Routine non-manual
40.3 58.9 1.4 12.7
IIIb Lower sales-service
4.8 41.2 16.5 51.3 11.7
IVa Self-empl with empl
21.1 47.5 1.9 0.1 5.6 1.9 1.9 11.4 4.8
IVb Self-empl no empl
100.0 1.5 5.1 5.6 1.8 13.8 4.5
V Manual supervisors
18.1 22.9 3.7
VI Skilled workers
42.3 77.1 11.6
VIIa Unskilled workers
49.5 100.0 13.7
VIIb Farm labours
100.0 1.4
IVc Self-empl farmers
100.0 3.4
Total 100 100 100 100 100 100 100 100 100 100 100 100 100 100 100 N* 933 571 322 1597 778 1673 821 1673 2436 1618 2068 1466 236 566 16758

59
Table 3.2 continues. Man. I
high. service
Man II Se.1-3 empl.
Self-empl.
0 empl.
Prof-essi-onals
Techn-icians
Semi-profes-sionals
Skilled ser-
vants
Un-skill-
ed serv-ants
Cleri-cal
occu-pations
Sales occu-
pations
Skill-ed
man. work-ers
Un-skilled man. wor-kers
Farm wor-kers
Farm-ers
Total N*
I Prof.. Adm. High
34.9 2.6 52.8 2.6 3.6 0.8 0.1 1.1 1.5 100 2108
II Prof. Adm. Low
7.3 12.9 21.7 27.6 5.4 0.8 14.5 9.8 100 3338
IIIa Routine non-manual
31.6 67.3 1.1 100 2134
IIIb Lower sales-service
2.0 35.2 20.5 42.3 100 1960
IVa Self-empl with empl
24.4 33.5 3.7 0.1 5.7 4.0 5.8 22.8 100 808
IVb Self-empl no empl
42.9 3.2 5.6 12.5 6.0 29.7 100 750
V Manual supervisors
24.0 76.0 100 622
VI Skilled workers
17.9 82.1 100 1942
VIIa Un- skilled workers
36.1 63.9 100 2294
VIIb Farm labours
100.0 100 236
IVc Self- empl. farmers
100.0 100 566
Total 5.6 3.4 1.9 9.5 4.6 10.0 4.9 10.0 14.5 9.7 12.3 8.7 1.4 3.4 100 16758
European Social Survey 2002-3. * Cases weighted nationally.

60
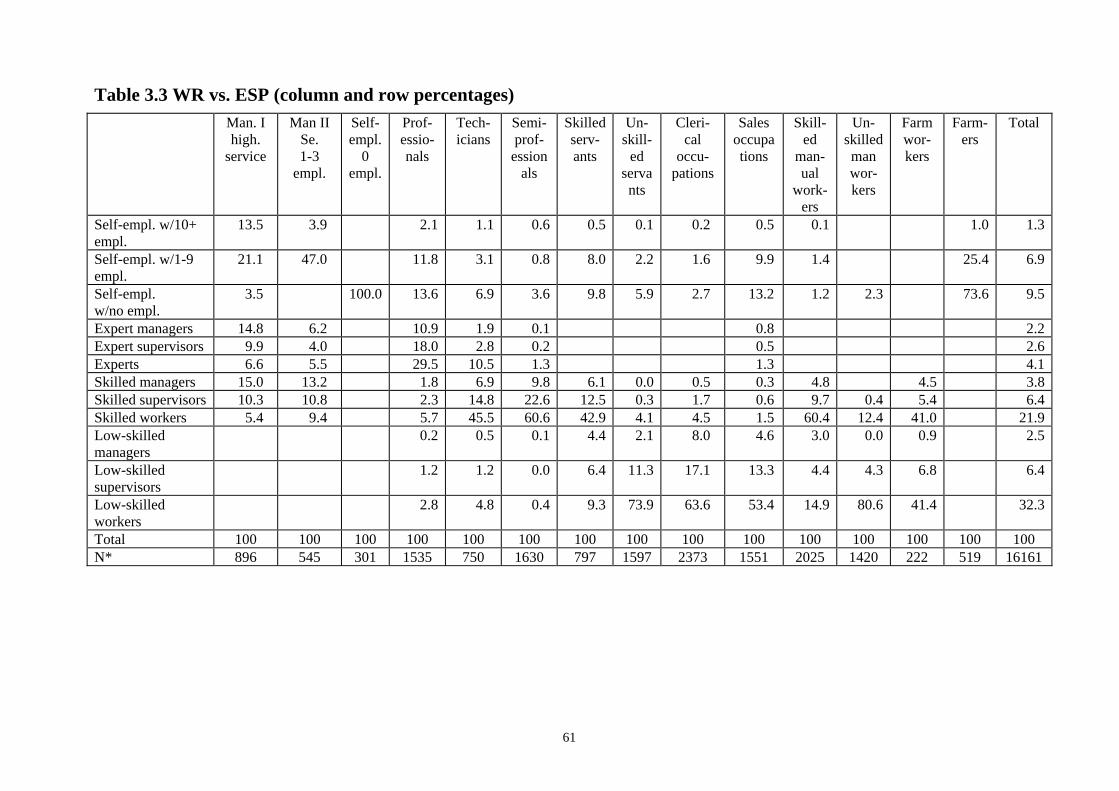
61
Table 3.3 WR vs. ESP (column and row percentages) Man. I
high. service
Man II Se. 1-3
empl.
Self-empl.
0 empl.
Prof-essio-nals
Tech-icians
Semi-prof-
essionals
Skilled serv-ants
Un-skill-
ed servants
Cleri-cal
occu-pations
Sales occupations
Skill-ed
man-ual
work-ers
Un-skilled man wor-kers
Farm wor-kers
Farm-ers
Total
Self-empl. w/10+ empl.
13.5 3.9 2.1 1.1 0.6 0.5 0.1 0.2 0.5 0.1 1.0 1.3
Self-empl. w/1-9 empl.
21.1 47.0 11.8 3.1 0.8 8.0 2.2 1.6 9.9 1.4 25.4 6.9
Self-empl. w/no empl.
3.5 100.0 13.6 6.9 3.6 9.8 5.9 2.7 13.2 1.2 2.3 73.6 9.5
Expert managers 14.8 6.2 10.9 1.9 0.1 0.8 2.2 Expert supervisors 9.9 4.0 18.0 2.8 0.2 0.5 2.6 Experts 6.6 5.5 29.5 10.5 1.3 1.3 4.1 Skilled managers 15.0 13.2 1.8 6.9 9.8 6.1 0.0 0.5 0.3 4.8 4.5 3.8 Skilled supervisors 10.3 10.8 2.3 14.8 22.6 12.5 0.3 1.7 0.6 9.7 0.4 5.4 6.4 Skilled workers 5.4 9.4 5.7 45.5 60.6 42.9 4.1 4.5 1.5 60.4 12.4 41.0 21.9 Low-skilled managers
0.2 0.5 0.1 4.4 2.1 8.0 4.6 3.0 0.0 0.9 2.5
Low-skilled supervisors
1.2 1.2 0.0 6.4 11.3 17.1 13.3 4.4 4.3 6.8 6.4
Low-skilled workers
2.8 4.8 0.4 9.3 73.9 63.6 53.4 14.9 80.6 41.4 32.3
Total 100 100 100 100 100 100 100 100 100 100 100 100 100 100 100 N* 896 545 301 1535 750 1630 797 1597 2373 1551 2025 1420 222 519 16161

62
Table 3.3 continues. Man I
high service
Man II Se.1-3 empl.
Self-empl.
0 empl.
Prof. Techn. Semi-prof.
Skilled ser-
vants
Un-skilled
ser-vants
Cleric-al
occup
Sales occup.
Skilled man.
workers
Uns-killed man.
workers
Farm wor-kers
Far-mers
Tot. N*
Self-empl. w/10+ empl.
55.5 9.6 15.1 3.7 4.6 1.8 0.9 2.3 3.2 0.9 2.3 100 218
Self-empl. w/1-9 empl.
17.0 23.0 16.2 2.1 1.2 5.7 3.1 3.5 13.8 2.5 11.8 100 1114
Self-empl. w/no empl.
2.0 19.6 13.6 3.4 3.8 5.1 6.2 4.2 13.4 1.6 2.2 24.9 100 1533
Expert managers
36.7 9.4 46.4 3.9 0.3 3.3 100 362
Expert supervisors
21.2 5.2 66.0 5.0 1.0 1.7 100 420
Experts 8.9 4.5 68.4 11.9 3.2 3.0 100 662 Skilled managers
21.6 11.6 4.5 8.4 25.8 7.9 0.0 1.9 0.8 15.8 1.6 100 620
Skilled supervisors
8.9 5.7 3.5 10.8 35.7 9.7 0.4 3.9 0.9 19.0 0.5 1.2 100 1032
Skilled workers
1.4 1.4 2.5 9.6 27.9 9.7 1.9 3.0 0.7 34.5 5.0 2.6 100 3542
Lowskilled managers
0.7 1.0 0.2 8.7 8.4 47.4 17.9 15.1 0.0 0.5 100 403
Low-skilled supervisors
1.7 0.9 0.0 4.9 17.4 39.1 19.9 8.7 5.9 1.4 100 1038
Low-skilled workers
0.8 0.7 0.1 1.4 22.6 28.9 15.9 5.8 21.9 1.8 100 5217
Total 5.5 3.4 1.9 9.5 4.6 10.1 4.9 9.9 14.7 9.6 12.5 8.8 1.4 3.2 100 16161 European Social Survey 2002-3. * Cases weighted nationally.

63
Table 3.4 WR vs. WR_P (column and row percentages)
Capitalist Small Empl-oyers
Self-Empl
Skilled Managers
Low- skilled Managers
Skilled super-visors
Low- skilled Super-visors
Skilled Semi- autono-mous
Low- skilled Semi- autonomous
Skilled workers
Low- skilled workers
Total
Self-empl. w/10+ empl. 100 .0 .0 .0 .0 .0 .0 .0 .0 .0 .0 .0 1 .5 Self-empl. w/1-9 empl. .0 100 .0 .0 .0 .0 .0 .0 .0 .0 .0 .0 8 .7 Self-empl. w/no empl. .0 .0 100
.0 .0 .0 .0 .0 .0 .0 .0 .0 13 .0
Expert managers .0 .0 .0 36 .1 .0 .0 .0 .0 .0 .0 .0 2 .1 Expert supervisors .0 .0 .0 .0 .0 28 .0 .0 .0 .0 .0 .0 2 .4 Experts .0 .0 .0 .0 .0 .0 .0 25 .1 .0 11 .7 .0 3 .8 Skilled managers .0 .0 .0 63 .9 .0 .0 .0 .0 .0 .0 .0 3 .7 Skilled supervisors .0 .0 .0 .0 .0 72 .0 .0 .0 .0 .0 .0 6 .2 Skilled workers .0 .0 .0 .0 .0 .0 .0 74 .9 .5 88 .3 .0 20 .6 Low-skilled managers .0 .0 .0 .0 100 .0 .0 .0 .0 .0 .0 .0 2 .3 Low-skilled supervisors .0 .0 .0 .0 .0 .0 100 .0 .0 .0 .0 .0 6 .0 Low-skilled workers .0 .0 .0 .0 .0 .0 .0 .0 99 .5 .0 100 .0 29 .9 Total 100 100 100 100 100 100 100 100 100 100 100 100 N* 266 1524 2269 1001 400 1501 1044 1227 1226 3043 4010 17511

64
Table 3.4 continues. Capitalist Small
EmployersSelf- Empl
Skilled Managers
Low- skilled Managers
Skilled super-visors
Low- skilled Super-visors
Skilled Semi- autono-mous
Low-skilled Semi- autono-mous
Skilled workers
Low- skilled workers
Total N*
Self-empl. w/10+ empl.
100 .0 .0 .0 .0 .0 .0 .0 .0 .0 .0 .0 100 266
Self-empl. w/1-9 empl.
.0 100 .0 .0 .0 .0 .0 .0 .0 .0 .0 .0 100 1524
Self-empl. w/no empl.
.0 .0 100.0 .0 .0 .0 .0 .0 .0 .0 .0 100 2269
Expert managers .0 .0 .0 100 .0 .0 .0 .0 .0 .0 .0 .0 100 361 Expert supervisors
.0 .0 .0 .0 .0 100 .0 .0 .0 .0 .0 .0 100 421
Experts .0 .0 .0 .0 .0 .0 .0 46 .3 .0 53 .7 .0 100 665 Skilled managers
.0 .0 .0 100 .0 .0 .0 .0 .0 .0 .0 .0 100 640
Skilled supervisors
.0 .0 .0 .0 .0 100 .0 .0 .0 .0 .0 .0 100 1080
Skilled workers .0 .0 .0 .0 .0 .0 .0 25 .5 .2 74 .4 .0 100 3611 Low-skilled managers
.0 .0 .0 .0 100 .0 .0 .0 .0 .0 .0 .0 100 400
Low-skilled supervisors
.0 .0 .0 .0 .0 .0 100 .0 .0 .0 .0 .0 100 1044
Low-skilled workers
.0 .0 .0 .0 .0 .0 .0 .0 23 .3 .0 76 .7 100 5230
Total 1 .5 8 .7 13 .0 5 .7 2 .3 8 .6 6 .0 7 .0 7 .0 17 .4 22 .9 100 17511 European Social Survey 2002-3. * Cases weighted by design and population.

65
Table 3.5 ESP vs. WR_P (column and row percentages) Capitalist Small
EmployersSelf- Empl
Skilled Managers
Low-- skilled Managers
Skilled super-visors
Low skilled Super-visors
Skilled Semi- autono-mous
Low- skilled Semiaut
Skilled workers
Low- skilled workers
Total
Manager I Hi.serv. 57,9 18,1 1,5 27,2 ,0 12,4 ,0 3,6 ,0 2,1 ,0 5,9 Man.II Self-empl.1-3 empl.
9,8 23,4 ,0 10,8 ,0 5,6 ,0 3,1 ,0 1,4 ,0 3,7
Self-empl. 0 empl. ,0 ,0 19,4 ,0 ,0 ,0 ,0 ,0 ,0 ,0 ,0 2,5 Professionals 13,9 13,7 11,7 20,0 ,8 21,5 1,7 20,3 1,7 9,9 ,6 9,4 Technicians 3,4 1,7 2,7 6,7 1,0 9,1 ,9 11,9 ,6 9,4 ,7 4,4 Semi-professionals 3,8 1,0 3,5 16,4 ,3 25,7 ,0 29,2 ,2 22,0 ,1 9,6 Skilled servants 1,5 5,0 4,4 5,0 8,8 6,9 4,9 7,4 1,1 8,4 1,5 4,8 Unskilled servants 1,1 3,0 5,1 ,0 8,5 ,3 17,5 1,0 24,4 1,9 22,0 9,4 Clerical occupations 2,3 2,9 3,6 1,2 46,9 2,7 39,3 3,5 40,1 2,2 25,5 13,8 Sales occupations 3,8 14,8 13,6 1,6 18,0 1,2 19,9 1,2 15,1 1,0 16,2 9,9 Skilled manual workers ,8 3,0 1,4 10,0 15,3 13,5 8,6 15,7 3,8 34,2 6,5 11,8 Unskilled manual workers
,0 ,0 2,1 ,0 ,0 ,3 5,9 2,2 12,4 5,0 24,8 8,3
Farm workers ,0 ,0 ,0 1,0 ,5 ,8 1,4 1,1 ,6 2,6 2,1 1,3 Farmers 1,9 13,3 30,8 ,0 ,0 ,0 ,0 ,0 ,0 ,0 ,0 5,1 Total 100 100 100 100 100 100 100 100 100 100 100 100 N* 266 1506 2213 981 399 1456 1042 1214 1226 3013 4010 17326

66
Table 3.5 continues. Capi-
talist Small Em-ployers
Self- Empl
Skilled Managers
Low- skilled Mana-gers
Skilled super-visors
Low- skilled Super-visors
Skilled Semi- autono-mous
Low- skilled Sem. aut
Skilled workers
Low- skilled workers
Total N*
Manager I Hi.serv.
15,1 26,8 3,3 26,3 ,0 17,8 ,0 4,3 ,0 6,3 ,0 100 1017
Man.II Self-empl.1-3 empl.
4,0 54,6 ,0 16,4 ,0 12,5 ,0 5,9 ,0 6,5 ,0 100 646
Self-empl. 0 empl.
,0 ,0 100,0 ,0 ,0 ,0 ,0 ,0 ,0 ,0 ,0 100 429
Professionals 2,3 12,8 16,0 12,1 ,2 19,3 1,1 15,2 1,3 18,3 1,4 100 1620 Technicians 1,2 3,4 7,8 8,6 ,5 17,3 1,2 18,7 ,9 36,7 3,8 100 769 Semi-professionals
,6 ,9 4,7 9,7 ,1 22,5 ,0 21,3 ,2 39,8 ,3 100 1663
Skilled servants
,5 9,0 11,8 5,9 4,2 12,0 6,1 10,8 1,7 30,6 7,2 100 830
Unskilled servants
,2 2,8 6,9 ,0 2,1 ,2 11,1 ,7 18,3 3,6 54,1 100 1633
Clerical occupations
,3 1,8 3,3 ,5 7,8 1,7 17,1 1,8 20,5 2,7 42,6 100 2397
Sales occupations
,6 12,9 17,5 ,9 4,2 1,0 12,0 ,8 10,7 1,7 37,6 100 1723
Skilled manual workers
,1 2,2 1,6 4,8 3,0 9,6 4,4 9,3 2,2 50,3 12,7 100 2051
Unskilled manual workers
,0 ,0 3,3 ,0 ,0 ,3 4,2 1,9 10,6 10,4 69,3 100 1438
Farm workers ,0 ,0 ,0 4,5 ,9 5,4 6,8 5,9 3,2 35,1 38,3 100 222 Farmers ,6 22,6 76,8 ,0 ,0 ,0 ,0 ,0 ,0 ,0 ,0 100 888 Total 1,5 8,7 12,8 5,7 2,3 8,4 6,0 7,0 7,1 17,4 23,1 100 17326

67
Table 3.6 EGP vs. WR_P (column and row percentages) Capitalist Small
Emp-loyers
Self- Empl
Skilled Managers
Low- skilled Managers
Skilled super-visors
Low- skilled Super-visors
Skilled Semi- autono-mous
Low- skilled Semi- autono-mous
Skilled workers
Low- skilled workers
Total
I Prof. Adm. High 81,2 11,8 7,1 55,6 4,8 32,4 1,1 18,5 ,1 10,0 ,0 12,3 II Prof. Adm. Low ,0 6,6 12,3 24,2 27,1 37,7 18,4 45,9 14,4 29,5 6,0 19,2 IIIa Routine non-manuals
,0 ,9 2,8 5,9 22,1 9,8 23,0 10,2 27,4 10,3 18,6 12,2
IIIb Lower sales-service
,0 ,0 ,0 ,0 20,8 ,0 30,7 ,0 26,8 ,1 29,8 11,1
IVa Self-empl. with empl.
16,2 64,2 ,0 ,0 ,0 ,0 ,0 ,0 ,0 ,0 ,0 5,8
IVb Self-empl. no empl.
,0 ,0 42,2 ,0 ,0 ,0 ,0 ,0 ,0 ,0 ,0 5,4
V Manual supervisors
,8 1,9 ,0 10,5 2,3 10,2 1,0 5,3 ,1 7,8 ,6 3,6
VI Skilled workers ,0 1,2 1,7 2,7 21,6 8,6 11,1 15,9 4,4 33,1 6,6 11,1 VIIa Unskilled workers
,0 ,0 3,1 ,0 1,0 ,5 13,4 3,1 26,2 6,7 36,4 12,9
VIIb Farm labours ,0 ,0 ,0 1,0 ,5 ,8 1,4 1,1 ,6 2,6 2,1 1,3 IVc Self-empl. farmers 1,9 13,4 30,8 ,0 ,0 ,0 ,0 ,0 ,0 ,0 ,0 5,1 Total 100 100 100 100 100 100 100 100 100 100 100 100 N* 266 1504 2212 982 399 1454 1044 1213 1226 3011 4010 17321

68
Table 3.6 contintues Capitalist Small
Emp-loyers
Self- Empl
Skilled Managers
Low- skilled Managers
Skilled super-visors
Low- skilled Super-visors
Skilled Semi- autono-mous
Low- skilled Semi- autonomous
Skilled workers
Low- skilled workers
Total N*
I Prof. Adm. High
10,2 8,3 7,4 25,7 ,9 22,2 ,5 10,6 ,0 14,2 ,0 100 2123
II Prof. Adm. Low
,0 3,0 8,2 7,2 3,3 16,5 5,8 16,8 5,3 26,7 7,2 100 3319
IIIa Routine nonmanuals
,0 ,6 2,9 2,7 4,2 6,7 11,3 5,9 15,9 14,7 35,2 100 2118
IIIb Lower sales service
,0 ,0 ,0 ,0 4,3 ,0 16,6 ,0 17,1 ,1 61,9 100 1927
IVa Self-empl. with empl.
4,3 95,7 ,0 ,0 ,0 ,0 ,0 ,0 ,0 ,0 ,0 100 1009
IVb Self-empl. no empl.
,0 ,0 100,0 ,0 ,0 ,0 ,0 ,0 ,0 ,0 ,0 100 933
V Manual supervisors
,3 4,6 ,0 16,5 1,4 23,8 1,6 10,2 ,2 37,5 3,8 100 626
VI Skilled workers
,0 ,9 2,0 1,4 4,5 6,5 6,1 10,1 2,8 52,0 13,8 100 1917
VIIa Unskilled workers
,0 ,0 3,1 ,0 ,2 ,3 6,3 1,7 14,3 9,0 65,2 100 2239
VIIb Farm labours
,0 ,0 ,0 4,5 ,9 5,4 6,8 5,9 3,2 35,1 38,3 100 222
IVc Self-empl. farmers
,6 22,6 76,8 ,0 ,0 ,0 ,0 ,0 ,0 ,0 ,0 100 888
Total 1,5 8,7 12,8 5,7 2,3 8,4 6,0 7,0 7,1 17,4 23,2 100 17321 European Social Survey 2002-3. * Cases weighted by design and population..

69
Table 4.1.1. EGP. Class distribution for men by county (percentages) I
Prof. Adm. High
II Prof. Adm. Low
IIIa Routine
non-manual
IIIb Lower sales
service
IVa Self-empl with empl
IVb Self-empl no
empl
V Manual super-visors
VI Skilled workers
VIIa Unskill-
ed workers
VIIb Farm
labours
IVc Self-empl.
farmers
Total N *
Austria 15.2 21.2 12.5 10.3 3.8 1.6 7.1 13.0 10.3 0.5 4.3 100.0 184 Belgium 16.8 21.3 3.3 8.6 3.3 3.7 7.0 20.1 13.1 0.8 2.0 100.0 244 Switzerland 24.4 20.5 7.8 4.9 3.9 4.4 8.3 12.7 6.8 2.0 4.4 100.0 205 Czech Republic 9.4 19.2 6.0 3.0 4.5 7.5 5.3 24.2 15.8 3.4 1.5 100.0 265 Germany 13.2 20.8 9.1 3.1 4.5 3.6 8.0 22.1 13.7 0.5 1.5 100.0 1907 Denmark 18.9 19.6 4.1 4.7 4.1 2.0 6.1 18.9 17.6 1.4 2.7 100.0 148 Spain 10.5 16.3 4.2 5.4 4.1 4.7 3.7 17.0 24.9 5.3 3.9 100.0 830 Finland 17.2 19.0 1.7 2.6 4.3 2.6 2.6 24.1 16.4 2.6 6.9 100.0 116 United Kingdom 26.2 16.0 4.6 6.6 3.0 6.4 6.3 13.4 14.6 1.4 1.3 100.0 1421 Greece 9.7 11.1 3.2 7.8 11.5 11.5 1.8 16.1 10.6 1.4 15.2 100.0 217 Hungary 12.8 11.3 0.0 3.6 8.7 6.2 4.6 22.1 22.1 5.1 3.6 100.0 195 Ireland 19.8 12.1 3.3 5.5 6.6 5.5 6.6 12.1 13.2 2.2 13.2 100.0 91 Israel 32.5 18.7 5.7 4.9 4.9 2.4 5.7 10.6 12.2 0.8 1.6 100.0 123 Italy 10.1 18.6 5.6 4.2 13.7 8.2 3.7 11.8 16.4 1.2 6.6 100.0 1339 Luxembourg 22.2 22.2 0.0 11.1 0.0 0.0 11.1 11.1 22.2 0.0 0.0 100.0 9 Netherlands 24.8 23.6 6.0 5.5 5.5 1.0 8.0 12.0 10.8 1.0 1.8 100.0 399 Norway (stand) Norway (revised)
18.4 15.5
22.8 19.3
6.1 5.2
9.6 8.1
0.0 5.2
0.0 10.4
9.6 8.1
17.5 14.8
14.0 11.9
1.8 1.5
0.0 --
100.0 100.0
114 135
Poland 11.4 14.0 2.7 1.7 5.3 5.3 5.2 20.2 19.5 1.3 13.3 100.0 769 Portugal 10.7 8.9 6.7 3.1 11.6 7.1 4.5 22.3 18.8 0.9 5.4 100.0 224 Sweden 18.3 25.6 4.9 6.9 3.7 3.7 4.5 16.3 12.6 1.2 2.4 100.0 246 Slovenia 15.4 17.9 5.1 5.1 5.1 2.6 10.3 20.5 12.8 2.6 2.6 100.0 39 Total 15.7 18.1 5.7 4.7 6.0 5.2 5.8 17.1 15.7 1.6 4.3 100.0 9085 European Social Survey 2002-3. * Cases weighted nationally.

70
Table 4.1.2. EGP. Class distribution for women by county (percentages) I
Prof. Adm. High
II Prof. Adm. Low
IIIa Routine
non-manual
IIIb Lower sales
service
IVa Self-empl with empl
IVb Self-empl no
empl
V Manual super-visors
VI Skilled workers
VIIa Unskill-
ed workers
VIIb Farm
labours
IVc Self-empl
farmers
Total N*
Austria 8.4 17.3 31.8 22.9 2.8 2.8 0.6 2.8 5.6 0.6 4.5 100.0 179 Belgium 14.7 25.9 7.6 23.5 3.5 2.9 1.2 6.5 12.9 0.0 1.2 100.0 170 Switzerland 10.3 22.9 26.3 24.0 2.3 2.9 0.6 4.0 4.6 0.0 2.3 100.0 175 Czech Republic 6.0 20.5 24.0 13.5 1.5 4.0 3.5 8.0 16.5 2.5 0.0 100.0 200 Germany 8.2 23.7 30.8 18.1 2.0 2.6 0.2 3.4 9.7 0.8 0.5 100.0 1716 Denmark 8.5 25.4 20.0 25.4 1.5 1.5 1.5 5.4 9.2 0.8 0.8 100.0 130 Spain 4.8 24.0 4.3 22.3 5.5 7.4 1.2 8.6 15.9 4.3 1.6 100.0 579 Finland 10.9 25.5 13.6 22.7 1.8 2.7 0.9 4.5 11.8 0.9 4.5 100.0 110 United Kingdom 12.5 19.9 21.2 28.3 0.7 2.4 1.0 3.9 9.4 0.7 0.0 100.0 1351 Greece 5.9 10.5 11.8 15.0 3.3 14.4 0.7 5.9 14.4 0.7 17.6 100.0 153 Hungary 11.1 24.2 17.6 15.0 2.6 5.2 0.7 7.8 15.0 0.7 0.0 100.0 153 Ireland 13.0 22.1 13.0 29.9 3.9 2.6 1.3 3.9 9.1 0.0 1.3 100.0 77 Israel 14.3 37.8 18.5 15.1 3.4 3.4 0.0 2.5 5.0 0.0 0.0 100.0 119 Italy 5.1 15.1 21.1 15.2 11.4 4.3 3.1 5.7 14.4 1.5 3.2 100.0 1044 Luxembourg 12.5 37.5 25.0 12.5 0.0 0.0 0.0 0.0 12.5 0.0 0.0 100.0 8 Netherlands 10.3 35.9 20.4 17.6 2.8 1.0 1.0 2.1 7.5 0.8 0.5 100.0 387 Norway (stand.) Norway (revised)
10.9 10.2
27.2 25.5
18.5 17.3
32.6 30.6
0.0 2.0
0.0 4.1
0.0 0.0
4.3 4.1
6.5 6.1
0.0 0.0
0.0 0.0
100.0 100.0
92 98
Poland 9.4 22.3 17.7 11.5 1.9 4.4 1.2 6.4 11.3 0.9 12.9 100.0 565 Portugal 6.5 12.5 16.7 11.1 3.2 8.3 0.9 13.0 23.1 1.9 2.8 100.0 216 Sweden 11.9 30.2 14.9 29.7 0.5 1.5 0.5 2.5 7.9 0.0 0.5 100.0 202 Slovenia 13.9 22.2 22.2 11.1 5.6 0.0 2.8 11.1 11.1 0.0 0.0 100.0 36 Total 8.9 22.1 21.1 20.0 3.4 3.6 1.1 5.0 11.2 1.1 2.4 100.0 7662 European Social Survey 2002-3. * Cases weighted nationally.
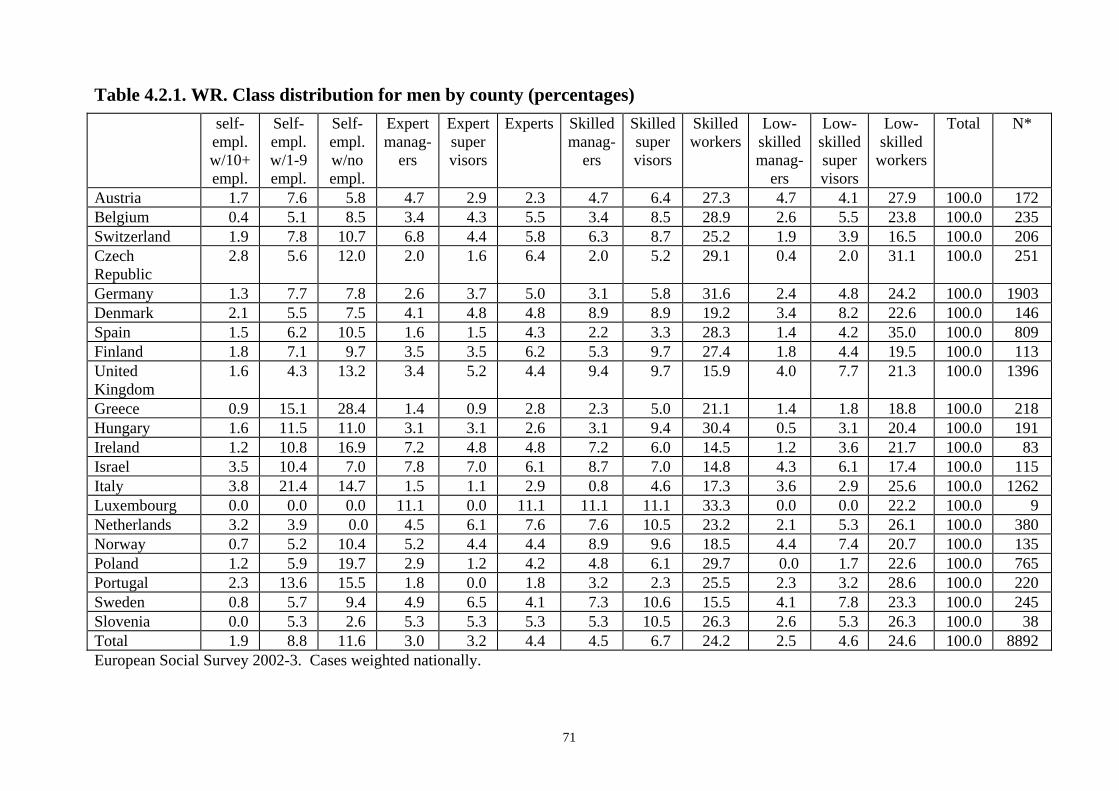
71
Table 4.2.1. WR. Class distribution for men by county (percentages) self-
empl. w/10+ empl.
Self- empl. w/1-9 empl.
Self- empl. w/no empl.
Expert manag-
ers
Expert super visors
Experts Skilled manag-
ers
Skilled super visors
Skilled workers
Low- skilled manag-
ers
Low- skilled super visors
Low- skilled
workers
Total N*
Austria 1.7 7.6 5.8 4.7 2.9 2.3 4.7 6.4 27.3 4.7 4.1 27.9 100.0 172 Belgium 0.4 5.1 8.5 3.4 4.3 5.5 3.4 8.5 28.9 2.6 5.5 23.8 100.0 235 Switzerland 1.9 7.8 10.7 6.8 4.4 5.8 6.3 8.7 25.2 1.9 3.9 16.5 100.0 206 Czech Republic
2.8 5.6 12.0 2.0 1.6 6.4 2.0 5.2 29.1 0.4 2.0 31.1 100.0 251
Germany 1.3 7.7 7.8 2.6 3.7 5.0 3.1 5.8 31.6 2.4 4.8 24.2 100.0 1903 Denmark 2.1 5.5 7.5 4.1 4.8 4.8 8.9 8.9 19.2 3.4 8.2 22.6 100.0 146 Spain 1.5 6.2 10.5 1.6 1.5 4.3 2.2 3.3 28.3 1.4 4.2 35.0 100.0 809 Finland 1.8 7.1 9.7 3.5 3.5 6.2 5.3 9.7 27.4 1.8 4.4 19.5 100.0 113 United Kingdom
1.6 4.3 13.2 3.4 5.2 4.4 9.4 9.7 15.9 4.0 7.7 21.3 100.0 1396
Greece 0.9 15.1 28.4 1.4 0.9 2.8 2.3 5.0 21.1 1.4 1.8 18.8 100.0 218 Hungary 1.6 11.5 11.0 3.1 3.1 2.6 3.1 9.4 30.4 0.5 3.1 20.4 100.0 191 Ireland 1.2 10.8 16.9 7.2 4.8 4.8 7.2 6.0 14.5 1.2 3.6 21.7 100.0 83 Israel 3.5 10.4 7.0 7.8 7.0 6.1 8.7 7.0 14.8 4.3 6.1 17.4 100.0 115 Italy 3.8 21.4 14.7 1.5 1.1 2.9 0.8 4.6 17.3 3.6 2.9 25.6 100.0 1262 Luxembourg 0.0 0.0 0.0 11.1 0.0 11.1 11.1 11.1 33.3 0.0 0.0 22.2 100.0 9 Netherlands 3.2 3.9 0.0 4.5 6.1 7.6 7.6 10.5 23.2 2.1 5.3 26.1 100.0 380 Norway 0.7 5.2 10.4 5.2 4.4 4.4 8.9 9.6 18.5 4.4 7.4 20.7 100.0 135 Poland 1.2 5.9 19.7 2.9 1.2 4.2 4.8 6.1 29.7 0.0 1.7 22.6 100.0 765 Portugal 2.3 13.6 15.5 1.8 0.0 1.8 3.2 2.3 25.5 2.3 3.2 28.6 100.0 220 Sweden 0.8 5.7 9.4 4.9 6.5 4.1 7.3 10.6 15.5 4.1 7.8 23.3 100.0 245 Slovenia 0.0 5.3 2.6 5.3 5.3 5.3 5.3 10.5 26.3 2.6 5.3 26.3 100.0 38 Total 1.9 8.8 11.6 3.0 3.2 4.4 4.5 6.7 24.2 2.5 4.6 24.6 100.0 8892 European Social Survey 2002-3. Cases weighted nationally.

72
Table 4.2.2. WR . Class distribution for women by county (percentages) Self-
empl. w/10+ empl.
Self- empl. w/1-9 empl.
Self- empl. w/no empl.
Expert manag-
ers
Expert super- visors
Experts Skilled manag-
ers
Skilled supervisors
Skilled workers
Low- skilled manag-
ers
Low- skilled
supervisors
Low- skilled
workers
Total N*
Austria 1.2 5.3 7.7 0.6 2.4 1.2 4.1 7.1 18.9 4.1 8.3 39.1 100.0 169 Belgium 0.0 5.1 7.7 1.3 2.6 4.5 2.6 5.1 19.9 1.9 10.3 39.1 100.0 156 Switzerland 0.6 3.5 8.8 1.2 2.9 4.7 2.4 7.1 18.2 2.9 7.6 40.0 100.0 170 Czech Republic
0.5 1.6 6.3 0.5 2.1 1.6 2.1 4.8 27.0 1.6 5.3 46.6 100.0 189
Germany 0.9 3.7 5.9 0.9 1.9 3.5 1.6 5.7 21.4 1.6 6.7 46.3 100.0 1697 Denmark 0.0 2.4 2.4 2.4 1.6 2.4 5.6 9.6 20.8 4.8 13.6 34.4 100.0 125 Spain 0.7 5.2 10.0 0.5 0.4 3.2 2.0 4.6 16.6 2.5 8.4 45.9 100.0 560 Finland 0.0 2.9 5.7 1.0 1.9 4.8 2.9 6.7 24.8 1.9 9.5 38.1 100.0 105 United Kingdom
0.7 1.2 4.2 2.2 2.4 3.7 6.9 9.1 11.5 3.5 13.7 40.9 100.0 1328
Greece 0.7 6.7 32.0 0.7 0.7 2.7 1.3 2.7 11.3 1.3 5.3 34.7 100.0 150 Hungary 0.6 3.2 7.1 1.9 4.5 5.2 2.6 7.1 16.9 0.6 9.1 40.9 100.0 154 Ireland 0.0 4.2 4.2 2.8 2.8 4.2 4.2 6.9 15.3 4.2 9.7 41.7 100.0 72 Israel 0.9 2.7 4.5 1.8 4.5 5.4 7.2 10.8 18.9 6.3 11.7 25.2 100.0 111 Italy 1.0 13.4 6.7 0.4 0.0 2.7 1.5 5.9 23.1 2.5 6.7 36.0 100.0 978 Luxembourg 0.0 0.0 0.0 0.0 0.0 0.0 0.0 0.0 33.3 0.0 16.7 50.0 100.0 6 Netherlands 0.3 2.2 0.0 1.9 2.5 5.0 3.3 7.2 22.9 2.2 12.2 40.3 100.0 362 Norway 0.0 2.1 4.1 2.1 3.1 3.1 7.2 9.3 17.5 3.1 12.4 36.1 100.0 97 Poland 0.7 4.5 16.9 2.0 1.1 5.3 1.8 5.3 26.0 0.9 2.0 33.6 100.0 551 Portugal 0.5 4.8 13.0 0.5 1.0 1.9 1.9 3.4 19.7 1.9 4.3 47.1 100.0 208 Sweden 0.5 2.0 4.0 2.5 4.5 5.1 5.6 7.6 18.2 2.5 9.6 37.9 100.0 198 Slovenia 0.0 2.8 2.8 5.6 8.3 2.8 8.3 25.0 2.8 5.6 36.1 100.0 36 Total 0.7 4.6 7.2 1.3 1.8 3.6 3.2 6.5 19.4 2.4 8.5 40.8 100.0 7422 European Social Survey 2002-3. Cases weighted nationally.

73
Table 4.3.1. ESP. Class distribution for men by county (percentages) Man. I
high. Serv.
Man II
Se.1-3 empl.
Self-empl.
0 empl.
Prof. Technicians
Semi-prof.
Skil-led ser-
vants
Unskilled
serv-ants
Cler-ical
occupations
Sales occupations
Skil-led
man.work-
ers
Unskilled
man. work-
ers
Farm work-
ers
Farm-ers
Total N*
Austria 8.8 2.2 1.1 8.8 9.3 6.6 4.9 3.8 18.7 6.6 17.0 7.1 0.5 4.4 100.0 182 Belgium 6.5 2.0 2.8 11.4 10.6 6.5 6.9 3.7 8.5 5.3 22.0 11.0 0.8 2.0 100.0 246 Switzerland 8.8 4.9 2.9 19.6 6.4 6.9 4.9 3.4 7.4 4.9 18.6 4.9 2.0 4.4 100.0 204 Czech Republic
3.8 4.2 3.8 9.8 8.0 3.8 4.2 2.3 7.2 8.0 26.1 14.0 3.4 1.5 100.0 264
Germany 3.9 3.5 1.8 13.7 8.4 4.2 4.7 4.6 10.3 5.7 26.9 10.4 0.5 1.5 100.0 1909 Denmark 9.0 4.1 2.1 12.4 5.5 6.2 2.8 5.5 4.1 8.3 22.8 13.1 1.4 2.8 100.0 145 Spain 3.6 2.3 3.5 8.1 2.9 4.2 2.9 6.6 9.3 7.7 18.9 20.9 5.3 3.9 100.0 831 Finland 7.8 6.1 2.6 11.3 8.7 3.5 2.6 4.3 0.9 4.3 25.2 13.0 2.6 7.0 100.0 115 United Kingdom
14.2 5.1 3.8 12.7 3.2 5.0 6.1 6.9 5.9 8.1 16.2 10.0 1.4 1.3 100.0 1420
Greece 5.5 8.8 9.7 7.8 1.8 4.6 5.1 4.6 6.5 5.1 14.7 9.2 1.4 15.2 100.0 217 Hungary 6.2 8.2 4.1 7.7 5.2 2.6 3.1 6.2 0.0 4.6 24.7 18.6 5.2 3.6 100.0 194 Ireland 11.0 5.5 4.4 13.2 3.3 3.3 3.3 4.4 5.5 4.4 15.4 11.0 2.2 13.2 100.0 91 Israel 13.1 4.1 0.8 20.5 6.6 7.4 5.7 6.6 8.2 4.9 11.5 8.2 0.8 1.6 100.0 122 Italy 4.3 5.2 3.1 9.6 7.4 4.8 6.3 6.1 8.9 11.9 12.2 12.6 1.2 6.6 100.0 1338 Luxembourg 12.5 0.0 0.0 12.5 12.5 0.0 0.0 12.5 12.5 0.0 25.0 12.5 0.0 0.0 100.0 8 Netherlands 14.6 5.8 1.0 13.1 7.1 5.5 4.3 5.3 9.8 5.5 17.6 7.6 1.0 1.8 100.0 397 Norway 5.3 3.5 0.0 13.2 8.8 5.3 1.8 6.1 9.6 6.1 26.3 12.3 1.8 0.0 100.0 114 Poland 9.6 6.6 3.5 5.3 3.4 1.4 1.8 2.7 4.6 4.8 24.4 17.1 1.3 13.3 100.0 767 Portugal 8.0 5.8 2.2 5.4 2.7 0.9 1.3 4.5 12.1 8.9 25.9 16.1 0.9 5.4 100.0 224 Sweden 8.1 1.6 2.0 15.9 8.9 5.3 4.1 6.1 5.7 9.8 18.7 10.2 1.2 2.4 100.0 246 Slovenia 7.5 5.0 2.5 10.0 7.5 0.0 5.0 2.5 7.5 7.5 30.0 10.0 2.5 2.5 100.0 40 Total 7.5 4.6 2.9 11.1 6.0 4.4 4.6 5.2 8.1 7.3 20.2 12.3 1.6 4.3 100.0 9074 European Social Survey 2002-3. Cases weighted nationally.
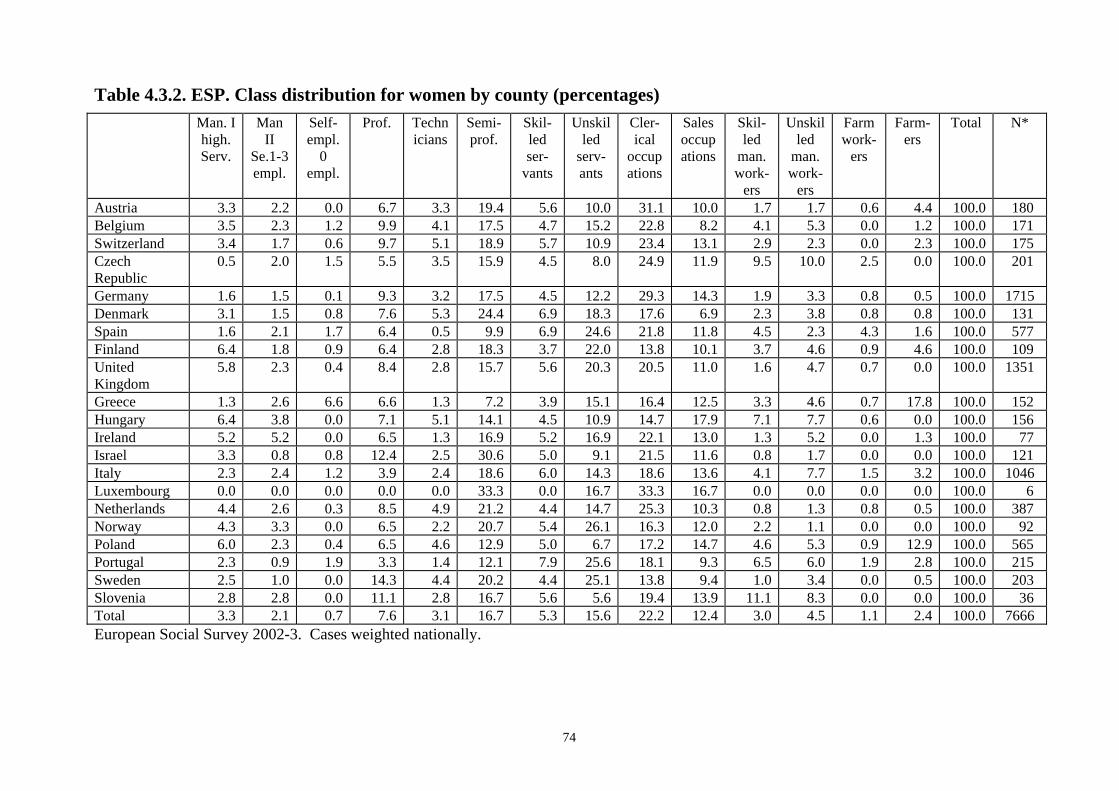
74
Table 4.3.2. ESP. Class distribution for women by county (percentages) Man. I
high. Serv.
Man II
Se.1-3 empl.
Self-empl.
0 empl.
Prof. Technicians
Semi-prof.
Skil-led ser-
vants
Unskilled
serv-ants
Cler-ical
occupations
Sales occupations
Skil-led
man.work-
ers
Unskilled
man. work-
ers
Farm work-
ers
Farm-ers
Total N*
Austria 3.3 2.2 0.0 6.7 3.3 19.4 5.6 10.0 31.1 10.0 1.7 1.7 0.6 4.4 100.0 180 Belgium 3.5 2.3 1.2 9.9 4.1 17.5 4.7 15.2 22.8 8.2 4.1 5.3 0.0 1.2 100.0 171 Switzerland 3.4 1.7 0.6 9.7 5.1 18.9 5.7 10.9 23.4 13.1 2.9 2.3 0.0 2.3 100.0 175 Czech Republic
0.5 2.0 1.5 5.5 3.5 15.9 4.5 8.0 24.9 11.9 9.5 10.0 2.5 0.0 100.0 201
Germany 1.6 1.5 0.1 9.3 3.2 17.5 4.5 12.2 29.3 14.3 1.9 3.3 0.8 0.5 100.0 1715 Denmark 3.1 1.5 0.8 7.6 5.3 24.4 6.9 18.3 17.6 6.9 2.3 3.8 0.8 0.8 100.0 131 Spain 1.6 2.1 1.7 6.4 0.5 9.9 6.9 24.6 21.8 11.8 4.5 2.3 4.3 1.6 100.0 577 Finland 6.4 1.8 0.9 6.4 2.8 18.3 3.7 22.0 13.8 10.1 3.7 4.6 0.9 4.6 100.0 109 United Kingdom
5.8 2.3 0.4 8.4 2.8 15.7 5.6 20.3 20.5 11.0 1.6 4.7 0.7 0.0 100.0 1351
Greece 1.3 2.6 6.6 6.6 1.3 7.2 3.9 15.1 16.4 12.5 3.3 4.6 0.7 17.8 100.0 152 Hungary 6.4 3.8 0.0 7.1 5.1 14.1 4.5 10.9 14.7 17.9 7.1 7.7 0.6 0.0 100.0 156 Ireland 5.2 5.2 0.0 6.5 1.3 16.9 5.2 16.9 22.1 13.0 1.3 5.2 0.0 1.3 100.0 77 Israel 3.3 0.8 0.8 12.4 2.5 30.6 5.0 9.1 21.5 11.6 0.8 1.7 0.0 0.0 100.0 121 Italy 2.3 2.4 1.2 3.9 2.4 18.6 6.0 14.3 18.6 13.6 4.1 7.7 1.5 3.2 100.0 1046 Luxembourg 0.0 0.0 0.0 0.0 0.0 33.3 0.0 16.7 33.3 16.7 0.0 0.0 0.0 0.0 100.0 6 Netherlands 4.4 2.6 0.3 8.5 4.9 21.2 4.4 14.7 25.3 10.3 0.8 1.3 0.8 0.5 100.0 387 Norway 4.3 3.3 0.0 6.5 2.2 20.7 5.4 26.1 16.3 12.0 2.2 1.1 0.0 0.0 100.0 92 Poland 6.0 2.3 0.4 6.5 4.6 12.9 5.0 6.7 17.2 14.7 4.6 5.3 0.9 12.9 100.0 565 Portugal 2.3 0.9 1.9 3.3 1.4 12.1 7.9 25.6 18.1 9.3 6.5 6.0 1.9 2.8 100.0 215 Sweden 2.5 1.0 0.0 14.3 4.4 20.2 4.4 25.1 13.8 9.4 1.0 3.4 0.0 0.5 100.0 203 Slovenia 2.8 2.8 0.0 11.1 2.8 16.7 5.6 5.6 19.4 13.9 11.1 8.3 0.0 0.0 100.0 36 Total 3.3 2.1 0.7 7.6 3.1 16.7 5.3 15.6 22.2 12.4 3.0 4.5 1.1 2.4 100.0 7666 European Social Survey 2002-3. Cases weighted nationally.

75
Table 4.4.1. WR_P. Class distribution for men by country (percentages) Capitalist Small
EmployersSelf- Empl
Skilled Managers
Low- skilled Managers
Skilled super-visors
Low- skilled super-visors
Skilled Semi- autono-mous
Low- skilled Semi- autono-mous
Skilled workers
Low- skilled workers
Total N*
Austria 1 .7 9 .4 6 .6 8 .8 4 .4 9 .4 3 .9 5 .5 5 .5 23 .8 21 .0 100.0 181 Belgium .8 7 .2 10 .8 6 .0 2 .4 12 .0 5 .2 11 .2 6 .8 20 .9 16 .5 100.0 249 Switzerland 2 .3 8 .9 11 .7 12 .6 1 .9 13 .1 3 .7 8 .4 4 .2 21 .5 11 .7 100.0 214 Czech Republic 2 .8 5 .9 12 .6 3 .9 .4 6 .7 2 .0 5 .9 4 .3 29 .1 26 .4 100.0 254 Germany 2 .0 10 .0 8 .9 5 .5 2 .3 9 .1 4 .6 8 .7 4 .3 26 .2 18 .7 100.0 2000 Denmark 3 .3 7 .2 9 .2 11 .8 3 .3 13 .1 7 .8 9 .2 7 .2 13 .1 15 .0 100.0 153 Spain 1 .4 7 .9 17 .3 3 .3 .8 4 .4 4 .1 5 .1 4 .4 24 .1 27 .1 100.0 907 Finland 1 .7 8 .3 12 .4 8 .3 1 .7 13 .2 4 .1 9 .9 4 .1 22 .3 14 .0 100.0 121 United Kingdom
2 .1 6 .9 15 .5 11 .9 3 .7 13 .9 7 .1 4 .9 5 .1 14 .1 14 .7 100.0 1497
Greece 1 .5 15 .5 36 .7 3 .0 1 .1 5 .3 1 .5 2 .7 3 .4 17 .0 12 .1 100.0 264 Hungary 1 .5 11 .8 12 .3 6 .2 .5 12 .3 3 .1 5 .1 3 .1 27 .2 16 .9 100.0 195 Ireland 2 .2 12 .1 19 .8 13 .2 1 .1 9 .9 3 .3 3 .3 5 .5 15 .4 14 .3 100.0 91 Israel 4 .1 11 .6 7 .4 15 .7 4 .1 13 .2 5 .8 6 .6 3 .3 14 .0 14 .0 100.0 121 Italy 3 .5 24 .0 17 .1 2 .1 3 .3 5 .3 2 .6 5 .2 5 .8 13 .4 17 .7 100.0 1369 Luxembourg .0 11 .1 .0 11 .1 .0 11 .1 .0 11 .1 11 .1 22 .2 22 .2 100.0 9 Netherlands 3 .6 5 .9 .0 11 .8 2 .0 16 .1 5 .1 11 .5 7 .9 18 .7 17 .4 100.0 391 Norway 1 .4 7 .6 12 .5 13 .2 4 .2 13 .2 6 .9 7 .6 7 .6 13 .9 11 .8 100.0 144 Poland 1 .2 7 .0 24 .8 6 .9 .0 6 .7 1 .5 5 .2 2 .4 26 .1 18 .2 100.0 840 Portugal 3 .0 14 .4 18 .6 4 .7 2 .1 2 .1 3 .0 3 .0 3 .4 22 .5 23 .3 100.0 236 Sweden 1 .2 7 .4 11 .3 11 .7 3 .9 16 .7 7 .4 9 .3 8 .2 9 .3 13 .6 100.0 257 Slovenia .0 7 .1 4 .8 9 .5 2 .4 14 .3 7 .1 7 .1 4 .8 23 .8 19 .0 100.0 42 Total 2 .1 10 .8 14 .4 6 .9 2 .3 9 .3 4 .3 6 .5 4 .9 20 .2 18 .1 100.0 9535 European Social Survey 2002-3. Cases weighted by design and population..

76
Table 4.4.2. WR _P. Class distribution for women by country (percentages) Capitalist Small
EmployersSelf- Empl
Skilled Managers
Low- skilled Managers
Skilled super-visors
Low- skilled Super-visors
Skilled Semi- autono-mous
Low- skilled Semi- autonomous
Skilled workers
Low- skilled workers
Total N*
Austria 1 .7 6 .2 9 .0 4 .5 3 .9 9 .6 8 .4 3 .9 11 .2 15 .2 26 .4 100.0 178 Belgium 1 .1 6 .3 12 .0 3 .4 1 .7 7 .4 9 .1 9 .7 13 .1 13 .1 22 .9 100.0 175 Switzerland 1 .1 4 .0 10 .3 3 .4 2 .9 9 .7 7 .4 7 .4 14 .3 14 .9 24 .6 100.0 175 Czech Republic
.5 1 .6 7 .3 3 .1 1 .6 6 .8 5 .2 5 .2 10 .9 22 .4 35 .4 100.0 192
Germany .8 5 .3 8 .2 2 .4 1 .6 7 .2 6 .4 7 .8 11 .5 15 .9 32 .8 100.0 1776 Denmark .8 3 .8 3 .8 7 .7 4 .6 10 .8 13 .1 10 .8 13 .1 11 .5 20 .0 100.0 130 Spain .8 5 .9 17 .9 2 .2 2 .2 4 .5 7 .5 5 .1 6 .5 12 .8 34 .6 100.0 627 Finland .9 3 .5 9 .7 4 .4 1 .8 8 .0 8 .8 11 .5 10 .6 15 .9 24 .8 100.0 113 United Kingdom
.7 2 .1 5 .6 9 .0 3 .4 11 .2 13 .4 6 .1 7 .2 8 .7 32 .7 100.0 1362
Greece .5 7 .5 43 .9 1 .1 1 .1 2 .7 4 .3 3 .2 3 .7 8 .0 24 .1 100.0 187 Hungary .6 5 .0 8 .8 5 .0 .6 11 .3 8 .8 3 .8 8 .8 17 .5 30 .0 100.0 160 Ireland .0 5 .4 5 .4 6 .8 4 .1 9 .5 9 .5 5 .4 8 .1 13 .5 32 .4 100.0 74 Israel .9 4 .4 5 .3 8 .8 6 .2 15 .0 11 .5 7 .1 8 .8 15 .9 15 .9 100.0 113 Italy .9 16 .8 9 .5 1 .8 2 .2 5 .4 6 .2 11 .9 11 .2 12 .4 21 .6 100.0 1072 Luxembourg .0 .0 .0 .0 .0 14 .3 14 .3 14 .3 14 .3 14 .3 28 .6 100.0 7 Netherlands .5 4 .3 .0 5 .1 2 .1 9 .1 11 .8 11 .0 14 .7 16 .1 25 .2 100.0 373 Norway .0 2 .9 6 .8 9 .7 2 .9 11 .7 11 .7 6 .8 7 .8 13 .6 26 .2 100.0 103 Poland .6 5 .6 30 .2 3 .1 .7 5 .2 1 .6 6 .1 3 .7 19 .5 23 .7 100.0 676 Portugal .9 4 .9 18 .4 2 .2 1 .8 3 .6 4 .0 1 .8 9 .9 18 .4 34 .1 100.0 223 Sweden 1 .0 2 .4 5 .8 8 .3 2 .4 11 .7 9 .2 13 .6 14 .1 9 .2 22 .3 100.0 206 Slovenia .0 5 .4 .0 5 .4 2 .7 10 .8 5 .4 5 .4 5 .4 29 .7 29 .7 100.0 37 Total .8 6 .1 11 .2 4 .2 2 .2 7 .7 7 .9 7 .6 9 .6 14 .0 28 .6 100.0 7959 European Social Survey 2002-3. Cases weighted design and population..

77
Table 5.1-3. Alternative class models and economic indicators (means) EGP Treiman
Prestige Score
International Socio-
Economic Index
Control own job
Get a similar or better job with another
employer
Start own business
Family Income
Equivalent Family Income
I Prof. Adm. High 62.6 69.4 69.2 4.8 4.1 50977.0 30152.0 II Prof. Adm. Low 51.7 56.2 58.0 4.1 3.2 36682.5 21519.7 IIIa Routine non-manual 43.3 45.0 52.2 4.0 2.6 33483.1 18623.7 IIIb Lower sales-service 31.6 37.2 48.2 4.4 2.7 29820.6 16139.2 IVa Self-empl with empl 39.5 43.3 85.1 5.5 5.3 35275.4 19244.9 IVb Self-empl no empl 36.6 39.5 68.7 5.3 5.7 30397.2 16679.1 V Manual supervisors 37.0 34.5 51.6 4.1 3.4 30749.3 17310.1 VI Skilled workers 35.1 32.4 41.4 3.6 2.6 24661.3 13587.1 VIIa Unskilled workers 26.2 25.9 34.7 3.4 2.1 22023.8 12054.9 VIIb Farm labours 34.6 23.8 40.9 3.8 2.5 19977.3 10075.7 IVc Self-empl farmers 43.0 35.1 56.7 3.0 2.8 13929.2 7126.7 Total 41.9 44.0 50.5 4.0 2.9 32444.3 18366.3 Eta Squared 0.709 0.737 0.158 0.019 0.045 0.136 0.144 N* 16757 16757 13422 13321 13322 13101 13058

78
Table 5.1.3 continues. WR Treiman
Prestige Score
International Socio-
Economic Index
Control own job
Get a similar/ better job with
another employer
Start own business
Family Income
Equivalent Family Income
Self-empl. w/10+ empl. 57.6 60.0 60.4 5.2 5.9 54106.3 30434.6 Self-empl. w/1-9 empl. 44.2 47.7 64.0 5.7 3.4 37653.7 21126.8 Self-empl. w/no empl. 42.4 42.7 69.6 4.8 5.0 27953.2 16177.8 Expert managers 61.2 68.4 83.1 5.0 4.9 51083.3 30197.1 Expert supervisors 61.1 69.6 70.8 4.7 4.1 51454.5 31172.4 Experts 61.8 69.3 52.1 4.1 3.1 41634.6 24773.1 Skilled managers 49.8 50.3 80.1 5.3 4.5 47072.0 27173.8 Skilled supervisors 48.8 49.0 68.0 4.5 3.6 36982.1 21004.1 Skilled workers 44.4 43.2 40.9 3.6 2.4 28734.0 15863.4 Low-skilled managers 36.6 40.9 82.8 4.7 4.5 41445.1 23491.7 Low-skilled supervisors 36.2 39.8 72.0 4.4 3.6 35600.3 20427.9 Low-skilled workers 32.9 36.1 38.6 3.7 2.3 26281.9 14520.5 Total 41.9 44.1 50.4 4.0 2.9 32615.0 18456.9 Eta Squared 0.406 0.334 0.364 0.026 0.080 0.095 0.098 N* 16199 16199 13373 13203 13202 12862 12820
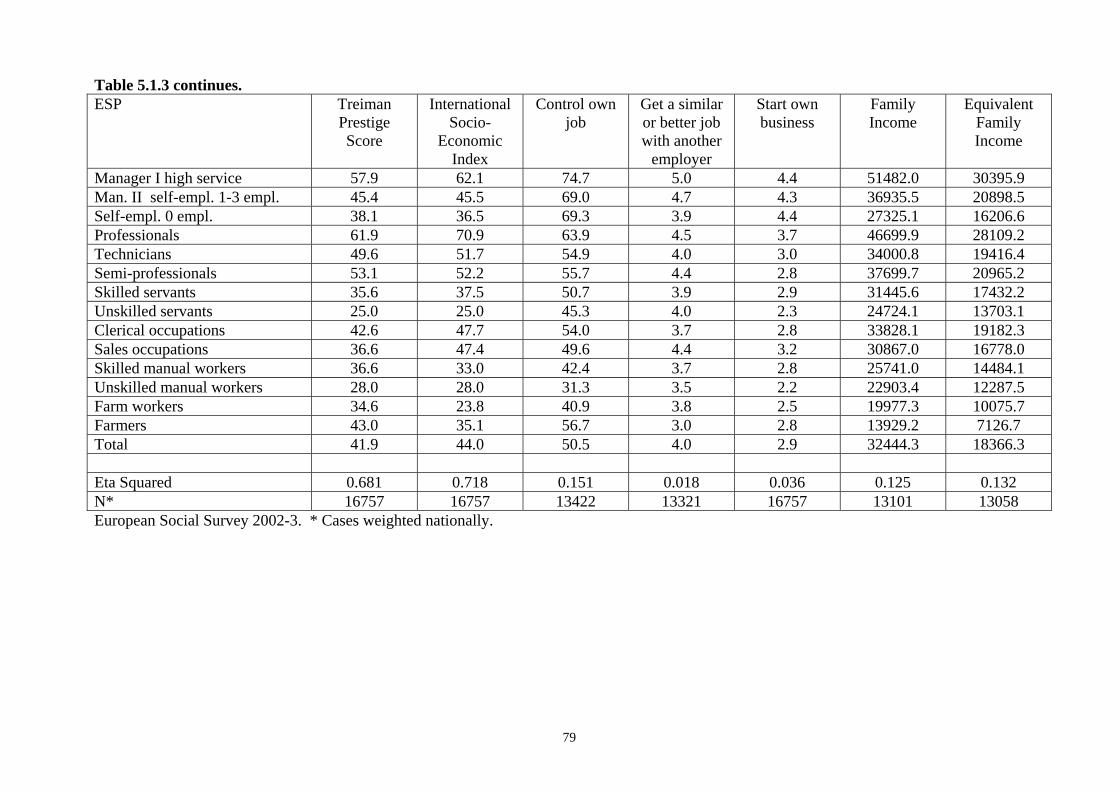
79
Table 5.1.3 continues. ESP Treiman
Prestige Score
International Socio-
Economic Index
Control own job
Get a similar or better job with another
employer
Start own business
Family Income
Equivalent Family Income
Manager I high service 57.9 62.1 74.7 5.0 4.4 51482.0 30395.9 Man. II self-empl. 1-3 empl. 45.4 45.5 69.0 4.7 4.3 36935.5 20898.5 Self-empl. 0 empl. 38.1 36.5 69.3 3.9 4.4 27325.1 16206.6 Professionals 61.9 70.9 63.9 4.5 3.7 46699.9 28109.2 Technicians 49.6 51.7 54.9 4.0 3.0 34000.8 19416.4 Semi-professionals 53.1 52.2 55.7 4.4 2.8 37699.7 20965.2 Skilled servants 35.6 37.5 50.7 3.9 2.9 31445.6 17432.2 Unskilled servants 25.0 25.0 45.3 4.0 2.3 24724.1 13703.1 Clerical occupations 42.6 47.7 54.0 3.7 2.8 33828.1 19182.3 Sales occupations 36.6 47.4 49.6 4.4 3.2 30867.0 16778.0 Skilled manual workers 36.6 33.0 42.4 3.7 2.8 25741.0 14484.1 Unskilled manual workers 28.0 28.0 31.3 3.5 2.2 22903.4 12287.5 Farm workers 34.6 23.8 40.9 3.8 2.5 19977.3 10075.7 Farmers 43.0 35.1 56.7 3.0 2.8 13929.2 7126.7 Total 41.9 44.0 50.5 4.0 2.9 32444.3 18366.3 Eta Squared 0.681 0.718 0.151 0.018 0.036 0.125 0.132 N* 16757 16757 13422 13321 16757 13101 13058 European Social Survey 2002-3. * Cases weighted nationally.
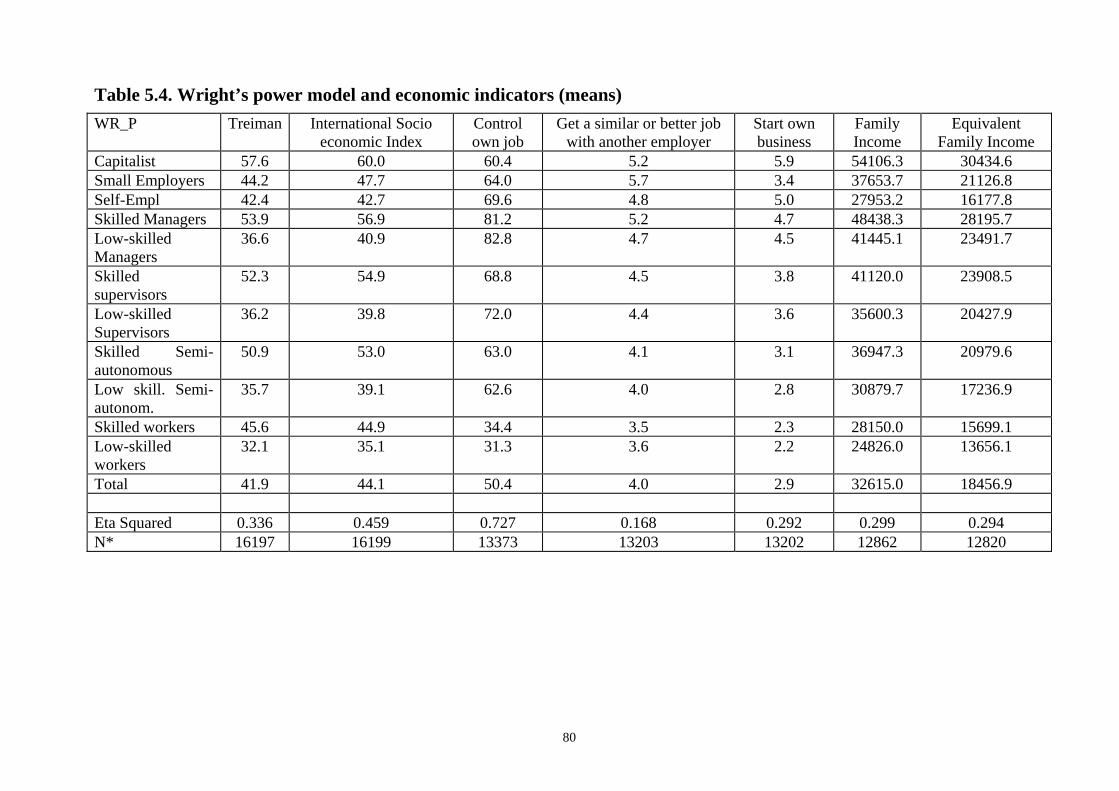
80
Table 5.4. Wright’s power model and economic indicators (means) WR_P Treiman International Socio
economic Index Control own job
Get a similar or better job with another employer
Start own business
Family Income
Equivalent Family Income
Capitalist 57.6 60.0 60.4 5.2 5.9 54106.3 30434.6 Small Employers 44.2 47.7 64.0 5.7 3.4 37653.7 21126.8 Self-Empl 42.4 42.7 69.6 4.8 5.0 27953.2 16177.8 Skilled Managers 53.9 56.9 81.2 5.2 4.7 48438.3 28195.7 Low-skilled Managers
36.6 40.9 82.8 4.7 4.5 41445.1 23491.7
Skilled supervisors
52.3 54.9 68.8 4.5 3.8 41120.0 23908.5
Low-skilled Supervisors
36.2 39.8 72.0 4.4 3.6 35600.3 20427.9
Skilled Semi-autonomous
50.9 53.0 63.0 4.1 3.1 36947.3 20979.6
Low skill. Semi-autonom.
35.7 39.1 62.6 4.0 2.8 30879.7 17236.9
Skilled workers 45.6 44.9 34.4 3.5 2.3 28150.0 15699.1 Low-skilled workers
32.1 35.1 31.3 3.6 2.2 24826.0 13656.1
Total 41.9 44.1 50.4 4.0 2.9 32615.0 18456.9 Eta Squared 0.336 0.459 0.727 0.168 0.292 0.299 0.294 N* 16197 16199 13373 13203 13202 12862 12820
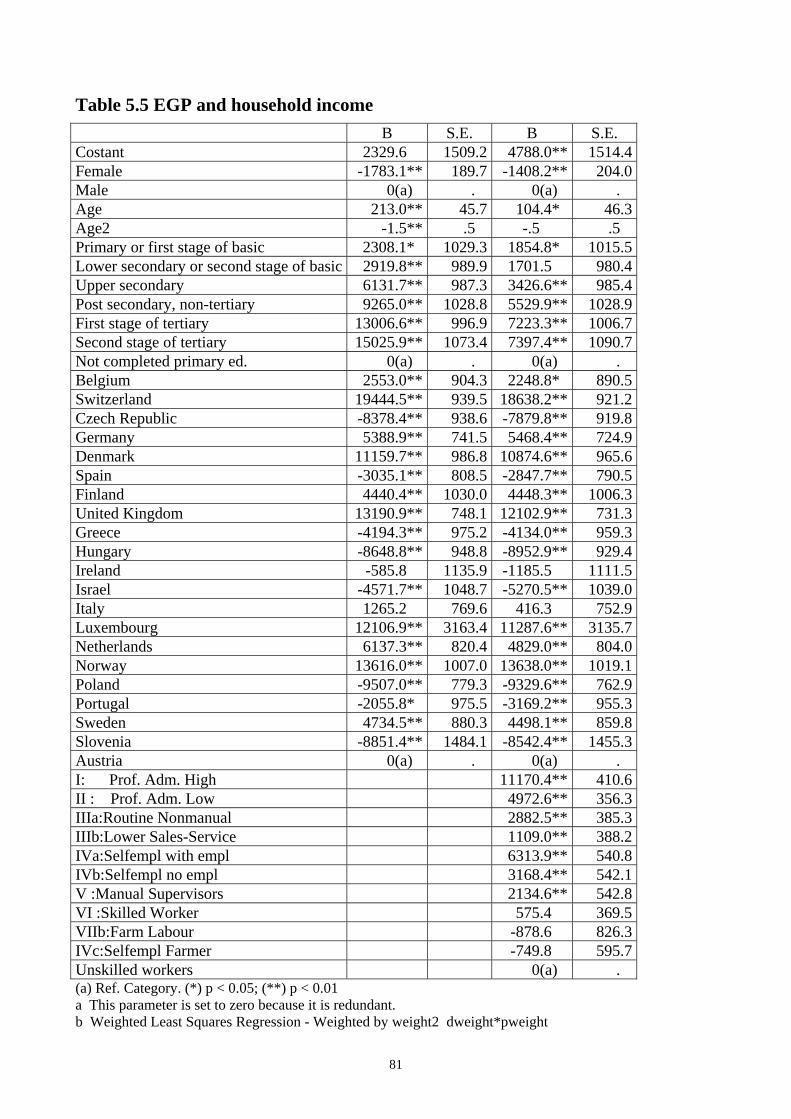
81
Table 5.5 EGP and household income B S.E. B S.E.
Costant 2329.6 1509.2 4788.0** 1514.4 Female -1783.1** 189.7 -1408.2** 204.0 Male 0(a) . 0(a) . Age 213.0** 45.7 104.4* 46.3 Age2 -1.5** .5 -.5 .5 Primary or first stage of basic 2308.1* 1029.3 1854.8* 1015.5 Lower secondary or second stage of basic 2919.8** 989.9 1701.5 980.4 Upper secondary 6131.7** 987.3 3426.6** 985.4 Post secondary, non-tertiary 9265.0** 1028.8 5529.9** 1028.9 First stage of tertiary 13006.6** 996.9 7223.3** 1006.7 Second stage of tertiary 15025.9** 1073.4 7397.4** 1090.7 Not completed primary ed. 0(a) . 0(a) . Belgium 2553.0** 904.3 2248.8* 890.5 Switzerland 19444.5** 939.5 18638.2** 921.2 Czech Republic -8378.4** 938.6 -7879.8** 919.8 Germany 5388.9** 741.5 5468.4** 724.9 Denmark 11159.7** 986.8 10874.6** 965.6 Spain -3035.1** 808.5 -2847.7** 790.5 Finland 4440.4** 1030.0 4448.3** 1006.3 United Kingdom 13190.9** 748.1 12102.9** 731.3 Greece -4194.3** 975.2 -4134.0** 959.3 Hungary -8648.8** 948.8 -8952.9** 929.4 Ireland -585.8 1135.9 -1185.5 1111.5 Israel -4571.7** 1048.7 -5270.5** 1039.0 Italy 1265.2 769.6 416.3 752.9 Luxembourg 12106.9** 3163.4 11287.6** 3135.7 Netherlands 6137.3** 820.4 4829.0** 804.0 Norway 13616.0** 1007.0 13638.0** 1019.1 Poland -9507.0** 779.3 -9329.6** 762.9 Portugal -2055.8* 975.5 -3169.2** 955.3 Sweden 4734.5** 880.3 4498.1** 859.8 Slovenia -8851.4** 1484.1 -8542.4** 1455.3 Austria 0(a) . 0(a) . I: Prof. Adm. High 11170.4** 410.6 II : Prof. Adm. Low 4972.6** 356.3 IIIa:Routine Nonmanual 2882.5** 385.3 IIIb:Lower Sales-Service 1109.0** 388.2 IVa:Selfempl with empl 6313.9** 540.8 IVb:Selfempl no empl 3168.4** 542.1 V :Manual Supervisors 2134.6** 542.8 VI :Skilled Worker 575.4 369.5 VIIb:Farm Labour -878.6 826.3 IVc:Selfempl Farmer -749.8 595.7 Unskilled workers 0(a) . (a) Ref. Category. (*) p < 0.05; (**) p < 0.01 a This parameter is set to zero because it is redundant. b Weighted Least Squares Regression - Weighted by weight2 dweight*pweight

82
Table 5.6 Wright (WR_DM) and household income B S.E. B S.E.
Costant 2329.6 1509.2 3848.9* 1548.6 Female -1783.1** 189.7 -823.1** 194.3 Male 0(a) . 0(a) . Age 213.0** 45.7 92.0 48.3 Age2 -1.5** .5 -.3 .6 Primary or first stage of basic 2308.1* 1029.3 2236.0* 1049.7 Lower secondary or second stage of basic 2919.8** 989.9 2672.8** 1010.5 Upper secondary 6131.7** 987.3 5381.8** 1008.3 Post secondary, non-tertiary 9265.0** 1028.8 8061.1** 1047.8 First stage of tertiary 13006.6** 996.9 10680.9** 1021.8 Second stage of tertiary 15025.9** 1073.4 11363.1** 1103.8 Not completed primary ed. 0(a) . 0(a) . Belgium 2553.0** 904.3 2683.6** 917.1 Switzerland 19444.5** 939.5 18768.0** 939.7 Czech Republic -8378.4** 938.6 -8031.3** 945.2 Germany 5388.9** 741.5 5443.4** 742.9 Denmark 11159.7** 986.8 10507.6** 986.7 Spain -3035.1** 808.5 -2970.7** 808.6 Finland 4440.4** 1030.0 4144.8** 1025.6 United Kingdom 13190.9** 748.1 12143.9** 750.5 Greece -4194.3** 975.2 -4637.5** 974.7 Hungary -8648.8** 948.8 -9194.2** 948.3 Ireland -585.8 1135.9 -1393.2 1149.6 Israel -4571.7** 1048.7 -5566.2** 1069.1 Italy 1265.2 769.6 222.3 773.4 Luxembourg 12106.9** 3163.4 11892.1** 3178.9 Netherlands 6137.3** 820.4 5277.5** 826.3 Norway 13616.0** 1007.0 12915.9** 1000.7 Poland -9507.0** 779.3 -9582.6** 779.6 Portugal -2055.8* 975.5 -2642.4** 974.6 Sweden 4734.5** 880.3 4285.2** 877.3 Slovenia -8851.4** 1484.1 -9041.3** 1498.0 Austria 0(a) . 0(a) . self empl w/10+ employees 13682.6** 864.6 self empl w/1-9 employees 6309.8** 434.1 self empl w/no empoyees 2067.0** 372.1 expert manager 9591.9** 664.0 expert supervisor 9127.2** 614.4 experts 4918.3** 515.0 skilled manager 6674.1** 486.8 skilled supervisor 2390.0** 402.8 skilled worker 564.3* 266.5 low skilled manager 5361.6** 613.6 low skilled supervisor 2696.5** 397.4 low skilled worker 0(a) . (a) Ref. Category. (*) p < 0.05; (**) p < 0.01 a This parameter is set to zero because it is redundant. b Weighted Least Squares Regression - Weighted by weight2 dweight*pweight
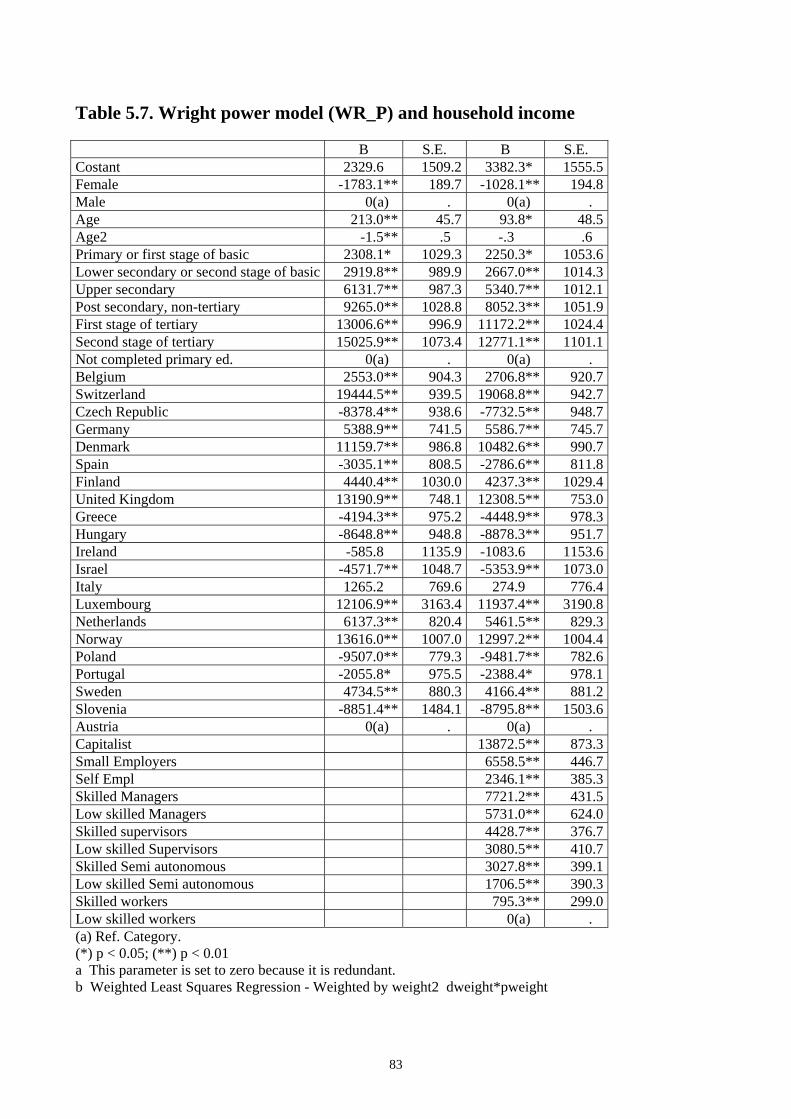
83
Table 5.7. Wright power model (WR_P) and household income
B S.E. B S.E. Costant 2329.6 1509.2 3382.3* 1555.5 Female -1783.1** 189.7 -1028.1** 194.8 Male 0(a) . 0(a) . Age 213.0** 45.7 93.8* 48.5 Age2 -1.5** .5 -.3 .6 Primary or first stage of basic 2308.1* 1029.3 2250.3* 1053.6 Lower secondary or second stage of basic 2919.8** 989.9 2667.0** 1014.3 Upper secondary 6131.7** 987.3 5340.7** 1012.1 Post secondary, non-tertiary 9265.0** 1028.8 8052.3** 1051.9 First stage of tertiary 13006.6** 996.9 11172.2** 1024.4 Second stage of tertiary 15025.9** 1073.4 12771.1** 1101.1 Not completed primary ed. 0(a) . 0(a) . Belgium 2553.0** 904.3 2706.8** 920.7 Switzerland 19444.5** 939.5 19068.8** 942.7 Czech Republic -8378.4** 938.6 -7732.5** 948.7 Germany 5388.9** 741.5 5586.7** 745.7 Denmark 11159.7** 986.8 10482.6** 990.7 Spain -3035.1** 808.5 -2786.6** 811.8 Finland 4440.4** 1030.0 4237.3** 1029.4 United Kingdom 13190.9** 748.1 12308.5** 753.0 Greece -4194.3** 975.2 -4448.9** 978.3 Hungary -8648.8** 948.8 -8878.3** 951.7 Ireland -585.8 1135.9 -1083.6 1153.6 Israel -4571.7** 1048.7 -5353.9** 1073.0 Italy 1265.2 769.6 274.9 776.4 Luxembourg 12106.9** 3163.4 11937.4** 3190.8 Netherlands 6137.3** 820.4 5461.5** 829.3 Norway 13616.0** 1007.0 12997.2** 1004.4 Poland -9507.0** 779.3 -9481.7** 782.6 Portugal -2055.8* 975.5 -2388.4* 978.1 Sweden 4734.5** 880.3 4166.4** 881.2 Slovenia -8851.4** 1484.1 -8795.8** 1503.6 Austria 0(a) . 0(a) . Capitalist 13872.5** 873.3 Small Employers 6558.5** 446.7 Self Empl 2346.1** 385.3 Skilled Managers 7721.2** 431.5 Low skilled Managers 5731.0** 624.0 Skilled supervisors 4428.7** 376.7 Low skilled Supervisors 3080.5** 410.7 Skilled Semi autonomous 3027.8** 399.1 Low skilled Semi autonomous 1706.5** 390.3 Skilled workers 795.3** 299.0 Low skilled workers 0(a) . (a) Ref. Category. (*) p < 0.05; (**) p < 0.01 a This parameter is set to zero because it is redundant. b Weighted Least Squares Regression - Weighted by weight2 dweight*pweight

84
Table 5.8. Esping Andersen’s class model (ESP) and household income B S.E. B S.E.
Costant 2329.6 1509.2 2575.2 1527.9 Female -1783.1** 189.7 -1416.0** 210.6 Male 0(a) . 0(a) . Age 213.0** 45.7 155.7** 46.1 Age2 -1.5** .5 -1.0 .5 Primary or first stage of basic 2308.1* 1029.3 1853.4 1016.4 Lower secondary or second stage of basic 2919.8** 989.9 1802.6 980.9 Upper secondary 6131.7** 987.3 3647.6** 985.5 Post secondary, non-tertiary 9265.0** 1028.8 5841.4** 1029.0 First stage of tertiary 13006.6** 996.9 8108.7** 1006.9 Second stage of tertiary 15025.9** 1073.4 8528.0** 1092.1 Not completed primary ed. 0(a) . 0(a) . Belgium 2553.0** 904.3 2615.5** 890.2 Switzerland 19444.5** 939.5 18990.9** 922.3 Czech Republic -8378.4** 938.6 -7795.3** 920.4 Germany 5388.9** 741.5 5616.6** 725.7 Denmark 11159.7** 986.8 11245.6** 966.6 Spain -3035.1** 808.5 -2378.0** 790.8 Finland 4440.4** 1030.0 4766.4** 1007.3 United Kingdom 13190.9** 748.1 12439.5** 731.9 Greece -4194.3** 975.2 -3922.2** 960.3 Hungary -8648.8** 948.8 -8710.3** 930.3 Ireland -585.8 1135.9 -887.3 1112.2 Israel -4571.7** 1048.7 -4621.1** 1039.3 Italy 1265.2 769.6 817.6 752.1 Luxembourg 12106.9** 3163.4 11503.1** 3137.6 Netherlands 6137.3** 820.4 5291.5** 803.8 Norway 13616.0** 1007.0 14179.2** 1020.3 Poland -9507.0** 779.3 -9297.4** 763.8 Portugal -2055.8* 975.5 -2673.9** 955.2 Sweden 4734.5** 880.3 4894.4** 860.6 Slovenia -8851.4** 1484.1 -8265.5** 1456.5 Austria 0(a) . 0(a) . Manager I Hi.serv. 12858.5** 508.4 Man.+Se1-3 dip 5727.2** 603.6 S.e 0 dip 3008.5** 765.1 Professionals 9162.3** 464.5 Technicians 3834.4** 527.8 Semi-professional 3747.1** 441.3 Skilled servant 2564.8** 513.8 Clerical Occupations 4404.4** 390.3 Sales Occupations 3319.4** 428.6 Skilled Manual workers 1597.5** 414.5 Unskilled Manual w. 1183.8** 444.9 Farm Workers -345.8 845.7 Farmers -152.7 627.0 Unskilled Servant 0(a) . (a) Ref. Category. (*) p < 0.05; (**) p < 0.01 a This parameter is set to zero because it is redundant. b Weighted Least Squares Regression - Weighted by weight2 dweight*pweight

85
Table 6.1-3. Alternative class models and unemployment experiences EGP Unemplo
yed last 5 years
Unemployed but
not last 5 year
Never Unemplo
yed
Total N*
I Prof. Adm. High 5.0 11.6 83.4 100.0 2101 II Prof. Adm. Low 9.5 14.3 76.2 100.0 3319 IIIa Routine non-manual 11.5 15.6 72.9 100.0 2117 IIIb Lower sales-service 14.9 14.8 70.3 100.0 1951 IVa Self-empl with empl 4.6 14.3 81.2 100.0 807 IVb Self-empl no empl 14.1 14.6 71.4 100.0 747 V Manual supervisors 7.4 16.0 76.6 100.0 620 VI Skilled workers 14.3 15.3 70.4 100.0 1932 VIIa Unskilled workers 22.3 19.4 58.3 100.0 2280 VIIb Farm labours 21.4 13.7 65.0 100.0 234 IVc Self-empl farmers 4.6 7.4 87.9 100.0 564 Total 12.0 14.8 73.2 100.0 16672 Table 6.1-3 continues. WR Unemplo
yed last 5 years
Unemployed but
not last 5 year
Never Unemplo
yed
Total N*
Self-empl. w/10+ empl. 4.6 5.0 90.4 100.0 218 Self-empl. w/1-9 empl. 6.0 14.6 79.4 100.0 1125 Self-empl. w/no empl. 11.9 12.0 76.1 100.0 1569 Expert managers 2.2 18.1 79.7 100.0 360 Expert supervisors 3.8 11.0 85.2 100.0 419 Experts 10.9 10.8 78.3 100.0 658 Skilled managers 3.8 9.6 86.7 100.0 638 Skilled supervisors 8.5 13.7 77.8 100.0 1073 Skilled workers 12.2 14.4 73.4 100.0 3559 Low-skilled managers 5.7 9.7 84.6 100.0 403 Low-skilled supervisors 10.0 18.7 71.2 100.0 1035 Low-skilled workers 17.2 17.6 65.2 100.0 5186 Total 11.9 14.8 73.3 100.0 16243
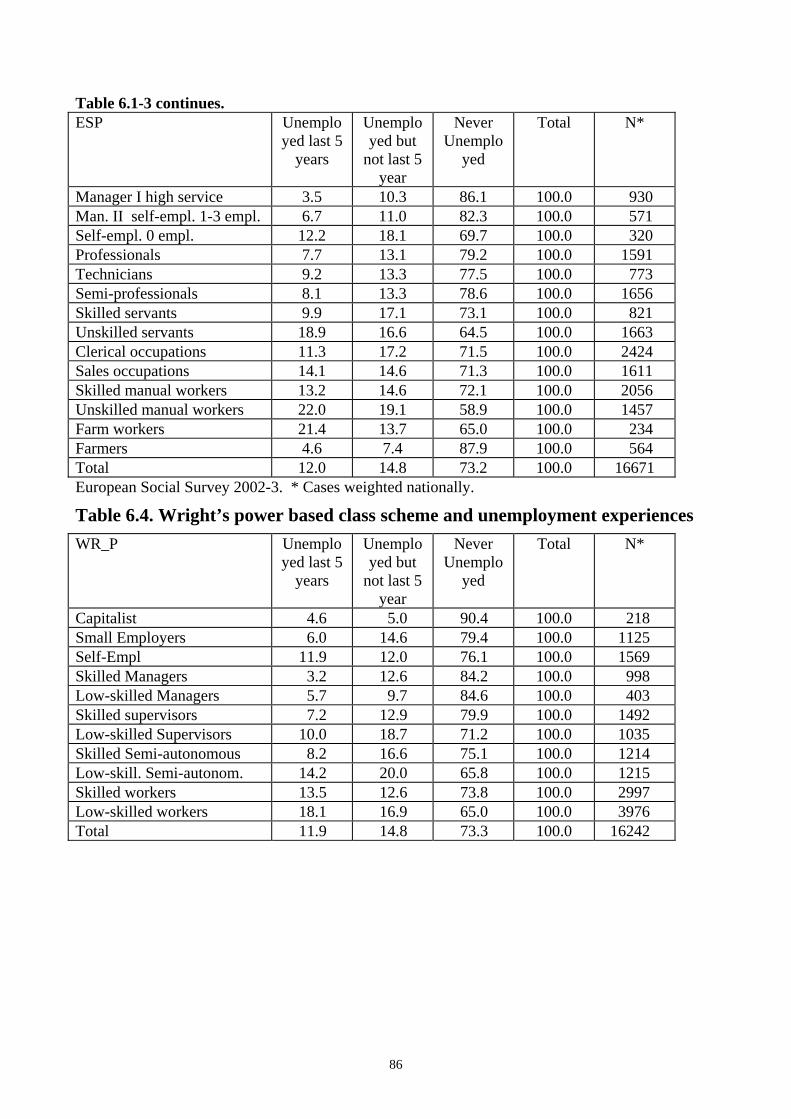
86
Table 6.1-3 continues. ESP Unemplo
yed last 5 years
Unemployed but
not last 5 year
Never Unemplo
yed
Total N*
Manager I high service 3.5 10.3 86.1 100.0 930 Man. II self-empl. 1-3 empl. 6.7 11.0 82.3 100.0 571 Self-empl. 0 empl. 12.2 18.1 69.7 100.0 320 Professionals 7.7 13.1 79.2 100.0 1591 Technicians 9.2 13.3 77.5 100.0 773 Semi-professionals 8.1 13.3 78.6 100.0 1656 Skilled servants 9.9 17.1 73.1 100.0 821 Unskilled servants 18.9 16.6 64.5 100.0 1663 Clerical occupations 11.3 17.2 71.5 100.0 2424 Sales occupations 14.1 14.6 71.3 100.0 1611 Skilled manual workers 13.2 14.6 72.1 100.0 2056 Unskilled manual workers 22.0 19.1 58.9 100.0 1457 Farm workers 21.4 13.7 65.0 100.0 234 Farmers 4.6 7.4 87.9 100.0 564 Total 12.0 14.8 73.2 100.0 16671 European Social Survey 2002-3. * Cases weighted nationally.
Table 6.4. Wright’s power based class scheme and unemployment experiences WR_P Unemplo
yed last 5 years
Unemployed but
not last 5 year
Never Unemplo
yed
Total N*
Capitalist 4.6 5.0 90.4 100.0 218 Small Employers 6.0 14.6 79.4 100.0 1125 Self-Empl 11.9 12.0 76.1 100.0 1569 Skilled Managers 3.2 12.6 84.2 100.0 998 Low-skilled Managers 5.7 9.7 84.6 100.0 403 Skilled supervisors 7.2 12.9 79.9 100.0 1492 Low-skilled Supervisors 10.0 18.7 71.2 100.0 1035 Skilled Semi-autonomous 8.2 16.6 75.1 100.0 1214 Low-skill. Semi-autonom. 14.2 20.0 65.8 100.0 1215 Skilled workers 13.5 12.6 73.8 100.0 2997 Low-skilled workers 18.1 16.9 65.0 100.0 3976 Total 11.9 14.8 73.3 100.0 16242
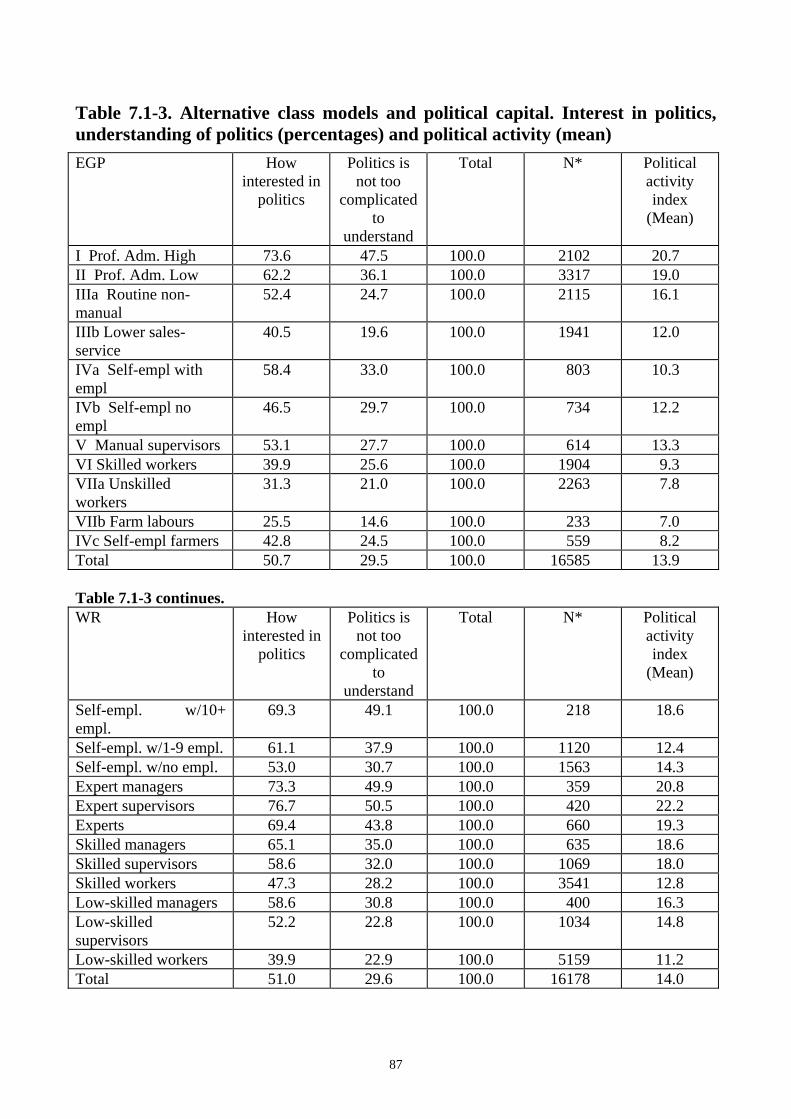
87
Table 7.1-3. Alternative class models and political capital. Interest in politics, understanding of politics (percentages) and political activity (mean) EGP How
interested in politics
Politics is not too
complicated to
understand
Total N* Political activity index
(Mean)
I Prof. Adm. High 73.6 47.5 100.0 2102 20.7 II Prof. Adm. Low 62.2 36.1 100.0 3317 19.0 IIIa Routine non-manual
52.4 24.7 100.0 2115 16.1
IIIb Lower sales-service
40.5 19.6 100.0 1941 12.0
IVa Self-empl with empl
58.4 33.0 100.0 803 10.3
IVb Self-empl no empl
46.5 29.7 100.0 734 12.2
V Manual supervisors 53.1 27.7 100.0 614 13.3 VI Skilled workers 39.9 25.6 100.0 1904 9.3 VIIa Unskilled workers
31.3 21.0 100.0 2263 7.8
VIIb Farm labours 25.5 14.6 100.0 233 7.0 IVc Self-empl farmers 42.8 24.5 100.0 559 8.2 Total 50.7 29.5 100.0 16585 13.9 Table 7.1-3 continues. WR How
interested in politics
Politics is not too
complicated to
understand
Total N* Political activity index
(Mean)
Self-empl. w/10+ empl.
69.3 49.1 100.0 218 18.6
Self-empl. w/1-9 empl. 61.1 37.9 100.0 1120 12.4 Self-empl. w/no empl. 53.0 30.7 100.0 1563 14.3 Expert managers 73.3 49.9 100.0 359 20.8 Expert supervisors 76.7 50.5 100.0 420 22.2 Experts 69.4 43.8 100.0 660 19.3 Skilled managers 65.1 35.0 100.0 635 18.6 Skilled supervisors 58.6 32.0 100.0 1069 18.0 Skilled workers 47.3 28.2 100.0 3541 12.8 Low-skilled managers 58.6 30.8 100.0 400 16.3 Low-skilled supervisors
52.2 22.8 100.0 1034 14.8
Low-skilled workers 39.9 22.9 100.0 5159 11.2 Total 51.0 29.6 100.0 16178 14.0
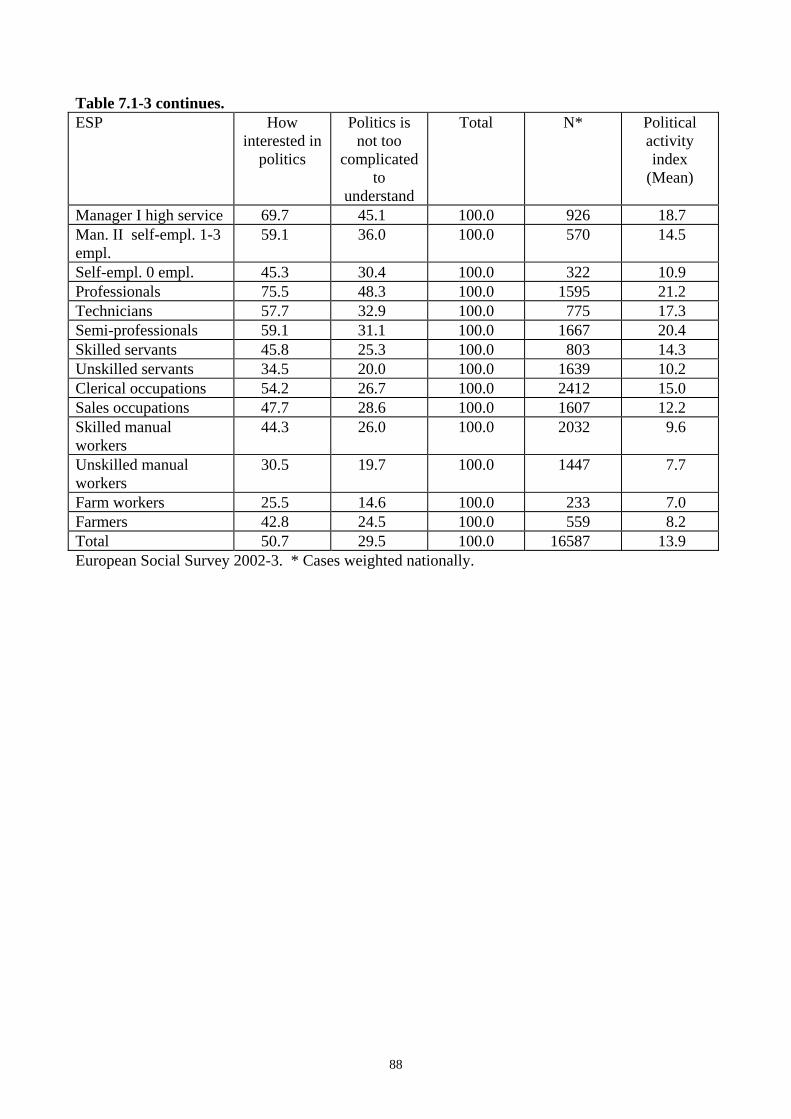
88
Table 7.1-3 continues. ESP How
interested in politics
Politics is not too
complicated to
understand
Total N* Political activity index
(Mean)
Manager I high service 69.7 45.1 100.0 926 18.7 Man. II self-empl. 1-3 empl.
59.1 36.0 100.0 570 14.5
Self-empl. 0 empl. 45.3 30.4 100.0 322 10.9 Professionals 75.5 48.3 100.0 1595 21.2 Technicians 57.7 32.9 100.0 775 17.3 Semi-professionals 59.1 31.1 100.0 1667 20.4 Skilled servants 45.8 25.3 100.0 803 14.3 Unskilled servants 34.5 20.0 100.0 1639 10.2 Clerical occupations 54.2 26.7 100.0 2412 15.0 Sales occupations 47.7 28.6 100.0 1607 12.2 Skilled manual workers
44.3 26.0 100.0 2032 9.6
Unskilled manual workers
30.5 19.7 100.0 1447 7.7
Farm workers 25.5 14.6 100.0 233 7.0 Farmers 42.8 24.5 100.0 559 8.2 Total 50.7 29.5 100.0 16587 13.9 European Social Survey 2002-3. * Cases weighted nationally.

89
Table 7.4. Wright’s power based class scheme and political capital. Interest in politics, understanding of politics (percentages) and political activity (mean) WR How
interested in politics
Politics is not too
complicated to
understand
Total N* Political activity index
(Mean)
Capitalist 69.3 49.1 100.0 218 18.6 Small Employers 61.1 37.9 100.0 1120 12.4 Self-Empl 53.0 30.7 100.0 1563 14.3 Skilled Managers 68.1 40.3 100.0 994 19.4 Low-skilled Managers 58.6 30.8 100.0 400 16.3 Skilled supervisors 63.7 37.2 100.0 1488 19.1 Low-skilled Supervisors
52.2 22.8 100.0 1034 14.8
Skilled Semi-autonomous
58.6 34.0 100.0 1216 18.0
Low-skill Semi-autonom.
47.3 25.4 100.0 1216 14.0
Skilled workers 47.6 29.4 100.0 2979 12.1 Low-skilled workers 37.7 22.1 100.0 3948 10.4 Total 51.0 29.6 100.0 16176 14.0 European Social Survey 2002-3. * Cases weighted nationally.
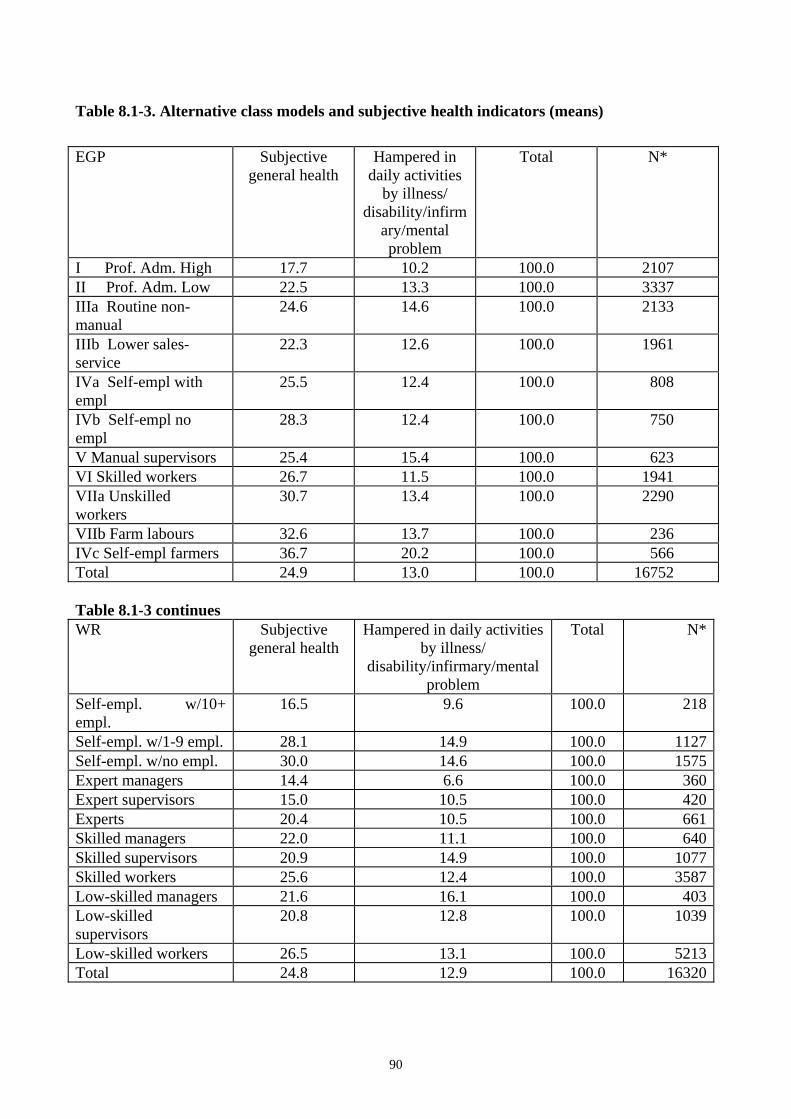
90
Table 8.1-3. Alternative class models and subjective health indicators (means) EGP Subjective
general health Hampered in
daily activities by illness/
disability/infirmary/mental problem
Total N*
I Prof. Adm. High 17.7 10.2 100.0 2107 II Prof. Adm. Low 22.5 13.3 100.0 3337 IIIa Routine non-manual
24.6 14.6 100.0 2133
IIIb Lower sales-service
22.3 12.6 100.0 1961
IVa Self-empl with empl
25.5 12.4 100.0 808
IVb Self-empl no empl
28.3 12.4 100.0 750
V Manual supervisors 25.4 15.4 100.0 623 VI Skilled workers 26.7 11.5 100.0 1941 VIIa Unskilled workers
30.7 13.4 100.0 2290
VIIb Farm labours 32.6 13.7 100.0 236 IVc Self-empl farmers 36.7 20.2 100.0 566 Total 24.9 13.0 100.0 16752 Table 8.1-3 continues WR Subjective
general health Hampered in daily activities
by illness/ disability/infirmary/mental
problem
Total N*
Self-empl. w/10+ empl.
16.5 9.6 100.0 218
Self-empl. w/1-9 empl. 28.1 14.9 100.0 1127Self-empl. w/no empl. 30.0 14.6 100.0 1575Expert managers 14.4 6.6 100.0 360Expert supervisors 15.0 10.5 100.0 420Experts 20.4 10.5 100.0 661Skilled managers 22.0 11.1 100.0 640Skilled supervisors 20.9 14.9 100.0 1077Skilled workers 25.6 12.4 100.0 3587Low-skilled managers 21.6 16.1 100.0 403Low-skilled supervisors
20.8 12.8 100.0 1039
Low-skilled workers 26.5 13.1 100.0 5213Total 24.8 12.9 100.0 16320

91
Table 8.1-3 continues ESP Subjective
general health
Hampered in daily activities
by illness/ disability/infirm
ary/mental problem
Total N*
Manager I high service 16.1 10.7 100.0 932 Man. II self-empl. 1-3 empl.
22.2 13.0 100.0 570
Self-empl. 0 empl. 29.8 13.4 100.0 321 Professionals 19.2 10.2 100.0 1597 Technicians 22.2 14.3 100.0 776 Semi-professionals 23.6 13.5 100.0 1671 Skilled servants 24.2 14.6 100.0 822 Unskilled servants 29.1 15.0 100.0 1671 Clerical occupations 24.5 14.3 100.0 2429 Sales occupations 23.3 10.7 100.0 1617 Skilled man. workers 27.3 12.5 100.0 2065 Unskilled man workers 28.2 11.8 100.0 1462 Farm workers 32.6 13.7 100.0 234 Farmers 36.7 20.2 100.0 563 Total 24.9 13.1 100.0 16730 European Social Survey 2002-3. * Cases weighted nationally.
Table 8.4. Alternative class models and subjective health indicators (means)
WR Subjective general health
Hampered in daily activities by illness/
disability/infirmary/mental problem
Total N*
Capitalist 16.5 9.6 100.0 218 Small Employers 28.1 14.9 100.0 1127 Self-Empl 30.0 14.6 100.0 1575 Skilled Managers 19.3 9.5 100.0 1000 Low-skilled Managers 21.6 16.1 100.0 403 Skilled supervisors 19.3 13.6 100.0 1499 Low-skilled Supervisors
20.8 12.8 100.0 1039
Skilled Semi-autonomous
22.6 14.0 100.0 1222
Low-skill. Semi-autonom.
24.7 14.3 100.0 1222
Skilled workers 25.7 11.4 100.0 3021 Low-skilled workers 27.1 12.7 100.0 3997 Total 24.8 12.9 100.0 16323 European Social Survey 2002-3. * Cases weighted nationally.

92
Appendix II – EGP classes (9.1-9.4)
Table 9.1. Ganzeboom’s EGP Classes versus ours. Distributions based on 21 ESS countries 2002/3 (weighted) EGP Ganzebom Our I Prof. Adm. High 15.1 12.6 II Prof. Adm. Low 23.2 19.9 IIIa Routine non-manual 9.5 12.7 IIIb Lower sales-service 9.3 11.7 IVa Self-empl with empl 4.8 4.8 IVb Self-empl no empl 5.0 4.5 V Manual supervisors 3.6 3.7 VI Skilled workers 11.4 11.6 VIIa Unskilled workers 13.3 13.7 VIIb Farm labours 1.2 1.4 IVc Self-empl farmers 3.5 3.4 Total 100.0 100.0 N* 16757 16759European Social Survey 2002-3. * Cases weighted nationally.

93
Table 9.2. EGP Trento by EGP Ganzeboom original. European Social Survey 2002/3 . 21 countries (weighted)
I Higher cont-
rollers
II Lower
control-ers
IIIa Routine
non-manual
IIIb Lower sales
service
IVa Selfempl
with empl
IVb Selfempl no empl
V Manual super-visors
VI Skilled workers
VIIa Unskill-
ed workers
VIIb Farm
labours
IVc Self-empl
farmers
Total N*
I Prof. Adm. High
2103 0 0 0 0 0 0 0 0 0 2 100 2105
II Prof. Adm. Low
271 3068 0 0 0 0 0 0 0 0 0 100 3339
IIIa Routine non-manual
79 461 1594 0 0 0 0 0 0 0 0 100 2134
IIIb Lower sales-service
34 365 0 1563 0 0 0 0 0 0 0 100 1962
IVa Self-empl with empl
36 0 0 0 772 0 0 0 0 0 0 100 808
IVb Self-empl no empl
0 0 0 0 0 750 0 0 0 0 0 100 750
V Manual supervisors
2 0 0 0 18 0 603 0 0 0 0 100 623
VI Skilled workers
0 0 0 0 8 36 0 1898 0 0 0 100 1942
VIIa Unskilled workers
0 0 0 0 0 50 0 14 2230 0 0 100 2294
VIIb Farm labours
0 0 0 0 0 0 0 0 0 209 27 100 236
IVc Self-empl farmers
0 0 0 0 0 0 0 0 0 0 566 100 566
N* 2525 3894 1594 1563 798 836 603 1912 2230 209 595 100 16759 European Social Survey 2002-3. * Cases weighted nationally.
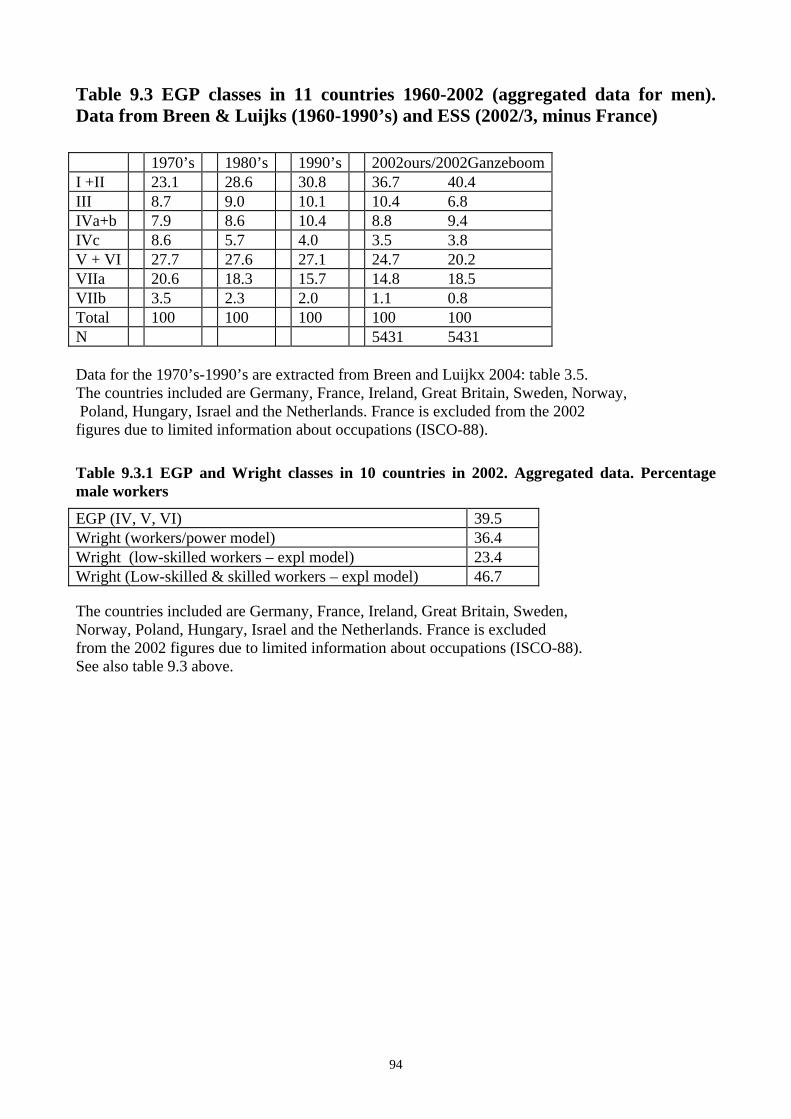
94
Table 9.3 EGP classes in 11 countries 1960-2002 (aggregated data for men). Data from Breen & Luijks (1960-1990’s) and ESS (2002/3, minus France) 1970’s 1980’s 1990’s 2002ours/2002Ganzeboom I +II 23.1 28.6 30.8 36.7 40.4 III 8.7 9.0 10.1 10.4 6.8 IVa+b 7.9 8.6 10.4 8.8 9.4 IVc 8.6 5.7 4.0 3.5 3.8 V + VI 27.7 27.6 27.1 24.7 20.2 VIIa 20.6 18.3 15.7 14.8 18.5 VIIb 3.5 2.3 2.0 1.1 0.8 Total 100 100 100 100 100 N 5431 5431 Data for the 1970’s-1990’s are extracted from Breen and Luijkx 2004: table 3.5. The countries included are Germany, France, Ireland, Great Britain, Sweden, Norway, Poland, Hungary, Israel and the Netherlands. France is excluded from the 2002 figures due to limited information about occupations (ISCO-88).
Table 9.3.1 EGP and Wright classes in 10 countries in 2002. Aggregated data. Percentage male workers
EGP (IV, V, VI) 39.5 Wright (workers/power model) 36.4 Wright (low-skilled workers – expl model) 23.4 Wright (Low-skilled & skilled workers – expl model) 46.7 The countries included are Germany, France, Ireland, Great Britain, Sweden, Norway, Poland, Hungary, Israel and the Netherlands. France is excluded from the 2002 figures due to limited information about occupations (ISCO-88). See also table 9.3 above.

95
Table 9.4 EGP classes in 10 European countries. Frequencies based on our program and Ganzeboom’s EGP program. ESS Total @egp10ir Our Table
Frequen
cy Percent Valid
PercentCumulative
Percent 1.00 I+II 3067 32.8 33.8 33.8
2.00 IIIab
949 10.1 10.4 44.2
3.00 IVab
1016 10.9 11.2 55.4
4.00 IVc
385 4.1 4.2 59.7
5.00 V+VI
2087 22.3 23.0 82.7
6.00 VIIa
1429 15.3 15.7 98.4
7.00 VIIb
146 1.6 1.6 100.0
Valid
Total 9080 97.1 100.0
Missing
System 269 2.9
Total 9349 100.0

96
@egp10gr Ganzeboom Table
Frequen
cy Percent Valid
PercentCumulative
Percent 1.00 I+II 3385 36.2 37.3 37.3
2.00 IIIab
654 7.0 7.2 44.5
3.00 IVab
1069 11.4 11.8 56.3
4.00 IVc
411 4.4 4.5 60.8
5.00 V+VI
1668 17.8 18.4 79.2
6.00 VIIa
1770 18.9 19.5 98.6
7.00 VIIb
123 1.3 1.4 100.0
Valid
Total 9078 97.1 100.0
Missing
System 271 2.9
Total 9349 100.0
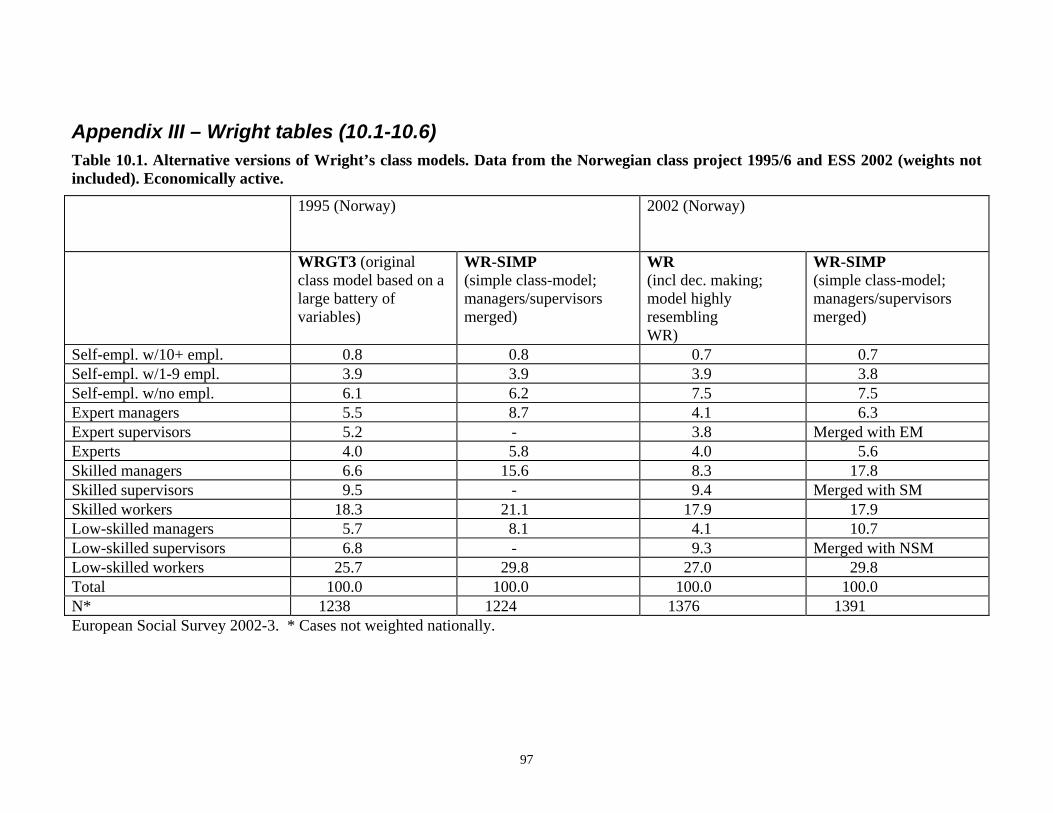
97
Appendix III – Wright tables (10.1-10.6) Table 10.1. Alternative versions of Wright’s class models. Data from the Norwegian class project 1995/6 and ESS 2002 (weights not included). Economically active.
1995 (Norway) 2002 (Norway)
WRGT3 (original class model based on a large battery of variables)
WR-SIMP (simple class-model; managers/supervisors merged)
WR (incl dec. making; model highly resembling WR)
WR-SIMP (simple class-model; managers/supervisors merged)
Self-empl. w/10+ empl. 0.8 0.8 0.7 0.7 Self-empl. w/1-9 empl. 3.9 3.9 3.9 3.8 Self-empl. w/no empl. 6.1 6.2 7.5 7.5 Expert managers 5.5 8.7 4.1 6.3 Expert supervisors 5.2 - 3.8 Merged with EM Experts 4.0 5.8 4.0 5.6 Skilled managers 6.6 15.6 8.3 17.8 Skilled supervisors 9.5 - 9.4 Merged with SM Skilled workers 18.3 21.1 17.9 17.9 Low-skilled managers 5.7 8.1 4.1 10.7 Low-skilled supervisors 6.8 - 9.3 Merged with NSM Low-skilled workers 25.7 29.8 27.0 29.8 Total 100.0 100.0 100.0 100.0 N* 1238 1224 1376 1391 European Social Survey 2002-3. * Cases not weighted nationally.
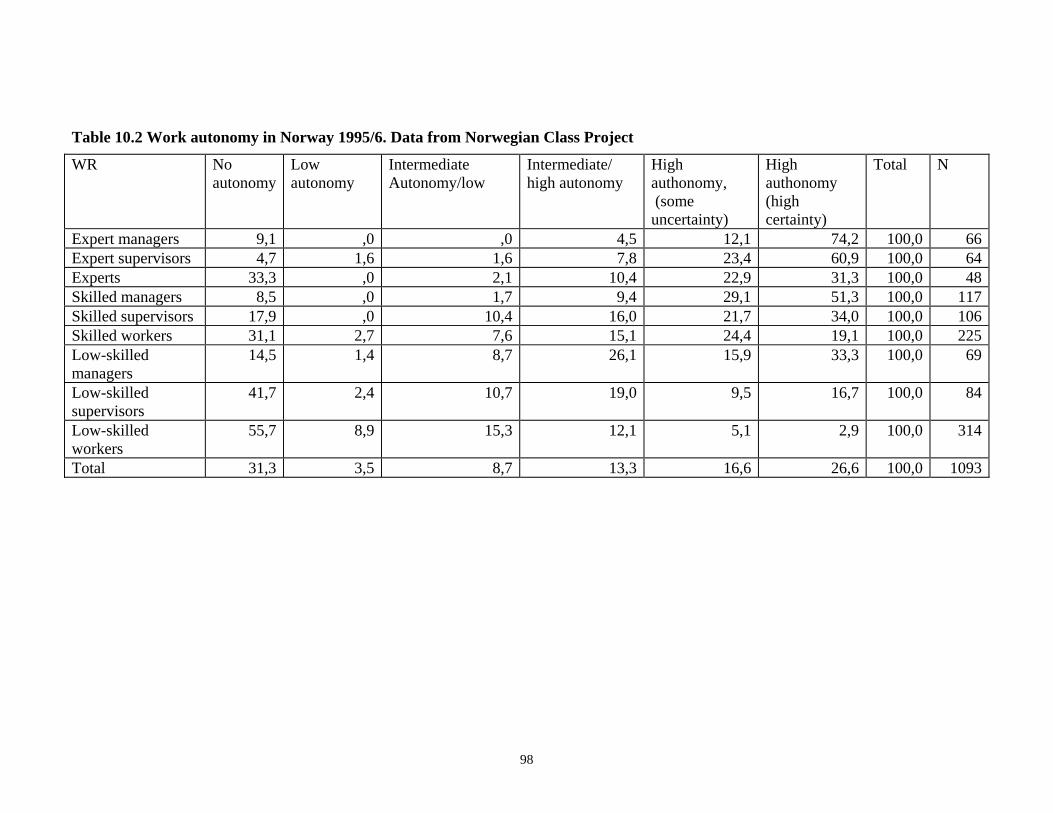
98
Table 10.2 Work autonomy in Norway 1995/6. Data from Norwegian Class Project
WR No autonomy
Low autonomy
Intermediate Autonomy/low
Intermediate/ high autonomy
High authonomy, (some uncertainty)
High authonomy (high certainty)
Total N
Expert managers 9,1 ,0 ,0 4,5 12,1 74,2 100,0 66 Expert supervisors 4,7 1,6 1,6 7,8 23,4 60,9 100,0 64 Experts 33,3 ,0 2,1 10,4 22,9 31,3 100,0 48 Skilled managers 8,5 ,0 1,7 9,4 29,1 51,3 100,0 117 Skilled supervisors 17,9 ,0 10,4 16,0 21,7 34,0 100,0 106 Skilled workers 31,1 2,7 7,6 15,1 24,4 19,1 100,0 225 Low-skilled managers
14,5 1,4 8,7 26,1 15,9 33,3 100,0 69
Low-skilled supervisors
41,7 2,4 10,7 19,0 9,5 16,7 100,0 84
Low-skilled workers
55,7 8,9 15,3 12,1 5,1 2,9 100,0 314
Total 31,3 3,5 8,7 13,3 16,6 26,6 100,0 1093

99
Table 10.3 Work autonomy in Norway 2002. Data from European Social Survey WR_P No influ
ence 1 2 3 4 5 6 7 8 9 Complete
control Total N*
Expert managers ,0 ,0 ,0 ,0 ,0 1,7 ,0 5,2 17,2 39,7 36,2 100,0 58 Expert supervisors ,0 ,0 1,9 ,0 ,0 ,0 3,8 7,5 37,7 30,2 18,9 100,0 53 Experts 1,8 ,0 7,1 1,8 5,4 8,9 7,1 14,3 30,4 12,5 10,7 100,0 56 Skilled managers ,0 ,0 ,0 ,0 ,9 ,9 ,9 3,5 21,1 31,6 41,2 100,0 114 Skilled supervisors 2,3 ,0 1,5 1,5 5,4 6,9 1,5 15,4 30,0 17,7 17,7 100,0 130 Skilled workers 6,6 2,5 11,1 7,8 9,0 10,7 7,4 14,3 14,3 8,6 7,8 100,0 244 Low-skilled managers 1,8 ,0 ,0 ,0 3,5 7,0 3,5 7,0 22,8 14,0 40,4 100,0 57 Low-skilled supervisors ,0 ,8 ,0 ,8 ,0 3,1 1,6 10,1 27,1 20,9 35,7 100,0 129 Low-skilled workers 9,9 7,5 8,3 7,2 6,4 13,9 5,4 11,5 15,8 4,0 9,9 100,0 373 Total 4,8 2,9 5,4 4,1 4,9 8,4 4,2 11,0 20,8 14,5 19,1 100,0 1214

100
Table 10.4: The class structure in Sweden, Norway, Finland and Denmark in the 1980’s and 1990’s. Economically active 18-65 years. Wright Project Data
1980-84 1991-95 Swe Norw Finl Denm Swe Norw Finl Denm
Capitalists/ small employers
5,0 3,4 4,4 6,3 3,5 4,7 3,4 -
Self empl. 5,1 9,5 16,6 4,0 5,9 6,1 16,6 - Expert& skilled managers/ supervisors
14,8 18,8 13,2 16,8 21,2 28,8 18,1 -
Low-skilled managers/ supervisors
6,4 8,3 4,0 8,4 10,2 12,4 2,1 -
Experts 2,6 4,8 1,8 2,8 5,4 4,0 5,3 - Skilled workers 18,9 21,3 20,2 20,1 23,5 18,3 24,4 - Low- skilled workers 47,0 34,0 39,6 41,6 30,3 25,7 30,0 - Total 100 100 100 100 100,0 100,0 100,0 - (N) 1145 1636 989 1047 1156 1785 917 -
Table 10.5: The class structure in the USA, United Kingdom and Germany in the 1980’s and 1990’s. Economically active 18-65 years. Wright Project Data
1983-85 1991-1992 USA United
King. Germany (West)
USA United King.1
Germany
Capitalists/ small employers
7,9 7,3 6,2 9,1 5,7 -
Self Empl. 6,1 6,7 5,7 9,0 9,5 - Expert &skilled managers/ supervisors
23,5 18,8 13,0 22,3 24,9 -
Low-skilled managers/ supervisors
9,7 7,4 13,4 8,9 8,8 -
Experts 3,9 1,5 1,2 4,2 2,3 - Skilled workers 14,1 16,4 11,3 13,5 17,3 - Low-skilled workers
34,7 41,9 49,2 32,9 31,4 -
Total 100 100 100 100,0 100,0 - (N) 1681 1164 1521 1663 682 - 1The data from the U.K are from the Social Justice Project (ICPSR ), the remaining data from Wright’s comparative class project

101
Table 10.6: The class structure in Sweden, Norway, Finland, United Kingdom 2002. Economically active 18-65 years. ESS Data
2002 (ESS)1
Sweden Norway Finland Denm. Germany United King.
Capitalists/small employers
4,4 4,6 5,6 5,3 6,7 4,0
Self empl 6,4 7,3 7,5 5,0 6,7 9,0Expert managers 3,9 4,1 2,6 3,3 1,9 2,9Expert supervisors 5,8 3,8 3,0 3,2 2,9 4,0Skilled managers 6,6 8,5 4,3 7,6 2,5 8,6Skilled supervisors 9,5 9,6 8,4 9,4 5,8 9,9Lowskilled managers 3,6 4,1 1,8 4,0 2,1 3,7Lowskilled supervisors
8,5 9,1 7,1 10,4 5,9 10,4
Experts 4,7 4,0 5,5 3,7 4,4 4,3Skilled workers 16,9 18,0 26,0 20,4 26,8 13,3Low-skilled workers 29,7 26,9 28,3 27,8 34,4 29,8 Total 100 100 100 100 100 100 (N) 1201 1351 1046 904 1468
1112 * The category ‘skilled manager/supervisors’ not included initially. (Norway, Sweden, Finland, United Kingdom, Germany and Denmark. ESS 2002 (USA not included 2002. Class variable used: WR)
1 The results from the ESS data material is including only 18-65 year olds, and is weighted by dweight (that is design weight).

102
Appendix IV - Economic indicators (11-12.d)
Table 11. Response rate to the ESS question on household income in different countries
No answer
Information N.
Austria 35.4 64.6 370 Belgium 17.1 82.9 461 Switzerland 21.0 79.0 391 Czech Republic 29.4 70.6 479 Germany 18.1 81.9 3755 Denmark 11.0 89.0 283 Spain 40.8 59.2 1440 Finland 5.7 94.3 228 United Kingdom 11.4 88.6 2793 Greece 29.2 70.8 380 Hungary 14.0 86.0 358 Ireland 12.9 87.1 171 Israel 22.7 77.3 260 Italy 43.4 56.6 2471 Luxembourg 27.8 72.2 18 Netherlands 11.4 88.6 806 Norway 2.1 97.9 240 Poland 15.8 84.2 1347 Portugal 32.4 67.6 445 Sweden 3.1 96.9 453 Slovenia 12.5 87.5 80 N* 22.4 77.6 17229 European Social Survey 2002-3. * Cases weighted nationally.

103
Table 12a. Equivalent family income (dependent variable). Controlled for sex, country and EGP class (independent variables). ESS 2002/3. Anova Regression
EGP B S.E. B S.E. Costant 2329.6 1509.2 4788.0** 1514.4 Female -1783.1** 189.7 -1408.2** 204.0 Male 0(a) . 0(a) . Age 213.0** 45.7 104.4* 46.3 Age2 -1.5** .5 -.5 .5 Primary or first stage of basic 2308.1* 1029.3 1854.8* 1015.5 Lower secondary or second stage of basic 2919.8** 989.9 1701.5 980.4 Upper secondary 6131.7** 987.3 3426.6** 985.4 Post secondary, non-tertiary 9265.0** 1028.8 5529.9** 1028.9 First stage of tertiary 13006.6** 996.9 7223.3** 1006.7 Second stage of tertiary 15025.9** 1073.4 7397.4** 1090.7 Not completed primary ed. 0(a) . 0(a) . Belgium 2553.0** 904.3 2248.8* 890.5 Switzerland 19444.5** 939.5 18638.2** 921.2 Czech Republic -8378.4** 938.6 -7879.8** 919.8 Germany 5388.9** 741.5 5468.4** 724.9 Denmark 11159.7** 986.8 10874.6** 965.6 Spain -3035.1** 808.5 -2847.7** 790.5 Finland 4440.4** 1030.0 4448.3** 1006.3 United Kingdom 13190.9** 748.1 12102.9** 731.3 Greece -4194.3** 975.2 -4134.0** 959.3 Hungary -8648.8** 948.8 -8952.9** 929.4 Ireland -585.8 1135.9 -1185.5 1111.5 Israel -4571.7** 1048.7 -5270.5** 1039.0 Italy 1265.2 769.6 416.3 752.9 Luxembourg 12106.9** 3163.4 11287.6** 3135.7 Netherlands 6137.3** 820.4 4829.0** 804.0 Norway 13616.0** 1007.0 13638.0** 1019.1 Poland -9507.0** 779.3 -9329.6** 762.9 Portugal -2055.8* 975.5 -3169.2** 955.3 Sweden 4734.5** 880.3 4498.1** 859.8 Slovenia -8851.4** 1484.1 -8542.4** 1455.3 Austria 0(a) . 0(a) . I: Prof. Adm. High 11170.4** 410.6 II: Prof. Adm. Low 4972.6** 356.3 IIIa:Routine Nonmanual 2882.5** 385.3 IIIb:Lower Sales-Service 1109.0** 388.2 IVa:Selfempl with empl 6313.9** 540.8 IVb:Selfempl no empl 3168.4** 542.1 V :Manual Supervisors 2134.6** 542.8 VI :Skilled Worker 575.4 369.5 VIIb:Farm Labour -878.6 826.3 IVc:Selfempl Farmer -749.8 595.7 Unskilled workers 0(a) . (a) Ref. Category. (*) p < 0.05; (**) p < 0.01 a This parameter is set to zero because it is redundant. b Weighted Least Squares Regression - Weighted by weight2 dweight*pweight
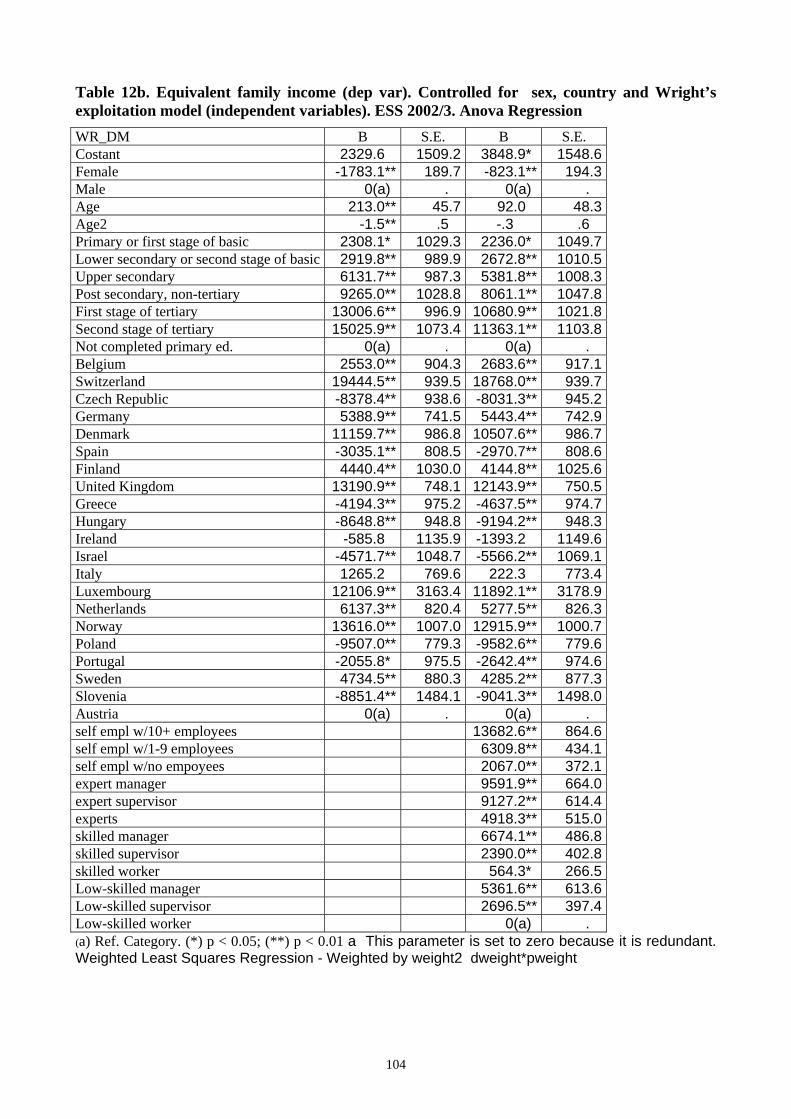
104
Table 12b. Equivalent family income (dep var). Controlled for sex, country and Wright’s exploitation model (independent variables). ESS 2002/3. Anova Regression WR_DM B S.E. B S.E. Costant 2329.6 1509.2 3848.9* 1548.6 Female -1783.1** 189.7 -823.1** 194.3 Male 0(a) . 0(a) . Age 213.0** 45.7 92.0 48.3 Age2 -1.5** .5 -.3 .6 Primary or first stage of basic 2308.1* 1029.3 2236.0* 1049.7 Lower secondary or second stage of basic 2919.8** 989.9 2672.8** 1010.5 Upper secondary 6131.7** 987.3 5381.8** 1008.3 Post secondary, non-tertiary 9265.0** 1028.8 8061.1** 1047.8 First stage of tertiary 13006.6** 996.9 10680.9** 1021.8 Second stage of tertiary 15025.9** 1073.4 11363.1** 1103.8 Not completed primary ed. 0(a) . 0(a) . Belgium 2553.0** 904.3 2683.6** 917.1 Switzerland 19444.5** 939.5 18768.0** 939.7 Czech Republic -8378.4** 938.6 -8031.3** 945.2 Germany 5388.9** 741.5 5443.4** 742.9 Denmark 11159.7** 986.8 10507.6** 986.7 Spain -3035.1** 808.5 -2970.7** 808.6 Finland 4440.4** 1030.0 4144.8** 1025.6 United Kingdom 13190.9** 748.1 12143.9** 750.5 Greece -4194.3** 975.2 -4637.5** 974.7 Hungary -8648.8** 948.8 -9194.2** 948.3 Ireland -585.8 1135.9 -1393.2 1149.6 Israel -4571.7** 1048.7 -5566.2** 1069.1 Italy 1265.2 769.6 222.3 773.4 Luxembourg 12106.9** 3163.4 11892.1** 3178.9 Netherlands 6137.3** 820.4 5277.5** 826.3 Norway 13616.0** 1007.0 12915.9** 1000.7 Poland -9507.0** 779.3 -9582.6** 779.6 Portugal -2055.8* 975.5 -2642.4** 974.6 Sweden 4734.5** 880.3 4285.2** 877.3 Slovenia -8851.4** 1484.1 -9041.3** 1498.0 Austria 0(a) . 0(a) . self empl w/10+ employees 13682.6** 864.6 self empl w/1-9 employees 6309.8** 434.1 self empl w/no empoyees 2067.0** 372.1 expert manager 9591.9** 664.0 expert supervisor 9127.2** 614.4 experts 4918.3** 515.0 skilled manager 6674.1** 486.8 skilled supervisor 2390.0** 402.8 skilled worker 564.3* 266.5 Low-skilled manager 5361.6** 613.6 Low-skilled supervisor 2696.5** 397.4 Low-skilled worker 0(a) . (a) Ref. Category. (*) p < 0.05; (**) p < 0.01 a This parameter is set to zero because it is redundant. Weighted Least Squares Regression - Weighted by weight2 dweight*pweight
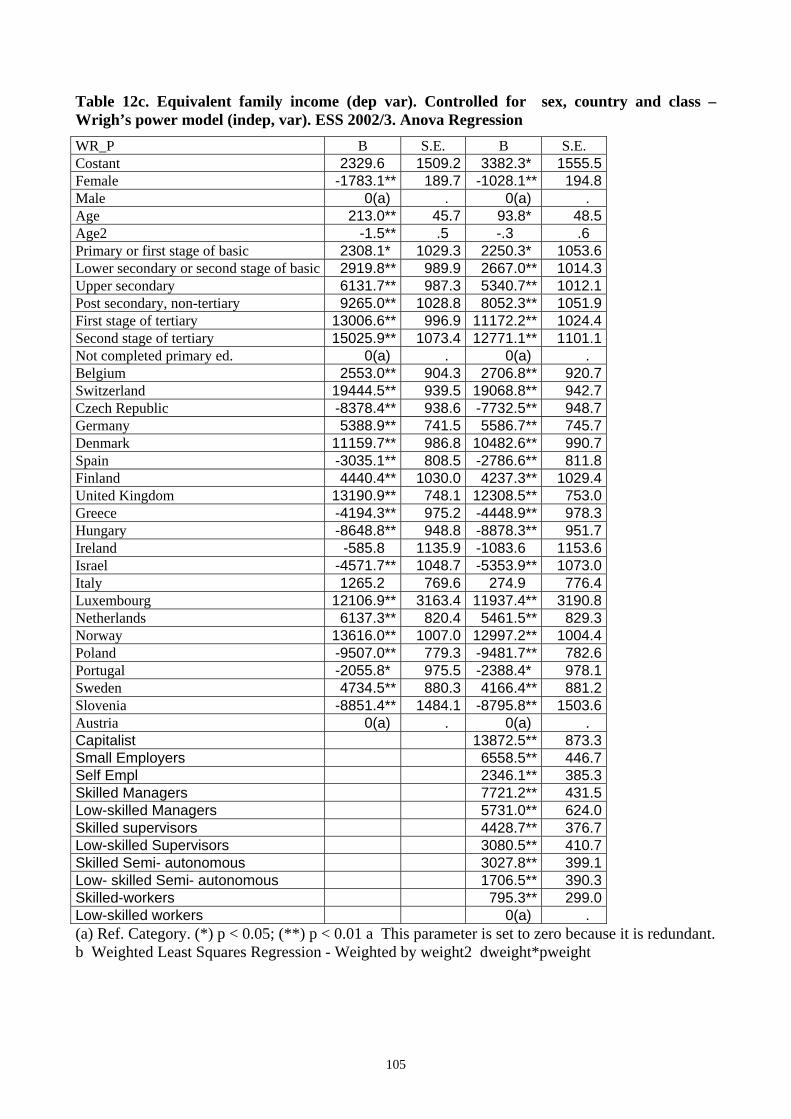
105
Table 12c. Equivalent family income (dep var). Controlled for sex, country and class – Wrigh’s power model (indep, var). ESS 2002/3. Anova Regression WR_P B S.E. B S.E. Costant 2329.6 1509.2 3382.3* 1555.5 Female -1783.1** 189.7 -1028.1** 194.8 Male 0(a) . 0(a) . Age 213.0** 45.7 93.8* 48.5 Age2 -1.5** .5 -.3 .6 Primary or first stage of basic 2308.1* 1029.3 2250.3* 1053.6 Lower secondary or second stage of basic 2919.8** 989.9 2667.0** 1014.3 Upper secondary 6131.7** 987.3 5340.7** 1012.1 Post secondary, non-tertiary 9265.0** 1028.8 8052.3** 1051.9 First stage of tertiary 13006.6** 996.9 11172.2** 1024.4 Second stage of tertiary 15025.9** 1073.4 12771.1** 1101.1 Not completed primary ed. 0(a) . 0(a) . Belgium 2553.0** 904.3 2706.8** 920.7 Switzerland 19444.5** 939.5 19068.8** 942.7 Czech Republic -8378.4** 938.6 -7732.5** 948.7 Germany 5388.9** 741.5 5586.7** 745.7 Denmark 11159.7** 986.8 10482.6** 990.7 Spain -3035.1** 808.5 -2786.6** 811.8 Finland 4440.4** 1030.0 4237.3** 1029.4 United Kingdom 13190.9** 748.1 12308.5** 753.0 Greece -4194.3** 975.2 -4448.9** 978.3 Hungary -8648.8** 948.8 -8878.3** 951.7 Ireland -585.8 1135.9 -1083.6 1153.6 Israel -4571.7** 1048.7 -5353.9** 1073.0 Italy 1265.2 769.6 274.9 776.4 Luxembourg 12106.9** 3163.4 11937.4** 3190.8 Netherlands 6137.3** 820.4 5461.5** 829.3 Norway 13616.0** 1007.0 12997.2** 1004.4 Poland -9507.0** 779.3 -9481.7** 782.6 Portugal -2055.8* 975.5 -2388.4* 978.1 Sweden 4734.5** 880.3 4166.4** 881.2 Slovenia -8851.4** 1484.1 -8795.8** 1503.6 Austria 0(a) . 0(a) . Capitalist 13872.5** 873.3 Small Employers 6558.5** 446.7 Self Empl 2346.1** 385.3 Skilled Managers 7721.2** 431.5 Low-skilled Managers 5731.0** 624.0 Skilled supervisors 4428.7** 376.7 Low-skilled Supervisors 3080.5** 410.7 Skilled Semi- autonomous 3027.8** 399.1 Low- skilled Semi- autonomous 1706.5** 390.3 Skilled-workers 795.3** 299.0 Low-skilled workers 0(a) . (a) Ref. Category. (*) p < 0.05; (**) p < 0.01 a This parameter is set to zero because it is redundant. b Weighted Least Squares Regression - Weighted by weight2 dweight*pweight

106
Table 12d. Equivalent family income (dependent variable). Controlled for sex, country and Esping Andersen’s class scheme (independent variable.). ESS 2002/3. Anova Regression ESP B S.E. B S.E. Costant 2329.6 1509.2 2575.2 1527.9 Female -1783.1** 189.7 -1416.0** 210.6 Male 0(a) . 0(a) . Age 213.0** 45.7 155.7** 46.1 Age2 -1.5** .5 -1.0 .5 Primary or first stage of basic 2308.1* 1029.3 1853.4 1016.4 Lower secondary or second stage of basic 2919.8** 989.9 1802.6 980.9 Upper secondary 6131.7** 987.3 3647.6** 985.5 Post secondary, non-tertiary 9265.0** 1028.8 5841.4** 1029.0 First stage of tertiary 13006.6** 996.9 8108.7** 1006.9 Second stage of tertiary 15025.9** 1073.4 8528.0** 1092.1 Not completed primary ed. 0(a) . 0(a) . Belgium 2553.0** 904.3 2615.5** 890.2 Switzerland 19444.5** 939.5 18990.9** 922.3 Czech Republic -8378.4** 938.6 -7795.3** 920.4 Germany 5388.9** 741.5 5616.6** 725.7 Denmark 11159.7** 986.8 11245.6** 966.6 Spain -3035.1** 808.5 -2378.0** 790.8 Finland 4440.4** 1030.0 4766.4** 1007.3 United Kingdom 13190.9** 748.1 12439.5** 731.9 Greece -4194.3** 975.2 -3922.2** 960.3 Hungary -8648.8** 948.8 -8710.3** 930.3 Ireland -585.8 1135.9 -887.3 1112.2 Israel -4571.7** 1048.7 -4621.1** 1039.3 Italy 1265.2 769.6 817.6 752.1 Luxembourg 12106.9** 3163.4 11503.1** 3137.6 Netherlands 6137.3** 820.4 5291.5** 803.8 Norway 13616.0** 1007.0 14179.2** 1020.3 Poland -9507.0** 779.3 -9297.4** 763.8 Portugal -2055.8* 975.5 -2673.9** 955.2 Sweden 4734.5** 880.3 4894.4** 860.6 Slovenia -8851.4** 1484.1 -8265.5** 1456.5 Austria 0(a) . 0(a) . Manager I Hi.serv. 12858.5** 508.4 Man.+Se1-3 dip 5727.2** 603.6 S.e 0 dip 3008.5** 765.1 Professionals 9162.3** 464.5 Technicians 3834.4** 527.8 Semi-professional 3747.1** 441.3 Skilled servant 2564.8** 513.8 Clerical Occupations 4404.4** 390.3 Sales Occupations 3319.4** 428.6 Skilled Manual workers 1597.5** 414.5 Unskilled Manual w. 1183.8** 444.9 Farm Workers -345.8 845.7 Farmers -152.7 627.0 Unskilled Servant 0(a) . (a) Ref. Category. (*) p < 0.05; (**) p < 0.01 a This parameter is set to zero because it is redundant. b Weighted Least Squares Regression - Weighted by weight2 dweight*pweight

107
Appendix V - SPSS Class Schemes Programs adjusted to ESS data File 2002/3
1) EGP (Trento version) 2) EGP (Ganzeboom original) 3) Wright (Trondheim versions) 4) ESP (Trento version) 5) ISEI Index (Ganzeboom original) 6) Treiman Index (Ganzeboom original)
108
_____________________________________________________________________ ERIKSON GOLDTHORPE PORTOCARRERO ------------ EGP - CLASS SCHEME _____________________________________________________________________ Ivano Bison University of Trento Dep. of Sociology and Social Research. /******************************************************************************************/ /* This program creates the EGP based on ISCO88 for the ESS data 2002-2003 */ /* Program version 1.0 - december 2004 */ /*******************************************************************************************/ /* Dear user, */ /* before run this program not forget to change the file location in the "import" or "get file" line */ /* the declaration of the ISCO88 variable at the "compute @isko" line */ /* Dear user, /* this program is based on Ganzeboom SPSS Program (http://www.fss.uu.nl/soc/hg/isko88/) */ /* - last fix: summer 1994. - last fix: may 2001 IIIa and IIIb distinguished */ /* Overall the two programs are very similar, differences between the my and Ganzeboom Spss */ /* program concern only the promotability e the degradability of certain occupations. */ /* A first difference, with the Ganzeboom SPSS program concern the extension of the control */ /* of own job. In this program I introduce the information on the extension of the control of own job. */ /* So in the my SPSS program I move from class IIIa and IIIb into class II only the employees */ /* supervisor (with 10 or more subordinate) with large extent organize own work */ /* and from class II to class I only the employees supervisor (with 10 or more subordinate) with large */ /* extent organize own work */. /* A second difference is: I do not move the members of the classes V, VI and VII, that declare */ /* self-employ but don't have the whole control of their job, into the classes IVa and IVb */ /* A third difference is a simple data cleaning specific for the ESS data. For example supervisor */ /* unskilled worker that I have moved into skilled workers or self employ farm labour */ /* into self employ farmer. */ /* Last difference: the ISCO code (2470 Pubblic service administrative professionals); */ /* (7139 Build finiscer, rel. trade work not else class); (8287 Composite products assemblers) not classify */ /* in Ganzeboom program are here classify (2470 into class II) (7139 into class VI) (8287 into class VII) */. /******************************************************************************************/ /* VARIABLES */ /******************************************************************************************/ /* THIS PROGRAM USES THE FOLLOWING ORIGINAL ESS VARIABLES */ /* emplno */ /* emplrel */ /* njbspv */ /* jbspv */ /* orgwrk */ /* THIS PROGRAM CREATE THE FOLLOWING VARIABLES */ /* emplno1 */ /* emplrel1 */ /* njbspv1 */ /* jbspv1 */ /* THIS PROGRAM CREATE THE FOLLOWING MACRO VARIABLES */ /* @ISKO */ /* @EGP10 */ /* @SEMPL */

109
/* @SUPVIS */ /**********************************************************************/ /* BEGIN procedure to define vars @SUPVIS @SEMPL @ISKO */ /**********************************************************************/. /* Dear user, */ /* this part of the program create the new variables emplno1 emplrel1 njbspv1 jbspv1 */ /* as result of cleans variables emplno emplrel njbspv jbspv and create the macro variables*/ /* @SUPVIS @SEMPL @ISKO */ /* in the following line you have to specify the data set's variable containing the ISCO88 4-digits information */ /* if you use the original ESS1E05_F1.POR data file: cancel the asterisk in front of line; modify the path and run this line */ /* remember: if you run this line do not run the following "GET FILE" line command */ * IMPORT FILE='C:\dati\Hakon\ESS1E05_F1.POR'. /* if you use a SPSS system file ".SAV": modify the path and the file name and run this line */ GET FILE='C:\dati\Hakon\ESS1E05_F1.sav'. /* insert here the variable name containing the ISCO88 4-digits information of the occupation of the respondent: in ESS is iscoco.*/ compute @isko = iscoco. /* Here the program create a copy of emplno emplrel njbspv jbspv */ recode emplno (else=copy) into emplno1. recode njbspv (else=copy) into njbspv1. recode jbspv (sysmis=-1) (else=copy) into jbspv1. recode emplrel (else=copy) into @sempl. /* Here the program create a variable on self-employment "@sempl" with the code=2 for the self-employed */ do if ((emplno1 lt 66666) and (@sempl gt 6)). compute @sempl=2. else if ((emplno1 eq 66666) and (@sempl gt 6)). compute @sempl=1. else if ((emplno1 lt 6666) and any(@sempl,1,3)). compute emplno1=99999. end if. val labels @sempl 1 'Employee' 2 'Self-Employed' 3 'Working for own family business' 6 'Not applicable' 7 'Refusal' 8 "Don't know" 9 'No answer' /jbspv1 1 "Yes" 2 "No" 6 'Not applicable' 7 'Refusal' 8 "Don't know" 9 'No answer'. do if ((njbspv1 lt 66666) and (jbspv1 gt 6)). compute jbspv1=1. else if ((njbspv1 eq 66666) and (jbspv1 gt 6)). compute jbspv1=2. else if ((njbspv1 lt 6666) and (jbspv1 eq 2)). compute njbspv1=99999. else if ((njbspv1 eq 0) and (jbspv1 eq 1)). compute njbspv1=99999. end if. /* Here the program create a variable on supervision "@supvis" with the number of supervised person and number of employed */ do if ((@sempl eq 2) and (jbspv1 ne 1)). compute @supvis=emplno1. else if ((@sempl ne 2) and (jbspv1 eq 1)). compute @supvis=njbspv1. else if ((@sempl eq 2) and (jbspv1 eq 1)).

110
compute @supvis=emplno1. else. compute @supvis=emplno1. end if. recode @supvis (66666=-2). recode @sempl (2 ,3=2) (else=1). exec. missing value @supvis (77777 thru 99999). missing value emplno1 (66666 thru 99999). *********************************************************************. * END of procedure to define vars @SUPVIS @SEMPL @ISKO. *********************************************************************. /**********************************************************************/ /* BEGIN procedure to define the variable @EGP10 * /**********************************************************************/. /* Dear user, */ /* this part of the program create the EGP Class Scheme */ /* The first part of the programa is from GANZEBOOM PROGRAM */ /* The second part of the program revised the GANZEBOOM PROGRAM */ *____________________________________________________ THIS PART IS FROM THE GANZEBOOM PROGRAM ____________________________________________________. ** last fix: summer 1994. ** last fix: may 2001 IIIa and IIIb distinguished do repeat i=@isko / e=@egp10. compute e=i. end repeat. ** This module makes sure that managers and owners with certain. ** employment statuses go into the right place. do repeat iii=@isko / sss=@sempl. do if (sss eq 2). . recode iii (6130=1311). end if. end repeat. execute. do repeat s=@sempl / sv=@supvis / is=@isko. if ( is eq 7510 and sv le 0) sv=5. if ((is ge 6100 and is le 6133) and sv ge 1) is=1311. if ((is ge 9200 and is le 9213) and sv gt 1) is=6132. do if (sv ge 11). recode is (1311=1221)(1312=1222)(1313=1223)(1314=1224)(1315=1225) (1316=1226)(1317=1227)(1318=1228)(1319=1229)(1300,1310=1220). end if. do if (sv ge 1 and sv le 10). recode is (1221=1311)(1222=1312)(1223=1313)(1224=1314)(1225=1315) (1226=1316)(1227=1317)(1228=1318)(1229=1319)(1200 1210 1220=1310). end if. if ((is eq 1220 or (is ge 1222 and is le 1229)) and (s eq 2) and (sv ge 11)) is=1210. end repeat. execute. recode @isko (1000= 1) into @egp10. recode @isko (1100= 1) into @egp10. recode @isko (1110= 1) into @egp10.
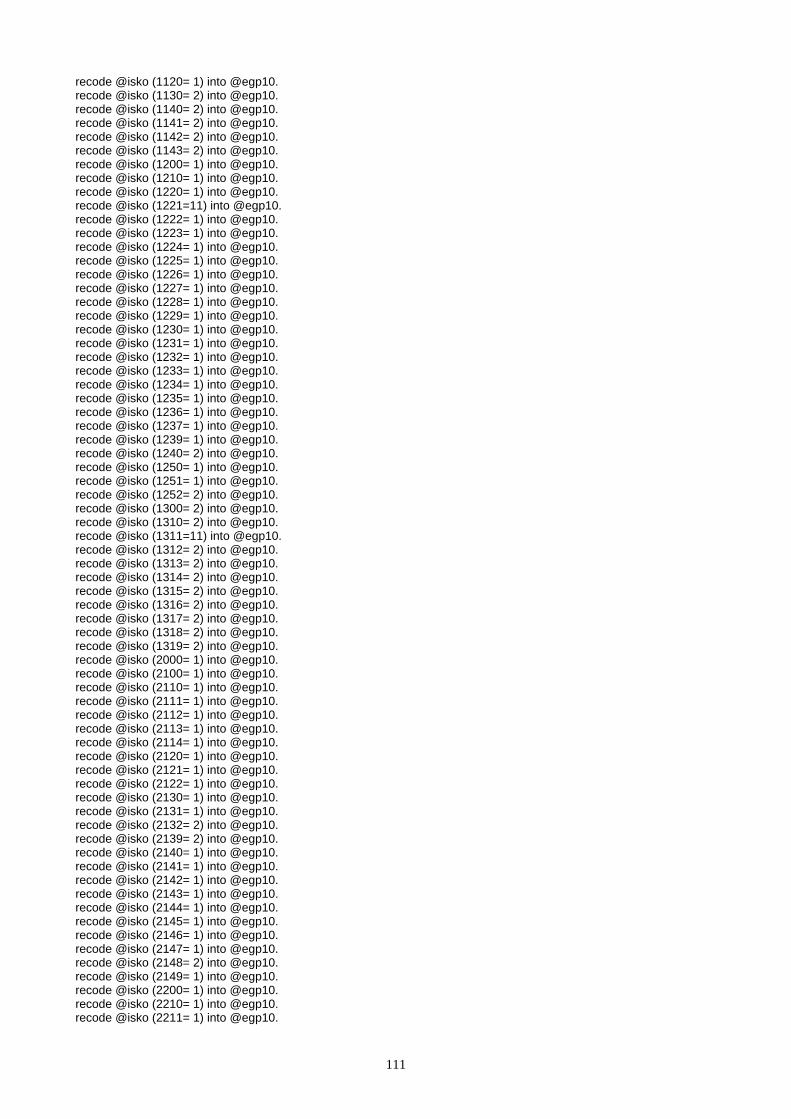
111
recode @isko (1120= 1) into @egp10. recode @isko (1130= 2) into @egp10. recode @isko (1140= 2) into @egp10. recode @isko (1141= 2) into @egp10. recode @isko (1142= 2) into @egp10. recode @isko (1143= 2) into @egp10. recode @isko (1200= 1) into @egp10. recode @isko (1210= 1) into @egp10. recode @isko (1220= 1) into @egp10. recode @isko (1221=11) into @egp10. recode @isko (1222= 1) into @egp10. recode @isko (1223= 1) into @egp10. recode @isko (1224= 1) into @egp10. recode @isko (1225= 1) into @egp10. recode @isko (1226= 1) into @egp10. recode @isko (1227= 1) into @egp10. recode @isko (1228= 1) into @egp10. recode @isko (1229= 1) into @egp10. recode @isko (1230= 1) into @egp10. recode @isko (1231= 1) into @egp10. recode @isko (1232= 1) into @egp10. recode @isko (1233= 1) into @egp10. recode @isko (1234= 1) into @egp10. recode @isko (1235= 1) into @egp10. recode @isko (1236= 1) into @egp10. recode @isko (1237= 1) into @egp10. recode @isko (1239= 1) into @egp10. recode @isko (1240= 2) into @egp10. recode @isko (1250= 1) into @egp10. recode @isko (1251= 1) into @egp10. recode @isko (1252= 2) into @egp10. recode @isko (1300= 2) into @egp10. recode @isko (1310= 2) into @egp10. recode @isko (1311=11) into @egp10. recode @isko (1312= 2) into @egp10. recode @isko (1313= 2) into @egp10. recode @isko (1314= 2) into @egp10. recode @isko (1315= 2) into @egp10. recode @isko (1316= 2) into @egp10. recode @isko (1317= 2) into @egp10. recode @isko (1318= 2) into @egp10. recode @isko (1319= 2) into @egp10. recode @isko (2000= 1) into @egp10. recode @isko (2100= 1) into @egp10. recode @isko (2110= 1) into @egp10. recode @isko (2111= 1) into @egp10. recode @isko (2112= 1) into @egp10. recode @isko (2113= 1) into @egp10. recode @isko (2114= 1) into @egp10. recode @isko (2120= 1) into @egp10. recode @isko (2121= 1) into @egp10. recode @isko (2122= 1) into @egp10. recode @isko (2130= 1) into @egp10. recode @isko (2131= 1) into @egp10. recode @isko (2132= 2) into @egp10. recode @isko (2139= 2) into @egp10. recode @isko (2140= 1) into @egp10. recode @isko (2141= 1) into @egp10. recode @isko (2142= 1) into @egp10. recode @isko (2143= 1) into @egp10. recode @isko (2144= 1) into @egp10. recode @isko (2145= 1) into @egp10. recode @isko (2146= 1) into @egp10. recode @isko (2147= 1) into @egp10. recode @isko (2148= 2) into @egp10. recode @isko (2149= 1) into @egp10. recode @isko (2200= 1) into @egp10. recode @isko (2210= 1) into @egp10. recode @isko (2211= 1) into @egp10.
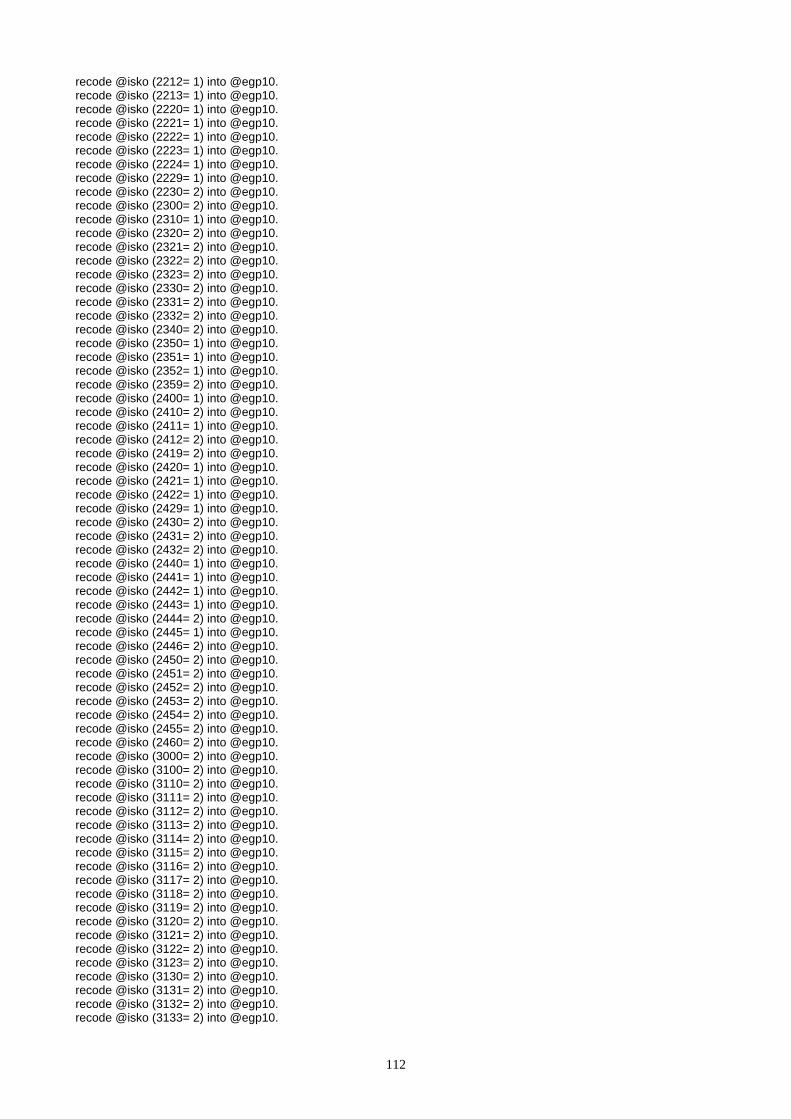
112
recode @isko (2212= 1) into @egp10. recode @isko (2213= 1) into @egp10. recode @isko (2220= 1) into @egp10. recode @isko (2221= 1) into @egp10. recode @isko (2222= 1) into @egp10. recode @isko (2223= 1) into @egp10. recode @isko (2224= 1) into @egp10. recode @isko (2229= 1) into @egp10. recode @isko (2230= 2) into @egp10. recode @isko (2300= 2) into @egp10. recode @isko (2310= 1) into @egp10. recode @isko (2320= 2) into @egp10. recode @isko (2321= 2) into @egp10. recode @isko (2322= 2) into @egp10. recode @isko (2323= 2) into @egp10. recode @isko (2330= 2) into @egp10. recode @isko (2331= 2) into @egp10. recode @isko (2332= 2) into @egp10. recode @isko (2340= 2) into @egp10. recode @isko (2350= 1) into @egp10. recode @isko (2351= 1) into @egp10. recode @isko (2352= 1) into @egp10. recode @isko (2359= 2) into @egp10. recode @isko (2400= 1) into @egp10. recode @isko (2410= 2) into @egp10. recode @isko (2411= 1) into @egp10. recode @isko (2412= 2) into @egp10. recode @isko (2419= 2) into @egp10. recode @isko (2420= 1) into @egp10. recode @isko (2421= 1) into @egp10. recode @isko (2422= 1) into @egp10. recode @isko (2429= 1) into @egp10. recode @isko (2430= 2) into @egp10. recode @isko (2431= 2) into @egp10. recode @isko (2432= 2) into @egp10. recode @isko (2440= 1) into @egp10. recode @isko (2441= 1) into @egp10. recode @isko (2442= 1) into @egp10. recode @isko (2443= 1) into @egp10. recode @isko (2444= 2) into @egp10. recode @isko (2445= 1) into @egp10. recode @isko (2446= 2) into @egp10. recode @isko (2450= 2) into @egp10. recode @isko (2451= 2) into @egp10. recode @isko (2452= 2) into @egp10. recode @isko (2453= 2) into @egp10. recode @isko (2454= 2) into @egp10. recode @isko (2455= 2) into @egp10. recode @isko (2460= 2) into @egp10. recode @isko (3000= 2) into @egp10. recode @isko (3100= 2) into @egp10. recode @isko (3110= 2) into @egp10. recode @isko (3111= 2) into @egp10. recode @isko (3112= 2) into @egp10. recode @isko (3113= 2) into @egp10. recode @isko (3114= 2) into @egp10. recode @isko (3115= 2) into @egp10. recode @isko (3116= 2) into @egp10. recode @isko (3117= 2) into @egp10. recode @isko (3118= 2) into @egp10. recode @isko (3119= 2) into @egp10. recode @isko (3120= 2) into @egp10. recode @isko (3121= 2) into @egp10. recode @isko (3122= 2) into @egp10. recode @isko (3123= 2) into @egp10. recode @isko (3130= 2) into @egp10. recode @isko (3131= 2) into @egp10. recode @isko (3132= 2) into @egp10. recode @isko (3133= 2) into @egp10.

113
recode @isko (3139= 2) into @egp10. recode @isko (3140= 2) into @egp10. recode @isko (3141= 2) into @egp10. recode @isko (3142= 2) into @egp10. recode @isko (3143= 1) into @egp10. recode @isko (3144= 1) into @egp10. recode @isko (3145= 2) into @egp10. recode @isko (3150= 2) into @egp10. recode @isko (3151= 2) into @egp10. recode @isko (3152= 2) into @egp10. recode @isko (3200= 2) into @egp10. recode @isko (3210= 2) into @egp10. recode @isko (3211= 2) into @egp10. recode @isko (3212= 2) into @egp10. recode @isko (3213= 2) into @egp10. recode @isko (3220= 2) into @egp10. recode @isko (3221= 2) into @egp10. recode @isko (3222= 2) into @egp10. recode @isko (3223= 2) into @egp10. recode @isko (3224= 2) into @egp10. recode @isko (3225= 2) into @egp10. recode @isko (3226= 2) into @egp10. recode @isko (3227= 2) into @egp10. recode @isko (3228= 2) into @egp10. recode @isko (3229= 2) into @egp10. recode @isko (3230= 3) into @egp10. recode @isko (3231= 3) into @egp10. recode @isko (3232= 3) into @egp10. recode @isko (3240= 2) into @egp10. recode @isko (3241= 2) into @egp10. recode @isko (3242= 2) into @egp10. recode @isko (3300= 3) into @egp10. recode @isko (3310= 3) into @egp10. recode @isko (3320= 3) into @egp10. recode @isko (3330= 3) into @egp10. recode @isko (3340= 3) into @egp10. recode @isko (3400= 2) into @egp10. recode @isko (3410= 2) into @egp10. recode @isko (3411= 2) into @egp10. recode @isko (3412= 2) into @egp10. recode @isko (3413= 2) into @egp10. recode @isko (3414= 2) into @egp10. recode @isko (3415= 2) into @egp10. recode @isko (3416= 2) into @egp10. recode @isko (3417= 2) into @egp10. recode @isko (3419= 2) into @egp10. recode @isko (3420= 2) into @egp10. recode @isko (3421= 2) into @egp10. recode @isko (3422= 2) into @egp10. recode @isko (3423= 2) into @egp10. recode @isko (3429= 2) into @egp10. recode @isko (3430= 3) into @egp10. recode @isko (3431= 2) into @egp10. recode @isko (3432= 2) into @egp10. recode @isko (3433= 3) into @egp10. recode @isko (3434= 2) into @egp10. recode @isko (3439= 3) into @egp10. recode @isko (3440= 2) into @egp10. recode @isko (3441= 2) into @egp10. recode @isko (3442= 2) into @egp10. recode @isko (3443= 2) into @egp10. recode @isko (3444= 2) into @egp10. recode @isko (3449= 2) into @egp10. recode @isko (3450= 2) into @egp10. recode @isko (3451= 2) into @egp10. recode @isko (3452= 7) into @egp10. recode @isko (3460= 3) into @egp10. recode @isko (3470= 2) into @egp10. recode @isko (3471= 2) into @egp10.

114
recode @isko (3472= 2) into @egp10. recode @isko (3473= 2) into @egp10. recode @isko (3474= 2) into @egp10. recode @isko (3475= 2) into @egp10. recode @isko (3480= 3) into @egp10. recode @isko (4000= 3) into @egp10. recode @isko (4100= 3) into @egp10. recode @isko (4110= 3) into @egp10. recode @isko (4111= 3) into @egp10. recode @isko (4112= 3) into @egp10. recode @isko (4113= 3) into @egp10. recode @isko (4114= 3) into @egp10. recode @isko (4115= 3) into @egp10. recode @isko (4120= 3) into @egp10. recode @isko (4121= 3) into @egp10. recode @isko (4122= 3) into @egp10. recode @isko (4130= 3) into @egp10. recode @isko (4131= 3) into @egp10. recode @isko (4132= 3) into @egp10. recode @isko (4133= 3) into @egp10. recode @isko (4140= 3) into @egp10. recode @isko (4141= 3) into @egp10. recode @isko (4142= 9) into @egp10. recode @isko (4143= 3) into @egp10. recode @isko (4144= 3) into @egp10. recode @isko (4190= 3) into @egp10. recode @isko (4200= 3) into @egp10. recode @isko (4210= 3) into @egp10. recode @isko (4211= 3) into @egp10. recode @isko (4212= 3) into @egp10. recode @isko (4213= 3) into @egp10. recode @isko (4214= 3) into @egp10. recode @isko (4215= 3) into @egp10. recode @isko (4220= 3) into @egp10. recode @isko (4221= 3) into @egp10. recode @isko (4222= 3) into @egp10. recode @isko (4223= 3) into @egp10. recode @isko (5000= 3) into @egp10. recode @isko (5100= 3) into @egp10. recode @isko (5110= 3) into @egp10. recode @isko (5111= 3) into @egp10. recode @isko (5112= 3) into @egp10. recode @isko (5113= 3) into @egp10. recode @isko (5120= 3) into @egp10. recode @isko (5121= 3) into @egp10. recode @isko (5122= 8) into @egp10. recode @isko (5123= 3) into @egp10. recode @isko (5130= 3) into @egp10. recode @isko (5131= 3) into @egp10. recode @isko (5132= 3) into @egp10. recode @isko (5133= 3) into @egp10. recode @isko (5139= 3) into @egp10. recode @isko (5140= 8) into @egp10. recode @isko (5141= 8) into @egp10. recode @isko (5142= 3) into @egp10. recode @isko (5143= 8) into @egp10. recode @isko (5149= 3) into @egp10. recode @isko (5150= 2) into @egp10. recode @isko (5151= 2) into @egp10. recode @isko (5152= 2) into @egp10. recode @isko (5160= 9) into @egp10. recode @isko (5161= 8) into @egp10. recode @isko (5162= 8) into @egp10. recode @isko (5163= 9) into @egp10. recode @isko (5164= 8) into @egp10. recode @isko (5169= 9) into @egp10. recode @isko (5200= 3) into @egp10. recode @isko (5210= 3) into @egp10. recode @isko (5220= 3) into @egp10.

115
recode @isko (5230= 3) into @egp10. recode @isko (6000=10) into @egp10. recode @isko (6100=10) into @egp10. recode @isko (6110=10) into @egp10. recode @isko (6111=10) into @egp10. recode @isko (6112=10) into @egp10. recode @isko (6113=10) into @egp10. recode @isko (6114=10) into @egp10. recode @isko (6120=10) into @egp10. recode @isko (6121=10) into @egp10. recode @isko (6122=10) into @egp10. recode @isko (6123=10) into @egp10. recode @isko (6124=10) into @egp10. recode @isko (6129=10) into @egp10. recode @isko (6130=10) into @egp10. recode @isko (6131=11) into @egp10. recode @isko (6132=11) into @egp10. recode @isko (6133=11) into @egp10. recode @isko (6134=10) into @egp10. recode @isko (6140=10) into @egp10. recode @isko (6141=10) into @egp10. recode @isko (6142=10) into @egp10. recode @isko (6150=10) into @egp10. recode @isko (6151=10) into @egp10. recode @isko (6152=10) into @egp10. recode @isko (6153=10) into @egp10. recode @isko (6154=10) into @egp10. recode @isko (6200=11) into @egp10. recode @isko (6210=11) into @egp10. recode @isko (7000= 8) into @egp10. recode @isko (7100= 8) into @egp10. recode @isko (7110= 8) into @egp10. recode @isko (7111= 8) into @egp10. recode @isko (7112= 8) into @egp10. recode @isko (7113= 8) into @egp10. recode @isko (7120= 8) into @egp10. recode @isko (7121= 9) into @egp10. recode @isko (7122= 9) into @egp10. recode @isko (7123= 9) into @egp10. recode @isko (7124= 8) into @egp10. recode @isko (7129= 8) into @egp10. recode @isko (7130= 8) into @egp10. recode @isko (7131= 9) into @egp10. recode @isko (7132= 8) into @egp10. recode @isko (7133= 8) into @egp10. recode @isko (7134= 8) into @egp10. recode @isko (7135= 9) into @egp10. recode @isko (7136= 8) into @egp10. recode @isko (7137= 8) into @egp10. recode @isko (7140= 8) into @egp10. recode @isko (7141= 8) into @egp10. recode @isko (7142= 9) into @egp10. recode @isko (7143= 9) into @egp10. recode @isko (7200= 8) into @egp10. recode @isko (7210= 8) into @egp10. recode @isko (7211= 8) into @egp10. recode @isko (7212= 8) into @egp10. recode @isko (7213= 8) into @egp10. recode @isko (7214= 8) into @egp10. recode @isko (7215= 8) into @egp10. recode @isko (7216= 8) into @egp10. recode @isko (7220= 8) into @egp10. recode @isko (7221= 8) into @egp10. recode @isko (7222= 8) into @egp10. recode @isko (7223= 8) into @egp10. recode @isko (7224= 8) into @egp10. recode @isko (7230= 8) into @egp10. recode @isko (7231= 8) into @egp10. recode @isko (7232= 8) into @egp10.

116
recode @isko (7233= 8) into @egp10. recode @isko (7234= 9) into @egp10. recode @isko (7240= 8) into @egp10. recode @isko (7241= 8) into @egp10. recode @isko (7242= 8) into @egp10. recode @isko (7243= 8) into @egp10. recode @isko (7244= 8) into @egp10. recode @isko (7245= 8) into @egp10. recode @isko (7300= 8) into @egp10. recode @isko (7310= 8) into @egp10. recode @isko (7311= 8) into @egp10. recode @isko (7312= 8) into @egp10. recode @isko (7313= 8) into @egp10. recode @isko (7320= 9) into @egp10. recode @isko (7321= 9) into @egp10. recode @isko (7322= 9) into @egp10. recode @isko (7323= 8) into @egp10. recode @isko (7324= 8) into @egp10. recode @isko (7330= 9) into @egp10. recode @isko (7331= 9) into @egp10. recode @isko (7332= 9) into @egp10. recode @isko (7340= 8) into @egp10. recode @isko (7341= 8) into @egp10. recode @isko (7342= 8) into @egp10. recode @isko (7343= 8) into @egp10. recode @isko (7344= 8) into @egp10. recode @isko (7345= 8) into @egp10. recode @isko (7346= 8) into @egp10. recode @isko (7400= 8) into @egp10. recode @isko (7410= 8) into @egp10. recode @isko (7411= 8) into @egp10. recode @isko (7412= 8) into @egp10. recode @isko (7413= 8) into @egp10. recode @isko (7414= 8) into @egp10. recode @isko (7415= 8) into @egp10. recode @isko (7416= 8) into @egp10. recode @isko (7420= 8) into @egp10. recode @isko (7421= 9) into @egp10. recode @isko (7422= 8) into @egp10. recode @isko (7423= 8) into @egp10. recode @isko (7424= 9) into @egp10. recode @isko (7430= 8) into @egp10. recode @isko (7431= 9) into @egp10. recode @isko (7432= 9) into @egp10. recode @isko (7433= 8) into @egp10. recode @isko (7434= 8) into @egp10. recode @isko (7435= 8) into @egp10. recode @isko (7436= 8) into @egp10. recode @isko (7437= 8) into @egp10. recode @isko (7440= 8) into @egp10. recode @isko (7441= 8) into @egp10. recode @isko (7442= 8) into @egp10. recode @isko (7500= 8) into @egp10. recode @isko (7510= 7) into @egp10. recode @isko (7520= 8) into @egp10. recode @isko (7530= 9) into @egp10. recode @isko (8000= 9) into @egp10. recode @isko (8100= 9) into @egp10. recode @isko (8110= 8) into @egp10. recode @isko (8111= 8) into @egp10. recode @isko (8112= 8) into @egp10. recode @isko (8113= 8) into @egp10. recode @isko (8120= 8) into @egp10. recode @isko (8121= 8) into @egp10. recode @isko (8122= 8) into @egp10. recode @isko (8123= 8) into @egp10. recode @isko (8124= 8) into @egp10. recode @isko (8130= 9) into @egp10. recode @isko (8131= 9) into @egp10.

117
recode @isko (8139= 9) into @egp10. recode @isko (8140= 9) into @egp10. recode @isko (8141= 9) into @egp10. recode @isko (8142= 9) into @egp10. recode @isko (8143= 9) into @egp10. recode @isko (8150= 8) into @egp10. recode @isko (8151= 8) into @egp10. recode @isko (8152= 8) into @egp10. recode @isko (8153= 8) into @egp10. recode @isko (8154= 8) into @egp10. recode @isko (8155= 8) into @egp10. recode @isko (8159= 8) into @egp10. recode @isko (8160= 8) into @egp10. recode @isko (8161= 8) into @egp10. recode @isko (8162= 8) into @egp10. recode @isko (8163= 8) into @egp10. recode @isko (8170= 8) into @egp10. recode @isko (8171= 8) into @egp10. recode @isko (8172= 8) into @egp10. recode @isko (8200= 9) into @egp10. recode @isko (8210= 8) into @egp10. recode @isko (8211= 8) into @egp10. recode @isko (8212= 9) into @egp10. recode @isko (8220= 9) into @egp10. recode @isko (8221= 9) into @egp10. recode @isko (8222= 9) into @egp10. recode @isko (8223= 9) into @egp10. recode @isko (8224= 9) into @egp10. recode @isko (8229= 9) into @egp10. recode @isko (8230= 9) into @egp10. recode @isko (8231= 9) into @egp10. recode @isko (8232= 9) into @egp10. recode @isko (8240= 9) into @egp10. recode @isko (8250= 9) into @egp10. recode @isko (8251= 9) into @egp10. recode @isko (8252= 9) into @egp10. recode @isko (8253= 9) into @egp10. recode @isko (8260= 9) into @egp10. recode @isko (8261= 9) into @egp10. recode @isko (8262= 9) into @egp10. recode @isko (8263= 9) into @egp10. recode @isko (8264= 9) into @egp10. recode @isko (8265= 9) into @egp10. recode @isko (8266= 9) into @egp10. recode @isko (8269= 9) into @egp10. recode @isko (8270= 9) into @egp10. recode @isko (8271= 9) into @egp10. recode @isko (8272= 9) into @egp10. recode @isko (8273= 9) into @egp10. recode @isko (8274= 9) into @egp10. recode @isko (8275= 9) into @egp10. recode @isko (8276= 9) into @egp10. recode @isko (8277= 9) into @egp10. recode @isko (8278= 9) into @egp10. recode @isko (8279= 9) into @egp10. recode @isko (8280= 9) into @egp10. recode @isko (8281= 9) into @egp10. recode @isko (8282= 9) into @egp10. recode @isko (8283= 9) into @egp10. recode @isko (8284= 9) into @egp10. recode @isko (8285= 9) into @egp10. recode @isko (8286= 9) into @egp10. recode @isko (8290= 9) into @egp10. recode @isko (8300= 9) into @egp10. recode @isko (8310= 9) into @egp10. recode @isko (8311= 8) into @egp10. recode @isko (8312= 9) into @egp10. recode @isko (8320= 9) into @egp10. recode @isko (8321= 9) into @egp10.
118
recode @isko (8322= 9) into @egp10. recode @isko (8323= 9) into @egp10. recode @isko (8324= 9) into @egp10. recode @isko (8330= 9) into @egp10. recode @isko (8331=10) into @egp10. recode @isko (8332= 8) into @egp10. recode @isko (8333= 8) into @egp10. recode @isko (8334= 9) into @egp10. recode @isko (8340= 9) into @egp10. recode @isko (8400= 9) into @egp10. recode @isko (9000= 9) into @egp10. recode @isko (9100= 3) into @egp10. recode @isko (9110= 3) into @egp10. recode @isko (9111= 3) into @egp10. recode @isko (9112= 3) into @egp10. recode @isko (9113= 3) into @egp10. recode @isko (9120= 9) into @egp10. recode @isko (9130= 9) into @egp10. recode @isko (9131= 9) into @egp10. recode @isko (9132= 9) into @egp10. recode @isko (9133= 9) into @egp10. recode @isko (9140= 9) into @egp10. recode @isko (9141= 9) into @egp10. recode @isko (9142= 9) into @egp10. recode @isko (9150= 9) into @egp10. recode @isko (9151= 9) into @egp10. recode @isko (9152= 9) into @egp10. recode @isko (9153= 9) into @egp10. recode @isko (9160= 9) into @egp10. recode @isko (9161= 9) into @egp10. recode @isko (9162= 9) into @egp10. recode @isko (9200= 9) into @egp10. recode @isko (9210=10) into @egp10. recode @isko (9211=10) into @egp10. recode @isko (9212=10) into @egp10. recode @isko (9213=10) into @egp10. recode @isko (9300= 9) into @egp10. recode @isko (9310= 9) into @egp10. recode @isko (9311= 9) into @egp10. recode @isko (9312= 9) into @egp10. recode @isko (9313= 9) into @egp10. recode @isko (9320= 9) into @egp10. recode @isko (9321= 9) into @egp10. recode @isko (9322= 9) into @egp10. recode @isko (9330= 9) into @egp10. recode @isko (9331= 9) into @egp10. recode @isko (9332= 9) into @egp10. recode @isko (9333= 9) into @egp10. execute. * ----------------------------------------------------------------------------- ATTENTION: ENDING PART OF THE GANZEBOOM PROGRAM ----------------------------------------------------------------------------- BEGIN PART OF TRENTO PROGRAM ____________________________________________________. /* Dear user, */ /* This is the second part of the program revised the GANZEBOOM PROGRAM */ /* here the ISCO Code not classify in Ganzeboom program */ recode @isko (2470= 2) into @egp10. recode @isko (7139= 8) into @egp10. recode @isko (8287= 9) into @egp10. /* here code promotability and degradability of certain occupations */
119
DO REPEAT E=@EGP10 / IS=@ISKO / sv=@supvis / s=@sempl / o= orgwrk. COMPUTE #P=IS. RECODE #P (1000 thru 9299=1)(else=0). compute #d=is. recode #d (1300 thru 1319 3400 thru 3439 4000 thru 5230=1)(else=0). /* Move self-empl. Lover controllers and Routine non manual with ISCO 1300 thru 1319 3400 thru 3439 4000 thru 5230 into Self-empl IVa (with code 4) */ IF ((e eq 3 or e eq 2) and (s eq 2) and (#d eq 1)) e=4. /* Move self-empl. members of class V, VI, VIIa with large extent organize own work with ISCO 1000-9229 into Self-empl IVb (with code 5) */ IF ((E GE 7 AND E LE 9) AND (S=2) and (#p eq 1) and any(o,1)) E=5. end repeat. /* Change code position of self empl. IVa code 4 into code 5 and IVb code 5 into code 6 */ recode @egp10 (4=5)(5=6). /* Move Self-empl. without employees of class (IVa) into Self-empl. (IVb) and Self-empl. with employees of class (IVb) into Self-empl. (IVa) */ do IF ((@EGP10 eq 5) AND (@supvis lt 1)). compute @EGP10=6. else IF ((@EGP10 eq 6) AND (@supvis Ge 1)). compute @EGP10=5. end if. execute. /* Move all self-empl. with more of 10 employees into Hi Controllers (I) */ if ((emplno1 gt 10)) @egp10=1. /* Move Routine non manual (IIIa) with ISCO code 4142 4190 4200 thru 4215 5000 thru 5239 into Lower sales service (IIIb) */ do repeat egp=@egp10 /isko=@isko. do if (egp eq 3). recode isko (4142 4190 4200 thru 4215 5000 thru 5239=4) into egp. end if. end repeat. /* move labor farm (VIIb) self-empl into farmer (IVc) and farmer (IVc) not self-empl into labor farm (VIIb) */ IF ((@EGP10 eq 10) AND (@sempl eq 2)) @egp10=11. IF ((@EGP10 eq 11) AND (@sempl eq 1)) @egp10=10. /* Move supervisor unskilled workers (VIIb) into Skilled workers (VI) and Skilled workers (IV) into Manual supervisor (V) */ do if ((@egp10 eq 9) and (@supvis GE 1)). compute @egp10=8. else IF ((@EGP10 eq 8) AND (@supvis GE 1)). compute @EGP10=7. end if. /* Move (supervisor with 10 or more subordinate) with large extent organize own work of class Lover Controllers (II) into Higher controllers (I) */ IF ((@EGP10 eq 2) AND (@supvis GE 10) and (orgwrk eq 1)) @EGP10 =1. /* Move (supervisor with 10 or more subordinate) with large extent organize own work of class Routine Non-Manual (IIIa) into Lover controllers (II) */ IF ((@EGP10 eq 3) AND (@supvis GE 10) and (orgwrk eq 1)) @EGP10 =2.
120
/* Move (supervisor with 10 or more subordinate) with large extent organize own work of class Lower sales service (IIIb) into Lower controllers (II) */ IF ((@EGP10 eq 4) AND (@supvis GE 10) and (orgwrk eq 1)) @EGP10 =2. /***************************/ /* Define missing value */ /***************************/ do if (missing(@egp10)). recode iscoco (else=copy) into @egp10. end if. missing value @egp10 (100 thru 99999). /***************************/ /* Define value labels */ /***************************/ Var labels @egp10 'EGP Class scheme: trento version'. add value labels @egp10 1 ' I Profesionals, administrators and managers, higher-grade’ 2 ' II Profesionals, administrators and managers, lower-grade and higher-grade technicians’ 3 'IIIa Routine non-manuals, employees, higher-grade ' 4 'IIIb Routine non-manuals, employees, lower-grade' 5 'IVa Small proprietors and employees and self-empl. with empl.' 6 'IVb Small proprietors and employees and self-empl. with no empl.' 7 ' V Lower-grade technicians and supervisors of manual workers' 8 ' VI Skilled manual workers' 9 'VIIa Nonskilled manual workers (other than in agriculture )' 10 'VIIb Agricultural workers' 11 'IVc Small proprietors and employees and self-empl. farmers' 100 'Armed forces' 66666 'Not applicable' 77777 'Refusal' 88888 "Don't know" 99999 'No answer'. execute. delete variable emplno1 njbspv1 jbspv1 @sempl @supvis.
121
_____________________________________________________________________ ERIKSON GOLDTHORPE PORTOCARRERO ------------ EGP - CLASS SCHEME original version of Ganzeboom program (http://www.fss.uu.nl/soc/hg/isko88/) - last fix: summer 1994 - last fix: may 2001 IIIa and IIIb distinguished _____________________________________________________________________ Ivano Bison University of Trento Dep. of Sociology and Social Research. /******************************************************************************************/ /* This program creates the EGP based on ISCO88 for the ESS data 2002-2003 */ /* Program version 1.0 - december 2004 */ /*******************************************************************************************/ /* Dear user, /* this program is the adapted version on ESS data file to the Ganzeboom SPSS Program */ /* (http://www.fss.uu.nl/soc/hg/isko88/) */ /* - last fix: summer 1994. - last fix: may 2001 IIIa and IIIb distinguished */ /* Dear user, */ /* before run this program not forget to change the file location in the "import" or "get file" line */ /* the declaration of the ISCO88 variable at the "compute @isko" line */ /******************************************************************************************/ /* VARIABLES */ /******************************************************************************************/ /* THIS PROGRAM USES THE FOLLOWING ORIGINAL ESS VARIABLES */ /* emplno */ /* emplrel */ /* njbspv */ /* jbspv */ /* orgwrk */ /* THIS PROGRAM CREATE THE FOLLOWING VARIABLES */ /* emplno1 */ /* emplrel1 */ /* njbspv1 */ /* jbspv1 */ /* THIS PROGRAM CREATE THE FOLLOWING MACRO VARIABLES */ * @ISKO */ * @egp11 */ * @SEMPL */ * @SUPVIS */ /**********************************************************************/ /* BEGIN procedure to define vars @SUPVIS @SEMPL @ISKO */ /**********************************************************************/. /* Dear user, */ /* this part of the program create the new variables emplno1 emplrel1 njbspv1 jbspv1 */ /* as result of cleans variables emplno emplrel njbspv jbspv and create the macro variables*/ /* @SUPVIS @SEMPL @ISKO */

122
/* in the following line you have to specify the data set's variable containing the ISCO88 4-digits information */ /* if you use the original ESS1E05_F1.POR data file: cancel the asterisk in front of line; modify the path and run this line */ /* remember: if you run this line do not run the following "GET FILE" line command */ * IMPORT FILE='C:\dati\Hakon\ESS1E05_F1.POR'. /* if you use a SPSS system file ".SAV": modify the path and the file name and run this line */ GET FILE='C:\dati\Hakon\ESS1E05_F1.sav'. /* insert here the variable name containing the ISCO88 4-digits information of the occupation of the respondent: in ESS is iscoco.*/ compute @isko = iscoco. /* Here the program create a copy of emplno emplrel njbspv jbspv */ recode emplno (else=copy) into emplno1. recode njbspv (else=copy) into njbspv1. recode jbspv (sysmis=-1) (else=copy) into jbspv1. recode emplrel (else=copy) into @sempl. /* Here the program create a variable on self-employment "@sempl" with the code=2 for the self-employed */ do if ((emplno1 lt 66666) and (@sempl gt 6)). compute @sempl=2. else if ((emplno1 eq 66666) and (@sempl gt 6)). compute @sempl=1. else if ((emplno1 lt 6666) and any(@sempl,1,3)). compute emplno1=99999. end if. val labels @sempl 1 'Employee' 2 'Self-Employed' 3 'Working for own family business' 6 'Not applicable' 7 'Refusal' 8 "Don't know" 9 'No answer' /jbspv1 1 "Yes" 2 "No" 6 'Not applicable' 7 'Refusal' 8 "Don't know" 9 'No answer'. do if ((njbspv1 lt 66666) and (jbspv1 gt 6)). compute jbspv1=1. else if ((njbspv1 eq 66666) and (jbspv1 gt 6)). compute jbspv1=2. else if ((njbspv1 lt 6666) and (jbspv1 eq 2)). compute njbspv1=99999. else if ((njbspv1 eq 0) and (jbspv1 eq 1)). compute njbspv1=99999. end if. /* Here the program create a variable on supervision "@supvis" with the number of supervised person and number of employed */ do if ((@sempl eq 2) and (jbspv1 ne 1)). compute @supvis=emplno1. else if ((@sempl ne 2) and (jbspv1 eq 1)). compute @supvis=njbspv1. else if ((@sempl eq 2) and (jbspv1 eq 1)). compute @supvis=emplno1. else. compute @supvis=emplno1. end if. recode @supvis (66666=-2). recode @sempl (2 ,3=2) (else=1). exec. missing value @supvis (77777 thru 99999). missing value emplno1 (66666 thru 99999). *********************************************************************. * END of procedure to define vars @SUPVIS @SEMPL @ISKO. *********************************************************************.
123
/* Dear user, */ /* this part of the program is from GANZEBOOM and create the EGP Class Scheme */ /**********************************************************************/ /* BEGIN procedure to define the variable @EGP11 * /**********************************************************************/. do repeat i=@isko / e=@egp11. compute e=i. end repeat. ** This module makes sure that managers and owners with certain. ** employment statuses go into the right place. do repeat iii=@isko / sss=@sempl. do if (sss eq 2). . recode iii (6130=1311). end if. end repeat. execute. do repeat s=@sempl / sv=@supvis / is=@isko. if ( is eq 7510 and sv le 0) sv=5. if ((is ge 6100 and is le 6133) and sv ge 1) is=1311. if ((is ge 9200 and is le 9213) and sv gt 1) is=6132. do if (sv ge 11). recode is (1311=1221)(1312=1222)(1313=1223)(1314=1224)(1315=1225) (1316=1226)(1317=1227)(1318=1228)(1319=1229)(1300,1310=1220). end if. do if (sv ge 1 and sv le 10). recode is (1221=1311)(1222=1312)(1223=1313)(1224=1314)(1225=1315) (1226=1316)(1227=1317)(1228=1318)(1229=1319)(1200 1210 1220=1310). end if. if ((is eq 1220 or (is ge 1222 and is le 1229)) and (s eq 2) and sv ge 11) is=1210. end repeat. execute. recode @isko (1000= 1) into @egp11. recode @isko (1100= 1) into @egp11. recode @isko (1110= 1) into @egp11. recode @isko (1120= 1) into @egp11. recode @isko (1130= 2) into @egp11. recode @isko (1140= 2) into @egp11. recode @isko (1141= 2) into @egp11. recode @isko (1142= 2) into @egp11. recode @isko (1143= 2) into @egp11. recode @isko (1200= 1) into @egp11. recode @isko (1210= 1) into @egp11. recode @isko (1220= 1) into @egp11. recode @isko (1221=11) into @egp11. recode @isko (1222= 1) into @egp11. recode @isko (1223= 1) into @egp11. recode @isko (1224= 1) into @egp11. recode @isko (1225= 1) into @egp11. recode @isko (1226= 1) into @egp11. recode @isko (1227= 1) into @egp11. recode @isko (1228= 1) into @egp11. recode @isko (1229= 1) into @egp11. recode @isko (1230= 1) into @egp11. recode @isko (1231= 1) into @egp11. recode @isko (1232= 1) into @egp11.
124
recode @isko (1233= 1) into @egp11. recode @isko (1234= 1) into @egp11. recode @isko (1235= 1) into @egp11. recode @isko (1236= 1) into @egp11. recode @isko (1237= 1) into @egp11. recode @isko (1239= 1) into @egp11. recode @isko (1240= 2) into @egp11. recode @isko (1250= 1) into @egp11. recode @isko (1251= 1) into @egp11. recode @isko (1252= 2) into @egp11. recode @isko (1300= 2) into @egp11. recode @isko (1310= 2) into @egp11. recode @isko (1311=11) into @egp11. recode @isko (1312= 2) into @egp11. recode @isko (1313= 2) into @egp11. recode @isko (1314= 2) into @egp11. recode @isko (1315= 2) into @egp11. recode @isko (1316= 2) into @egp11. recode @isko (1317= 2) into @egp11. recode @isko (1318= 2) into @egp11. recode @isko (1319= 2) into @egp11. recode @isko (2000= 1) into @egp11. recode @isko (2100= 1) into @egp11. recode @isko (2110= 1) into @egp11. recode @isko (2111= 1) into @egp11. recode @isko (2112= 1) into @egp11. recode @isko (2113= 1) into @egp11. recode @isko (2114= 1) into @egp11. recode @isko (2120= 1) into @egp11. recode @isko (2121= 1) into @egp11. recode @isko (2122= 1) into @egp11. recode @isko (2130= 1) into @egp11. recode @isko (2131= 1) into @egp11. recode @isko (2132= 2) into @egp11. recode @isko (2139= 2) into @egp11. recode @isko (2140= 1) into @egp11. recode @isko (2141= 1) into @egp11. recode @isko (2142= 1) into @egp11. recode @isko (2143= 1) into @egp11. recode @isko (2144= 1) into @egp11. recode @isko (2145= 1) into @egp11. recode @isko (2146= 1) into @egp11. recode @isko (2147= 1) into @egp11. recode @isko (2148= 2) into @egp11. recode @isko (2149= 1) into @egp11. recode @isko (2200= 1) into @egp11. recode @isko (2210= 1) into @egp11. recode @isko (2211= 1) into @egp11. recode @isko (2212= 1) into @egp11. recode @isko (2213= 1) into @egp11. recode @isko (2220= 1) into @egp11. recode @isko (2221= 1) into @egp11. recode @isko (2222= 1) into @egp11. recode @isko (2223= 1) into @egp11. recode @isko (2224= 1) into @egp11. recode @isko (2229= 1) into @egp11. recode @isko (2230= 2) into @egp11. recode @isko (2300= 2) into @egp11. recode @isko (2310= 1) into @egp11. recode @isko (2320= 2) into @egp11. recode @isko (2321= 2) into @egp11. recode @isko (2322= 2) into @egp11. recode @isko (2323= 2) into @egp11. recode @isko (2330= 2) into @egp11. recode @isko (2331= 2) into @egp11. recode @isko (2332= 2) into @egp11. recode @isko (2340= 2) into @egp11. recode @isko (2350= 1) into @egp11. recode @isko (2351= 1) into @egp11.

125
recode @isko (2352= 1) into @egp11. recode @isko (2359= 2) into @egp11. recode @isko (2400= 1) into @egp11. recode @isko (2410= 2) into @egp11. recode @isko (2411= 1) into @egp11. recode @isko (2412= 2) into @egp11. recode @isko (2419= 2) into @egp11. recode @isko (2420= 1) into @egp11. recode @isko (2421= 1) into @egp11. recode @isko (2422= 1) into @egp11. recode @isko (2429= 1) into @egp11. recode @isko (2430= 2) into @egp11. recode @isko (2431= 2) into @egp11. recode @isko (2432= 2) into @egp11. recode @isko (2440= 1) into @egp11. recode @isko (2441= 1) into @egp11. recode @isko (2442= 1) into @egp11. recode @isko (2443= 1) into @egp11. recode @isko (2444= 2) into @egp11. recode @isko (2445= 1) into @egp11. recode @isko (2446= 2) into @egp11. recode @isko (2450= 2) into @egp11. recode @isko (2451= 2) into @egp11. recode @isko (2452= 2) into @egp11. recode @isko (2453= 2) into @egp11. recode @isko (2454= 2) into @egp11. recode @isko (2455= 2) into @egp11. recode @isko (2460= 2) into @egp11. recode @isko (3000= 2) into @egp11. recode @isko (3100= 2) into @egp11. recode @isko (3110= 2) into @egp11. recode @isko (3111= 2) into @egp11. recode @isko (3112= 2) into @egp11. recode @isko (3113= 2) into @egp11. recode @isko (3114= 2) into @egp11. recode @isko (3115= 2) into @egp11. recode @isko (3116= 2) into @egp11. recode @isko (3117= 2) into @egp11. recode @isko (3118= 2) into @egp11. recode @isko (3119= 2) into @egp11. recode @isko (3120= 2) into @egp11. recode @isko (3121= 2) into @egp11. recode @isko (3122= 2) into @egp11. recode @isko (3123= 2) into @egp11. recode @isko (3130= 2) into @egp11. recode @isko (3131= 2) into @egp11. recode @isko (3132= 2) into @egp11. recode @isko (3133= 2) into @egp11. recode @isko (3139= 2) into @egp11. recode @isko (3140= 2) into @egp11. recode @isko (3141= 2) into @egp11. recode @isko (3142= 2) into @egp11. recode @isko (3143= 1) into @egp11. recode @isko (3144= 1) into @egp11. recode @isko (3145= 2) into @egp11. recode @isko (3150= 2) into @egp11. recode @isko (3151= 2) into @egp11. recode @isko (3152= 2) into @egp11. recode @isko (3200= 2) into @egp11. recode @isko (3210= 2) into @egp11. recode @isko (3211= 2) into @egp11. recode @isko (3212= 2) into @egp11. recode @isko (3213= 2) into @egp11. recode @isko (3220= 2) into @egp11. recode @isko (3221= 2) into @egp11. recode @isko (3222= 2) into @egp11. recode @isko (3223= 2) into @egp11. recode @isko (3224= 2) into @egp11. recode @isko (3225= 2) into @egp11.

126
recode @isko (3226= 2) into @egp11. recode @isko (3227= 2) into @egp11. recode @isko (3228= 2) into @egp11. recode @isko (3229= 2) into @egp11. recode @isko (3230= 3) into @egp11. recode @isko (3231= 3) into @egp11. recode @isko (3232= 3) into @egp11. recode @isko (3240= 2) into @egp11. recode @isko (3241= 2) into @egp11. recode @isko (3242= 2) into @egp11. recode @isko (3300= 3) into @egp11. recode @isko (3310= 3) into @egp11. recode @isko (3320= 3) into @egp11. recode @isko (3330= 3) into @egp11. recode @isko (3340= 3) into @egp11. recode @isko (3400= 2) into @egp11. recode @isko (3410= 2) into @egp11. recode @isko (3411= 2) into @egp11. recode @isko (3412= 2) into @egp11. recode @isko (3413= 2) into @egp11. recode @isko (3414= 2) into @egp11. recode @isko (3415= 2) into @egp11. recode @isko (3416= 2) into @egp11. recode @isko (3417= 2) into @egp11. recode @isko (3419= 2) into @egp11. recode @isko (3420= 2) into @egp11. recode @isko (3421= 2) into @egp11. recode @isko (3422= 2) into @egp11. recode @isko (3423= 2) into @egp11. recode @isko (3429= 2) into @egp11. recode @isko (3430= 3) into @egp11. recode @isko (3431= 2) into @egp11. recode @isko (3432= 2) into @egp11. recode @isko (3433= 3) into @egp11. recode @isko (3434= 2) into @egp11. recode @isko (3439= 3) into @egp11. recode @isko (3440= 2) into @egp11. recode @isko (3441= 2) into @egp11. recode @isko (3442= 2) into @egp11. recode @isko (3443= 2) into @egp11. recode @isko (3444= 2) into @egp11. recode @isko (3449= 2) into @egp11. recode @isko (3450= 2) into @egp11. recode @isko (3451= 2) into @egp11. recode @isko (3452= 7) into @egp11. recode @isko (3460= 3) into @egp11. recode @isko (3470= 2) into @egp11. recode @isko (3471= 2) into @egp11. recode @isko (3472= 2) into @egp11. recode @isko (3473= 2) into @egp11. recode @isko (3474= 2) into @egp11. recode @isko (3475= 2) into @egp11. recode @isko (3480= 3) into @egp11. recode @isko (4000= 3) into @egp11. recode @isko (4100= 3) into @egp11. recode @isko (4110= 3) into @egp11. recode @isko (4111= 3) into @egp11. recode @isko (4112= 3) into @egp11. recode @isko (4113= 3) into @egp11. recode @isko (4114= 3) into @egp11. recode @isko (4115= 3) into @egp11. recode @isko (4120= 3) into @egp11. recode @isko (4121= 3) into @egp11. recode @isko (4122= 3) into @egp11. recode @isko (4130= 3) into @egp11. recode @isko (4131= 3) into @egp11. recode @isko (4132= 3) into @egp11. recode @isko (4133= 3) into @egp11. recode @isko (4140= 3) into @egp11.
127
recode @isko (4141= 3) into @egp11. recode @isko (4142= 9) into @egp11. recode @isko (4143= 3) into @egp11. recode @isko (4144= 3) into @egp11. recode @isko (4190= 3) into @egp11. recode @isko (4200= 3) into @egp11. recode @isko (4210= 3) into @egp11. recode @isko (4211= 3) into @egp11. recode @isko (4212= 3) into @egp11. recode @isko (4213= 3) into @egp11. recode @isko (4214= 3) into @egp11. recode @isko (4215= 3) into @egp11. recode @isko (4220= 3) into @egp11. recode @isko (4221= 3) into @egp11. recode @isko (4222= 3) into @egp11. recode @isko (4223= 3) into @egp11. recode @isko (5000= 3) into @egp11. recode @isko (5100= 3) into @egp11. recode @isko (5110= 3) into @egp11. recode @isko (5111= 3) into @egp11. recode @isko (5112= 3) into @egp11. recode @isko (5113= 3) into @egp11. recode @isko (5120= 3) into @egp11. recode @isko (5121= 3) into @egp11. recode @isko (5122= 8) into @egp11. recode @isko (5123= 3) into @egp11. recode @isko (5130= 3) into @egp11. recode @isko (5131= 3) into @egp11. recode @isko (5132= 3) into @egp11. recode @isko (5133= 3) into @egp11. recode @isko (5139= 3) into @egp11. recode @isko (5140= 8) into @egp11. recode @isko (5141= 8) into @egp11. recode @isko (5142= 3) into @egp11. recode @isko (5143= 8) into @egp11. recode @isko (5149= 3) into @egp11. recode @isko (5150= 2) into @egp11. recode @isko (5151= 2) into @egp11. recode @isko (5152= 2) into @egp11. recode @isko (5160= 9) into @egp11. recode @isko (5161= 8) into @egp11. recode @isko (5162= 8) into @egp11. recode @isko (5163= 9) into @egp11. recode @isko (5164= 8) into @egp11. recode @isko (5169= 9) into @egp11. recode @isko (5200= 3) into @egp11. recode @isko (5210= 3) into @egp11. recode @isko (5220= 3) into @egp11. recode @isko (5230= 3) into @egp11. recode @isko (6000=10) into @egp11. recode @isko (6100=10) into @egp11. recode @isko (6110=10) into @egp11. recode @isko (6111=10) into @egp11. recode @isko (6112=10) into @egp11. recode @isko (6113=10) into @egp11. recode @isko (6114=10) into @egp11. recode @isko (6120=10) into @egp11. recode @isko (6121=10) into @egp11. recode @isko (6122=10) into @egp11. recode @isko (6123=10) into @egp11. recode @isko (6124=10) into @egp11. recode @isko (6129=10) into @egp11. recode @isko (6130=10) into @egp11. recode @isko (6131=11) into @egp11. recode @isko (6132=11) into @egp11. recode @isko (6133=11) into @egp11. recode @isko (6134=10) into @egp11. recode @isko (6140=10) into @egp11. recode @isko (6141=10) into @egp11.
128
recode @isko (6142=10) into @egp11. recode @isko (6150=10) into @egp11. recode @isko (6151=10) into @egp11. recode @isko (6152=10) into @egp11. recode @isko (6153=10) into @egp11. recode @isko (6154=10) into @egp11. recode @isko (6200=11) into @egp11. recode @isko (6210=11) into @egp11. recode @isko (7000= 8) into @egp11. recode @isko (7100= 8) into @egp11. recode @isko (7110= 8) into @egp11. recode @isko (7111= 8) into @egp11. recode @isko (7112= 8) into @egp11. recode @isko (7113= 8) into @egp11. recode @isko (7120= 8) into @egp11. recode @isko (7121= 9) into @egp11. recode @isko (7122= 9) into @egp11. recode @isko (7123= 9) into @egp11. recode @isko (7124= 8) into @egp11. recode @isko (7129= 8) into @egp11. recode @isko (7130= 8) into @egp11. recode @isko (7131= 9) into @egp11. recode @isko (7132= 8) into @egp11. recode @isko (7133= 8) into @egp11. recode @isko (7134= 8) into @egp11. recode @isko (7135= 9) into @egp11. recode @isko (7136= 8) into @egp11. recode @isko (7137= 8) into @egp11. recode @isko (7140= 8) into @egp11. recode @isko (7141= 8) into @egp11. recode @isko (7142= 9) into @egp11. recode @isko (7143= 9) into @egp11. recode @isko (7200= 8) into @egp11. recode @isko (7210= 8) into @egp11. recode @isko (7211= 8) into @egp11. recode @isko (7212= 8) into @egp11. recode @isko (7213= 8) into @egp11. recode @isko (7214= 8) into @egp11. recode @isko (7215= 8) into @egp11. recode @isko (7216= 8) into @egp11. recode @isko (7220= 8) into @egp11. recode @isko (7221= 8) into @egp11. recode @isko (7222= 8) into @egp11. recode @isko (7223= 8) into @egp11. recode @isko (7224= 8) into @egp11. recode @isko (7230= 8) into @egp11. recode @isko (7231= 8) into @egp11. recode @isko (7232= 8) into @egp11. recode @isko (7233= 8) into @egp11. recode @isko (7234= 9) into @egp11. recode @isko (7240= 8) into @egp11. recode @isko (7241= 8) into @egp11. recode @isko (7242= 8) into @egp11. recode @isko (7243= 8) into @egp11. recode @isko (7244= 8) into @egp11. recode @isko (7245= 8) into @egp11. recode @isko (7300= 8) into @egp11. recode @isko (7310= 8) into @egp11. recode @isko (7311= 8) into @egp11. recode @isko (7312= 8) into @egp11. recode @isko (7313= 8) into @egp11. recode @isko (7320= 9) into @egp11. recode @isko (7321= 9) into @egp11. recode @isko (7322= 9) into @egp11. recode @isko (7323= 8) into @egp11. recode @isko (7324= 8) into @egp11. recode @isko (7330= 9) into @egp11. recode @isko (7331= 9) into @egp11. recode @isko (7332= 9) into @egp11.
129
recode @isko (7340= 8) into @egp11. recode @isko (7341= 8) into @egp11. recode @isko (7342= 8) into @egp11. recode @isko (7343= 8) into @egp11. recode @isko (7344= 8) into @egp11. recode @isko (7345= 8) into @egp11. recode @isko (7346= 8) into @egp11. recode @isko (7400= 8) into @egp11. recode @isko (7410= 8) into @egp11. recode @isko (7411= 8) into @egp11. recode @isko (7412= 8) into @egp11. recode @isko (7413= 8) into @egp11. recode @isko (7414= 8) into @egp11. recode @isko (7415= 8) into @egp11. recode @isko (7416= 8) into @egp11. recode @isko (7420= 8) into @egp11. recode @isko (7421= 9) into @egp11. recode @isko (7422= 8) into @egp11. recode @isko (7423= 8) into @egp11. recode @isko (7424= 9) into @egp11. recode @isko (7430= 8) into @egp11. recode @isko (7431= 9) into @egp11. recode @isko (7432= 9) into @egp11. recode @isko (7433= 8) into @egp11. recode @isko (7434= 8) into @egp11. recode @isko (7435= 8) into @egp11. recode @isko (7436= 8) into @egp11. recode @isko (7437= 8) into @egp11. recode @isko (7440= 8) into @egp11. recode @isko (7441= 8) into @egp11. recode @isko (7442= 8) into @egp11. recode @isko (7500= 8) into @egp11. recode @isko (7510= 7) into @egp11. recode @isko (7520= 8) into @egp11. recode @isko (7530= 9) into @egp11. recode @isko (8000= 9) into @egp11. recode @isko (8100= 9) into @egp11. recode @isko (8110= 8) into @egp11. recode @isko (8111= 8) into @egp11. recode @isko (8112= 8) into @egp11. recode @isko (8113= 8) into @egp11. recode @isko (8120= 8) into @egp11. recode @isko (8121= 8) into @egp11. recode @isko (8122= 8) into @egp11. recode @isko (8123= 8) into @egp11. recode @isko (8124= 8) into @egp11. recode @isko (8130= 9) into @egp11. recode @isko (8131= 9) into @egp11. recode @isko (8139= 9) into @egp11. recode @isko (8140= 9) into @egp11. recode @isko (8141= 9) into @egp11. recode @isko (8142= 9) into @egp11. recode @isko (8143= 9) into @egp11. recode @isko (8150= 8) into @egp11. recode @isko (8151= 8) into @egp11. recode @isko (8152= 8) into @egp11. recode @isko (8153= 8) into @egp11. recode @isko (8154= 8) into @egp11. recode @isko (8155= 8) into @egp11. recode @isko (8159= 8) into @egp11. recode @isko (8160= 8) into @egp11. recode @isko (8161= 8) into @egp11. recode @isko (8162= 8) into @egp11. recode @isko (8163= 8) into @egp11. recode @isko (8170= 8) into @egp11. recode @isko (8171= 8) into @egp11. recode @isko (8172= 8) into @egp11. recode @isko (8200= 9) into @egp11. recode @isko (8210= 8) into @egp11.

130
recode @isko (8211= 8) into @egp11. recode @isko (8212= 9) into @egp11. recode @isko (8220= 9) into @egp11. recode @isko (8221= 9) into @egp11. recode @isko (8222= 9) into @egp11. recode @isko (8223= 9) into @egp11. recode @isko (8224= 9) into @egp11. recode @isko (8229= 9) into @egp11. recode @isko (8230= 9) into @egp11. recode @isko (8231= 9) into @egp11. recode @isko (8232= 9) into @egp11. recode @isko (8240= 9) into @egp11. recode @isko (8250= 9) into @egp11. recode @isko (8251= 9) into @egp11. recode @isko (8252= 9) into @egp11. recode @isko (8253= 9) into @egp11. recode @isko (8260= 9) into @egp11. recode @isko (8261= 9) into @egp11. recode @isko (8262= 9) into @egp11. recode @isko (8263= 9) into @egp11. recode @isko (8264= 9) into @egp11. recode @isko (8265= 9) into @egp11. recode @isko (8266= 9) into @egp11. recode @isko (8269= 9) into @egp11. recode @isko (8270= 9) into @egp11. recode @isko (8271= 9) into @egp11. recode @isko (8272= 9) into @egp11. recode @isko (8273= 9) into @egp11. recode @isko (8274= 9) into @egp11. recode @isko (8275= 9) into @egp11. recode @isko (8276= 9) into @egp11. recode @isko (8277= 9) into @egp11. recode @isko (8278= 9) into @egp11. recode @isko (8279= 9) into @egp11. recode @isko (8280= 9) into @egp11. recode @isko (8281= 9) into @egp11. recode @isko (8282= 9) into @egp11. recode @isko (8283= 9) into @egp11. recode @isko (8284= 9) into @egp11. recode @isko (8285= 9) into @egp11. recode @isko (8286= 9) into @egp11. recode @isko (8290= 9) into @egp11. recode @isko (8300= 9) into @egp11. recode @isko (8310= 9) into @egp11. recode @isko (8311= 8) into @egp11. recode @isko (8312= 9) into @egp11. recode @isko (8320= 9) into @egp11. recode @isko (8321= 9) into @egp11. recode @isko (8322= 9) into @egp11. recode @isko (8323= 9) into @egp11. recode @isko (8324= 9) into @egp11. recode @isko (8330= 9) into @egp11. recode @isko (8331=10) into @egp11. recode @isko (8332= 8) into @egp11. recode @isko (8333= 8) into @egp11. recode @isko (8334= 9) into @egp11. recode @isko (8340= 9) into @egp11. recode @isko (8400= 9) into @egp11. recode @isko (9000= 9) into @egp11. recode @isko (9100= 3) into @egp11. recode @isko (9110= 3) into @egp11. recode @isko (9111= 3) into @egp11. recode @isko (9112= 3) into @egp11. recode @isko (9113= 3) into @egp11. recode @isko (9120= 9) into @egp11. recode @isko (9130= 9) into @egp11. recode @isko (9131= 9) into @egp11. recode @isko (9132= 9) into @egp11. recode @isko (9133= 9) into @egp11.

131
recode @isko (9140= 9) into @egp11. recode @isko (9141= 9) into @egp11. recode @isko (9142= 9) into @egp11. recode @isko (9150= 9) into @egp11. recode @isko (9151= 9) into @egp11. recode @isko (9152= 9) into @egp11. recode @isko (9153= 9) into @egp11. recode @isko (9160= 9) into @egp11. recode @isko (9161= 9) into @egp11. recode @isko (9162= 9) into @egp11. recode @isko (9200= 9) into @egp11. recode @isko (9210=10) into @egp11. recode @isko (9211=10) into @egp11. recode @isko (9212=10) into @egp11. recode @isko (9213=10) into @egp11. recode @isko (9300= 9) into @egp11. recode @isko (9310= 9) into @egp11. recode @isko (9311= 9) into @egp11. recode @isko (9312= 9) into @egp11. recode @isko (9313= 9) into @egp11. recode @isko (9320= 9) into @egp11. recode @isko (9321= 9) into @egp11. recode @isko (9322= 9) into @egp11. recode @isko (9330= 9) into @egp11. recode @isko (9331= 9) into @egp11. recode @isko (9332= 9) into @egp11. recode @isko (9333= 9) into @egp11. execute. DO REPEAT E=@egp11 / IS=@ISKO / sv=@supvis / s=@sempl. COMMENT #P CODES PROMOTABILITY OF CERTAIN OCCUPATIONS. COMPUTE #P=IS. RECODE #P (1000 thru 9299=1)(else=0). compute #d=is. comment #d codes degradability of certain occupations. recode #d (1300 thru 1319 3400 thru 3439 4000 thru 5230=1)(else=0). IF ((E=3) AND (SV GE 1)) E=2. if ((e eq 3 or e eq 2) and (s eq 2) and (#d=1)) e=4. IF ((E GE 7 AND E LE 9) AND (S=2) and (#p=1)) E=5. IF ((E=8) AND (SV GE 1)) E=7. IF ((E=10) AND (S=2)) E=11. IF ((E=4) AND (SV lt 1)) E=5. IF ((E=5) AND (SV Ge 1)) E=4. IF ((E=2 OR E=3 OR E=4) AND (SV GE 10)) E=1. end repeat. execute. recode @egp11 (4=5)(5=6). do repeat egp=@egp11 /isko=@isko. do if (egp eq 3). recode isko (4142 4190 4200 thru 4215 5000 thru 5239=4) into egp. end if. end repeat. /***************************/ /* Define missing value */ /***************************/ do if (missing(@egp11)). recode iscoco (else=copy) into @egp11. end if. missing value @egp11 (100 thru 99999). /***************************/ /* Define value labels */ /***************************/
132
Var labels @egp11 'EGP Class scheme: Ganzeboom version'. add value labels @egp11 1 ' I Higher controllers' 2 ' II Lower controllers' 3 'IIIa Routine non-manuals' 4 'IIIb Lower sales-service' 5 'IVa Self-empl. with empl.' 6 'IVb Self-empl. no empl.' 7 ' V Manual supervisors' 8 ' VI Skilled workers' 9 'VIIa Unskilled workers' 10 'VIIb Farm labors' 11 'IVc Self-empl. farmers' 100 'armed forces' 2470 "Pubblic service administrative professionals" 7139 "Build finiscer, rel. trade work not else class" 8287 "Composite products assemblers" 66666 'Not applicable' 77777 'Refusal' 88888 "Don't know" 99999 'No answer'. execute. freq @egp11. delete variable emplno1 njbspv1 jbspv1 @sempl @supvis.

133
* ___________________________________________________________ ERIK WRIGHT'S CLASS SCHEMES ------------ WR - FULL VERSION OF WRIGHT'S CLASS SCHEME (exploitation model) WR_SIMP - SIMPLIFIED VERSION OF WRIGHT'S CLASS SCHEME (exploitation model) WR_P – MODIFIED VERSION OF WRIGHT’S POWER MODEL (ownership, dec.making, work autonomy, with skill as as a new an addititional criteria of differentiation). ___________________________________________________________. Håkon Leiulfsrud and Heidi Jensberg Norwegian University of Science and Technology (NTNU) Department of Sociology and Political Science, Trondheim Program Version (Nov 2004/ April 2005). * Variable construction and spss program of Wright classes. * Variables in use: * Iscoco: Occupation, isco88 (COM) * Emplno: F13 Number of employees * Emplrel: F12 Employment relation * Jbspv: F16 Responsible for supervising other employees * njbspv: F17 Number of people responsible for in job * Empl: E29 Employment status * Orgwrk: F18 To what extent the respondent organize his/her own work * Wkdscin: E33 Allowed to influence decisions about work direction. *Three categories of self-empoyed - In a first step we separate between different strata of the self-employed according to numbers of employees. *Spss program for construction 'emplno3' RECODE emplno (0=0) (1 thru 9=1) (10 thru 2000=2) (ELSE=sysmis) INTO emplno3 . VARIABLE LABELS emplno3 how many employees 3 categories. val labels emplno3 0 '0 Employees' 1 '1-9 Employees' 2 '10 or more Employees' EXECUTE . * Program for constructing 'employed'. recode emplrel (1=1) (2 3 =0) (else=sysmis) into employed. Val lab employed 0 'self employed' 1 'employees'. EXEC. * Program for constructing 'occr' compute occr=Iscoco. recode occr (2212, 2221, 2222, 2223, 2224, 2220=1) (2229, 2230, 3220, 3223, 3224, 3226, 3229, 3231, 3232=2) (2411=3) (2320, 2331, 2332, 2340, 2351, 2359, 3310, 3320, 3330, 3340, 2300, 2330, 2350, 3300 =4) (2310, 2400, 2410, 2431, 2432, 2430 =5) (2211, 2212, 2213, 2412, 2419, 2441 thru 2445, 2000, 2210, 2440=5.5) (2111, 2112, 2113, 2121, 2122, 2131, 2139, 2141, 2142, 2143, 2144, 2145, 2146, 2147, 2148, 2149, 3112, 3141, 3434, 2100, 2110, 2114, 2130, 2140 =6) (3114, 3117, 3118, 3121, 3122, 3123, 3131, 3132, 3133, 3139, 3142, 3143, 3144, 3145, 3211, 3212, 3213, 3111, 3113, 3115, 3116, 3119, 3151=7) (2446, 2460, 2470, 3423, 3429, 3432, 3460, 3480, 5150 =8) (2421, 2422, 2429=9) (2451, 2452, 2453, 2454, 2455, 3471, 3472, 3473, 3474, 3475, 5210, 2450, 3470, 3000, 3100, 3110, 3120, 3130, 3140, 3150, 3200, 3210 =10) (1110, 1141, 1142, 1143, 2352, 3152, 1140=11)
134
(1210, 1231, 1232, 1234, 1235, 1236, 1237, 1238, 1239, 1316, 1317, 1318, 1319, 3416=12) (1225, 1233, 1314, 1315=13) (3431, 3233, 4115 =14) (4111, 4112, 4113, 4114, 4121, 4122, 4131, 4132, 4133, 4141, 4142, 4143, 4144, 4190, 4211, 4212, 4213, 4214, 4215, 4221, 4222, 4223, 3430, 4000, 4100, 4110, 4120, 4130, 4140, 4200, 4210, 4220=15) (3411, 3412, 3413, 3414, 3415, 3417, 3419, 3421, 3422, 5220, 5221, 5222, 5223, 5230, 9111, 9113, 3400, 3410, 3420, 5200, 9100, 9110=16) (1221, 1222, 1226, 1227, 1228, 1229, 1223, 1224,1311, 1312, 1313, 1200, 1220, 1300, 1310, =17) (7111 thru 7113, 7121 thru 7137, 7139 thru 7143, 7211 thru 7216, 7221 thru 7224, 7231 thru 7245, 7311 thru 7313, 7321 thru 7324, 7331, 7332, 7341 thru 7343, 7345, 7346, 7411 thru 7413, 7415, 7421, 7422, 7433 thru 7437, 7441, 7442, 8124, 7000, 7100, 7110, 7120, 7200, 7210, 7220, 7230, 7300, 7310, 7320, 7330, 7340, 7400=18) (3441 thru 3444, 3449, 3450, 5161 thru 5163, 5169, 0100, 5160=19) (5112, 8311, 8312, 8321 thru 8324, 8331 thru 8334, 8340, 8300, 8310, 8320, 8330=20) (7344, 7414, 7416, 7423, 7424, 7431, 7432, 8111, 8112, 8113, 8121 thru 8123, 8131, 8139 thru 8143, 8151 thru 8155, 8159 thru 8163, 8170, 8211, 8212, 8221 thru 8224, 8229 thru 8232, 8240, 8251 thru 8253, 8261 thru 8266, 8269 thru 8287, 8290, 9320, 7410, 7420, 7430, 8000, 8100, 8110, 8120, 8130, 8150, 8200, 8210, 8220, 8250, 8260=21) (6121 thru 6129, 6142, 9142, 9161, 9311 thru 9313, 9330, 9300, 9310=22) (6141, 6151 thru 6154, 9211, 9212, 9213, 6140, 6150, 9200, 9210=23) (3221, 3222, 3225, 3227, 3228=24) (5113, 5122, 5141, 5140=25) (5111, 5121, 5131 thru 5139, 5142, 5143, 5149, 9120, 9131 thru 9133, 9141, 9151 thru 9153, 9162, 5000, 5120, 5123, 5130, 9000,9130, 9140, 9150, 9160=26) (6121 thru 6130, 6111, 6112, 6000, 6100, 6110, 6120=27) (1100=11) (1230=12) (2420=9) (3230=2) (3433=14) (3440=19) (5100=sysmis). exe. val lab occr 1 'Physicians and dentists' 2 'Other medical and paramedical' 3 'Accountants, auditors, actuaries' 4'Teachers: elementary and secondary' 5 'Teachers: university, social sc, librarians' 5.5 'Other univ professionals' 6 'Mathematicians, engineers etc' 7 'Technicians etc' 8 'Public advisors' 9 'Lawyers and judges' 10 'Arts and entertainment' 11 'Managers: public and quasi-public' 12 'Managers: corporate' 13 'Managers: other' 14 'Secretaries' 15 'Other clerical' 16 'Sales' 17 'Foremen' 18 'Crafts' 19 'Government protective workers' 20 'Transportation workers' 21 'Operatives, except transportation' 22 'Laborers, except farm laborers' 23 'Farm Workers' 24 'White collar services' 25 'Skilled manual services' 26 'Lowskilled services' 27 'Farmers and related profession '. exe.

135
* Program for constructing 'Skill2' compute skill2=OCCR. recode skill2 (1, 3, 5, 5.5, 6, 9, 11, 12=1) (2, 4, 7, 8, 10, 13, 17, 18, 19, 25, 27=2) (14, 15, 16, 20, 21, 22, 23, 24, 26=3). value labels skill2 1 'Expert' 2 'Skilled' 3 'Low/semi skilled'. exe. * MAN1: How to differentiate between supervisors and managers MAN1 is based on the variables wkdcsin, employed, jbspv and orgwrk. * 1. Program for constructing wdec1 When using this variable we only include economically active respondents. recode wkdcsin (0 thru 7=0) (8 thru 10=1) (else=sysmis) into wdec1. var lab wdec1 1 'wkdcsin collapsed'. val lab wdec1 1 '8+'. exec. * The varaible DP (decision power) is based on jbspv and wdec1 (only for those economic active). * 2. Program for constructing DP (decision power). compute DP =0. if (employed=1 & jbspv=1 & wdec1=1) DP =1. if (employed=1 & jbspv=1 & wdec1=0) DP =2. if (employed=1 & jbspv=2 & wdec1=1) DP =3. if (employed=1 & jbspv=2 & wdec1=0) DP =4. recode DP (0=sysmis). val lab DP 1 'boss w/influence' 2 'boss w/little or mod influence' 3 'not boss w/influence' 4 'not boss w/little or mod influence'. * We are now ready to construct man1. * 3. Constructing man1. compute man1=0. if (employed=1 & DP =1 & orgwrk=1)man1=1. if (employed=1 & DP =1 & orgwrk>2)man1=3. if (employed=1 & DP =2 & orgwrk=1)man1=2. if (employed=1 & DP =1 & orgwrk=2)man1=2. if (employed=1 & DP =2 & orgwrk>1)man1=3. if (employed=1 & DP =3 & orgwrk=1)man1=2. if (employed=1 & DP =3 & orgwrk>1)man1=3. if (employed=1 & DP =4 & orgwrk=1)man1=3. if (employed=1 & DP =4 & orgwrk>1)man1=4. recode man1 (0=sysmis). exec. val lab man1 1 'managers' 2 'supervisors' 3 'not clear' 4 'not boss'. * Constructing the simple Wright model - WR SIMP.

136
* Program file for constructing WR_SIMP Variables needed: Emplno3; Employed; Jbspv; Skill2. compute WR_SIMP =0. if (emplno3=2) WR_SIMP =1. if (emplno3=1) WR_SIMP =2. if (emplno3=0) WR_SIMP =3. if (employed=1 & jbspv=1 & skill2=1) WR_SIMP =4. if (employed=1 & jbspv=2 & skill2=1) WR_SIMP =6. if (employed=1 & jbspv=1 & skill2=2) WR_SIMP =7. if (employed=1 & jbspv=2 & skill2=2) WR_SIMP =9. if (employed=1 & jbspv=1 & skill2=3) WR_SIMP =10. if (employed=1 & jbspv=2 & skill2=3) WR_SIMP =12. recode wr_simp (0=sysmis). VAL LAB WR_SIMP 1 'self empl w/10+ employees' 2 'self empl w/1-9 employees' 3 'self empl w/no empoyees' 4 'expert managers' 6 'expert workers' 7 'skilled manager/superv' 9 'skilled workers' 10 'low skilled manager/superv' 12 'low skilled workers'. * Constructing the complex Wright model – WR_DM (decision-making) - Our variable WR_ SIMP does not differentiate between managers and supervisors - It is based on the variable DP which combines wdec1 (se introduction) and leadership (jbspv) - DP and orgwrk constitutes the manager variable that separates between managers and supervisors. * Variables needed: wr_simp; MAN1. compute WR_DM=0. if (wr_simp =4 & man1=1) WR_DM =4. if ((wr_simp =4 or wr_simp =6) & (man1=2)) WR_DM =5. if ((wr_simp =4 or wr_simp =6) & (man1>2)) WR_DM =6. if (wr_simp =7 & man1=1) WR_DM =7. if ((wr_simp =7 or wr_simp =9) & (man1=2)) WR_DM =8. if ((wr_simp =7 or wr_simp =9) & (man1>2)) WR_DM =9. if ((wr_simp =10 or wr_simp =12) & (man1=1)) WR_DM =10. if ((wr_simp =10 or wr_simp =12) & (man1=2)) WR_DM =11. if ((wr_simp =10 or wr_simp =12) & (man1>2)) WR_DM =12. if (wr_simp =1) WR_DM =1. if (wr_simp =2) WR_DM =2. if (wr_simp =3) WR_DM =3. recode WR_DM (0=sysmis) (else=copy). rename var (WR_DM = WR). exec. val lab WR 1 'Self empl w/10+ employees' 2 'Self empl w/1-9 employees' 3 'Self empl w/no empoyees' 4 'Expert managers' 5 'Expert supervisors' 6 'Experts' 7 'Skilled managers' 8 'Skilled supervisors' 9 'Skilled workers'

137
10 'Low skilled managers' 11 'Low skilled supervisors' 12 'Low skilled workers'. freq WR. ---------------------------------------------------------------------------------------------------- Construction of WR_P (Power Class) april 8, 2005 * Reconstruction of Wright's original class model based on power and work autonomy. Experts, skilled workers and unskilled workers are either ending up as semi autonomous employees or workers in this model. We have also made an addition to Wright's model from the late 1970's differentiating between expert/skilled managers and supervisors. The new variable PC is a temporary step recoding WR. The new variable WR_P is based on WR (and later PC). The question, 'Are you allowed to decide how daily work is organized (scale from = 0, no influence to 10, I have complete control). Those ending up in PC =6 (experts), 7 (skilled workers) and 7,5 (unskilled workers) with low automy (0-7 on variable WKDCORG) are defined as workers. Those having a values 8-10 on the same variable are defined as semi autonomous.. ----------------------------------------------------------------------------------------------------- recode WR (1=1) (2=2) (3=3) (4 7=4) (10=4.5) (5 8= 5) (11=5.5) (6=6) (9=7) (12=7.5) INTO PC. compute WR_P= PC. if ((pc=6 or pc=7) & (wkdcorg ge 8 & wkdcorg le 10)) wr_p=6. if ((pc=6 or pc=7) & (wkdcorg ge 0 & wkdcorg le 7)) wr_p=6.5. if (pc=7.5 & (wkdcorg ge 8 & wkdcorg le 10)) wr_p=7. if (pc=7.5 & (wkdcorg ge 0 & wkdcorg le 7)) wr_p=7.5. exec. recode wr_p (6.5=7) (7=6.5) (else= copy). FREQ wr_p. Val lab WR_P 1 'Capitalist' 2 'Small Employers' 3 'Self Empl' 4 'Skilled Managers' 4.5 'Low skilled Managers' 5 'Skilled supervisors' 5.5 'Low skilled Supervisors' 6 'Skilled Semi autonomous' 6.5 'Low skilled Semi autonomous'

138
7 'Skilled workers' 7.5 'Low skilled workers'. freq wr_p.

139
_____________________________________________________________________ ESPING - ANDERSEN ------------ POST - INDUSTRIAL CLASS SCHEME _____________________________________________________________________ Ivano Bison University of Trento Dep. of Sociology and Social Research. /******************************************************************************************/ /* This program is based on ISCO88 for the ESS data 2002-2003 */ /* Program version 1.0 - december 2004 */ /*******************************************************************************************/ /* Dear user, */ /* this program creates the Esping-Andersen post-industrial class classification */ /* This program use the EGP class scheme, before use run ESS EGP class program */ /* Dear user, please specify the data set containing the ISCO88 4-digits information and EGP10 create by ESS EGP class program */ /* in the following line you have to specify the data set's variable containing the ISCO88 4-digits information and EGP10 variable*/ * GET FILE='C:\dati\Hakon\ESS1E05_F1.sav'. /* OR if you do not have EGP10 variable please before run "ESS EGP class scheme.sps" program and after run this program */ ************************************************************ ATTENTION: This program use the EGP class scheme Before use run ESS EGP class program ************************************************************. recode @isko (1000= 0) into @esp10. recode @isko (1100= 0) into @esp10. recode @isko (1110= 0) into @esp10. recode @isko (1120= 0) into @esp10. recode @isko (1130= 1) into @esp10. recode @isko (1140= 1) into @esp10. recode @isko (1141= 1) into @esp10. recode @isko (1142= 1) into @esp10. recode @isko (1143= 1) into @esp10. recode @isko (1200= 0) into @esp10. recode @isko (1210= 0) into @esp10. recode @isko (1220= 0) into @esp10. recode @isko (1221=11) into @esp10. recode @isko (1222= 0) into @esp10. recode @isko (1223= 0) into @esp10. recode @isko (1224= 0) into @esp10. recode @isko (1225= 0) into @esp10. recode @isko (1226= 0) into @esp10. recode @isko (1227= 0) into @esp10. recode @isko (1228= 0) into @esp10. recode @isko (1229= 0) into @esp10. recode @isko (1230= 0) into @esp10. recode @isko (1231= 0) into @esp10. recode @isko (1232= 0) into @esp10. recode @isko (1233= 0) into @esp10. recode @isko (1234= 0) into @esp10. recode @isko (1235= 0) into @esp10. recode @isko (1236= 0) into @esp10. recode @isko (1237= 0) into @esp10. recode @isko (1239= 0) into @esp10. recode @isko (1240= 1) into @esp10.

140
recode @isko (1250= 0) into @esp10. recode @isko (1251= 0) into @esp10. recode @isko (1252= 1) into @esp10. recode @isko (1300= 1) into @esp10. recode @isko (1310= 1) into @esp10. recode @isko (1311=11) into @esp10. recode @isko (1312= 1) into @esp10. recode @isko (1313= 1) into @esp10. recode @isko (1314= 1) into @esp10. recode @isko (1315= 1) into @esp10. recode @isko (1316= 1) into @esp10. recode @isko (1317= 1) into @esp10. recode @isko (1318= 1) into @esp10. recode @isko (1319= 1) into @esp10. recode @isko (2000= 2) into @esp10. recode @isko (2100= 2) into @esp10. recode @isko (2110= 2) into @esp10. recode @isko (2111= 2) into @esp10. recode @isko (2112= 2) into @esp10. recode @isko (2113= 2) into @esp10. recode @isko (2114= 2) into @esp10. recode @isko (2120= 2) into @esp10. recode @isko (2121= 2) into @esp10. recode @isko (2122= 2) into @esp10. recode @isko (2130= 2) into @esp10. recode @isko (2131= 2) into @esp10. recode @isko (2132= 3) into @esp10. recode @isko (2139= 3) into @esp10. recode @isko (2140= 2) into @esp10. recode @isko (2141= 2) into @esp10. recode @isko (2142= 2) into @esp10. recode @isko (2143= 2) into @esp10. recode @isko (2144= 2) into @esp10. recode @isko (2145= 2) into @esp10. recode @isko (2146= 2) into @esp10. recode @isko (2147= 2) into @esp10. recode @isko (2148= 2) into @esp10. recode @isko (2149= 2) into @esp10. recode @isko (2200= 2) into @esp10. recode @isko (2210= 2) into @esp10. recode @isko (2211= 2) into @esp10. recode @isko (2212= 2) into @esp10. recode @isko (2213= 2) into @esp10. recode @isko (2220= 2) into @esp10. recode @isko (2221= 2) into @esp10. recode @isko (2222= 2) into @esp10. recode @isko (2223= 2) into @esp10. recode @isko (2224= 2) into @esp10. recode @isko (2229= 2) into @esp10. recode @isko (2230= 4) into @esp10. recode @isko (2300= 4) into @esp10. recode @isko (2310= 2) into @esp10. recode @isko (2320= 4) into @esp10. recode @isko (2321= 4) into @esp10. recode @isko (2322= 4) into @esp10. recode @isko (2330= 4) into @esp10. recode @isko (2331= 4) into @esp10. recode @isko (2332= 4) into @esp10. recode @isko (2340= 4) into @esp10. recode @isko (2350= 2) into @esp10. recode @isko (2351= 4) into @esp10. recode @isko (2352= 2) into @esp10. recode @isko (2359= 4) into @esp10. recode @isko (2400= 2) into @esp10. recode @isko (2410= 2) into @esp10. recode @isko (2411= 2) into @esp10. recode @isko (2412= 2) into @esp10. recode @isko (2419= 2) into @esp10. recode @isko (2420= 2) into @esp10.

141
recode @isko (2421= 2) into @esp10. recode @isko (2422= 2) into @esp10. recode @isko (2429= 2) into @esp10. recode @isko (2430= 4) into @esp10. recode @isko (2431= 4) into @esp10. recode @isko (2432= 4) into @esp10. recode @isko (2440= 2) into @esp10. recode @isko (2441= 2) into @esp10. recode @isko (2442= 2) into @esp10. recode @isko (2443= 2) into @esp10. recode @isko (2444= 4) into @esp10. recode @isko (2445= 2) into @esp10. recode @isko (2446= 4) into @esp10. recode @isko (2450= 2) into @esp10. recode @isko (2451= 2) into @esp10. recode @isko (2452= 2) into @esp10. recode @isko (2453= 2) into @esp10. recode @isko (2454= 2) into @esp10. recode @isko (2455= 2) into @esp10. recode @isko (2460= 4) into @esp10. if ((@isko eq 2460) and any(@egp10,1,2,3,5,6,10)) @esp10=2. recode @isko (2470= 2) into @esp10. recode @isko (3000= 3) into @esp10. recode @isko (3100= 3) into @esp10. recode @isko (3110= 3) into @esp10. recode @isko (3111= 3) into @esp10. recode @isko (3112= 3) into @esp10. recode @isko (3113= 3) into @esp10. recode @isko (3114= 3) into @esp10. recode @isko (3115= 3) into @esp10. recode @isko (3116= 3) into @esp10. recode @isko (3117= 3) into @esp10. recode @isko (3118= 3) into @esp10. recode @isko (3119= 3) into @esp10. recode @isko (3120= 3) into @esp10. recode @isko (3121= 3) into @esp10. recode @isko (3122= 3) into @esp10. recode @isko (3123= 3) into @esp10. recode @isko (3130= 3) into @esp10. recode @isko (3131= 5) into @esp10. recode @isko (3132= 5) into @esp10. recode @isko (3133= 3) into @esp10. recode @isko (3139= 3) into @esp10. recode @isko (3140= 3) into @esp10. recode @isko (3141= 3) into @esp10. recode @isko (3142= 2) into @esp10. recode @isko (3143= 2) into @esp10. recode @isko (3144= 3) into @esp10. recode @isko (3145= 3) into @esp10. recode @isko (3150= 3) into @esp10. recode @isko (3151= 3) into @esp10. recode @isko (3152= 3) into @esp10. recode @isko (3200= 3) into @esp10. recode @isko (3210= 3) into @esp10. recode @isko (3211= 3) into @esp10. recode @isko (3212= 11) into @esp10. recode @isko (3213= 11) into @esp10. recode @isko (3220= 3) into @esp10. recode @isko (3221= 3) into @esp10. recode @isko (3222= 5) into @esp10. recode @isko (3223= 3) into @esp10. recode @isko (3224= 4) into @esp10. recode @isko (3225= 5) into @esp10. recode @isko (3226= 5) into @esp10. recode @isko (3227= 3) into @esp10. recode @isko (3228= 3) into @esp10. recode @isko (3229= 3) into @esp10. recode @isko (3230= 4) into @esp10. recode @isko (3231= 4) into @esp10.

142
recode @isko (3232= 4) into @esp10. recode @isko (3240= 4) into @esp10. recode @isko (3241= 4) into @esp10. recode @isko (3242= 9999) into @esp10. recode @isko (3300= 4) into @esp10. recode @isko (3310= 4) into @esp10. recode @isko (3320= 4) into @esp10. recode @isko (3330= 4) into @esp10. recode @isko (3340= 4) into @esp10. recode @isko (3400= 2) into @esp10. recode @isko (3410= 2) into @esp10. if ((@isko eq 3410) and any(@egp10,3,4,7,8,9,11)) @esp10=7. recode @isko (3411= 2) into @esp10. if ((@isko eq 3411) and any(@egp10,3,4,7,8,9,11)) @esp10=7. recode @isko (3412= 2) into @esp10. if ((@isko eq 3412) and any(@egp10,3,4,7,8,9,11)) @esp10=7. recode @isko (3413= 8) into @esp10. recode @isko (3414= 8) into @esp10. recode @isko (3415= 8) into @esp10. recode @isko (3416= 8) into @esp10. recode @isko (3417= 7) into @esp10. recode @isko (3419= 8) into @esp10. recode @isko (3420= 8) into @esp10. recode @isko (3421= 8) into @esp10. recode @isko (3422= 4) into @esp10. recode @isko (3423= 4) into @esp10. recode @isko (3429= 8) into @esp10. recode @isko (3430= 7) into @esp10. recode @isko (3431= 7) into @esp10. recode @isko (3432= 7) into @esp10. recode @isko (3433= 7) into @esp10. recode @isko (3434= 3) into @esp10. recode @isko (3439= 7) into @esp10. recode @isko (3440= 7) into @esp10. recode @isko (3441= 7) into @esp10. recode @isko (3442= 7) into @esp10. recode @isko (3443= 7) into @esp10. recode @isko (3444= 7) into @esp10. recode @isko (3449= 7) into @esp10. recode @isko (3450= 5) into @esp10. recode @isko (3451= 5) into @esp10. recode @isko (3452= 5) into @esp10. recode @isko (3460= 4) into @esp10. recode @isko (3470= 4) into @esp10. recode @isko (3471= 5) into @esp10. recode @isko (3472= 4) into @esp10. recode @isko (3473= 6) into @esp10. recode @isko (3474= 6) into @esp10. recode @isko (3475= 2) into @esp10. recode @isko (3480= 4) into @esp10. recode @isko (4000= 7) into @esp10. recode @isko (4100= 7) into @esp10. recode @isko (4110= 7) into @esp10. recode @isko (4111= 7) into @esp10. recode @isko (4112= 7) into @esp10. recode @isko (4113= 7) into @esp10. recode @isko (4114= 7) into @esp10. recode @isko (4115= 7) into @esp10. recode @isko (4120= 7) into @esp10. recode @isko (4121= 7) into @esp10. recode @isko (4122= 7) into @esp10. recode @isko (4130= 7) into @esp10. recode @isko (4131= 7) into @esp10. recode @isko (4132= 7) into @esp10. recode @isko (4133= 7) into @esp10. recode @isko (4140= 7) into @esp10. recode @isko (4141= 7) into @esp10. recode @isko (4142= 6) into @esp10. recode @isko (4143= 7) into @esp10.

143
recode @isko (4144= 7) into @esp10. recode @isko (4190= 7) into @esp10. recode @isko (4200= 7) into @esp10. recode @isko (4210= 7) into @esp10. recode @isko (4211= 8) into @esp10. recode @isko (4212= 7) into @esp10. recode @isko (4213= 8) into @esp10. recode @isko (4214= 7) into @esp10. recode @isko (4215= 7) into @esp10. recode @isko (4220= 7) into @esp10. recode @isko (4221= 8) into @esp10. recode @isko (4222= 7) into @esp10. recode @isko (4223= 7) into @esp10. recode @isko (5000= 5) into @esp10. recode @isko (5100= 5) into @esp10. recode @isko (5110= 5) into @esp10. recode @isko (5111= 5) into @esp10. recode @isko (5112= 5) into @esp10. recode @isko (5113= 6) into @esp10. recode @isko (5120= 6) into @esp10. recode @isko (5121= 6) into @esp10. recode @isko (5122= 5) into @esp10. recode @isko (5123= 6) into @esp10. recode @isko (5130= 6) into @esp10. recode @isko (5131= 6) into @esp10. recode @isko (5132= 6) into @esp10. recode @isko (5133= 6) into @esp10. recode @isko (5139= 6) into @esp10. recode @isko (5140= 6) into @esp10. recode @isko (5141= 5) into @esp10. recode @isko (5142= 5) into @esp10. recode @isko (5143= 5) into @esp10. recode @isko (5149= 6) into @esp10. recode @isko (5150= 6) into @esp10. recode @isko (5151= 6) into @esp10. recode @isko (5152= 6) into @esp10. recode @isko (5160= 5) into @esp10. recode @isko (5161= 5) into @esp10. recode @isko (5162= 5) into @esp10. recode @isko (5163= 5) into @esp10. recode @isko (5164= 5) into @esp10. recode @isko (5169= 5) into @esp10. recode @isko (5200= 6) into @esp10. recode @isko (5210= 6) into @esp10. recode @isko (5220= 8) into @esp10. recode @isko (5230= 6) into @esp10. recode @isko (6000=11) into @esp10. recode @isko (6100=11) into @esp10. recode @isko (6110=11) into @esp10. recode @isko (6111=11) into @esp10. recode @isko (6112=11) into @esp10. recode @isko (6113=11) into @esp10. recode @isko (6114=11) into @esp10. recode @isko (6120=11) into @esp10. recode @isko (6121=11) into @esp10. recode @isko (6122=11) into @esp10. recode @isko (6123=11) into @esp10. recode @isko (6124=11) into @esp10. recode @isko (6129=11) into @esp10. recode @isko (6130=11) into @esp10. recode @isko (6131=11) into @esp10. recode @isko (6132=11) into @esp10. recode @isko (6133=11) into @esp10. recode @isko (6134=11) into @esp10. recode @isko (6140=11) into @esp10. recode @isko (6141=11) into @esp10. recode @isko (6142=11) into @esp10. recode @isko (6150=11) into @esp10. recode @isko (6151=11) into @esp10.
144
recode @isko (6152=11) into @esp10. recode @isko (6153=11) into @esp10. recode @isko (6154=11) into @esp10. recode @isko (6200=11) into @esp10. recode @isko (6210=11) into @esp10. recode @isko (9000= 6) into @esp10. recode @isko (9120= 6) into @esp10. recode @isko (9130= 6) into @esp10. recode @isko (9131= 6) into @esp10. recode @isko (9132= 6) into @esp10. recode @isko (9133= 6) into @esp10. recode @isko (9140= 6) into @esp10. recode @isko (9141= 6) into @esp10. recode @isko (9150= 6) into @esp10. recode @isko (9151= 6) into @esp10. recode @isko (9152= 6) into @esp10. recode @isko (9153= 6) into @esp10. recode @isko (9160= 6) into @esp10. recode @isko (9162= 6) into @esp10. recode @isko (1000 thru 1999=1) (2000 thru 2999=2) (3000 thru 3999=3) (4000 thru 4999=4) (5000 thru 5999=5) (6000 thru 6999=6) (7000 thru 7999=7) (8000 thru 8999=8) (9000 thru 9999=9) into iscogrp. execute. recode @esp10 (sysmis=99) (11=15). if ((@egp10 eq 7) and (@esp10 eq 99)) @esp10=9. if ((@egp10 eq 8) and (@esp10 eq 99)) @esp10=9. if ((@egp10 eq 9) and (@esp10 eq 99)) @esp10=10. if ((@egp10 eq 10)) @esp10=11. if ((@egp10 eq 11)) @esp10=12. if (any(iscogrp,4,5) and any(@egp10,4,8,9) and (@esp10 eq 10)) @esp10=6. if (any(iscogrp,4,5) and any(@egp10,4,8,9) and (@esp10 eq 9)) @esp10=5. if (any(iscogrp,4,5) and any(@egp10,4,8,9) and (@esp10 eq 99)) @esp10=6. if ((@egp10 eq 5) and (emplno gt 3)) @esp10=0. if ((@egp10 eq 5) and any(emplno,1,2,3) and (@esp10 eq 99)) @esp10=1. if ((@egp10 eq 6) and (@esp10 eq 99)) @esp10=1.1. if ((@egp10 eq 6) and (@esp10 eq 1)) @esp10=1.1. if ((@egp10 eq 8) and (@esp10 eq 6)) @esp10=5. if ((@egp10 eq 1) and (@esp10 eq 99)) @esp10=1. if ((@egp10 eq 5) and (@esp10 eq 99)) @esp10=1. if ((@egp10 eq 2) and (@esp10 eq 99)) @esp10=2. if ((@egp10 eq 2) and (@esp10 eq 15)) @esp10=8. if ((@egp10 eq 1) and (@esp10 eq 15)) @esp10=8. if ((@egp10 eq 7) and (@esp10 eq 6)) @esp10=5. if ((@egp10 eq 9) and (@esp10 le 5)) @esp10=6. if (any(@egp10,4) and (@esp10 lt 5)) @esp10=7. if ((@egp10 eq 3) and (@esp10 eq 99)) @esp10=7. *recode @egp10 (sysmis=sysmis) into @esp10. recode @esp10 (99=sysmis). /***************************/ /* Define missing value */ /***************************/ do if (missing(@esp10)). recode iscoco (else=copy) into @esp10. end if. missing value @esp10 (100 thru 99999). /***************************/ /* Define value labels */

145
/***************************/ var labels @esp10 'ESP Class Schema'. value labels @esp10 0 'Manager I Hi.serv.' 1 'Man.II Self.empl.1-3 empl.' 1.1 'Self-empl. 0 empl.' 2 'Professionals' 3 'Technicians' 4 'Semi-professionals' 5 'Skilled servants' 6 'Unskilled servants' 7 'Clerical occupations' 8 'Sales occupations' 9 'Skilled manual workers' 10 'Unskilled manual workers' 11 'Farm workers' 12 'Farmers' 100 'armed forces' 66666 'Not applicable' 77777 'Refusal' 88888 "Don't know" 99999 'No answer'. execute. delete var iscogrp.
146
____________________________________________________ TREIMAN INDEX ------------ TREIMAN ------------------------------------------------ - PROGRAM BY GANZEBOOM ____________________________________________________ (http://www.fss.uu.nl/soc/hg/isko88/). /******************************************************************************************/ /* This program creates the TREIMAN PRESTIGE SCORE based on ISCO88 */ /******************************************************************************************/ /* Dear user, */ /* before run this program not forget to change the file location in the "import" or "get file" line */ /* the declaration of the ISCO88 variable at the "compute @isko" line */ /* in the following line you have to specify the data set's variable containing the ISCO88 4-digits information */ /* if you use the original ESS1E05_F1.POR data file: cancel the asterisk in front of line; modify the path and run this line */ /* remember: if you run this line do not run the following "GET FILE" line command */ * IMPORT FILE='C:\dati\Hakon\ESS1E05_F1.POR'. /* if you use a SPSS system file ".SAV": modify the path and the file name and run this line */ GET FILE='C:\dati\Hakon\ESS1E05_F1.sav'. /* insert here the variable name containing the ISCO88 4-digits information of the occupation of the respondent: in ESS is iscoco.*/ **************************. compute @isko = iscoco. **************************. recode @isko (1000=51) into @trei. recode @isko (1100=67) into @trei. recode @isko (1110=64) into @trei. recode @isko (1120=71) into @trei. recode @isko (1130=63) into @trei. recode @isko (1140=63) into @trei. recode @isko (1141=63) into @trei. recode @isko (1142=63) into @trei. recode @isko (1143=63) into @trei. recode @isko (1200=60) into @trei. recode @isko (1210=70) into @trei. recode @isko (1220=63) into @trei. recode @isko (1221=60) into @trei. recode @isko (1222=60) into @trei. recode @isko (1223=60) into @trei. recode @isko (1224=60) into @trei. recode @isko (1225=60) into @trei. recode @isko (1226=60) into @trei. recode @isko (1227=60) into @trei. recode @isko (1228=60) into @trei. recode @isko (1229=60) into @trei. recode @isko (1230=60) into @trei. recode @isko (1231=60) into @trei. recode @isko (1232=60) into @trei. recode @isko (1233=60) into @trei. recode @isko (1234=60) into @trei. recode @isko (1235=60) into @trei. recode @isko (1236=60) into @trei. recode @isko (1237=60) into @trei. recode @isko (1239=60) into @trei. recode @isko (1240=55) into @trei. recode @isko (1250=65) into @trei. recode @isko (1251=73) into @trei.

147
recode @isko (1252=63) into @trei. recode @isko (1300=50) into @trei. recode @isko (1310=50) into @trei. recode @isko (1311=47) into @trei. recode @isko (1312=52) into @trei. recode @isko (1313=52) into @trei. recode @isko (1314=46) into @trei. recode @isko (1315=38) into @trei. recode @isko (1316=52) into @trei. recode @isko (1317=52) into @trei. recode @isko (1318=52) into @trei. recode @isko (1319=52) into @trei. recode @isko (2000=62) into @trei. recode @isko (2100=63) into @trei. recode @isko (2110=69) into @trei. recode @isko (2111=75) into @trei. recode @isko (2112=72) into @trei. recode @isko (2113=69) into @trei. recode @isko (2114=67) into @trei. recode @isko (2120=56) into @trei. recode @isko (2121=69) into @trei. recode @isko (2122=55) into @trei. recode @isko (2130=51) into @trei. recode @isko (2131=51) into @trei. recode @isko (2132=51) into @trei. recode @isko (2139=51) into @trei. recode @isko (2140=63) into @trei. recode @isko (2141=72) into @trei. recode @isko (2142=70) into @trei. recode @isko (2143=65) into @trei. recode @isko (2144=65) into @trei. recode @isko (2145=66) into @trei. recode @isko (2146=66) into @trei. recode @isko (2147=61) into @trei. recode @isko (2148=58) into @trei. recode @isko (2149=56) into @trei. recode @isko (2200=70) into @trei. recode @isko (2210=62) into @trei. recode @isko (2211=69) into @trei. recode @isko (2212=68) into @trei. recode @isko (2213=56) into @trei. recode @isko (2220=73) into @trei. recode @isko (2221=78) into @trei. recode @isko (2222=70) into @trei. recode @isko (2223=61) into @trei. recode @isko (2224=64) into @trei. recode @isko (2229=73) into @trei. recode @isko (2230=54) into @trei. recode @isko (2300=61) into @trei. recode @isko (2310=78) into @trei. recode @isko (2320=60) into @trei. recode @isko (2321=60) into @trei. recode @isko (2322=57) into @trei. recode @isko (2330=57) into @trei. recode @isko (2331=57) into @trei. recode @isko (2332=49) into @trei. recode @isko (2340=62) into @trei. recode @isko (2350=62) into @trei. recode @isko (2351=68) into @trei. recode @isko (2352=68) into @trei. recode @isko (2359=62) into @trei. recode @isko (2400=60) into @trei. recode @isko (2410=57) into @trei. recode @isko (2411=62) into @trei. recode @isko (2412=56) into @trei. recode @isko (2419=57) into @trei. recode @isko (2420=73) into @trei. recode @isko (2421=73) into @trei. recode @isko (2422=76) into @trei.
148
recode @isko (2429=71) into @trei. recode @isko (2430=54) into @trei. recode @isko (2431=54) into @trei. recode @isko (2432=54) into @trei. recode @isko (2440=58) into @trei. recode @isko (2441=60) into @trei. recode @isko (2442=67) into @trei. recode @isko (2443=67) into @trei. recode @isko (2444=62) into @trei. recode @isko (2445=67) into @trei. recode @isko (2446=52) into @trei. recode @isko (2450=57) into @trei. recode @isko (2451=58) into @trei. recode @isko (2452=57) into @trei. recode @isko (2453=45) into @trei. recode @isko (2454=40) into @trei. recode @isko (2455=57) into @trei. recode @isko (2460=60) into @trei. recode @isko (2470=68) into @trei. recode @isko (3000=48) into @trei. recode @isko (3100=48) into @trei. recode @isko (3110=47) into @trei. recode @isko (3111=46) into @trei. recode @isko (3112=39) into @trei. recode @isko (3113=46) into @trei. recode @isko (3114=46) into @trei. recode @isko (3115=46) into @trei. recode @isko (3116=46) into @trei. recode @isko (3117=53) into @trei. recode @isko (3118=55) into @trei. recode @isko (3119=46) into @trei. recode @isko (3120=53) into @trei. recode @isko (3121=53) into @trei. recode @isko (3122=53) into @trei. recode @isko (3123=53) into @trei. recode @isko (3130=46) into @trei. recode @isko (3131=46) into @trei. recode @isko (3132=49) into @trei. recode @isko (3133=58) into @trei. recode @isko (3139=44) into @trei. recode @isko (3140=57) into @trei. recode @isko (3141=60) into @trei. recode @isko (3142=55) into @trei. recode @isko (3143=60) into @trei. recode @isko (3144=50) into @trei. recode @isko (3145=46) into @trei. recode @isko (3150=54) into @trei. recode @isko (3151=54) into @trei. recode @isko (3152=54) into @trei. recode @isko (3200=51) into @trei. recode @isko (3210=52) into @trei. recode @isko (3211=52) into @trei. recode @isko (3212=47) into @trei. recode @isko (3213=55) into @trei. recode @isko (3220=51) into @trei. recode @isko (3221=53) into @trei. recode @isko (3222=48) into @trei. recode @isko (3223=52) into @trei. recode @isko (3224=60) into @trei. recode @isko (3225=44) into @trei. recode @isko (3226=51) into @trei. recode @isko (3227=48) into @trei. recode @isko (3228=44) into @trei. recode @isko (3229=45) into @trei. recode @isko (3230=44) into @trei. recode @isko (3231=44) into @trei. recode @isko (3232=44) into @trei. recode @isko (3240=29) into @trei. recode @isko (3241=29) into @trei.

149
recode @isko (3242=22) into @trei. recode @isko (3300=50) into @trei. recode @isko (3310=50) into @trei. recode @isko (3320=50) into @trei. recode @isko (3330=50) into @trei. recode @isko (3340=50) into @trei. recode @isko (3400=48) into @trei. recode @isko (3410=47) into @trei. recode @isko (3411=50) into @trei. recode @isko (3412=44) into @trei. recode @isko (3413=49) into @trei. recode @isko (3414=43) into @trei. recode @isko (3415=46) into @trei. recode @isko (3416=49) into @trei. recode @isko (3417=46) into @trei. recode @isko (3419=46) into @trei. recode @isko (3420=42) into @trei. recode @isko (3421=55) into @trei. recode @isko (3422=50) into @trei. recode @isko (3423=49) into @trei. recode @isko (3429=42) into @trei. recode @isko (3430=49) into @trei. recode @isko (3431=53) into @trei. recode @isko (3432=49) into @trei. recode @isko (3433=49) into @trei. recode @isko (3434=51) into @trei. recode @isko (3439=53) into @trei. recode @isko (3440=52) into @trei. recode @isko (3441=44) into @trei. recode @isko (3442=52) into @trei. recode @isko (3443=55) into @trei. recode @isko (3444=54) into @trei. recode @isko (3449=55) into @trei. recode @isko (3450=45) into @trei. recode @isko (3451=60) into @trei. recode @isko (3452=44) into @trei. recode @isko (3460=49) into @trei. recode @isko (3470=45) into @trei. recode @isko (3471=49) into @trei. recode @isko (3472=50) into @trei. recode @isko (3473=32) into @trei. recode @isko (3474=33) into @trei. recode @isko (3475=49) into @trei. recode @isko (3480=50) into @trei. recode @isko (4000=37) into @trei. recode @isko (4100=37) into @trei. recode @isko (4110=45) into @trei. recode @isko (4111=42) into @trei. recode @isko (4112=42) into @trei. recode @isko (4113=45) into @trei. recode @isko (4114=45) into @trei. recode @isko (4115=53) into @trei. recode @isko (4120=44) into @trei. recode @isko (4121=45) into @trei. recode @isko (4122=36) into @trei. recode @isko (4130=32) into @trei. recode @isko (4131=30) into @trei. recode @isko (4132=44) into @trei. recode @isko (4133=37) into @trei. recode @isko (4140=37) into @trei. recode @isko (4141=36) into @trei. recode @isko (4142=33) into @trei. recode @isko (4143=41) into @trei. recode @isko (4144=37) into @trei. recode @isko (4190=37) into @trei. recode @isko (4200=39) into @trei. recode @isko (4210=37) into @trei. recode @isko (4211=34) into @trei. recode @isko (4212=42) into @trei.

150
recode @isko (4213=34) into @trei. recode @isko (4214=15) into @trei. recode @isko (4215=27) into @trei. recode @isko (4220=38) into @trei. recode @isko (4221=38) into @trei. recode @isko (4222=38) into @trei. recode @isko (4223=38) into @trei. recode @isko (5000=32) into @trei. recode @isko (5100=32) into @trei. recode @isko (5110=32) into @trei. recode @isko (5111=50) into @trei. recode @isko (5112=32) into @trei. recode @isko (5113=29) into @trei. recode @isko (5120=26) into @trei. recode @isko (5121=37) into @trei. recode @isko (5122=31) into @trei. recode @isko (5123=21) into @trei. recode @isko (5130=27) into @trei. recode @isko (5131=23) into @trei. recode @isko (5132=42) into @trei. recode @isko (5133=17) into @trei. recode @isko (5139=29) into @trei. recode @isko (5140=29) into @trei. recode @isko (5141=32) into @trei. recode @isko (5142=17) into @trei. recode @isko (5143=34) into @trei. recode @isko (5149=29) into @trei. recode @isko (5150=37) into @trei. recode @isko (5151=37) into @trei. recode @isko (5152=37) into @trei. recode @isko (5160=37) into @trei. recode @isko (5161=35) into @trei. recode @isko (5162=40) into @trei. recode @isko (5163=39) into @trei. recode @isko (5164=39) into @trei. recode @isko (5169=30) into @trei. recode @isko (5200=31) into @trei. recode @isko (5210=28) into @trei. recode @isko (5220=32) into @trei. recode @isko (5230=24) into @trei. recode @isko (6000=37) into @trei. recode @isko (6100=38) into @trei. recode @isko (6110=40) into @trei. recode @isko (6111=40) into @trei. recode @isko (6112=40) into @trei. recode @isko (6113=40) into @trei. recode @isko (6114=40) into @trei. recode @isko (6120=40) into @trei. recode @isko (6121=40) into @trei. recode @isko (6122=40) into @trei. recode @isko (6123=40) into @trei. recode @isko (6124=40) into @trei. recode @isko (6129=40) into @trei. recode @isko (6130=38) into @trei. recode @isko (6131=40) into @trei. recode @isko (6132=41) into @trei. recode @isko (6133=40) into @trei. recode @isko (6134=30) into @trei. recode @isko (6140=24) into @trei. recode @isko (6141=24) into @trei. recode @isko (6142=16) into @trei. recode @isko (6150=28) into @trei. recode @isko (6151=23) into @trei. recode @isko (6152=23) into @trei. recode @isko (6153=28) into @trei. recode @isko (6154= 6) into @trei. recode @isko (6200=38) into @trei. recode @isko (6210=38) into @trei. recode @isko (7000=38) into @trei.

151
recode @isko (7100=34) into @trei. recode @isko (7110=34) into @trei. recode @isko (7111=34) into @trei. recode @isko (7112=36) into @trei. recode @isko (7113=34) into @trei. recode @isko (7120=34) into @trei. recode @isko (7121=36) into @trei. recode @isko (7122=34) into @trei. recode @isko (7123=34) into @trei. recode @isko (7124=37) into @trei. recode @isko (7129=28) into @trei. recode @isko (7130=37) into @trei. recode @isko (7131=31) into @trei. recode @isko (7132=31) into @trei. recode @isko (7133=31) into @trei. recode @isko (7134=28) into @trei. recode @isko (7135=26) into @trei. recode @isko (7136=34) into @trei. recode @isko (7137=44) into @trei. recode @isko (7139=31) into @trei. recode @isko (7140=31) into @trei. recode @isko (7141=31) into @trei. recode @isko (7142=29) into @trei. recode @isko (7143=20) into @trei. recode @isko (7200=40) into @trei. recode @isko (7210=38) into @trei. recode @isko (7211=38) into @trei. recode @isko (7212=39) into @trei. recode @isko (7213=34) into @trei. recode @isko (7214=44) into @trei. recode @isko (7215=32) into @trei. recode @isko (7216=26) into @trei. recode @isko (7220=37) into @trei. recode @isko (7221=35) into @trei. recode @isko (7222=40) into @trei. recode @isko (7223=38) into @trei. recode @isko (7224=27) into @trei. recode @isko (7230=43) into @trei. recode @isko (7231=43) into @trei. recode @isko (7232=50) into @trei. recode @isko (7233=42) into @trei. recode @isko (7234=20) into @trei. recode @isko (7240=38) into @trei. recode @isko (7241=38) into @trei. recode @isko (7242=48) into @trei. recode @isko (7243=42) into @trei. recode @isko (7244=35) into @trei. recode @isko (7245=36) into @trei. recode @isko (7300=39) into @trei. recode @isko (7310=45) into @trei. recode @isko (7311=47) into @trei. recode @isko (7312=33) into @trei. recode @isko (7313=43) into @trei. recode @isko (7320=28) into @trei. recode @isko (7321=25) into @trei. recode @isko (7322=37) into @trei. recode @isko (7323=31) into @trei. recode @isko (7324=31) into @trei. recode @isko (7330=31) into @trei. recode @isko (7331=31) into @trei. recode @isko (7332=31) into @trei. recode @isko (7340=42) into @trei. recode @isko (7341=42) into @trei. recode @isko (7342=41) into @trei. recode @isko (7343=41) into @trei. recode @isko (7344=42) into @trei. recode @isko (7345=32) into @trei. recode @isko (7346=52) into @trei. recode @isko (7400=33) into @trei.

152
recode @isko (7410=28) into @trei. recode @isko (7411=24) into @trei. recode @isko (7412=33) into @trei. recode @isko (7413=34) into @trei. recode @isko (7414=35) into @trei. recode @isko (7415=34) into @trei. recode @isko (7416=34) into @trei. recode @isko (7420=29) into @trei. recode @isko (7421=29) into @trei. recode @isko (7422=40) into @trei. recode @isko (7423=36) into @trei. recode @isko (7424=21) into @trei. recode @isko (7430=34) into @trei. recode @isko (7431=29) into @trei. recode @isko (7432=32) into @trei. recode @isko (7433=40) into @trei. recode @isko (7434=35) into @trei. recode @isko (7435=40) into @trei. recode @isko (7436=26) into @trei. recode @isko (7437=31) into @trei. recode @isko (7440=27) into @trei. recode @isko (7441=22) into @trei. recode @isko (7442=27) into @trei. recode @isko (7500=48) into @trei. recode @isko (7510=46) into @trei. recode @isko (7520=46) into @trei. recode @isko (7530=37) into @trei. recode @isko (8000=34) into @trei. recode @isko (8100=36) into @trei. recode @isko (8110=31) into @trei. recode @isko (8111=34) into @trei. recode @isko (8112=32) into @trei. recode @isko (8113=31) into @trei. recode @isko (8120=40) into @trei. recode @isko (8121=45) into @trei. recode @isko (8122=36) into @trei. recode @isko (8123=38) into @trei. recode @isko (8124=28) into @trei. recode @isko (8130=31) into @trei. recode @isko (8131=31) into @trei. recode @isko (8139=31) into @trei. recode @isko (8140=28) into @trei. recode @isko (8141=29) into @trei. recode @isko (8142=28) into @trei. recode @isko (8143=28) into @trei. recode @isko (8150=42) into @trei. recode @isko (8151=43) into @trei. recode @isko (8152=43) into @trei. recode @isko (8153=43) into @trei. recode @isko (8154=43) into @trei. recode @isko (8155=37) into @trei. recode @isko (8159=43) into @trei. recode @isko (8160=38) into @trei. recode @isko (8161=42) into @trei. recode @isko (8162=35) into @trei. recode @isko (8163=34) into @trei. recode @isko (8170=30) into @trei. recode @isko (8171=30) into @trei. recode @isko (8172=30) into @trei. recode @isko (8200=34) into @trei. recode @isko (8210=37) into @trei. recode @isko (8211=38) into @trei. recode @isko (8212=30) into @trei. recode @isko (8220=43) into @trei. recode @isko (8221=43) into @trei. recode @isko (8222=43) into @trei. recode @isko (8223=28) into @trei. recode @isko (8224=43) into @trei. recode @isko (8229=43) into @trei.

153
recode @isko (8230=30) into @trei. recode @isko (8231=30) into @trei. recode @isko (8232=30) into @trei. recode @isko (8233=30) into @trei. recode @isko (8240=31) into @trei. recode @isko (8250=41) into @trei. recode @isko (8251=41) into @trei. recode @isko (8252=32) into @trei. recode @isko (8253=28) into @trei. recode @isko (8260=28) into @trei. recode @isko (8261=29) into @trei. recode @isko (8262=29) into @trei. recode @isko (8263=25) into @trei. recode @isko (8264=25) into @trei. recode @isko (8265=26) into @trei. recode @isko (8266=28) into @trei. recode @isko (8269=26) into @trei. recode @isko (8270=33) into @trei. recode @isko (8271=31) into @trei. recode @isko (8272=34) into @trei. recode @isko (8273=33) into @trei. recode @isko (8274=33) into @trei. recode @isko (8275=35) into @trei. recode @isko (8276=45) into @trei. recode @isko (8277=34) into @trei. recode @isko (8278=34) into @trei. recode @isko (8279=39) into @trei. recode @isko (8280=33) into @trei. recode @isko (8281=30) into @trei. recode @isko (8282=48) into @trei. recode @isko (8283=48) into @trei. recode @isko (8284=30) into @trei. recode @isko (8285=31) into @trei. recode @isko (8286=28) into @trei. recode @isko (8287=48) into @trei. recode @isko (8290=33) into @trei. recode @isko (8300=33) into @trei. recode @isko (8310=36) into @trei. recode @isko (8311=43) into @trei. recode @isko (8312=29) into @trei. recode @isko (8320=32) into @trei. recode @isko (8321=31) into @trei. recode @isko (8322=31) into @trei. recode @isko (8323=32) into @trei. recode @isko (8324=33) into @trei. recode @isko (8330=32) into @trei. recode @isko (8331=31) into @trei. recode @isko (8332=32) into @trei. recode @isko (8333=33) into @trei. recode @isko (8334=28) into @trei. recode @isko (8340=29) into @trei. recode @isko (8400=33) into @trei. recode @isko (9000=21) into @trei. recode @isko (9100=23) into @trei. recode @isko (9110=25) into @trei. recode @isko (9111=24) into @trei. recode @isko (9112=24) into @trei. recode @isko (9113=26) into @trei. recode @isko (9120=12) into @trei. recode @isko (9122=12) into @trei. recode @isko (9130=21) into @trei. recode @isko (9131=22) into @trei. recode @isko (9132=21) into @trei. recode @isko (9133=22) into @trei. recode @isko (9140=23) into @trei. recode @isko (9141=25) into @trei. recode @isko (9142=19) into @trei. recode @isko (9150=20) into @trei. recode @isko (9151=22) into @trei.
154
recode @isko (9152=20) into @trei. recode @isko (9153=21) into @trei. recode @isko (9160=13) into @trei. recode @isko (9161=13) into @trei. recode @isko (9162=13) into @trei. recode @isko (9200=23) into @trei. recode @isko (9210=23) into @trei. recode @isko (9211=23) into @trei. recode @isko (9212=18) into @trei. recode @isko (9213=23) into @trei. recode @isko (9300=18) into @trei. recode @isko (9310=16) into @trei. recode @isko (9311=18) into @trei. recode @isko (9312=15) into @trei. recode @isko (9313=15) into @trei. recode @isko (9320=19) into @trei. recode @isko (9321=18) into @trei. recode @isko (9322=22) into @trei. recode @isko (9330=20) into @trei. recode @isko (9331=17) into @trei. recode @isko (9332=22) into @trei. recode @isko (9333=20) into @trei. var lab @trei 'Treiman Prestige scores'. execute.

155
____________________________________________________ INTERNATIONAL SOCIO ECONOMIC INDEX ------------ ISEI - INDEX ------------------------------------------------ - PROGRAM BY GANZEBOOM ____________________________________________________ (http://www.fss.uu.nl/soc/hg/isko88/). /*********************************************************************/ /* This program creates the ISEI based on ISCO88 */ /*********************************************************************/ /* Dear user, */ /* before run this program not forget to change the file location in the "import" or "get file" line */ /* the declaration of the ISCO88 variable at the "compute @isko" line */ /* in the following line you have to specify the data set's variable containing the ISCO88 4-digits information */ /* if you use the original ESS1E05_F1.POR data file: cancel the asterisk in front of line; modify the path and run this line */ /* remember: if you run this line do not run the following "GET FILE" line command */ * IMPORT FILE='C:\dati\Hakon\ESS1E05_F1.POR'. /* if you use a SPSS system file ".SAV": modify the path and the file name and run this line */ GET FILE='C:\dati\Hakon\ESS1E05_F1.sav'. /* insert here the variable name containing the ISCO88 4-digits information of the occupation of the respondent: in ESS is iscoco.*/ ***************************. compute @isko = iscoco. ***************************. recode @isko (1000=55) into @isei. recode @isko (1100=70) into @isei. recode @isko (1110=77) into @isei. recode @isko (1120=77) into @isei. recode @isko (1130=66) into @isei. recode @isko (1140=58) into @isei. recode @isko (1141=58) into @isei. recode @isko (1142=58) into @isei. recode @isko (1143=58) into @isei. recode @isko (1200=68) into @isei. recode @isko (1210=70) into @isei. recode @isko (1220=67) into @isei. recode @isko (1221=67) into @isei. recode @isko (1222=67) into @isei. recode @isko (1223=67) into @isei. recode @isko (1224=59) into @isei. recode @isko (1225=59) into @isei. recode @isko (1226=59) into @isei. recode @isko (1227=87) into @isei. recode @isko (1228=59) into @isei. recode @isko (1229=67) into @isei. recode @isko (1230=61) into @isei. recode @isko (1231=69) into @isei. recode @isko (1232=69) into @isei. recode @isko (1233=56) into @isei. recode @isko (1234=69) into @isei. recode @isko (1235=69) into @isei. recode @isko (1236=69) into @isei. recode @isko (1237=69) into @isei. recode @isko (1239=69) into @isei. recode @isko (1240=58) into @isei. recode @isko (1250=64) into @isei. recode @isko (1251=70) into @isei.

156
recode @isko (1252=60) into @isei. recode @isko (1300=51) into @isei. recode @isko (1310=51) into @isei. recode @isko (1311=43) into @isei. recode @isko (1312=56) into @isei. recode @isko (1313=51) into @isei. recode @isko (1314=49) into @isei. recode @isko (1315=44) into @isei. recode @isko (1316=51) into @isei. recode @isko (1317=51) into @isei. recode @isko (1318=51) into @isei. recode @isko (1319=51) into @isei. recode @isko (2000=70) into @isei. recode @isko (2100=69) into @isei. recode @isko (2110=74) into @isei. recode @isko (2111=74) into @isei. recode @isko (2112=74) into @isei. recode @isko (2113=74) into @isei. recode @isko (2114=74) into @isei. recode @isko (2120=71) into @isei. recode @isko (2121=71) into @isei. recode @isko (2122=71) into @isei. recode @isko (2130=71) into @isei. recode @isko (2131=71) into @isei. recode @isko (2132=71) into @isei. recode @isko (2139=71) into @isei. recode @isko (2140=73) into @isei. recode @isko (2141=69) into @isei. recode @isko (2142=69) into @isei. recode @isko (2143=68) into @isei. recode @isko (2144=68) into @isei. recode @isko (2145=67) into @isei. recode @isko (2146=71) into @isei. recode @isko (2147=67) into @isei. recode @isko (2148=56) into @isei. recode @isko (2149=69) into @isei. recode @isko (2200=80) into @isei. recode @isko (2210=78) into @isei. recode @isko (2211=77) into @isei. recode @isko (2212=77) into @isei. recode @isko (2213=79) into @isei. recode @isko (2220=85) into @isei. recode @isko (2221=88) into @isei. recode @isko (2222=85) into @isei. recode @isko (2223=83) into @isei. recode @isko (2224=74) into @isei. recode @isko (2229=85) into @isei. recode @isko (2230=43) into @isei. recode @isko (2300=69) into @isei. recode @isko (2310=77) into @isei. recode @isko (2320=69) into @isei. recode @isko (2321=70) into @isei. recode @isko (2322=66) into @isei. recode @isko (2330=66) into @isei. recode @isko (2331=66) into @isei. recode @isko (2332=43) into @isei. recode @isko (2340=66) into @isei. recode @isko (2350=66) into @isei. recode @isko (2351=70) into @isei. recode @isko (2352=70) into @isei. recode @isko (2359=65) into @isei. recode @isko (2400=68) into @isei. recode @isko (2410=69) into @isei. recode @isko (2411=69) into @isei. recode @isko (2412=69) into @isei. recode @isko (2419=69) into @isei. recode @isko (2420=85) into @isei. recode @isko (2421=85) into @isei. recode @isko (2422=90) into @isei.
157
recode @isko (2429=82) into @isei. recode @isko (2430=65) into @isei. recode @isko (2431=65) into @isei. recode @isko (2432=65) into @isei. recode @isko (2440=65) into @isei. recode @isko (2441=78) into @isei. recode @isko (2442=71) into @isei. recode @isko (2443=71) into @isei. recode @isko (2444=65) into @isei. recode @isko (2445=71) into @isei. recode @isko (2446=51) into @isei. recode @isko (2450=61) into @isei. recode @isko (2451=65) into @isei. recode @isko (2452=54) into @isei. recode @isko (2453=64) into @isei. recode @isko (2454=64) into @isei. recode @isko (2455=64) into @isei. recode @isko (2460=53) into @isei. recode @isko (2470=77) into @isei. recode @isko (3000=54) into @isei. recode @isko (3100=50) into @isei. recode @isko (3110=49) into @isei. recode @isko (3111=45) into @isei. recode @isko (3112=45) into @isei. recode @isko (3113=46) into @isei. recode @isko (3114=46) into @isei. recode @isko (3115=54) into @isei. recode @isko (3116=54) into @isei. recode @isko (3117=54) into @isei. recode @isko (3118=51) into @isei. recode @isko (3119=53) into @isei. recode @isko (3120=52) into @isei. recode @isko (3121=52) into @isei. recode @isko (3122=52) into @isei. recode @isko (3123=52) into @isei. recode @isko (3130=52) into @isei. recode @isko (3131=48) into @isei. recode @isko (3132=57) into @isei. recode @isko (3133=57) into @isei. recode @isko (3139=52) into @isei. recode @isko (3140=57) into @isei. recode @isko (3141=52) into @isei. recode @isko (3142=52) into @isei. recode @isko (3143=69) into @isei. recode @isko (3144=69) into @isei. recode @isko (3145=50) into @isei. recode @isko (3150=50) into @isei. recode @isko (3151=50) into @isei. recode @isko (3152=50) into @isei. recode @isko (3200=48) into @isei. recode @isko (3210=50) into @isei. recode @isko (3211=50) into @isei. recode @isko (3212=50) into @isei. recode @isko (3213=50) into @isei. recode @isko (3220=55) into @isei. recode @isko (3221=51) into @isei. recode @isko (3222=51) into @isei. recode @isko (3223=51) into @isei. recode @isko (3224=60) into @isei. recode @isko (3225=51) into @isei. recode @isko (3226=60) into @isei. recode @isko (3227=51) into @isei. recode @isko (3228=51) into @isei. recode @isko (3229=51) into @isei. recode @isko (3230=38) into @isei. recode @isko (3231=38) into @isei. recode @isko (3232=38) into @isei. recode @isko (3240=49) into @isei. recode @isko (3241=51) into @isei.
158
recode @isko (3242=38) into @isei. recode @isko (3300=38) into @isei. recode @isko (3310=38) into @isei. recode @isko (3320=38) into @isei. recode @isko (3330=38) into @isei. recode @isko (3340=38) into @isei. recode @isko (3400=55) into @isei. recode @isko (3410=55) into @isei. recode @isko (3411=61) into @isei. recode @isko (3412=54) into @isei. recode @isko (3413=59) into @isei. recode @isko (3414=56) into @isei. recode @isko (3415=56) into @isei. recode @isko (3416=50) into @isei. recode @isko (3417=56) into @isei. recode @isko (3419=55) into @isei. recode @isko (3420=55) into @isei. recode @isko (3421=55) into @isei. recode @isko (3422=55) into @isei. recode @isko (3423=55) into @isei. recode @isko (3429=55) into @isei. recode @isko (3430=54) into @isei. recode @isko (3431=54) into @isei. recode @isko (3432=59) into @isei. recode @isko (3433=51) into @isei. recode @isko (3434=61) into @isei. recode @isko (3439=54) into @isei. recode @isko (3440=56) into @isei. recode @isko (3441=56) into @isei. recode @isko (3442=57) into @isei. recode @isko (3443=56) into @isei. recode @isko (3444=46) into @isei. recode @isko (3449=56) into @isei. recode @isko (3450=56) into @isei. recode @isko (3451=55) into @isei. recode @isko (3452=56) into @isei. recode @isko (3460=43) into @isei. recode @isko (3470=52) into @isei. recode @isko (3471=53) into @isei. recode @isko (3472=64) into @isei. recode @isko (3473=50) into @isei. recode @isko (3474=50) into @isei. recode @isko (3475=54) into @isei. recode @isko (3480=38) into @isei. recode @isko (4000=45) into @isei. recode @isko (4100=45) into @isei. recode @isko (4110=51) into @isei. recode @isko (4111=51) into @isei. recode @isko (4112=50) into @isei. recode @isko (4113=50) into @isei. recode @isko (4114=51) into @isei. recode @isko (4115=53) into @isei. recode @isko (4120=51) into @isei. recode @isko (4121=51) into @isei. recode @isko (4122=51) into @isei. recode @isko (4130=36) into @isei. recode @isko (4131=32) into @isei. recode @isko (4132=43) into @isei. recode @isko (4133=45) into @isei. recode @isko (4140=39) into @isei. recode @isko (4141=39) into @isei. recode @isko (4142=39) into @isei. recode @isko (4143=39) into @isei. recode @isko (4144=39) into @isei. recode @isko (4190=39) into @isei. recode @isko (4200=49) into @isei. recode @isko (4210=48) into @isei. recode @isko (4211=53) into @isei. recode @isko (4212=46) into @isei.

159
recode @isko (4213=40) into @isei. recode @isko (4214=40) into @isei. recode @isko (4215=40) into @isei. recode @isko (4220=52) into @isei. recode @isko (4221=52) into @isei. recode @isko (4222=52) into @isei. recode @isko (4223=52) into @isei. recode @isko (5000=40) into @isei. recode @isko (5100=38) into @isei. recode @isko (5110=34) into @isei. recode @isko (5111=34) into @isei. recode @isko (5112=34) into @isei. recode @isko (5113=34) into @isei. recode @isko (5120=32) into @isei. recode @isko (5121=30) into @isei. recode @isko (5122=30) into @isei. recode @isko (5123=34) into @isei. recode @isko (5130=25) into @isei. recode @isko (5131=25) into @isei. recode @isko (5132=25) into @isei. recode @isko (5133=25) into @isei. recode @isko (5139=25) into @isei. recode @isko (5140=30) into @isei. recode @isko (5141=29) into @isei. recode @isko (5142=19) into @isei. recode @isko (5143=54) into @isei. recode @isko (5149=19) into @isei. recode @isko (5150=43) into @isei. recode @isko (5151=43) into @isei. recode @isko (5152=43) into @isei. recode @isko (5160=47) into @isei. recode @isko (5161=42) into @isei. recode @isko (5162=50) into @isei. recode @isko (5163=40) into @isei. recode @isko (5164=40) into @isei. recode @isko (5169=40) into @isei. recode @isko (5200=43) into @isei. recode @isko (5210=43) into @isei. recode @isko (5220=43) into @isei. recode @isko (5230=37) into @isei. recode @isko (6000=23) into @isei. recode @isko (6100=23) into @isei. recode @isko (6110=23) into @isei. recode @isko (6111=23) into @isei. recode @isko (6112=23) into @isei. recode @isko (6113=23) into @isei. recode @isko (6114=23) into @isei. recode @isko (6120=23) into @isei. recode @isko (6121=23) into @isei. recode @isko (6122=23) into @isei. recode @isko (6123=23) into @isei. recode @isko (6124=23) into @isei. recode @isko (6129=23) into @isei. recode @isko (6130=23) into @isei. recode @isko (6131=23) into @isei. recode @isko (6132=27) into @isei. recode @isko (6133=28) into @isei. recode @isko (6134=28) into @isei. recode @isko (6140=22) into @isei. recode @isko (6141=22) into @isei. recode @isko (6142=22) into @isei. recode @isko (6150=28) into @isei. recode @isko (6151=28) into @isei. recode @isko (6152=28) into @isei. recode @isko (6153=28) into @isei. recode @isko (6154=28) into @isei. recode @isko (6200=16) into @isei. recode @isko (6210=16) into @isei. recode @isko (7000=34) into @isei.
160
recode @isko (7100=31) into @isei. recode @isko (7110=30) into @isei. recode @isko (7111=30) into @isei. recode @isko (7112=30) into @isei. recode @isko (7113=27) into @isei. recode @isko (7120=30) into @isei. recode @isko (7121=29) into @isei. recode @isko (7122=29) into @isei. recode @isko (7123=26) into @isei. recode @isko (7124=29) into @isei. recode @isko (7129=30) into @isei. recode @isko (7130=34) into @isei. recode @isko (7131=19) into @isei. recode @isko (7132=30) into @isei. recode @isko (7133=31) into @isei. recode @isko (7134=34) into @isei. recode @isko (7135=26) into @isei. recode @isko (7136=33) into @isei. recode @isko (7137=37) into @isei. recode @isko (7139=31) into @isei. recode @isko (7140=29) into @isei. recode @isko (7141=29) into @isei. recode @isko (7142=32) into @isei. recode @isko (7143=29) into @isei. recode @isko (7200=34) into @isei. recode @isko (7210=31) into @isei. recode @isko (7211=29) into @isei. recode @isko (7212=30) into @isei. recode @isko (7213=33) into @isei. recode @isko (7214=30) into @isei. recode @isko (7215=30) into @isei. recode @isko (7216=30) into @isei. recode @isko (7220=35) into @isei. recode @isko (7221=33) into @isei. recode @isko (7222=40) into @isei. recode @isko (7223=34) into @isei. recode @isko (7224=24) into @isei. recode @isko (7230=34) into @isei. recode @isko (7231=34) into @isei. recode @isko (7232=42) into @isei. recode @isko (7233=33) into @isei. recode @isko (7234=23) into @isei. recode @isko (7240=40) into @isei. recode @isko (7241=40) into @isei. recode @isko (7242=39) into @isei. recode @isko (7243=41) into @isei. recode @isko (7244=40) into @isei. recode @isko (7245=38) into @isei. recode @isko (7300=34) into @isei. recode @isko (7310=38) into @isei. recode @isko (7311=38) into @isei. recode @isko (7312=38) into @isei. recode @isko (7313=38) into @isei. recode @isko (7320=28) into @isei. recode @isko (7321=27) into @isei. recode @isko (7322=29) into @isei. recode @isko (7323=29) into @isei. recode @isko (7324=29) into @isei. recode @isko (7330=29) into @isei. recode @isko (7331=29) into @isei. recode @isko (7332=29) into @isei. recode @isko (7340=40) into @isei. recode @isko (7341=40) into @isei. recode @isko (7342=40) into @isei. recode @isko (7343=42) into @isei. recode @isko (7344=40) into @isei. recode @isko (7345=37) into @isei. recode @isko (7346=38) into @isei. recode @isko (7400=33) into @isei.
161
recode @isko (7410=30) into @isei. recode @isko (7411=30) into @isei. recode @isko (7412=31) into @isei. recode @isko (7413=30) into @isei. recode @isko (7414=30) into @isei. recode @isko (7415=30) into @isei. recode @isko (7416=30) into @isei. recode @isko (7420=33) into @isei. recode @isko (7421=33) into @isei. recode @isko (7422=33) into @isei. recode @isko (7423=33) into @isei. recode @isko (7424=33) into @isei. recode @isko (7430=36) into @isei. recode @isko (7431=29) into @isei. recode @isko (7432=29) into @isei. recode @isko (7433=45) into @isei. recode @isko (7434=36) into @isei. recode @isko (7435=36) into @isei. recode @isko (7436=33) into @isei. recode @isko (7437=28) into @isei. recode @isko (7440=31) into @isei. recode @isko (7441=31) into @isei. recode @isko (7442=31) into @isei. recode @isko (7500=42) into @isei. recode @isko (7510=42) into @isei. recode @isko (7520=39) into @isei. recode @isko (7530=26) into @isei. recode @isko (8000=31) into @isei. recode @isko (8100=30) into @isei. recode @isko (8110=35) into @isei. recode @isko (8111=35) into @isei. recode @isko (8112=35) into @isei. recode @isko (8113=35) into @isei. recode @isko (8120=30) into @isei. recode @isko (8121=31) into @isei. recode @isko (8122=30) into @isei. recode @isko (8123=28) into @isei. recode @isko (8124=30) into @isei. recode @isko (8130=22) into @isei. recode @isko (8131=22) into @isei. recode @isko (8139=22) into @isei. recode @isko (8140=27) into @isei. recode @isko (8141=27) into @isei. recode @isko (8142=27) into @isei. recode @isko (8143=27) into @isei. recode @isko (8150=35) into @isei. recode @isko (8151=35) into @isei. recode @isko (8152=35) into @isei. recode @isko (8153=35) into @isei. recode @isko (8154=35) into @isei. recode @isko (8155=35) into @isei. recode @isko (8159=35) into @isei. recode @isko (8160=32) into @isei. recode @isko (8161=33) into @isei. recode @isko (8162=27) into @isei. recode @isko (8163=33) into @isei. recode @isko (8170=26) into @isei. recode @isko (8171=26) into @isei. recode @isko (8172=26) into @isei. recode @isko (8200=32) into @isei. recode @isko (8210=36) into @isei. recode @isko (8211=36) into @isei. recode @isko (8212=30) into @isei. recode @isko (8220=30) into @isei. recode @isko (8221=30) into @isei. recode @isko (8222=30) into @isei. recode @isko (8223=30) into @isei. recode @isko (8224=30) into @isei. recode @isko (8229=30) into @isei.

162
recode @isko (8230=30) into @isei. recode @isko (8231=30) into @isei. recode @isko (8232=30) into @isei. recode @isko (8233=30) into @isei. recode @isko (8240=29) into @isei. recode @isko (8250=38) into @isei. recode @isko (8251=38) into @isei. recode @isko (8252=38) into @isei. recode @isko (8253=38) into @isei. recode @isko (8260=30) into @isei. recode @isko (8261=29) into @isei. recode @isko (8262=29) into @isei. recode @isko (8263=32) into @isei. recode @isko (8264=24) into @isei. recode @isko (8265=32) into @isei. recode @isko (8266=32) into @isei. recode @isko (8269=32) into @isei. recode @isko (8270=29) into @isei. recode @isko (8271=29) into @isei. recode @isko (8272=29) into @isei. recode @isko (8273=29) into @isei. recode @isko (8274=29) into @isei. recode @isko (8275=29) into @isei. recode @isko (8276=29) into @isei. recode @isko (8277=29) into @isei. recode @isko (8278=29) into @isei. recode @isko (8279=29) into @isei. recode @isko (8280=31) into @isei. recode @isko (8281=30) into @isei. recode @isko (8282=34) into @isei. recode @isko (8283=34) into @isei. recode @isko (8284=30) into @isei. recode @isko (8285=30) into @isei. recode @isko (8286=30) into @isei. recode @isko (8287=34) into @isei. recode @isko (8290=26) into @isei. recode @isko (8300=32) into @isei. recode @isko (8310=36) into @isei. recode @isko (8311=41) into @isei. recode @isko (8312=32) into @isei. recode @isko (8320=34) into @isei. recode @isko (8321=30) into @isei. recode @isko (8322=30) into @isei. recode @isko (8323=30) into @isei. recode @isko (8324=34) into @isei. recode @isko (8330=26) into @isei. recode @isko (8331=26) into @isei. recode @isko (8332=26) into @isei. recode @isko (8333=28) into @isei. recode @isko (8334=28) into @isei. recode @isko (8340=32) into @isei. recode @isko (8400=24) into @isei. recode @isko (9000=20) into @isei. recode @isko (9100=25) into @isei. recode @isko (9110=29) into @isei. recode @isko (9111=29) into @isei. recode @isko (9112=28) into @isei. recode @isko (9113=29) into @isei. recode @isko (9120=28) into @isei. recode @isko (9122=28) into @isei. recode @isko (9130=16) into @isei. recode @isko (9131=16) into @isei. recode @isko (9132=16) into @isei. recode @isko (9133=16) into @isei. recode @isko (9140=23) into @isei. recode @isko (9141=23) into @isei. recode @isko (9142=23) into @isei. recode @isko (9150=27) into @isei. recode @isko (9151=25) into @isei.

163
recode @isko (9152=27) into @isei. recode @isko (9153=27) into @isei. recode @isko (9160=23) into @isei. recode @isko (9161=23) into @isei. recode @isko (9162=23) into @isei. recode @isko (9200=16) into @isei. recode @isko (9210=16) into @isei. recode @isko (9211=16) into @isei. recode @isko (9212=16) into @isei. recode @isko (9213=16) into @isei. recode @isko (9300=23) into @isei. recode @isko (9310=21) into @isei. recode @isko (9311=21) into @isei. recode @isko (9312=21) into @isei. recode @isko (9313=21) into @isei. recode @isko (9320=20) into @isei. recode @isko (9321=20) into @isei. recode @isko (9322=24) into @isei. recode @isko (9330=29) into @isei. recode @isko (9331=22) into @isei. recode @isko (9332=22) into @isei. recode @isko (9333=30) into @isei. var lab @isei 'ISEI scores'. Execute.