esrc international distance education and african students advisory panel meeting
TRANSCRIPT

Working together on using learning analytics and learning design to improve (international) student outcomes
UNISA 24 January 2017
Ashley Gunter, Clare Madge, Jenna Mittelmeier, Paul Prinsloo, Parvati Raghuram, Katharine Reedy, Jekaterina Rogaten, Bart Rienties

(Social) Learning Analytics“LA is the measurement, collection, analysis and reporting of data about learners and their contexts, for purposes of understanding and optimising learning and the environments in which it occurs” (LAK 2011)
Social LA “focuses on how learners build knowledge together in their cultural and social settings” (Ferguson & Buckingham Shum, 2012)
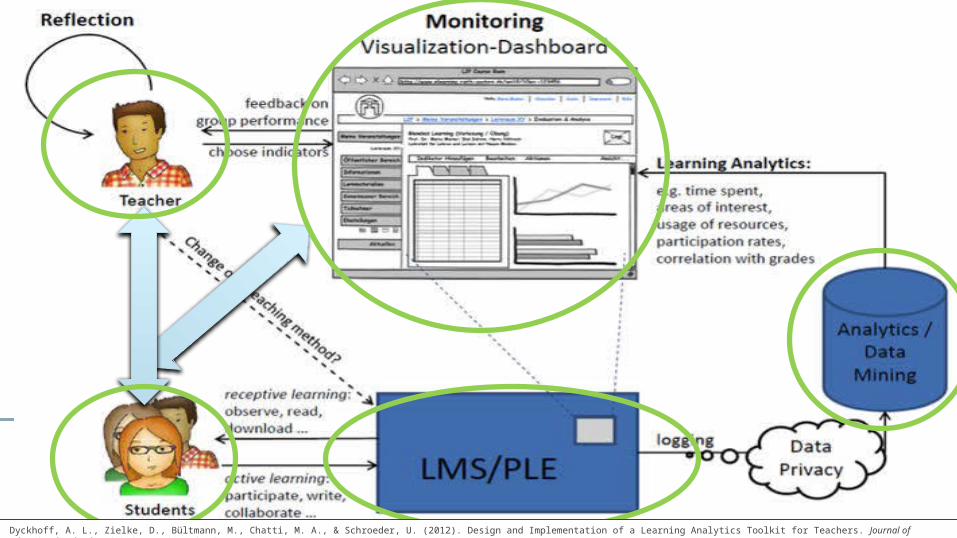
Dyckhoff, A. L., Zielke, D., Bültmann, M., Chatti, M. A., & Schroeder, U. (2012). Design and Implementation of a Learning Analytics Toolkit for Teachers. Journal of Educational Technology & Society, 15(3), 58-76.

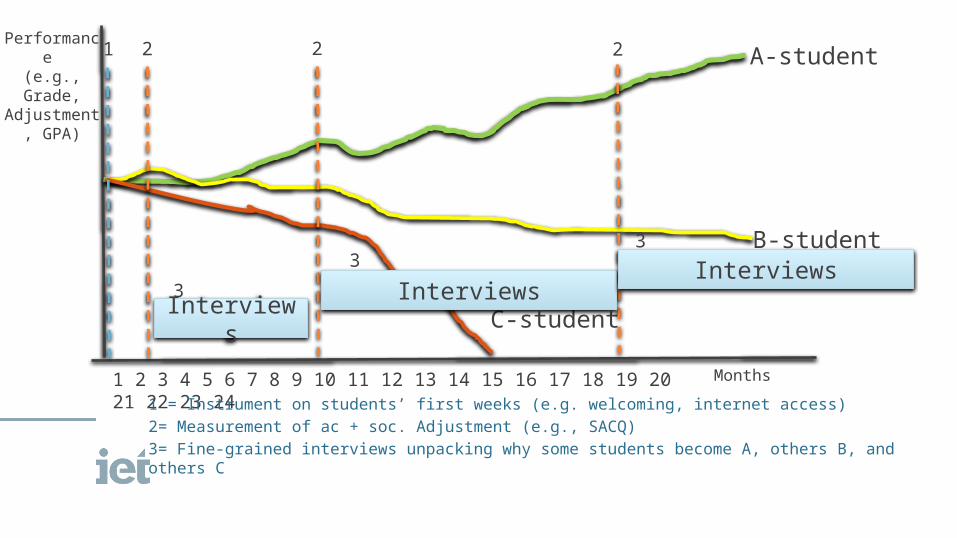
Performance (e.g., Grade,Adjustment,
GPA)
Time
A-student
B-student
C-student
A vast body of research shows that Affective, Behavioural, and Cognitive factors (Searle and Ward, 1990; Jindal-Snape & Rienties, 2016) influence academic and social adjustment over time, which in turn predicts learning outcomes (Crede et al. 2012; Rienties et al. 2012). Some students develop appropriate ABC and ac + soc. Adjustment strategies and become “A-students”, others progress reasonably well (B-student) and some students drop out over time (C-student).
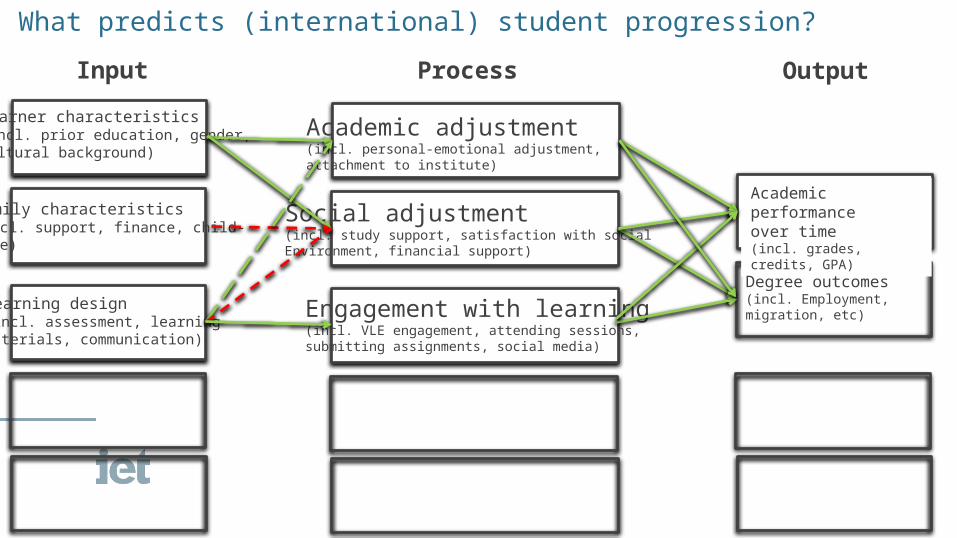
What predicts (international) student progression?
Input Process Output
Learner characteristics(incl. prior education, gender,cultural background)
Academic adjustment(incl. personal-emotional adjustment, attachment to institute)
Social adjustment(incl. study support, satisfaction with socialEnvironment, financial support)
Family characteristics(incl. support, finance, child-care)
Learning design(incl. assessment, learning materials, communication)
Engagement with learning(incl. VLE engagement, attending sessions, submitting assignments, social media)
Academic performanceover time(incl. grades, credits, GPA)
Degree outcomes(incl. Employment, migration, etc)
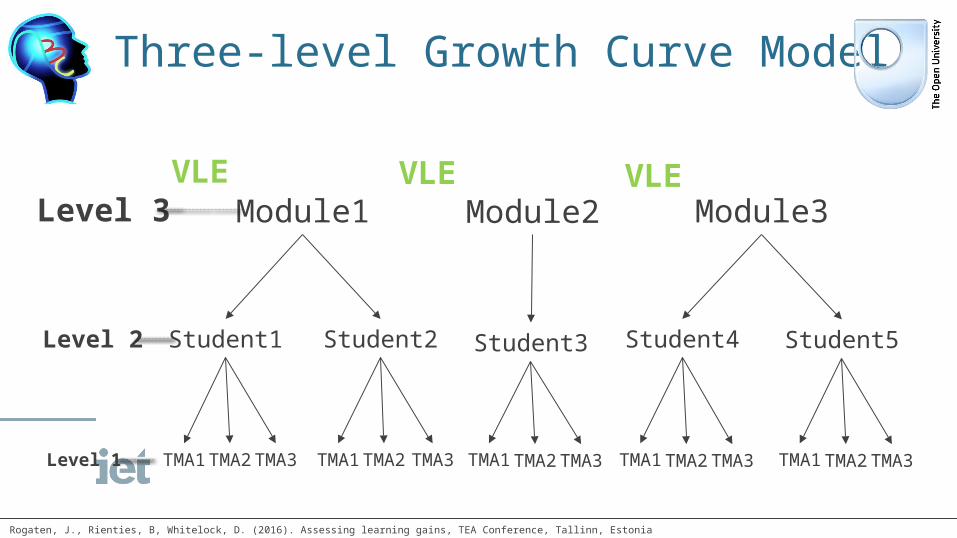
Three-level Growth Curve Model
Level 1
Level 2
Level 3
TMA1
Student1
TMA3 TMA1 TMA2 TMA3 TMA1 TMA2 TMA3TMA2
Student2 Student3
Module1 Module2
TMA1 TMA2 TMA3
Student4
TMA1 TMA2 TMA3
Student5
Module3
Rogaten, J., Rienties, B, Whitelock, D. (2016). Assessing learning gains, TEA Conference, Tallinn, Estonia
VLE VLEVLE
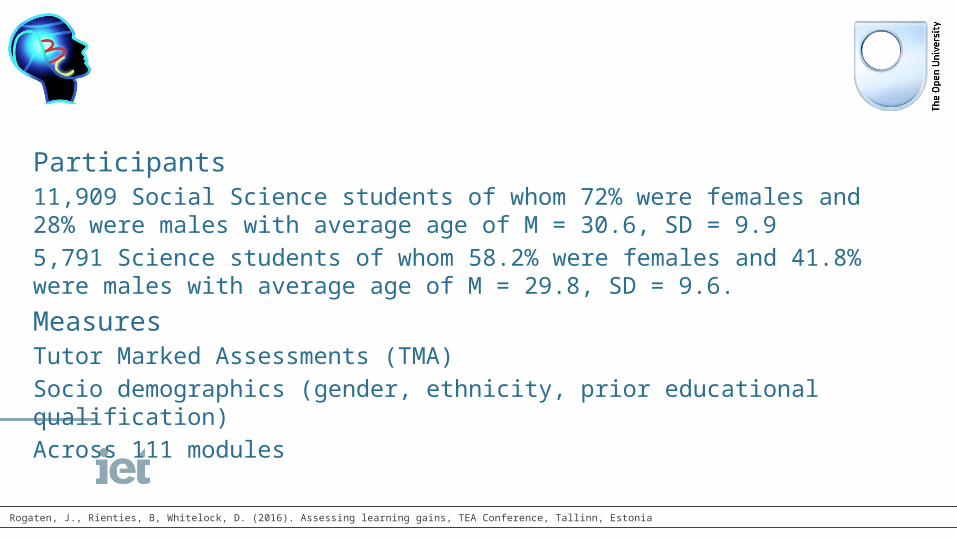
Participants11,909 Social Science students of whom 72% were females and 28% were males with average age of M = 30.6, SD = 9.95,791 Science students of whom 58.2% were females and 41.8% were males with average age of M = 29.8, SD = 9.6.
MeasuresTutor Marked Assessments (TMA)Socio demographics (gender, ethnicity, prior educational qualification)Across 111 modules
Rogaten, J., Rienties, B, Whitelock, D. (2016). Assessing learning gains, TEA Conference, Tallinn, Estonia
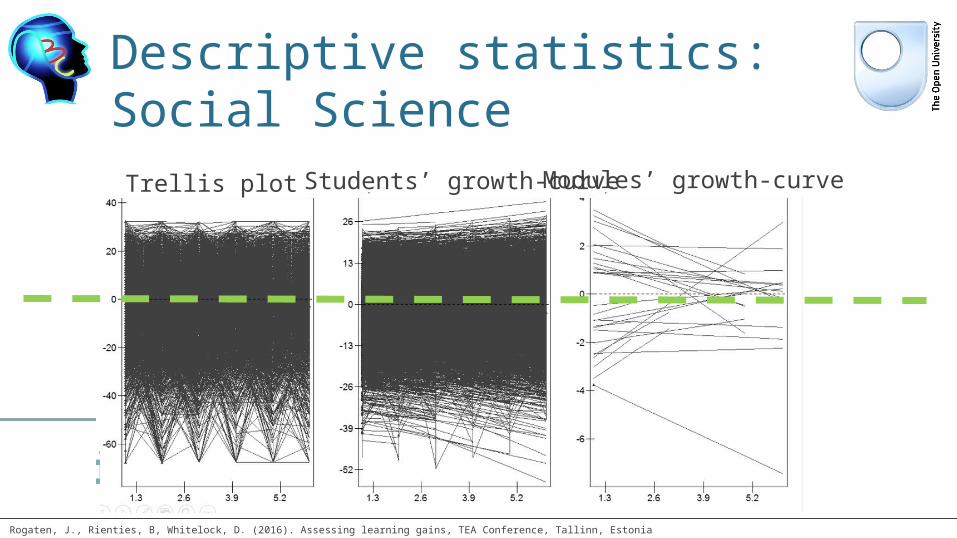
Descriptive statistics: Social Science
Trellis plot Students’ growth-curve Modules’ growth-curve
Rogaten, J., Rienties, B, Whitelock, D. (2016). Assessing learning gains, TEA Conference, Tallinn, Estonia

Descriptive statistics: Science
Trellis plot Students’ growth-curve Modules’ growth-curve
Rogaten, J., Rienties, B, Whitelock, D. (2016). Assessing learning gains, TEA Conference, Tallinn, Estonia

The 3-level model accounted for total of:6% and 33% of variance in students initial scores 19% and 26% of variance in students subsequent learning gains
Socio-demographic variables are strong predictors of variance in initial achievements and also in subsequent learning gainsMain effect of socio-demographic variables and Interaction between TMAs socio-demographic variables showed that single most important predictors of initial achievements and growth were ethnicity and prior education level (White students with A levels show high initial achievements and subsequent high learning gain)
Rogaten, J., Rienties, B, Whitelock, D. (2016). Assessing learning gains, TEA Conference, Tallinn, Estonia
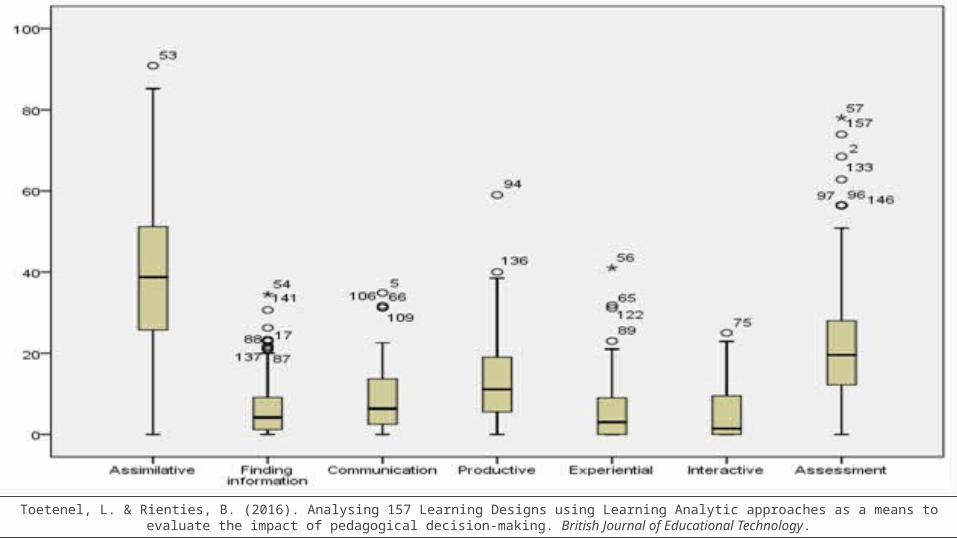
Toetenel, L. & Rienties, B. (2016). Analysing 157 Learning Designs using Learning Analytic approaches as a means to evaluate the impact of pedagogical decision-making. British Journal of Educational Technology.

Method – data sets• Combination of four different data sets:
• learning design data (189 modules mapped, 276 module implementations included)
• student feedback data (140)• VLE data (141 modules)• Academic Performance (151)
• Data sets merged and cleaned• 111,256 students undertook these modules

Constructivist Learning Design
Assessment Learning Design
Productive Learning Design
Socio-construct. Learning Design
VLE Engagement
Student Satisfaction
Student retention
150+ modules
Week 1 Week 2 Week30+
Rienties, B., Toetenel, L., (2016). The impact of learning design on student behaviour, satisfaction and performance: a cross-institutional comparison across 151 modules. Computers in Human Behavior, 60 (2016), 333-341
Communication
Performance (e.g., Grade,Adjustment,
GPA)
Months
A-student
B-student
C-student
1 2 3 4 5 6 7 8 9 10 11 12 13 14 15 16 17 18 19 20 21 22 23 24
InterviewsInterviews
Interviews
1 2 2 2
1 = Instrument on students’ first weeks (e.g. welcoming, internet access)2= Measurement of ac + soc. Adjustment (e.g., SACQ)3= Fine-grained interviews unpacking why some students become A, others B, and others C
3
33
Working together on using learning analytics and learning design to improve (international) student outcomes
UNISA 24 January 2017
Ashley Gunter, Clare Madge, Jenna Mittelmeier, Paul Prinsloo, Parvati Raghuram, Katharine Reedy, Jekaterina Rogaten, Bart Rienties