esr-study of the bandstructure of cadmiu sulfidm e by
TRANSCRIPT

ESR-STUDY OF THE BANDSTRUCTURE OF CADMIUM SULFIDE
by
BJORN JOHAN SLAGSVOLD
A THESIS SUBMITTED IN PARTIAL FULFILMENT OF
THE REQUIREMENTS FOR THE DEGREE OF
DOCTOR OF PHILOSOPHY
i n t h e Department
o f
P h y s i c s '
We a c c e p t t h i s t h e s i s as c o n f o r m i n g t o t h e
r e q u i r e d s t a n d a r d
THE UNIVERSITY OF BRITISH COLUMBIA
J u l y 1 9 6 6

In presenting t h i s t h e s i s i n p a r t i a l f u l f i l m e n t of the requirements
f o r an advanced degree at the U n i v e r s i t y of B r i t i s h . Columbia,, I agree
that the L i b r a r y s h a l l make i t f r e e l y a v a i l a b l e f o r reference and
study„ I furt h e r agree that permission-for extensive copying of t h i s
t h e s i s f o r s c h o l a r l y purposes may be granted by the Head of my
Department or by h i s representatives. I t i s understood that copying
or p u b l i c a t i o n of t h i s t h e s i s f o r f i n a n c i a l gain shall, not be allowed
without my w r i t t e n permission.
Department of
The U n i v e r s i t y of B r i t i s h Columbia Vancouver 8, Canada

The University of. B r i t i s h Columbia
FACULTY OF GRADUATE STUDIES
PROGRAMME OF THE
FINAL ORAL, EXAMINATION
FOR THE DEGREE OF
DOCTOR OF PHILOSOPHY
of
BJ0RN JOHAN SLAGSVOLD
C.E., Technical University of Norway, 1962
THURSDAYt AUGUST 25, .1.966 at. 3:30 P.M.
IN ROOM 301, HENNINGS BUILDING
COMMITTEE IN CHARGE
Chairman; B. N. Moyls
R. Barrie C. F. Schwerdtfeger J. B. Farmer B. G. Turrel1 R. Howard L. Young
External Examiner; J . Lambe
Ford S c i e n t i f i c Laboratories Dearborne, Michigan.
Research Supervisor: C. F. Schwerdtfeger

AN ESR-STUDY OF THE BANDSTRUCTURE OF GDS
ABSTRACT
The e l e c t r o n i c g-tensor i n halogen-doped cadmium su l f i d e -has been measured at 1.7°KS and i t s dependence upon u n i a x i a l pressures p a r a l l e l and perpendicular to the c-axis has been investigated. A sample doped with iodine to a room temperature r e s i s t i v i t y of « 0 . 7 .TLcm exhibited an anisotropic, g-tensor with g = 1.785 and g . = 1.767. The anisotropy i n a heavily bromine-doped sample (> « 0.07 .n, cm) was the same, but g^ was s l i g h t l y larger, 1.789. When some of the cadmium i s replaced by zinc, the a l l o y acquires properties intermediate between those of CdS and ZnS. This was shown to apply to the g-tensor by measuring i t i n CdS(10% Zn):I. It was found to have a smaller anisotrophy and a larger absolute value than that of CdS:I, thus having changed towards that of ZnS.
The pressure dependence of the g-tensor and the change i n the o p t i c a l bandgap under hydrostatic pressure could be reasonably well explained i n terms of two deformation p o t e n t i a l constants for the bandgap D1-C1-C3 «w6.3 eV/unit s t r a i n and D2-C2-C4«1.8 eV/unit s t r a i n . It i s therefore concluded that although the bandstructure of CdS i s not s u f f i c i e n t l y well known to predict the g-tensor c o r r e c t l y , the i n t e r a c t i o n of the conduction band with the valence bands appears to be.dqminant. Further experiments to study the conduction band edge are proposed.

GRADUATE STUDIES
F i e l d of Study: S o l i d State Physics
Elementary Quantum Mechanics F. A. Kaempf.'
Quantum Theory of Solids W . Opechow
Stochastic. Processes i n Physics R„ E. Burge
Advanced Magnetism M. Bio
S t a t i s t i c a l Mechanics R. Ban
Advanced Topics l a S o l i d State Physics D. L. W i l l i e

PUBLICATIONS
B. 3. Slagsvold, Spin Wave I n s t a b i l i t y i n Ferro- and Ferrimagnetic Materials with A p p l i c a t i o n to Power Limiting ( i n Norwegian) s Elektroteknisk T i d s s k r i f t 13 (1963).
B. J. Slagsvold and C. F. Schwerdtfeger, Electron Spin Resonance of Halogens i n CdS, Can.J.Phys. 43 2092 -(1965).

ABSTRACT
The e l e c t r o n i c g-tensor i n halogen-doped cadmium s u l f i d e has been
measured at 1.7°K, and i t s dependence upon u n i a x i a l pressures p a r a l l e l and
perpendicular to the c-axis has been investigated. A sample doped with
iodine to a room temperature r e s i s t i v i t y of w0.7^cm exhibited an aniso
t r o p i c g-tensor with g^ = 1.785 and g^ = 1.767. The anisotropy i n a heavily
bromine-doped sample 0.07/icm) was the same, but g^ was s l i g h t l y
l a r g e r , 1.789. When some of the cadmium i s replaced by zinc, the a l l o y
acquires properties intermediate between those of CdS and ZnS. This was
shown to apply to the g-tensor by measuring i t i n CdS(10%Zn):I. I t was
found to have a smaller anisotropy and a larger absolute value than that of
CdS:I, thus having changed towards that of ZnS.
The pressuredependence of the g-tensor and the change i n the
o p t i c a l bandgap under hydrostatic pressure could be reasonably well explained
i n terms of two deformation p o t e n t i a l constants f o r the bandgap, D^-C^-C3 »
6.3 eV/unit s t r a i n and D 2 - C 2 - C 4 « 1 . 8 eV/unit s t r a i n . It i s therefore
concluded that although the bandstructure of CdS i s not s u f f i c i e n t l y well
known to predict the g-tensor c o r r e c t l y , the i n t e r a c t i o n of the conduction
band with the valence bands appears to be dominant. Further experiments to
study the conduction band edge are proposed.
II

TABLE OF CONTENTS
Abstract
Table of Contents
L i s t of Figures
L i s t of Tables
Acknowledgments
CHAPTER 1
Introduction
CHAPTER 2
P r i n c i p l e s of Operation
Systemdescription
Procedure and performance
S e n s i t i v i t y
CHAPTER 3
Samples
CHAPTER 4
Theory of the g-Value
• Experimental Results
Discussion
The Linewidth
CHAPTER 5
The strain-dependence of the g-Value
Experimental R e s u l t s
Discussion
I I I

Page
CHAPTER 6
The Resonance i n a Current-carrying Sample 56
The Temperature-dependence 58
The S p i n - S p l i t t i n g f o r F i n i t e k" 58
. CHAPTER 7
Conclusions 60
Bibliography 62
IV

LIST OF FIGURES
Page
Figure 2.1 Block diagram of spectrometer 8
Figure 2.2 ^104 rectangular cavity, with lever arms .9
Figure 2.3 Signal d i s t o r t i o n r e s u l t i n g from admixture of dispersion .13
Figure 2.4 V a r i a t i o n of s i g n a l to noise r a t i o and linewidth with 16 modulation amplitude •
Figure 3.1 V-I c h a r a c t e r i s t i c s at room temperature of CdS:I and 20 CdS(10%Zri-):I
Figure 3.2 V a r i a t i o n of resistance with temperature 21
Figure 3.3 V-I c h a r a c t e r i s t i c of a CdS:I sample at <~1.7°K 22
Figure 4.1 The bandstructure at k = 0 i n CdS and Ge 25
Figure 4.2 Spin resonance signals i n CdS 32
Figure 4.3 The g-value as a function of o r i e n t a t i o n 33
Figure 5.1 Recorder trace of ESR l i n e with f i e l d markers 47
Figure 5.2 The change i n g^ with u n i a x i a l pressure 49
Figure 5.3 The change i n g^ with u n i a x i a l pressure 50
Figure 5.4 The change i n g. with u n i a x i a l pressure ( s i n g l e 51 readings) -1-
Figure 6.1 Cavity used with a current carrying sample 56
V

LIST OF TABLES
Table 3. 1 R e s i s t i v i t i e s of the Samples
• Page
19
Table 4. 1 The Valence Band States i n Wurtzite 28
Table 4. 2 Results f o r the Conduction Band g-Tensor in CdS 34
Table 4. 3 Bandparameters f o r CdS and CdSe 38
Table 4. 4 Comparison of A 's Obtained from.Quasi-cubic Model and from F i t of the g-Tensor
40
Table 4. 5 Spins and Magnetic Moments of Donor Nuclei 42
Table 5. 1 Observed g-Shifts Under Strain 52
VI

ACKNOWLEDGMENTS
I wish to thank Dr. C. F. Schwerdtfeger f o r h i s guidance and
assistance at a l l stages i n preparing t h i s t h e s i s . To Dr. R. Barrie I am
indebted f o r h e l p f u l suggestions concerning the i n t e r p r e t a t i o n of the
r e s u l t s .
Scholarships from The Royal Norwegian Council f o r S c i e n t i f i c and
I n d u s t r i a l Research, The University of B r i t i s h Columbia by the Dean of
Inter-Faculty and Student A f f a i r s , and from the National Research Council
of Canada are g r a t e f u l l y acknowledged.
The research f o r t h i s t h e s i s was supported by the National
Research Council, grant number A-2228.
VII

CHAPTER 1
INTRODUCTION
In the present t h e s i s we s h a l l be dealing with electron spin
resonance (ESR) i n cadmium s u l f i d e . This i s one of the wurtzite-type
materials, which include the s u l f i d e s and selenides of zinc and cadmium, and
zinc oxide. Whereas these materials are e s p e c i a l l y important as photo-
conductors and phosphors, they also possess semiconductor c h a r a c t e r i s t i c s .
These properties are l a r g e l y determined by the bahdstructure of the 'crystal,
as well as the various kinds of defect centres which may e x i s t i n the l a t t i c e .
A v a r i e t y of experimental t o o l s have been used i n exploring energy bands and
impurities i n semiconductors. In p a r t i c u l a r , electron spin resonance
experiments performed by Eeher (1959), Feher, Wilson and Gere (1959), and by
Wilson (1964) provided valuable information on the shallow donors i n s i l i c o n
and germanium. A review of the r e s u l t s from the extensive studies of semi
conductors by ESR techniques has been given by Ludwig and Woodbury (1962).
The spectra observed by. Eeher and Wilson from electrons bound to
shallow donors i n s i l i c o n and germanium exhibited hyperfine structure owing
to the i n t e r a c t i o n of the electron spins with the magnetic moments of the
donor n u c l e i . A number of resonances have also been detected i n compound
semiconductors, but a hyperfine structure s i m i l a r to that found i n s i l i c o n
and germanium, i s generally absent. The reason for t h i s i s that the a v a i l a b l e
compound semiconductor c r y s t a l s usually have impurity concentrations i n a
region where impurity band e f f e c t s are important. Possible hyperfine structure
i s averaged out because the electrons from which the signals a r i s e , are
e s s e n t i a l l y mobile even at low temperatures (Muller and Schneider 1963). We
have observed such single l i n e ESR spectra at «1.7°K i n cadmium s u l f i d e
doped with bromine and iodine (Slagsvold and Schwerdtfeger 1965). These
impurities form shallow donors i n CdS. The present measurements include a
determination of the g-tensors i n three d i f f e r e n t samples and an i n v e s t i g a t i o n
- 1 -

of the s h i f t of the g-value under u n i a x i a l pressures.
The f i r s t resonance i n a halogen-doped c r y s t a l of CdS was reported
by Lambe and Kikuchi (1958). Their sample was CdS:Cl with an estimated room
17 —3
temperature c a r r i e r concentration of «*10 x / cm . The half-width of the
single l i n e seen at 4.2°K was about 8 gauss, and the g-value was s l i g h t l y
a n i s o t r o p i c , being 1.79 and 1.78 f o r magnetic f i e l d s p a r a l l e l and perpendicular
to the c-axis r e s p e c t i v e l y . Lambe and Kikuchi ascribed t h e i r s i g n a l to
electrons bound to C l _ centres. The reason f o r the absence of a hyperfine
structure was explained under the assumption that an already negative
chlorine core would tend to minimize the i n t e r a c t i o n of the a d d i t i o n a l
electron with the chlorine nucleus. To explain the observed g - s h i f t
(deviation from the free electron value of 2.0023) a model of a l o c a l i z e d
e l ectron i n analogy with the F-center was used. Hopfield and Thomas (1961)
derived e l e c t r o n i c g-values i n agreement with those of Lambe and Kikuchi from
excitonspectra i n CdS and pointed out that they should e s s e n t i a l l y be
determined by the bandstructure. That t h i s i s i n f a c t so i s c l e a r l y shown by
a number of observations on the wurtzite-type materials. In p a r t i c u l a r a
mixture of ZnS. and CdS exh i b i t s a g-value intermediate between those of ZnS
and CdS re s p e c t i v e l y . Miiller and Schneider (1963) have reviewed these
r e s u l t s . In addition to the above measurements t h e i r review mentions an
observation by Dieleman (1962) on CdS containing gallium - also a donor - i n
an excess of copper.
A de r i v a t i o n of the g-value from the bandstructure has been given
by Roth (1960). The formula contains interband matrix elements of the
momentum operator "p and the bandgaps. These same quantities also enter the
formula f o r the e f f e c t i v e mass r e s u l t i n g from the use of the k-p"" technique
(e.g. K i t t e l 1963). Cardona (I963a)has calculated g-values and e f f e c t i v e
masses for the common germanium-like semiconductors using these methods.
- 2 -

He neglected the anisotropy of the wurtzite-type materials by treating them
as cubic, while they a c t u a l l y are hexagonal. In the case of CdS Cardona
obtained an e l e c t r o n i c g-value of »1.89, thus accounting f o r about one h a l f
of the observed g - s h i f t .
In the next two chapters we give a d e s c r i p t i o n of our experimental
arrangement. Then i n chapter 4 i s presented an attempt to calculate the
contribution to the g - s h i f t from the valence bands taking anisotropy into
account. In describing the valence band states we u t i l i z e functions
derived on the quasi-cubic model of Hopfield (1960).
The strain-dependence of the g-value i s considered i n chapter 5.
It i s thought of' as a r i s i n g from changes i n the bandstructure when the
l a t t i c e i s deformed. The discussion i s based on the deformation p o t e n t i a l
theory of Bardeen and Schockley (1950). Deformation p o t e n t i a l constants
appropriate f o r the wurtzite structure may be derived by considering small
changes i n the c r y s t a l f i e l d parameter as defined by Hopfield (i960). A
s l i g h t l y more general d e s c r i p t i o n may be obtained from the theory of
Pikus (1961).
A p p l i c a t i o n of u n i a x i a l pressures usually show the most i n t e r e s t i n g
e f f e c t s when i t causes a removal of degeneracies. In our case there was no
degeneracy to be l i f t e d , and the experiments were undertaken to gain further
information on the connection between the bandstructure and the g-tensor.
According to Sobolev (1964) the deformation p o t e n t i a l constants describing
r e l a t i v e movements of the valence bands are large enough to be observable
o p t i c a l l y . They might therefore also be expected to a f f e c t the s t r a i n
dependence of the g-tensor.
In homopolar semiconductors m o b i l i t i e s and the temperature change
of the bandgap are governed by the deformation potentials'through scattering
- 3 -

by a c o u s t i c a l phonons and the d i l a t a t i o n e f f e c t r e s p e c t i v e l y . In polar
c r y s t a l s a coupling of the electrons to o p t i c a l phonons gives the dominant
contributions to these quantities thereby reducing the s i g n i f i c a n c e of
deformation p o t e n t i a l s . They s t i l l however belong to the complete picture
of a semiconductor.
!
- 4 -

CHAPTER 2
PRINCIPLES OF OPERATION
In the type of experiment we are concerned with, a small sample of
the paramagnetic material to be studied i s placed i n a microwave cavity at a
p o s i t i o n where i t experiences a p r a c t i c a l l y constant microwave magnetic f i e l d .
A DC magnetic f i e l d i s applied perpendicular to the microwave f i e l d .
Consider the equivalent c i r c u i t at a detuned short p o s i t i o n of a
microwave cavity (Ginzton 1957). I t s impedance i s given by Qo
Z = Z 0 - | p - (2.1) R i
•Here Zo i s the c h a r a c t e r i s t i c impedance of the transmission l i n e connecting
the cavity to the s i g n a l source. Qo i s the q u a l i t y f a c t o r of the unloaded
cavity. The external Q-value, Qex, measures the power reradiated through
the coupling hole. F i n a l l y Rs and Zs are the resistance and,, t o t a l impedance
re s p e c t i v e l y of the ser i e s equivalent c i r c u i t . I f we place a small para
magnetic sample i n the c o i l , i t s self-inductance i s changed from Lo to L:
L = L 0 ( l + FX) (2.2)
The complex r f s u s c e p t i b i l i t y X = X1- - iX' i s a function of the DC magnetic
f i e l d H at a given frequency. F - the f i l l i n g f a c t o r - i s proportional to
the r a t i o of the sample and c o i l volumes and depends upon the shape of the
c o i l . I f the s i g n a l source i s tuned to the resonance of the empty cavity o i
i . e . o> = =—, then the transformed impedance becomes ° Qo
Z = Z ° 1 + iFQo(X' - i X " ) ( 2 > 3 )
One can measure the r e a l and imaginary parts of the s u s c e p t i b i l i t y
separately by using a bridge arrangement. The r e a l part X' represents a
detuning of the cavity from resonance. I f one e l e c t r o n i c a l l y keeps the
cavity at resonance thereby compensating f o r X', then the cavity Q i s given
- 5 -

by, from equation(2.3 )
Q = q°—r, (2-4) ^ 1 + FQ 0X"
To obtain good s i g n a l to noise r a t i o s one usually employs AC-
technique to detect the sig n a l s . A small modulation h^ sinco^t i s super
imposed on the DC magnetic f i e l d . Tuning the detector c i r c u i t to U>M? the
part of Z varying at U>M * s picked out:
Z ~ Z ° Qel F W~ hM s i n W M t (2.5)
If now the centre Tvalue of the DC magnetic f i e l d i s slowly swept
and the r e c t i f i e d s i g n a l traced out with a recorder, one obtains a display dX"
of the der i v a t i v e of the s u s c e p t i b i l i t y , ^ — . Usually one i s interested
i n the magnetic f i e l d at which X" has i t s maximum and i n the width of the
absorption peak. I f one requires the absolute magnitude of X!' , i t i s best
to compare with a standard s i g n a l .
- 6 -

SYSTEMDESCRIPTION
A block-diagram of the system i s given in fi g u r e 2.1. A type
E.M.I. R9546 s i g n a l klystron ( k l y s t r o n o s c i l l a t o r I) was used. These tubes
are s p e c i f i e d to d e l i v e r from 20 to 100 mw i n the band 32.3 - 37.5 Gc/s
(Ka-band). They do however o s c i l l a t e with a s u b s t a n t i a l output down to ca.
30 Gc/s.
The s i g n a l frequency was measured by zero beating i t against the
t h i r d harmonic of a V-154 k l y s t r o n o s c i l l a t o r ( I I ) i n conjunction with a
TRG Model X920A harmonic mixer. F i n a l l y the X-Band frequency was measured
using the Hewlett Packard 540B t r a n s f e r o s c i l l a t o r and 524D counter with
525A plug-in unit.
The microwave bridge was a 4-port hybrid junction ("^magic T w ) .
In the v a r i a b l e coupler (Gordon 1961) the waveguide cross-section
i s tapered down to a si z e corresponding to a c u t - o f f frequency of 38 Gc/s.
This may be lowered to »*#26 Gc/s by f i l l i n g the guide with t e f l o n ( d i e l e c t r i c
constant e = 2.1). Thus, i f a t e f l o n plunger i s moved in t o the narrowed
section, the length of the c u t - o f f waveguide i s reduced and we vary the
coupling (Qex).
A tunable TEioi c y l i n d r i c a l cavity from Varian Associates was used
when measuring the anisotropy i n the g-values. The samples were mounted i n
the centre of the cavity with a t e f l o n holder, and the magnetic f i e l d could
be rotated about the cavity axis. For the measurements on strained samples
a homemade TE104 rectangular cavity ( f i g u r e 2.2) was employed. Its upper
part was soldered onto the v a r i a b l e coupler. A known force (measured by a
c a l i b r a t e d spring) was applied through a bellows on the dewar head, and
then s p l i t into two to cancel the bending moment on the waveguide. The
sample was placed between two pieces of i n t r i n s i c s i l i c o n , one glued to the
bottom section of the cavity with epoxy, the other protruding from the
- 7 -

I I
Power aupp'y
Klystron oscillator I
Power supply
Error signal
lOkc/s reference
I Matched load
Slide screw tuner
Directional coupler
Uniline
Attenuator
Oscilloscope
®
Attenuator
Modulation coils
Proton sample'
Oewar'
"Magic T"
ra— P r e " y L amplifier
Crystal detector Variable coupler
/and sample cavity
Audio oscillator
Marginal oscillator
Magnet
Audio output
Klystron oscillator II — T = H — t i t .
Uniline Attenuator
Crystal detector
Harmonic mixer
Hybrid
Transfer oscillator
Amplifier, detector
10 kc/s
400 c/s
Lock in amplifier
400 c/s reference
Counter
Recorder
Fig.2.1. Block diagram of spectrometer.

Figure 2.2. TE^o4 rectangular cavity with l e v e r to apply pressure to the sample.

cavity through a hole i n i t s wall. A pair of lever arms acting on the second
piece of s i l i c o n and the cavity f i n a l l y converted the applied force from v e r t i c a l
to h o r i z o n t a l movement. A sheet of paper between the c r y s t a l and each s i l i c o n
bar ensured a f a i r l y uniformly applied force.
The c r y s t a l detector used was a 1N53B - a low noise diode from
Microwave Associates. The r e f l e c t o r voltage of the s i g n a l k l y s t r o n was
modulated at 10 kc/s. This frequency, as well as the 400 c/s f i e l d modulation
frequency was contained i n the c r y s t a l output. The two signals were amplified
and r e c t i f i e d by phase s e n s i t i v e detectors. I f the cavity was at resonance,
there would be no s i g n a l at 10 kc/s, since a s i g n a l at t h i s frequency would
give r i s e to a correction voltage to the k l y s t r o n r e f l e c t o r , thus moving the
frequency to cancel the s i g n a l . The l o c k - i n a m p l i f i e r used f o r the resonance
s i g n a l was an E l e c t r o n i c s , M i s s i l e s and Communications Inc. Model RJB Lock-
i n Amplifier. Its r e c t i f i e d output was fed into a Brown Potentiometer
(recorder) Model no. 153X12V-X-30A.
The f i e l d measurements were made with a marginal o s c i l l a t o r
described by Benedek and Kushida (1960). The glycerine proton sample was
attached to one of the polepieces. There was a f i e l d d ifference of about
100 gauss between the centre of the gap and the p o s i t i o n of the glycerine
probe. For the absolute g-value measurements the s i g n a l caused by phosphorous
impurities i n heavily doped s i l i c o n (2110^-8 P/cm^) was used as a reference.
To do t h i s the f i e l d configuration was assumed e s s e n t i a l l y the same i n the
range : 12-14 kguuss. The proton s i g n a l was introduced iri£o; the l o c k ^ i n . a m p l i f i e r
iii; p a r a l l e l .with thec:electronLspin::signal..permitting the f i e l d markers to
appear .directly ..On; the c h a r t J . The i frequency f of other, marginal .^.oscillator- was
counted with the HP counter and the f i e l d computed from
H (gauss) = 2.3487-10"4 f ( c / s e c ) (2.6)
- 10 -

The magnet was a Newport Instruments Type D 8 W Electromagnet. A
p a i r of modulation c o i l s attached to the c o n i c a l p o l e t i p s were driven with
an audio o s c i l l a t o r and amp l i f i e r . This gave a maximum modulation amplitude
of about 32 gauss.
Temperatures of f»1.7°K i n the cavity were obtained by immersing
i t i n l i q u i d helium and pumping down the pressure. Glass dewars were used
to contain the helium and the nitrogen s h i e l d . One helium dewar became
"soft™ a f t e r some usage, presumably due to small scratches caused by rubbing
against the metal parts. At low temperatures these w i l l l e t helium through
into the evacuated wall of the dewar, thereby causing a serious heatleak.
Some coating (e.g. e l e c t r i c a l tape) should therefore be used on flanges,
screws etc. to protect the glass when the dewar i s set i n place.
- 11 -

PROCEDURE AND PERFORMANCE
The r e f l e c t o r voltage was modulated over a mode at the l i n e
frequency and the detector output displayed on an os c i l l o s c o p e . I f the
klys t r o n frequency sweeps through the cavity resonance frequency, a dip
appears on the scope picture. The klystron i s then locked to the frequency
corresponding to the bottom of t h i s dip by the AFC (automatic frequency
control) u n i t .
When the kly s t r o n i s thus locked to the cavi t y , the recorded
s i g n a l should, f o r a modulation amplitude l e s s than about one f i f t h of the dX" 0 0
linewidth, c l o s e l y reproduce the shape of — ' . However, in our set-up
c e r t a i n problems were encountered with unsymmetric l i n e s . At times the
d i s t o r t i o n would be serious.
I f the cavity i t s e l f presented the only s i g n i f i c a n t frequency f
dependence i n the system within a range of a few times —=r- , then the %
k l y s t r o n would be locked exactly to the cavity -resonance frequency, and a dX"
true ^ would be observed. However, several components do show
s i g n i f i c a n t frequency dependence. The width of the k l y s t r o n mode i t s e l f i s
less than 100 Mc/s. while the unloaded and loaded Q-s of the cavity with
sample would t y p i c a l l y be about 5000 and 1500 res p e c t i v e l y (overcoupled)
corresponding to a & 20 Mc/s. In the bridge, the C c i v i t y was balanced
against a matched load (VSWR < 1.05)- preceded by a var i a b l e tuning stub.
This stub was used both f o r tuning purposes and to adjust the power into
the detector. The DC c r y s t a l current was kept i n the range 5-50 pA. The
apparent resonance frequency of the cavity was found to be affected by the
tuner, and also by the coupler f o r a l l but the highest Qo-s («12000).
Also, the tuning of the c r y s t a l detector was rather narrowband. As a r e s u l t
the s i g n a l contained a small admixture of some dispersion i n spite of the

Figure 2 . 3 . Signal d i s t o r t i o n r e s u l t i n g from admixture of dispersion. The amplitude i s proportional to the d e r i v a t i v e with respect to x of X" +aX'. A Lorentzian l i n e with H-H0 i s assumed.
x =
- 13 -

supposed merits of such a s t a b i l i z a t i o n scheme.
Assuming a symmetric X"" (H), the r e s u l t of dispersion admixture i s
that the two peaks ( f i g u r e 2.3) of the s i g n a l w i l l have a d i f f e r e n t height
and the i n t e r s e c t i o n with the baseline w i l l not correspond to the true l i n e -
centre. The asymmetry i n our l i n e s had a peak height r a t i o of *»1.3. This
corresponds to an estimated 20% admixture of X* and a systematic error in the
p o s i t i o n of the l i n e centre of l e s s than one eighth of the width between the
i n f l e c t i o n points. In terms of g the error should be l e s s than 2-10" 4. The
absolute g-measurements are hardly affected by t h i s since t h e i r accuracy was
+ 1-10~3. In the case of r e l a t i v e g-measurements, the systematic error
would be the same throughout a run and hence would not a f f e c t the g - s h i f t
measurements. The error i n the observed width between i n f l e c t i o n points i s
n e g l i g i b l e with our accuracy.
It was found that even with the u n i l i n e (s»20 db i s o l a t o r ) between
the k l y s t r o n and the bridge, some attenuation was needed to prevent the
cavity from p u l l i n g the k l y s t r o n . About 20 db was used l e a v i n g *w 0.1 mW
to be fed into the c a v i t y .
-14 -

SENSITIVITY
The obtainable s i g n a l to noise r a t i o i s a main concern i n
electron spin resonance spectroscopy on semiconductors. A general study of
the problem has been made by Feher (1957). For a s t r a i g h t detection
spectrometer l i k e the present the ultimate s e n s i t i v i t y l i m i t i n g feature i s
the ^ c r y s t a l noise. Measurements of the noisepower being fed into the 1 1.2
l o c k T i n a m p l i f i e r from the preamplifier gave a v a r i a t i o n of roughly ^
from s*50 c/s to 5 kc/s using a IN53 c r y s t a l detector i n our set-up. Also
the noise increased roughly i n d i r e c t proportion to the r e c t i f i e d current
from 5 - 200^iA, while the s i g n a l to noise r a t i o was constant. This
indicates that the c r y s t a l noise i s at l e a s t i n part l i m i t i n g the s e n s i t i v i t y
i n the case of narrow l i n e s .
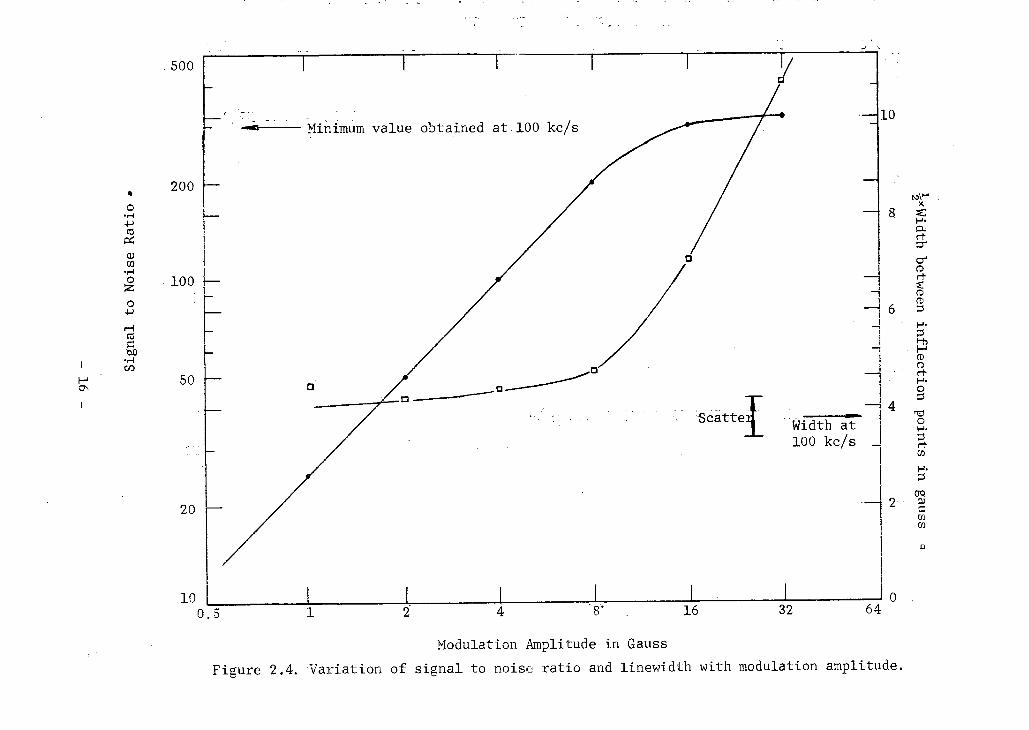
- In general the s i g n a l to noise r a t i o increases with the modulation
amplitude up to about twice the linewidth. This i s shown i n figure 2.4.
The sample was carbon (charred sugar) at room temperature. Also shown i s
the linebroadening as the modulation amplitude becomes comparable to the
linewidth. At a modulation frequency of 100. kc/s, the c r y s t a l noise should
be greatly reduced. Modulation c o i l s f o r t h i s frequency were attached
d i r e c t l y to the cavity.. As i s indicated i n figure 2.4 the maximum
s e n s i t i v i t y obtained with 16 gauss modulation amplitude at 400 c/s i s the
same as that obtained with only 2 gauss at 100 kc/s. However, d r i v i n g the
100 kc/s c o i l s at t h i s l e v e l i n the heliumbath quickly boiled the helium
away thereby also causing a d d i t i o n a l noise. The 100 kc/s modulation scheme
therefore did not seem to o f f e r any r e a l advantage f o r our purpose, and we
used modulation amplitudes of 5-15 gauss at 400 c/s. While the inherent
s e n s i t i v i t y of the spectrometer was s u f f i c i e n t to give s i g n a l to noise - 15 -
o
o +J be
O N
Modulation Amplitude in Gauss Figure 2.4. V a r i a t i o n of s i g n a l to noise r a t i o and linewidth with modulation amplitude.

r a t i o s i n excess of «»15 f o r most of our samples, the high modulation
amplitude would occasionally cause serious v i b r a t i o n a l noise i n the ca v i t y .
The cavity q u a l i t y f a c t o r Qo i s an important parameter i n s i g n a l
to noise considerations. For the two c a v i t i e s c h i e f l y employed i n the present
measurements Q's were measured at «»100°K (nitrogen i n the s h i e l d i n g dewar).
The r e s u l t s were *w 12000 and *=»7500 f o r the c y l i n d r i c a l (commercial) and
rectangular (homemade) one r e s p e c t i v e l y .
Rectangular T E i o n c a v i t i e s were made from the WG28 s i l v e r waveguide.
Both they and the commercial cavity ( s i l v e r p l a t e d ) showed spurious signals
at 4.2°K and lower. There was one very ;.asymmetric «*250 gauss wide l i n e
at g «s*2.05 and a «25 gauss wide symmetric l i n e at g a* 2. Their r e l a t i v e
heights varied somewhat, but s i g n a l to noise r a t i o s of up to 20 were
observed f o r both l i n e s . The o r i g i n of the l i n e s i s not known, but s i m i l a r
cavity e f f e c t s have been reported e a r l i e r (Low 1960). 'A thorough scrubbing
with Comet detergent i s a remedy which i s sometimes successful i n eliminating
such spurious resonance l i n e s (R. T. Schumacher, private communication).
F i n a l l y t e s t s on DPPH and s i l i c o n containing 2•10 1 8•P/cm 3
12
indicated that at room temperature a minimum number of roughly 10 A H
spins could be detected at 34 Gc/s using 400 c/s modulation frequency, 3 sec
timeconstant, the c y l i n d r i c a l c avity and the IN53B c r y s t a l .
- 17 -

CHAPTER 3
SAMPLES
The c r y s t a l s a v a i l a b l e at the time these experiments were i n i t i a t e d
were cadmium s u l f i d e doped with bromine and iodine and cadmium s u l f i d e
containing about 10% Zn and doped with iodine, a l l from Ford S c i e n t i f i c
Laboratories, Dearborne, Mich. From these were selected s i n g l e c r y s t a l s
used i n the measurements. Av a i l a b l e now are also s i n g l e c r y s t a l s of cadmium
s u l f i d e doped with ch l o r i n e , bromine or iodine from Semi-Elements, Saxonburg,
Pa. and a chlorine doped ingot of cadmium s u l f i d e from Eagle Picher,
C i n c i n n a t i , Ohio. Owing to the small concentration a s i g n a l has been
detected only from a bromine-doped sample i n these c r y s t a l s .
Cadmium s u l f i d e c r y s t a l l i z e s i n the hexagonal wurtzite structure -
the spacegroup i s C5 V. I t s c/a r a t i o i s 1.623, close to the value 1.633 of
the hexagonal close-packed structure. The c r y s t a l s e a s i l y cleave i n (1120)
planes. Some of the Ford c r y s t a l s showed a pyramidal growth forming parts
of s i x - s i d e d pyramids. From t h i s the c-axis could be discerned. To a c t u a l l y
i s o l a t e and prepare the samples, c r y s t a l s were e i t h e r cut i n a wiresaw, or
cleaved. The samples used f o r the absolute g-value and r e s i s t i v i t y measure
ments were etched i n a 80°C bath of 100 ml H 2 O , 1 ml cone. H 2 S O 4 and
0.1 mg C r 2 0 3 (Holmes 1962) a f t e r degreasing to clean the surface and remove
fr a c t u r e s . The CdS: Br and CdS: I samples used to measure g(^) were small
cleaved fragments of rather i r r e g u l a r shapes. To v e r i f y that t h e i r
o r i e n t a t i o n s were c o r r e c t l y assumed, they were X-rayed on t h e i r quartz mounts
(Laue back r e f l e c t i o n ) .
The c r y s t a l s of CdS:I and CdS:Br from Ford were rather strongly
colored i n d i c a t i n g a heavy doping, and they also showed low r e s i s t i v i t i e s .
Indium and gallium form ohmic contacts onto n-type CdS. Such contacts
- 1 8 -

were soldered onto roughly rectangular prisms of CdS (<%*1.5 x 1.5 x 1.5 mm3).
^ R e s i s t i v i t i e s were then estimated from the observed resistances of such
samples, and the r e s u l t s are given i n table 3.1.
Table 3.1. R e s i s t i v i t i e s of the Samples
Sample R e s i s t i v i t y Estimated C a r r i e r Concentration
CdS:I a 0 7 n c m 1 0 1 7 cm - 3
CdS(lO% Zn): i a 8 j \ cm 1 0 1 6 cm - 3
CdS:Br a 0 07 n cm 1 0 1 8 cm - 3
CdS:Br b 0 5ricm 1 0 1 7 cm"3
a Ford S c i e n t i f i c L a b o r a t o r i e s D e a r b o r n e , Mich.
D.Semi-Elements, Saxonburg, Pa.
The concentration estimates have been made on the assumption of
100 cm-fyvolt sec f o r the m o b i l i t y .
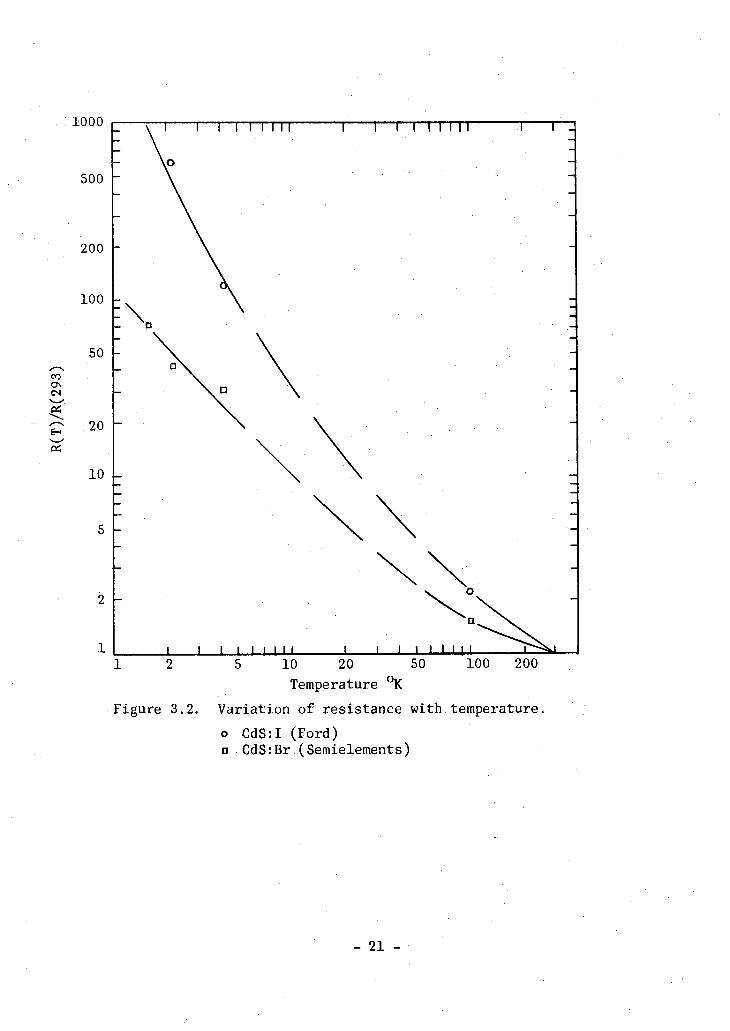
Figure 3.1 shows a part of the V-*I c h a r a c t e r i s t i c f o r CdS(lO% Zn):I
and CdS:I. The contacts are seen to be c l o s e l y ohmic. In f i g u r e 3.2 the
v a r i a t i o n of the resistances of two samples with temperature i s shown.
F i n a l l y f i g u r e 3.3 shows the V-I c h a r a c t e r i s t i c f o r a CdS:I sample at **1.7°K.
It i s s t i l l symmetric, but the t y p i c a l hot e l e c t r o n deviation from ohmic
behaviour i s apparent. The breakdown voltage corresponds to a f i e l d of
«*50 v/cm.
An expression f o r the skin depth i n a semiconductor has been given
by F r e i and S t r u t t (i960):
.6= So { ( i + f t ( 3 - i )
where ( i n cm)
L- J0' (3.2)
a n d r 3 W T 1 0 1 1 • ( 3 - 3 )
- 19 -

4-> C <u u u 3
o
100
80
60
40
20
0
-20
-40
-60
-80
-100
1 1 1 1 1 1 1 1 I Ji 1
1 / 1 1 1 1 1 1 I I I -1.2 -1.0 -0.8 -0.6 -0.4 -0.2 0 0.2 0.4 0.6 0.8 1.0 1.2
Applied Voltage ( v o l t s )
b
-p u u
-1.2 1.0 0.8 0.6 0.4 0.2 0 0.2 0.4 0.6 0.8 1.0 1.2
Applied voltage ( v o l t s )
Figure 3.1. V-I c h a r a c t e r i s t i c s at room temperature of CdS:I (a) and CdS(l0% Zn):I (b).
- 20
.1000
500 h
200 h
100 \-
Ix
1 2 5 10 20 50 100 200 Temperature °K
Figure 3.2. V a r i a t i o n of resistance with temperature. o CdS:I (Ford) • CdS:Br (Semielements)
-21 -

-22 -

Here d i s the conductivity in.n_ cm, co the angular frequency i n r a d / s e c ,
jx the permeability and £ the d i e l e c t r i c constant. Taking as t y p i c a l
values at 1. 7°K 6 « 0.02n-1cm-1, co « 2JC • 31-109 rad/sec., j i «j 1 and
£ w 10, we f i n d & Q*s2 mm, and ^~10 giving a h of about 1 cm. This i s i n
general large compared with the thickness of our samples.
Since the iodine-doped c r y s t a l s exhibited the narrowest l i n e s ,
these were selected f o r the s t r a i n experiments. C r y s t a l s chosen f o r
applying u n i a x i a l pressure II c-axis were plates p a r a l l e l to easy cleavage
planes. For applying the force 1 c-axis rectangular plates were cut and
ground from pyramidal faces. However, the geometry did not permit a
measurement of g under perpendicular pressure i n these samples.
-23 -

C H A P T E R 4
T H E O R Y O F T H E g - V A L U E
T h e s t a r t i n g p o i n t i s a n e x p r e s s i o n f o r t h e e l e c t r o n i c g - v a l u e a t
a b a n d e d g e a s g i v e n f o r i n s t a n c e b y L u d w i g a n d W o o d b u r y (1962):
g z z = 2 + 3 m I P (°tlPxl")HPylo+) (4.1)
a n d „ f
g x x = 2 -3m £ l_ {(°tlPy l n X n I P z M )
+ ( 0 | | P y | n ) ( n | p a | 0 t ) } (4,2).
H e r e 0 r e f e r s t o t h e b a n d f o r w h i c h t h e g - v a l u e i s c a l c u l a t e d , a n d t h e s u m
o v e r n e x c l u d e s t h i s b a n d . S p i n - " u p " a n d " d o w n " i n t h e z - d i r e c t i o n a r e
d e n o t e d b y • a n d I . m i s t h e m a s s o f a f r e e e l e c t r o n .
I n o u r d i s c u s s i o n we s h a l l b e m a k i n g r e f e r e n c e s t o t h e e f f e c t i v e
m a s s m * . S i n c e t h e c a l c u l a t i o n o f m * i s v e r y s i m i l a r t o t h a t o f t h e g - v a l u e ,
i t w i l l b e i n c l u d e d f o r c o m p a r i s o n . U s i n g iT-p" p e r t u r b a t i o n t h e o r y o n e c a n
d e r i v e a n e x p r e s s i o n f o r t h e e f f e c t i v e m a s s o f t h e b a n d E 0 a s g i v e n i n t h e
p a p e r b y L u d w i g a n d W o o d b u r y :
• in . 2 y (OflPx | n ) ( n | p x | 0 Q ( 4 3 )
L—J E n - E n x x 1 + m V E ° " E n
I n o r d e r t o a p p l y t h e s e f o r m u l a e t o t h e c o n d u c t i o n b a n d o f c a d m i u m
s u l f i d e o n e h a s t o k n o w t h e p o s i t i o n a n d s t r u c t u r e o f t h e n e a r b y b a n d s . T h e
e x t r e m a o f t h e c o n d u c t i o n a n d v a l e n c e b a n d s o f C d S a r e a t o r v e r y c l o s e t o
k . = 0, a n d t h e b a n d s t r u c t u r e a t t h i s p o i n t i s s h o w n i n f i g u r e 4.1. F o r
c o m p a r i s o n , t h a t o f g e r m a n i u m - t h e c o r r e s p o n d i n g i s o e l e c t r o n i c h o m o p o l a r
s e m i c o n d u c t o r - i s a l s o s h o w n .
-24 -

Figure 4.1. The bandstructure at lc = 0 i n CdS (Reynolds,Litton and Wheeler 1964) (a) and Ge (Cardona 1963a) (b). 17 and are i r r e d u c i b l e representations of the wurtzite double group. I15» I^' a n d I25f are i r r e d u c i b l e representations o f the f u l l cubic group ( s i n g l e group), and J i 5 c , l~±c
a n a " ^I5v a r e t n e
corresponding representations of the zincblende structure. F i g . 4.1.b also serves as an explanation of the notation used in. the equations (4.21), (4.22), (4.23) and (4.24).
- 2 5 -

The conduction band minimum i n CdS belongs to.the i r r e d u c i b l e
representation Fy of the wurtzite double group. There are three spin-
degenerate valence bands close together and belonging to f , J"y and [7*
r e s p e c t i v e l y . They are separated from the conduction band by a gap of
about 2.6 eV. According to Cardona (1963b) there i s a l s o a group of states
at 6.1 eV above the valence bands having the same transformation properties
as these.
Base-functions f o r the and [^representations have been given
by Birman (1959):
_ tig f + dz| + ^ f ( x + i y ) {
CS J + dzf + ^ f ( - x + i y ) f
(4.4)
\ (x - i y ) \
In these expressions x,y,z are p - o r b i t a l s and S an s;-function, c,d,f are
constants., and \ and \ are again the spinfunctions.
According to Hopfield (1961) the conduction band i s almost purely
s - l i k e , so f o r that band we s h a l l assume c = 1 and d. = f = 0. The .["^
valence-bands are dominantly p - l i k e . We s h a l l f i r s t take c = 0 f o r these
bands. A possible e f f e c t of a f i n i t e value f o r c w i l l be considered i n the
discussion. In the quasi cubic (qc) model of Hopfield (1960) the remaining
d's and f's may be r e l a t e d to the observed s p l i t t i n g s of the three valence
bands. The wurtzite structure i s regarded as a cubic c r y s t a l u n i a x i a l l y
stressed along.a ( l l l ) - d i r e c t i o n . For vanishing s p i n - o r b i t energy the valence
band of the cubic semiconductor ( i . e . S i , Ge, InSb,GaAs) consists of s i x
states. Their r o t a t i o n a l properties may be represented by the angular
- 26 -

m o m e n t u m J = | a n d J. = - i s t a t e s ( K i t t e l 1963):
3 2
3 2
3 2
3 2
1 2
1 2
' ! > = f f Cx-'dy).
| > = ( f { z ) - ( x + l y ) | }
(4.5)
T h e s p i n - o r b i t e n e r g y i s d i a g o n a l i n t h i s r e p r e s e n t a t i o n , b u t s p l i t s t h e
1 3
J - 2 a n & ^ = 2 S T ; a T ; e s b y a n a m o u n t 8. T h e H a m i l t o n i a n m a t r i x r e p r e s e n t i n g
t h i s s p l i t t i n g i s
H. s p i n - o r b i t
•0
0
0
0
0
0
0
0
0
0
0
0
0
0
0
0
0
0
0
0
0
0
8
o
(4.6)
T h e r o w s o f t h e m a t r i x c o r r e s p o n d s t o t h e s t a t e s i n t h e o r d e r t h e y a r e l i s t e d
a m o n g t h o s e o f e q . . . (4.5). 8 w o u l d b e t h e v a l e n c e b a n d s p l i t t i n g i n t h e
a b s e n c e o f a h e x a g o n a l c r y s t a l f i e l d , i . e . i f t h e c r y s t a l w e r e c u b i c .
- 27 -

Table 4 . 1 . The Salence Band States i n Wurtzite
.Energy Wavefunction
W = 0 k (x + iy)t
i (x - iy)t ![2
V=:El = :{v4s+2A)2-*3M
A 2 ( C 3 E l - 2)zf - (x + iy)») 1 * " A 2 = f 2 + ( 3 E l - 2 ) 2 } ^
o"
X 2 { ( 3 E l - 2)z:f + (x - iy)t} s
A 3 f / 3 ( E i * E 2 ) _ 2 ) z f _ ( x + } j . i * K J 1 Ao = {2 + ( 3fe+B 2) -2) }
5 A g { ( 3 ( E l ^ > - . 2 ) z f + ( x r i y ) t ]
w-^Ex . E 2 ) = - { £ i 4 - ( ( ^ ) 2 - ^ } A 3 f / 3 ( E i * E 2 ) _ 2 ) z f _ ( x + } j . i
* K J 1 Ao = {2 + ( 3fe+B 2) -2) } 5
A g { ( 3 ( E l ^ > - . 2 ) z f + ( x r i y ) t ]
A „ and A are normalizing constants.

A. u n i a x i a l stress i n the z - d i r e c t i o n w i l l leave the states xf
x | , y t and y I equivalent, but change the energy of the states z t and
z I an amount A with respect to these. A would be the'valence band
s p l i t t i n g f o r vanishing s p i n - o r b i t coupling. The s t r a i n Hamiltonian i n
t h i s representation i s then:
H s t r a i n
0
0
0
0
0
0
0
0
A
0
0
0
0
0
CO
0
0
0
0
0
Q
0
0
0
(4.7)
Here the order i s x j , y j , z l , . x t , y | , z t . Di'agonalization of
^spin o r b i t + ^ s t r a i n g i y e s the states and t h e i r energies r e l a t i v e to the
l e v e l . The r e s u l t s are presented i n table 4.1. We note that the
expressions f o r and E 2 are not changed i f we interchange A and - 8.
Therefore i f we solve f o r A and 5 i n terms of E^ and E 2 , we get two sets of
solutions:
6= E i + ^ E 2 * \ U(B 2 - E i ) 2 - 3Ei ( : . (4.8)
A= = ( E i + ^E 2) •+ \ | ( E 2 - E X ) 2 - 3 E i 2
The two sets of solutions correspond to what Pikus (,1961) has c a l l e d the
Hopfield model (upper sign, £>IZil) and Birman model (lower sign, S< IAI). On t h i s model we can compute the valence band contribution to the
g - s h i f t (deviation from the free electron value 2.0023) and the e f f e c t i v e
mass i n the bottom of the 8-like conduction band. . Using the base-functions
table 4.1 i n the formulae (4.1), (4.2) and (4.3) we f i n d
- 29 -

gH m l E g Eg+E! E g+E!+E 2 ) ^ '
and
§ 1 m I Eg+Ei V ^ yl E g+E!+E 2 V £ P
S i m i l a r l y the contribution to the e f f e c t i v e mass i s given by
(XV i + i l l ! ( 1 + 2 ^ + 2X 32 | ( 4 > 1 1 )
VmVll m L Eg Eg+E-^ E g+E 1+E 2 J
In these expressions the matrix element III i s that of the momentum operator
between the conduction and valence bands:
i i ' 2 =K (r7c) | W(r9
vj>|2 (4.i2)
The g - s h i f t i s caused by the spin o r b i t i n t e r a c t i o n . This i s not
immediately c l e a r from the equations(4.9) and (4.10). I t i s easier to see
i n the cubic case f o r which A vanishes. For the g-value and the e f f e c t i v e
mass we then f i n d
f l * * 1 ! ! 1 • t wfvh (4-i3)
and
= 1 + J i l l . J 3E g + 2$ ( 4 < 1 4 )
m" m 3 Eg(E g+£)
I f we eliminate the matrix element between these two expressions, we get
the so-called Roth-relation
g ~ 2 = _ 2S f 4 ± 5 )
in _ 1 3Eg+25" ^ ;
m*
Knowing m*, & and Eg one can obtain good estimates of the e l e c t r o n i c g-values
when Eg i s small, i . e . when one can neglect a l l other bands. - 30 -

EXPERIMENTAL RESULTS
The g-values of the sin g l e resonance l i n e s seen i n the c r y s t a l s
CdS:Br, CdS:I and CdS(lO% Zn):I were measured at «1.7°K as a function of
the angle i3* between the magnetic f i e l d and the c-axis, : (Slagsvold and
Schwerdtfeger 1965 ). A t y p i c a l trace i s shown f o r each sample i n f i g . 4.2.
Figure 4.3 shows the r e s u l t s and t h e i r f i t to
g 2 = g^ 2 s i n 2 $ + g 2 c o s 2 (4.16)
The parameters obtained from the f i t s , as well as the widths between
i n f l e c t i o n points and an estimate of the number of centres contributing to the
resonance, are given i n table 4.2. These estimates were obtained by
int e g r a t i n g the recorded de r i v a t i v e s and comparing the t o t a l i n t e n s i t y with 18 3 \
that from the s i l i c o n sample used as a g-marker (2-10 Patoms/cm- ).
Approximate values f o r the halfwidths are also given i n table 4.2. For
comparison the table contains r e s u l t s on c r y s t a l s doped with chlorine,
gallium ( i n an excess of copper) and values f o r the e l e c t r o n i c g-factor
deduced from exciton-spectra. The l i n e i n the bromine doped sample i s
notably wider than the others. However, a s i g n a l seen i n CdS:Br from Semi-
Elements Inc. (see table 3.1) has.an i n f l e c t i o n width «*10 gauss - roughly
the same as that of the CdS:I c r y s t a l s used.
DISCUSSION
The halogens (CI, Br and I) when introduced into cadmium s u l f i d e
give r i s e to l o c a l i z e d l e v e l s «»0.03 eV below the conduction band (Bube and
Thomsen 1955) thereby acting as donors. According to c a l c u l a t i o n s i n the
e f f e c t i v e mass approximation the donor binding energy i s (Kohn 1957):
E = 13.6 -* • ^9 eV (4.17)
- 31 -


a) CdS:Br b) CdS:I c ) CdS ( 1 0%Zn):I 1 . 8 0 1 — i — i — f — T — i — | — i — i — j — i — r ^ — [ — 1 1 | I I I I I I I r~
1 . 7 6 I i l I I I I I I I I 1 I I I J I 1 1 1 1 L_J 1 1 1 J 1 0 ° 3 0 ° 6 0 ° 9 0 ° 3 0 ° 6 0 ° 9 0 ° 3 0 ° 6 0 ° 9.0°
ft F i g u r e 4 . 3 . The g - v a l u e as a f u n c t i o n o f o r i e n t a t i o n . & i s t h e a n g l e between t h e c - a x i s and
t h e m a g n e t i c f i e l d .

Table 4.2. Results f o r the Conduction Band g-Tensor in CdS
C r y s t a l Width Between I n f l e c t i o n Points
(gauss)
True Half-Width (gauss)
Approximate Number of Spins
Conditions of Observation
CdS:Br 1.789+0.001 1. 771+0.001 « 3 4 « 5 0 « 3 - 1 0 1 7 cm - 3 1.7°K
CdS: I 1.785+0.001 1. 767+0.001 12 « 2 - 1 0 1 7 cm"3 1.7°K
CdS(10%Zn):I 1.796+0.001 1. 780+0.001 15 «20 « 2 - 1 0 1 6 cm"3 1.7°K
Si:P 1.99883 3 « 4.5 2-10 1 8 cm"3 1.7°K
CdS:Cl b 1.79 1. 78 5 8 « 1 0 1 7 4.2°K
CdS:(Ga>Cu) c 1.792 1. 775 10 77°K, 550 myu r a d i a t i o n
CdS d 1.78+0.05 1. 72±0.10 Excitonspectrum
a G. Feher (1959)
b Lambe -and Kikuchi (1958)
c Dieleman (1962)
d Hopfield and Thomas (1961)

Here K i s the s t a t i c d i e l e c t r i c constant of the semiconductor. For the case
of CdS m * « 0 . 2 m and >c»10 giving a value of «*28 meV ( m i l l i eV) f o r the
binding energy. The radius of the corresponding Bohr 'orbit i s
a B = 0.529 • -a< A (4.18)
For CdS t h i s radius i s « 2 6 A.
As the impurity concentration increases, these l o c a l i z e d states
s t a r t to overlap at some value cn- and form an impurity band. A further
increase i n the impurity concentration eventually leads to a merging of the
impurity and conduction bands. Miiller and Schneider (1963) estimate that
t h i s occurs at an impurity concentration of c , 2*10 cm ° i n CdS.
R e s i s t i v i t y measurements on our samples strongly i n d i c a t e that
the s i g n a l s we observe at low temperatures are due to electrons i n an
impurity band. In f a c t , the degeneracy temperature of the conduction band
as -given by
(4.19)
i s *»40 K f o r N «*10 L' cm - . Under these conditions the s i g n a l i s expected
to be l a r g e l y concentration independent(Bemski 1960). This appears to be
the case since the t o t a l s i g n a l i n t e n s i t y of CdS:Br and CdS:I are
p r a c t i c a l l y the same although the room temperature r e s i s t i v i t i e s of these
sampJ.es are about an order of magnitude d i f f e r e n t , i n d i c a t i n g considerably
different: dopings.
The donor wavefunctions are made up of Blochfunctions from the
bottom of the conduction band with a modulating envelope. We therefore
expect the g-value i n the impurity band to be very close to that of the•
conduction band. In our formulae we take f o r Er, the true gap minus
- 35 -

0.028 eV - a t y p i c a l shallow donor binding energy. The s p l i t t i n g s of the
valence bands i n CdS are = 0.016 eV and E 2 = 0.057 eV. Using these
values in the equations (4.8), we f i n d f o r the s p i n - o r b i t and c r y s t a l f i e l d
parameters:
s _ _ | 0.0596 eV ^ A 0.0294 eV ( 4 2 Q )
{ 0.0294 eV I - 0.0596 eV
I f we were to use 8 = 0.0294 eV and A= ± 0.0596 eV (the Birman model) the
valence bands would account f o r l e s s than a quarter of the observed g - s h i f t s
according to equation (4.9). Therefore i t seems reasonable at t h i s point to
choose the set 8 = 0.0596 eV, A= - 0.0294 eV (the Hopfield model).
According to observations by Sobolev (1964) i n CdS and CdSe the energies
f o r o p t i c a l t r a n s i t i o n s between the two upper valence bands and the
conduction band change d i f f e r e n t l y upon deformation. From t h i s Sandomirskii
(1964) also concludes that the Hopfield model i s preferable.
We f i n a l l y need the matrix element III as defined i n equation
(4.12). Since the bands above the conduction band-certainly do contribute
s i g n i f i c a n t l y at l e a s t to the e f f e c t i v e mass, we cannot eliminate III
between equations (4.9) and (4.11) as we did to derive the Roth-relation,
(equation (4.15)). Instead we s h a l l use a r e s u l t from a paper by
Cardona (1963a). He considered the e f f e c t of an anti-symmetric perturbation
on the bandstructure of a homopolar semiconductor l i k e germanium. The
o p t i c a l t r a n s i t i o n 125 1 17' (valence band to conduction band, fig u r e 4.1)
i s allowed while R'— f l 5 (between conduction bands) i s forbidden
< Y ( I ? 0 I 7 hK(E 5)>=.0 (4.21)
The "perturbed™ states of the polar semiconductor are (eq,.:. (3) of Cardona's
paper):
- 36 -

( Use) = a f ( ITs) - b f ( K s O (4-22>
( flsv) • = b/Vjr( fig)-* I^sO ;C4.23)
a and b are constants that may be expressed i n terms of the "unperturbed"
energies. The antisymmetric p o t e n t i a l i s assumed to have a n e g l i g i b l e
e f f e c t on . the ij/d ?•) state:
I ^ P cEc)*ij/( r 2o (4- 2 4>
Substitution of the wave-function f o r the polar material into equation (4.12)
then gives the r e s u l t :
I I I 2 = a 2 I I , , |2 (4.25) 1 1 homopolar 1 v '
•2 The quantity P as defined by Cardona i s
2 ,p2 = 2 |ihomopolarI (4.26)
m .
Cardona then obtains a good o v e r a l l agreement between predicted and
observed e f f e c t i v e masses and g-values f o r the wurtzite-type materials 9
using P = 21 eV. Substituting the band s p l i t t i n g s f o r Ge and CdS into
the expression f o r a (equation (4) i n Cardona's paper) we f i n d a2.= 0.75
and therefore f o r the t r a n s i t i o n to the valence bands: 2 1 1 1 2 .= 15.7 eV (4.27) m
The g - s h i f t s as computed from the equations (4.9) and (4.10) are
then 4 g ( | = - 0.10 and Ag x =-0.06. This therefore accounts f o r l e s s
than h a l f of the observed g - s h i f t , and i t predicts an anisotropy with
g(|< g^ i n contrast to what i s observed.
- 37 -

In the case of the e f f e c t i v e mass, we f i n d f o r the valence band
contribution A (jj ) = 6 which would give m* 0.14 m. The observed value i s
m*observed 0...20 m, and the agreement becomes quite good when the upper
conduction bands are included. Here the appropriate matrix element i s
l l / = (1 - a'2) H n o m o p o l a r P (4.28)
For m * p r e a i c t e d Cardona then finds *»0.18 m. He neglects the anisotropy
of these materials, and for the s p i n - o r b i t s p l i t t i n g he takes & - 0.068 eV,
a somewhat l a r g e r value than ours. The r e s u l t f o r g i s then 1.89 or
e s s e n t i a l l y the same as we calculated from the valence band terms only.
I f the discrepancy f o r the g-tensor i s due to the fac t that the
de t a i l e d structure of the upper conduction bands has not been taken properly
into account, one would expect a much better agreement f o r cadmium selenide,
which has a bandgap of only 1.84 eV. In table 4.3 we compare parameters f o r
CdS and CdSe of i n t e r e s t f o r the present discussion. The notation follows
that we have been using. E g c denotes the distance from the lower to the
upper conduction bands.
Table 4.3. Bandparameters for. CdS and CdSe.
c/a m * g„ gj_ S (eV) A ( e V ) Eg(eV) Eg c(eV)
CdS 1.623 0.20 a 1.785 1.767 0.0596 0.0294 2.58 a 3.52a
CdSe 1.63 0.13 a 0.6+0.l b 0.51+0.05b 0.44 c 0.04 c 1.84a 4.26 a
a Cardona (1963a)
c Sobolev (1964)'
Dimmock and Wheeler (1961)
We can estimate the r e l a t i v e importance of the valence and the
conduction bands in c a l c u l a t i n g bandparameters at the bottom of the conduction
- 38 -

band. The contribution to the inverse e f f e c t i v e mass from a group of states 2 II I 2
separated ...by an energy E,. .will be proportional to — — — where III i s the
relevant matrix element. S i m i l a r l y the contribution to the g - s h i f t w i l l be o | T 12
approximately proportional to — • . The r e l a t i v e importance of the
valence bands and conduction bands (c) i s then measured by 5 , 2 , • !§£ and 9 • • ^ 4 - ( 4 - 2 9 )
1 - a i Eg 1 - a l 6c E g 2
f o r the e f f e c t i v e mass and the g - s h i f t r e s p e c t i v e l y . JL- i s not known but Oc
should be of the order of unity. The values of the parameters defined i n the
expressions (4.29) are then 4 and 6 f o r CdS and 7 and 16 f o r CdSe. Cardona
now calc u l a t e s a correct e f f e c t i v e mass f o r CdSe, and f o r the g-value he
finds g p r e c i i . c t e d ~ °- 8 4- From the formulae (4.9) and (4.10) we calculate
Agjl ..= - 1.15 and A g ^ = i - 1.06. The anisotropy i s therefore again
i n c o r r e c t .
These r e s u l t s suggest that the quasi-cubic model i s not adequate
f o r a c a l c u l a t i o n of the g-tensor. Hopfield (1961) has estimated the order
of magnitude of the constants that we have so f a r neglected i n the
expressions (4.4). I f we allow a l l the constants to be d i f f e r e n t from zero,'
there w i l l be a d d i t i o n a l terms i n the equations (4.9), (4.10) and (4.11).
These are, however, d i f f i c u l t to estimate, and we therefore r e s t r i c t
ourselves to considering only a modification of the expressions as they are.
This w i l l . n o t a f f e c t the e f f e c t i v e mass which appears to be well accounted
fo r already.
Admixture of an s-part to the ["7 valence band functions reduces
the normalizing constants A 2 and A 3 . According to Hopfield (1961), the
- 39 -

value of c f o r these states should be at most of the order of g i v i n g
f o r the A ' s: 2 -\ 2 \ A g c
I~TA~ ( 4- 3°) Eg
For CdS =rf 0.01 i n d i c a t i n g that A 2 ' s about 1% lower than the values L g
calculated on the quasi-cubic model should be used i n the formulae (4.9) and
(4.10). In the case of CdSe =A- 5»0.02 i n d i c a t i n g about twice as large L g
admixtures i n CdSe.
We may attempt to estimate the amount of s-part admixture by
t r e a t i n g A 2 a r , d A 3 as adjustable parameters. In doing so, we s h a l l
neglect any possible contribution from the upper conduction bands (although
i t i s probably of the order of 1/5 of the t o t a l g - s h i f t f o r CdS). We use
the g-tensors as given i n table 4.3. That of CdSe has not been measured
by ESR techniques and has a rather large uncertainty. The admixtures are
of the expected order of magnitude, and the r e s u l t s are given i n table 4.4.
Table 4.4. Comparison of A' and from
s obtained from Quasi-cubic f i t .of the g-tensor.
Model
quasi-cubic from f i t /a
reduction A?
quasi-cubic Al
from f i t /a
reduction
CdS 0.292 0.289 1 0.208 0.200 4
CdSe 0.1875 0.1875 0 0.321 0.289 10
F i n a l l y we note that Thomas and Hopfield (1959) allowed an s-part
admixture of the order of 15% i n the valence band states of CdS to account
f o r the i n t e n s i t i e s of the e x c i t o n l i n e s .
Pedrotti and Reynolds (1962) have shown that i f the s u l f u r i n
CdS i s i n part replaced by selenium, the bandgap and the s p i n - o r b i t s p l i t t i n g
- 40 -

of the valence bands assume values intermediate between those of CdS and
CdSe. The same thing also occurs i n germanium-silicon a l l o y s (Levitas,
Wang and Alexander 1954). Since the e l e c t r o n i c g-value i s a c h a r a c t e r i s t
of the bandstructure, i t should also assume intermediate values when two
substances are alloyed. Miiller and Schneider (1963) found g = 1.843 i n a
ZnS (50%) - CdS (50%) powder sample. This i s about midway between the
value g«1.888 f o r ZnS and that of CdS. The a l l o y 'we have used contains
considerably l e s s Zn (10%), so the change from grj^s ^ s rather small.
According.to Miiller and Schneider, the g'-anisotropy i n wurtzite (hexagonal
ZnS) i s 0.0073 (g- > g± as i n CdS). This i s consistent with the fac t
that our alloyed sample exhibits a s l i g h t l y smaller anisotropy than the
CdS-samples (0.0160 versus 0.0180, although the errors almost overlap).
I t thus seems possible to adjust the g-value over wide ranges by a l l o y i n g
i n these c r y s t a l s .
To conclude the discussion of the g-tensor i n CdS we f i n d that
a generalization of the expression (4.13) f o r a cubic germanium-like
semiconductor within the framework of the quasi-cubic model does not
predict a l l of the observed g - s h i f t . More serious i s the f a c t that i t
gives an anisotropy of the wrong sign f o r both CdS and CdSe. We are
therefore l e d to consider corrections to the quasi^cubic model. Although
i t i s hard to take these unambiguously into account, we f i n d that i t i s
possible to f i t the observed g-tensors to our formulae by allowing small
s-part admixtures to the valence band states. We therefore expect that
a better knowledge of the valence bands and the conduction band i s
needed to obtain a c l o s e r agreement between theory and experiment f o r
the g-tensor i n CdS and CdSe.
- 41 -

THE LINEWIDTH
The hyperfine structure due to the magnetic moments of the donor
n u c l e i disappears i n the impurity band region (Fefter 1959). It i s therefore
not s u r p r i s i n g that we do not see any structure i n our l i n e s . However, a
few considerations along these l i n e s seem to be i n order. The pertinent
data of impurities so f a r used - nuclear abundancies, spins and magnetic
moments of CI, Br, I and Ga - are given i n table 4.5.
Table 4.5. Spins and Magnetic Moments of Donor N u c l e i 3
Natural Magnetic moment Nucleus Abundancy Spin i n nuclear Bohr magnetons 35 75.4%
3 35 CI 75.4% 0. ,82 17 i.
37 CI 24.6% 3 o
0. ,68 17 £
79 Br 50.52% 3 o 2. ,10
35 L
81 Br 49.48% 3 o
2. ,26 35 Z
127 I 100% 5 o 2. ,79
53 i.
69 Ga 60.5% 3 o 2, ,00
31 L
71 Ga 39.5% 3 o 2. .55
31
Varian Associates NMR table, f i f t h e d i t i o n 1965
- 42 -

0n basis of t h i s table, chlorine doped samples would be expected
to show the narrowest l i n e which i s indeed the case. The other l i n e s should
then be about three times wider, a c t u a l l y t h i s f a c t o r i s 2 - 2.5. Since we
have been using rather high modulation amplitudes and also because of our
trouble with unsymmetric l i n e s , our l i n e shapes are not as r e l i a b l e as one
would wish. However, inte g r a t i o n of a few l i n e s indicates that the r a t i o
-Mk i s about 1.5. The l i n e of Lambe and Kikuchi (1958) f or the AH i n f l e c t i o n
chlorine doped sample exhibited a value of about 1.6 f o r t h i s r a t i o , while i t
is•1.73 i n the case of complete motional narrowing. Thus the single l i n e s •
in CdS may be the r e s u l t of incomplete narrowing. In the case of the bromine
doped sample from Ford (Chapter 4) i t appears that we are seeing a broadening
with concentration s i m i l a r to that o f Si:P f o r Np>2-10 1 8 cm - 3 (Feher 1959) or
InSb f o r N>2-10 1 4 cm - 3 (Bemski 1960).
- 43 -

CHAPTER 5
THE STRAIN-DEPENDENCE OF THE g-VALUE
We found i n Chapter 4 that the r e l a t i o n between the g-tensor of
the conduction band and the bandstructure of CdS i s not too well understood,
and we cannot.therefore expect to be able to explain a possible s t r a i n
dependence i n much d e t a i l . The theory as presented should however serve as
a u s e f u l guideline i n i n t e r p r e t i n g the r e s u l t s , and one may hope to gain
further information on the bandstructure by measuring the g - s h i f t s under
strain.;
In the present experiment there are no degeneracies to be
removed, so that the only e f f e c t of a s t r a i n w i l l be to cause small changes
i n the energy separations. Using a l i n e a r approximation we then write f o r
the bandgap:
•%••= Eg' + ^gP ( 5 - 1 )
Here p i s the pressure and the constant <pg can be rela t e d to the usual
deformation p o t e n t i a l constants (Bardeen and Schockley 1950). Then the
strain-dependent parts of the g-tensor w i l l contain terms proportional to
. This reduces the importance of the upper conduction band r e l a t i v e
to that of the valence bands by another f a c t o r 1.4 bringing the relevant / a2 E 3
r a t i o of matrix elements and energy gaps to « 8.5 ( =•,-= 2 , see v -L - a Eg J
expressions (4.29|. Also, since such small changes i n the X's were
necessary to account f o r the g-tensor, we s h a l l i n the following make the
si m p l i f y i n g assumption that the-valence bands do i n f a c t give the dominant
contribution to the g-value. We then expect the g-value's dependence upon
the energy gap Eg to be f a i r l y well described by the equations (4.9) and
(4.10).
- 44 -

A. u n i a x i a l stress i n the c - d i r e c t i o n preserves the symmetry
such that we -may represent i t s e f f e c t on the valence band structure by a
change i n the c r y s t a l l i n e f i e l d parameter A , and we write similarly, to
eq,. (5.1)
A = A°+gO vp (5.2)
From the theory of Pikus (1961) one can show that a pressure which changes
the symmetry may also be represented i n t h i s way with ^>vp having the same
strain-dependence. One can next c a l c u l a t e the changes i n A 2
2 , E 2 ,
A 3 2 , and keeping only terms l i n e a r i n cp vp, substitute the new values i n t o
the equations f o r the g - s h i f t . The c o e f f i c i e n t s of the d i f f e r e n t terms are
generally large (compared to those of $>gp) but cancel to within 5%. Also
changes i n the s-parts discussed i n Chapter 4 would contribute terms of
t h i s order of magnitude and possibly cause a more complete c a n c e l l a t i o n .
As a r e s u l t we are not able to cal c u l a t e the c o e f f i c i e n t of 5? v p with any
confidence. For t h i s reason and since the r e s u l t s can be f a i r l y w e ll
accounted f o r by cpgp, we s h a l l neglect ) vp.
We then c a l c u l a t e the g - s h i f t s under s t r a i n by substituting;Eg
from eq..;. (5.1) into the equations (4.9) and (4.10). Keeping only l i n e a r
terms we f i n d
2 I I I 2 f 1 2X.22 2 X 3 2 ,K „ x Ag.|| - - I T - i E g ^ - C E g ^ ! ) 2 - ( E g ^ E 2 ) 2 ) ^ P ( 5 - 3 )
and
A g l m 1 (Eg+Ei) 2 V S > ( E g + E 1 - f E 2 ) 2 V $ Vjf
Numerically there i s again a large c a n c e l l a t i o n - to within 1%, but the e f f e c t
of <pg should be taken f a i r l y w e ll into account i n the r e s u l t
A g „ = 0.119 <pgp ; A g r - 0 - 1 2 5 <pgp (5.5)
- 45 -

In deformation p o t e n t i a l theory (Bardeen and Schockley 1950) the
energies at the band extrema are expanded in.the s t r a i n s , £. . For the
conduction band and the valence band of the wurtzite structure we use
the forms derived by Pikus (1961):
E c = E c ° + D l £ | | + D 2 £ x (5.6)
E V = E v° + (c1+c3)e,| + (c2+c 4)e 1 ( s . v )
& || = zz s ^ l f ^ x x + £ yy
Here T)j, D 2, C 1 ? C 2, C 3, C 4 are deformation p o t e n t i a l constants. Our cpg
can be expressed i n terms of these:
cpg = (D 1-C 1-C 3) 111 ..+ (D 2-C 2-C 4) _£l (5.8)
Furthermore, using the e l a s t i c compliance constants, - the s t r a i n s can be
rela t e d to the pressures. For the configurations of i n t e r e s t we have:
Hydrostatic pressure:
$0 gH- = ( 2 S13 + S 3 3 ) ( D 1 - C 1 - C 3 ) + 2 ( S 1 1 + S 1 2 + S 1 3 ) ( D 2 - C 2 - C 4 ) (5.9)
U n i a x i a l force II c-axis:
fg\\ .= S 3 3 (Dx-Cx-Cg).* 2 S 1 3 (D 2-C 2-C 4) (5.10)
Uniaxial, force _L c-axis:
Cpgj_ = S13v(D1-C1-C3) + ( S 1 1 + S 1 2 ) ( D 2 - C 2 - C 4 ) (5.11) This forms the basis f o r the i n t e r p r e t a t i o n of the r e s u l t s . EXPERIMENTAL RESULTS
The s h i f t s of the resonance l i n e under s t r a i n were measured
r e l a t i v e to the n.m.r. s i g n a l of a glycerine proton sample f i x e d to the
pol e t i p s of the magnet. Interpolation between proton marker signals on
ei t h e r side of the ESR s i g n a l gave the centreposition. A recorder trace
- 46 -

- 47 -

i s shown i n figure 5.1. The linewidth l i m i t s the accuracy with which g-values
can be measured. In our case the protonsignals were strongly overmodulated,
the modulation amplitude being up to « 9 gauss. We therefore expect the
accuracy of a single measurement to be ~ ^ of the width between i n f l e c t i o n
points of the ESR l i n e , corresponding to a g «.+ 2-10 - 4. This, however,
i s on the assumption of a stable f i e l d and a uniform sweeprate. D i f f i c u l t i e s
with an unstable f i e l d were encountered i n some of the l a t e r runs
(perpendicular pressures).
The observed s h i f t s turned out to be very small. To improve the
accuracy several runs were therefore made at each value of the applied force
and the r e s u l t s averaged. Forces up to «*2.5 kg were-assumed to be applied
to the c r y s t a l . It was found that a rather c a r e f u l adjustment of the
squeezing jaws was necessary f o r a p p l i c a t i o n of small forces to the
c r y s t a l . Results on c r y s t a l s of somewhat d i f f e r e n t cross-sections are
however c o n s i s t e n t b u t some i r r e g u l a r i t i e s due to uncertainty in.the
applied tension are expected.
The observed s h i f t s i n g|| f o r forces p a r a l l e l to the c-axis are
shown i n figure 5.2. The g-value at zero s t r a i n i s normalized to that
given i n table 4.2 f o r CdS:I. E r r o r bars are given f o r points averaged
over at l e a s t three single runs. They represent the s t a t i s t i c a l e r r o r i n
the mean as defined by M
6 mean £(§i-g) ( 5 1 2 ) N(N-i) l 5 - - U J
In f i g u r e 5.3 i s shown how g^ changes under p a r a l l e l and
perpendicular forces. Again the zero-strain; g-values are normalized to
that of table 4.2. Results f o r two He-runs on the same sample are given
f o r p a r a l l e l forces. The points with error bars are here averaged over at
l e a s t 4 runs at the same applied force.
- 48 -

1.7860
1.7850
400 600 800 1000
Pressure (kg/cm 2)
Figure 5.21 The change i n g-jp with u n i a x i a l pressure p a r a l l e l to the c-axis. Each point represents several runs through the l i n e . ( C r y s t a l C).
]
- 49 -

'1. 1.7670
64
62 200 400 600 800
pressure (kg/cm 2)
1000 1200
Figure 5.3. The .change i n g^ with u n i a x i a l pressure p a r a l l e l and perpendicular to the c-axis. Each.point represents several runs through the l i n e .
- 50 -

400 800 1200 1600 2000
Pressure ( k g/cm 2)
Figure 5.4. The change i n g^ with u n i a x i a l pressure perpendicular to the c-axis. Each point represents a single run through the l i n e . ( C r y s t a l A).
- 51 -

Table 5.1. Observed g - s h i f t s Under Strain
Average
C r y s t a l Dimensions tnirt AreaJL
Applied Force Force D i r e c t i o n F i e l d D i r e c t i o n g - s h i f t cm2/kg
B 0, .19: x.113.x 0.53 0.215 II II + ( 7 - 10.2)-10- 7
C 0. .26 x 1.19 x 0.54 0.31 II H + 10.6-10" 7
C II 1 + 8.2-10"7
A 0, .21 x 0.92 x 0.85 0.19 1 1 - 4.3-10-7
D 0. .25 x 1.02 x 0.80 0.25 1 1 - 4.5-10"7

The e f f e c t of the averaging can be seen by comparing these graphs
with that of f i g u r e 5.4 where the r e s u l t s of single measurements are plotted,
the applied force being changed between each run (the.:force being
s l i g h t l y increasedjeach'time). In f i g u r e 5.4 the average deviation from the
s t r a i g h t l i n e i s Ag + 1 0 - 4 , a value reduced by at l e a s t a f a c t o r of two
by the s t a t i s t i c a l approach. F i n a l l y the experimental r e s u l t s are summarized
in table 5.1. A, B, C and D were d i f f e r e n t samples used.
DISCUSSION
Again, we s h a l l assume the states In the impurity band to behave
e s s e n t i a l l y l i k e those at the bottom of the conduction band. .
Since our theory at t h i s point i s rather q u a l i t a t i v e we s h a l l
average over A g j j and A g ^ i n the case of p a r a l l e l forces. We then get 2
A g 2i0.12avp from eq. . (5.5) and ^ + 9.4 • l O " 7 f o r the 7 6 dp,, K g
cm •> i_
experimental value. For transverse forces we take « - 4.4 jjg"" » . The
e l a s t i c compliance constants are given by B e r l i n c o u r t , J a f f e and S'hiozawa
(1963). Their temperature v a r i a t i o n s are too small to be of s i g n i f i c a n c e
to the present discussion. The values are: S ; Q = 2.04, S33 •= 1.58,
S 1 2 = - 1.03 and S 1 3 = - 0.52, a l l times 10 - 1 1 and i n the u n i t s m2/N.
Equations (5.10) and (5.11) become 8.0 = 1.58 (D T - C I - CS) - 1.05 (D2-C2-C4) (5.13) -3.7 =.-0.52 (Di-Ci-Cs) + 1.01 (D2-C2-C4) (5.14)
From these we f i n d
Di-Cn-Cg + 4.0 eV/ unit s t r a i n . (5.15)
The value of ^ i s not too well determined, and t h i s makes i t d i f f i c u l t dp ±
to f i n d a r e l i a b l e value f o r D2-C2-C4. This i s because the l e f t hand sides
- 53 -
tend to cancel when eliminating D^-C^-Cg. In f a c t , the so l u t i o n f o r
D 2 - C 2 - C 4 of the above equations i s negative, which seems unreasonable. We
s h a l l instead use a r e s u l t due to Langer (1960). He measured cf>gj{ (see
eqv. (5.9)) o p t i c a l l y at 77°K, and one would not expect a s i g n i f i c a n t change
i n going from 77°K to 1:He temperatures. Langer's r e s u l t was <jPgH
s+4.9-10 eVm 2/N. Equation (5.9) then becomes:
+ 5.0 = 0.52 ( D i - C x - C s ) + 0.98 (D 2-C 2-C 4) (5.16)
From equations (5.13) and (5.16) we f i n d
Dn-C-i-Co «*6.3 eV/unit s t r a i n (5.17)
D 2 - C 2 - C 4 «*1.8 eV/unit s t r a i n
Using these values and equation (5.11) we predict «j?g^as - l . S ' l O - 1 ^ - eVm 2 /N
which corresponds then to ^ « - l . S ^ l O - 7 cm2/kg. This i s d e f i n i t e l y d p j _
l e s s than what i s observed, but i t does give the r i g h t sign and order of
magnitude.
One would expect the deformation p o t e n t i a l constants of CdS to
be s i m i l a r to those of CdTe (cubic) and CdSe i(hexagonal). Thomas (1961)
has measured D^-C^-Cg =+4.5 eV/unit s t r a i n f o r CdTe. The CdSe parameters
have been measured o p t i c a l l y by Grynberg (1964). This paper contains a
number of mistakes in the c a l c u l a t i o n s , but from h i s data we f i n d
D-i-C-i-Co « + 3.5 eV/unit s t r a i n 1 (5.18)
D 2 - C 2 - C 4 1.6 eV/unit s t r a i n
Our numerical r e s u l t s therefore seem quite reasonable, and we conclude that
the strain-dependence of the g-tensor can i n a consistent way be ascribed
to a change i n the gap between the valence bands and the conduction band.
This then i s further evidence that the valence bands give the main contribu
t i o n to the g-value's deviation from 2, although t h i s i s not f u l l y - 54 -

demonstrated i n the previous c a l c u l a t i o n of the g-tensor based on the quasi
cubic model.
In the c a l c u l a t i o n ofthedeformation p o t e n t i a l s an average of the
slopes f o r p a r a l l e l pressures was used. However since these were measured
on the same c r y s t a l under i d e n t i c a l conditions, i t i s c e r t a i n that — | i i — dp
i s about 25% l a r g e r than ^ 1 f o r p II c-axis. I t was also intended to
measure the changes i n g^ under perpendicular forces, but several attempts
were unsuccessful as the c r y s t a l s broke. We would however expect f o r
p 1 c-axis to be s i m i l a r to ^ x . To explain these differences one would
presumably need a r e l i a b l e dependence upon (pvp as defined i n equation (5.2).
- 55 -

CHAPTER 6
THE RESONANCE IN A CURRENT-CARRYING•SAMPLE
Attempts were made to observe the spin resonance s i g n a l as a .DC
current was being passed through.the sample. From such an experiment one
may learn something about the structure of the band-edge.
A modified TE-LQ4 rectangular cavity ( f i g u r e 6.1) i n which
Figure 6.1 ..Cavity used with a current-carrying sample.
the lowest three quarter wavelength,had a smaller cross-section.than the rest
of. the cavity, was made from WR.28 waveguide. Its Q-value was only s l i g h t l y
l e s s than that of the ordinary TE-^Q^ rectangular c a v i t i e s giving.almost the
same signal, to noise r a t i o as these with the same sample. This reduced the
f i l l i n g f a c t o r and the requirement on the lengths of needle-shaped.samples
p a r a l l e l to the c-axis. A 2.4 mm.long CdS:I sample of a f a i r l y uniform
cross-section (0.3 mm x 0.4 mm) over a length corresponding to the height of
the cavity, but narrowing towards the ends, placed the contacts well out of
the cavity. The DC magnetic f i e l d was also applied II c-axis. A \ mil t h i c k
sheet of mylar acted as a DC i n s u l a t o r between the sample and the guide.
At. 1.7°K a s i g n a l to noise r a t i o of 10:1 was obtained.at the best.
With the magnetic f i e l d adjusted to the centre of the l i n e , a voltage was
applied to the c r y s t a l . A small, change in the centre-position.of the l i n e
would then move the recorder pen out towards one of the peaks of the

d e r i v a t i v e t r a c e . W i t h a p o o r s i g n a l t o n o i s e r a t i o a n d a n i l l - d e f i n e d
e l e c t r i c f i e l d i n t h e s a m p l e , n o l i n e - s h i f t w a s o b s e r v e d . T h e o c c u r r e n c e o f
b r e a k d o w n d i d h o w e v e r a f f e c t t h e m i c r o w a v e c o n d u c t i v i t y c o n s i d e r a b l y , b u t n o
s t u d y w a s m a d e o f t h i s e f f e c t .
W i t h t h e p r e s e n t l y a v a i l a b l e c r y s t a l s a n d e q u i p m e n t i t . s h o u l d b e
p o s s i b l e t o i m p r o v e t h e e x p e r i m e n t a l c o n d i t i o n t o s e e w h a t e f f e c t a DC
e l e c t r i c f i e l d h a s o n t h e g - v a l u e , t h e l i n e w i d t h a n d t h e s i g n a l ; i n t e n s i t y .
T h e m o d i f i e d . c a v i t y , h a s p r o v e n t o b e a u s e f u l i d e a i n o v e r c o m i n g t h e
d i f f i c u l t y o f m a k i n g l o n g t h i n s a m p l e s a n d a l l e v i a t i n g t h e i r e x c e s s i v e
l o a d i n g o f t h e c a v i t y .
- 57, -

THE TEMPERATURE DEPENDENCE
I n t h e p r o c e s s o f p e r f o r m i n g t h e s t r a i n - m e a s u r e m e n t s i t was
no t e d t h a t t h e r e was a s m a l l change i n t h e g - v a l u e i n c o o l i n g f r o m 42°K
t o * 1.7°K:
jj| « - 2.5-10" 4 /°K ( 6 . 1 )
T h i s v a l u e was about t h e same f o r b o t h components o f t h e g - t e n s o r . We
may a t t e m p t t o r e l a t e t h i s a l s o t o a change i n t h e bandgap. U s i n g
e q u a t i o n s ; ;.(5.1) and (5. 5 ) we f i n d :
dEg 2-10" 3 e V / ° K ( 6 . 2 ) dT
K l i c k (1953) has measured
^ = - 4 . 1 - 1 ( T 4 e V / B K (4°K < T <77°K) ( 6 . 3 )
The t e m p e r a t u r e s h i f t o f t h e g - v a l u e i s t h e r e f o r e an o r d e r o f magnitude
t o o l a r g e t o be e x p l a i n e d i n t e r m s o f a change i n t h e bandgap. W i t h a
t e m p e r a t u r e c o n t r o l l e d dewar now under c o n s t r u c t i o n i n o u r l a b o r a t o r y i t
w i l l become p o s s i b l e t o i n v e s t i g a t e t h i s e f f e c t a t t e m p e r a t u r e s above
4.2°K.
THE SPIN-SPLITTING FOR FINITE IT.
H o p f i e l d (1961) has shown t h a t t h e energy n e a r t h e c o n d u c t i o n band
minimum i n CdS may be w r i t t e n
E ( k ) . = (A k 2 + B k 2 ) I + C ^ S y - ky fl^) ( 6 . 4 )
A,.B and C a r e c o n s t a n t s ; O'x and <5y a r e t h e P a u l i m a t r i c e s w h i l e I i s
t h e t w o - d i m e n s i o n a l u n i t m a t r i x . The t e r m l i n e a r i n k" has t h e e f f e c t o f
s p l i t t i n g t h e s p i n s t a t e s f o r f i n i t e kj. F o r a g i v e n microwave f r e q u e n c y
t h e e x t e r n a l f i e l d a t r e s o n a n c e w i l l be \2
H . h v 1 ( 2 C k x r , s
- 58 -

(assuming |2Ckj_l « hv). It was pointed out by Hopfield that C i s so
small ( i t s e f f e c t cannot be seen i n o p t i c a l experiments) that the only
experiments where i t could possibly be detected,would be ESR experiments
on conduction electrons. Since there would be a d i s t r i b u t i o n of kj_ -values
the e f f e c t of a f i n i t e C would be a broadening of the l i n e as well as a
l i n e - s h i f t . From equation (6.5) we note that both these e f f e c t s increase
with decreasing microwave frequency. The average value of ICkj_ I could be
measured by measuring the resonance f i e l d at two d i f f e r e n t frequencies.
Estimates ind i c a t e that at 31 G c / s and a Fermi temperature of 15°K the
l i n e width from t h i s e f f e c t would be of the order of 400 gauss when
assuming Hopfield's upper estimate 6-10 - 1 1 eVcm f o r C. The g - s h i f t would
be « + 0.02. I f we assume a value f o r C about 3.times smaller we would
expect linewidths of the order of 40 gauss and g - s h i f t s *»+ 0.002. It i s
not c l e a r i n what manner the Cvterm i n the energy w i l l be r e f l e c t e d i n the
impurity band, but from table 4.2 we see that i n going from CdS:I to
CdS:Br there i s an extra l i n e broadening of about 30 gauss as well as a
g - s h i f t «a + 0.004. This could possibly be caused by the C-term when
electrons are f i l l e d up to higher k-values. Two experiments are planned
to t e s t t h i s . The g-value and linewidth of a CdS:I sample a t X-Band
( «10 G c / s ) w i l l be compared with those at Ka-band ( « 31 G c / s " ) . Also the
g-tensors of our two d i f f e r e n t CdS:Br samples w i l l be compared. As
already mentioned i n Chapter 4, the linewidth increases with increasing
doping. This could possibly be caused by occupation of states with
l a r g e r k.
- 59 -

CHAPTER 7
CONCLUSIONS
An 8 mm microwave spectrometer employing s t r a i g h t c r y s t a l detec
t i o n and 400 c/s f i e l d modulation has been assembled and shown to have a
s u f f i c i e n t s e n s i t i v i t y to allow detection of various ESR signals i n semi
conductors such as s i l i c o n and cadmium s u l f i d e . In p a r t i c u l a r good s i g n a l
to noise r a t i o s were obtained at He temperatures from halogen-doped single
c r y s t a l s of CdS with room temperature c a r r i e r concentrations around 1 7 — 3
10 cm . This i s i n a range where impurity/band e f f e c t s are important,
and i t i s believed that the single ESR l i n e s i n CdS:I, CdS:Br and 1
CdS(lO%Zn);I are due to electrons i n impurity bands about 0.03 eV below
the bottom of the conduction band. The widths of these l i n e s were about
2.5 times l a r g e r than that of a l i n e i n CdS:Cl reported e a r l i e r . We
note that t h i s i s somewhat l e s s than the r a t i o s of the nuclear magnetic
moments of the donor n u c l e i , these being ^^"yjurji ~ 2 - 8 and A* ILIQ « 3,4.
Also, experiments on CdS:Br with d i f f e r e n t dopings show that the linewidth
increases with increasing impurity concentrations.
The g-values i n CdS:I and CdS:Br d i f f e r e d by only 0.004. In
both samples the u n i a x i a l l y symmetric g-tensor exhibited a small
anisotropy with g-(| -g^ = 0.018. CdS(l0%Zn):I had a s l i g h t l y higher
g-value and smaller anisotropy providing further evidence that a l l o y i n g with
zinc produces a bandstructure intermediate between that of CdS and ZnS.
The knowledge of the bandstructure of CdS was found to be
i n s u f f i c i e n t l y accurate to allow an unambiguous explanation of the g-tensor.
/However, only small corrections to the quasi-cubic model were shown to give
good agreement with experiment f o r CdSe as well as f o r CdS by taking only
- 60 -

the valence bands into account. This i n t e r p r e t a t i o n i s further supported by
the r e s u l t s of measurements of the g - s h i f t s under u n i a x i a l pressure. Their
main features could be consistently explained i n terms of a change i n the
bandgap. By neglecting small e f f e c t s that are possibly due to changes in
the valence band structure, the changes i n the bandgap under hydrostatic
pressure and u n i a x i a l pressures p a r a l l e l and perpendicular to the c-axis
could be reasonably well described by the two deformation p o t e n t i a l
constants D1 -C2-C3 «* 6.3 e V / u n i t s t r a i n and D 2 - C 2-C 4«1.8 e V / u n i t s t r a i n .
Suggestions, f o r further experiments arose out of the present
i n v e s t i g a t i o n . A g - s h i f t from 1.7°K to 4.2°K appears to be too large to
allow an explanation i n terms of a change with temperature of the bandgap
and i s not understood. Preliminary experiments indicated that i t would be
possible to observe the e f f e c t on the ESR l i n e under a DC heating of the
c a r r i e r s with the a v a i l a b l e equipment and c r y s t a l s . Also suggested were
experiments that could give a value f o r the slope of E(k) at k.= 0.
- 61 -

BIBLIOGRAPHY
Bardeen, J. and Schockley, W. 1950. Phys. Rev. 80, 72.
Benedek, G.B. and Kushida, T. 1960. 118, 46. Phys.Rev.
Bemski, G. 1960. Phys. Rev. Le t t e r s 4, 62.
Berlincourt, D; J a f f e , H. and Shiozawa, L.R. 1963. 129, 1009. Phys. Rev.
Birman, J.L. 1959. Phys. Rev. 114, 1490.
Bube, R.H. and Thomsen, S.M. 1955. J. Chemical Physics 23_, 15.
Cardona, M. 1963a. J. Phys. Chem. Solids 24, 1543.
Cardona, M. 1963b. Phys. Rev. 129, 1068.
Dieleman, J. 1962. Proc. 11th Colloque Ampere, Eindhoven (North-Holl. Publ. Comp. Amsterdam, 1963) p. 412.
?
Dimmock, J.0. and Wheeler, R.G. 1961. J. Appl. Phys. 32 Suppl. 2271.
Feher, G. 1957. B e l l . System Tech. J. 36, 449.
Feher, G. 1959. Phys. Rev. 114, 1219.
Feher, G., Wilson, D.K. and Gere,- E. 1959. Phys. Rev. Let t e r s 3_, 25.
F r e i , A.H. and St r u t t , M.J.0. 1960. Proc. I.R.E. 48, 1272.
Ginzton, E.L. 1957. Microwave Measurements (McGraw-Hill Book Company, Inc.)
Gordon, J.P. 1961. Rev. S c i . Instr. 32, 658. Grynberg, M. 1964. Proc. 7th Internat. Conf. on Semiconductor Physics.
Paris 1964. (Academic Press, New York) p. 135
Holmes, P.J. 1962. The Electrochemistry of Semiconductors (Academic Press, London) p. 374.
Hopfield, J . J . 1960. J. Phys. Chem. So l i d s , 15, 97.
Hopfield, J.J. 1961. J. Appl. Phys. 32, Suppl. 2277.
Hopfield, J.J. and Thomas, D.G. 1961. Phys. Rev. 122, 35.
K i t t e l , C. 1963. Quantum Theory of Solids (John Wiley & Sons, New York) p. 279.
K l i c k , C C . 1953. Phys. Rev. 89, 274.
Kohn, W. 1957. So l i d State Physics, ed. by F. Seitz andD. Turnbull, Vol. 5 (Academic Press, New York).
- 62 -

Langer, D. 1960. Proc. Internat. Conf. on Semiconductor. Physics. Prague 1960. (Academic Press, New York) p. 1042.
Lambe, J. and Kikuchi, C. 1958. J. Phys. Chem. Solids 9, 492.
Levi t a s , A., Wang, C.C. and Alexander, B.H. 1954. Phys. Rev. 95_, 846.
Low, W. 1960. Paramagnetic Resonance i n Solids Suppl. 2. S o l i d State Physics, ed. by F. Seitz and D. Turnbull (Academic Press, Inc., New York) p. 184.
Ludwig, G.W. and Woodbury, H.H. 1962. S o l i d State Physics, ed. by F. Seitz and D. Turnbull, Vol. 13 (Academic Press, New York) p. 223.
Miiller, K.A. and Schneider, J. 1963. Physics L e t t e r s 4, 288.
Pedrot t i , F.L. and Reynolds, D.C. 1962. Phys. Rev. 127, 1584. See also C. C. K l i c k and J.H. Schulman <Solid State Physics, ed. by F. Seitz and D. Turnbull, V ol. 5, (Academic Press, New York, second p r i n t i n g 1962) p. 148.
Pikus, G . E . 1961. Soviet Phys. J.E.T.P. 14, 898 and 1075.
Roth, L.M. 1960. Phys. Rev. 118, 1534.
Reynolds, D.C., L i t t o n , C.W. and'Wheeler, R . G . 1964. Proc. 7th Internat. Conf. on Semiconductor Physics. Paris 1964. (Academic Press, New York) p. 739.
Sandomirskii, V.B. 1964. F i z . Tverdogo Tela, 6, 324.
Slagsvold, B.J. and Schwerdtfeger, C.F. 1965. Can. J. Phys. 43, 2092.
Sobolev, V.V. 1964. Soviet- Phys. S o l i d State 6, 697.
Syed, A.S. 1962. Can. J. Phys. 40, 286.
Thomas, D . G . 1961. J. Appl. Phys. 32, Suppl. 2298.
Thomas, D . G . and Hopfield, J . J . 1959. 116, 573. fiy.tev.
Wilson, D.K. 1964. Phys. Rev. 134, A265.
- 63 -