esprinet group
TRANSCRIPT

Esprinet Group
Annual Report 2014
Parent Company: Esprinet S.p.A. VAT Number: IT 02999990969 Monza e Brianza Companies’ Register and Tax Number: 05091320159 Repository of financial and administrative information (R.E.A.) number: 1158694 Registered Office and Administrative HQ: Via Energy Park, 20 - 20871 Vimercate (MB) Subscribed and paid-in share capital as at 31/12/2014: Euro 7,860,651
www.esprinet.com - [email protected]
Esprinet 2014 Directors’ Report on Operations
2
GENERAL CONTENTS * Directors' Report on Operations
Consolidated results overview page 4
1 Letter from the Chairman
2 Summary of the Group's economic and financial results
3 Share performance (year 2014)
Call of Shareholders' Meeting abstract page 9
Corporate Governance page 11
1 Company Officers
2 Waiver of the obligations to provide information on extraordinary transactions
3 Corporate Governance
Activities and structure of the Esprinet Group page 12
1 Description of the activities
2 Group structure
Organi SocialiStructure and target market trends page 15
B2B distribution of IT and consumer electronics
Group and Esprinet S.p.A. economic and financial results page 20
1 Income trend
2 Operating net working capital
3 Net financial position
4 Sales by product family and customer type
Significant events occurred during the period page 29
Subsequent events page 30
Outlook page 30
Human Resources page 31
Health, safety and environment page 35
Main risks and uncertainties facing the Group and Esprinet S.p.A. page 37
Other important information page 45
1 Research and development activities
2 Number and value of own shares
3 Relationships with related parties
4 Business combinations
5 Disposed or disposal groups
6 Relationships with subsidiaries subject to management and coordination activities
7 Shares of the parent company Esprinet S.p.A. held by board members, statutory auditors and key managers
8 Atypical and/or unusual operations
9 Additional information required by Bank of Italy and Consob
10 Share incentive plans
11 Net equity and result reconciliation between Group and parent company
12 Other information
Proposal of approval of the Financial Statements and allocation of the 2014 profits page 54
* Consolidated financial statements1
page 55
Schemes of the Esprinet Group consolidated financial statements
Notes to the consolidated financial statementsDeclaration pursuant to Art.81-ter Consob Regulation
* ESPRINET S.p.A. financial statements1 (Separate financial statements
2) page 131
Schemes of the Esprinet S.p.A. financial statements
Notes to the Esprinet S.p.A. financial statementsDeclaration pursuant to Art.81-ter Consob Regulation
Board of Statutory Auditors' Report
Indipendent Auditors' Reports
1 Each booklet has a separate table of contents to facilitate the reader
2 Esprinet S.p.A. separate financial statements, as defined by international accounting principles IFRSs
Esprinet 2014 Directors’ Report on Operations
3
Directors’ Report on Operations
2014
Esprinet 2014 Directors’ Report on Operations
4
Consolidated results overview
1. Letter from the Chairman
To our Shareholders, The Esprinet Group closed the fiscal year 2014 with a net profit of 26.8 million euro, up by about 16% compared to the 23.1 million euro of 2013 while revenues grew by more than + 14% attaining just under 2.3 billion euro, an increase in absolute value of almost 290 million euro. All other economic and financial indicators are largely positive and show a strong improvement compared to the previous year. Even during the financial year just ended our Group has firmly maintained its long-term market leadership in Italy, while the activities in Spain showed strong signs of improvement allowing us to consolidate the 3rd place in the ranking of local distributors.
The market
The distribution sector of technology generally presents growth rates correlated with the overall trend of the economy, the rate of product innovation, the average price of products sold, discontinuities such as, for example, the launch of new versions of the operating system Windows and the relative weight of the "channel" with respect to the distribution of "direct". 2014 was still a difficult year on the macroeconomic front, especially in Italy, even though 2015 seems to have opened with a really positive trend. According to forecasts of the International Monetary Fund (source: WEO-World Economic Outlook, January 2015), the euro area should in fact experience in 2015 an increase of 1.2% compared to 2014. In this context, the growth forecast for Italian GDP oscillates between + 0.2% (source: OECD) and + 2.5% (CSC-Centro Studi Confindustria) with consensus figures around 0.4-0.6%. Spain's economy is expected to grow at higher rates (+ 2.7% according to the International Monetary Fund, + 1.7% for the OECD and the EU Commission). The factors that are driving the recovery in Europe in general, and more specifically in Italy and Spain, countries in which our Group is active, are many, but certainly the reduction in oil prices, the weakness of the euro and expansive monetary policies by the ECB represent the most significant elements. The delays in the adoption of the structural reforms of Italy and the high level of public debt are the key factors explaining the negative Italian macroeconomic trend in 2014 and probably in 2015, being the latter anyhow the year for which the experts expect the end of the current recession after about three years, The Spanish macroeconomic backdrop, although still burdened by a high level of unemployment, was improving in 2014 and appears well matching for 2015 for the timely implementation of structural reforms, most notably that of the labour market, to improve the competitiveness of the country, despite some political risk linked to the next election. As for product innovation we highlight the fact that 2014 was the year of revival for notebooks, a technology now considered mature. The industry experienced a number of new product launches with new "form-factors", touch screens, solid state drives and in general an overall improvement of the user experience that was not perceived in years. Consumer electronics product too were rich with innovation and that provided the fuel for growth, whilst the future launch of increasingly sophisticated smartwatches could be a new step in the gradual colonization by the digital technologies we distribute of markets historically preserve of manufacturers and distributors of "analog" technologies. Aside from these innovations, we had a further positive effect represented by particularly robust sales of PC-Desktop Professional related to the end-of-life of Microsoft Windows XP. This event forced many large and medium-sized enterprises to renew its fleet of old machines in order to keep their IT clients continuously upgradable and above all safe compared to the many and growing threats posed by piracy. The average prices of the product began to stabilize, even for the progressive weakening of the euro in the last months of 2014. Still the main driver of growth was mostly found in the changes in the so-called "go-to-market" of manufacturers. During 2014 we experienced a further shift of the percentage of total sales of technology through distributors: this process was fuelled both by the growth in mobile phone sales, once mainly

Esprinet 2014 Directors’ Report on Operations
5
conveyed by the manufacturers through Telcos, as well as from the willingness of many manufacturers of keeping a more variable cost structure by means of outsourcing of certain sales and marketing processes. Overall, the target market in which our Group is active grew at a European level about +8% compared to 2013 (source: Global Tech Distribution Council - Context, January 2015) with a trend in the fourth quarter of 2014 of +9% . Spain was the market that showed the highest growth rate, with a growth of + 24% in 2014, and Italy has ended with a remarkable +12%, ranking in the third place among the top nations in terms of volume growth. This trend was further confirmed in the fourth quarter of 2014 which saw the Spanish market to grow by + 30% and the Italian one by + 13%. Looking at the typology of customers, we experienced a trend in Italy of reduction of the weight of retail chains in favour of the specialists of telephony, while in Spain we had a remarkable good performance of large professional corporate resellers.
Activities in Italy
In 2014, the Italian Group companies have been engaged on multiple fronts. Ordinary activities focused on the exploitation of opportunities arising from the gradual recovery in the economic activity. Having resisted, in the midst of the crisis, the idea of reducing employment levels and the quality of our asset, even at the loss of certain additional revenue opportunities, allowed us to capture the first signs of recovery in a very satisfactory manner. Many of the major vendors have identified Esprinet as the distributor equipped with the technological skills, organizational, human and financial means to develop commercial plans aimed at recovering those portions of the market lost during the crisis. Investment in staff training and continuous development of information systems have allowed us to further improve the level of service offered to customers. In addition, a variety of projects is now in the pipeline in order to further improve the speed of response to the needs of customers and suppliers and raise standards of quality and cost effectiveness. We kept on providing training activities and enhancement of our human resources, thus guaranteeing stability in the relationship with our partners. A lot of efforts were put, eventually, in refocusing the group on its "core business" of technology distribution. In February we divested the total stake in Monclick, a company selling technology products "on-line", reflecting the strong desire of our group to stand by our customers only as partners and not as a perceived competitor. In July 2014, we sold Comprel, an historical distributor of electronic components, to an Italian company that we believe can develop at best the wealth of expertise and goodwill built in over thirty years. I take this opportunity to reiterate my thanks for the excellent work done over the years, and to express my best wishes for their new professional future to all the employees of Comprel. In the face of divestitures were made direct investments to develop specific know-how in the production and distribution of accessories for smartphones through the acquisition of a 60% stake in Celly SpA. We believe that this acquisition will enable us over time to further strengthen our presence in a segment with high growth potential, leveraging on the investments in the smartphone market segment put in place over the years by means of a network of national sales people, distribution agreements of great potential and prestige and specific procedures for the management of smartphone logistics.
The business in Spain
In the course of 2014 the Spanish economy has consolidated the progress already achieved towards the end of 2013. The measures implemented by the Spanish Government on the labour market and the stabilization of the banking system have produced measurable effects on the climate of general confidence of individuals and businesses reverberating in measurable signs of economic recovery. Taking advantage of this favourable trend, we worked to align the organizational structure of Esprinet Iberica to the standards of excellence achieved by the Italian operation. Therefore, in the first part of the year the company was divisionalized by means of the creation of n. 3 "market area": one focused on IT-clients and datacentre products, one acting as a specialist on accessories and consumables, and one focused on consumer electronics devices. In the spring of 2014 our Country Manager Matteo Restelli retired and left the group. The previous sales director of Esprinet Iberica was appointed Country Manager in its place. To Matteo Restelli goes my heartfelt thanks for his valuable contribution to our Group over many years of collaboration, as well as the best wishes for his future.
Esprinet 2014 Directors’ Report on Operations
6
The focus along the above mentioned strategic guidelines enabled the Spanish company to seize many of the opportunities offered by the recovery in the economic activity, and the good financial results obtained are a clear consequence of such good activity.
The new initiatives The Group faces 2015, which apparently began in the best way, with a cohesive and determined management team. The divisional structure has allowed us to work in an organic and effective way in defence of the positions already occupied both in Italy and in Spain in the IT-Client market segment, as well as in the development of the consumer electronics and "datacenter" devices. To this end, we are planning to invest in new warehousing space as well as in the search for talent with expertise and skills in the new areas of expansion. Many of the management efforts will be targeted to capitalize on the opportunities arising from the exploitation of the know-how and products of Celly in order to expand the volume of high margin products marketed by our Group. We plan to open a subsidiary in Portugal in the first half of the year as well as launching a cash and carry in Madrid, a first experiment in Iberian territory linked to this sales format. In 2014 we obtained a mid-term loan of 130.0 by a pool of leading Italian and international banks in order to support the many initiatives of the Group's development. Today the Group therefore has a balanced financial and capital structure, which is characterized by a level of stability and elasticity adequate with respect to growth initiatives, including acquisitions, which we are planning.
Conclusions For the first time in years, we enter the new fiscal year driven by the hope that the economic environment could be a source of new opportunities and not of further threats. Having passed the most acute moment of the crisis without suffering in a particular way in terms of economic and financial fundamentals, we are confident that we can continue our path of value creation for all our stakeholders and especially for our shareholders. As now customary every year, I wish, eventually, to thank all the people who every day with dedication, honesty and intelligence contribute to the success of our Group, and I personally wish them a 2015 of further professional as well as personal achievements. Thank you for investing in our Company.
Francesco Monti
Chairman of the Board of Directors

Esprinet 2014 Directors’ Report on Operations
7
2. Summary of the Group’s economic and financial results
The 2014 economic and financial results and those of the relative periods of comparison have been drawn up according to International Financial Reporting Standards (‘IFRS’) endorsed by the European Union and in force during the period. In the table, in combination with IFRS defined measures, some ‘alternative performance measures’, not defined from IFRS, are presented. These ‘alternative performance measures’, consistently presented in previous reports and not intended as substitute of IFRS defined measures, are internally used by the management for measuring and controlling the Group’s profitability, performance, asset structure and financial position. As required by CESR (Committee of European Securities Regulators) recommendation n. CESR/05-178b, basis of calculation adopted are defined below the table.
(1) EBITDA is equal to the operating income (EBIT) gross of amortisation and depreciation and accruals for risks and charges.
(2) Different amounts from those published in the interim management statement as at 31 December 2013 due to reclassification, recurred even in the
comparative figures, of the profit and loss values into ‘Income/loss from disposal Group’ item. (3)
Different amounts from those published in previous reports due to the changes, recurred even in 2013 reports, referred to IAS 19. (4)
Sum of consolidated net profit before minority interests and amortisation and depreciation. (5)
Sum of current assets, non-current assets held for sale and current liabilities, gross of short-term net financial position. (6)
Sum of trade receivables, inventory and trade payables. (7)
Non-current assets net of non-current financial assets. (8)
Equal to the sum of the net working capital plus fixed assets net of non-current liabilities except of financial liabilities. (9)
Equal to net equity less goodwill and intangible assets. (10)
Sum of borrowings and short term financial liabilities net of cash and cash equivalents, assets/liabilities for financial derivatives and financial receivables.
(11) Average of the balance at period beginning and end of companies consolidated.
% var.
14/13
Profit & Loss
Sales 2,291,141 100.0% 2,002,964 (2) 100.0% 14% 1,931,900 100.0%
Gross profit 141,836 6.2% 121,665 (2) 6.1% 17% 131,676 6.8%
EBITDA (1) 45,139 2.0% 37,673 (2) 1.9% 20% 39,895 2.1%
Operating income (EBIT) 41,086 1.8% 34,278 (2) 1.7% 20% 36,564 1.9%
Profit before income tax 39,100 1.7% 32,370 (2) 1.6% 21% 33,799 (3) 1.7%
Net income 26,813 1.2% 23,095 1.2% 16% 23,718 (3) 1.2%
Financial data
Cash flow (4) 30,080 25,840 (2) 26,727 (3)
Gross investments 3,593 2,998 6,904
Net w orking capital (5) 58,627 34,364 93,242
Operating net w orking capital (6) 77,431 49,457 102,939
Fixed assets (7) 98,058 96,753 97,237
Net capital employed (8) 144,588 118,174 178,775
Net equity 274,872 259,826 239,875
Tangible net equity (9) 198,605 185,840 165,728
Net f inancial debt (10) (130,284) (141,652) (61,100) 000
Main indicators
Net f inancial debt / Net equity (0.5) (0.5) (0.3)
Net f inancial debt / Tangible net equity (0.7) (0.8) (0.4)
EBIT / Finance costs - net 20.7 18.0 (2) 13.2 (3)
EBITDA / Finance costs - net 22.7 19.8 (2) 14.4 (3)
Net f inancial debt/ EBITDA (3.0) (3.8) (2) (1.5)
Operational data
N. of employees at end-period 969 975 971
Avarage number of employees (11) 972 973 966
Earnings per share (euro)
- From continuing operations - basic 0.51 0.42 21% 0.46 (3)
- Basic 0.53 0.45 (2) 18% 0.46 (3)
- From continuing operations - diluted 0.50 0.41 22% -
- Diluted 0.52 0.44 (2) 18% -
(euro/000) no tes % no tes % 2012 %no tes20132014

Esprinet 2014 Directors’ Report on Operations
8
3. Share performance (year 2014)
Esprinet S.p.A. ordinary shares (ticker: PRT IM) have been listed in the STAR segment of the MTA market of Borsa Italiana S.p.A., the Italian Stock Exchange, since 27 July 2001. The graph below illustrates the share performance from January 2 till December 31 2014:
As at 31 December 2014, the official closing price of the Esprinet share was 5.73 euro, increasing by 8.8% compared to its quotation at the beginning of the year (5.265 euro). Compared with a placement price of 1.4 euro per share in July 2001, taking into account the 1:10 share split-up effected during 2005 and without considering the reinvestment of the dividends paid out in shares, growth was 309%. The average quotation in 2014 was 6.9569 euro; the maximum official price reached during the year was 8.765 euro, recorded on June 9 2014. During the year, a dividend of 0.089 euro per share was distributed, a 1.3% dividend yield when compared with the average quotation of the year. An average volume of 141,229 shares per day was traded during 2014, increasing by 51% than the average volumes daily traded
1 in 2013 (92,933). Volumes reached an all-time high (883,072 shares traded) in the
session held on February 14 2014. Average volumes daily traded were 321,979 shares in the same month. On March 11 2015 the Esprinet share price was 8.435 euro, a 44% increase since the beginning of the year (5.87 euro). Average daily trading up to the same day was 132,712 shares per day.
1 Unweighted average of Esprinet shares volumes traded according to a Bloomberg Finance L.P. time series. Source: Banca IMI

Esprinet 2014 Directors’ Report on Operations
9
Call of Shareholders’ Meeting
ESPRINET S.p.A. Headquarter in Vimercate (MB), Via Energy Park n. 20
Share capital € 7,860,651.00, fully paid-up Listed on the Register of Companies of Monza and Brianza at number 05091320159
Tax code 05091320159 - VAT number 02999990969 – Economic Administrative Index MB-1158694 Website: www.esprinet.com
Notice of Ordinary and Extraordinary Meeting of Shareholders
The Ordinary and Extraordinary Meeting will be held at the Cosmo Hotel, Via Torri Bianche n. 4, Vimercate (MB), at 10:00 a.m. on April 28th 2015 (first call), and if necessary a second meeting will be called at 10:30 a.m. on April 30th 2015, to discuss the following
Agenda Ordinary session
1. Financial statements of Esprinet S.p.A. as at December 31st 2014:
1.1. Approval of 2014 Financial Statement; Directors' Report on Operations, Statutory Auditors’
Report, Independent Auditors’ Report, presentation of the Consolidated Financial Statement of
Esprinet Group as at December 31st 2014.
1.2. Allocation of income of the year.
2. Appointment of the Board of Directors for 2015/2017 years.
2.1 Establishment of the number of members to be appointed
2.2 Appointment of Directors
2.3 Appointment of the Chairman
2.4 Determination of Directors' fees
3. Appointment of the Board of Auditors for 2015/2017 years.
3.1 Appointment of members
3.2 Appointment of the Chairman
3.3 Determination of Auditors’ fees
4. Report on Remuneration. Resolutions on the first section of the Report on Remuneration under
article 123-ter of the legislative decree 58/1998.
5. Proposal for authorisation of a 18-months buy-back plan for the maximum number of shares legally
allowed: correlated repeal of the authorisation for the plan, or the unused portion of it, resolved
during the Shareholders’ Meeting of April 30th 2014.
6. Proposal for approval, in relation to remuneration policies and in accordance with article 114-bis of
legislative decree 58/1998, of a ‘Long Term Incentive Plan’ for the members of the of the company's
Board of Directors and other executives for the three years period 2015/2016/2017. The object of the
plan is the free allocation of ordinary shares in the Company (“Performance Stock Grants”) to
beneficiaries designated by the Board of Directors, up to a maximum of 1,150,000 shares in the
Company.

Esprinet 2014 Directors’ Report on Operations
10
Extraordinary session
1. Proposal for amendment of articles no. 9, 10, 16, 17 of the Company By-Laws.
For information about the share capital, on the right to request an amendment to the list of the items on the Agenda or to present new resolutions proposals, on the right to attend, and vote (also by proxy), on the right to make questions before the Meeting and on procedures and deadlines for the presentation of the lists for the appointment of the Board of Directors and of the Statutory Auditors, please check the complete notice published on the internet site www.esprinet.com, Investor Relations section, Corporate Documentation – 2015 Shareholders Meeting. DOCUMENTATION Documentation relating to the Meeting will be available to the public by the legal deadline, in the ways stipulated by law. The shareholders and anyone with voting rights may obtain a copy of the documentation which will be available from the company's head office, on the Company's website www.esprinet.com, Investor Relations section, Corporate Documentation – 2015 Shareholders Meeting, and on the website www.1info.it. Those authorised to attend and vote are invited to arrive at least one hour before the start of the Meeting, in order to facilitate the registration process.

Esprinet 2014 Directors’ Report on Operations
11
Corporate Governance
1. Company Officers
Board of Directors:
(Mandate expiring with approval of accounts for the year ending 31 December 2014)
Chairman Francesco Monti (SC)
Deputy Chairman Maurizio Rota (SC)
Chief Executive Officer Alessandro Cattani (SC)
Director Giuseppe Calì (SC)
Director Stefania Calì (SC)
Director Valerio Casari
Director Andrea Cavaliere (InD) (CRC) (RAC)
Director Mario Massari (InD) (CRC) (RAC)
Director Marco Monti
Director Umberto Giovanni Quilici (InD)
Director Chiara Mauri (InD) (CRC)
Director Cristina Galbusera (InD) (RAC)
Secretary Paolo Fubini Studio Fubini Jorio Cavalli
Notes (InD)= Independent director (CRC) = Control and Risks Committee (RAC) = Remuneration and Appointments Committee (SC)= Strategy Committee
Board of Statutory Auditor:
(Mandate expiring with approval of accounts for the year ending 31 December 2014)
Chairman Giorgio Razzoli
Permanent Auditor Emanuele Calcaterra
Permanent Auditor Mario Conti
Alternate Auditor Silvia Santini
Alternate Auditor Maurizio Rusconi
Independent Auditors:
(Mandate expiring with approval of accounts for the year ending 31 December 2018)
Reconta Ernst & Young S.p.A.
2. Waiver of the obligations to provide information on extraordinary transactions
Pursuant to article 70, section 8, and article 71, section 1-bis, of the Issuers’ Regulations issued by Consob, on 21 December 2012 the Board of Directors of Esprinet S.p.A. resolved to make use of the right to waive the obligations to publish the information documents stipulated for significant transactions relating to mergers, demergers, increases in capital by the contribution of goods in kind, acquisitions and transfers.

Esprinet 2014 Directors’ Report on Operations
12
3. Corporate governance
Esprinet S.p.A. adheres to and complies with the Corporate Governance Code for Italian Listed Companies (the Code), adapting it with the Group’s characteristics. During 2014 the Company confirmed to the recommendations of the new Code. Pursuant to Article 70(8) and Article 71(1-bis) of the Issuer Regulations published by CONSOB, the Board of Directors of Esprinet S.p.A. decided, on 21 December 2012, to exercise its right not to comply with the obligation to publish the information documents prescribed in the case of significant mergers, demergers, capital increases through the contribution of assets in kind, acquisitions and transfers. In compliance with the disclosure requirements provided for by industry legislation, a ‘Corporate Governance Report and ownership structure’ is drafted every year with a general description of the corporate governance system adopted by the Group, as well as information regarding its ownership structure, its organisational model adopted as per Legislative Decree No. 231 of 2001 and its degree of compliance to the Corporate Governance Code for Italian Listed Companies. It also includes the main governance practices used and features of the risk management and internal auditing systems regarding the financial reporting process. The ‘Report on Corporate Governance and ownership structure’ is available under Investor Relations – Corporate Documents – 2015 Shareholder Meeting on the Company website (www.esprinet.com). The Corporate Governance Code for Italian Listed Companies can be consulted on the Borsa Italiana S.p.A. site at www.borsaItaliana.it.
Activities and structure of the Esprinet Group
1. Description of the activities Esprinet S.p.A. (hereafter ’Esprinet’ or the ’parent company’) and its subsidiaries (the ‘Esprinet Group’ or the ‘Group’) operate in Italy and Spain. In Italy and in Spain, the Group operates solely in the ‘business-to-business’ (B2B) distribution of Information Technology (IT) and consumer electronics. In the Italian market, the distribution of IT products (hardware, software, value-added services) and consumer electronics constitutes the Group’s primary business. Besides the more traditional IT products (desktop PCs, notebooks, printers, copiers, servers, standard software etc.) and to their ‘consumables’ (cartridges, tapes, toners, magnetic supports), the Group also distributes tablet, mobile devices (smartphones) and their accessories, networking products (modems, routers, switches), state-of-the-art digital and entertainment products such as TVS, photo cameras, video cameras, videogames, handhelds and MP3/MP4 readers. The ‘Sales Analysis’ section provides a more detailed description of the main product categories marketed. Up to 28 February 2014 the Subgroup Italy operated also in the ‘business-to-consumer’ industry (B2C) of IT and consumer electronics through the company Monclick S.r.l. and, up to 23 July 2014 in the ‘business-to-business’ (B2B) distribution of microelectronic components through the company Comprel S.r.l.. At the same date, the Subgroup Spain is made up solely of Esprinet Iberica S.L.U.
‘Business-to-business’ (B2B) distribution of IT and consumer electronics
The Esprinet Group distributes branded IT products (hardware and software), mobile devices and, by its subsidiary Celly S.p.A., in the wholesale distribution of accessories for mobile devices, pitching itself at a customer base made up of resellers that in turn target both consumer and business users. Its markets in geographical terms are Italy and Spain. The range marketed by the Group consists of over 600 brands and services supplied by approx. 200 primary standing technology manufacturers (vendors), including all the world’s leading technology manufacturers (HP, Samsung, Apple, Asus, Acer, Microsoft, Dell, Epson, Xerox, Toshiba, Sony, IBM and Lenovo to name just a few). The Group has also been distributing, both in Italy and in Spain, house-branded products commissioned by third parties; these brands are Nilox, for entertainment sport products and PCs accessories, and Celly for mobile devices accessories.

Esprinet 2014 Directors’ Report on Operations
13
Customers, made up of the various types of IT resellers present in the Italian and Spanish markets, range from value-added resellers (VAR) to system integrators/corporate resellers, from dealers to shops (independent and/or affiliated stores), from major general and/or specialist retailers to sub-distributors. Total customers in 2014 were approx. 37,000, approx. 26,000 of which in Italy and approx. 11,000 in Spain. In recent years, Esprinet has also increased its presence in the office automation area by going on to defend other special customer segments (such as the suppliers and wholesalers of office items and/or supplies, as well as office automation specialists) in a more decisive fashion. Logistics activities are carried out at the three main logistics centres at Cambiago (MI), Cavenago (MB) and Zaragoza (Spain), all leased premises, totalling approx. 78,000 sqm (approx. 56,000 sqm in Italy and 22,000 sqm in Spain). ‘Business-to-consumer’ (B2C) distribution of IT and consumer electronics
The Esprinet Group was active in the sale to private consumers on the on-line IT and consumer electronics market through the fully owned subsidiary company Monclick S.r.l. (www.monclick.it), sold on February 28 2014. Monclick operated both as a ‘pure’ e-tailer, i.e. with products sold exclusively through the Internet channel and delivered to the customer's domicile address by-passing sale points and/or physical collection, and as an operator present in other segments falling under the ‘promotional’ category. The products marketed were essentially included in the following categories: personal computing, printers, audio-video, accessories, photography, telephony, air-conditioning, small and large electric household appliances. ‘Business-to-business’ (B2B) distribution of microelectronic components
The Esprinet Group has been one of the major operators in Italy in the distribution and marketing sector of electronic components for industrial applications through Comprel S.r.l., its fully owned subsidiary sold on July 23 2014. The products marketed by this company referred essentially to the following families: semiconductors (so-called ‘active’ devices), passive components, connections, displays and sub-systems. The business activity consisted in purchasing micro-electronic components such as micro-processors, memories or connecting devices, in addition to display sub-systems and single board computer products from manufacturers operating worldwide, and reselling to companies directly involved in the design and production of electronic equipment (so-called ‘Original Equipment Manufacturers-OEMs’) or to operators that are typically only assigned production activities (so-called ‘Contract Electronic Manufacturers-CEMs’).
2. Group Structure
The next chart illustrates the structure of the Esprinet Group as at 31 December 2014:
9.5%
100% 60% 100%
100% 100% 25%
100%
Celly S.p.A.V-Valley S.r.l. Esprinet Iberica S.L.U.
Esprinet S.p.A. Assocloud S.r.l.
Celly Pacific Limited
Celly Nordic OYCelly Swiss S.a.g.l. Ascendeo S.a.s.

Esprinet 2014 Directors’ Report on Operations
14
In legal terms the parent company, Esprinet S.p.A., was formed in September 2000 following the merger of the two leading distributors operating in Italy: Comprel S.p.A. and Celomax S.p.A.. The Esprinet Group later assumed its current composition as a result of the carve-out from the parent company of micro-electronic components and ‘high-value’ products distribution activities, the acquisitions and mergers through incorporation and disposals of companies made between 2005 and 2014. References to Subgroups Italy and Spain can be found in next comments and tables. As at 31 December 2014, the ‘Subgroup Italy’, made of companies subject to Italian law, includes, besides the parent company Esprinet S.p.A., V-Valley S.r.l. and Celly S.p.A. (acquired on 12 May 2014), all directly controlled companies, in addition to the associated company Assocloud S.r.l.. The latter, even if jointly controlled, is considered as an ‘investment in associate’ due to Esprinet’s significant influence as per the statutory agreements. The acquisition perimeter includes Celly S.p.A., company operating in the ‘business-to-business’ (B2B) distribution of Information Technology (IT) and consumer electronics and specifically in the wholesale distribution of accessories for mobile devices, as well as its wholly-owned subsidiaries: - Celly Nordic OY, a Finnish-law company; - Celly Swiss SAGL, a Helvetic-law company; - Celly Pacific LTD, a Chinese-law company, completely owned by Celly Swiss SAGL; all of which are operating in the same segment as the Holding Company, as well as Celly’s 25% share in Ascendeo SAS, a French-law company. Esprinet S.p.A. has its registered and administrative offices in Italy in Vimercate (Monza e Brianza), while warehouses and logistics centres are located in Cambiago (Milan) and Cavenago (Monza e Brianza). Esprinet uses Banca IMI S.p.A. as its specialist firm.
Subgroup Italy
Celly S.p.A. and its foreign subsidiaries
Established in 1998, Celly S.p.A is headquartered in Italy and is specialized in the design, production and distribution of mobile devices accessories. The Company has always been focussing on the development of concepts such as ‘Italian identity’ and ‘quality’ for its Celly branded products. On 12 May 2014 Esprinet S.p.A. bought a 60% stake in the share capital of Celly S.p.A.. This deal was executed through a purchase of shares from former shareholders as well as company’s own shares and, ultimately, the subscription of a share capital increase. Celly S.p.A., directly or indirectly, wholly owns the companies Celly Nordic OY, Celly Swiss SAGL and Celly Pacific LTD Celly S.p.A., all established at the end of the year 2013, operating in its same segment and in fact active during 2014 apart Celly Swiss SAGL that is still non-operating. V-Valley S.r.l.
Established in June 2010 as Master Team S.r.l. and named V-Valley S.r.l. in September, the company is headquartered in Vimercate (MB), and is 100%-owned by Esprinet S.p.A.. In this company, in fact active since December 2010, the distribution of ‘high-value’ products and solutions (high-end servers, networking and storage, virtualization, security software, bar-code scanning, mainly) has been concentrated.
Subgroup Spain
Esprinet Iberica S.L.U.
Originally established by the Group as the non-operating company governed by Spanish law to aid in the Spanish acquisitions effected between the end of 2005 and the end of 2006, due to the mergers through incorporations made in 2007, Esprinet Iberica is now the sole legal entity operating in Spain. Esprinet Iberica’s offices and warehouses are in Zaragoza, only approx. 300 km from all the main cities in Spain (Madrid, Barcelona, Bilbao and Valencia) which total over 80% of Spain’s IT consumption.
Esprinet 2014 Directors’ Report on Operations
15
Associated companies
Assocloud S.r.l.
On 16 January 2012 Assocloud S.r.l. was established. It is jointly controlled by Esprinet S.p.A and other eleven shareholders, but classified as an ‘investment in associate’ due to the significant influence exerted by Esprinet in accordance with the articles of association. On 2 April 2014 the shareholding in the associated company Assocloud grew from 8.33% to 9.52%. This company is aimed to give the Group the opportunity to enter the virtual service or storage supply and the ‘cloud computing’ business, consisting of the management and development of IT infrastructure and applications for data recording, filing and processing. Ascendeo S.A.S.
The Group also owns, by its subsidiary Celly S.p.A., a 25% stake in the capital of the French company Ascendeo S.A.S..
Structure and target market trends
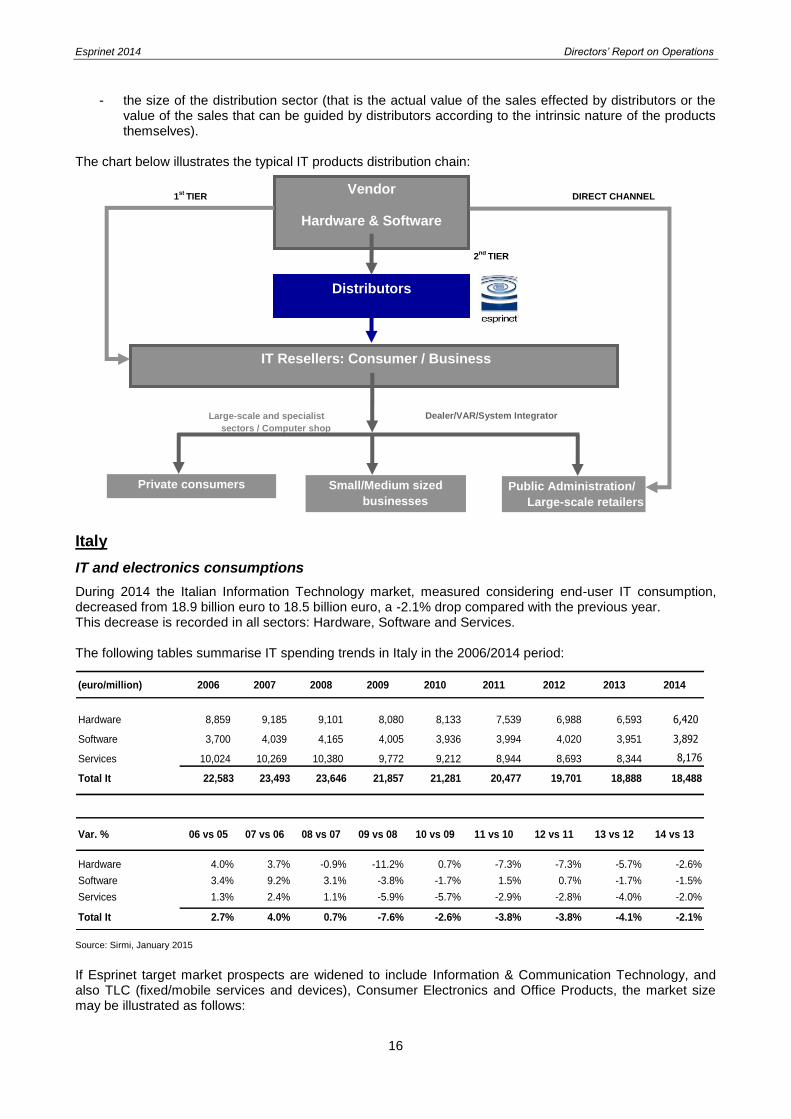
B2B distribution of IT and consumer electronics
The IT distribution chain
Generally speaking, IT and electronic products are distributed in two different ways: direct (‘Tier 1’) and indirect (‘Tier 2’). The former enables the suppliers to reach their technology end-users directly, while the latter makes use firstly of an intermediary figure or distributor and, secondly, of ‘resellers’. Very briefly the subjects making up the distribution chain are: - ‘vendors’: technology and/or IT products manufacturers who operate under their own brand; - ‘distributors’: operators supplying logistics services, storage, credit and marketing. In turn, distributors can
be divided into: (i) wide-range distributors, identified by their wide range and high turnover volumes; (ii) specialised distributors, the reference point for specific technology for products and services, such as
intermediate systems, networking products, Internet, consultancy training and after-sales services; - ‘resellers’: mixed operators in terms of size, profits and organisational structures, business models and
ways of approaching the end-user. ‘Resellers’ are traditionally coded in terms of their customer base and type of services or answers offered together with the sales of information systems (consultancy, installation, infrastructure production, systems support, outsourcing, after-sales service, and training). They are usually identified as per the following categories:
VAR (“Value Added Reseller”) Large-scale retail and specialist sectors
Corporate Reseller Sub-distribution
System Integrator Computer shop
Dealer Shop on-line
Office automation products and consumables specialist
The individual sectors of the business system described above can be further defined in two different ways:
a) the so-called ‘addressed’ market, which is the total volume of IT product sales made by distributors or
effectively passing through the so-called ‘indirect channel’ (that is, the sales flow that does not pass directly from the producer to the retailer or from the producer to the IT end-user);
b) the so-called ‘addressable’ market, which is the volume of IT product sales which can be made by distributors or effectively moved through the so-called ‘indirect channel’ (with the sole exclusion of hardware equipment such as mainframes or application software such as ERP etc., which by their very nature cannot be intercepted by distributors.).
It follows that the size of the sector must therefore be considered by analysing:
- IT demand (end-user consumption);
Esprinet 2014 Directors’ Report on Operations
16
- the size of the distribution sector (that is the actual value of the sales effected by distributors or the value of the sales that can be guided by distributors according to the intrinsic nature of the products themselves).
The chart below illustrates the typical IT products distribution chain:
Italy
IT and electronics consumptions
During 2014 the Italian Information Technology market, measured considering end-user IT consumption, decreased from 18.9 billion euro to 18.5 billion euro, a -2.1% drop compared with the previous year. This decrease is recorded in all sectors: Hardware, Software and Services. The following tables summarise IT spending trends in Italy in the 2006/2014 period:
(euro/million) 2006 2007 2008 2009 2010 2011 2012 2013 2014
Hardware 8,859 9,185 9,101 8,080 8,133 7,539 6,988 6,593 6,420
Software 3,700 4,039 4,165 4,005 3,936 3,994 4,020 3,951 3,892
Services 10,024 10,269 10,380 9,772 9,212 8,944 8,693 8,344 8,176
Total It 22,583 23,493 23,646 21,857 21,281 20,477 19,701 18,888 18,488
Var. % 06 vs 05 07 vs 06 08 vs 07 09 vs 08 10 vs 09 11 vs 10 12 vs 11 13 vs 12 14 vs 13
Hardware 4.0% 3.7% -0.9% -11.2% 0.7% -7.3% -7.3% -5.7% -2.6%
Software 3.4% 9.2% 3.1% -3.8% -1.7% 1.5% 0.7% -1.7% -1.5%
Services 1.3% 2.4% 1.1% -5.9% -5.7% -2.9% -2.8% -4.0% -2.0%
Total It 2.7% 4.0% 0.7% -7.6% -2.6% -3.8% -3.8% -4.1% -2.1%
Source: Sirmi, January 2015
If Esprinet target market prospects are widened to include Information & Communication Technology, and also TLC (fixed/mobile services and devices), Consumer Electronics and Office Products, the market size may be illustrated as follows:
Vendor
Hardware & Software
Distributors
IT Resellers: Consumer / Business
Private consumers Small/Medium sized
businesses
Public Administration/
Large-scale retailers
1st
TIER
2nd
TIER
DIRECT CHANNEL
Large-scale and specialist
sectors / Computer shop
Dealer/VAR/System Integrator
Esprinet 2014 Directors’ Report on Operations
17
(euro/million) 2011 2012 12 vs 11 2013 13 vs 12 2014 14 vs 13
Hardware 7,539 6,988 -7.3% 6,593 -5.7% 6,420 -2.6%
Software 3,994 4,020 0.7% 3,951 -1.7% 3,892 -1.5%
Services 8,944 8,693 -2.8% 8,344 -4.0% 8,176 -2.0%
Sub Total IT 20,477 19,701 -3.8% 18,888 -4.1% 18,488 -2.1%
TLC fixed 16,306 15,614 -4.2% 15,028 -3.8% 14,487 -3.6%
TLC mobile 21,528 20,886 -3.0% 19,549 -6.4% 18,802 -3.8%
Sub Total TLC 37,833 36,500 -3.5% 34,577 -5.3% 33,289 -3.7%
Consumer electronics 8,322 7,785 -6.5% 7,002 -10.1% 6,478 -7.5%
Sub Total ICT 66,632 63,986 -4.0% 60,467 -5.5% 58,255 -3.7%
Source: Sirmi, January 2015
The following is a breakdown of the main dynamics per single market segment by limiting the analysis to the areas which provide a better approximation of the eligible market for a distributor:
Hardware 14 vs 13 Software 14 vs 13
Large Systems: 11.8% System software: -1.8%
Systems: -16.1% Middleware e tools: -0.9%
PC Server: 19.8% Applications: -2.4%
PC Client: 6.5%
Printers: -6.2%
Storage: 1.6%
Networking Hardware: -4.6%
Source: Sirmi, January 2015
The distribution industry: dimensions and trends
In this paragraph, industry dimensions and trends have been measured by taking the total IT product sales actually made by distributors operating in Italy as the definition of the relevant industry. As per Sirmi data, during 2014 the IT distribution industry posted an increase of +6.4% compared to 2013. The table below provides a summary of the market positions of the top 20 IT distribution concerns
2:
2 All mainly IT distributors have been considered in the Sirmi survey of distributors operating in Italy (approx. 160 out of the over 200
surveyed). Revenues of companies with fiscal year different from the solar year have been estimated by Sirmi for purposes of homogeneity. Each company has been ranked on the basis of its company perimeter in the single year, disregarding any latest acquisitions/transfers.

Esprinet 2014 Directors’ Report on Operations
18
Market Share
2012 2013 2014 2012 2013 2014
1 ESPRINET 1,467.5 1,538.1 1,675.0 23.7% 25.0% 25.6%
2 COMPUTER GROSS ITALIA 721.0 781.0 900.0 11.6% 12.7% 13.7%
3 TECH DATA 635.9 644.3 800.0 10.2% 10.5% 12.2%
4 INGRAM MICRO ITALIA 613.5 613.8 615.0 9.9% 10.0% 9.4%
5 DATAMATIC 374.3 363.9 360.0 6.0% 5.9% 5.5%
6 ATTIVA 218.0 245.8 270.0 3.5% 4.0% 4.1%
7 BREVI 134.8 153.0 170.0 2.2% 2.5% 2.6%
8 FUTURA GRAFICA 101.9 93.2 91.5 1.6% 1.5% 1.4%
9 ADVEO ITALIA 49.9 83.1 90.5 0.8% 1.4% 1.4%
10 IL TRIANGOLO 68.3 71.7 75.0 1.1% 1.2% 1.1%
11 EXECUTIVE 68.7 88.6 91.0 1.1% 1.4% 1.4%
12 SNT TECHNOLOGIES 45.2 66.1 67.0 0.7% 1.1% 1.0%
13 ITWAY 69.3 62.9 61.0 1.1% 1.0% 0.9%
14 EDSLAN 55.8 59.5 71.5 0.9% 1.0% 1.1%
15 ARROW ECS 51.7 55.2 57.0 0.8% 0.9% 0.9%
16 COMETA 51.9 52.1 53.0 0.8% 0.8% 0.8%
17 ICOS 48.5 48.9 49.5 0.8% 0.8% 0.8%
18 FOCELDA 52.9 47.5 46.0 0.9% 0.8% 0.7%
19 SIDIN 49.0 46.0 44.0 0.8% 0.7% 0.7%
20 ADL AMERICAN DATALINE 43.4 45.4 47.0 0.7% 0.7% 0.7%
Top 20 distributors 4,921 5,160 5,634 79.3% 83.9% 86.1%
Total market 6,205 6,152 6,546 100.0% 100.0% 100.0%
Var % top 20 distributors 4.8% 9.2%
Million euro
Source: Company processing based on Sirmi data, 2015.
The industry also saw a consolidation in the market share collectively held by the industry’s top 20 distributors, which rose from 84% in 2013 to 86% in 2014. The Esprinet Group confirmed its own leadership in this environment thanks to its penetration close to 26%, almost twice as much as the second player in the Italian market. Even according to Context (January 2015), that analyses sales data of the main distributors represented by industry consortium GTDC - Global Tech Distribution Council, which includes Esprinet Group as well - in 2014 the distributors that operate on the Italian market recorded a sales increase of +12.5% year-over-year. Esprinet Italy ranked first in the panel, with a stable market share compared to the previous year.
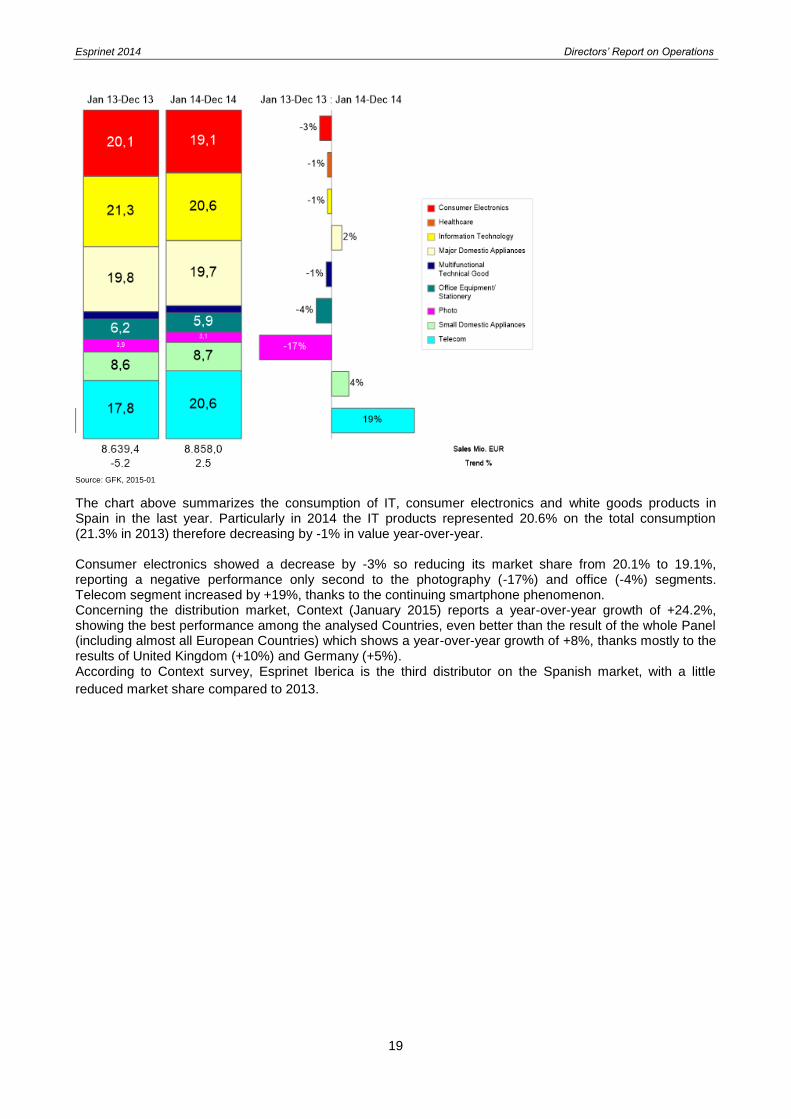
Spain
IT and electronics consumption
Information and data related to the Spanish market are unfortunately not as reliable as those of the Italian market. It is possible, however, to deduct few indicators that measure the end-users’ IT and consumer electronics consumption, thanks to surveys conducted directly on points of sales (either on-line or traditional shops) operating in the Spanish market.
Esprinet 2014 Directors’ Report on Operations
19
Source: GFK, 2015-01
The chart above summarizes the consumption of IT, consumer electronics and white goods products in Spain in the last year. Particularly in 2014 the IT products represented 20.6% on the total consumption (21.3% in 2013) therefore decreasing by -1% in value year-over-year. Consumer electronics showed a decrease by -3% so reducing its market share from 20.1% to 19.1%, reporting a negative performance only second to the photography (-17%) and office (-4%) segments. Telecom segment increased by +19%, thanks to the continuing smartphone phenomenon. Concerning the distribution market, Context (January 2015) reports a year-over-year growth of +24.2%, showing the best performance among the analysed Countries, even better than the result of the whole Panel (including almost all European Countries) which shows a year-over-year growth of +8%, thanks mostly to the results of United Kingdom (+10%) and Germany (+5%). According to Context survey, Esprinet Iberica is the third distributor on the Spanish market, with a little
reduced market share compared to 2013.

Esprinet 2014 Directors’ Report on Operations
20
Group and Esprinet S.p.A. economic and financial results
Please note that the economic and financial results and those of the relative period of comparison have been drawn up according to IFRSs.
1. Income trend
A) Esprinet Group financial highlights
The Group’s main economic, financial and assets results as at December 31st 2014 are as follows:
* Different amounts from those published in the Annual report as at 31 December 2013 due to reclassification, recurred even in the comparative figures, of the Monclick S.r.l. and Comprel S.r.l. profit and loss values into the ‘Income/loss from disposal Group’ item.
Consolidated sales, equal to 2,291.1 million euro, showed an increase of +14% (288.2 million euro) compared to 2,003.0 million euro of 31 December 2013. Consolidated gross profit was equal to 141.8 million euro showing an increase (equal to al 17% or 20.2 million euro) compared to the same period of 2013 as a consequence of both higher sales and higher gross profit margin. Consolidated operating income (EBIT) totalled 41.1 million euro, showing an increase of +20% compared to 31 December 2013 (34.3 million euro), with an ebit margin increased to 1.79% from 1.71%, notwithstanding a 13.4 million euro growth in operating costs compared to the same period of 2013. Consolidated profit before income taxes equal to 39.1 million euro, is affected by 0.1 million euro growth in financial costs and shows an increase of +21% compared to 31 December 2013. Consolidated net income from continuing operations was equal to 25.7 million euro, with an increase of +19% (4.1 million euro) compared to 31 December 2013. Consolidated net income was equal to 26.8 million euro, with an increase of +16% (3.7 million euro) compared to 31 December 2013 affected also by 1.1 million euro of “Profit/(Loss) from disposal groups” decreased by -0.4 million euro (-26%) compared to the same period of 2013. Basic earnings per share from continuing operations at 31 December 2014 was equal to 0.50 euro, showing an increase of +19% compared to the value of 31 December 2013. Basing earnings per ordinary share at 31 December 2014 was equal to 0.53 euro, showing an increase of +17% compared to 31 December 2013.
Sales 2,291,141 100.00% 2,002,964 100.00% 288,177 14%
Cost of sales (2,149,305) -93.81% (1,881,299) -93.93% (268,006) 14%
Gross profit 141,836 6.19% 121,665 6.07% 20,171 17%
Sales and marketing costs (38,381) -1.68% (29,994) -1.50% (8,387) 28%
Overheads and administrative costs (62,369) -2.72% (57,393) -2.87% (4,976) 9%
Operating income (EBIT) 41,086 1.79% 34,278 1.71% 6,808 20%
Finance costs - net (1,987) -0.09% (1,902) -0.09% (85) 4%
Other investments expenses / (incomes) 1 0.00% (6) 0.00% 7 -117%
Profit before income taxes 39,100 1.71% 32,370 1.62% 6,730 21%
Income tax expenses (13,413) -0.59% (10,795) -0.54% (2,618) 24%
Profit from continuing operations 25,687 1.12% 21,575 1.08% 4,112 19%
Income/(loss) from disposal groups 1,126 0.05% 1,520 0.08% (394) -26%
Net income 26,813 1.17% 23,095 1.15% 3,718 16%
Earnings per share - continuing operations 0.51 0.42 0.08 20%
Earnings per share - basic (euro) 0.53 0.45 0.08 17%
% % Var. Var. %(euro/000) 2014 2013 restated*
Esprinet 2014 Directors’ Report on Operations
21
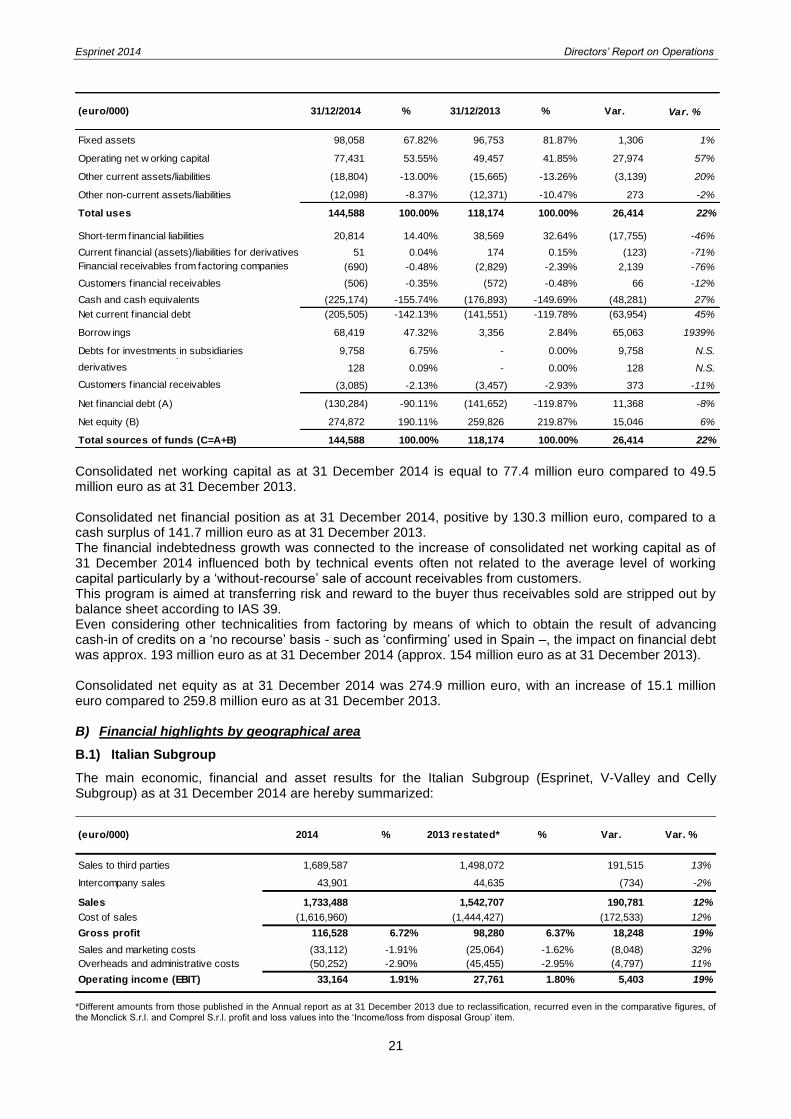
Consolidated net working capital as at 31 December 2014 is equal to 77.4 million euro compared to 49.5 million euro as at 31 December 2013. Consolidated net financial position as at 31 December 2014, positive by 130.3 million euro, compared to a cash surplus of 141.7 million euro as at 31 December 2013. The financial indebtedness growth was connected to the increase of consolidated net working capital as of 31 December 2014 influenced both by technical events often not related to the average level of working capital particularly by a ‘without-recourse’ sale of account receivables from customers. This program is aimed at transferring risk and reward to the buyer thus receivables sold are stripped out by balance sheet according to IAS 39. Even considering other technicalities from factoring by means of which to obtain the result of advancing cash-in of credits on a ‘no recourse’ basis - such as ‘confirming’ used in Spain –, the impact on financial debt was approx. 193 million euro as at 31 December 2014 (approx. 154 million euro as at 31 December 2013). Consolidated net equity as at 31 December 2014 was 274.9 million euro, with an increase of 15.1 million euro compared to 259.8 million euro as at 31 December 2013. B) Financial highlights by geographical area
B.1) Italian Subgroup
The main economic, financial and asset results for the Italian Subgroup (Esprinet, V-Valley and Celly Subgroup) as at 31 December 2014 are hereby summarized:
*Different amounts from those published in the Annual report as at 31 December 2013 due to reclassification, recurred even in the comparative figures, of the Monclick S.r.l. and Comprel S.r.l. profit and loss values into the ‘Income/loss from disposal Group’ item.
(euro/000) 31/12/2014 % 31/12/2013 % Var. Var. %
Fixed assets 98,058 67.82% 96,753 81.87% 1,306 1%
Operating net w orking capital 77,431 53.55% 49,457 41.85% 27,974 57%
Other current assets/liabilities (18,804) -13.00% (15,665) -13.26% (3,139) 20%
Other non-current assets/liabilities (12,098) -8.37% (12,371) -10.47% 273 -2%
Total uses 144,588 100.00% 118,174 100.00% 26,414 22%N.S.
Short-term financial liabilities 20,814 14.40% 38,569 32.64% (17,755) -46%
Current f inancial (assets)/liabilities for derivatives 51 0.04% 174 0.15% (123) -71%
Financial receivables from factoring companies (690) -0.48% (2,829) -2.39% 2,139 -76%
Customers f inancial receivables (506) -0.35% (572) -0.48% 66 -12%
Cash and cash equivalents (225,174) -155.74% (176,893) -149.69% (48,281) 27%
Net current f inancial debt (205,505) -142.13% (141,551) -119.78% (63,954) 45%
Borrow ings 68,419 47.32% 3,356 2.84% 65,063 1939%
Debts for investments in subsidiaries 9,758 6.75% - 0.00% 9,758 N.S.Non-current f inancial (assets)/liab. for
derivatives 128 0.09% - 0.00% 128 N.S.
Customers f inancial receivables (3,085) -2.13% (3,457) -2.93% 373 -11%
Net f inancial debt (A) (130,284) -90.11% (141,652) -119.87% 11,368 -8%
Net equity (B) 274,872 190.11% 259,826 219.87% 15,046 6%
Total sources of funds (C=A+B) 144,588 100.00% 118,174 100.00% 26,414 22%
Sales to third parties 1,689,587 100.00% 1,498,072 100.00% 191,515 13%
Intercompany sales 43,901 2.60% 44,635 2.98% (734) -2%
Sales 1,733,488 102.60% 1,542,707 102.98% 190,781 12%
Cost of sales (1,616,960) -95.70% (1,444,427) -96.42% (172,533) 12%
Gross profit 116,528 6.72% 98,280 6.37% 18,248 19%
Sales and marketing costs (33,112) -1.91% (25,064) -1.62% (8,048) 32%
Overheads and administrative costs (50,252) -2.90% (45,455) -2.95% (4,797) 11%
Operating income (EBIT) 33,164 1.91% 27,761 1.80% 5,403 19%
% % Var. Var. %(euro/000) 2014 2013 restated*
Esprinet 2014 Directors’ Report on Operations
22
Sales were 1,733.5 million euro, with an increase of +12% compared to 1,542.7 million euro as at 31 December 2013. The fourth quarter registered an increase of +20% compared to the fourth quarter 2013. Gross profit equal to 116.5 million euro shows an increase of +19% compared to 98.3 million euro as at 31 December 2013 thanks to the combination of the increasing gross profit margin (from 6.37% to 6.72%) and higher sales. Operating income (EBIT) is equal to 33.2 million euro, with an increase of +19% compared to the same period of 2013 and EBIT margin increased from 1.80% to 1.91% despite an increase of 12.9 million euro of operating costs.
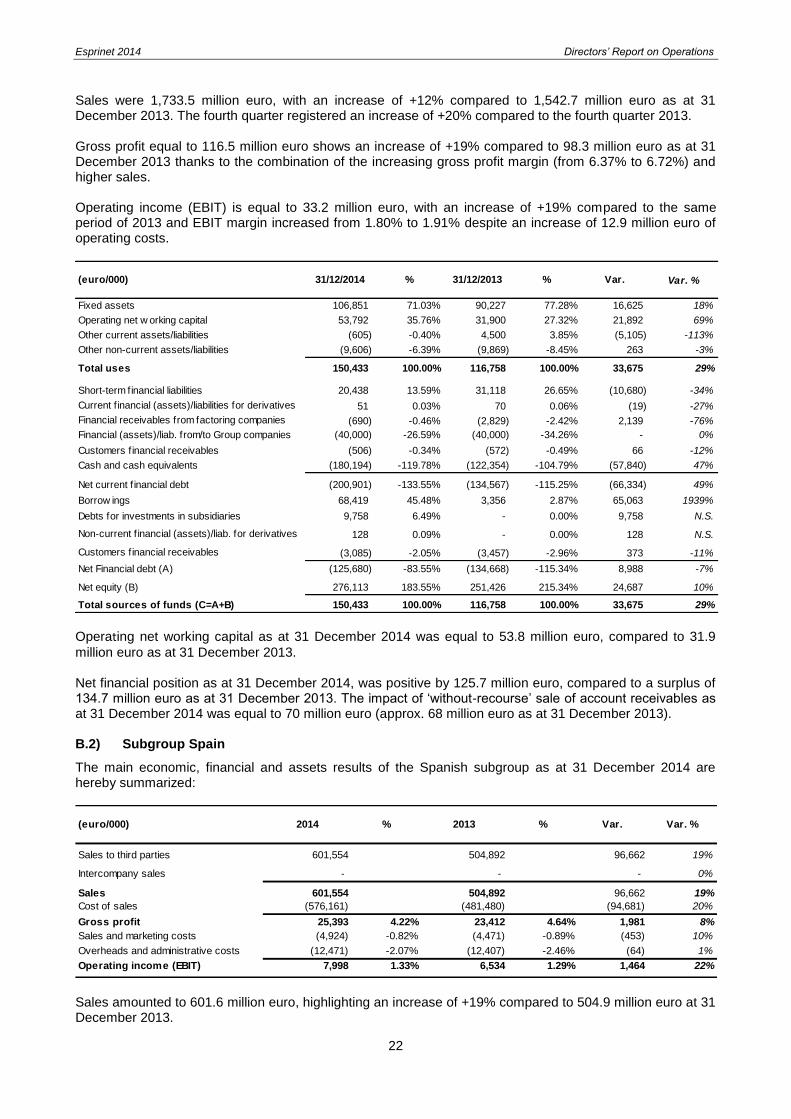
Operating net working capital as at 31 December 2014 was equal to 53.8 million euro, compared to 31.9
million euro as at 31 December 2013. Net financial position as at 31 December 2014, was positive by 125.7 million euro, compared to a surplus of 134.7 million euro as at 31 December 2013. The impact of ‘without-recourse’ sale of account receivables as at 31 December 2014 was equal to 70 million euro (approx. 68 million euro as at 31 December 2013). B.2) Subgroup Spain
The main economic, financial and assets results of the Spanish subgroup as at 31 December 2014 are hereby summarized:
Sales amounted to 601.6 million euro, highlighting an increase of +19% compared to 504.9 million euro at 31 December 2013.
(euro/000) 31/12/2014 % 31/12/2013 % Var. Var. %
Fixed assets 106,851 71.03% 90,227 77.28% 16,625 18%
Operating net w orking capital 53,792 35.76% 31,900 27.32% 21,892 69%
Other current assets/liabilities (605) -0.40% 4,500 3.85% (5,105) -113%
Other non-current assets/liabilities (9,606) -6.39% (9,869) -8.45% 263 -3%
Total uses 150,433 100.00% 116,758 100.00% 33,675 29%
Short-term financial liabilities 20,438 13.59% 31,118 26.65% (10,680) -34%
Current f inancial (assets)/liabilities for derivatives 51 0.03% 70 0.06% (19) -27%
Financial receivables from factoring companies (690) -0.46% (2,829) -2.42% 2,139 -76%
Financial (assets)/liab. from/to Group companies (40,000) -26.59% (40,000) -34.26% - 0%
Customers f inancial receivables (506) -0.34% (572) -0.49% 66 -12%
Cash and cash equivalents (180,194) -119.78% (122,354) -104.79% (57,840) 47%
Net current f inancial debt (200,901) -133.55% (134,567) -115.25% (66,334) 49%
Borrow ings 68,419 45.48% 3,356 2.87% 65,063 1939%
Debts for investments in subsidiaries 9,758 6.49% - 0.00% 9,758 N.S.
Non-current f inancial (assets)/liab. for derivatives 128 0.09% - 0.00% 128 N.S.
Customers f inancial receivables (3,085) -2.05% (3,457) -2.96% 373 -11%
Net Financial debt (A) (125,680) -83.55% (134,668) -115.34% 8,988 -7%
Net equity (B) 276,113 183.55% 251,426 215.34% 24,687 10%
Total sources of funds (C=A+B) 150,433 100.00% 116,758 100.00% 33,675 29%
Sales to third parties 601,554 100.00% 504,892 100.00% 96,662 19%
Intercompany sales - - - 0.00% - 0%
Sales 601,554 100.00% 504,892 100.00% 96,662 19%
Cost of sales (576,161) -95.78% (481,480) -95.36% (94,681) 20%
Gross profit 25,393 4.22% 23,412 4.64% 1,981 8%
Sales and marketing costs (4,924) -0.82% (4,471) -0.89% (453) 10%
Overheads and administrative costs (12,471) -2.07% (12,407) -2.46% (64) 1%
Operating income (EBIT) 7,998 1.33% 6,534 1.29% 1,464 22%
(euro/000) % % Var. Var. %2014 2013
Esprinet 2014 Directors’ Report on Operations
23
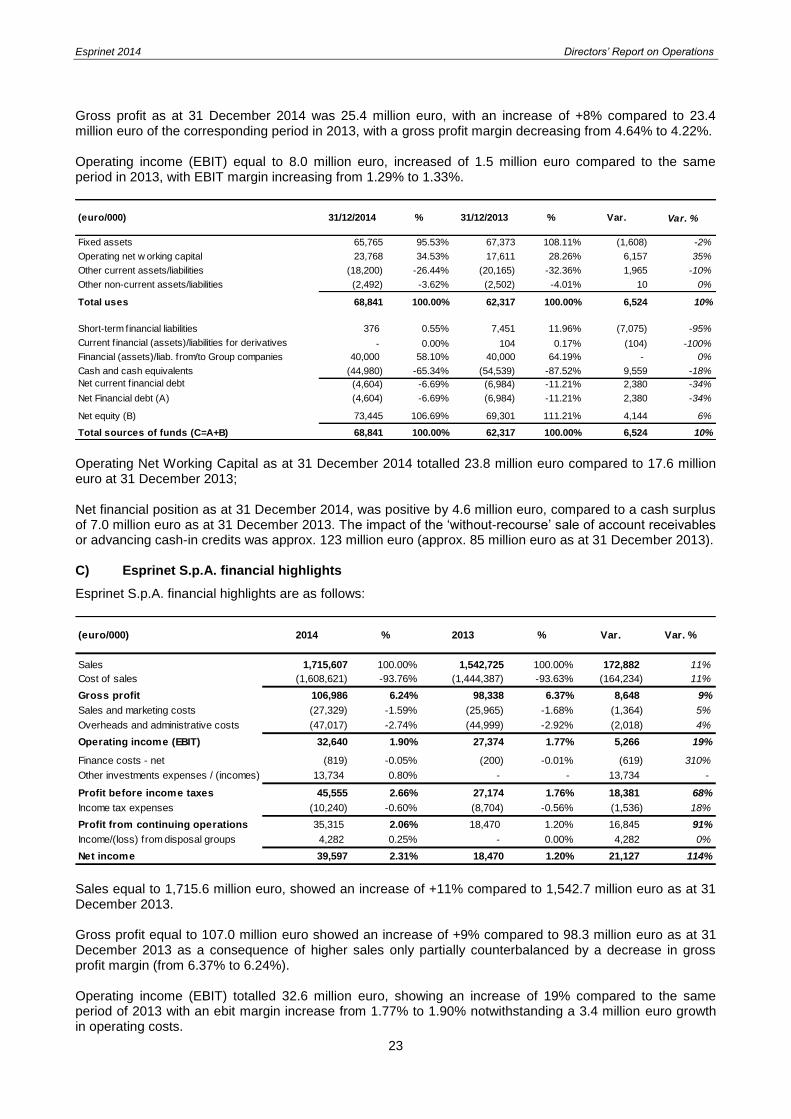
Gross profit as at 31 December 2014 was 25.4 million euro, with an increase of +8% compared to 23.4 million euro of the corresponding period in 2013, with a gross profit margin decreasing from 4.64% to 4.22%. Operating income (EBIT) equal to 8.0 million euro, increased of 1.5 million euro compared to the same period in 2013, with EBIT margin increasing from 1.29% to 1.33%.
Operating Net Working Capital as at 31 December 2014 totalled 23.8 million euro compared to 17.6 million euro at 31 December 2013; Net financial position as at 31 December 2014, was positive by 4.6 million euro, compared to a cash surplus of 7.0 million euro as at 31 December 2013. The impact of the ‘without-recourse’ sale of account receivables or advancing cash-in credits was approx. 123 million euro (approx. 85 million euro as at 31 December 2013). C) Esprinet S.p.A. financial highlights
Esprinet S.p.A. financial highlights are as follows:
Sales equal to 1,715.6 million euro, showed an increase of +11% compared to 1,542.7 million euro as at 31 December 2013. Gross profit equal to 107.0 million euro showed an increase of +9% compared to 98.3 million euro as at 31 December 2013 as a consequence of higher sales only partially counterbalanced by a decrease in gross profit margin (from 6.37% to 6.24%).
Operating income (EBIT) totalled 32.6 million euro, showing an increase of 19% compared to the same period of 2013 with an ebit margin increase from 1.77% to 1.90% notwithstanding a 3.4 million euro growth in operating costs.
(euro/000) 31/12/2014 % 31/12/2013 % Var. Var. %
Fixed assets 65,765 95.53% 67,373 108.11% (1,608) -2%
Operating net w orking capital 23,768 34.53% 17,611 28.26% 6,157 35%
Other current assets/liabilities (18,200) -26.44% (20,165) -32.36% 1,965 -10%
Other non-current assets/liabilities (2,492) -3.62% (2,502) -4.01% 10 0%
Total uses 68,841 100.00% 62,317 100.00% 6,524 10%
Short-term financial liabilities 376 0.55% 7,451 11.96% (7,075) -95%
Current f inancial (assets)/liabilities for derivatives - 0.00% 104 0.17% (104) -100%
Financial (assets)/liab. from/to Group companies 40,000 58.10% 40,000 64.19% - 0%
Cash and cash equivalents (44,980) -65.34% (54,539) -87.52% 9,559 -18%
Net current f inancial debt (4,604) -6.69% (6,984) -11.21% 2,380 -34%
Net Financial debt (A) (4,604) -6.69% (6,984) -11.21% 2,380 -34%
Net equity (B) 73,445 106.69% 69,301 111.21% 4,144 6%
Total sources of funds (C=A+B) 68,841 100.00% 62,317 100.00% 6,524 10%
Sales 1,715,607 100.00% 1,542,725 100.00% 172,882 11%
Cost of sales (1,608,621) -93.76% (1,444,387) -93.63% (164,234) 11%
Gross profit 106,986 6.24% 98,338 6.37% 8,648 9%
Sales and marketing costs (27,329) -1.59% (25,965) -1.68% (1,364) 5%
Overheads and administrative costs (47,017) -2.74% (44,999) -2.92% (2,018) 4%
Operating income (EBIT) 32,640 1.90% 27,374 1.77% 5,266 19%
Finance costs - net (819) -0.05% (200) -0.01% (619) 310%
Other investments expenses / (incomes) 13,734 0.80% - - 13,734 -
Profit before income taxes 45,555 2.66% 27,174 1.76% 18,381 68%
Income tax expenses (10,240) -0.60% (8,704) -0.56% (1,536) 18%
Profit from continuing operations 35,315 2.06% 18,470 1.20% 16,845 91%
Income/(loss) from disposal groups 4,282 0.25% - 0.00% 4,282 0%
Net income 39,597 2.31% 18,470 1.20% 21,127 114%
(euro/000) 2014 2013% % Var. Var. %
Esprinet 2014 Directors’ Report on Operations
24
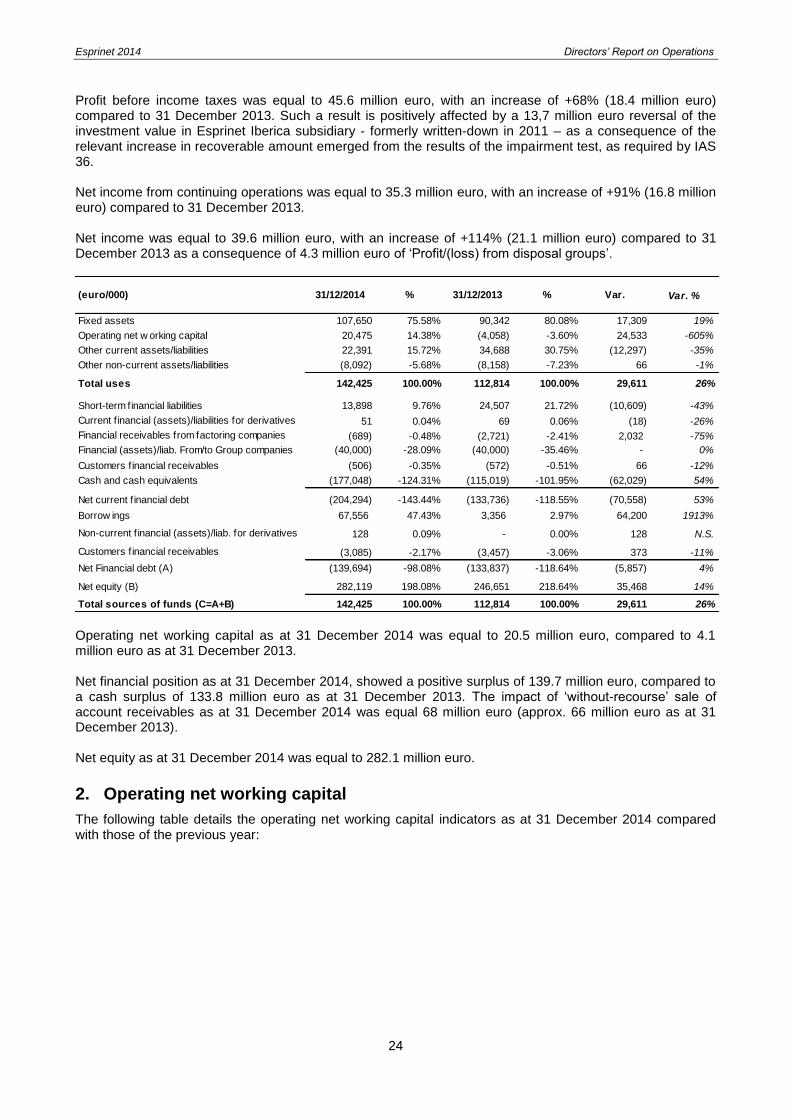
Profit before income taxes was equal to 45.6 million euro, with an increase of +68% (18.4 million euro) compared to 31 December 2013. Such a result is positively affected by a 13,7 million euro reversal of the investment value in Esprinet Iberica subsidiary - formerly written-down in 2011 – as a consequence of the relevant increase in recoverable amount emerged from the results of the impairment test, as required by IAS 36.
Net income from continuing operations was equal to 35.3 million euro, with an increase of +91% (16.8 million euro) compared to 31 December 2013.
Net income was equal to 39.6 million euro, with an increase of +114% (21.1 million euro) compared to 31 December 2013 as a consequence of 4.3 million euro of ‘Profit/(loss) from disposal groups’.
Operating net working capital as at 31 December 2014 was equal to 20.5 million euro, compared to 4.1 million euro as at 31 December 2013.
Net financial position as at 31 December 2014, showed a positive surplus of 139.7 million euro, compared to a cash surplus of 133.8 million euro as at 31 December 2013. The impact of ‘without-recourse’ sale of account receivables as at 31 December 2014 was equal 68 million euro (approx. 66 million euro as at 31 December 2013).
Net equity as at 31 December 2014 was equal to 282.1 million euro.
2. Operating net working capital
The following table details the operating net working capital indicators as at 31 December 2014 compared with those of the previous year:
(euro/000) 31/12/2014 % 31/12/2013 % Var. Var. %
Fixed assets 107,650 75.58% 90,342 80.08% 17,309 19%
Operating net w orking capital 20,475 14.38% (4,058) -3.60% 24,533 -605%
Other current assets/liabilities 22,391 15.72% 34,688 30.75% (12,297) -35%
Other non-current assets/liabilities (8,092) -5.68% (8,158) -7.23% 66 -1%
Total uses 142,425 100.00% 112,814 100.00% 29,611 26%
Short-term financial liabilities 13,898 9.76% 24,507 21.72% (10,609) -43%
Current f inancial (assets)/liabilities for derivatives 51 0.04% 69 0.06% (18) -26%
Financial receivables from factoring companies (689) -0.48% (2,721) -2.41% 2,032 -75%
Financial (assets)/liab. From/to Group companies (40,000) -28.09% (40,000) -35.46% - 0%
Customers f inancial receivables (506) -0.35% (572) -0.51% 66 -12%
Cash and cash equivalents (177,048) -124.31% (115,019) -101.95% (62,029) 54%
Net current f inancial debt (204,294) -143.44% (133,736) -118.55% (70,558) 53%
Borrow ings 67,556 47.43% 3,356 2.97% 64,200 1913%
Non-current f inancial (assets)/liab. for derivatives 128 0.09% - 0.00% 128 N.S.
Customers f inancial receivables (3,085) -2.17% (3,457) -3.06% 373 -11%
Net Financial debt (A) (139,694) -98.08% (133,837) -118.64% (5,857) 4%
Net equity (B) 282,119 198.08% 246,651 218.64% 35,468 14%
Total sources of funds (C=A+B) 142,425 100.00% 112,814 100.00% 29,611 26%

Esprinet 2014 Directors’ Report on Operations
25
31/12/2014 31/12/2013
Group Italy Spain Group Italy Spain
Trade receivables [a] 275,983 201,100 74,883 232,519 181,852 50,667
Trade receivables net of VAT (1)
226,723 164,836 61,887 190,933 149,059 41,874
Sales (2)
2,291,141 1,689,587 601,554 2,043,001 1,538,109 504,892
[A] Days Sales Outstanding - DSO (3)
36 36 38 34 35 30
Inventory [b] 253,488 195,258 58,230 217,304 165,968 51,336
[B] Days Sales of Inventory - DSI (4)
43 44 40 42 41 43
Trade payables [c] 452,040 342,566 109,474 400,366 315,920 84,446
Trade payables net of VAT (1)
371,266 280,792 90,474 328,741 258,951 69,790
Cost Of ssales 2,149,305 1,616,960 532,345 1,908,261 1,471,389 436,872
Total SG&A 100,750 83,709 17,041 97,752 81,343 16,409
[C] Days Payable Outstanding - DPO (5)
60 60 60 60 61 56
Operating net working capital [a+b-c] 77,431 53,792 23,639 49,457 31,900 17,557
Cash conversion Cycle (days) [A+B-C] 19 20 18 16 15 17
Operating net working capital / Sales 3.4% 3.2% 3.9% 2.4% 2.1% 3.5%
(euro/000)
(1)
Net of VAT calculated applying the ordinary 22% rate in the case of Subgroup Italy and 21% in the case of Subgroup Spain. (2)
Net of intercompany sales (3)
(Trade receivables net of VAT / Sales and services) * 365. (4)
(Inventory / Cost of sales) * 365. (5)
[Trade payables net of VAT / (Purchases + Cost of services and other Operating costs)] * 365.
The level of the Group operating net working capital as at 31 December 2014 showed an increase versus that of the previous year end (77.4 million euro versus 49.5 million euro at 31 December 2013) with a 3-day worsening in the duration of the cash conversion cycle of the Group.
The operating net working capital level existing as at 31 December, calculated as described in the notes to the table above, showed an increase of 5 days in the duration of the Subgroup Italy’s cash conversion cycle (from 15 to 20 days) and a corresponding worsening of the operating net working capital / sales ratio from 2.1% to 3.2%. The increase in the cash conversion cycle is due to a widespread stress in all ratios: DSO passed from 35 to 36, the inventory turnover time increased from 41 to 44 days, the average number of days in payment to suppliers reduced from 61 to 60. By the same calculations, Subgroup Spain shows better results both as level of the operating working capital, and in the operating net working capital / sales ratio, only worsen from 3.5% to 3.9%. Consequently an almost stable cash conversion cycle duration has been got thanks to an improved inventory turnover (reduced from 44 to 40 days) and to longer average delayed payment times granted by suppliers (increased from 56 to 60 days). These improvements have almost entirely counterbalanced the drop in the days needed to collect receivables from customers (from 30 to 38 days). During 2014, the ‘without-recourse’ sale of account receivables revolving program, focusing on the large-scale distribution sector in particular, continued as part of the processes concentrating on the management of operating net working capital both in Italy and in Spain. Taking into account also other technical forms of factoring than ‘no recourse assignment’, but with similar effects – i.e. confirming in Spain – the overall impact on financial debt was approx. 193 million euro as at 31 December 2013 (154 million euro as at 31 December 2013). The following table illustrates the Esprinet S.p.A. working capital trend in the last two financial years:
Esprinet 2014 Directors’ Report on Operations
26
(euro/000)
31/12/2014 31/12/2013
Trade receivables [a] 169,563 146,066
Trade receivables net of VAT (1)
138,986 119,726
Sales (2)
1,670,682 1,409,228
[A] Days Sales Outstanding - DSO (3)
30 31
Inventory [b] 188,013 160,976
[B] Days Sales of Inventory - DSI (4)
43 41
Trade payables [c] 337,101 311,100
Trade payables net of VAT (1)
276,312 255,000
Cost of sales (5)
1,607,862 1,443,162
Total SG&A (6)
74,679 72,685
[C] Days payables Outstanding - DPO (7)
60 61
Operating net working capital [a+b-c] 20,475 (4,058)
Cash conversion Cycle (days) [A+B-C] 13 11
Operating net working capital / Sales 1.2% -0.3%
Esprinet S.p.A.
(1) Net of VAT measured by applying the ordinary 22% rate.
(2) Net of intercompany sales amounting to 44.9 million euro (133.5 million euro in 2013) as per the table shown in the separate annual report
(3) (Trade receivables net of VAT / Sales and services) * 365.
(4) (Inventory / Cost of sales) * 365.
(5) Net of intercompany costs amounting to 0.8 million euro (1.2 million euro in 2013) as per the table shown in the separate annual report
(6) Net of intercompany costs and re-charges of 0.3 million euro (1.7 million euro in 2013). As per the table shown in the separate annual report
(7) [Trade payables net of VAT / (Purchases, costs for services + operating costs)] * 365.
During 2014 the duration of the entire cash conversion cycle of Esprinet S.p.A. increased from 11 to 13 days and the ratio between operating net working capital and increased to 1.2% from -0.3% in 2013. This worsening is mainly due to higher inventory turnover rates (passed from 41 to 43 days) having been the reduction in DSO (from 31 to 30 days) balanced by the slightly worsening in DPO (from 61 to 60 days). The total effect of these programs (without-recourse sale of account receivables revolving programs, focusing particularly on selected customer sectors) on the level of financial debt at year-end was approx. 68 million euro (approx. 66 million euro at 31 December 2013).
3. Net Financial Position
The tables below show the contributions of Subgroup Italy and Subgroup Spain to the Group’s net financial position (or ‘net financial debt’ or ‘net financial indebtedness’) as at 31 December 2014:
The Group’s net financial situation at year-end showed a 130.3 million euro cash surplus, 11.4 million euro less compared to the 141.7 million euro surplus recorded at 31 December 2013. This was mainly due to the extraordinary operations of acquisition and disposal of companies occurred during the year. The following table shows the trend in the relative weight of the individual companies making up the Subgroup Italy:
Italy Spain Group Italy Spain Group
Short-term financial liabilities 20,438 376 20,814 31,118 7,451 38,569 (17,755)
Customers f inancial receivables (506) - (506) (572) - (572) 66
Current f inancial (assets)/liabilities for derivatives 51 - 51 70 104 174 (123)
Financial receivables from factoring companies (690) - (690) (2,829) - (2,829) 2,139
Financial (assets)/liab. From/to Group companies (40,000) 40,000 - (40,000) 40,000 - -
Cash and cash equivalents (180,194) (44,980) (225,174) (122,354) (54,539) (176,893) (48,281)
Net current financial debt (200,901) (4,604) (205,505) (134,567) (6,984) (141,551) (63,954)
Borrow ings 68,419 - 68,419 3,356 - 3,356 65,063
Debts for investmebts in subsidiaries 9,758 - 9,758 - - - 9,758
Non-current f inancial (assets)/liab. for derivatives 128 - 128 - - - 128
Customers f inancial receivables (3,085) - (3,085) (3,457) - (3,457) 373
Net financial debt (125,680) (4,604) (130,284) (134,668) (6,984) (141,652) 11,368
31/12/2014 Var.
Group
31/12/2013
Esprinet 2014 Directors’ Report on Operations
27
Its role as IT production chain distributor means that the level of net financial indebtedness of the Esprinet Group is heavily influenced by the typical working capital needs related to the performance of its activities. This level fluctuates dramatically not only along the calendar year but also during each month and each day, due not only to the seasonable nature of the business, but for the most part also to the concentration of payments received from customers at the end and middle of each month, while the maturities of payments to suppliers are distributed more evenly over the month. For this reason, the figure resulting at the end of the period, as at 31 December 2014, or at the end of each month or quarter, is not totally representative of the average net financial indebtedness customarily observable during the same period.
4. Sales by product family and customer type
Group sales by product family and customer type
Sales by product family
(euro/million) 2014 % 2013 restated % Var. % Var.
PC - notebook 504.7 22.0% 435.9 21.8% 68.8 16%
TLC 284.7 12.4% 146.1 7.3% 138.6 95%
PC - desktop and monitor 245.5 10.7% 196.2 9.8% 49.3 25%
Consumables 243.9 10.6% 252.9 12.6% (9.0) -4%
Consumer electronics 235.6 10.3% 219.2 10.9% 16.4 7%
PC - tablet 216.3 9.4% 230.4 11.5% (14.1) -6%
Peripherical devices 117.0 5.1% 101.3 5.1% 15.7 15%
Storage 106.5 4.6% 110.3 5.5% (3.8) -3%
Software 105.6 4.6% 94.7 4.7% 10.9 12%
Networking 41.4 1.8% 40.5 2.0% 0.9 2%
Server 37.1 1.6% 41.2 2.1% (4.1) -10%
Services 18.3 0.8% 15.0 0.7% 3.3 22%
Other 134.5 5.9% 119.3 6.0% 15.2 13%
Group sales 2,291.1 100% 2,003.0 100% 288.1 14%
Esprinet Celly V-Valley Esprinet Comprel Monclick V-Valley
Short-term financial liabilities 13,898 6,031 509 24,507 5,780 4 826
Customers financial receivables (506) - - (572) - - -
Current f inancial (assets)/liabilities for derivatives 51 - - 70 - - -
Financial receivables from factoring companies (689) - (1) (2,721) - - (109)
Financial (assets)/liab. From/to Group companies (40,000) - - (40,000) - - -
Cash and cash equivalents (177,048) (730) (2,415) (115,019) (6) (1,568) (5,761)
Net current financial debt (204,294) 5,301 (1,907) (133,735) 5,774 (1,564) (5,044)
Borrow ings 67,556 863 - 3,356 - - -
Non-current f inancial (assets)/liab. for derivatives 128 - - - - - -
Customers financial receivables (3,085) - - (3,457) - - -
Net financial debt (139,694) 6,164 (1,907) (133,836) 5,774 (1,564) (5,044)
31/12/2014 31/12/2013
Esprinet 2014 Directors’ Report on Operations
28
Sales by Customer type
(euro/million) 2014 %2013
restated% Var. % Var.
Dealer 661.6 28.9% 563.4 28.1% 98.2 17%
GDO/GDS 514.6 22.5% 443.3 22.1% 71.3 16%
Office / Consumable dealers 419.2 18.3% 365.9 18.3% 53.3 15%
VAR 397.2 17.3% 355.2 17.7% 42.0 12%
Shop on-line 181.0 7.9% 167.6 8.4% 13.4 8%
Sub-Distributors 117.5 5.1% 107.6 5.4% 9.9 9%
Group sales 2,291.1 100.0% 2,003.0 100.0% 288.1 14%
The sales analysis by customer type shows a general improvement compared to the previous year. Best results are in the 'Dealer' channel (+17%) and in the 'GDO/GDS' one thanks to the good performance of ‘PC Clients’ (PC notebooks, PC desktops and tablets) and mobile phone devices. From the product standpoint, the Group performed well in the PC Client segment mainly thanks to the strong growth of the PC notebooks only partially counterbalanced by the negative trend of ‘Tablets’ (-6%). Among the other categories, note should be taken of the excellent performances of ‘TLC’ (smartphones mainly, +95%), while ‘Consumables’ (-4%), 'Storage' (-3%) and ‘Server’ (-10%) posted the worst sales results.
Esprinet S.p.A. sales by product family and customer type
The following are the same breakdowns of sales performance of Esprinet S.p.A. during the year:
Sales by product family
(euro/million) 2014 % 2013 % Var. % Var.
PC notebook 269.3 15.7% 262.4 17.0% 6.9 3%
TLC 247.0 14.4% 138.5 9.0% 108.5 78%
Consumables 226.0 13.2% 242.9 15.7% (16.9) -7%
Consumer electronics 196.5 11.5% 184.8 12.0% 11.7 6%
PC - desktop and monitor 175.2 10.2% 138.1 9.0% 37.1 27%
PC - Tablet 127.7 7.4% 132.3 8.6% (4.6) -3%
Peripherical devices 96.9 5.6% 82.6 5.4% 14.3 17%
Software 94.8 5.5% 85.9 5.6% 8.9 10%
Storage 87.9 5.1% 95.4 6.2% (7.5) -8%
Server 33.2 1.9% 36.6 2.4% (3.4) -9%
Networking 30.0 1.7% 30.6 2.0% (0.6) -2%
Services 17.7 1.0% 14.3 0.9% 3.4 24%
Others 113.4 6.6% 98.3 6.4% 15.1 15%
Group sales 1,715.6 100.0% 1,542.7 100.0% 172.9 11%
The breakdown of sales by product family underlines an overall increase, mainly referring to TLC sector (+78%) and ‘PC – desktop and monitors’ (+27%).

Esprinet 2014 Directors’ Report on Operations
29
Sales by customer type
(euro/million) 2014 % 2013 % Var. % Var.
Dealer 657.2 38.3% 600.2 38.9% 57.0 9%
Office/ Consumable dealers 310.4 18.1% 269.5 17.5% 40.9 15%
GDO/GDS 269.2 15.7% 252.5 16.4% 16.7 7%
VAR 255.9 14.9% 288.0 18.7% (32.1) -11%
Shop on-line 150.2 8.8% 53.3 3.5% 96.9 182%
Sub-distributors 72.6 4.2% 79.2 5.1% (6.6) -8%
Esprinet S.p.A. sales 1,715.6 100.0% 1,542.7 100.0% 172.9 11%
The 2014 showed on one hand an improvement in sales occurred in ‘Sub-distributors’ channel, ‘Office/Consumables Dealers’ and ‘Shop on-line’ ones, while on the other hand a drop in ‘VAR’ channel.
Significant events occurred during the period
The significant events occurred during the year are briefly described as follows: Esprinet to sale 100% of Monclick’s share capital
On 28 February 2014 Esprinet finalised the sale of 100% stake in its subsidiary Monclick S.r.l. for an equity value of 4.0 million euro paid in cash net of non-significant sale costs. On the same day the value of the Monclick subsidiary in the Esprinet S.p.A. Separate Financial Statements was 3.7 million euro, against an asset value of 1.5 million euro. The transaction represents a step forward in the process aimed at further focusing in the technology wholesale distribution business through maximizing ‘non-core assets’ value. The buyer is Project Informatica S.p.A. - one of the most valuable IT system integrators in the Italian market - through a wholly owned company. Agreements with Project Informatica S.p.A. include collateral contracts having the purpose of smoothing the process of exiting the Esprinet Group and ruling future commercial relationships between Esprinet and Monclick. Esprinet S.p.A. Shareholders’ General Meeting On 30 April 2014, in second call, the Esprinet Shareholders’ Meeting approved the financial statements of Esprinet S.p.A as at 31 December 2013 and resolved to distribute a gross dividend of 0,089 euro per ordinary share before taxes and any mandatory substitute taxation. The dividend, equal to 4.5 million euro, was paid out from 8 May 2014. Shareholders’ Meeting approved the first section of the report on remuneration pursuant to paragraph 6 art. 123-ter decree law 58/1998. The Shareholders’ Meeting approved the proposal for change and integration of current three years period 2012-2014 ‘Long Term Incentive Plan’ for executive directors and employees of Esprinet S.p.A., based on the grating of a up to a maximum of 1,150,000 shares of company’s own shares (‘performance stock grant’) approved by the Annual Shareholders’ Meeting on 9 May 2012. Major changes refer to the right granted to beneficiaries to receive a portion of the maximum number of shares in case of a partial achievement of financial targets, provided that a performance-threshold is at least overtaken. The Shareholders’ Meeting resolved to authorise, subject to prior revocation of former authorization resolved in the Shareholder’s Meeting on 29 April 2013, the acquisition and disposal of own shares. During 2013 the Company granted n. 168,000 own shares to some Company’s managers, in execution of the Long Term Incentive Plan for the 2010-2012 period. The proposed plan represents the re-iteration of the former one and comprises up to 10,480,000 ordinary shares of Esprinet S.p.A. with a nominal value of 0.15 euro each, or a maximum of 20% of share capital taking into account the own shares hold by the Company.

Esprinet 2014 Directors’ Report on Operations
30
Acquisition of 60% stake in Celly’s share capital
On 12 May 2014 Esprinet S.p.A. signed the agreement for the acquisition of a 60% stake in the share capital of Celly S.p.A., an Italian company active in the wholesale distribution of accessories for mobile devices. The aforementioned deal has been executed through a purchase of shares from former shareholders as well as company’s own shares and, ultimately, the subscription of a share capital increase. Total cash-out for Esprinet is 7.944 million euro, which corresponds to a pre-money equity value for 100% of share capital of 13.0 million euro. The binding agreement comprises a shareholders’ agreement with the owners of 40% of the capital, Stefano Bonfanti (20%) and Claudio Gottero (20% through GIR S.r.l.), aimed at establishing corporate governance rules along the investment period when the minority shareholders will co-manage the operations together with Esprinet. The way-out from investment is regulated through put/call options. Sale of 100% stake of the subsidiary Comprel S.r.l.
On 23 July 2014 Esprinet S.p.A. sold 100% stake in its subsidiary Comprel S.r.l., a leading Italian distributor of electro-components and subsystems, for a total value of 5.9 million euro paid in cash. On the same day the value of the Comprel subsidiary in the separated statement of Esprinet S.p.A. was 0.5 million euro, against an asset value of 6.2 million euro. Buyer is Melchioni S.p.A., one of the largest distributor of electro-components in the Italian market also operating in the supply of spare parts for the automotive industry, in ‘B2B’ distribution of professional electronics and ‘B2C’ distribution of consumer electronics and being active in the renewable energy market (photovoltaic and LED lighting). This transaction, as happened in February 2014 with the Monclick sale, represents a step forward in the process aimed at further focusing in the technology wholesale distribution business through maximizing ‘non-core assets’ value. Signing of a long term syndacated loan
On 31 July 2014 Esprinet S.p.A. signed an unsecured medium-term loan for a total maximum amount of 130.0 million euro split into a Term Loan Facility of up to 65.0 million euro and a Revolving Facility of up to 65.0 million euro with an expiry date fixed on 31 July 2019. Banca IMI S.p.A. both acted as Global Coordinator Bank and was, together with Unicredit S.p.A. and Banca Nazionale del Lavoro S.p.A., the Arranger and Bookrunner. Underwriters of the loan were primary banks as Intesa Sanpaolo S.p.A., Unicredit S.p.A., Banca Nazionale del Lavoro S.p.A., Banca Monte dei Paschi di Siena S.p.A., UBI Banca Soc. Coop. per azioni, Banco Popolare Soc. Coop., Caixabank, S.A., Cassa di Risparmio di Parma e Piacenza S.p.A.. These underwriters identified Banca IMI S.p.A.. as Agent Bank on behalf of the banking pool. Main purpose of the loan is to support Group’s financial needs by maintaining an adequate degree of stability and flexibility of the financial structure. Following the signing of the aforementioned term loan, in order to hedge the interest rate risk, on 22 December 2014 Esprinet subscribed bilateral “IRS-Intererest Rate Swap” agreements with each participating bank for notional amounts equivalent to those of the underlying loan.
Subsequent events
No significant events occurred after 31 December 2014.
Outlook
According to IMF’s predictions (source: WEO - World Economic Outlook, January 2015) the Eurozone should grow by +1.2% in 2015 as compared to 2014. In such a scenario, the consensus expects the Italian GDP to grow by +0.5%. Conversely, the Spanish economy should grow at a rate in excess of 2%. The Italian macroeconomic trend still appears as negatively affected both by the delay in the implementation of necessary structural reforms and the burden of public debt, despite favourable effects deriving from the decrease of oil price, further depreciation of euro against all major currencies and the “easing” monetary policy recently launched by ECB.

Esprinet 2014 Directors’ Report on Operations
31
Expected outperformance in Spain is mainly connected to both the early execution of labour market reform and a general enhancing of country competitiveness. As per the envisaged trend in IT spending throughout Europe – out of the relevant growth seen in 2014 in the traditional IT segment even thanks to the strong booster originated by the expiration of Microsoft Windows XP, prevailing sentiment remains positive although at a decelerating pace. Moreover the expected improvement in the macroeconomic scenario and more favourable access to bank lending should support technology spending both in the consumer and enterprise segment. In 2014 the Esprinet Group showed positive results, despite tough challenges to cope with. In the first ten weeks of the current year Group’s sales grew by +20% as compared to the same period of the previous year, being driven by the positive trend of Italian operations due to to a significant gain of market share. Nontheless expected ongoing pressure on gross margin is still there as it is related to both strong price competition and impact of unfavorauble re-mix in product families. For the current year managements expects to take advantage of the foreseeable growth of tech industry by capitalizing its strong focus on the ‘core business’ which will enable the best support to major vendors’ willingness to reduce the number of distributors or reinforce the use of the second-tier channel at the expense of direct sales. Esprinet’s market share should grow both in Italy and Spain, boosted by the commercial initiatives started in 2014 as well as by the positive contribute of less mature business segments (here including mobile phone accessories managed through the recent acquisition of Celly). All that said, subject to unforeseen event as well as the potential negative effect of current geo-political tensions (Ukrainian crisis, negotiations of Greece with European institutions), the Esprinet Group expects a significant revenue growth in the current year. Despite ongoing pressure on gross margin, mainly in the ‘traditional’ product families, the Group expects a positive operating leverage effect as the cost structure is under strict control and consequently a general increase in profitability.
Human Resources
Principles
Human resources are considered of primary importance in pursuing Group objectives. The Esprinet Group’s HR management and development model mainly aims to motivate and valorise all employees by enhancing their skills and according to its business development strategy. Although within a context where the rationalization of costs is paramount, these objectives are achieved, mainly, with the following instruments:
- training targeted and adequate to management needs; - selection of the best resources coming from the main national schools and universities and constant
attention to internal mobility; - a compensation system based on principles of selectivity and meritocracy linked to the achievement
of individual objectives. Employment
Compared to 31 December 2013 the number of employees of Esprinet S.p.A. decreased by No 4units, from 630 to 626. On May 2014 Celly SpA entered the Italian Group, with 73 employees. During the year Esprinet divested both Monclick S.r.l. and Comprel S.r.l.. In 2014 the average number of employees of Esprinet S.p.A. decreased by 3 units compared to the previous year, from 631 units in 2013 to 628 units in 2014. The trend of the Group employees in 2014 is represented as follows:

Esprinet 2014 Directors’ Report on Operations
32
ExecutivesClerks and middle
managementWorkers Total Average (1)
Esprinet S.p.A. 19 605 2 626 628
Comprel S.r.l. - - - -
Monclick S.r.l. - - - -
V-Valley S.r.l. - - - -
Celly S.p.A. 1 72 - 73
Subgroup Italy 20 677 2 699 710
Esprinet Iberica - 218 52 270 262
Esprinet Group 20 895 54 969 972
Esprinet S.p.A. 19 609 2 630 631
Comprel S.r.l. 2 55 - 57
Monclick S.r.l. 2 32 - 34
V-Valley S.r.l. - - - -
Subgroup Italy 23 696 2 721 723
Esprinet Iberica 1 207 46 254 250
Esprinet Group 24 903 48 975 973
Var Group 31/12/14 - 31/12/13 (4) (8) 6 (6) (1)
Var % -16,7% -1% 12,5% -0,6% -0,1%
31 December 2014
31 December 2013
(1)
Average of the balance at year-beginning and at year-end.
With reference to Esprinet S.p.A., considering some still open personnel researches at the end of 2014, the number of employee is stable compared to the same period in the previous year. With reference to Esprinet Iberica, an increase of the labour force (16 units) can be recorded compared to the previous year. This increase is mainly due to the hiring of personnel devoted to new projects and investments on specific business areas (mainly telephony and value products), to the increase of activities arisen from a greater turnover volume in the traditional business area, and to the substitution of absent employees, whose position must be preserved. The table below illustrates a definitely slightly lower turnover for Esprinet S.p.A. compared to the data of the preceding year. The actual increase for Celly at the aquisition date is equal to 10 units. The turnover of Esprinet Iberica is halved compared to the previous year.
Headcount at 31
December 2013Increase Decrease
Headcount at 31
December 2014
Esprinet S.p.A. 630 37 41 626
Comprel S.r.l. 57 1 58 (*) -
Monclick S.r.l. 34 2 36 (**) -
V-Valley S.r.l. - - - -
Celly S.p.A. - 78(***) 5 73
Subgroup Italy 721 118 140 699
Esprinet Iberica 254 54 38 270
Group 975 172 178 969
(*) Decreased by 57 due to the selling of the Company on 23 July 2014 (**) Decreased by 34 due to the selling of the Company on 28 February 2014 (***) Increased by 68 thanks to the acquisition of the Company on 12 May 2014
The table below highlights a constant predominance of women employees in the Group: 56.9% at 31 December 2014 and 55.3% at 31 December 2013. Analysing the situation in each subgroup we can remark that in Italy a substantial balance can be noticed (373 units on 699 units), while in Spain women employees are significantly predominant (178 units on 270 unit, 65.9%). At year-end graduates were 33.5% on the total of the Group, while the percentage of high-school leavers was 58.3%. Even at subgroup level, the percentage are stable for the two years analysed and compared.

Esprinet 2014 Directors’ Report on Operations
33
Italia Italy Spain
Esprinet
S.p.A.
Comprel
S.r.l.
Monclick
S.r.l.
V-Valley
S.r.l.
Celly
S.p.A.
Totale
Italia
Esprinet
Iberica
S.L.U.
Men 289 - - - 37 326 92 418 43,1% 436 44,7%
Women 337 - - - 36 373 178 551 56,9% 539 55,3%
Total 626 - - - 73 699 270 969 100% 975 100%
Graduation 198 - - - 16 214 111 325 33,5% 329 33,7%
High-School Cert 388 - - - 47 435 130 565 58,3% 574 58,9%
Secondary School Cert 40 - - - 10 50 29 79 8,2% 72 7,4%
Other - - - - - - - - - - 0,0%
Total 626 - - - 73 699 270 969 100% 975 100%
31 December 2014 31 December 2013
Group % Group %
Training
During 2014 the Group (Esprinet S.p.A., Celly and Esprinet Iberica) effected 14,212 training hours, in line with the hours effected in the previous year. In particular, 11,244 total training hours were effected in Italy, whose 866 hours related to health and safety at work and to the Legislative Decree 231. Also in 2014 the strong investment in training on MS continued, mainly on Excel (768 training hours effected). With reference to the linguistic area, new Spanish language training courses were introduced, for which 630 hours were effected. Regarding the English language, 2,739 hours were provided, continuing the weekly group training and workshop on several professional topics (“presentation skills”, “negotiation skills”, etc…) addressed to different categories of personnel, including the management. Full immersion courses in UK continued as well. During 2014 a new process of internal technical training – already started at the end of 2013 – was further implemented. It was addressed to the new employees and organised with the support of internal trainers (manager and operative employees); it aimed at developing and improving the skills related to the internal processes and company tools. The project involved 524 employees from Esprinet and Celly and 28 internal trainers, with a total amount of 1,833 hours effected. Further training courses were organised with external trainers, aimed at stabilizing the skills pertinent to the role and involved 176 employees, with a total amount of 2,276 hours effected. With reference to Celly, 2,132 training hours were effected, considering role training courses and outdoor activities. In Spain, during 2014, 2,968 training hours occurred, decreasing compared to 2013 due to the focus to the primary areas defined at the beginning of the year with the company management. The 2014 training programmes concentrated on the following areas: prevention of risks on workplace (1,399 hours), training in the linguistic area (754 hours dealing with learning and improvement of the English language), professional update (739 hours), and expertise development (76 hours). Recruitment
During 2014, the company continued the intense recruiting activity, begun in the previous years, aiming at including adequate resources to the required roles: high potential junior profiles, senior profiles, personnel with high level of specialized competences. For the recruitment of junior profiles Esprinet S.p.A. continued its collaboration with the main Milan University – especially with Bocconi, Cattolica University, Politecnico, and ‘Università degli Studi’ of Milan – and with specialized training companies as for exemple the “Civica Scuola Arte e Messaggio” in Milan, organising post high-school courses. A new collaboration started also with the University of Bergamo. During 2014, 47 interns were hired, 79% of which - with the exception of 21 units whose internship is still in progress and the interns that resigned during the on-the-job training - continued their cooperation with the company with a regular a labor contract.

Esprinet 2014 Directors’ Report on Operations
34
The Group still publishes the vacancies on the main on-line recruitment tools, and in the last months of 2014 prepared the basis for the Social Recruiting using LinkedIn. Head-Hunting Companies and Specialised Recruitment Agencies, as well as industry web platform are used for the recruitment of more technical profiles. With reference to the selection methods, the process generally consist on a first personal interview with the HR Department together with the reference line manage. In the event of a selection aimed at hiring neo-graduate employee, selection assessment centres are organised, that include company presentations, group tests, and the attendance of the Country Manager and of the Sales Managers as company testimonials. In Esprinet Iberica the recruitment activity in 2014, further intensified compared to 2013, was focused mainly on the selection of personnel with specific skills for the management of new business projects and on neo-graduate employees to be hired via internship agreements, in order to have a source of talented people to draw on for new positions or substitutions. The recruitment of young neo-graduates continues to be managed through the maintenance and development of existing agreements with the main Universities and Business Schools and other training bodies, both national and local (Universidad San Jorge, Kühnel, Esic, Montessori, etc…). Development and ‘compensation’
In terms of development, in the first months of 2014 the 2013 performance management process were concluded and stabilized, and involved all organisational structures of Esprinet Italy. More in details, the calibration meeting (discussion on results of the evaluation forms through 21 meeting organised with the department managers) and the feedback meeting (dealing with 520 employees) were organised. This process allowed to identify strengthens and weaknesses to be improved for each employee, planning ad hoc training courses, inter-departments job rotation, and professional growth process. In 2014, the compensation policy regarding variable incentives for the employees of Esprinet S.p.A. and Esprinet Iberica was based on the evaluation of the personal performance related to the achievement of personal objectives (80%), as well as company results (remaining 20%). With reference to the Management, the compensation policy was based only on the achievement of company targets. With reference to Celly S.p.A., the variable incentives policy depended on the evaluation of the performance related to the achievement of personal targets. In the Italian subgroup, the three-year (2012-2014) long-term compensation plan for directors and executives with strategic responsibilities will become exercisable with the ‘approval’ of the 2014 Consolidated Financial Statement. The corresponding accrued awards will be paid in May 2015. Organisation
Throughout 2014, the company developed its structures in order to make them more efficient and to meet the market needs more quickly. More in detail, the following organisational changes were realized:
Web Development & Design Corporate: three new organisational units were created, aimed at optimizing the activities of programming and graphics;
A new function was created (named “Cloud Marketing & Sales Department) in order to develop new commercial opportunity in the “Cloud” business
With reference to the Celly S.p.A., a new shop “Rosso Garibaldi” was open in November in the Milan area called “Bonola”.
With reference to Esprinet Iberica, a deep reorganisation of the Front Office area was effected in 2014. It began in March in the “Product Marketing” area, with the creation of three business macro-areas, and ended in October with the alignment of the sales structure. As a consequence of this process, the Front Office area is composed of the following five sales departments, devoted to specific customer/product cluster:
IT & Value Market Area – devoted on one hand to the continual development and strengthen of the traditional IT volume business (PC, notebook, tablet, peripherals, software etc…), both in the consumer segment and in the professional segment; on the other hand to achieve the growing target in the “Value” market (server, data storage, networking, video-surveillance, etc…) widening the brand portfolio managed by the Business Unit V-Valley.

Esprinet 2014 Directors’ Report on Operations
35
Components & Supplies Market Area – devoted to the development of the Components and Product Office business area.
Telephony and Consumer Electronica Market Area – devoted to the sale of the mobilephone devices and corresponding accessories, as well as to the development of the Digital Imaging, Games and Small Appliance business areas.
L&M Customers Sales – sales department focused on the customer segment Electro, IT Consumer, Sub Distribution, GD/GS and New Channels, with the addition of a new category management structure called “OK Retail”, aimed at managing services created to meet the needs of the “Retail” segment, as well as developing new business opportunity within the mass retail channel.
Specialized Channels – sales department includes the business segments of the companies characterised by a strong specialisation and/or focus necessary to implement the sales strategy. More in details:
- Office & Graphics; - Telephony; - Customer Development Sales.
Significant organisational changes were also implemented in the area devoted to special projects, in order to allow the company both to meet the market needs, and to be aligned with new projects development. Hiring of people with disabilities
The agreement between Esprinet S.p.A. and the Province of Monza and Brianza concerning the hiring of disabled people terminated in 2014 being the Company fully compliant with current legislation on the matter. The agreement between Celly SpA and the Province of Monza and Brianza is on the contrary still valid. In compliance with Law No. 68/99 regarding the hiring of disabled people in the workplace in Italy, Esprinet S.p.A. continued to avail themselves of the possibility of partial exemption by payment of a quota to the Regional Fund for the Employment of the Disabled. Esprinet S.p.A. also used the ‘LIFT Plan’ of the province of Monza and Brianza, which consists of the out-of-pocket incentives proportional to the disability type and to the agreement type in the event of disabled employee being hired, and used other incentives as provided for by ex art.13 Law 68/99. In 2014 Esprinet Iberica fully complied with the law governing the compulsory hiring of disabled people without any recourse to alternative solutions regarding the failure to insert disabled people.
Health, safety and environment
General principles and actions undertaken
The respect for the environment and the protection of health and safety at work has always been at the basis of Esprinet Group operations. It is the Group’s precise intention to further maintain, consolidate and improve the leadership position won in its own sector, by continuing to propose innovation in processes and in service to its customers and by simultaneously paying constant attention to safety, to individuals’ and collective health by respecting the law and the surrounding environment. In order to achieve these objectives, the Group has established, documented, implemented and maintained an Integrated Environment, Health and Safety Management System in the workplace. Esprinet S.p.A. and the subsidiary Esprinet Iberica have the Quality Certification (ISO 9001), the Environment Certification (ISO 14001) and the Safety on workplace (OHSAS 18001) whereas Celly S.p.A. has only the Quality Certification. During 2014 all the above said companies received the renewal of Certifications by BSI, international certification company. The following is a list of the tools considered essential for:
the pursuit of continuous improvement;
the reduction of accidents and illnesses in the workplace;
the minimisation of environmental impact caused by the Group’s activities.

Esprinet 2014 Directors’ Report on Operations
36
Training and involvement
The Group is aware of the role of primary importance played by staff and it is therefore strongly committed to promoting the active involvement, responsibility and professional growth of them. The constant activity of information and training is fundamental, in order to sensitise the personnel on environmental and safety topics, and on the importance of the contribution of each individual regarding the prevention and improvement of the general conditions of the safety at work and of the environmental efficiency of the company. Identification and evaluation of risks in the workplace and the environmental impact of operations The Esprinet Group defines the criteria and method for the continual evaluation of the main environmental aspects, of the risk of misfortune and danger, and of the identification of the corresponding impact. The latter are periodically verified compared to the forecasted objectives, which are defined, monitored, and updated for their continuous improvement. Compliance with laws and other regulations
Compliance with laws and regulations issued to protect workers’ health and safety and for the respect of the environment are values inseparable from the Group’s strategic action. Concluding conduct
The correct management, maintenance and regular checking of plants and equipment is one of the ways that the Group runs ‘health, safety and environmental’ policies together with checks on any possible use and/or disposal of chemical preparations or compounds whether dangerous or otherwise. This is also outsourced to qualified suppliers accurately selected for their technical/professional expertise and for their products and services which significantly eliminate or reduce the environmental, health or safety risks. These are just some of the methods used by the Group to implement its ‘ environment, health and safety’ policies. The Group is also engaged in minimising the consumption of natural resources (electricity, gas, water) and of waste production, encouraging recycling where possible. Effective communication
The Group recognises the importance of the role of ‘communication’ for all interested parties (personnel, suppliers, contractors and sub-contractors) as the basic element for managing responsibility correctly within the health, safety and environmental protection context. Audit
Both internal and external audits are an effective tool. They form the basis of company culture and are what determine the performance checks and supervision, including that regarding health, safety and environment. Membership of waste disposal consortia
Esprinet S.p.A. is member of the Raecycle consortium whereas Celly S.p.A. is member of the Remedia consortium. Both the consortium manages ‘end of life’ products defined by the regulation regarding the disposal of electric, electronic, cells and batteries waste. Esprinet Iberica, the Spanish subsidiary, is a member of the Ecotic, Ecopilas and Ecoembes consortia and of the Erp, Ecophilas and Ponto Verde consortia in the case of Portuguese operations. Italian companies have also adhered to SISTRI (the waste traceability checking system), founded in 2009 by the Ministry for the Environment and Protection of Land and Sea for computerizing the whole special waste production chain nationally.
Disclosure as per Legislative Decree 32/2007 and its interpretation In the case of the document approved on 14 January 2009 by the National Council of Accountants and Accounting Experts (Cndcec), aimed at supporting the first application of Legislative Decree 32/2007 concerning information regarding the environment and staff, the following has to be noted.

Esprinet 2014 Directors’ Report on Operations
37
‘Compulsory’ disclosure
In the case of staff, during the year no deaths, or serious or very serious accidents, or professional illnesses reported by employees or ex-employees, or ‘mobbing’ trials, where the companies of the Group were found guilty definitively, occurred.
In the case of the environment, during the year no significant damages to the environment, or fines or definitive penalties were charged to the company for environmental crimes or damages, nor was any emission of greenhouse gasses reported. ‘Voluntary’ disclosure
In the case of staff, the section ‘Human Resources’ and the ‘General principles and action undertaken’ of this chapter provide a complete picture of the policies pursued. The ‘pure’ IT products distribution activities (hardware, software and services) and consumer electronic products, undertaken at the three main sites at Cambiago and Cavenago in Italy (approx. 56.000 sqm), and at Zaragoza in Spain (approx. 22.000 sqm), do not create any special problems for the environment, Nevertheless the Group constantly monitors the use of energy at its various premises and has adopted strict disposal procedures for any type of waste.
Main risks and uncertainties facing the Group and Esprinet S.p.A.
Risks classification
Esprinet Group and Esprinet S.p.A. activities are exposed to risk factors able to influence their economic and financial situation. Esprinet S.p.A. and the Esprinet Group identify, assess and manage risks in compliance with internationally recognised models and techniques such as ‘Enterprise Risk Management - Integrated Framework (CoSo 2)’. Since 2009 the Group adopted an operative and organisational framework able to manage risks and monitor its adequacy in time (the so-called ‘ERM-Framework’). It hinges on the methodological model for the creation of an effective ‘risk management’ system able to involve the actors in the internal audit system at various levels, who are charged with different key roles according to the various control activities. The identification, assessment, management and monitoring system of the company’s main risks is based on a process which involves the performance of the following tasks, at least annually: - risk scoring and risk assessment of the main company risks; - identification of ‘risk management’ priorities; - identification of a ‘risk strategy’ and its transfer into action plans orientated to strengthening, improving
and monitoring the checking facilities of the risks identified. The ultimate purpose of the system described is to maintain the risk level within the acceptability threshold defined by the administrative body and supply reasonable support to the furtherance of company objectives. During 2014 the operational action plan, including an audit plan and a plan of measures aiming at improvements in the case of priority risks, has effectively checked on. The risk classification is based as follows: - strategic risks - operational risks - compliance risks; - financial risks; The annual revision of the company’s main risks has substantially confirmed the existing map of the risks. The following is a brief description of the main risks, these last assessed without taking into consideration the response actions put into force or planned by the Group to bring the seriousness of the risk within acceptable levels.

Esprinet 2014 Directors’ Report on Operations
38
Strategic Risks
Inadequate response to unfavourable macro-economic scenarios
The Group’s economic and financial situation is influenced by various factors which make up the macro-economic contexts of the markets where the Group operates. These include, but not only, GDP performance, consumer and business confidence levels, the inflation rate, interest rate trends, the cost of raw materials prime and unemployment rates. In 2014 overall the European Distributors market grew by +8% compared to 2013, with Italy and Spain achieving respectively +12% and +24%. The trend of the last quarter of 2014 shows a growth by +9% in the European market and by +13% in Italy and +30% in Spain respectively. Based on these results analysts forecast a positive 2015 even if a lower rate in the growth trend could occur. However, the performance of the market could not follow the expectations of the analysts and should these expectations not realize, the financial assets, economic, and financial situation could be negatively influenced. Inadequate response to customers’ and suppliers’ demands
Due to its intermediary role within the IT production chain, the Esprinet Group’s success largely depends on its ability to address, interpret and meet customers’ and suppliers’ demands. This ability translates into a value proposition both at the source and later on in the sales process which differentiated itself from the competition through its adequate and historically superior profitability conditions compared both with its direct and indirect competitors. Should the Esprinet Group be unable to maintain and renew this value proposition, that is, to develop more innovative offers and competitive services compared than those of its main competitors, the Group’s market shares could fall significantly causing a negative impact on its economic and financial position. Competition
The nature of the Group’s trade brokering activities means it operates in highly competitive sectors, both in Italy and in Spain. The Group has therefore to operate in a highly competitive context and to compete in the various geographical markets against both strongly rooted local operators and multinational companies significantly larger than the group and with considerably greater resources. Competition in the IT distribution and electronic consumables sector, the Group's main activity, is measured in terms of prices, availability, quality and variety of products and associated logistic services and pre and after-sale assistance. The degree of competition is also heightened by the fact that the Group acts as a broker between the large world-wide suppliers of technology and resellers of IT/electronic consumables, which include operators with high contractual power, including the major retail chains, often with the potential to open supply chains directly with the producers. The Group also competes with multinational groups of extremely high financial standing, both in Italy and in Spain. Should the Esprinet Group be unable to deal effectively with the external situation in question there could be a negative impact on the Group’s prospects and operations, as well as on its economic results and financial position. Moreover, the Group is also exposed to competition from alternative distribution models, whether current or potential, such as those based on direct sales to the user by the producer, even if all the limits of these alternative distribution models have been revealed during the last two-year period. If the ‘de-intermediation’ situation, already affecting the Group in the markets where it operates, accelerates in the next years, even though not caused by any empiric or economically rational facts, the Esprinet Group could suffer negative repercussions on its economic and financial position. Price changes
The technological sector is typified by a deflationary price trend linked to high product obsolescence and strong market competition, besides mainly economic factors linked to changes in the value of the USA dollar and the Chinese currency, which are the two main functional currencies for IT products.
Esprinet 2014 Directors’ Report on Operations
39
The Group is therefore exposed to the risk of falls in IT and electronic product unit prices, if the gross profit margin formed by the difference between the sales prices to retailers and purchasing costs applied by suppliers falls in absolute value when prices applied to the end consumer are lowered. This occurs since it is difficult to pass the higher costs caused by the lowering of prices on to customers in a sector as highly competitive as the distribution sector. Despite the fact that this risk is lessened by the Group's capacity to limit overheads/fixed costs levels and productivity standards at various levels, thus reducing process costs chiefly linked to physical drivers (e.g. number of transactions, number of products moved in warehouses or forwarded by courier), and despite the fact that the percentile value of the gross sales margin is to some extent independent of reductions in the single prices of products, it is not possible to provide assurances regarding the Group's ability to deal with the technological sector’s deflation rates Business combinations
As an integral part of its strategy for growth, the Group periodically acquires assets (divisions of a company and/or company shareholdings) which are highly compatible in strategic terms with its own area of business. Such operations, as any other future operation of the same type, run the risk of not being able to activate expected synergies either fully or in part, that is the risk that the explicit and/or implicit costs of integration might outweigh the benefits of the acquisition. Integration problems are increased by the fact that the companies acquired have to operate in countries and markets other than those where the Group has always operated and which involve specific business and regulatory issues different from those met with so far by the Group. Such problems arise from the need to align them to standards and policies mainly regarding internal auditing, reporting, information management and data protection procedures, besides to the implementation of suitable coordination and organisational mechanisms between the companies acquired and the rest of the Group. Therefore it is impossible to give any guarantees about the Group’s future success in concluding further acquisitions, neither to maintain the competitive positioning of purchasing target and neither to favourably repeat the proper business model and proposal system.
Operating risks
Dependency on IT systems
The Esprinet Group is strongly dependent on its IT systems in the performance of its activities. In particular, the viability of its business depends to some extent on the capacity of the IT systems to store and process enormous volumes of data and guarantee elevated standards of performance (speed, quality, reliability and security) that are stable over time. The critical nature of the IT systems is also heightened by the fact that the Group, because of its business model, relies on Internet for a consistent part of its business, both as an instrument for the transmission of information to its clients, and order-processing and marketing intelligence. Other critical factors are the connections in EDI mode to the IT systems of many vendors, as well as the remote connection to the cash & carry network active in the country. The Group has invested remarkable resources in the prevention and mitigation of risks linked to its dependency on IT systems and in the improvement of the IT security level (such as the continual maintenance of the hardware installed and the updating of the relative software, the stipulation of insurance policies against damages caused indirectly by possible system crashes, the housing of the data centre in safe environments, the construction of anti-intrusion and anti-virus defences, the continual backup of memory-resident data, the provision of business continuity and disaster recovery plans and the execution of ‘shutdown and restart tests on redundant systems’). Despite this, the possibility that the Group might have to suspend or interrupt its sales activities due to systems malfunctioning or actual black-outs cannot be totally excluded. It is similarly impossible to guarantee that the IT systems of companies and/or businesses acquired will satisfy the Group’s minimum reliability and safety requirements at the time of the acquisition. Medium-/long-term interruptions of logistics chain
The Group’s sales activities strongly depend on the correct functioning and efficiency of the logistics chain, thanks to which the products are able to reach their reference markets.

Esprinet 2014 Directors’ Report on Operations
40
These logistics chains have reached high levels of complexity and the journey of the goods from the factories where the IT and electronic products sold are produced to the end customers could be subject to interruptions due to natural, political and operational events such as natural disasters, changes in trade relations between governments, trade restrictions and embargoes or operators’ financial soundness in the various transport and storage stages. Any unfavourable events in these areas are likely to cause long-term interruptions, which could have a significantly negative impact on the Group’s prospects and financial position. Dependency on suppliers and risk of non-observance of extra-contractual agreements
Overall, the Group has direct contacts with about 200 leading vendors of technology, including IT, electronic consumables and micro-electronic components vendors. The Group has always focused on the distribution of branded goods, earnings from the sale of own-brand products (accessories, consumables, Nilox and Celly micro-computer components) being negligible. In most cases, trading contacts with the vendors are governed by contracts and/or agreements generally renewed every year. Despite the high number of vendors in its portfolio, the Esprinet Group presents a certain degree of risk concentration in that the incidence of the first 10 suppliers, accounted for over 74% of consolidated sales (71% in 2013). A consequence of this situation is that the Group is exposed to the risk of the non-renewal of current distribution contracts and/or inability to replace these contracts effectively. The Group is also exposed to the risk of significant changes in the terms and conditions of contracts drawn up with vendors, particularly regarding amounts regarding premiums for the attainment of targets, or the very level and nature of these targets, the sums for co-marketing and development, the policies for protection of the economic value of the stock and commercial returns, payment terms and associated discounts. These variations, if negative, are likely to have a negative impact on the assets and on the Group's economic and financial results. Traditionally, however, the Group has been able to negotiate contractual conditions with its counterparts providing a long historical series of positive economic results. The degree of partnership attained with the majority of its suppliers also laid the foundations for significantly consolidated collaborations with the most important suppliers over the years, something also due to the use and maintenance of direct communication channels. Dependency on suppliers of critical services
The Group’s logistics model is based upon the direct warehousing handling and collections and the outsourcing of haulage and delivery services. These activities are of critical importance to the value chain for IT and electronic consumables distributors. In the case of the first of the activities mentioned, the Group makes use of two porters' co-operatives in Italy. Transport activities are contracted out, both in Italy and in Spain, to independent outside shippers. The interruption of contractual relations with the above-mentioned suppliers of services, or a significant reduction in the level of quality and efficiency of the services provided, could have a significant negative impact on the Group's economic and financial results. These suppliers and the relative industry are continually monitored in order to mitigate any related risk. Low profit margins
The result of the high level of competition to which the Group is submitted is a low profit margin (gross trading margin and net operating result) in relation to earnings. These low margins tend to amplify the effects of unexpected variations in sales levels and operating costs on profitability that can be also negatively impacted from any incorrect decisions concerning the products ‘pricing’ and the management of discount policies. It is impossible to guarantee that the Group will also be able to manage its ‘pricing’ policies with the same care and prudence in the future, in difficult economic situations. Product margins and customers and the search for the best mix in suppliers and clientele are continually monitored, however, in order to mitigate any possible related risk.
Esprinet 2014 Directors’ Report on Operations
41
Reduction in value of inventory
The Group is subject to the risk of a reduction in the value of unsold stock as a result of lowered list prices on the part of vendors and economic or technological obsolescence. it is usual within the sector for the vendors to set up forms of total and/or partial protection, contractual or otherwise, of the financial value of stock in the above-mentioned cases for the benefit of the distributors with direct supply contacts. Nevertheless, cases of non-fulfilment on the part of the vendors or the failure to activate non-contractual protection can occur. Further, these protective clauses also come into force solely under certain conditions and are therefore totally controlled and by purchase planning ability in function of market potentiality. It is not possible to give guarantees regarding the Group’s future ability to manage stock levels so that even limited risks of stock devaluation are avoided, or failure to activate the contractual protection provided in the case of the majority of the product suppliers. The main risk mitigation methods depend on the constant ability to minimise stock levels also due to the support of expert inventory management and demand planning systems based on availability indicators and consequently customer satisfaction, together with the constant monitoring of existing contractual agreements, in terms of the consolidated practice of the sector which traditionally believes that suppliers are also likely to protect the value of stock. Dependency on key managers
The activity and development of the Esprinet Group is characterised by a significant dependence on the contribution of some key management staff, particularly that of the Chief Executive Officer, other executive Directors, and of the ‘front line’ management and/or heads of functions acting in the geographical markets where the Group operates: Italy and Spain. The Group’s success therefore depends to a large extent on the professional and personal ability of such key figures. The loss of the services of some of the managers without any suitable replacement, together with the inability to attract and keep new qualified resources, could therefore have negative effects on the Group’s prospects, operations and financial results. The main methods used by the Group to deal with the risk in question comprise professional development and employee retention policies. The latter are part of a compensation system which includes the use of long-term incentive plans as well as continual training activities. Physical destruction of company assets and products assigned for sale
Premises and products stored in warehouses are subject to risks linked to events such as earthquakes, floods, fire, theft and destruction. These events could cause a significant fall in the value of the damaged assets and an interruption in the Group’s operational ability, even for extended periods of time. In the impossibility of excluding such events occurring and the damage caused by the same, and while bearing in mind the management and mitigation policies for these risk categories in terms of physical safety and fire prevention basically effected by transferring the risks to insurance companies, no guarantees regarding the negative impacts that could affect the Group’s the financial position can be given. Fraud perpetrated by employees
Bearing in mind the high number of transactions effected, the intensive use of IT systems both for operations and for interfacing with customers and suppliers, besides the high unit value of some transactions, significant economic damage could be generated by disloyal employees’ conduct. The Esprinet Group is committed to reducing the likelihood of such fraudulent conduct occurring by means of duty segregation techniques, IT systems access management, the introduction of procedures and checks and the circulation of the code of ethics. However, it is not possible to give any guarantees about unfavourable impacts on the Group’s financial position which could derive from fraudulent activities of the kind described.
Esprinet 2014 Directors’ Report on Operations
42
Reliability of the administrative-accounting system
Strategic and operational decisions, the planning and reporting system, as well as the process of external communication of data and economic and financial information is based on the reliability of the administrative-accounting information generated and processed within the Group. The correctness of this information also depends on the existence of organisational procedures, rules and organisation, on employees’ professional expertise and on the effectiveness and efficiency of IT systems. The Group is committed to maintaining a high level of control over all the procedures that generate, process and circulate economic and financial information. These procedures and the underlying IT systems are subject to regular audits and checks by various actors of the Internal Audit System and are constantly updated even when solutions to ‘Non Conformity’ situations have been applied.
Compliance risks
The Esprinet Group is exposed to the risk of violating numerous laws, rules and regulations, including tax laws, which govern its operations. Legal and tax disputes
As of the drafting date of these financial statements some legal and tax disputes involving some of the companies within the Group are still pending. These could potentially influence the economic and financial results. Although the sums paid into the relative risk provisions are deemed sufficient to cover any liabilities arising from pending disputes, it cannot be excluded that in the case of a negative result being worse than expected, a negative effect may reflect on the Group's economic, asset and financial results. Legal disputes
The type of legal disputes to which the Group is exposed can be divided essentially into two main groups: disputes of a commercial nature (having as the object the nature and/or quantity of goods supplied, the interpretation of contractual clauses and/or the supporting documentation) and other of various kinds. The risks associated with the first type of dispute are the object of accurate monthly analyses together with the Group's legal advisors and the consequent financial impacts are reflected in the Bad debt provision. The ‘other disputes’ refer to various types of claims made against companies within the Group due to supposed infringements of laws or contracts. The risk analyses are undertaken periodically together with the external professionals appointed for the task and the consequent economic impacts are reflected in the Provision for risks and charges. Tax disputes
It cannot be excluded that the Group may have to pay liabilities as a result of tax disputes of various kinds. In such case the Group could be called on to pay extraordinary liabilities with consequent economic and financial effects. The risk analyses are undertaken periodically together with the external professionals appointed for the task and the consequent economic impacts are reflected in the Provision for risks and charges. For risks and the main developments of disputes in course please see the item ‘Non-current provisions and other liabilities’.
Financial risks
Esprinet Group’s activities are exposed to a series of financial risks able to influence its financial assets, profits and cash flows through their impact on existing financial operations. These risks may be summarised as follows: a) credit risk; b) liquidity risk; c) market risk (foreign exchange risk, interest rate risk and other price risks). The overall responsibility for the creation and supervision of a financial risk management system for the Group is, within the Internal Control System, up to the Board of Directors, to which the various organisational units responsible for actually managing the single types of risk report. These units, substantially belonging to the Finance and Treasury departments, within the guidelines traced out by the Board in the case of each specific risk, define the instruments and techniques necessary for the
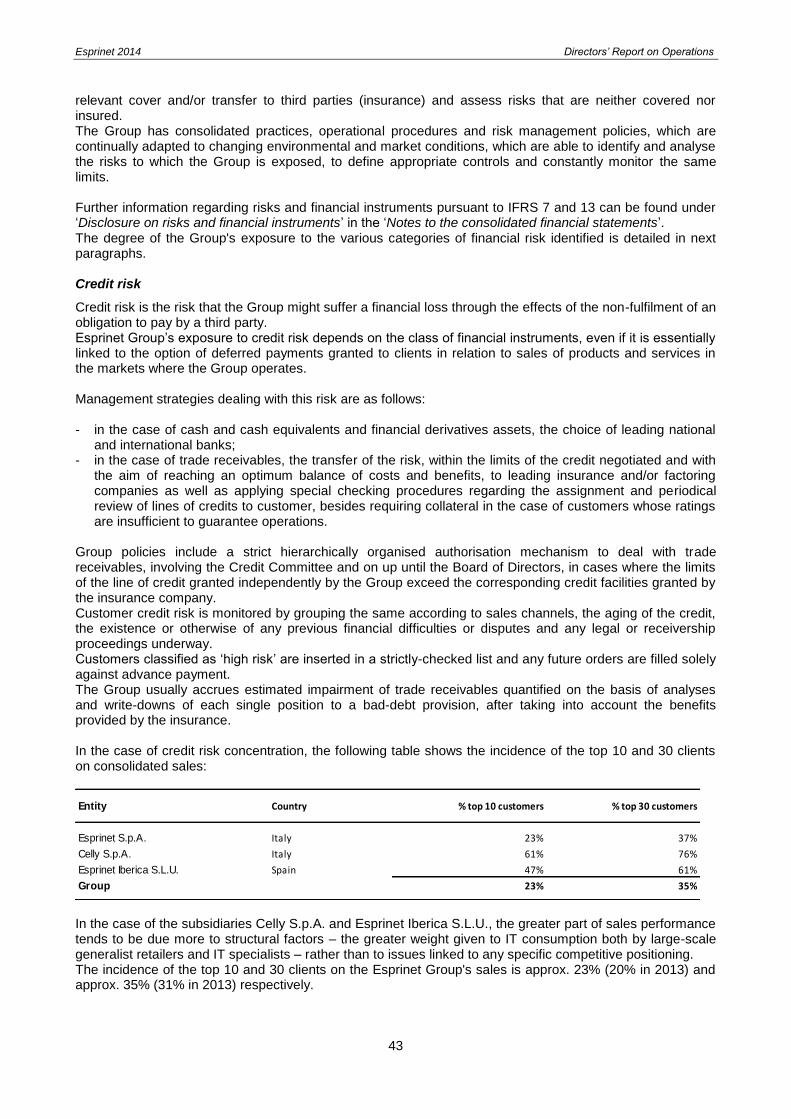
Esprinet 2014 Directors’ Report on Operations
43
relevant cover and/or transfer to third parties (insurance) and assess risks that are neither covered nor insured. The Group has consolidated practices, operational procedures and risk management policies, which are continually adapted to changing environmental and market conditions, which are able to identify and analyse the risks to which the Group is exposed, to define appropriate controls and constantly monitor the same limits. Further information regarding risks and financial instruments pursuant to IFRS 7 and 13 can be found under ‘Disclosure on risks and financial instruments’ in the ‘Notes to the consolidated financial statements’. The degree of the Group's exposure to the various categories of financial risk identified is detailed in next paragraphs. Credit risk
Credit risk is the risk that the Group might suffer a financial loss through the effects of the non-fulfilment of an obligation to pay by a third party. Esprinet Group’s exposure to credit risk depends on the class of financial instruments, even if it is essentially linked to the option of deferred payments granted to clients in relation to sales of products and services in the markets where the Group operates. Management strategies dealing with this risk are as follows: - in the case of cash and cash equivalents and financial derivatives assets, the choice of leading national
and international banks; - in the case of trade receivables, the transfer of the risk, within the limits of the credit negotiated and with
the aim of reaching an optimum balance of costs and benefits, to leading insurance and/or factoring companies as well as applying special checking procedures regarding the assignment and periodical review of lines of credits to customer, besides requiring collateral in the case of customers whose ratings are insufficient to guarantee operations.
Group policies include a strict hierarchically organised authorisation mechanism to deal with trade receivables, involving the Credit Committee and on up until the Board of Directors, in cases where the limits of the line of credit granted independently by the Group exceed the corresponding credit facilities granted by the insurance company. Customer credit risk is monitored by grouping the same according to sales channels, the aging of the credit, the existence or otherwise of any previous financial difficulties or disputes and any legal or receivership proceedings underway. Customers classified as ‘high risk’ are inserted in a strictly-checked list and any future orders are filled solely against advance payment. The Group usually accrues estimated impairment of trade receivables quantified on the basis of analyses and write-downs of each single position to a bad-debt provision, after taking into account the benefits provided by the insurance. In the case of credit risk concentration, the following table shows the incidence of the top 10 and 30 clients on consolidated sales:
Entity Country % top 10 customers % top 30 customers
Esprinet S.p.A. Italy 23% 37%
Celly S.p.A. Italy 61% 76%
Esprinet Iberica S.L.U. Spain 47% 61%
Group 23% 35%
In the case of the subsidiaries Celly S.p.A. and Esprinet Iberica S.L.U., the greater part of sales performance tends to be due more to structural factors – the greater weight given to IT consumption both by large-scale generalist retailers and IT specialists – rather than to issues linked to any specific competitive positioning. The incidence of the top 10 and 30 clients on the Esprinet Group's sales is approx. 23% (20% in 2013) and approx. 35% (31% in 2013) respectively.

Esprinet 2014 Directors’ Report on Operations
44
Liquidity risk
Liquidity risk is the risk the Group may encounter difficulty in meeting obligations associated with its financial instruments. The policy is therefore one of maximum prudence to avoid, at the occurrence of unexpected events, to have to sustain excessive charges or even see one’s reputation compromised in the market. The Group's policy essentially involves cash flow planning activities and the maintenance of consistent amounts of unused lines of credit in Italy and in Spain of a mainly self-liquidating nature, aided by a conservative financial policy favouring stable financing sources also to finance working capital. As at 31 December 2014 the Group had unused credit lines of 257 million euro (266 million euro at 31 December 2013), or approx. 72% (approx. 86% as at 31 December 2013) of the total of the existing credit lines. The availability of unused credit lines did not cause any specific charges.
The Group’s financial needs are largely covered by a Senior Loans of 5-years duration. This Loan is one of the pillars of the liquidity risk management and is subject to the strict observance of some covenants the non-compliance with which gives the issuing pool of banks the right to demand the immediate reimbursement of the same loan. As at 31 December 2014, according to management estimates as is clearer in the next paragraph ‘Loans and loan covenants’ under ‘Other significant information’ in the ‘Notes to the consolidated financial statements’, such covenants have been fully met. While the existence of a covenant structure allows the Group to dispose of a stable funding structure not subject to any cancellation and/or unilateral downsizing as per international contractual practice, on one hand, on the other it introduces elements of instability linked to the possible violation of one or more of the threshold financial parameters, failure to observe which exposes the Group to the risk of the advance reimbursement of the borrowed sums. In fact the Group regularly effects stress tests simulating situations which would arise in the case of violations of the parameters and the consequent obligation of advance reimbursement of the senior loans. Bearing in mind its increasingly high equity and unusual sources-uses structure, the most recent simulations have resulted in favourable outcomes regarding the Group’s ability to make up for the loss of the senior loans by drawing on the unused short-term reserves of mostly self-liquidating loans. Market risk: the currency risk
Currency risk is the risk of fluctuations in the value of a financial instrument as a result of variations in foreign exchange rates. In this regard, it should be noted that only a residual part of the products purchased by the Esprinet Group are expressed in currencies other than euro. During 2014 these purchases were mainly in US dollars and amounted to 3.1% of the Esprinet Group’s total purchases (3.0% in 2013). The possibility that parity of exchange - and the euro/USA dollar in particular– may be modified in the period running between the time of invoicing in foreign currency and the time of payment, determines the Group’s exposure to foreign exchange risk. Given that the Group has no other financial assets and liabilities or loans in foreign currency, its exposure to this type of risk is limited. Given the potentially modest impact involved, the policy adopted so far has consisted in the restraint of such risk type, without the activation of any specific form of cover, especially through the use of hedging instruments. Market risk: the interest rate risk
Interest rate risk comprises the risk of fluctuations in the fair value and/or in the future cash flows of a financial instrument as a result of variations in market interest rates. All of the loans obtained by the Esprinet Group provide for index-linked interest rates based on referential rates, and in particular on the ‘Europe Interbank Offered Rate’ or Euribor. The Group, as a result of analysis on the amount and composition of the Group indebtedness, can decide to totally or partially hedge itself against the interest rate risk on the loans. The aim of the hedging activity regarding interest rate risk is to fix the funding cost of the middle-term floating-rate loans (hedged items).

Esprinet 2014 Directors’ Report on Operations
45
During 2014 this result was achieved by entering in eight ‘IRS - Interest Rate Swap’ contracts (hedging instruments), signed with the same banks lenders of the medium/long-term loan hedged, that enabled the Group the floating rate to be received and the fixed rate to be paid on the 100% of its loan’s principal. These hedging transactions qualify for cash flow hedge accounting and are so recognised in the consolidated financial statements. Market risk: the other price risks
Other price risks include the risk of fluctuations in the fair value of marketable securities due to variations in the market price arising both from specific factors related to the individual security or its issuer and from factors able to influence the total securities traded in the market place. The Esprinet Group does not own any securities negotiable in active markets and consequently is not exposed to this type of risk in any way.
Other important information
1. Research and development activities
The research and development of Edp and Web activities are related to the definition and planning of new processes and services referred to the IT platform used by the Group, which is at customers and suppliers disposal for information communication as well as for the management of sales and purchase orders. These costs were entirely recorded in the current financial statement, mainly in the corresponding personnel costs figures.
2. Number and value of own shares
From the original 1,350,000 shares purchased in 2007 (as per the assembly resolution on 26 April 2007) and partially allocated (168,600) on 3 May 2013 as per the Long Term Incentive Plan approved on 27 April 2010, at the date of this Report Esprinet S.p.A holds 1,181,400 own shares, representing 2.25% of the share capital.
3. Relationships with related parties
The related parties of the Esprinet Group have been defined as per IAS 24. Group operations with related parties were effected in compliance with current laws and according to mutual economic advantage. In case of products sold to individuals, these sales are made under the same conditions as those usually applied to employees. During the year relationships with related parties consisted essentially in the sales of products and services at market conditions, including the leasing of real estate, between Group’s entities and associates or companies where the key management personnel of Esprinet S.p.A. - shareholders or directors or key manager - play important roles. Greater details of these operations, the total value of which is not material compared with the total volume of the Group’s activities, can be found under ‘Relationships with related parties’ in the ‘Notes to the consolidated financial statements’. Relationships with key managers result from the recognition of the payments for services rendered by the same, the quantification of which can be found under ‘Emoluments to board members and key managers’ in the ‘Notes to the consolidated financial statements’. In the case of Consob Regulation No. 17221 of 12/03/2010 and successive amendments and supplements, please note that Esprinet S.p.A. approved and implemented the management procedure regarding operations with related parties, further details of which may be found in the ‘Esprinet S.p.A Corporate Governance Report’. This procedure is similarly available at www.esprinet.com, under Investor Relations.

Esprinet 2014 Directors’ Report on Operations
46
4. Business combinations
Acquisition of Celly Group
On 12 May 2014 Esprinet S.p.A., consistently with strategic process aimed at focusing on core business and penetrating high-profitability segments, finalized the acquisition of a 60% stake in the share capital of Celly S.p.A., an Italian company active in the wholesale distribution of accessories for mobile devices. The acquisition perimeter includes Celly S.p.A. as well as its wholly-owned subsidiaries: - Celly Nordic OY, a Finnish-law company; - Celly Swiss SAGL, a Helvetic-law company; - Celly Pacific LTD, a Chinese-law company, completely owned by Celly Swiss SAGL; all of which are operating in the same segment as the Holding Company, as well as Celly’s 25% share in Ascendeo SAS, a French company active in the international distribution of Blackberry branded products. Esprinet S.p.A. and Celly non-controlling shareholders mutually granted put/call options on the residual 40% of Celly’s shares, substantially symmetric as the exercise terms for both the put and call options are fundamentally identical, simultaneously exercisable by/toward the minority stockholders between the 5
th and 7
th
year after the signing date. The option terms thus imply that Esprinet and the Celly minority stakeholders participate to a synthetic forward contract, whose underlying is represented by the 40% share of Celly S.p.A. capital. The consolidation of Celly Group, accounted for using the ‘acquisition method’, resulted in a goodwill not deductible for tax purposes, equal to 4.1 million euro arising from the difference between the acquisition spot price (7.9 million euro) and the fair values of the identifiable assets and liabilities of the above mentioned company, as summarised in the following table:
(euro/000)Fair value Group
Celly
12/05/2014
Fixed, intangible and financial assets 876
Deferred income tax assets 923
Receivables and other non-current assets 37
Inventory 6,544
Trade receivables 4,550
Other current assets 1,086
Cash and cash equivalents 2,178
Income tax liabilities (193)
Other non-current liabilities (850)
Trade payables (1,058)
Other current liabilities (1,204)
Short-term financial liabilities (6,570)
Net assets fair value 6,319
Interest of minority shareholders: 40% (2,528)
Net assets fair value relating to Esprinet shareholders 3,791
Provisional goodwill (1)
4,153
Cash paid 7,944
Potential compensation on the residual 40% 10,135
Potential compensation discounting (444)
Potential cost of the total acquisition 17,635
(1) Goodwill amount subject to adjustment within 12 months from the transaction date as permitted by the accounting standard IFRS 3.
The acquisition contract provides for the usual guarantees granted by sellers with reference to the subsequent potential liabilities due to events happened before the transaction date and not known at that date. As no significant or measurable surpluses have been identified from the acquired activities, the exceeding amount paid in comparison with the value of the acquired equity share was completely allocated to ‘Goodwill’ since this represents the capability of generating earnings and cash flows expected from the acquired business segment and from the potential synergies arising from the deal.

Esprinet 2014 Directors’ Report on Operations
47
The option potential compensation relating to the residual 40% of Celly S.p.A. share capital was recorded at its net present value, in the financial liabilities toward shareholders as well as in reduction of the Group net equity value. Such reduction only affected Esprinet Group net equity value without impairing the non-controlling interests equity since the latter did not transfer to Esprinet the benefits resulting from the minority interests ownership; in fact the option strike price was based on Celly’s forecasted revenues and net financial position and besides no restrictions were provided for as to dividend distribution during the period preceding the option exercise maturity date. The fair value of the accounts receivable, all of a short-term nature, represents the estimated value recoverable from the customers and takes into account 0.6 million euro accrual to bad debt provision. Transaction costs, estimated in 0.2 million in 2014, were recorded in the income statement as ‘overheads and administrative costs’ and were included in the operating activities section of the cash flow statement to which reference is made. As reported in the following table, the net cash flow from the acquisition of 60% of Celly Group was equal to 12.3 million euro.
(euro/000)Fair value Group
Celly
12/05/2014
Cash and cash equivalents 2,178
Short-term financial liabilities (6,570)
Net financial debts acquired (included in cash flows from investing activities) (4,392)
Cash paid (7,944)
Net cash outflow on acquisition of Celly Group 60% (12,336)
Finally, please consider that from the acquisition date Celly Group has contributed 18.7 million euro of revenue and a loss of 0.4 million euro to the net profit of Esprinet Group. If the acquisition had taken place at the beginning of the year the Celly Group contribution would have been equal to approximately 26.0 million euro of revenue and approx. 1.7 million euro of net loss.
5. Disposed or disposal groups
Disposal of the subsidiary Monclick S.r.l.
On 28 February 2014 Esprinet S.p.A, in the process aimed both at maximizing ‘non-core’ assets value and at focusing in the B2B technology distribution, finalised the sale of 100% stake in its subsidiary Monclick S.r.l.. till that date representative of the IT “business-to-consumer” (B2C) distribution segment and consumer electronics segment. The gain on disposal was equal to 2.5 million euro against a 4.0 million euro compensation. The following table shows how the gain generated as well as the detail of asset and liability items and their variation during the period when the Company Monclick was controlled by Esprinet S.p.A. as reported, for their respective total amount, in ‘Disposal groups assets’ and ‘Disposal groups liabilities’.

Esprinet 2014 Directors’ Report on Operations
48
(euro/000)
Carrying amount
Monclick S.r.l.Variation
Carrying amount
Monclick S.r.l.
01/01/2014 28/02/2014
Property, plant and equipment 221 (4) 217
Deferred income tax assets 25 - 25
Inventory 1,183 26 1,209
Trade receivables 4,619 (1,346) 3,273
Other current assets 1,209 (291) 918
Cash and cash equivalents 1,568 (352) 1,216
Disposed group assets (Monclick) 8,825 (1,967) 6,858
Deferred income tax liabilities (1) (1) (2)
Retirement benefit obligation (278) (7) (285)
Trade payables (630) (15) (645)
Short-term financial liabilities (5) 2 (3)
Income tax liabilities (93) (6) (99)
Provisions and other liabilities (6,318) 2,008 (4,310)
Disposed group liabilities (Monclick) (7,325) 1,981 (5,344)
Disposed group net equity (Monclick) 1,500 14 1,514
Salling costs 34
Gain on disposed group 2,452
Selling value of disposed group 4,000
Monclick’s results, including other charges and income incurred with reference to the investment disposal, summarized in ‘Income/(Loss) from disposal groups’, are shown below:
(euro/000)
Carrying
amounts
Carrying
amounts
2014 (1) 2013
Sales 6,229 95,773
Cost of sales (5,491) (89,801)
Gross profit 738 5,972
Sales and marketing costs (458) (2,603)
Overheads and administrative costs (260) (1,567)
Operating Income (Ebit) 20 1,802
Finance costs - net 1 (4)
Profit before income taxes 21 1,798
Income tax expenses (7) (619)
Net income from disposed group (Monclick) 14 1,179
Gain on disposed group 2,452 -
Income taxes on the disposal gain, net of selling expenses (4) -
Net income from disposed operating group 2,462 1,179
Earnings per share from disposal operating group - basic (euro) 0.05 0.02
Earnings per share from disposal operating group - diluted (euro) 0.05 0.02
(1)
These figures refer to the two months activity prior to the disposal on 28 February 2014.
Intercompany Profit and Loss items were not eliminated in order to better disclose the economic situation of Esprinet Group as the main trade relations with the company sold are continuing and will continue also afterwards. Therefore Esprinet Group revenues and costs towards Monclick will remain within the perimeter of the continuing operation activities. For a better explanation, a summary of intercompany transactions with Esprinet Group during the referred months is reported below:

Esprinet 2014 Directors’ Report on Operations
49
Sales Costs Sales Costs Sales Costs Sales Costs
Sales Products sales 5,604 - - - 88,872 - 734 -
Cost of sales Products purchase - - - 5,600 - 724 - 88,845
Sales and marketing costs Charged expenses - - - (6) - 7 - (33)
Overheads and admin. Costs Charged expenses - (75) - 85 - (425) - 488
Total 5,604 (75) - 5,679 88,872 306 734 89,300
(euro/000)
2014 (1) 2013
Esprinet Group Monclick MonclickEsprinet Group
Type
(1)
These figures refer to the two months activity prior to the disposal on 28 February 2014.
Net cash flow on disposal of the subsidiary Monclick S.r.l. is as follows:
(euro/000)Carrying amounts
2014
Selling value on disposed group 4,000
Short-term financial liabilities transferred 3
Cash and cash equivalents transferred (1,216)
Cash flow resulting from the sele of Monclick CGU (Cash Generiting Unit), net of
cash and cash equivalents transferred 2,787
Disposal of the subsidiary Comprel S.r.l. On 23 July 2014, in the process aimed both at maximizing ‘non-core assets’ value and at focusing in the B2B technology distribution, the management finalised the sale of 100% of Comprel S.r.l., company till that date active in the IT “business-to-consumer” (B2C) distribution segment of micro-electronic components. The loss on disposal was equal to 1.6 million euro against a 5.9 million euro compensation. The following table shows how the loss generated, as well as the detail of asset and liability items and their variation during the period when the Company Comprel was controlled by Esprinet S.p.A.:
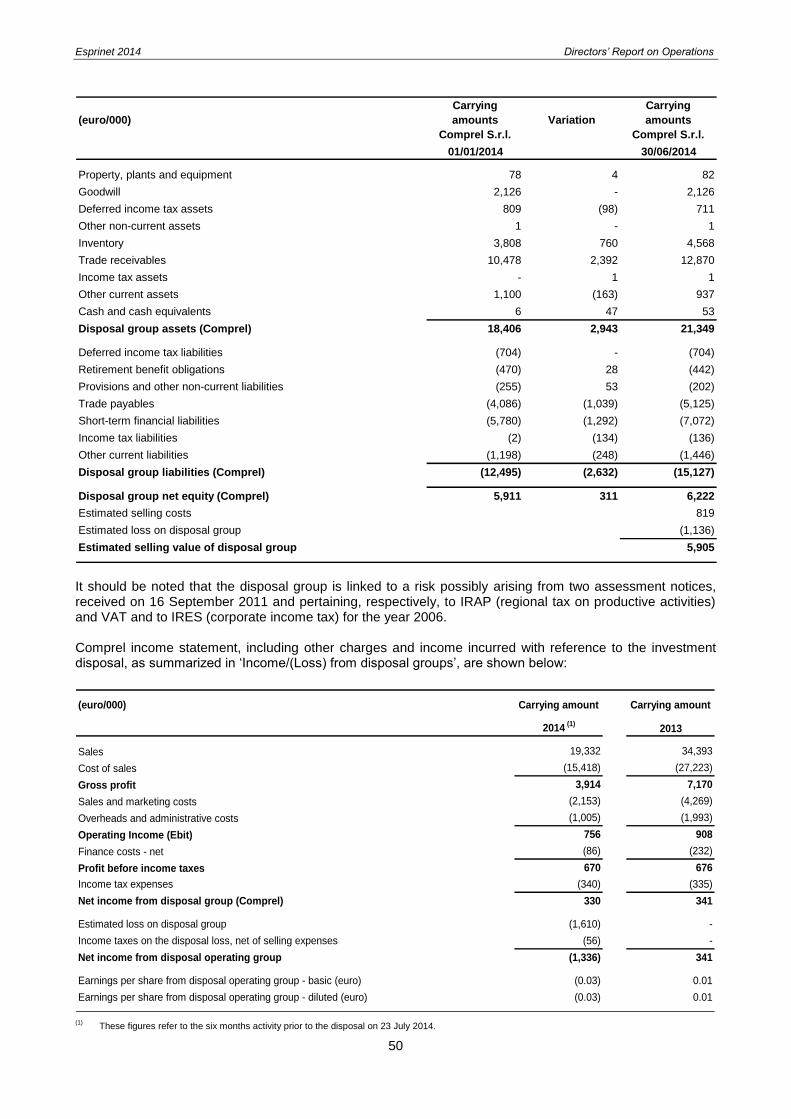
Esprinet 2014 Directors’ Report on Operations
50
(euro/000)
Carrying
amounts
Comprel S.r.l.
Variation
Carrying
amounts
Comprel S.r.l.
01/01/2014 30/06/2014
Property, plants and equipment 78 4 82
Goodwill 2,126 - 2,126
Deferred income tax assets 809 (98) 711
Other non-current assets 1 - 1
Inventory 3,808 760 4,568
Trade receivables 10,478 2,392 12,870
Income tax assets - 1 1
Other current assets 1,100 (163) 937
Cash and cash equivalents 6 47 53
Disposal group assets (Comprel) 18,406 2,943 21,349
Deferred income tax liabilities (704) - (704)
Retirement benefit obligations (470) 28 (442)
Provisions and other non-current liabilities (255) 53 (202)
Trade payables (4,086) (1,039) (5,125)
Short-term financial liabilities (5,780) (1,292) (7,072)
Income tax liabilities (2) (134) (136)
Other current liabilities (1,198) (248) (1,446)
Disposal group liabilities (Comprel) (12,495) (2,632) (15,127)
Disposal group net equity (Comprel) 5,911 311 6,222
Estimated selling costs 819
Estimated loss on disposal group (1,136)
Estimated selling value of disposal group 5,905
It should be noted that the disposal group is linked to a risk possibly arising from two assessment notices, received on 16 September 2011 and pertaining, respectively, to IRAP (regional tax on productive activities) and VAT and to IRES (corporate income tax) for the year 2006. Comprel income statement, including other charges and income incurred with reference to the investment disposal, as summarized in ‘Income/(Loss) from disposal groups’, are shown below:
(euro/000) Carrying amount Carrying amount
2014 (1)
2013
Sales 19,332 34,393
Cost of sales (15,418) (27,223)
Gross profit 3,914 7,170
Sales and marketing costs (2,153) (4,269)
Overheads and administrative costs (1,005) (1,993)
Operating Income (Ebit) 756 908
Finance costs - net (86) (232)
Profit before income taxes 670 676
Income tax expenses (340) (335)
Net income from disposal group (Comprel) 330 341
Estimated loss on disposal group (1,610) -
Income taxes on the disposal loss, net of selling expenses (56) -
Net income from disposal operating group (1,336) 341
Earnings per share from disposal operating group - basic (euro) (0.03) 0.01
Earnings per share from disposal operating group - diluted (euro) (0.03) 0.01
(1)
These figures refer to the six months activity prior to the disposal on 23 July 2014.
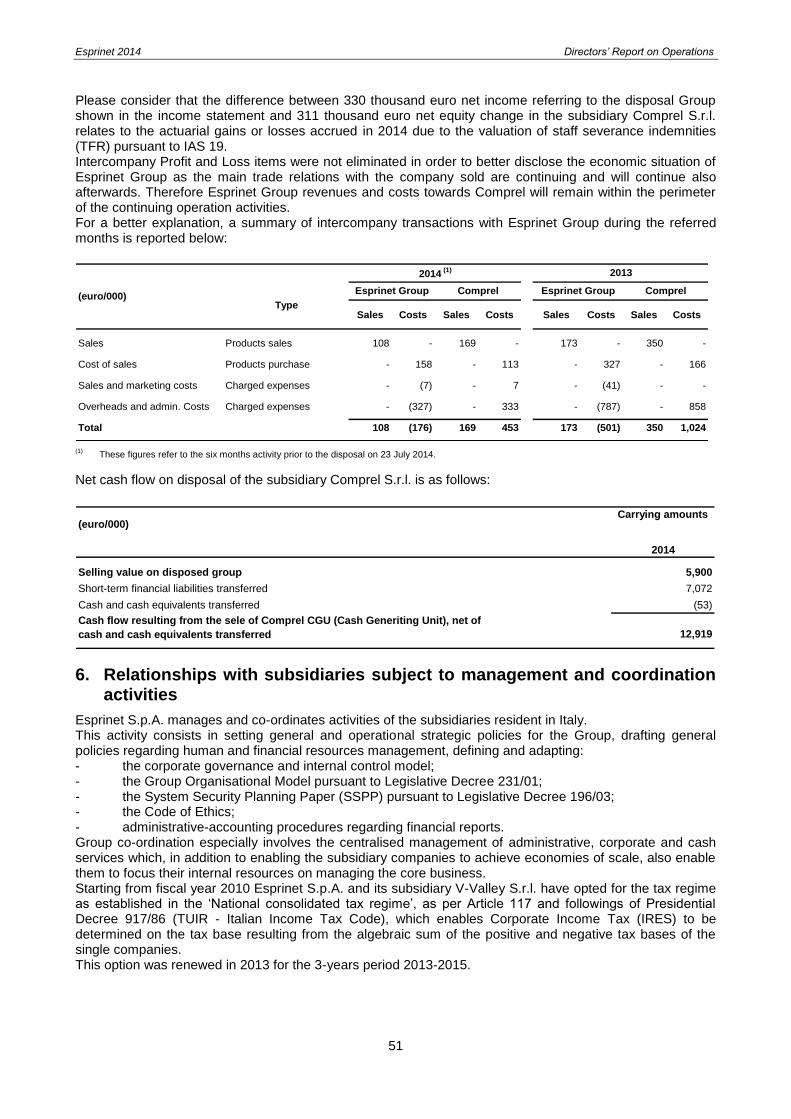
Esprinet 2014 Directors’ Report on Operations
51
Please consider that the difference between 330 thousand euro net income referring to the disposal Group shown in the income statement and 311 thousand euro net equity change in the subsidiary Comprel S.r.l. relates to the actuarial gains or losses accrued in 2014 due to the valuation of staff severance indemnities (TFR) pursuant to IAS 19. Intercompany Profit and Loss items were not eliminated in order to better disclose the economic situation of Esprinet Group as the main trade relations with the company sold are continuing and will continue also afterwards. Therefore Esprinet Group revenues and costs towards Comprel will remain within the perimeter of the continuing operation activities. For a better explanation, a summary of intercompany transactions with Esprinet Group during the referred months is reported below:
Sales Costs Sales Costs Sales Costs Sales Costs
Sales Products sales 108 - 169 - 173 - 350 -
Cost of sales Products purchase - 158 - 113 - 327 - 166
Sales and marketing costs Charged expenses - (7) - 7 - (41) - -
Overheads and admin. Costs Charged expenses - (327) - 333 - (787) - 858
Total 108 (176) 169 453 173 (501) 350 1,024
(euro/000)
2014 (1) 2013
Esprinet Group Comprel ComprelEsprinet Group
Type
(1)
These figures refer to the six months activity prior to the disposal on 23 July 2014.
Net cash flow on disposal of the subsidiary Comprel S.r.l. is as follows:
(euro/000)Carrying amounts
2014
Selling value on disposed group 5,900
Short-term financial liabilities transferred 7,072
Cash and cash equivalents transferred (53)
Cash flow resulting from the sele of Comprel CGU (Cash Generiting Unit), net of
cash and cash equivalents transferred 12,919
6. Relationships with subsidiaries subject to management and coordination activities
Esprinet S.p.A. manages and co-ordinates activities of the subsidiaries resident in Italy. This activity consists in setting general and operational strategic policies for the Group, drafting general policies regarding human and financial resources management, defining and adapting: - the corporate governance and internal control model; - the Group Organisational Model pursuant to Legislative Decree 231/01; - the System Security Planning Paper (SSPP) pursuant to Legislative Decree 196/03; - the Code of Ethics; - administrative-accounting procedures regarding financial reports. Group co-ordination especially involves the centralised management of administrative, corporate and cash services which, in addition to enabling the subsidiary companies to achieve economies of scale, also enable them to focus their internal resources on managing the core business. Starting from fiscal year 2010 Esprinet S.p.A. and its subsidiary V-Valley S.r.l. have opted for the tax regime as established in the ‘National consolidated tax regime’, as per Article 117 and followings of Presidential Decree 917/86 (TUIR - Italian Income Tax Code), which enables Corporate Income Tax (IRES) to be determined on the tax base resulting from the algebraic sum of the positive and negative tax bases of the single companies. This option was renewed in 2013 for the 3-years period 2013-2015.

Esprinet 2014 Directors’ Report on Operations
52
7. Shares of the parent company Esprinet S.p.A held by board members, statutory auditors and key managers
Name Office
No. of shares at
31/12/13 or at
appointment
date
No. of shares
purchased
No. of
shares
sold
Decrease for
office
termination
No. of shares
at 31/12/14
Francesco Monti Chairman 8,232,070 - - - 8,232,070
Maurizio Rota Deputy Chairman and CEO 2,514,310 - - - 2,514,310
Alessandro Cattani CEO 500,000 - - - 500,000
Giuseppe Calì Director 7,732,000 - - - 7,732,000
Stefania Calì Director 53,970 - - - 53,970
Valerio Casari Director 3,279 - - - 3,279
Andrea Cavaliere Director - - - - -
Mario Massari Director - - - - -
Marco Monti Director - - - - -
Chiara Mauri Director - - - - -
Umberto Giovanni Quilici (1)
Director 20,000 - - - 20,000
Cristina Galbusera Director - - - - -
Total Board of Directors 19,055,629 - - - 19,055,629
Giorgio Razzoli Chairman - - - - -
Emanuele Calcaterra Standing Statutory Auditor - - - - -
Mario Conti Standing Statutory Auditor - - - - -
Total Board of Statutory Auditor - - - - -
Total Managers with strategic responsibilities 638,909 - (624,721) (10,910) 3,278
(1) Shares hold by spouse
In compliance with CONSOB Resolution 11971 dated 14 May 1999, the previous table provides details of share dealing effected during the year by Esprinet S.p.A. Directors, Statutory Auditors and key managers, reminding that the company organisation structure does not include a General Manager. Further details can be found in the ‘Notes to the consolidated financial statements’ under ‘Emoluments paid to board members, statutory auditors and key managers’.
8. Atypical and/or unusual operations
No atypical and/or unusual events or operations according to the definition as per Consob communication No. DEM/6064293 of the 28 July 2006 occurred during the year.
9. Additional information required by Bank of Italy and Consob
In compliance with the Supervisory Authorities document no. 2 of 6 February 2009 and the successive specifications of 3 March 2010, requiring the drafters of financial reports to supply adequate disclosure on some themes, the relevant sections satisfying the applicable requests in question the Group are as follows:
1. disclosure about entity’s going concern, ‘Notes to the consolidated financial statements’ - paragraph ‘Accounting principles and valuation criteria’;
2. disclosure concerning financial risks, ‘Directors’ Report on Operations’ - paragraph ‘Main risks and uncertainties facing the Group and Esprinet S.p.A.’ - and ‘Notes to the consolidated financial statements’ - section ‘Disclosure on risks and financial instruments’;
3. disclosure on tests to assess if there is any impairment of assets, ‘Notes to the consolidated financial statements’ - paragraph ‘Notes to the balance sheet items’ item ‘Goodwill’;
4. disclosure about uncertainties when using estimates, ‘Notes to the consolidated financial statements’ - paragraph ‘Main accounting definitions and estimates’;
5. disclosure on financial liabilities type clauses, Notes to the consolidated financial statements’ - paragraph ‘Loans and loan covenants’;
6. disclosure concerning ‘fair value hierarchy’, ‘Notes to the consolidated financial statements’ - paragraph ‘Financial instruments pursuant to IAS 39: classes of risk and fair value’.

Esprinet 2014 Directors’ Report on Operations
53
The information required by Consob communication No. DEM/11012984 of 24 February 2011 ‘Request for information pursuant to Art. 114, paragraph 5, of Legislative Decree No. 58 of 24 February 1998, regarding compensation for advance termination of employment..’ can be found in the ‘Esprinet S.p.A. Corporate Governance Report’.
Disclosure required by Consob communication No. 3907 of 19 January 2015 can be found in the relevant sections of the ‘Notes to the consolidated financial statements’.
10. Share incentive plans
Under the share incentive policies, aimed at strengthening the loyalty of those managers considered critical for the achievement of the Group’s operating objectives, on 9 May 2012 the Esprinet S.p.A. shareholders’ meeting approved the proposal of the Compensation Committee for a further ‘Long Term Incentive Plan’ for members of the Boards of Directors and executives of the Company. This Plan is valid for the 2012/2013/2014 three-year period and regards the stock grant of a maximum number of 1,150,000 ordinary Esprinet S.p.A. shares to beneficiaries. The stock grant was assigned on 14 May 2012 with maturity deferred up to the presentation of the Group’s consolidated financial statements for the fiscal year 2014 to the Esprinet Shareholders’ Meeting. The exercise rights of the stock grant are conditional on the achievement of the Group’s income targets in 2012-2014, as well as on the permanence of the beneficiary in the Group up to the presentation of the 2014 consolidated financial statement. Esprinet S.p.A. ordinary shares underlying the ‘Long Term Incentive Plan’, of the face value of 0.15 euro each, were in the Esprinet S.p.A. portfolio since the Plan approval date. Further information can be found in the ‘Notes to the consolidated financial statement’ – paragraph ‘Group Personnel costs’.
11. Net equity and result reconciliation between Group and Parent company
In compliance with Consob communication no. DEM/6064293 of 28 July 2006 the reconciliation between Group net equity and result of the period together with the relative data of the parent company, Esprinet S.p.A., is illustrated in the table below:
31/12/14 31/12/13 31/12/14 31/12/13
Esprinet S.p.A. separate financial statements 39,597 18,471 282,119 246,651
Consolidation adjustements
Net equity and result for the year of consolidated companies, net of minority
interests 4,597 4,645 80,214 77,475
Esprinet S.p.A. 's investments in consolidated subsidiaries carryng amount (17,234) (83,602) (66,159)
Goodwill from Esprinet Iberica S.L.U. business combination 1,040 1,040
Goodwill from Celly S.p.A. business combination 4,153
Adjustment to equity value of associated companies (1) (9) (10) (9)
Deletion of non-realised (profit)/loss on inventory, net of fiscal effect (112) (12) (150) (39)
Option on 40% Celly shares (34) (9,759)
Other movements 867 867
Consolidated net equity 26,813 23,095 274,872 259,826
Net income/ (loss) Equity
(euro/000)
12. Other information
The System Security Planning Paper (SSPP) - as initially foreseen by Legislative Decree 196/2003, integrated by the Legislative Decree n.5/2012 (decree on simplification) - continues to be drawn up and applied by the companies of the Group localized in the Italian Country. On 28 June 2004, the Esprinet S.p.A. Board of Directors appointed the company’s Chief Executive Officer, Alessandro Cattani, as the executive responsible for protecting personal data. Mr Cattani was, however,

Esprinet 2014 Directors’ Report on Operations
54
vested with the particular ability to delegate all his powers and responsibilities to those company executives and employees operating as data-processing managers, in accordance with their respective areas of responsibility.
Proposal of approval of the Financial Statement and allocation of the 2014 profits
Dear Shareholders,
at the end of our illustration of the Esprinet S.p.A. financial statements (separate financial statements) and
the Group consolidated financial statements as at 31 December 2014, together with the Directors’ report on
operations, we hereby present you with our proposal for the allocation of the positive result posted for the
year by Esprinet S.p.A..
In seeking your approval of our operations, by assenting to our draft Financial Statements, as well as to our
Report on operations and the Notes to the financial statements, we propose to allocate the Company’s net
profit of 39,596,642.20 euro as follows:
- a dividend of 0.125 euro gross to each one of the Company’s ordinary shares in circulation, excluding
therefore any of its own shares held by the Company in its portfolio at the coupon detachment date;
- any remaining amount to the Extraordinary Reserve. Note that the company needs not set aside amounts to the legal reserve having reached 20% of the Share Capital. For the purpose of taxing beneficiaries, note that the company has residual retained earnings generated up to the financial year ended on 31 December 2007, thus pursuant to the legal presumption set forth by Ministry Decree of 2 April 2008 the whole amount of dividends distributed is considered to consist of profits made by the company up to financial year as at 31 December 2007.
Vimercate, 16 March 2015
On behalf of the Board of Directors The Chairman Francesco Monti
Esprinet 2014 Consolidated Financial Statement
55
Esprinet Group
Consolidated Financial Statements 2014

Esprinet 2014 Consolidated Financial Statement
56
CONTENTS of the 2014 Esprinet Group Consolidated Financial Statements
ESPRINET GROUPConsolidated financial statements
Consolidated statement of f inancial position page 57
Consolidated separate income statement page 58
Consolidated statement of comrehensive income page 58
Consolidated statement of changes in equity page 59
Consolidated statement of cash flow s page 60
Notes to the consolidated financial statements
1 General information page 61
2 Accounting principles and valuation criteria page 61
2.1 Accounting principles
2.2 Presentation of f inancial statements
2.3 Consolidation criteria and methods
2.4 Changes to the Group's consolidation area
2.5 Changes in accounting estimates and reclassif ication
2.6 Summary of signif icant valuation criteria and accounting policies
2.7 Critical accounting estimates and definitions
2.8 Recently issued accounting standards
3 Segment information page 75
3.1 Introduction
3.2 Segment results
3.3 Other information
4 Disclosures on risks and financial instruments page 80
5 Notes to the statement of f inancial position items page 93
6 Guarantees, commitments and potential risks page 112
7 Notes to the income statement items page 113
8 Other signif icant information page 120
8.1 Emoluments paid to the board members, statutory auditors and key managers
8.2 Relationships w ith related parties
8.3 Cash-flow analysis
8.4 Net f inancial indebtedness and financial liabilities analysis
8.5 Loans and loan covenants
8.6 Lines of credit
8.7 Seasonal nature of business
8.8 Non-recurring signif icant events and operations
8.9 Main disputes pending
8.10 Operations relating to derivative instruments
8.11 Compensation for Group auditing services
9 Publication of the Draft Annual Report page 129
Declaration pursuant to Art.81-ter Consob Regulation page 130

Esprinet 2014 Consolidated Financial Statement
57
Consolidated statement of financial position
The table below shows the consolidated statement of financial position drawn up according to IFRS principles, together with the information required pursuant to Consob Resolution No. 15519 of 27 July 2006:
(*) For further details regarding related parties please see the section ‘Relationships with related parties’ in the ‘Notes to the consolidated financial
statements’.
ASSETS
Non-current assets
Property, plant and equipment 1 10,271 9,877
Goodw ill 2 75,246 73,219
Intangible assets 3 1,021 767
Investments in associates 45 -
Deferred income tax assets 6 9,932 11,369
Receivables and other non-current assets 9 4,628 1,188 4,978 1,188
101,143 1,188 100,210 1,188
Current assets
Inventory 10 253,488 217,304
Trade receivables 11 275,983 16 232,519 35
Income tax assets 12 1,774 1,723
Other assets 13 9,814 - 10,621 -
Cash and cash equivalents 17 225,174 176,893
766,233 16 639,060 35
Disposal groups assets 48 - -
Total assets 867,376 1,204 739,270 1,223
EQUITY
Share capital 19 7,861 7,861
Reserves 20 237,783 228,870
Group net income 21 27,035 23,095
Group net equity 272,679 259,826
Non-controlling interests 2,193 -
Total equity 274,872 259,826
LIABILITIES
Non-current liabilities
Borrow ings 22 68,419 3,356
Derivative f inancial liabilities 23 128 -
Deferred income tax liabilities 24 4,795 5,331
Retirement benefit obligations 25 4,569 4,707
Debts for investments in subsidiaries 49 9,758 -
Provisions and other liabilities 26 2,734 2,333
90,403 15,727
Current liabilities
Trade payables 27 452,040 - 400,366 -
Short-term financial liabilities 28 20,814 38,569
Income tax liabilities 29 1,361 664
Derivative f inancial liabilities 30 51 174
Provisions and other liabilities 32 27,835 23,944
502,101 - 463,717 -
Disposal groups liabilities 34 - -
Total liabilities 592,504 - 479,444 -
Total equity and liabilities 867,376 - 739,270 -
(euro/000) Notes 31/12/2014related
parties*
related
parties*31/12/2013

Esprinet 2014 Consolidated Financial Statement
58
Consolidated separate income statement
The Group’s separate income statement is set out below. It is drawn up according to IFRS requirements and expenses are classified by ‘function’. It also includes the information required pursuant to Consob Resolution No. 15519 of 27 July 2006:
* Different amounts from those published in previous reports due to reclassification, recurred even in the comparative figures, of the profit and loss values of Monclick S.r.l. and Comprel S.r.l. into ‘Income/loss from disposal Group’ item.
** Emoluments to key managers excluded.
Consolidated statement of comprehensive income
* Different amounts from those published in previous reports due to reclassification, recurred even in the comparative figures, of the profit and loss values
of Monclick S.r.l. and Comprel S.r.l. into ‘Income/loss from disposal Group’ item.
Sales 33 2,291,141 - 13 2,002,964 - 21
Cost of sales (2,149,305) - - (1,881,299) - -
Gross profit 35 141,836 - 121,665 -
Sales and marketing costs 37 (38,381) - - (29,994) - -
Overheads and administrative costs 38 (62,369) (918) (3,384) (57,393) (98) (3,384)
Operating income (EBIT) 41,086 (918) 34,278 (98)
Finance costs - net 42 (1,987) - 12 (1,902) (66) 30
Other investments expenses/(incomes) 43 1 - (6) -
Profit before income tax 39,100 (918) 32,370 (164)
Income tax expenses 45 (13,413) (428) - (10,795) (428) -
Profit from continuing operations 25,687 (1,346) 21,575 (592)
Income/(loss) from disposal groups 47 1,126 1,520
Net income 26,813 (1,346) 23,095 (592)
- o f which attributable to non-contro lling interests (222) -
- o f which attributable to Group 27,035 (1,346) 23,095 (592)
Earnings continuing operation per share - basic 46 0.51 0.42
Earnings per share - basic (euro) 46 0.53 0.45
Earnings continuing operation per share - diluted 46 0.50 0.41
Earnings per share - diluted (euro) 46 0.52 0.44
related
parties**
(euro/000) Notes non -
recurring
related
parties**
non -
recurring
2014 2013 restated*
Net income 26,813 23,095
Other comprehensive income:
- Changes in 'cash flow hedge' equity reserve (339) 782
- Taxes on changes in 'cash flow hedge' equity reserve (2) (238)
- Changes in translation adjustment reserve 10 -
Other comprehensive income not to be reclassified in the separate income statement
- Changes in 'TFR' equity reserve (537) (113)
- Taxes on changes in 'TFR' equity reserve 148 31
Other comprehensive income (721) 462
Total comprehensive income 26,092 23,557
- of w hich attributable to Group 26,349 23,557
- of w hich attributable to non-controlling interests (257) -
(euro/000) 2014 2013 restated*

Esprinet 2014 Consolidated Financial Statement
59
Consolidated statement of changes in equity
Balance at 31 December 2012 7,861 223,231 (14,935) 23,718 239,875 - 239,875
Total comprehensive income/(loss) - 462 - 23,095 23,556 - 23,556
Allocation of last year net income/(loss) - 19,159 - (19,159) - - -
Dividend payment - - - (4,559) (4,559) - (4,559)
Transactions with owners - 19,159 - (23,718) (4,559) - (4,559)
Increase/(decrease) in 'stock grant' plan reserve - (245) - - (245) - (245)
Assignment of Esprinet ow n shares - (666) 1,865 - 1,199 - 1,199
Balance at 31 december 2013 7,861 241,941 (13,070) 23,095 259,826 - 259,826 -
Balance at 31 December 2013 7,861 241,940 (13,070) 23,095 259,826 - 259,826
Total comprehensive income/(loss) - (721) - 26,813 26,092 (257) 26,349
Allocation of last year net income/(loss) - 18,536 - (18,536) - - -
Dividend payment - - - (4,559) (4,559) - (4,559)
Transactions with owners - 18,536 - (23,095) (4,559) - (4,559)
Increase/(decrease) in 'stock grant' plan reserve - 913 - - 913 - 913
Increase in reserve from Celly group acquisition 2,528 2,528 2,528 -
Variation in IAS / FTA reserve (203) (203) (78) (125)
Other variations - 4 - - 4 - 4
Variation in reserve on 40% Celly option - (9,729) - - (9,729) - (9,729)
Balance at 31 december 2014 7,861 253,268 (13,070) 26,813 274,872 2,193 272,679
Own
sharesReserves
Share
capital(euro/000)
Group net
equity
Minority
interest
Total net
equity
Profit for
the
period

Esprinet 2014 Consolidated Financial Statement
60
Consolidated statement of cash flows3
(euro/000) 20142013
restated*
Cash flow provided by (used in) operating activities (D=A+B+C) 3,872 87,642
Cash flow generated from operations (A) 46,324 40,797
Operating income (EBIT) 41,086 34,278
Net income from disposal groups 1,533 2,473
Depreciation, amortisation and other fixed assets write-downs 3,267 2,745
Net changes in provisions for risks and charges (36) 632
Net changes in retirement benefit obligations (439) (284)
Stock option/grant costs 913 953
Cash flow provided by (used in) changes in working capital (B) (29,587) 57,719
Inventory (34,785) (1,154)
Trade receivables (54,006) 4,666
Other current assets (3,954) 5,425
Trade payables 54,266 44,180
Other current liabilities 8,892 4,602
Other cash flow provided by (used in) operating activities (C) (12,865) (10,874)
Interests paid, net 446 (1,187)
Foreign exchange (losses)/gains (1,239) (101)
Net results from associated companies (7) -
Gain on Monclick disposal (2,452) -
Gain on Comprel disposal 1,610 -
Income taxes paid (11,223) (9,586)
Cash flow provided by (used in) investing activities (E) 638 (2,487)
Net investments in property, plant and equipment (2,606) (2,511)
Net investments in intangible assets (769) (192)
Changes in other non current assets and liabilities 643 216
Celly business combination (12,336) -
Monclick selling 2,787 -
Comprel selling 12,919 -
Cash flow provided by (used in) financing activities (F) 43,771 (19,361)
Medium/long term borrowing 67,000 3,834
Repayment/renegotiation of medium/long-term borrowings (13,274) (24,280)
Net change in financial liabilities (7,370) 9,873
Net change in financial assets and derivative instruments 2,583 (4,773)
Deferred price Celly acquisition 9,758 -
Option on 40% Celly shares (9,691) -
Dividend payments (4,559) (4,559)
Increase/(decrease) in 'cash flow hedge' equity reserve (341) 544
Other movements (335) -
Net increase/(decrease) in cash and cash equivalents (G=D+E+F) 48,281 65,794
Cash and cash equivalents at year-beginning 176,893 111,099
Net decrease (increase) in cash and cash equivalents 48,281 65,794
Cash and cash equivalents at year-end 225,174 176,893
* Different amounts from those published in previous reports due to reclassification, recurred even in the comparative figures, of the profit and loss values of Monclick S.r.l. and Comprel S.r.l. into ‘Income/loss from disposal Group’ item.
3 No effects of relationships with related parties have been considered significant.

Esprinet 2014 Consolidated Financial Statement
61
Notes to the consolidated financial statements
1. General information
Esprinet S.p.A. (hereafter ’Esprinet’ or the ‘parent company’) and its subsidiaries (the ‘Esprinet Group’ or the ‘Group’) operate in Italy and Spain. In both Italy and Spain the Group is active in the ‘business-to-business’ (B2B) distribution of Information Technology (IT) and consumer electronics area.
Esprinet S.p.A. has its registered and administrative offices in Italy at Vimercate (Monza e Brianza). Ordinary shares in Esprinet S.p.A. (ticker: PRT.MI) have been listed in the ‘STAR’ segment (segment of securities with high qualification) of the MTA market of Borsa Italiana S.p.A., the Italian Stock Exchange, since 27 July 2001.
2. Accounting principles and valuation criteria
The principal accounting policies applied in the preparation of these consolidated financial statements are set out below. Unless otherwise stated, these policies have been consistently applied to all the years presented.
2.1 Accounting principles
The consolidated financial statements of the Esprinet Group as at 31 December have been drawn up in compliance with IFRS requirements issued by the International Accounting Standards Board (IASB) and approved by the European Union, as well as measures issued in accordance with art. 9 of D. Lgs. n. 38/2005. The acronym IFRS stands for the International Financial Reporting Standards (IFRS), which include the recent evolution of the International Accounting Standards (IAS) and all interpretations issued by the International Financial Reporting Interpretations Committee (IFRIC), previously known as the Standing Interpretations Committee (SIC). The financial statements have been drawn up using the historical cost, except for the assessment of some financial instruments, where the fair value criteria are applied, and also the going concern presumption.
2.2 Presentation of financial statements
The presentation formats of the financial position and income and cash-flow statements have the following characteristics: - statement of financial position: current and non-current assets and current and non-current liabilities are
reported separately; - statement of comprehensive income: income statement and statement of comprehensive income are
reported in two different statements; - separate income statement: costs have been analysed by function; - statement of cash flows: drawn up as per the indirect method set out in IAS 7. The choices made in terms of the presentation of the statement of accounts derive from the conviction that these contribute to an improvement in the quality of the information provided. The figures presented in this document are expressed in thousands of euro, unless otherwise indicated. Furthermore, in some cases the tables might have some inaccuracies due to the rounding-up to thousands.
2.3 Consolidation criteria and methods
The consolidated financial statements originate from the annual accounts for its operating year produced by the parent company Esprinet S.p.A. and from figures for the year, approved by their respective Boards of Directors, relating to the respective dates on which controlling stakes were acquired in those companies in which the parent company holds control, be it directly and/or indirectly. Wherever necessary, the subsidiaries’ accounts have been suitably adjusted to ensure consistency with the accounting principles used by the parent company.
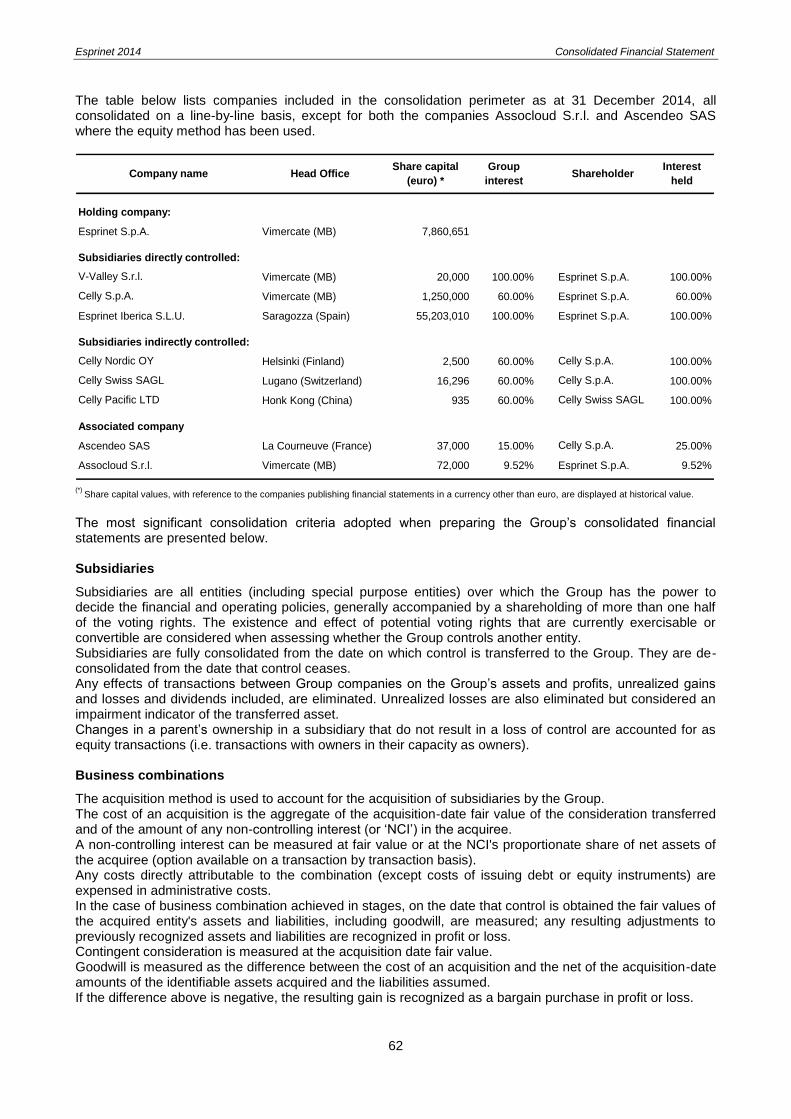
Esprinet 2014 Consolidated Financial Statement
62
The table below lists companies included in the consolidation perimeter as at 31 December 2014, all consolidated on a line-by-line basis, except for both the companies Assocloud S.r.l. and Ascendeo SAS where the equity method has been used.
Holding company:
Esprinet S.p.A. Vimercate (MB) 7,860,651
Subsidiaries directly controlled:
V-Valley S.r.l. Vimercate (MB) 20,000 100.00% Esprinet S.p.A. 100.00%
Celly S.p.A. Vimercate (MB) 1,250,000 60.00% Esprinet S.p.A. 60.00%
Esprinet Iberica S.L.U. Saragozza (Spain) 55,203,010 100.00% Esprinet S.p.A. 100.00%
Subsidiaries indirectly controlled:
Celly Nordic OY Helsinki (Finland) 2,500 60.00% Celly S.p.A. 100.00%
Celly Swiss SAGL Lugano (Switzerland) 16,296 60.00% Celly S.p.A. 100.00%
Celly Pacific LTD Honk Kong (China) 935 60.00% Celly Swiss SAGL 100.00%
Associated company
Ascendeo SAS La Courneuve (France) 37,000 15.00% Celly S.p.A. 25.00%
Assocloud S.r.l. Vimercate (MB) 72,000 9.52% Esprinet S.p.A. 9.52%
Interest
held
Group
interestCompany name Head Office
Share capital
(euro) *Shareholder
(*)
Share capital values, with reference to the companies publishing financial statements in a currency other than euro, are displayed at historical value.
The most significant consolidation criteria adopted when preparing the Group’s consolidated financial statements are presented below. Subsidiaries
Subsidiaries are all entities (including special purpose entities) over which the Group has the power to decide the financial and operating policies, generally accompanied by a shareholding of more than one half of the voting rights. The existence and effect of potential voting rights that are currently exercisable or convertible are considered when assessing whether the Group controls another entity. Subsidiaries are fully consolidated from the date on which control is transferred to the Group. They are de-consolidated from the date that control ceases. Any effects of transactions between Group companies on the Group’s assets and profits, unrealized gains and losses and dividends included, are eliminated. Unrealized losses are also eliminated but considered an impairment indicator of the transferred asset. Changes in a parent’s ownership in a subsidiary that do not result in a loss of control are accounted for as equity transactions (i.e. transactions with owners in their capacity as owners). Business combinations
The acquisition method is used to account for the acquisition of subsidiaries by the Group. The cost of an acquisition is the aggregate of the acquisition-date fair value of the consideration transferred and of the amount of any non-controlling interest (or ‘NCI’) in the acquiree. A non-controlling interest can be measured at fair value or at the NCI's proportionate share of net assets of the acquiree (option available on a transaction by transaction basis). Any costs directly attributable to the combination (except costs of issuing debt or equity instruments) are expensed in administrative costs. In the case of business combination achieved in stages, on the date that control is obtained the fair values of the acquired entity's assets and liabilities, including goodwill, are measured; any resulting adjustments to previously recognized assets and liabilities are recognized in profit or loss. Contingent consideration is measured at the acquisition date fair value. Goodwill is measured as the difference between the cost of an acquisition and the net of the acquisition-date amounts of the identifiable assets acquired and the liabilities assumed. If the difference above is negative, the resulting gain is recognized as a bargain purchase in profit or loss.
Esprinet 2014 Consolidated Financial Statement
63
The ‘purchase method’ was used to account acquisition of subsidiaries by the Group until 2009 included. Costs directly attributable to the acquisition were included in the cost of the acquisition. Minority interests consisted of the share of the net assets of the acquired entity. Business combinations achieved in stages were treated separately at the date of each transaction, with no impact on the previous goodwill may be accounted. Non-controlling interests
The Group applies a policy of treating transactions with non-controlling shareholders as transactions with parties outside the Group itself. The share of equity attributable to outside shareholders of subsidiary companies included in the consolidated accounts is carried separately under the equity item ‘Non-controlling interests’, precisely created for this purpose. The share of net income attributable to non-controlling shareholders is reported separately in the consolidated separate income statement under the item ‘Non-controlling interests’ whereas, their share of comprehensive income is shown in the statement of comprehensive income under the item ‘Total comprehensive income attributable to non-controlling interests’. Losses are attributed to non-controlling shareholders even if they make negative the non-controlling interests balance. Associated companies
Group investments in associates are assessed using the net equity method. Associates are companies over which the Group has significant influence, even though they are not subsidiaries or part of a joint-venture. Financial statements of associates are used by the Group for the application of the net equity method of accounting. The closing of accounts of associates and of the Group take place at the same date and by using the same accounting principles. Group investments in associates are recorded in the statement of financial position at the cost increased or decreased by the post-acquisition changes in the Group’s share of its associates’ net profit and eventually decreased by any possible loss of value. The possible Goodwill relating to an associate is included in the carrying amount of the investment and its amortization or impairment are not permitted. The separate income statement reflects the Group’s share of its associates’ net profit/loss except the quotas of profits and losses resulting from transactions between the Group and the associate which are eliminated. If an associate adjusts a movement directly taking it to equity, the Group also adjusts its share subsequently and reports it, where applicable, in the statement of changes in equity. At each reporting date, after application of the equity method the Group determines whether it is necessary to recognize any additional impairment loss with respect to its investment in the associate. In the case the impairment loss occurred, the Group measures it by comparing the recoverable amount and the carrying amount of the investment, and recognize this loss in the separate income statement under ‘share of profits/losses of associates’. Intercompany dividends
Dividends distributed among Group companies are eliminated from the consolidated income statement.
2.4 Changes to the Group’s consolidation area Compared to 31 December 2013 we report the exit from the consolidation area of the companies Monclick S.r.l. and Comprel S.r.l., respectively sold on 28 February 2014 and 23 July 2014 and the entry on 12 May 2014 of the company Celly S.p.A. together with its subsidiaries and associated companies as a consequence of the acquisition of a 60% share by Esprinet S.p.A.. On 2 April 2014 the shareholding in the associated company Assocloud grew from 8.33% to 9.52%. For further information please refer to the paragraph ‘Significant events occurred in the period’.
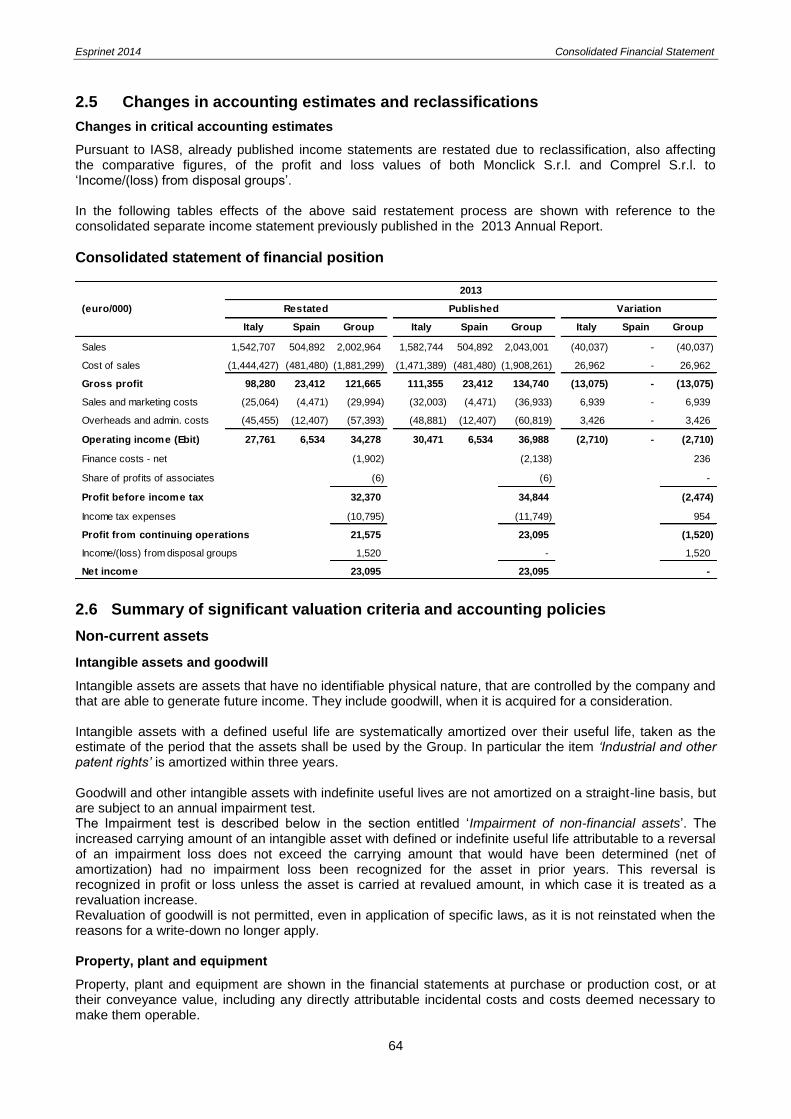
Esprinet 2014 Consolidated Financial Statement
64
2.5 Changes in accounting estimates and reclassifications
Changes in critical accounting estimates
Pursuant to IAS8, already published income statements are restated due to reclassification, also affecting the comparative figures, of the profit and loss values of both Monclick S.r.l. and Comprel S.r.l. to ‘Income/(loss) from disposal groups’. In the following tables effects of the above said restatement process are shown with reference to the consolidated separate income statement previously published in the 2013 Annual Report.
Consolidated statement of financial position
2.6 Summary of significant valuation criteria and accounting policies
Non-current assets
Intangible assets and goodwill
Intangible assets are assets that have no identifiable physical nature, that are controlled by the company and that are able to generate future income. They include goodwill, when it is acquired for a consideration. Intangible assets with a defined useful life are systematically amortized over their useful life, taken as the estimate of the period that the assets shall be used by the Group. In particular the item ‘Industrial and other patent rights’ is amortized within three years. Goodwill and other intangible assets with indefinite useful lives are not amortized on a straight-line basis, but are subject to an annual impairment test. The Impairment test is described below in the section entitled ‘Impairment of non-financial assets’. The increased carrying amount of an intangible asset with defined or indefinite useful life attributable to a reversal of an impairment loss does not exceed the carrying amount that would have been determined (net of amortization) had no impairment loss been recognized for the asset in prior years. This reversal is recognized in profit or loss unless the asset is carried at revalued amount, in which case it is treated as a revaluation increase. Revaluation of goodwill is not permitted, even in application of specific laws, as it is not reinstated when the reasons for a write-down no longer apply. Property, plant and equipment
Property, plant and equipment are shown in the financial statements at purchase or production cost, or at their conveyance value, including any directly attributable incidental costs and costs deemed necessary to make them operable.
Italy Spain Group Italy Spain Group Italy Spain Group
Sales 1,542,707 504,892 2,002,964 1,582,744 504,892 2,043,001 (40,037) - (40,037)
Cost of sales (1,444,427) (481,480) (1,881,299) (1,471,389) (481,480) (1,908,261) 26,962 - 26,962
Gross profit 98,280 23,412 121,665 111,355 23,412 134,740 (13,075) - (13,075)
Sales and marketing costs (25,064) (4,471) (29,994) (32,003) (4,471) (36,933) 6,939 - 6,939
Overheads and admin. costs (45,455) (12,407) (57,393) (48,881) (12,407) (60,819) 3,426 - 3,426
Operating income (Ebit) 27,761 6,534 34,278 30,471 6,534 36,988 (2,710) - (2,710)
Finance costs - net (1,902) (2,138) 236
Share of profits of associates (6) (6) -
Profit before income tax 32,370 34,844 (2,474)
Income tax expenses (10,795) (11,749) 954
Profit from continuing operations 21,575 23,095 (1,520)
Income/(loss) from disposal groups 1,520 - 1,520
Net income 23,095 23,095 -
(euro/000) Restated Published Variation
2013
Esprinet 2014 Consolidated Financial Statement
65
Ordinary maintenance and repair costs are charged to the income statement for the year in which they are incurred. Extraordinary maintenance costs leading to a significant and tangible increase in the productivity or useful life of an asset are added to the value of the asset concerned and amortized over a period representing its remaining useful life. Costs for leasehold improvements are entered under their relevant tangible assets category. Individual components of a facility that have different useful lives are recognized separately, so that each component may be depreciated at a rate consistent with its useful life. Fixed assets are systematically depreciated every year, in line with depreciation schedules drawn up to reflect the remaining usefulness of the assets concerned. The value reported in the statement of financial position is shown net of accumulated depreciation according to the remaining possible use of the asset. The depreciation rates applied for each asset category are detailed as follows:
Economic - technical rate
Security systems 25%
Generic plants da 3% a 20%
Other specific plants 15%
Conditioning plants da 3% a 14,3%
Telephone systems and equipment da 10% a 20%
Communication and telesignal plants 25%
Industrial and commercial equipment da 7,1% a 15%
Electronic office machines da 20% a 25%
Furniture and fittings da 10% a 25%
Other assets da 10% a 19%
If there are indications of a decline in value, assets are subjected to an impairment test in the manner described below under the section ‘Impairment of non-financial assets’. When the reasons for a write-down no longer apply, the asset’s cost may be reinstated. The increased carrying amount attributable to the reversal of an impairment loss does not exceed the carrying amount that would have been determined (net of depreciation) had no impairment loss been recognized for the asset in prior years. This reversal is recognized in profit or loss unless the asset is carried at revalued amount, in which case it is treated as a revaluation increase. Leasing transactions
Assets acquired through financial leases are registered under property, plant and equipment, and are entered at the lower of the market value and the value obtained by time-discounting the rents and redemption price determined at the time the contract is signed. The liabilities in question are entered under ‘Financial liabilities’. The leases, in which the lessor substantially maintains the risks and benefits associated with the ownership of assets, are itemized as operating leasing. The earnings (costs) emerging from operating leasing are entered in linear fashion in the income statement during the life of the leasing contract. Impairment of non-financial assets IAS 36 requires the testing of property, plant and equipment and intangible assets for impairment when there are indications that impairment has occurred. In the case of goodwill and other assets with indefinite lives or assets that are not available for use, this test must be conducted at least annually. In the case of goodwill and other assets with indefinite lives or assets that are not available for use, this test must be conducted at least annually. In the case of goodwill, the Group carries out the impairment tests foreseen by IAS 36 in respect of all cash generating units to which goodwill has been allocated. The recoverability of a carrying amount is tested by comparing it against an asset’s fair value, less cost to sell, when there is an active market, or its value in use, whichever is greater. Value in use is the present value of future cash flows expected to be derived from an asset or a Cash Generation Unit (CGU) and from its disposal at the end of its useful life.

Esprinet 2014 Consolidated Financial Statement
66
CGUs have been identified within the Group’s organizational and business structure as homogeneous groups of assets that generate cash inflows independently through the continued use of the assets included in each group. Deferred income tax assets
Deferred income tax assets are recorded at face value. They are entered in the books when their recovery is deemed probable. See also the comment under item ‘Income taxes’. Financial assets
Receivables and financial fixed assets that will be held until their maturity are stated at the cost represented by the fair value of the initial payment given in exchange, increased by the costs of the transaction (e.g. commissions, consultancy fees, etc.). The initial statement value is subsequently modified to take into account any capital repayments, write-downs and amortization of the difference between the reimbursement value and the initial statement value. The amortization is carried out based on the effective internal rate which is the rate that renders the current value of expected cash flows and the initial statement value identical at the moment of the initial statement (so-called amortized cost method). Financial assets destined for negotiation and financial assets available for sale are stated at fair value with the effect accounted in the income statement item ‘Finance income/(cost)’ and the Shareholders’ Equity item ‘Other reserves’ respectively. When the purchase or sale of a financial asset foresees the payment for the transaction and the delivery of the asset within a set number of days, established by the market authorities or by convention (e.g. purchase of shares on regulated markets), the transaction is stated at the payment date. Financial assets that are sold are eliminated from the assets when the right to receive cash flow is transferred together the risks and benefits associated with the ownership of that asset. At each reporting date the Group assess whether there is any indication that a financial asset or a group of financial assets may be impaired.
Current assets
Inventory
Stock is taken at the lower of acquisition cost and realizable value, as obtained from market trends, whilst taking into account the features peculiar to the target sector of the Group concerned, which sells mainly IT products and consumer electronics that rapidly become obsolete. The configuration of cost adopted when valuating stock is based on the FIFO method of accounting. Purchase cost considers additional expenses as well as any discounts and allowances granted by vendors, in accordance with the sector’s standard business practice, in relation to predetermined sales targets being achieved and marketing activities being adequately developed in order to promote the brands being distributed and to develop the sales channels utilized. Cost includes ‘price protections’ on inventories granted by suppliers on the purchasing prices. Obsolete and surplus stock and stock characterized by slow turnover is written down to reflect the chances of selling it.
Trade and other receivables
Trade and other receivables are initially stated at ‘fair value’. After first appraisal, receivables are stated at the amortized cost based on the real IRR (Internal Rate of Return), that is, the rate that renders the current value of expected cash flows and the initial statement value identical at the moment of the initial appraisal (so-called amortized cost method). The amount obtained using the amortized cost method, is then reduced to the realizable amount in the case of loss occurring. Write-downs are determined by considering the solvency of individual creditors, the insurance coverage and the level of credit risk, based on the available information and accumulated historical experience. Receivables assigned without recourse can be de-recognized only when they meet the de-recognition requirements of IAS 39.

Esprinet 2014 Consolidated Financial Statement
67
Income tax assets
Current taxation assets are stated at fair value; they include all those assets that are taxable by the Tax Authorities or that can be financially compensated in the short term. For further information please refer to the heading ‘Income taxes’. Other current assets
Other current assets are stated at the lesser of the cost and the net realizable value. Cash and cash equivalents
Cash in hand includes all liquid funds and deposits in bank accounts that are immediately available, as well as other liquidity with a duration of less than three months. The liquid funds in euro are stated at their face value, while liquid funds in other currencies are stated at the current exchange rate at the end of the year.
Non-current assets held for sale
A non-current asset held for sale (or assets of a disposal group) is an asset whose carrying amount will be recovered principally through a sale transaction rather than through continuing use. As consequence a non-current asset held for sale is measured at the lower of its carrying amount and fair value less costs to sell, and depreciation on such asset ceases. It is available for immediate sale in its present condition subject only to terms that are usual and customary for sales of such assets (or disposal group) and its sale is highly probable.
Net equity
Own shares
Where existing, own shares are stated at cost and deducted from equity. In the case of any subsequent sale, the difference between the cost of own shares and the selling price is recognized in equity.
Current and non-current liabilities
Financial liabilities
Financial liabilities are recognized in the statement of financial position when, and only when, the Group becomes a party to the contractual provisions of the instrument. Financial liabilities are initially stated at fair value, to which any eventual costs related to the transaction are added. Afterwards, financial liabilities are stated at the amortized cost using the actual interest rate for the discount calculation. Financial liabilities are removed from the income statement once the obligation specified in the contract has been fulfilled, cancelled or expired. The difference between the book value of the financial liability which is paid off or transferred to another party and the sum paid is reported in the income statement. The fair value of a financial asset or liability quoted in an active market is defined, at each reporting date, in terms of the quoted market price or of the dealers’ price (‘bid price’ for asset held or liability to be issued, ‘asking price’ for an asset to be acquired or a liability held), without any deduction for transaction costs. If the market for a financial instrument is not active the fair value is established by using a valuation technique. Valuation techniques include using recent arm’s length market transactions between knowledgeable, willing parties, if available, reference to the current fair value of another instrument that is substantially the same, discounted cash flow analysis or other valuation models. Provisions for risks and charges
Provisions are made when: (i) there is the probable existence of an obligation, be it actual, legal or implicit, due to past events; (ii) it is probable that the fulfilment of the obligation be against payment; (iii) the amount of the obligation can be reasonably ascertained. The provisions are stated at the value that represents the best estimate of the year. Where there is a significant financial effect over time and the payment date of the obligations can be reasonably estimated, the provisions are actualized; the increase in the provisions linked to the passing of time is stated in the separate income statement in the item ‘Finance costs’.
Esprinet 2014 Consolidated Financial Statement
68
Staff post-employment benefits
Staff post-employment benefits are defined on the basis of plans which even though not yet official are called either ‘fixed contribution’ or ‘defined benefit’ plans, depending on their characteristics. In the ‘fixed contribution’ plans the obligation of the company, limited to the payment of contributions to the State or entity or a distinct legal authority (fund), is calculated on the basis of the contributions owed. Until the 2007 Financial Law and relative enforcing decrees came into force, the uncertainty regarding payment times meant that staff severance indemnity (TFR) was likened to a defined benefit plan. Following the reform, the allocation of accruing staff severance indemnity quotas to the pension fund or to INPS, the Italian Social Security body, caused the transformation of the plan into a fixed contribution plan, where the company’s obligation is exclusively the payment of the contributions either to the fund or to INPS. Liabilities relating to past staff severance indemnity still represent a defined benefits plan calculated by independent actuaries using an actuarial-type method. During 2013 actuarial profits and losses, deriving from changes to actuarial hypotheses, are reported in an appropriate equity reserve figure as required by the IAS19 R. Pursuant to IAS 19, the above-mentioned reform has made it necessary to recalculate the value of the past staff severance indemnity provision due to the exclusion of the actuarial hypotheses linked to salary increases and the revision of financial-type hypotheses. This effect (curtailment) has been reported in the 2007 separate income statement in reduction of personnel costs. Payables, other debts, other liabilities
Payables, other debts and other liabilities are initially reported at their fair value increased by any costs linked to the transaction. They are later reported in the income statement at their face value, since no time-discounting or separate entry of interest payable is deemed necessary given the foreseen payment times. Provisions for presumed debt are liabilities paid for goods or services which have been received or supplied but not yet paid and include amounts due to staff or other subjects. The degree of uncertainty regarding the timing or amount of the allocations for ‘Other debt/liability’ is rather less than that of the provisions. For further details regarding trade payables please see ‘Definitions’ below.
Income statement
Revenues and expenses
Revenues from sales and services are stated at the moment of transfer of the typical risks and advantages of property or at the time the service is performed. Revenues are recognized at the time of shipment when the risk of loss is transferred to the buyer at that time. Revenues are stated net of returns, discount, allowances and bonuses, as well as directly related taxation. Costs are recognized when related to goods and services sold or used in the period or proportionally when their useful future life cannot be determined. The purchase cost of products is reported net of any discounts granted by vendors for ‘protection’ provided in respect of price-list reductions and product replacements. Credits arising from any such allowances are recorded by using the accrual method of accounting, based on information from the vendors concerned. Discounts granted for immediate cash payments of invoices payable upon presentation are used to reduce the cost of the products purchased, since – as is standard practice in the sector in which the Group operates – the commercial component is considered predominant. Dividends
Dividend payable is stated at the date of approval of the decision by the Assembly. Earnings per share

Esprinet 2014 Consolidated Financial Statement
69
Basic
Basic earnings per share are calculated by dividing the Group’s year-end profit by the weighted average number of ordinary shares in issue during the year, excluding ordinary shares purchased by the company and held as own shares.
Diluted
The diluted profit per share is calculated by dividing the Group’s year-end profit by the weighted average of ordinary shares in circulation during the accounting period, excluding any own shares. For the purposes of the calculation of the diluted profit per share, the weighted average of the shares in circulation is modified by assuming the exercising by all owners of rights that potentially having diluting effects, while the net result of the Group is adjusted to take into account any effects, net of taxes, of the exercising of said rights. The result per diluted share is not calculated in the case of losses, in that any diluting effect would determine an improvement in the result per share. Stock grants
Labour costs include stock options and/or stock grants awarded to managers in as much as they represent actual remuneration accruing at the closing date of the financial statements. The cost is calculated in reference to the fair value of the assignment awarded to the employee. The portion belonging to the period is calculated pro rata temporis over the vesting period. The fair value of assigned stock grants is measured by the ‘Black-Scholes and is stated in the form of a counterparty in the ‘Reserves’. Income taxes
Current income taxes are calculated with an estimate of taxable income for each company of the Group; the forecast payable is stated in the item ‘Current income tax liabilities’ but, if surplus accounts have been paid, the receivable is stated in the item ‘Current income tax assets’. Tax payables and receivables for current taxation are stated at the value that it is expected to pay to or to recover from the Tax Authorities when applying the rates and current tax law or laws which have been substantially approved at the end of the period. Deferred and advance income taxes are calculated using the ‘liability method’ on the temporary differences between the values of assets and liabilities stated on the statement of financial position and the corresponding values recognized for tax purposes. The statement of assets for advanced taxation is made when their recovery is probable. Deferred and advance taxation are not stated if they are linked to the initial statement of an asset or liability in a different transaction by a business combination and that does not have an impact on the results and taxable income. Assets for advanced taxation and liabilities for deferred taxation are stated in the fixed assets and liabilities and are off-set for each single company if they are taxes that can be off-set. If the balance of this off-set is positive, it is stated in the item ‘Deferred income tax assets’; if it is negative, it is stated in the item ‘Deferred income tax liabilities’. Foreign currency translation, transactions and balances
Functional and presentation currency
Items included in this financial statement are measured using the currency of the primary economic environment in which each Group’s entity operates (the functional currency). The consolidated financial statements are presented in euro, which is the Group’s functional and presentation currency. Currency transactions and balances
Foreign currency transactions are entered under functional currency using the exchange rates prevailing at the date of the transactions. Monetary assets and liabilities in foreign currency are converted into euro by applying the current exchange rate at the end of the period and the effect is stated in the separate income statement. Non-monetary assets and liabilities in foreign currency valued at cost are stated at the initial exchange rate; when they are valued at fair value or their recoverable or sale value, the current exchange rate is used on the date that the evaluation is made.
Esprinet 2014 Consolidated Financial Statement
70
Exchange ratePunctual at
31.12.2014Average period
Hong Kong Dollar (HKD) 9.42 10.30
Sw iss franc (CHF) 0.83 0.82
Financial derivatives
Derivatives are financial assets and liabilities that are stated at their fair value. Derivatives are classified as hedging instruments when the relationship between the derivative and the underlying instrument is documented and the effectiveness of the hedge is both high and regularly verified. When a derivative covers the risk of variation of cash flow of the underlying instrument (cash flow hedge; e.g. to cover the variability of cash flow of assets/liabilities due to changes in interest rates), the variation in the fair value of the derivative is initially stated in the shareholders’ equity (and, consequently, in the statement of comprehensive income) and afterwards in the separate income statement in line with the economic effects produced by the covered transaction. If the hedging instrument expires or is sold, terminated or exercised (replacement excluded), or if the entity revokes the designation of the hedging relationship, the cumulative gain or loss on the hedging instrument recognized directly in equity from the period when the hedge was effective shall remain separately recognized in equity until the forecast transaction occurs. Variations of fair value derivatives that do not fulfil the requirements necessary to be defined as hedging instruments are stated in the separate income statement. Other information
Please note that the information required by Consob regarding significant operations and balances with related parties has been entered separately in the statement of accounts solely when significant and can also be found under ‘Other significant information’.
2.7 Critical accounting estimates and definitions
2.7.1 Introduction
The IT and electronic consumables distribution sector presents some significant specific features, as it is to some extent independent of geographic constraints, especially as regards commercial relations with suppliers of products or vendors. This is particularly evident in the conditions and formation of the so-called back-end profit margin, which results from the difference between the purchase price of the products and the sales price to the final consumer or reseller according to the terms of each supplier (with respect of the distributor’s main function which naturally remains that of brokering the flow of products between supplier/producer and reseller/retailer). Purchase conditions typically provide for a basic discount on end-users’/resellers’ price lists and a series of additional conditions that vary from vendor to vendor in terms of function and terminology but which can normally be summarized in the following categories: - bonuses/rebates for attaining targets (‘sell-in’, ‘sell-out’, number of clients, logistic efficiency); - development funds, co-marketing and other incentives; - cash discounts (so-called ‘prompt payment discounts’). The Esprinet Group further benefits from current agreements with almost all the vendors in the form of specific contractual protections concerning the value of unsold stock, the aim of which is to neutralise the financial risk associated with variations in list prices of products ordered (‘price protection’) or already present in the distributor’s warehouses (‘stock protection’), within certain limits. In the first case, the protection is generally recognised through the invoicing of products ordered and not yet sent at the new price; in the second case, the vendor usually accords a credit equal to the reduction in price of the products.

Esprinet 2014 Consolidated Financial Statement
71
As for the cash discounts, these are generally recognised following respect of the contractually fixed payment terms and provide an incentive to pay punctually. These conditions allow for deferred payments in all cases with respect to the issue of the relative invoice or sending of the merchandise. In line with what happens for the financial discounts offered to some selected groups of customers, which are accounted for as reduced earnings, the cash discounts are accounted for in the form of reduced purchase costs. It is not possible within the sector to establish mid-norm payment terms policies regarding payment to suppliers as there is a considerable variety of conditions according to supplier. More in particular, the intervals in deferral of payments set out in the invoices range from a minimum of 7 to a maximum of 120 days, and in only one case is cash payment required. In some cases, the payment terms set out in the invoice are the object of further agreed deferrals, for each shipment or on the basis of clearly-defined commercial programmes set up by the suppliers. In the cases in which the above-mentioned deferrals carry an additional charge, the interest rate applied is not explicit, except in rare cases. Further, it often happens that implicit deferral terms – sometimes applied through a reduction in the contractually agreed cash discounts – have no connection with the current financial market rates, thus revealing how the commercial item takes precedence over the strictly financial item compensating for the delay between the date the debt arises and its effective payment. This element is also suborned by the relatively brief duration, on average, of the deferral period, even when extended, which never, except in rare cases, exceeds 90 days. 2.7.2 Critical Definitions
For the purposes of the drafting of the present statement of accounts, and as a further qualification of the definitions contained in the IFRS, some conventional definitions regarding the nature of the liability entries have been adopted. Financial debt
‘Financial debt’ is the term used to describe obligations to pay given amounts on a given date arising from the obtaining of financial liquidity as a loan.
These include the type of transaction set out below, prevalently of a financial character and explicitly remunerated, and, in terms of the identity of the creditor, typically represented by a financial body or institution. As examples, and regardless of the item’s current or non-current character, the following liabilities are considered financial debt: - payables to banks; - payables to leasing companies (financial leasing operations); - payables to factoring companies (without recourse advances). Not included in the category of financial debt are those liabilities which, although not deferred payment for the purchase of goods or services, nevertheless do not strictly constitute loans. By contrast, costs deriving from the above-mentioned loans, including interest on current account overdrafts, on short and medium/long-term loans, the amortisation of initial loan operation costs, costs associated with financial leasing and exchange-rate differences, are entered in the books among the financial costs. Trade payables
The category ‘payables to suppliers’ includes liabilities arising from the deferred purchase of goods or services. Liabilities representing the deferred payment of goods or services are therefore entered under payables to suppliers at their face value, since no updating and separate itemisation in the income statement in terms of explicit or separate interest due is deemed necessary for considering the expected payment times.
2.7.3 Critical accounting estimates and assumptions
The preparation of the financial statements and the related notes has required the use of estimates and assumptions both in the measurement of certain assets and liabilities and in the valuation of contingent

Esprinet 2014 Consolidated Financial Statement
72
assets and liabilities. Estimates and assumptions have been made based on historical experience and other factors, including expectations of future events, the manifestation of which are deemed reasonable. Estimates and assumptions are revised on a regular basis, and the impact of such revision is immediately recognised in the income statement in the period of the change, if the change affects that period only, or in the period of the change and future periods if the change affects both. The assumptions regarding future performance are characterized by uncertainties. This means that different results - obviously neither estimable nor foreseeable, today – which might even cause significant adjustments to the book values of the relative items, cannot be excluded for the next financial year. The financial statement items mainly affected by these situations of uncertainty are certain sales revenues, some sales reversals, the provisions for risks and charges, the allowances for doubtful accounts, depreciations and amortisation, employee benefits, income taxes and goodwill. The critical valuation processes and the estimates and assumptions deemed likely to produce significant effects on the financial situation of the Esprinet Group, should the future events set out not take place in whole or in part, are summarised below. Goodwill
For purposes of verifying loss of goodwill value entered in the books, the ‘value in use’ of the Cash Generating Units (‘CGUs’) to which a goodwill value has been attributed has been calculated. The CGUs have been identified within the Group’s organisational and business structure as homogeneous groups of assets that generate cash inflows independently, through the continued use of the assets included in each group. The use value has been calculated by the discounting back of expected cash-flows for each CGU as well as of the value expected from its disposal at the end of its useful life. To this end, the so-called Discounted Cash Flow Model (DCF) has been used, which requires that future financial flows be discounted at a rate adjusted to the specific risks of each single CGU. ‘Fair value’ of derivatives
For purposes of the present statement of accounts it has been necessary to measure the fair value of the two IRS - Interest Rate Swap contracts signed in December 2007 in order to hedge the risk of changes in future cash flows of the hedged loans technically defined as ‘amortising - forward start’. Their conditions fully comply with International Accounting Standard 39 regarding ‘hedge accounting’ (formal designation and documentation of the hedging relationship; hedge expected to be highly effective and reliably measured; forecast transaction highly probable and affecting profit or loss) and as a consequence, both of the two derivative contracts were subject to the ‘cash flow hedge’ accounting rules. At inception date the portion of the gain or loss on the hedging instrument (that has been determined to be an effective hedge) has been recognised directly in equity. Subsequent changes in fair value of the expected future cash flows on the hedge item from inception of the hedge (due to changes in the interest rate curve) have been similarly recognised directly in equity (always within limits of being an effective hedge) and, consequently, shown in the statement of comprehensive income. Stock grant
For the purposes of the present statement of accounts, it has been necessary to include in the books the economic/asset effects associated with the stock grant plans in favour of some managers of Esprinet S.p.A., the operation of which is better illustrated in the paragraphs ‘Share incentive plans’ and ‘Share capital’. The cost of these plans have been specifically determined with reference to the fair value of the rights assigned to the single beneficiaries at assignment date. Bearing in mind the unusual and manifold operating conditions – in part governed by the consolidated financial results of the Group and in part by the permanence of the beneficiary in the Group until the vesting date of the plans – this fair value has been measured using the ‘Black-Scholes’ method, taking expected volatility, presumed dividend yield and the risk-free interest rate into account.
Esprinet 2014 Consolidated Financial Statement
73
Revenue recognition
For purposes of recognising earnings on sales and services, insufficient information regarding haulers’ actual consignment dates, means that dates are usually estimated by the Group on the basis of historical experience of average delivery times which differ according to the geographical location of the destination. Credit notes due from vendors
Bearing in mind the unusual practices of the sector regarding the way purchase and sale conditions are defined and, ultimately, the way the trading margin is formed and stated, estimates are usually effected by the Group, especially where the occurrence of events might provoke significant financial effects. Estimates of the sums of credit notes due from vendors to suppliers as rebates for the achieving of targets and incentives of various kinds, reimbursements for joint marketing activities, contractual stock protection, etc. at the drafting date of this document are referred to in particular. The Group has developed a series of procedures and checks to minimise possible errors in evaluations and estimates of the credit notes due. The possibility of differences emerging from between the estimated sums and those actually received in the final statement of financial position cannot be excluded, however. Depreciation and amortisation of fixed assets
Tangible and intangible assets with a defined useful life are systematically depreciated throughout their useful life. Useful life is defined as the period in which the activities will be used by the Group. This is estimated on the basis of experience with similar assets, market conditions and other events likely to exercise any influence on the useful life including, just as an example, significant technological changes. As a result, the actual economic life may differ from the estimated useful life. The validity of the expected useful life in terms of its asset category is regularly checked by the Group. This revision may result in variations to the periods of depreciation and amortization quotas in future accounting periods. Bad debt provision
For purposes of calculating the presumed degree of encashment of receivables, the Group makes forecasts concerning the degree of solvency of the other parties, on the basis of available information and historical experience. The actual value of encashment of receivables may differ from that estimated because of uncertainties regarding the conditions underlying the appraisal of solvency made. Any extension and/or deterioration of the present economic and financial crisis may cause a further worsening in the financial conditions of the Group’s debtors as opposed to that already taken into consideration when estimating the provision entered in the statement of financial position. Stock obsolescence provision
The Group usually effects forecasts regarding the value of encashment of obsolete, surplus or slow-moving warehouse stocks. This estimate is mainly based on historical experience and takes into consideration the peculiarities of the respective stock sectors. The value of encashment of the stocks may differ from that estimated because of the uncertainty affecting the conditions underlying the estimates made. The present economic and financial crisis may cause a further worsening in market conditions compared with that taken into consideration when estimating the provision entered in the financial statements. Provision for risks and charges
The Group makes provision for risks and charges on the basis of assumptions referred essentially to sums that might reasonably be paid to meet obligations for payment relating to past events. The estimate is the result of a complex process including the involvement of legal and tax consultants and which also includes personal opinions on the part of the Group's management. The sums actually paid to extinguish or transfer the obligations for payment to third parties may also differ significantly from those estimated for purposes of provision.

Esprinet 2014 Consolidated Financial Statement
74
Benefits to employees
Liabilities arising from benefits to employees subsequent to the employment noted in the statement of accounts are calculated by the application of actuarial methods as per IAS 39. These methods have required the identification of several employment possibilities and estimates of a demographic (probability of death, disability, leaving the labour market, etc.) and financial nature (technical rate of discounting back, inflation rate, rate of increase in remuneration, rate of increase of severance indemnity). The validity of the estimates made depends essentially on the stability of the regulations used as a reference point, the progress of market interest rates, the progress of the remuneration dynamics and eliminations, and also on the frequency of access to advances on the part of employees.
Taxes
Current income taxes are calculated on the basis of the estimate of liable earnings, by applying the current fiscal rates pertaining on the date of the drafting of the statement of accounts. Deferred and advance taxes are determined by the temporary differences arising between the values of the assets and liabilities reported and the corresponding values recognised for tax purposes, using those tax rates considered possible upon encashment of the asset or extinguishment of the liability. Deferred tax assets are registered when the associated recovery is deemed probable; this probability depends upon the effective existence of taxable results in the future enabling deductible temporary differences to be used. The future taxable results have been estimated by taking into consideration the budget results and the plans consistent with those used to effect impairment tests. The fact that deferred tax assets refer to temporary tax differences/losses, a significant amount of which may be recovered over a very long time-span, compatible therefore with a situation where overcoming the crisis and economic recovery might extend beyond the time-frame implicit in the aforementioned plans, has also been taken into account.
2.8 Recently issued accounting standards
The IASB (International Accounting Standard Board) and the IFRIC (Financial Reporting Interpretation Committee) have approved some variations of IFRS (International Financial Reporting Standards) and some interpretations, some of which already endorsed and published in the Official Journal of the European Union, applicable starting 1 January 2014. Changes (new or revised accounting principles, additions to the same, new interpretations) specifically significant for the Group are as follows. IFRS 10 Consolidated Financial Statements, IAS 27 (2011). Separate Financial Statements IFRS 10 introduces a single control model to be applied to all companies, including special purpose entities. IFRS 10 replaces the part of IAS 27 — Consolidated and Separate Financial Statements regulating the preparation and presentation of consolidated financial statements, and SIC-12 — Consolidation - Special Purposes Entities. IFRS 10 changes the definition of control, establishing that an investor controls an investee when it is exposed, or has rights, to variable returns from its involvement with the investee and at the same time has the ability to affect those returns through its power over the investee. An investor must possess all of the following to be deemed to control an investee: (a) power over the investee; (b) exposure, or rights, to variable returns from its involvement with the investee; and (c) the ability to exert power over the investee to affect the amount of its returns. IFRS 10 did not have any impact on the consolidation of the Group’s shareholdings. IFRS 11 Joint Arrangements and IAS 28 (2011) – Investments in Associates and Joint Ventures. IFRS 11 replaces IAS 31 – Interests in Joint Ventures and SIC 13 – Joint Controlled Entities – Non Monetary Contributions by Venturers and eliminates the option to account for joint ventures by using the proportional consolidation method. If companies are considered joint ventures according to IFRS 11 definitions, they must be accounted for using the equity method. IFRS 11 had no impact on the shareholdings in associate company or joint ventures held by the Group. IFRS 12 Disclosure of Interests in Other Entities. IFRS 12 establishes disclosure requirements for interests held by an entity in subsidiaries, joint ventures, associates and structured entities. Those disclosure requirements do not apply to condensed interim financial statements, unless material events and/or

Esprinet 2014 Consolidated Financial Statement
75
transactions during the period entail a need to provide such disclosures. Accordingly, the Group has not provided the disclosures envisaged in IFRS 12 in its Condensed Consolidated Six Monthly Report. Investment entities - Amendments to IFRS 10, IFRS 12 and IAS 27. These amendments provide for an exemption from consolidation for entities that meet the definition of investment entities provided in IFRS 10 - Consolidated Financial Statements. The exemption from consolidation requires that investment entities measure their subsidiaries at fair value through profit or loss. These amendments had no impact on the Group in that none of the Group’s entities qualify as an investment entity as defined in IFRS 10. Offsetting Financial Assets and Financial Liabilities – Amendments to IAS 32. The amendments provide clarifications on the meaning of legally enforceable right of set-off and on the application of offsetting rules regarding settlement systems (such as centralised clearing systems) that settle on a non-simultaneous gross basis. These amendments had no impact on the Group’s Financial Statements. Novation of Derivatives and Continuation of Hedge Accounting – Amendments to IAS 39. These amendments allow for the continuation of hedge accounting when the novation of a hedging derivative meets certain requirements. These amendments did not have any impact on the Group. Recoverable Amount — Disclosures for Non-Financial Assets – Amendments to IAS 36. These amendments remove the unintentional consequences of IFRS 13 for the disclosures required by IAS 36. In addition, these amendments require disclosure of the recoverable amount of assets or CGUs for which an impairment loss has been recognised or reversed during the year. These amendments did not have any impact on the Group. Recoverable Amount — Disclosures for Non-Financial Assets – Amendments to IAS 36. These amendments remove the unintentional consequences of IFRS 13 for the disclosures required by IAS 36. In addition, these amendments require disclosure of the recoverable amount of assets or CGUs for which an impairment loss has been recognised or reversed during the year. These amendments did not have any impact on the Group. The Group has not early adopted any other standard, interpretation or amendment that has been issued but is not yet effective. Principles and interpretations issued but yet not effective at the balance sheet date are as follows: IFRIC 21 – ‘Levies’. IFRIC 21 clarifies that an entity recognises a liability for a levy when the activity that triggers payment, as identified by the relevant legislation, occurs. For a levy that is triggered upon reaching a minimum threshold, the interpretation clarifies that no liability should be anticipated before the specified minimum threshold is reached. IFRIC 21 is effective for annual periods beginning on or after 17 June 2014.
3. Segment information
3.1 Introduction
An operating segment is a component of the Group:
a) that engages in business activities from which it may earn revenues and incur expenses (including revenues and expenses relating to transactions with other components of the same Group);
b) whose operating results are regularly reviewed by the Group’s chief operating decision maker to make decisions about resources to be allocated to the segment and assess its performance;
c) for which discrete financial information is available. The Esprinet Group is organised in the geographical business areas of Italy and Spain (operating segments) where it performs the business-to-business (B2B) distribution of Information Technology (IT) and consumer electronics. The B2B IT and consumer electronics distribution is aimed at professional dealers, including large-scale distributors/retailers, and regards traditional IT products (desktop PCs, PC notebooks, printers, photocopiers, servers, standard software, etc.), consumables (cartridges, tapes, toners, magnetic supports), networking products (modems, routers, switches), state-of-the-art digital and entertainment products such as photo cameras, video cameras, videogames, LCD TVs, handhelds and MP3 readers.

Esprinet 2014 Consolidated Financial Statement
76
Solely in Italy, the Group was also marginally active in the business-to-consumer (B2C) IT and consumer electronics distribution and business-to-business (B2B) micro-electronic components distribution business segments, both disposed before 31 December 2014. A ‘geographical segment’ is engaged in providing products or services within a particular economic environment that are subject to risks and returns that are different from those achievable in other geographical segments. A ‘business segment’ is a group of assets and operations engaged in providing products or services that are subject to risks and returns that are different from those of other business segments. Although the organisation by geographical segments is the main way of managing and analysing the Group’s results, the next tables also provide a fuller picture of the operating results and assets balances of the business segments where the Group operates in Italy.
3.2 Segment results
The separate income statement, statement of financial position and other significant information regarding each of the Esprinet Group’s operating segments are as follows:
Separate income statement and other significant information by operating segments:
Italy Spain
(euro/000) Distr. IT &
CE B2B
Distr. IT
& CE B2C
Electr.
Comp.
Distr.
Elim. and
other Total %
Distr. It
& CE B2B %
Elim.
and
other
Group
Sales to third parties 1,689,587 - - - 1,689,587 601,554 - 2,291,141
Intersegment sales 43,901 - - - 43,901 - (43,901) -
Sales 1,733,488 - - - 1,733,488 601,554 (43,901) 2,291,141
Cost of sales (1,616,872) - - (88) (1,616,960) (576,161) 43,816 (2,149,305)
Gross profit 116,616 - - (88) 116,528 6.90% 25,393 4.22% (85) 141,836
Sales and marketing costs (33,112) - - - (33,112) -1.96% (4,924) -0.82% (345) (38,381)
Overheads and admin. costs (50,252) - - - (50,252) -2.97% (12,471) -2.07% 354 (62,369)
Operating income (Ebit) 33,252 - - (88) 33,164 1.96% 7,998 1.33% (76) 41,086
Finance costs - net (1,987)
Share of profits of associates 1
Profit before income tax 39,100
Income tax expenses (13,413)
Profit from continuing operations 25,687
Income/(loss) from disposal groups 1,126
Net income 26,813
- o f which attributable to non-contro lling interests (222)
- of which attributable to Group 27,035
Depreciation and amortisation 2,710 - - - 2,710 307 251 3,268
Other non-cash items 3,363 - - - 3,363 243 - 3,606
Investments 2,900 693 - 3,593
Total assets 742,357 244,384 (119,365) 867,376
2014
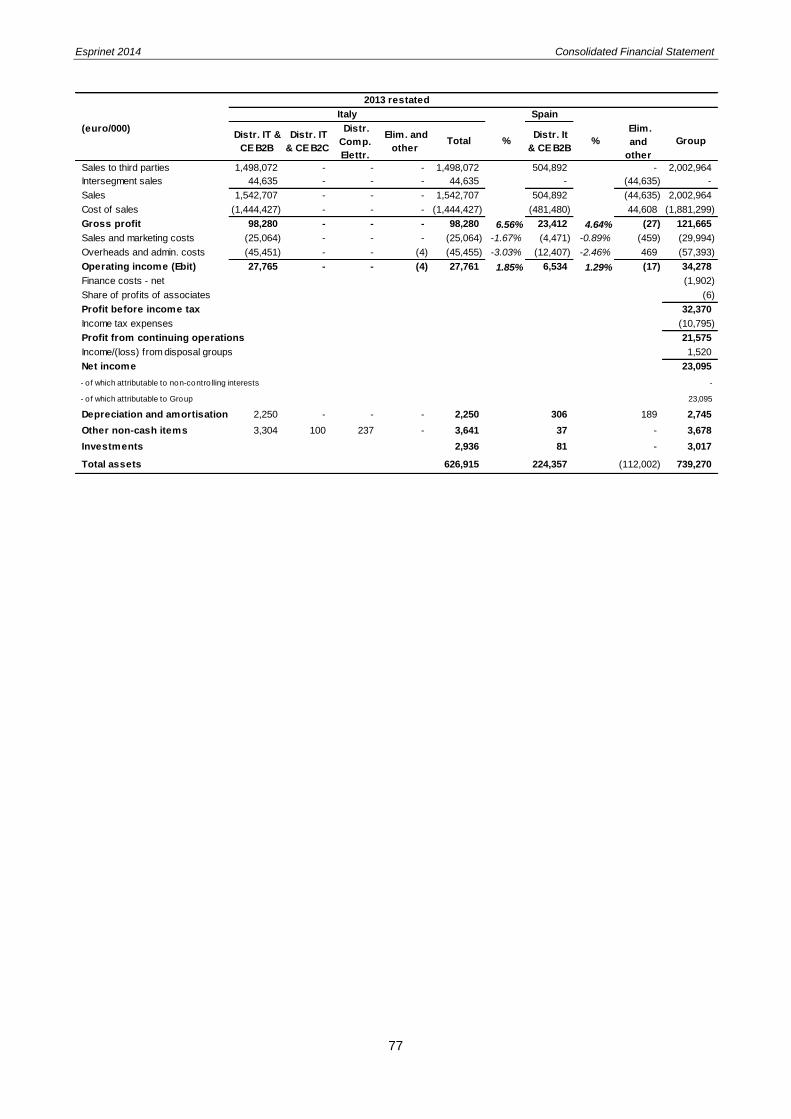
Esprinet 2014 Consolidated Financial Statement
77
Italy Spain
(euro/000) Distr. IT &
CE B2B
Distr. IT
& CE B2C
Distr.
Comp.
Elettr.
Elim. and
other Total %
Distr. It
& CE B2B %
Elim.
and
other
Group
Sales to third parties 1,498,072 - - - 1,498,072 504,892 - 2,002,964
Intersegment sales 44,635 - - - 44,635 - (44,635) -
Sales 1,542,707 - - - 1,542,707 504,892 (44,635) 2,002,964
Cost of sales (1,444,427) - - - (1,444,427) (481,480) 44,608 (1,881,299)
Gross profit 98,280 - - - 98,280 6.56% 23,412 4.64% (27) 121,665
Sales and marketing costs (25,064) - - - (25,064) -1.67% (4,471) -0.89% (459) (29,994)
Overheads and admin. costs (45,451) - - (4) (45,455) -3.03% (12,407) -2.46% 469 (57,393)
Operating income (Ebit) 27,765 - - (4) 27,761 1.85% 6,534 1.29% (17) 34,278
Finance costs - net (1,902)
Share of profits of associates (6)
Profit before income tax 32,370
Income tax expenses (10,795)
Profit from continuing operations 21,575
Income/(loss) from disposal groups 1,520
Net income 23,095
- o f which attributable to non-contro lling interests -
- o f which attributable to Group 23,095
Depreciation and amortisation 2,250 - - - 2,250 306 189 2,745
Other non-cash items 3,304 100 237 - 3,641 37 - 3,678
Investments 2,936 81 - 3,017
Total assets 626,915 224,357 (112,002) 739,270
2013 restated

Esprinet 2014 Consolidated Financial Statement
78
Statement of financial position by operating segments
Distr. IT
& CE
B2B
Distr. IT
& CE
B2C
Electr.
Comp.
Distr.
Elim.
and
other
Total Italy
Distr. IT
& CE
B2B
Elim.
and
other
Group
ASSETS
Non-current assets
Property, plant and equipment 9,191 - - - 9,191 1,080 - 10,271
Goodw ill 10,626 - - 5,020 15,646 58,561 1,039 75,246
Intangible assets 944 - - - 944 77 - 1,021
Investments in associates 55 - - (10) 45 - - 45
Investments in others 83,602 - - (7,965) 75,637 - (75,637) -
Deferred income tax assets 4,014 - - 28 4,042 5,850 40 9,932
Receivables and other non-current assets 4,431 - - - 4,431 197 - 4,628
112,863 - - (2,927) 109,936 65,765 (74,558) 101,143
Current assets
Inventory 195,347 - - (89) 195,258 58,359 (129) 253,488
Trade receivables 201,100 - - - 201,100 74,883 - 275,983
Income tax assets 1,774 - - - 1,774 - - 1,774
Other assets 54,094 - - - 54,094 397 (44,677) 9,814
Cash and cash equivalents 180,194 - - - 180,194 44,980 - 225,174
632,509 - - (89) 632,420 178,619 (44,806) 766,233
Disposal groups assets - - - - - - - -
Total assets 745,372 - - (3,016) 742,356 244,384 (119,364) 867,376
EQUITY
Share capital 9,131 - - (1,270) 7,861 54,693 (54,693) 7,861
Reserves 240,191 - - (10,667) 229,524 14,467 (6,208) 237,783
Group net income 39,565 - - (3,054) 36,511 4,285 (13,761) 27,035
Group net equity 288,887 - - (14,991) 273,896 73,445 (74,662) 272,679
Non-controlling interests - - - 2,217 2,217 - (24) 2,193
Total equity 288,887 - - (12,774) 276,113 73,445 (74,686) 274,872
LIABILITIES
Non-current liabilities
Borrow ings 68,419 - - - 68,419 - - 68,419
Derivative f inancial liabilities 128 - - - 128 - - 128
Deferred income tax liabilities 2,690 - - - 2,690 2,105 - 4,795
Retirement benefit obligations 4,569 - - - 4,569 - - 4,569
Debts for investments in subsidiaries - - - 9,758 9,758 - - 9,758
Provisions and other liabilities 2,347 - - - 2,347 387 - 2,734
78,153 - - 9,758 87,911 2,492 - 90,403
Current liabilities
Trade payables 342,566 - - - 342,566 109,474 - 452,040
Short-term financial liabilities 20,438 - - - 20,438 40,376 (40,000) 20,814
Income tax liabilities 1,111 - - - 1,111 250 - 1,361
Derivative f inancial liabilities 51 - - - 51 - - 51
Provisions and other liabilities 14,166 - - - 14,166 18,347 (4,678) 27,835
378,332 - - - 378,332 168,447 (44,678) 502,101
Disposal groups liabilities - - - - - - - -
Total liabilities 456,485 - - 9,758 466,243 170,939 (44,678) 592,504
Total equity and liabilities 745,372 - - (3,016) 742,356 244,384 (119,364) 867,376
(euro/000)
31/12/2014
Italy Spain
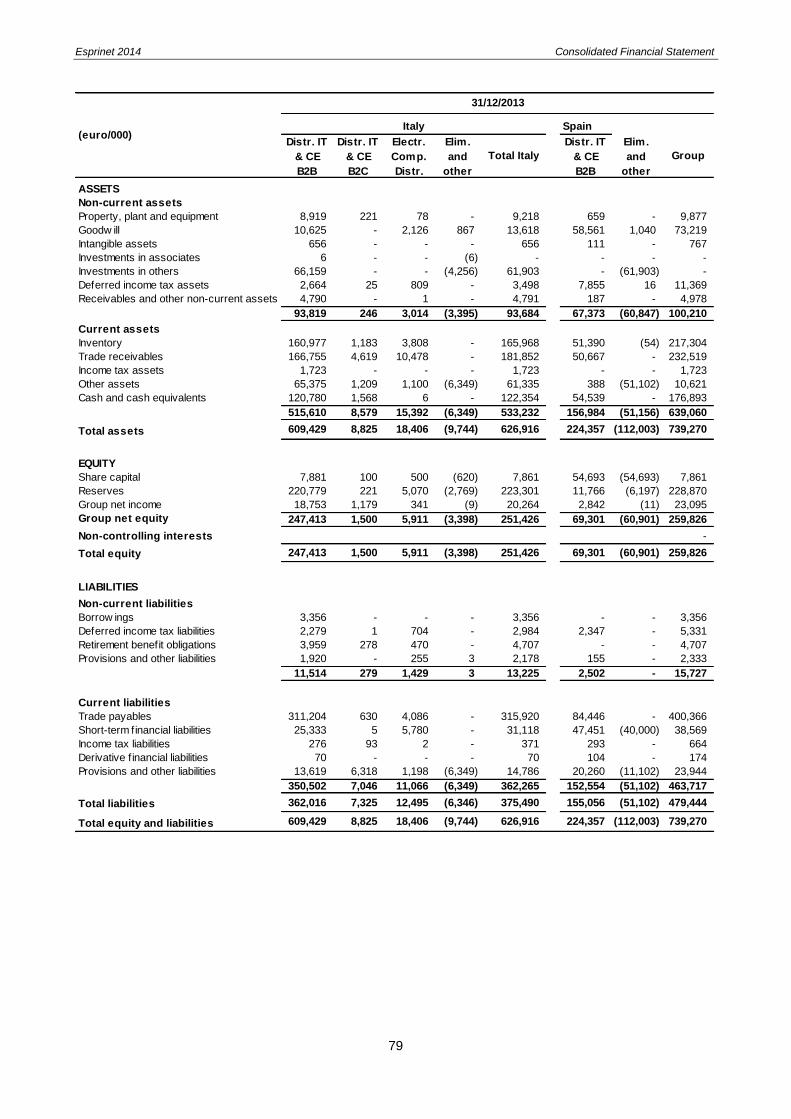
Esprinet 2014 Consolidated Financial Statement
79
Distr. IT
& CE
B2B
Distr. IT
& CE
B2C
Electr.
Comp.
Distr.
Elim.
and
other
Total Italy
Distr. IT
& CE
B2B
Elim.
and
other
Group
ASSETS
Non-current assets
Property, plant and equipment 8,919 221 78 - 9,218 659 - 9,877
Goodw ill 10,625 - 2,126 867 13,618 58,561 1,040 73,219
Intangible assets 656 - - - 656 111 - 767
Investments in associates 6 - - (6) - - - -
Investments in others 66,159 - - (4,256) 61,903 - (61,903) -
Deferred income tax assets 2,664 25 809 - 3,498 7,855 16 11,369
Receivables and other non-current assets 4,790 - 1 - 4,791 187 - 4,978
93,819 246 3,014 (3,395) 93,684 67,373 (60,847) 100,210
Current assets
Inventory 160,977 1,183 3,808 - 165,968 51,390 (54) 217,304
Trade receivables 166,755 4,619 10,478 - 181,852 50,667 - 232,519
Income tax assets 1,723 - - - 1,723 - - 1,723
Other assets 65,375 1,209 1,100 (6,349) 61,335 388 (51,102) 10,621
Cash and cash equivalents 120,780 1,568 6 - 122,354 54,539 - 176,893
515,610 8,579 15,392 (6,349) 533,232 156,984 (51,156) 639,060
Total assets 609,429 8,825 18,406 (9,744) 626,916 224,357 (112,003) 739,270
EQUITY
Share capital 7,881 100 500 (620) 7,861 54,693 (54,693) 7,861
Reserves 220,779 221 5,070 (2,769) 223,301 11,766 (6,197) 228,870
Group net income 18,753 1,179 341 (9) 20,264 2,842 (11) 23,095
Group net equity 247,413 1,500 5,911 (3,398) 251,426 69,301 (60,901) 259,826
Non-controlling interests -
Total equity 247,413 1,500 5,911 (3,398) 251,426 69,301 (60,901) 259,826
LIABILITIES
Non-current liabilities
Borrow ings 3,356 - - - 3,356 - - 3,356
Deferred income tax liabilities 2,279 1 704 - 2,984 2,347 - 5,331
Retirement benefit obligations 3,959 278 470 - 4,707 - - 4,707
Provisions and other liabilities 1,920 - 255 3 2,178 155 - 2,333
11,514 279 1,429 3 13,225 2,502 - 15,727
Current liabilities
Trade payables 311,204 630 4,086 - 315,920 84,446 - 400,366
Short-term financial liabilities 25,333 5 5,780 - 31,118 47,451 (40,000) 38,569
Income tax liabilities 276 93 2 - 371 293 - 664
Derivative f inancial liabilities 70 - - - 70 104 - 174
Provisions and other liabilities 13,619 6,318 1,198 (6,349) 14,786 20,260 (11,102) 23,944
350,502 7,046 11,066 (6,349) 362,265 152,554 (51,102) 463,717
Total liabilities 362,016 7,325 12,495 (6,346) 375,490 155,056 (51,102) 479,444
Total equity and liabilities 609,429 8,825 18,406 (9,744) 626,916 224,357 (112,003) 739,270
(euro/000)Italy Spain
31/12/2013

Esprinet 2014 Consolidated Financial Statement
80
3.3 Other information
The Group’s operating segments can be identified by the geographical markets where the Group operates: Italy and Spain. ‘Spain’ is represented by the Esprinet Iberica S.L.U. subsidiary which has business relations solely with the Esprinet S.p.A. holding company within the Italian operating segment. Besides the main B2B IT and consumer electronics distribution segment answering to the Esprinet S.p.A. holding company and to both the subsidiary V-Valley S.r.l. and Celly S.p.A., including its subsidiaries and associated foreign companies, two Italian marginal business areas, where the Group partially operated during 2014, are also included: the B2C IT and consumer electronics distribution, effected exclusively by the Monclick S.r.l. subsidiary (disposed on 28 February 2014). and the B2B micro-electronic components distribution, effected exclusively by the Comprel S.r.l. subsidiary (disposed on 23 July 2014). Intra-segment operations, including those between the minor Italian segments, are identified in terms of the counter-party and the accounting rules are the same as those used in the case of transactions with third-parties which can be found under ‘Main valuation criteria and accounting’. Details of the Group’s revenues from external customers by product family and geographical area, with quotas effected in the country where the parent company is headquartered highlighted, can be found under the section ‘Revenues’ in the ‘Notes to income statement items’. Geographical area breakdown depends in particular on the customers’ country of residence. The Group is not dependent on its major customers despite revenues from transactions with entities operating in the ‘B2B’ of IT and consumer electronics known to be under common control of one sole entity and, pursuant to IAS 8.34 considered as a single customer, amounting to an over 10% in terms of consolidated revenues.
4. Disclosure on risks and financial instruments
4.1 Definition of risks
The international accounting principle IFRS 7 requires entities to provide disclosures in their financial statements that enable users to evaluate: - the significance of financial instruments for the entity’s financial position and performances; - the nature and extent of risks arising from financial instruments to which the entity is exposed during the
year and at the reporting date, and how the entity managed those risks. The principles in this IFRS complement and/or supersede the principles for recognising, measuring and presenting financial assets and financial liabilities in IAS 32 ‘Financial instruments: Presentation’ and IAS 39 ‘Financial instruments: Recognition and Measurement’. Disclosures as per IFRS 7 and IFRS 13 are therefore reported in this section. Accounting principles regarding financial instruments used in preparing the consolidated financial statements can be found in the section ‘Accounting principles and valuation criteria’ whereas the definition of financial risks, the degree of the Group's exposure to the various identified categories of risk, such as: a) credit risk; b) liquidity risk; c) market risk (currency risk, interest rate risk, other price risk); and the relevant risk management policies have been analysed in depth under ‘Main risks and uncertainties facing the Group and Esprinet S.p.A.’ in the ‘Director’s Report on Operations’.
4.2 Financial instruments pursuant to IAS 39: classes of risk and ‘fair value’
The next table illustrates the relationship between the financial instruments items in the statement of financial position and the financial assets and liabilities categories in accordance with accounting principle IAS 39:

Esprinet 2014 Consolidated Financial Statement
81
Assets 31/12/2014 31/12/2013
(euro/000)Carrying
amount
Financial
assets at
FVTPL(1)
Loans and
receiv.
Not
IAS 39
Carrying
amount
Financial
assets at
FVTPL(1)
Loans and
receiv.
Not
IAS 39
Customer financial receivables 3,085 3,085 3,457 3,457
Guarantee deposits 1,522 1,522 1,498 1,498
Consortium membership fees 21 21 23 23
Rec.and other non-curr. Assets 4,628 3,085 1,543 4,978 3,457 1,521
Non-current assets 4,628 - 3,085 1,543 4,978 - 3,457 1,521
Trade receivables 275,983 275,983 232,519 232,519
Receivables from associates 569 569 275 275
Receivables from factors 690 690 2,829 2,829
Customer financial receivables 506 506 572 572
Other tax receivables 823 823 2,149 2,149
Receivables from suppliers 3,390 3,390 2,135 2,135
Receivables from insurances 1,834 1,834 1,795 1,795
Receivables from employees 9 9 3 3
Receivables from others 137 137 1 1
Pre-payments 1,856 1,856 862 862
Other receivables 9,814 3,745 6,069 10,621 5,475 5,146
Cash and cash equivalents 225,174 225,174 176,893 176,893
Current assets 510,971 - 504,902 6,069 420,033 - 414,887 5,146
Liabilities 31/12/2014 31/12/2013
(euro/000)Carrying
amount
Financial
liabilities at
FVTPL(1)
Financial
liabilities
amortized
cost
Not
IAS 39
Carrying
amount
Financial
liabilities at
FVTPL(1)
Financial
liabilities
amortized
cost
Not
IAS 39
Borrowings 68,419 68,419 3,356 3,356
Derivative financial liabilities 128 128 - -
Debts for investments in subsidiar. 9,758 9,758 - -
Provisions of pensions 1,433 1,433 1,304 1,304
Other provisions 1,301 1,301 605 605
Cash incentive liabilities - - 424 424
Provis. And other non-curr. Liab. 2,734 - 2,734 2,333 424 1,909
Non-current liabilities 81,039 9,886 68,419 2,734 5,689 - 3,780 1,909
Trade payables 452,040 452,040 400,366 400,366
Short-term financial liabilities 20,814 20,814 38,569 38,569
Derivative financial liabilities 51 51 174 174
Associates liabilities 63 63 61 61
Social security liabilities 2,979 2,979 3,034 3,034
Other tax liabilities 15,489 15,489 12,543 12,543
Payables to others 8,931 8,931 7,860 7,860
Accrued expenses (insurance) 123 123 75 75
Deferred income 250 250 371 371
Provisions and other liabilities 27,835 12,096 15,739 23,944 11,030 12,914
Current liabilities 500,740 51 484,950 15,739 463,053 174 449,965 12,914
(1) ’FVTPL’: Fair Value Through Profit and Loss.
For further details about the contents of individual balance sheet items please see the analyses provided in the specific sections in the chapter ‘Notes to the statement of financial position items’. As can be seen in the previous table, the statement of financial position classifications provide an almost immediate distinction between classes of financial instruments, as per their different valuation methods and exposure to financial risk:
financial instruments measured at amortised cost:
- cash and cash equivalents and receivables from factoring companies - receivables from insurance companies - trade receivables - customer financial receivables (current and non-current)

Esprinet 2014 Consolidated Financial Statement
82
- receivables from employees - receivables from associated companies - receivables from others - trade payables - financial liabilities - other debts (current and non-current)
financial instruments measured at ‘fair value’ since initial recognition:
- derivative financial assets - derivative financial liabilities - debts for investments in subsidiaries
Cash and cash equivalents are almost entirely immediately available bank deposits. These, together with the receivables from factoring companies, the Group’s usual counter-parties for its operations, and the derivative financial assets (even though the latter are measured at fair value and not at amortised cost) have a very low risk rating, limited to that of the credit risk in the case in question. This last circumstance is linked to the high standing of counter-parties, which are banks and factoring companies with high ratings and often also to credits as a result of loans and/or advance payments. Receivables in the form of reimbursements already recognised by international insurance companies, and consequently with consolidated relationships with the Group, are of the same type and risk level. Customers financial receivables are of the same type but with an even lower risk level, considering as they are composed by receivables from the Italian Public Administration. Trade receivables are subject to credit risk. They are the result of a structured process that starts with customer selection and admission to a credit line and then monitoring the same credit facilities. The risk is mitigated by recourse to traditional insurance contracts with leading international insurance companies, without-recourse factoring schemes and, for the remainder, by specific guarantees (bank guarantees typically). It should be noted that no significant financial effects have ever arisen from insolvency problems. Receivables from others are subject to a sensibly lower credit risk compared to trade receivables due to the existence of contractual guarantees Receivables from employees, both advances and loans, have a lower credit risk than trade receivables, given the closer relationship between the parts and considering the continuity of the employment. Receivables from associated companies are subject to the same risk level, due to the significant influence exerted by Esprinet S.p.A. as a consequence of the operative and management relationships established with the parent company. Both trade payables and other debts, are subject to the risk that the Group will be unable to respect the payment commitments undertaken on time (liquidity risk). Financial liabilities and derivative financial liabilities (even though the latter are measured at fair value and not at amortised cost) are exposed at the same but higher risky kind of risk than trade payables, due to the superior negotiating power of banks and the implicitly less flexible nature of covenants and obligations of the ‘negative pledge’, ‘pari passu’ or similar type in the case of medium/long-term loans. Debts for investments in subsidiaries are exposed to the same but intermediate liquidity risk than the two aforementioned classes of financial instruments (trade payables and financial liabilities) because of obligations stated in the acquisition agreement and because of the type of counterparts. The latter are minorities who are also directors of the subsidiary to which the option for buying the remaining stake of share capital refers. The fair value measurement of financial assets and liabilities reported in the statement of financial position and provided by IAS 39 and governed by IFRS 7 and IFRS 13, grouped into classes of risk, and the methods and the assumptions applied in determining them, are as follows:

Esprinet 2014 Consolidated Financial Statement
83
Assets 31/12/2014 31/12/2013
Fair value Fair value
Trade
receiv.
Financial
receiv.
Receiv.
From
others
Receiv.
From
insurers
Receiv.
From
employe
es
Trade
receiv.
Financial
receiv.
Receiv.
From
others
Receiv.
From
insurers
Receiv.
From
employe
es
Customer financial receivables 3,085 3,040 - 3,457 3,229 -
Other non current assets 3,085 3,040 - 3,457 3,229 -
Non - current assets 3,085 - 3,040 - - - 3,457 - 3,229 - - -
Trade receivables 275,983 275,983 232,519 232,519
Receiv. From associates 569 569 275 275
Receiv. From factors 690 690 2,829 2,829
Customer financial receivables 506 506 572 572
Receiv. From insurances 1,834 1,834 1,795 1,795
Receiv. From employees 9 9 3 3
Receiv. From others 137 137 1 1
Other receivables 3,745 1,196 137 1,834 578 5,475 3,401 1 1,795 278
Cash and cash equival. 225,174 225,174 176,893 176,893
Current assets 504,902 275,983 226,370 137 1,834 578 414,887 232,519 180,294 1 1,795 278
Carrying
amount
Carrying
amount(euro/000)
Liabilities 31/12/2014 31/12/2013
Fair value Fair value
Trade
payables
Financial
payables
FVTPL
derivat.
Other
payable
s
Trade
payables
Financial
payables
FVTPL
derivat.
Other
payable
s
Borrowings 68,419 68,045 3,356 3,134
Financial derivatives 128 128 - -
Debts for investments in subsidiar. 9,758 9,524 - -
Cash incentive liab. - - 424 424
Provisions and other liab. - - 424 424
Non-current liabilities 78,305 - 77,569 128 - - 3,780 - 3,134 - 424 -
Trade payables 452,040 452,040 400,366 400,366
Short-term financial liab. 20,814 19,564 38,569 38,546
Financial Derivatives 51 51 174 174
Associates liabilities 63 63 61 61
Social security liabilities 2,979 2,979 3,034 3,034
Payables to others 8,931 8,931 7,860 7,860
Accroued exp. (insurance) 123 123 75 75
Provisions and other liab. 12,096 12,096 11,030 11,030
Current liabilities 485,001 452,040 19,564 51 12,096 - 450,139 400,366 38,546 174 11,030 -
Carrying
amount
Carrying
amount(euro/000)
The corresponding hierarchy level for each of the abovementioned fair value list is described below:
Assets 31/12/2014 31/12/2013
Customer financial receivables 3,085 3,040 level 2 3,457 3,229 level 2
Other non current assets 3,085 3,040 3,457 3,229
Non - current assets 3,085 3,040 3,457 3,229- -
Trade receivables 275,983 275,983 level 2 232,519 232,519 level 2
Receiv. From associates 569 569 level 2 275 275 level 2
Receiv. From factors 690 690 level 2 2,829 2,829 level 2
Customer financial receivables 506 506 level 2 572 572 level 2
Receiv. From insurances 1,834 1,834 level 2 1,795 1,795 level 2
Receiv. From employees 9 9 level 2 3 3 level 2
Receiv. From others 137 137 level 2 1 1 level 2
Other receivables 3,745 3,745 5,475 5,475
Cash and cash equival. 225,174 225,174 176,893 176,893
Current assets 504,902 504,902 414,887 414,887
Fair valueFair value
hierarchy
Carrying
amount
Carrying
amount(euro/000) Fair value
Fair value
hierarchy
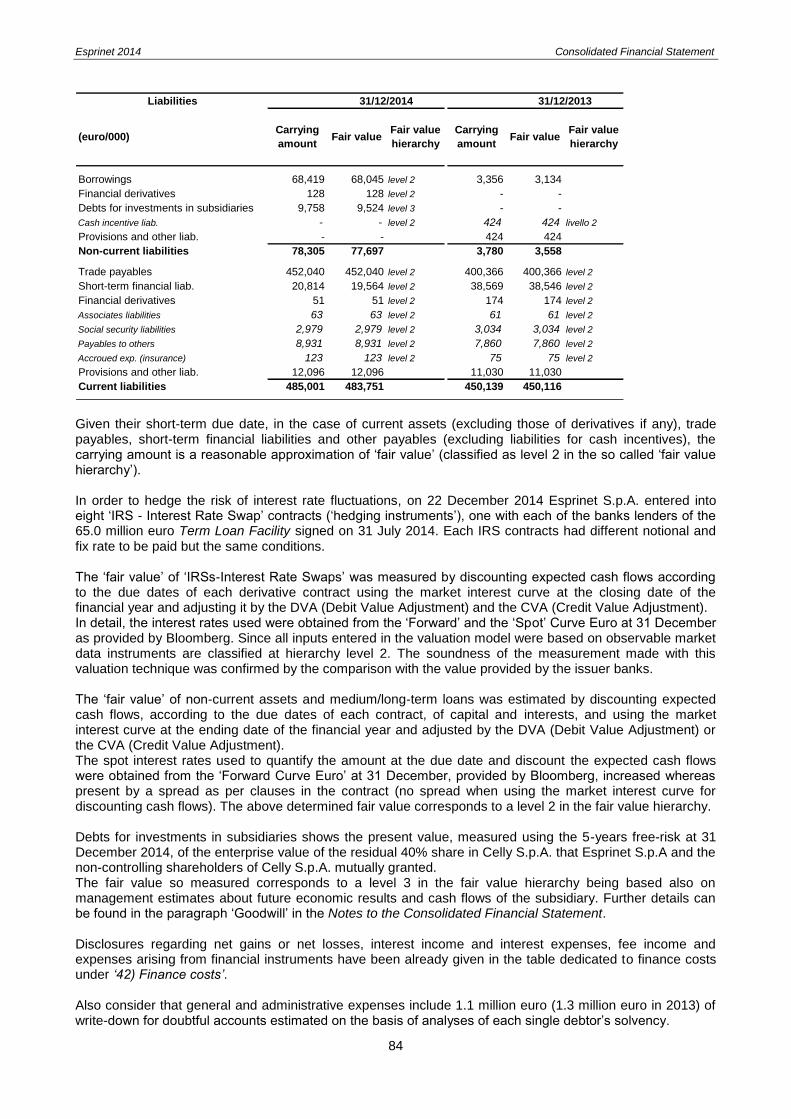
Esprinet 2014 Consolidated Financial Statement
84
Liabilities 31/12/2014 31/12/2013
Borrowings 68,419 68,045 level 2 3,356 3,134
Financial derivatives 128 128 level 2 - -
Debts for investments in subsidiaries 9,758 9,524 level 3 - -
Cash incentive liab. - - level 2 424 424 livello 2
Provisions and other liab. - - 424 424
Non-current liabilities 78,305 77,697 3,780 3,558
Trade payables 452,040 452,040 level 2 400,366 400,366 level 2
Short-term financial liab. 20,814 19,564 level 2 38,569 38,546 level 2
Financial derivatives 51 51 level 2 174 174 level 2
Associates liabilities 63 63 level 2 61 61 level 2
Social security liabilities 2,979 2,979 level 2 3,034 3,034 level 2
Payables to others 8,931 8,931 level 2 7,860 7,860 level 2
Accroued exp. (insurance) 123 123 level 2 75 75 level 2
Provisions and other liab. 12,096 12,096 11,030 11,030
Current liabilities 485,001 483,751 450,139 450,116
Fair value
hierarchy Fair value
Carrying
amount
Carrying
amount(euro/000) Fair value
Fair value
hierarchy
Given their short-term due date, in the case of current assets (excluding those of derivatives if any), trade payables, short-term financial liabilities and other payables (excluding liabilities for cash incentives), the carrying amount is a reasonable approximation of ‘fair value’ (classified as level 2 in the so called ‘fair value hierarchy’). In order to hedge the risk of interest rate fluctuations, on 22 December 2014 Esprinet S.p.A. entered into eight ‘IRS - Interest Rate Swap’ contracts (‘hedging instruments’), one with each of the banks lenders of the 65.0 million euro Term Loan Facility signed on 31 July 2014. Each IRS contracts had different notional and fix rate to be paid but the same conditions. The ‘fair value’ of ‘IRSs-Interest Rate Swaps’ was measured by discounting expected cash flows according to the due dates of each derivative contract using the market interest curve at the closing date of the financial year and adjusting it by the DVA (Debit Value Adjustment) and the CVA (Credit Value Adjustment). In detail, the interest rates used were obtained from the ‘Forward’ and the ‘Spot’ Curve Euro at 31 December as provided by Bloomberg. Since all inputs entered in the valuation model were based on observable market data instruments are classified at hierarchy level 2. The soundness of the measurement made with this valuation technique was confirmed by the comparison with the value provided by the issuer banks. The ‘fair value’ of non-current assets and medium/long-term loans was estimated by discounting expected cash flows, according to the due dates of each contract, of capital and interests, and using the market interest curve at the ending date of the financial year and adjusted by the DVA (Debit Value Adjustment) or the CVA (Credit Value Adjustment). The spot interest rates used to quantify the amount at the due date and discount the expected cash flows were obtained from the ‘Forward Curve Euro’ at 31 December, provided by Bloomberg, increased whereas present by a spread as per clauses in the contract (no spread when using the market interest curve for discounting cash flows). The above determined fair value corresponds to a level 2 in the fair value hierarchy. Debts for investments in subsidiaries shows the present value, measured using the 5-years free-risk at 31 December 2014, of the enterprise value of the residual 40% share in Celly S.p.A. that Esprinet S.p.A and the non-controlling shareholders of Celly S.p.A. mutually granted. The fair value so measured corresponds to a level 3 in the fair value hierarchy being based also on management estimates about future economic results and cash flows of the subsidiary. Further details can be found in the paragraph ‘Goodwill’ in the Notes to the Consolidated Financial Statement. Disclosures regarding net gains or net losses, interest income and interest expenses, fee income and expenses arising from financial instruments have been already given in the table dedicated to finance costs under ‘42) Finance costs’. Also consider that general and administrative expenses include 1.1 million euro (1.3 million euro in 2013) of write-down for doubtful accounts estimated on the basis of analyses of each single debtor’s solvency.
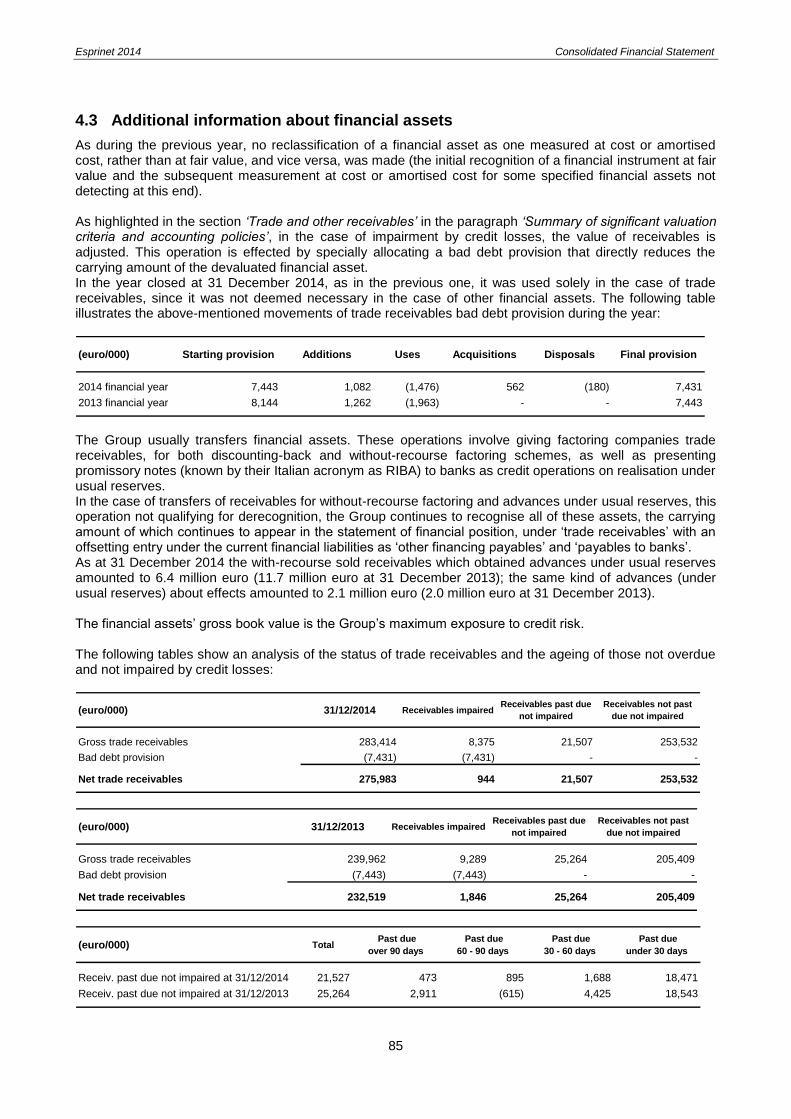
Esprinet 2014 Consolidated Financial Statement
85
4.3 Additional information about financial assets
As during the previous year, no reclassification of a financial asset as one measured at cost or amortised cost, rather than at fair value, and vice versa, was made (the initial recognition of a financial instrument at fair value and the subsequent measurement at cost or amortised cost for some specified financial assets not detecting at this end). As highlighted in the section ‘Trade and other receivables’ in the paragraph ‘Summary of significant valuation criteria and accounting policies’, in the case of impairment by credit losses, the value of receivables is adjusted. This operation is effected by specially allocating a bad debt provision that directly reduces the carrying amount of the devaluated financial asset. In the year closed at 31 December 2014, as in the previous one, it was used solely in the case of trade receivables, since it was not deemed necessary in the case of other financial assets. The following table illustrates the above-mentioned movements of trade receivables bad debt provision during the year:
(euro/000) Starting provision Additions Uses Acquisitions Disposals Final provision
2014 financial year 7,443 1,082 (1,476) 562 (180) 7,431
2013 financial year 8,144 1,262 (1,963) - - 7,443
The Group usually transfers financial assets. These operations involve giving factoring companies trade receivables, for both discounting-back and without-recourse factoring schemes, as well as presenting promissory notes (known by their Italian acronym as RIBA) to banks as credit operations on realisation under usual reserves. In the case of transfers of receivables for without-recourse factoring and advances under usual reserves, this operation not qualifying for derecognition, the Group continues to recognise all of these assets, the carrying amount of which continues to appear in the statement of financial position, under ‘trade receivables’ with an offsetting entry under the current financial liabilities as ‘other financing payables’ and ‘payables to banks’. As at 31 December 2014 the with-recourse sold receivables which obtained advances under usual reserves amounted to 6.4 million euro (11.7 million euro at 31 December 2013); the same kind of advances (under usual reserves) about effects amounted to 2.1 million euro (2.0 million euro at 31 December 2013). The financial assets’ gross book value is the Group’s maximum exposure to credit risk. The following tables show an analysis of the status of trade receivables and the ageing of those not overdue and not impaired by credit losses:
(euro/000) 31/12/2014 Receivables impairedReceivables past due
not impaired
Receivables not past
due not impaired
Gross trade receivables 283,414 8,375 21,507 253,532
Bad debt provision (7,431) (7,431) - -
Net trade receivables 275,983 944 21,507 253,532
(euro/000) 31/12/2013 Receivables impairedReceivables past due
not impaired
Receivables not past
due not impaired
Gross trade receivables 239,962 9,289 25,264 205,409
Bad debt provision (7,443) (7,443) - -
Net trade receivables 232,519 1,846 25,264 205,409
(euro/000) Total Past due
over 90 days
Past due
60 - 90 days
Past due
30 - 60 days
Past due
under 30 days
Receiv. past due not impaired at 31/12/2014 21,527 473 895 1,688 18,471
Receiv. past due not impaired at 31/12/2013 25,264 2,911 (615) 4,425 18,543

Esprinet 2014 Consolidated Financial Statement
86
Due to its historical experience and to its policy of not accepting orders from insolvent customers unless paid in advance, the Group does not believe that premises for allocating provisions for doubtful receivables for amounts not yet overdue exist. There are no financial assets which would otherwise be past due or impaired whose terms have been re-negotiated, except for some re-entry plans agreed with customers for not-material amounts. The following instruments are usually used by the Group to limit its credit risk (the percentages refer to trade receivables at 31 December 2014):
- traditional credit insurance (covering approx. 90% of the face value of the insured receivables provided they are within the limit of the credit line given by the insurance company) covering approx. 61% of the total amount of trade receivables;
- without-recourse factoring with leading factoring companies covering approx. 15% of the receivables (the amount refers to receivables existing at the closing date of the financial year but subject to revolving credit at the times and with the methods of the schemes);
- real guarantees (bank guarantees and asset mortgagees) in the case of approx. 2% of total gross amount of trade receivables;
No financial or non-financial assets were obtained by the Group during the period by taking possession of collateral it holds as security or calling on other credit enhancements (e.g. guarantees). Nor did the Group hold collateral (of financial or non-financial assets) it was permitted to sell or re-pledge in the absence of default by the owner of the collateral. No other financial assets regulated by IFRS 7 have been impaired in the current or in the previous year. The two tables below illustrate their status and the ageing of those not overdue and not impaired by credit losses:
31/12/2014 31/12/2013
(euro/000)Carrying
amount
Receiv.
impaired
Receiv.
past due
not impaired
Receiv.
not past due
not impaired
Carrying
amount
Receiv.
impaired
Receiv.
past due
not impaired
Receiv.
not past due
not impaired
Customer financial receiv. 3,085 3,085 3,457 3,457
Other non-current assets 3,085 3,085 3,457 3,457
Non-current assets 3,085 - - 3,085 3,457 - - 3,457
Receivables from asscociat. 569 162 407 275 240 35
Receivables from factors 690 678 12 2,829 (11) 2,840
Customer financial receiv. 506 572 572 572
Receivables from insurances 1,834 1,834 1,795 1,795
Receivables from employees 9 9 3 3
Receivables from others 137 137 1 1
Other receivables 3,745 2,674 1,137 5,475 2,024 3,451
Cash and cash equivalents 225,174 225,174 176,893 176,893
Current assets 228,919 - 227,848 1,137 182,368 - 178,917 3,451
(euro/000) Total Past due
over 90 days
Past due
60 - 90 days
Past due
30 - 60 days
Past due
under 30 days
Receivables from associat. 162 81 - - 81
Receivables from factoring companies 12 - - - 12
Receivables from insurance companies 1,834 1,694 58 47 35
Receivables from others - - - - -
Receiv. past due not impaired at 31/12/2014 2,008 1,775 58 47 128
Receivables from associat. 240 183 - 60 (3)
Receivables from factoring companies (11) - - - (11)
Receivables from insurance companies 1,795 1,595 24 28 148
Receivables from others - - - - -
Receiv. past due not impaired at 31/12/2013 2,024 1,778 24 88 134

Esprinet 2014 Consolidated Financial Statement
87
Receivables from factoring companies relate wholly to ‘without-recourse’ factoring operations, where the ownership and connected risks of the sold receivables have therefore been wholly transferred to factoring companies. The past due quota relates to sums due at the closing date of the year which were paid during the first days of the following year for technical reasons. The not yet due quota regards amounts collectable by contract only at the original due date of the receivable existing between the sold customers and the Group companies. It should be noted, however, that these receivables had also almost completely been paid by the time this report was drawn up as the deadlines were met.
4.4 Additional information about financial liabilities
Amounts detailed in the following maturity analysis are the contractual undiscounted cash flows, including interests to be paid and excluding the effects of netting agreements:
(euro/000)
Carrying
amount
31/12/2014
Future
cash flows
in 6
months
6-12
months
1-2
years
2-5
years
after 5
years
Borrowings 68,419 74,329 167 815 18,663 53,131 1,553
Derivative financial liabilities 128 183 - 52 118 13 -
Debts for investments in subsidiaries 9,758 10,135 - - - 10,135 -
Cash incentive liabilities - - - - - - -
Provisions and other non-corr. liabilities - - - - - - -
Non-current liabilities 78,305 84,647 167 867 18,781 63,279 1,553
Trade payables 452,040 511,635 456,836 4,796 9,474 24,996 15,533
Short-term financial liabilities 20,814 19,144 18,696 448 - - -
Derivative financial liabilities 51 - - - - - -
Payables to assoc. and subsidiaries 63 63 63 - - - -
Social security liabilities 2,979 2,979 2,979 - - - -
Payables to others 8,931 7,860 7,860 - - - -
Accrued expenses (insurance) 123 123 123 - - - -
Provisions and other liabilities 12,096 11,025 11,025 - - - -
Current liabilites 485,001 541,804 486,557 5,244 9,474 24,996 15,533
(euro/000)
Carrying
amount
31/12/2013
Future
cash flows
in 6
months
6-12
months
1-2
years
2-5
years
after 5
years
Borrowings 3,356 4,243 103 - 517 1,553 2,070
Derivative financial liabilities - - - - - - -
Cash incentive liabilities 424 424 - - 424 - -
Provisions and other non-corr. liabilities 424 424 - - 424 - -
Non-current liabilities 3,780 4,667 103 - 941 1,553 2,070
Trade payables 400,366 462,495 405,106 4,740 9,066 24,043 19,540
Short-term financial liabilities 38,569 38,612 38,612 - - - -
Derivative financial liabilities 174 174 174 - - - -
Payables to assoc. and subsidiaries 61 61 61 - - - -
Social security liabilities 3,034 3,034 3,034 - - - -
Payables to others 7,860 7,860 7,860 - - - -
Accrued expenses (insurance) 75 75 75 - - - -
Provisions and other liabilities 11,030 11,030 11,030 - - - -
Current liabilites 450,139 512,311 454,922 4,740 9,066 24,043 19,540
The above tables can be understood more easily if the following are considered:
- when a counter-party has a choice of when an amount is paid, the liability has been included on the basis of the earliest date on which the Group can be required to pay;
- the amounts shown relate to contractual undiscounted cash flows gross of interests to be paid; - the amount of floating rate loans payable has been estimated by reference to the conditions existing at the
reporting date (i.e. the interest rate curve at the end of the year).
Esprinet 2014 Consolidated Financial Statement
88
In July 2014Esprinet S.p.A., among activities aimed to support Group’s financial needs, obtained a credit facily from a pool of banks made up of a Term Loan Facility and of a Revolving Facility, each for a maximum loan principal of 65.0 million euro and expiring within 31 July 2019. The above mention loan agreements contain the usual agreements which take into account the possible loss of the benefit to pay reimbursements at deferred maturity should certain financial covenants not be met when checked against consolidated and audited financial statements data. At 31 December 2014 according to the available evidence and using management estimates (since the same will be checked against the consolidated and audited financial statements), the covenants resulted fully met. Apart from 31 December 2007 and 30 June 2008 when, even if with no consequences for the Group, one of the covenants to which loans whose reimbursement ended in July 2014, as stated in their agreements, was broken, the Group has never been in a condition of default regarding principal, interest, sinking fund or redemption terms of passive loans. The Group also has other minor loans (more details can be found in the paragraph ‘Loans and loan covenants’), as well as a loan due in January 2022, with a remaining value as notional of 3.5 million euro and registered as 3.4 million euro by effect of the amortising costs accounting method, achieved in December 2013 under the contractual terms of payment from the Public Administration for the supply of personal computers to the same by the Parent Company. The issuing bank was granted by the Group an irrevocable collection derogation for multi-year contribution’s collection due from the Public Administration and equal, in both the amounting and due dates, to the reimbursement loan plan that, for the above mentioned reason, do not contains dealings for a possible shirk benefitting from the reimbursement terms. Up to now the Group has not issued any instruments containing both a liability and an equity component.
4.5 Hedge accounting
Introduction
The Esprinet Group signs derivative contracts in order to hedge some loan agreements against fluctuating interest rates by means of a strategy of cash flow hedge. The aim of these hedging transactions against the interest rate risk is to fix the funding cost of middle/long-term floating-rate loans by entering into a derivative contract that enables the Group the floating rate to be received and the fixed rate to be paid. Hedging operations are therefore reported in the financial statements according to the instructions of the IAS 39 accounting principle regarding ‘hedge accounting’ and in order to verify the hedge effectiveness, the Group periodically carry out perspective and retrospective tests. Derivative instruments matured during the year
On 27 June 2014 the two IRS –(Interest Rate Swap) contracts came to maturity, which were entered into with Intesa Sanpaolo S.p.A. at the end of November 2007 and provided for different amounts, namely 3.5 million euro for Esprinet S.p.A. and 5.2 million euro for Esprinet Iberica S.L.U., but identical conditions (hedging instruments). Such contracts were technically defined as ‘amortising - forward start’ in as much as they provided for the exchange or ‘swap’ of a fixed rate debt (4.33%) with a floating 6 month Euribor rate with a future maturity date coinciding with the beginning of the following interest period of the hedged item, a ‘Senior Amortizing Term Loan’ of residual 5.0 million euro for Esprinet S.p.A. and 7.1 million euro per Esprinet Iberica S.L.U., agreed with a pool of banks and matured on 27 June 2014 it also. The main features of the two contracts are summarized below:
Trade date 20 November 2007
Effective date 27 December 2007
Termination date 27 June 2014 subject to adjustment in accordance with the modified business day convention
Notional amount Esprinet S.p.A.: 45.5 million euro (subject to an amortisation plan) Esprinet Iberica S.L.U.: 68.25 million euro (subject to an amortisation plan)
Fixed rate 4,33%, act/360
Fixed and floating rates payment dates 27/06/08, 29/12/08, 29/06/09, 28/12/09, 28/06/10, 27/12/10, 27/06/11,
Esprinet 2014 Consolidated Financial Statement
89
27/12/11, 27/06/12, 27/12/12, 27/06/13, 27/12/13, 27/06/14 subject to adjustment in accordance with the modified business day convention
Fixed rate payer Esprinet S.p.A. and Esprinet Iberica S.L.U. respectively
Floating rate Euribor 6M, act/360, fixed as the first day of each interest calculation period
Floating rate payer Intesa Sanpaolo S.p.A.
Since, until 30 November 2012, it was fully in compliance with International Accounting Standard 39 regarding ‘hedge accounting’ (formal designation and documentation of the hedging relationship; hedge expected to be highly effective and reliably measured; forecast transaction highly probable and affecting profit or loss) both of the two derivative contracts had been subject to the ‘cash flow hedge’ accounting rules until that date. At inception date the portion of the gain or loss on the hedging instrument (that has been determined to be an effective hedge) was recognised directly in equity (and shown, consequently, in the statement of comprehensive income), the ineffective portion of the gain or loss on the hedging instrument was recognised in profit or loss. Subsequent changes until 30 November 2012 in the fair value of the expected future cash flows on the hedge item from inception of the hedge (due to changes in the interest rate curve), always within limits of being an effective hedge, had been similarly recognised directly in equity (and in the statement of comprehensive income). After 30 November 2012, and thus for all of 2014, as a consequence of the ‘high’ effectiveness term ination proved by retrospective tests, the fair value variation of the derivative instruments has been booked as financial costs directly in the separate income statement. Entering into these derivative contracts was part of the commitments assumed at the time of the closing of the Senior Amortizing Loan contract during the total renegotiation of the Group’s financial debt. It was thus necessary to sell two previous IRS contracts signed in 2006 by Esprinet Iberica S.L.U. as the total hedge of the remaining amount of 48.8 million euro of the pool loan in 2005 granted by Intesa Sanpaolo S.p.A. and MCC S.p.A. (Group Unicredit) as part of the latters’ financial support in the Memory Set S.A.U. purchase. Both the contracts were recognised in accordance with ‘cash flow hedge’ accounting methods. As a result of this accounting method and their sale, on 27 June 2014, at the maturity of the restructured loan, the Group recognised in profit or loss a 32 thousand euro amount generated by cumulative changes in the fair value of these two derivatives and recognised under net equity in the ‘cash flow hedge’ reserve until 31 December 2013. The main features of the above said derivative contracts sold in 2007 are summarized below:
Trade date 2 August 2006
Effective date 5 December 2006
Termination date 5 December 2012
Notional amount Euro 24.428.571,43, subject to an amortisation plan
Fixed rate 4,055%, act/360
Fixed and floating rates payment dates Every 5 December and 5 June starting from 5 June 2007 up to 5 December 2012
Fixed rate payer Yedraint S.L.U. (now Esprinet Iberica S.L.U.)
Floating rate Euribor 6M, act/360, fixed two days before the interest calculation period
Controparte pagatrice del tasso variabile Banca di Roma S.p.A.
Derivative instruments entered during the year
In order to hedge the risk of interest rate fluctuations, on 22 December 2014 Esprinet S.p.A. entered into eight ‘IRS - Interest Rate Swap’ contracts (‘hedging instruments’), one with each of the banks lenders of the 65.0 million euro Term Loan Facility signed on 31 July 2014. Each IRS contracts had different notional and fix rate to be paid but the same conditions. Each participating bank to the hedged loan entered a derivative contract for a notional amount equivalent to that of the own quote of the underlying loan to which hedging the derivative contract is aimed by the floating rate collection and the fixed rate payment.

Esprinet 2014 Consolidated Financial Statement
90
The main features of the eight contracts are summarized below:
Trade date 22 December 2014
Effective date 30 January 2015
Terminantion date 31 July 2019
Notional amount 65.0 million euro (subject to an amortisation plan)
Fixed rate From 0.33% to 0.37%, act/360
Fixed and floating rates payment dates Every 31 January and 31 July starting from 31 July 2015 up to 31 July 2019, subject to adjustment in accordance with the modified business day convention
Fixed rate payer Esprinet S.p.A.
Floating rate Euribor 6M, act/360, fixed two days before the interest calculation period
Floating rate payer Intesa Sanpaolo S.p.A., Banca Nazionale del Lavoro S.p.A., Unicredit S.p.A., Banca Monte dei Paschi di Siena S.p.A., UBI Banca - Società Cooperativa per Azioni, Banco Popolare – Società Cooperativa, Caixabank S.A., Cassa di Risparmio di Parma e Piacenza S.p.A., each for its own contract
Since it is fully in compliance with International Accounting Standard 39 regarding ‘hedge accounting’ (formal designation and documentation of the hedging relationship; hedge expected to be highly effective and reliably measured; forecast transaction higly probable and affecting profit or loss) both of the eight derivative contracts have been subject to the ‘cash flow hedge’ accounting rules. Information regarding derivative contracts existing during the year
The next tables illustrate the following information regarding the derivative contracts with reference to the cash flow hedge accounting technique (until 30 November 2012 for derivatives matured during 2014): - the notional amount at 31 December 2014 and 2013 shared into portions maturing within or beyond a 12-
months period; - the amount recognised in the statement of financial position as at 31 December 2014 and 2013 with
reference to the ‘fair value’ of the contracts with ‘highly ‘effective hedge conditions (30 November 2012 for the financial year 2013);
- the cumulative change in fair value from the inception to the date of ‘highly ‘effective hedge termination with reference to the instalments still effective at the financial statement closing date;
- the ineffective portion of gains/losses on the hedging instrument computed to the income statement under ‘Finance costs’ from the inception with reference to the instalments still effective at the same date.
31/12/2014
Within 1
year
Beyond 1
year
Interest rate risk management
- cash flow hedge on derivatives 2014 - 65,000 179 - (50) (129)
- cash flow hedge on derivatives 2007 - - - - - -
- cash flow hedge on derivatives 2006 - - - - - -
Total - 65,000 179 - (50) (129)
Notional amount(euro/000)
Fair value(1) Income
statement (2)
Retained
earnings (4)
Taxes on
FV
contracts (3)
31/12/2013
Within 1
year
Beyond 1
year
Interest rate risk management
- cash flow hedge on derivatives 2007 8,750 - 176 305 (51) 180
- cash flow hedge on derivatives 2006 - - - - - 32
Total 8,750 - 176 305 (51) 212
Notional amount(euro/000)
Fair value(1) Income
statement
(2)
Retained
earnings (4)
Taxes on
FV
contracts (3)
(1)
Amount of the (assets)/liabilities recorded in the statement of financial position as per the ‘fair value’ measurement of derivatives using cash flow hedge
accounting technique. (2)
Ineffective portion of the gain or loss on the hedging instrument as per IAS 39. (3)
Deferred income taxes related to the fair value of the derivative contracts using cash flow hedge accounting technique.

Esprinet 2014 Consolidated Financial Statement
91
(4) Cumulative change in fair value from inception to the statement of financial position date recognised in equity using cash flow hedge accounting
technique.
The events that caused the changes in the amount of the ‘cash flow hedge’ equity reserve during the year are so detailed:
2014
- equity reserve on derivatives 2014 (179) - - 50 (129)
- equity reserve on derivatives 2007 - 176 (305) (51) (180)
- equity reserve on derivatives 2006 - (32) - - (32)
Total (179) 144 (305) (1) (341)
(euro/'000)Ineffective
portion of
(gain)/loss to
Taxes on fair
value of
derivatives
Change in equity
reserve
Change in fair
value of
derivatives
Transfer to P&L(1)
(1)
Accounted as increase/(decrease) of ‘Financial charges’.
2013
- equity reserve on derivatives 2007 - 824 22 (238) 608
- equity reserve on derivatives 2006 - (62) - - (62)
Total - 762 22 (238) 546
(euro/000)
Ineffective
portion of
(gain)/loss to
P&L
Taxes on fair
value of
derivatives
Change in equity
reserve
Change in fair
value of
derivatives
Transfer to
P&L(1)
(1)
Accounted as increase/(decrease) of ‘Financial charges’.
The following are the periods when the cash flows relating to the hedged items are expected to occur and when they are expected to affect the Income Statement:
(euro/000)Expected
cash flow0-6 months
6-12
months1-2 years 2-5 years
After 5
years
Loans: 31/12/14 Cash flow 4,671 136 803 1,485 2,247 -
Impact on P&L 4,671 805 792 1,344 1,730 -
31/12/13 Cash flow and impact on P&L 57 57 - - - -
As a consequence of the derivatives fair value variation directly reported in the Income Statement, 7 thousand euro financial costs were recorded in 2013 as mentioned in paragraph ’42) Financial costs – net’. No costs were posted in 2014 due to the maturity of the derivatives. The derivative instrument changes referring to the fair value variations recorded in the Income Statement are reported below:
Derivatives 2014: 2014 n.a. n.a. n.a. n.a.
2013 n.a. n.a. n.a. n.a.
Derivatives 2007: 2014 (174) 174 - -
2013 (1,029) 848 7 (174)
Total (1,203) 1,022 7 (174)
Variation FV
rates not past due
FV
31/12/c.y.2
Rates past due(euro/000) Year
FV
31/12/p.y.1
(1) Previous year
(2)
Current year
4.6 Sensitivity analysis
Since the Group is exposed to a limited currency risk it has decided not to effect sensitivity analyses regarding this type of risk (for more details see section ‘Main risks and uncertainties facing the Group and Esprinet S.p.A.’ in the ‘Director’s Report on Operations’).

Esprinet 2014 Consolidated Financial Statement
92
A sensitivity analysis regarding the interest rate risk was performed in order to show how profit or loss and equity would have been affected by changes in the interest rate curve that were reasonably possible during the period. For these purposes, the 2014 market interest rate trend was taken into account together with the Group’s estimates on rates in the immediate future and a forward shifting of spot/forward interest rate curves +/-100 basis points was simulated. The following tables show the results of the simulation (net of tax effects): Scenario 1: +100 basis points
(euro/000) Net equity Profit/(loss) Net equity Profit/(loss)
Cash and cash equivalents 491 491 229 229
Short-term financial liabilities (85) (85) (196) (196)
Borrowings (1) (2)
(165) (165) (25) (25)
Derivative financial liabilities 1,305 - 94 94
Total 1,546 241 102 102
31/12/2014 31/12/2013
(1) Medium/long-term loans include the portion falling due within 12 months.
(2) Impact on the loans hedged by IRS regards solely the uncovered portion of the loans.
Scenario 2: -100 basis points
(euro/000) Net equity Profit/(loss) Net equity Profit/(loss)
Cash and cash equivalents (444) (444) (199) (199)
Short-term financial liabilities 84 84 194 194
Borrowings (1) (2)
45 45 25 25
Derivative financial liabilities (129) - (34) (34)
Total (444) (315) (14) (14)
31/12/2014 31/12/2013
(1) Medium/long-term loans include the portion falling due within 12 months.
(2) Impact on the loans hedged by IRS regards solely the uncovered portion of the loans.

Esprinet 2014 Consolidated Financial Statement
93
5. Notes to the statement of financial position items
Non-current assets
1) Property, plant and equipment
Property, plant and equipment amount to 10.3 million euro as at 31 December 2014 (versus the 9.9 million euro as at 31 December 2013). Changes occurring during the year are as follows:
(euro/000)Plant and
machinery
Ind. & Comm.
Equipment &
other assets
Assets under
construction &
advances
Total
Historical cost 9,757 19,946 495 30,198
Accumulated depreciation (7,439) (12,882) - (20,321)
Balance at 31 December 2013 2,318 7,064 495 9,877
Business combination acquisition - historical cost 292 1,173 - 1,465
Business combination acquisition - accumulated depreciation (246) (484) - (730)
Reclass. in disposal group assets - historical cost (171) (671) - (842)
Reclass. in disposal group assets - accumulated depreciation 132 411 - 543
Historical cost increase 265 1,584 930 2,779
Historical cost decrease (293) (558) (38) (889)
Historical cost reclassification 406 164 (570) -
Increase in accumulated depreciation (642) (2,071) - (2,713)
Decrease in accumulated depreciation 293 488 - 781
Total changes 29 (393) 322 (42)
Historical cost 10,256 21,638 817 32,711
Accumulated depreciation (7,902) (14,538) - (22,440)
Balance at 31 December 2014 2,354 7,100 817 10,271
Investments mainly refer to the ‘industrial & commercial equipment & other assets’ category (1.6 million euro), and are almost entirely related to the purchase of security equipment, electronic machines, furniture and fittings. The disinvestments refer to electronic machines disposals, mainly from the subsidiary Esprinet Iberica S.l.u. The movements related to the acquisition of Celly S.p.A. and to the disposal of Monclick S.r.l. and Comprel S.r.l. are also displayed. There are no temporarily unused tangible fixed assets intended for sale. The depreciation rates applied for each asset category are the same as those used during the fiscal year closed at 31 December 2013 with reference to the companies included in the Group last year. The following is the breakdown of the item ‘Industrial and commercial equipment and other assets’:

Esprinet 2014 Consolidated Financial Statement
94
(euro/000) 31/12/2014 31/12/2013 Var.
Electronic machines 2,498 2,277 221
Furniture and fittings 3,485 3,357 128
Industrial and commercial equipment 304 406 (102)
Other assets 813 1,024 (211)
Total 7,100 7,064 36
2) Goodwill
All goodwill items identify the excess of the price paid for obtaining the control of another business over the net of the acquisition-date amounts of the identifiable assets acquired and the liabilities assumed.
Disclosures regarding impairment tests of assets: goodwill
Scope of application
IAS 36 requires the testing of property, plant and equipment and intangible assets with indefinite useful life for impairment whether there are indications that impairment has occurred. In the case of goodwill and other intangible assets with an indefinite useful life, this test, so said ‘impairment test’, must be conducted at least annually and whenever ‘triggering events’ occur, i.e. extraordinary negative events implying the asset may be impaired. Goodwill does not generate cash flows independently of other assets or group of assets so, in compliance with IFRS, it is not an ‘individual asset‘ and may not be subjected to a separate impairment test being tested for impairment together with the group of activities to which it has been allocated. For the purposes of impairment testing, goodwill acquired in a business combination shall, from the acquisition date, be allocated to each of the acquirer’s ‘CGU - Cash-Generating Units’, or groups of CGUs that must not to be larger than an operating segment determined in accordance with IFRS 8. Cash Generating Unit: identification and goodwill allocation
The next table summarises the original values of the single goodwill items in terms of the business combinations from which they arose and a summary by company:
(euro/000) EntityGoodwill original
values
Memory Set S.a.u. Esprinet Iberica 50,427
UMD S.a.u. Esprinet Iberica 25,916
Esprinet Iberica S.l.u.(1)
Esprinet Iberica 1,040
Assotrade S.p.A. Esprinet S.p.A. 5,500
Pisani S.p.A. Esprinet S.p.A. 3,878
Esprilog S.r.l. Esprinet S.p.A. 2,115
60% Celly S.p.A. Celly S.p.A. 4,153
Total by business combination 93,029
Esprinet Iberica S.L.U. 77,383
Esprinet S.p.A. 11,492
Celly S.p.A. 4,153
Total by entity 93,028
1) Transaction costs sustained for the UMD and Memory Set business combinations.
Goodwill 75,246 73,219 2,028
(euro/000) 31/12/2014 31/12/2013 Var.

Esprinet 2014 Consolidated Financial Statement
95
Allocation of goodwill to each CGUs, identified as homogeneous groups of assets that generate cash inflows independently through the continued use of the assets included in each group, was made by charging the above mentioned goodwill to the relevant CGUs, that is, to the elementary units which received the businesses purchased in strictly operational terms. The following table summarises the goodwill allocations to the 3 CGUs, highlighting the relationships between the operating segments and the legal entities which form the Group, as well as the changes occurred in the year:
(euro/000) 31/12/2014 31/12/2013 Var.
Esprinet S.p.A. 11,492 11,492 - CGU 1 Distrib.B2B di Inf.Technology e Consumer Electronics (Italy)
Comprel S.r.l. - 2,126 (2,126) Distrib.B2B microelectronics components (Italy)
Celly S.p.A. 4,153 - 4,153 CGU 2 Distrib.B2B di Inf.Technology e Consumer Electronics (Italy)
Esprinet Iberica S.l.u. 59,601 59,601 - CGU 3 Distrib.B2B di Inf.Technology e Consumer Electronics (Spain)
Total 75,246 73,219 2,027
This allocation reflects the organizational and business structure of the Group, who operate in the core business of IT and consumer electronics business-to-business distribution (i.e. exclusively for business customers made up of resellers, who in turn refer to end-users, both private and company) in two geographical markets, Italy and Spain, both managed by, on one hand, two basically independent structures and, on the other hand, a ‘corporate’ structure where coordination and strategy are centralized for almost all activities that contribute to the reseller ‘value chain’ (sales, purchasing, product marketing, logistics). Compared to the split of the operating segments, identified also for the Segment Information as required by IFRS, another CGU operating within the same segment of Esprinet Italy, but focused mainly on accessories products of mobile phones as well as able to generate cash flows by its own, was identified as the controlled company Celly S.p.A.. The Group, until last year, showed also a CGU referring to B2B micro-electronics distribution managed by the affiliated company Comprel, which exited the Group during 2014. Compared to the original value, a different goodwill amount referred to the CGU3 Esprinet Iberica can be noted as consequence of a 17.8 million euro write-down occured in 2011. The impairment test valuation process and the results on 31 December 2014 goodwill items as previously explained are below described. A) Valuation system
The valuation framework and the methodological structure adopted are summarised below: The extreme rarefaction of the comparable market transactions and, for the few concluded deals, the low quantity of usable published information, make difficult the identification of implicit multiples applicable for the calculation purposes of a reasonably reliable ‘fair value’. Recoverability of goodwill is tested by comparing the carrying amount of each single CGU to which the goodwill has been allocated, with the recoverable amount of the unit in the meaning of ‘value in use’. The latter is the present value, at the date of the test, of the future cash flows (inflows and outflows) expected to be derived from the continuing use of assets which are part of the tested CGU. The ‘value in use’ was estimated using the Discounted Cash Flow (DCF) model, which requires an appropriate discount rate to estimate the discounting back of future cash flows. An ‘asset side’ approach was used which presupposes discounting unlevered cash flows generated by operations. These cash flows were calculated net of ‘figurative income taxes’ measured by applying an estimated tax rate to the operating income (EBIT). In the case of the Spanish CGU 3, the estimated effective and nominal tax rates correspond (in 2015 equal to 28%, from 2016 equal to 25%). In the case of the Italian CGU 1 and CGU 2, the effective tax rates calculated as per Italian tax law and deriving from the calculation of the IRES and IRAP tax rates on their different tax bases were applied, taking into account the different structure of the tax bases and, in particular, the non-deductibility of some relevant costs for the IRAP impact calculation. Disclosures required by the international accounting principles regarding the main methods chosen when calculating the recoverable amount are as follows.
Esprinet 2014 Consolidated Financial Statement
96
Basis for estimates of future cash flows
As required by the IAS 36 accounting principle, paragraph 50, estimated cash flows exclude financial charges, as per the ‘asset side’ approach already described. Projections based on forecasts cover a 5-year period, from 2015 to 2019. The discount rate includes the effect of price increases attributable to general inflation so future cash flows are estimated in nominal terms. Projection method
Future cash flows have been estimated for each CGU in its current condition which means not including estimates of future cash inflows that are expected to arise from the business combination, or from improving or enhancing its performance, or from extraordinary operations representing a discontinuity compared with this status. The definition of forecasted plans and of the resulting cash flows took into account each CUG’s peculiarity, therefore basing the whole, as already mentioned, on the so called ‘unique scenario’. The latter was identified as the ‘normal’ cash flow, or rather, taken as the one with the highest degree of probability of occurrence (so called ‘probabilistic approach’). The operating sustainability of the plans in terms of the ‘entrepreneurial model’ used, and of the business size, and therefore also the plans financial sustainability, was assessed by taking into account the value drivers of each CGUs as well as the Group financial capability. The latter has been considered as appropriate, also taking into account both the low investments level necessary for each CGU activities substantially limited to maintenance levels, and the liquidity risk management strategy. This risk is essentially managed by the preservation of a substantial number of non-used credit lines, mainly of self-liquidating nature, as well as by a conservative financial strategy focused on stable financial sources – i.e. middle term borrowings supported by financial covenants with which the Group is constantly provided – also for working capital purposes. The Board of Directors’ Meeting on 16 March 2015 approved the forecasted plans arising from the analytical budget of 2015, considered a ‘pivot’ year. These plans were drawn up thanks to forecasting techniques useful both for a separate management of fixed and variables costs, and for defining the revenues and product gross margin trend. This was done utilising a ‘benchmarking’ of the sector trends and of the end market in its entirety, as evaluated by reliable external sources, as well as assuming, for each CGU, different trends according to the current and prospective competitive position. Flows discounted or weighted for probability
Future cash flows have been estimated for each CGU following the ‘traditional approach’. This hinges on the so called ‘unique scenario’ defined as the ‘normal’ flow profile in which accounting applications of present value have used a single set of estimated cash flows and a single discount rate, both assumed as those with the highest degree of probability of occurrence (so said ‘probabilistic approach’).
Terminal value
The terminal value recorded at the end of the forecast period was calculated using the ‘Perpetuity Method’ (unlimited capitalisation model of the plan last year’s cash flow). The approach used presumes that at the end of the 5
th year on, cash flow will grow at a constant rate of ‘g’
and therefore the terminal value is calculated as perpetual income by means of the capitalisation of the plan’s last flow at a rate corresponding to the discounting back rate used (WACC) adjusted by a growth factor presumed stable. This last factor is presumed to be 2% for all the CGU and approximates the long-term nominal growth rate of the corresponding sector both in Italy and Spain, the cyclical requirements of which approximate the same rate to the long-term nominal growth rate of the two economies in their entirety. Discount rate
The discount rate used must be that of the return required by the suppliers of both risk and debt capital and takes into account risks specific to the activities relating to each single CGU. As a consequence, a Weighted Average Cost of Capital (‘WACC’) notion has been used, whose cost of the risk capital has been measured using a Capital Asset Pricing Model (‘CAPM’) approach.
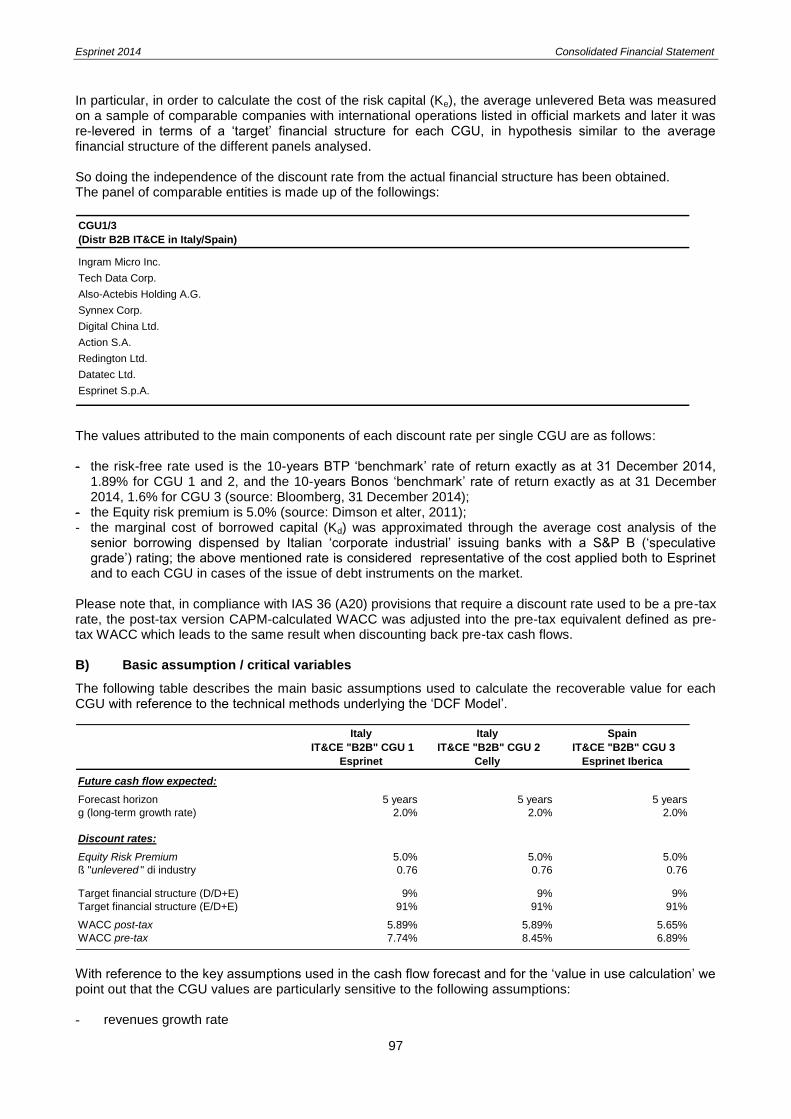
Esprinet 2014 Consolidated Financial Statement
97
In particular, in order to calculate the cost of the risk capital (Ke), the average unlevered Beta was measured on a sample of comparable companies with international operations listed in official markets and later it was re-levered in terms of a ‘target’ financial structure for each CGU, in hypothesis similar to the average financial structure of the different panels analysed. So doing the independence of the discount rate from the actual financial structure has been obtained. The panel of comparable entities is made up of the followings:
CGU1/3
(Distr B2B IT&CE in Italy/Spain)
Ingram Micro Inc.
Tech Data Corp.
Also-Actebis Holding A.G.
Synnex Corp.
Digital China Ltd.
Action S.A.
Redington Ltd.
Datatec Ltd.
Esprinet S.p.A.
The values attributed to the main components of each discount rate per single CGU are as follows: - the risk-free rate used is the 10-years BTP ‘benchmark’ rate of return exactly as at 31 December 2014,
1.89% for CGU 1 and 2, and the 10-years Bonos ‘benchmark’ rate of return exactly as at 31 December 2014, 1.6% for CGU 3 (source: Bloomberg, 31 December 2014);
- the Equity risk premium is 5.0% (source: Dimson et alter, 2011); - the marginal cost of borrowed capital (Kd) was approximated through the average cost analysis of the
senior borrowing dispensed by Italian ‘corporate industrial’ issuing banks with a S&P B (‘speculative grade’) rating; the above mentioned rate is considered representative of the cost applied both to Esprinet and to each CGU in cases of the issue of debt instruments on the market.
Please note that, in compliance with IAS 36 (A20) provisions that require a discount rate used to be a pre-tax rate, the post-tax version CAPM-calculated WACC was adjusted into the pre-tax equivalent defined as pre-tax WACC which leads to the same result when discounting back pre-tax cash flows. B) Basic assumption / critical variables
The following table describes the main basic assumptions used to calculate the recoverable value for each CGU with reference to the technical methods underlying the ‘DCF Model’.
Italy
IT&CE "B2B" CGU 1
Esprinet
Italy
IT&CE "B2B" CGU 2
Celly
Spain
IT&CE "B2B" CGU 3
Esprinet Iberica
Future cash flow expected:
Forecast horizon 5 years 5 years 5 years
g (long-term growth rate) 2.0% 2.0% 2.0%
Discount rates:
Equity Risk Premium 5.0% 5.0% 5.0%
ß "unlevered " di industry 0.76 0.76 0.76
Target financial structure (D/D+E) 9% 9% 9%
Target financial structure (E/D+E) 91% 91% 91%
WACC post-tax 5.89% 5.89% 5.65%
WACC pre-tax 7.74% 8.45% 6.89%
With reference to the key assumptions used in the cash flow forecast and for the ‘value in use calculation’ we point out that the CGU values are particularly sensitive to the following assumptions: - revenues growth rate

Esprinet 2014 Consolidated Financial Statement
98
- gross product margin / fixed costs contribution margin - operating leverage - cash flow discounted rate - growth rate ‘g’ applied to the cash flow of the last defined year utilized for the Terminal Value
calculation. C) External indicators of loss of values and ‘impairment test’
The management, in order to review the impairment indicators, takes into account, amongst other factors, (i) market rate growth or other rates of cost of capital return (ii) the ratio between the book value total net asset of the CGU and the relative market capitalisation. With reference to the first point, during the year no variation in the market rates, that were likely to affect significantly the discount rate used in calculating the asset’s value in use or decrease the asset’s recoverable amount materially, was observed. For completeness, a decrease in the 10years BTP’s applied in the “Free Risk rate and then reflected in the adopted discount rate can be noted as at 31 December 2014 compared to the previous year. With reference to the market value, as at 31 December 2014 the Group Esprinet market capitalisation was equal to 300.2 million euro compared to the consolidation net equity value equal to 275.0 million euro. The latter further enforces the positive results of the goodwill impairment test D) Value adjustments and ‘sensitivity analysis
In conclusion the impairment test did not highlight the need for a write-down in the value of the goodwill entry as at 31 December 2014. In addition, the management believes it unlikely that there will be key assumption changes able to generate a reduction in the CGUs below the carrying amount. More specifically, different sensitivity analysis of the test results were performed taking into account simultaneously the variation of the following basic assumptions.
- the long term growth rate ‘g’ in order to obtain the cash flows beyond plan horizon; - the cash flow discounted rate; - the forecasted EBITDA. The variation range compared to the ‘normal’ case taken into account are as follows: - ‘g’ equal to 0% and to 1%; - WACC lower than -2% and -1%; - EBITDA lower than -10% and -20%.
Can be highlighted that only in the “worst” scenario (g equal to 0%, WACC lower than -2%, EBITDA lower than -10%), a goodwill write-down of the CGU2 equal to 1.1 million euro would be necessary. With reference to the other CGUs no goodwill write-down would be necessary for all scenarios. The abovementioned sensitivity analysis was performed as required by IAS 36 solely for purposes of information and the directors do not believe further write-downs will be necessary since the cash flow forecasts and basic assumptions used in the impairment test are considered reasonably representative of ‘unique scenarios’ where a certain symmetry between ‘best’ and ‘worst’ scenarios can be expected.
3) Intangible assets
Intangible assets amount to 1.0 million euro at 31 December 2014 versus the 767 thousand euro at 31 December 2013. The following table highlights the changes occurred during the year:
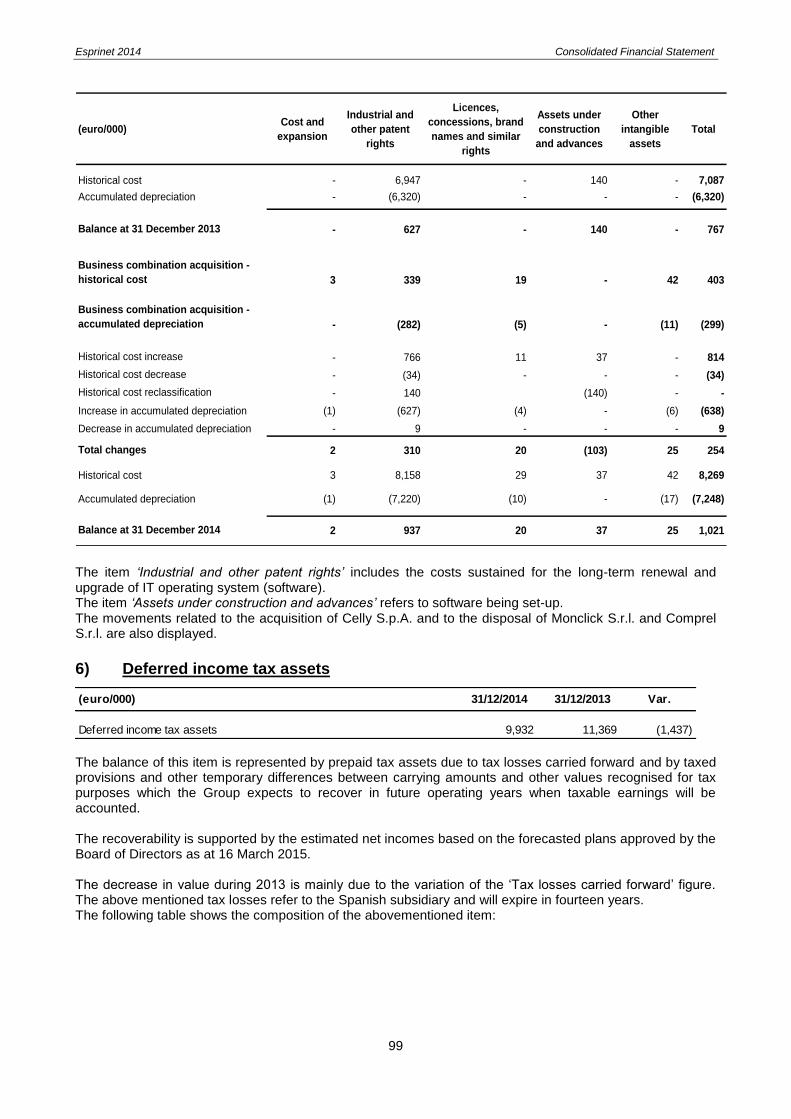
Esprinet 2014 Consolidated Financial Statement
99
(euro/000)Cost and
expansion
Industrial and
other patent
rights
Licences,
concessions, brand
names and similar
rights
Assets under
construction
and advances
Other
intangible
assets
Total
Historical cost - 6,947 - 140 - 7,087
Accumulated depreciation - (6,320) - - - (6,320)
Balance at 31 December 2013 - 627 - 140 - 767
Business combination acquisition -
historical cost 3 339 19 - 42 403
Business combination acquisition -
accumulated depreciation - (282) (5) - (11) (299)
Historical cost increase - 766 11 37 - 814
Historical cost decrease - (34) - - - (34)
Historical cost reclassification - 140 (140) - -
Increase in accumulated depreciation (1) (627) (4) - (6) (638)
Decrease in accumulated depreciation - 9 - - - 9
Total changes 2 310 20 (103) 25 254
Historical cost 3 8,158 29 37 42 8,269
Accumulated depreciation (1) (7,220) (10) - (17) (7,248)
Balance at 31 December 2014 2 937 20 37 25 1,021
The item ‘Industrial and other patent rights’ includes the costs sustained for the long-term renewal and upgrade of IT operating system (software). The item ‘Assets under construction and advances’ refers to software being set-up. The movements related to the acquisition of Celly S.p.A. and to the disposal of Monclick S.r.l. and Comprel S.r.l. are also displayed.
6) Deferred income tax assets
The balance of this item is represented by prepaid tax assets due to tax losses carried forward and by taxed provisions and other temporary differences between carrying amounts and other values recognised for tax purposes which the Group expects to recover in future operating years when taxable earnings will be accounted. The recoverability is supported by the estimated net incomes based on the forecasted plans approved by the Board of Directors as at 16 March 2015. The decrease in value during 2013 is mainly due to the variation of the ‘Tax losses carried forward’ figure. The above mentioned tax losses refer to the Spanish subsidiary and will expire in fourteen years. The following table shows the composition of the abovementioned item:
(euro/000) 31/12/2014 31/12/2013 Var.
Deferred income tax assets 9,932 11,369 (1,437)

Esprinet 2014 Consolidated Financial Statement
100
Temporary
differences
Fiscal effect (tax
rate)Amount
Temporary
differences
Fiscal effect (tax
rate)Amount
Deferred income tax:
Tax losses carried forward 22,747 30%-28%-25% 5,735 23,928 30.00% 7,178
Tax losses carried forward 723 27.50% 199 - 27.50% -
Tax losses carried forward 32 22.00% 7 - 22.00% -
Derivative instruments 179 27.50% 49 69 27.50% 19
Derivative instruments - 30.00% - 104 30.00% 31
Interest expenses - 30.00% - 1,796 30.00% 539
Exceeding amortisation 690 27.50% 190 2,211 27.50% 608
Exceeding amortisation 538 3.90% 21 2,211 3.90% 86
Bad debt provision 6,400 27.50% 1,760 5,635 27.50% 1,550
Bad debt provision 45 28.00% 13 82 30.00% 25
Inventory obsolescence provision 2,536 27.50% 697 1,396 27.50% 384
Inventory obsolescence provision 2,536 3.90% 99 1,396 3.90% 54
Change in inventory 265 31.40% 83 54 30.00% 16
Ammortization costs 171 30.00% 51 57 30.00% 17
Director's fees not paid 1,260 27.50% 347 1,092 27.50% 300
Foreign exchange estimate 261 27.50% 72 35 27.50% 10
Agent suppl. indemnity provision 797 27.50% 219 996 27.50% 274
Agent suppl. indemnity provision 797 3.90% 31 996 3.90% 39
Provisions for risks 416 27.50% 114 361 27.50% 99
Provisions for risks 318 3.90% 12 335 3.90% 13
Provisions for risks 179 28.00% 50 - 28.00% -
TFR' - actuarial gain/loss 614 27.50% 169 - 27.50% -
Ineffec. on cash-flow hedge derivatives - 27.50% - 122 27.50% 34
Ineffec. on cash-flow hedge derivatives - 30.00% - 183 30.00% 55
Derivatives 2006 - 30.00% - 32 30.00% 10
Other 44 31.40% 14 - 31.40% -
Other - 27.50% - 102 27.50% 28
Deferred income tax assets 9,932 11,369
31/12/2014 31/12/2013
(euro/000)
The time-related allocation of this item is as follows:
(euro/000) Within 1 year 1-5 year Over 5 years Total
Deferred income tax assets 31/12/2014 3,458 3,637 2,837 9,932
31/12/2013 3,375 7,131 863 11,369
9) Receivables and other non-current assets
The trade receivables refer to the portion of credit toward the customer ‘Revenue Guard Corps’ (so called Guardia di Finanza – GdF) which expiring date is after one year and arose from a delivery of goods from Esprinet S.p.A. toward the GdF in 2011. This credit consists of annuals payments plan until January 2022 against which the Holding Company obtained a loan with Intesa Sanpaolo during 2013 whose instalments would be paid directly by the customer.
(euro/000) 31/12/2014 31/12/2013 Var.
Guarantee deposits receivables 1,522 1,498 24
Trade receivables 3,085 3,457 (372)
Other receivables 21 23 (2)
Receivables and other non-current assets 4,628 4,978 (350)

Esprinet 2014 Consolidated Financial Statement
101
Since the counterparts of the two transactions are different it was deemed necessary to maintain separately booked on one hand the credit toward the customer and on the other correspondently the debt toward the financial entity until the repayment of the loan in its entirety. The variation compared to 31 December 2013 is due to the allocation in the current receivables of the portion expiring within next fiscal year. The item Guarantee deposits receivables includes guarantee deposits relating to utilities and renting agreements ongoing. The amount entered under Other receivables refers to the Ecor’it consortium membership fees.
Current assets
10) Inventory
(euro/000) 31/12/2014 31/12/2013 Var.
Finished products and goods 256,301 218,958 37,343
Provision for obsolescence (2,813) (1,654) (1,159)
Inventory 253,488 217,304 36,184
Inventory totalled 253.5 million euro shows an increase of +17% almost equally split among the Group companies and aligned to the revenues increase of the year (+14%). The 2.8 million euro allocated to Provision for obsolescence is intended to address the risks associated with the presumed lower realisable value of obsolete and slow-moving stock. The movement in the provision during the period was as follows:
(euro/000) 31/12/2014 31/12/2013 Var.
Provision for absolescence: year-beginning 1,654 994 660
Uses (235) (210) (25)
Accruals 659 870 (211)
Subtotal 424 660 (236)
Acquisition in business combination 829 - 829
Reclass. in disposal group (94) - (94)
Total Variation 1,159 660 499
Provision for absolescence: period-end 2,813 1,654 1,159
11) Trade receivables
(euro/000) 31/12/2014 31/12/2013 Var.
Trade receivables - gross 283,414 239,962 43,452
Bad debt provision (7,431) (7,443) 12
Trade receivables - net 275,983 232,519 43,464
The increase in the item trade receivables-gross (+16%) was mainly caused by the significant improvement in Group trade receivables turnover (+14%) and partially by the customers average collection period up from 34 days in 2013 to 36 in 2014. Adjustments to the presumed net realisable value of receivables collected is effected through bad debt provision which incidence on receivables-gross is substantially stable (further information can be found under ‘Disclosure on risks and financial instruments’). The movement in this provision during the period was as follows:
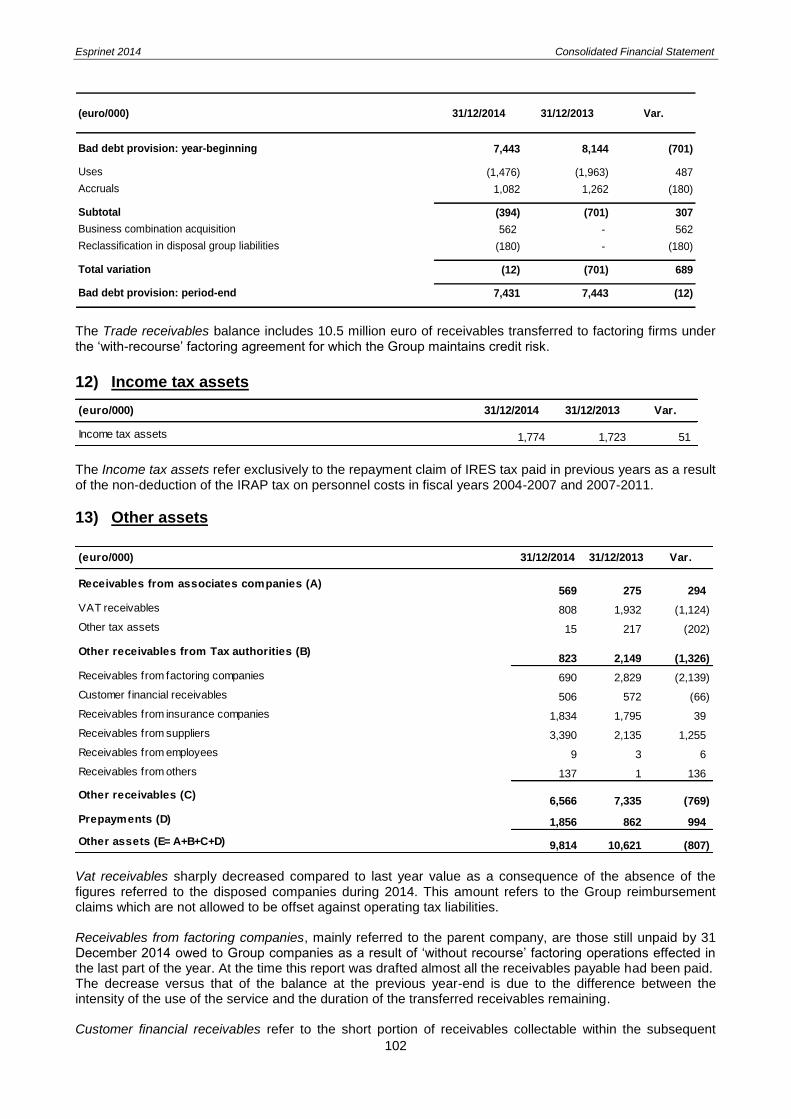
Esprinet 2014 Consolidated Financial Statement
102
(euro/000) 31/12/2014 31/12/2013 Var.
Bad debt provision: year-beginning 7,443 8,144 (701)
Uses (1,476) (1,963) 487
Accruals 1,082 1,262 (180)
Subtotal (394) (701) 307
Business combination acquisition 562 - 562
Reclassification in disposal group liabilities (180) - (180)
Total variation (12) (701) 689
Bad debt provision: period-end 7,431 7,443 (12)
The Trade receivables balance includes 10.5 million euro of receivables transferred to factoring firms under the ‘with-recourse’ factoring agreement for which the Group maintains credit risk.
12) Income tax assets
The Income tax assets refer exclusively to the repayment claim of IRES tax paid in previous years as a result of the non-deduction of the IRAP tax on personnel costs in fiscal years 2004-2007 and 2007-2011.
13) Other assets
Vat receivables sharply decreased compared to last year value as a consequence of the absence of the figures referred to the disposed companies during 2014. This amount refers to the Group reimbursement claims which are not allowed to be offset against operating tax liabilities. Receivables from factoring companies, mainly referred to the parent company, are those still unpaid by 31 December 2014 owed to Group companies as a result of ‘without recourse’ factoring operations effected in the last part of the year. At the time this report was drafted almost all the receivables payable had been paid. The decrease versus that of the balance at the previous year-end is due to the difference between the intensity of the use of the service and the duration of the transferred receivables remaining. Customer financial receivables refer to the short portion of receivables collectable within the subsequent
(euro/000) 31/12/2014 31/12/2013 Var.
Income tax assets 1,774 1,723 51
(euro/000) 31/12/2014 31/12/2013 Var.
Receivables from associates companies (A)569 275 294
VAT receivables 808 1,932 (1,124)
Other tax assets 15 217 (202)
Other receivables from Tax authorities (B)823 2,149 (1,326)
Receivables from factoring companies 690 2,829 (2,139)
Customer f inancial receivables 506 572 (66)
Receivables from insurance companies 1,834 1,795 39
Receivables from suppliers 3,390 2,135 1,255
Receivables from employees 9 3 6
Receivables from others 137 1 136
Other receivables (C)6,566 7,335 (769)
Prepayments (D) 1,856 862 994
Other assets (E= A+B+C+D) 9,814 10,621 (807)

Esprinet 2014 Consolidated Financial Statement
103
year that arose from a delivery of goods in 2011 from Esprinet S.p.A. to the customer ‘Guardia di finanza - GdF’. For further information please refer also to paragraph “Receivables and other non-current assets”. Receivables from insurance companies include the insurance compensation – after deductibles – recognized by the insurance companies for claims of various kinds not yet paid but which are reasonably expected to be collected within the end of next year. Receivables from suppliers refer to credit notes received exceeding the amount owed at year-end, to advance payments demanded by suppliers before purchase orders are executed and to receivables from hauliers for advance VAT payments and customs duties pertaining to imports. Prepayments are costs (mainly maintenance fees, insurance premiums, payable rents and payable.
17) Cash and cash equivalents
Cash and cash equivalents are almost entirely made up of bank balances, all immediately available. Of a partly temporary nature, the level of liquidity (originated in the normal short-term financial cycle of collections) dramatically fluctuates not only along the calendar year but also during each month, due for the most part to the concentration of payments received from customers at the end and middle of each month, while the maturities of payments to suppliers are distributed more evenly over the month. The market value of the cash and cash equivalents is the same as the carrying amount.
Net Equity
Items composing consolidated shareholders’ equity are explained in the following notes:
19) Share capital
The Esprinet S.p.A. Share capital, fully subscribed and paid-in as at 31 December 2014, is 7,860,651 euro and comprises 52,404,340 shares with a face value of 0.15 euro each. The main information items used in reporting the value of the rights for the free assignment of the shares can be found in the ‘Directors’ Report on Operations’. The value of these rights was reported in the separate income statement under costs relating to salaried staff and under those relating to Directors, with a balancing item reported in the statement of financial position under the item ‘Reserves’.
(euro/000) 31/12/2014 31/12/2013 Var.
Bank and postal deposit 225,131 176,876 48,255
Cash 43 17 26
Cheques - - -
Total cash and cash equivalents 225,174 176,893 48,281
(euro/000) 31/12/2014 31/12/2013 Var.
Share Capital (A) 7,861 7,861 -
Reserves and profit carried over (B) 250,853 241,940 8,913
Ow n shares (C) (13,070) (13,070) -
Total reserves (D=B+C) 237,783 228,870 8,913
Net income for the year (E) 27,035 23,095 3,940
Net equity (F=A+D+E) 272,679 259,826 12,853
Non-controlling interests (G) 2,193 - 2,193
Total equity (H=F+G) 274,872 259,826 15,046
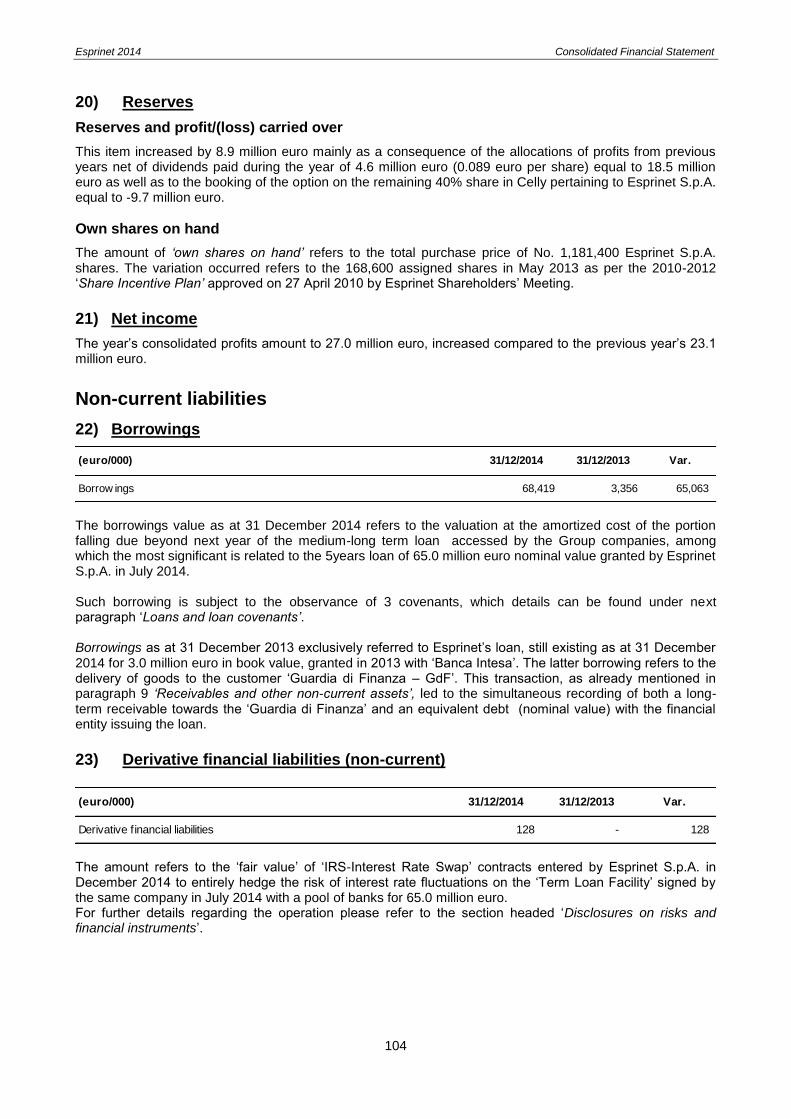
Esprinet 2014 Consolidated Financial Statement
104
20) Reserves
Reserves and profit/(loss) carried over
This item increased by 8.9 million euro mainly as a consequence of the allocations of profits from previous years net of dividends paid during the year of 4.6 million euro (0.089 euro per share) equal to 18.5 million euro as well as to the booking of the option on the remaining 40% share in Celly pertaining to Esprinet S.p.A. equal to -9.7 million euro.
Own shares on hand
The amount of ‘own shares on hand’ refers to the total purchase price of No. 1,181,400 Esprinet S.p.A. shares. The variation occurred refers to the 168,600 assigned shares in May 2013 as per the 2010-2012 ‘Share Incentive Plan’ approved on 27 April 2010 by Esprinet Shareholders’ Meeting.
21) Net income
The year’s consolidated profits amount to 27.0 million euro, increased compared to the previous year’s 23.1 million euro.
Non-current liabilities
22) Borrowings
The borrowings value as at 31 December 2014 refers to the valuation at the amortized cost of the portion falling due beyond next year of the medium-long term loan accessed by the Group companies, among which the most significant is related to the 5years loan of 65.0 million euro nominal value granted by Esprinet S.p.A. in July 2014. Such borrowing is subject to the observance of 3 covenants, which details can be found under next paragraph ‘Loans and loan covenants’. Borrowings as at 31 December 2013 exclusively referred to Esprinet’s loan, still existing as at 31 December 2014 for 3.0 million euro in book value, granted in 2013 with ‘Banca Intesa’. The latter borrowing refers to the delivery of goods to the customer ‘Guardia di Finanza – GdF’. This transaction, as already mentioned in paragraph 9 ‘Receivables and other non-current assets’, led to the simultaneous recording of both a long-term receivable towards the ‘Guardia di Finanza’ and an equivalent debt (nominal value) with the financial entity issuing the loan.
23) Derivative financial liabilities (non-current)
The amount refers to the ‘fair value’ of ‘IRS-Interest Rate Swap’ contracts entered by Esprinet S.p.A. in December 2014 to entirely hedge the risk of interest rate fluctuations on the ‘Term Loan Facility’ signed by the same company in July 2014 with a pool of banks for 65.0 million euro. For further details regarding the operation please refer to the section headed ‘Disclosures on risks and financial instruments’.
Borrow ings 68,419 3,356 65,063
(euro/000) 31/12/2014 31/12/2013 Var.
(euro/000) 31/12/2014 31/12/2013 Var.
Derivative financial liabilities 128 - 128

Esprinet 2014 Consolidated Financial Statement
105
24) Deferred income tax liabilities
The balance of this item depends on higher taxes that the Group has to pay in the next operating years due to temporary differences between the carrying amounts of assets and liabilities in the financial statements and the corresponding values recognised for tax purposes. As shown in the following table, these differences mainly arise from the elimination of the tax amortisation of goodwill.
Temporary
differences
Fiscal effect (tax
rate)Amount
Temporary
differences
Fiscal effect (tax
rate)Amount
Deferred income tax liabilities
Goodwills' amortisation 7,382 27.50% 2,030 9,158 27.50% 2,518
Goodwills' amortisation 7,382 3.90% 288 9,158 3.90% 357
Goodwills' amortisation 7,966 25.00% 1,992 7,329 30.00% 2,199
TFR' variation 166 27.50% 46 153 27.50% 42
Foreign exchange estimate 101 27.50% 28 107 27.50% 29
Change in inventory 894 27.50% 246 119 27.50% 33
Change in inventory 894 3.90% 35 119 3.90% 5
Change in inventory 232 30.00% 70 221 30.00% 66
Leasing quotas 163 28%-25% 44 273 30.00% 82
Other 91 20.00% 18
Total deferred income tax liabilities 4,795 5,331
31/12/2014 31/12/2013
(euro/000)
The time-related allocation of deferred income tax liabilities is as follows:
(euro/000) Within 1 year 1-5 years Over 5 years Total
Deferred income tax liabilities 31/12/2014 471 14 4,310 4,795
31/12/2013 875 49 4,407 5,331
25) Retirement benefit obligations
‘Retirement benefit obligations’ reflects the ‘TFR’ provision and other benefits accruing to salaried staff at the close of the period, assessed in accordance with actuarial criteria, pursuant to IAS 19. The provisions totally belong to Italian companies, since a similar system does not exist in Spain. Please note that from 1 January 2007 important modifications governing the Staff Severance Fund, among which the possibility for the worker to choose the destination of the accruing Staff Severance Fund, were introduced. In particular, the new Staff Severance Fund flows can be channelled by the worker into a selected pension fund or kept in the company (in this case the Staff Severance Fund contributions will be paid into a treasury fund instituted at the INPS). Changes occurred during the year are shown in the tables below:
(euro/000) 31/12/2014 31/12/2013 Var.
Deferred income tax liabilities 4,795 5,331 (536)
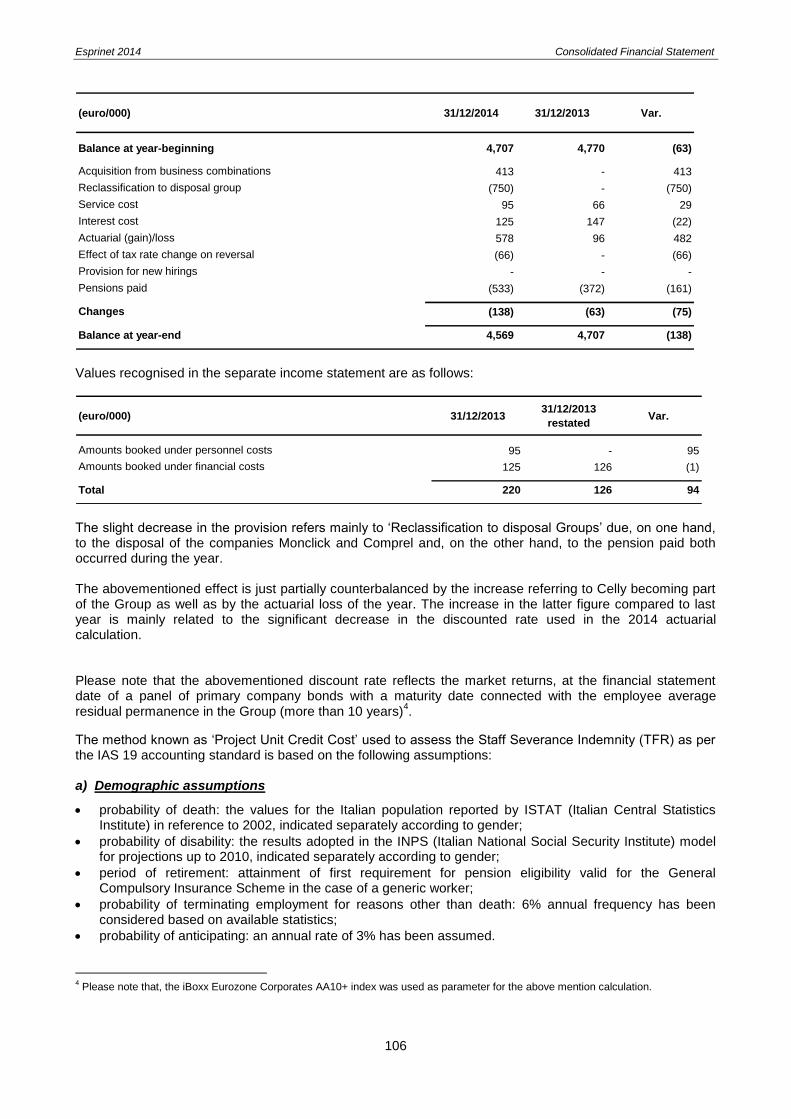
Esprinet 2014 Consolidated Financial Statement
106
(euro/000) 31/12/2014 31/12/2013 Var.
Balance at year-beginning 4,707 4,770 (63)
Acquisition from business combinations 413 - 413
Reclassification to disposal group (750) - (750)
Service cost 95 66 29
Interest cost 125 147 (22)
Actuarial (gain)/loss 578 96 482
Effect of tax rate change on reversal (66) - (66)
Provision for new hirings - - -
Pensions paid (533) (372) (161)
Changes (138) (63) (75)
Balance at year-end 4,569 4,707 (138)
Values recognised in the separate income statement are as follows:
(euro/000) 31/12/201331/12/2013
restatedVar.
Amounts booked under personnel costs 95 - 95
Amounts booked under financial costs 125 126 (1)
Total 220 126 94
The slight decrease in the provision refers mainly to ‘Reclassification to disposal Groups’ due, on one hand, to the disposal of the companies Monclick and Comprel and, on the other hand, to the pension paid both occurred during the year. The abovementioned effect is just partially counterbalanced by the increase referring to Celly becoming part of the Group as well as by the actuarial loss of the year. The increase in the latter figure compared to last year is mainly related to the significant decrease in the discounted rate used in the 2014 actuarial calculation. Please note that the abovementioned discount rate reflects the market returns, at the financial statement date of a panel of primary company bonds with a maturity date connected with the employee average residual permanence in the Group (more than 10 years)
4.
The method known as ‘Project Unit Credit Cost’ used to assess the Staff Severance Indemnity (TFR) as per the IAS 19 accounting standard is based on the following assumptions: a) Demographic assumptions
probability of death: the values for the Italian population reported by ISTAT (Italian Central Statistics Institute) in reference to 2002, indicated separately according to gender;
probability of disability: the results adopted in the INPS (Italian National Social Security Institute) model for projections up to 2010, indicated separately according to gender;
period of retirement: attainment of first requirement for pension eligibility valid for the General Compulsory Insurance Scheme in the case of a generic worker;
probability of terminating employment for reasons other than death: 6% annual frequency has been considered based on available statistics;
probability of anticipating: an annual rate of 3% has been assumed.
4 Please note that, the iBoxx Eurozone Corporates AA10+ index was used as parameter for the above mention calculation.

Esprinet 2014 Consolidated Financial Statement
107
b) Economic-financial assumptions
31/12/2014 31/12/2013
Cost of living increase 2.0% 2.0%
Discounting rate (2)
2.30% 3.20%
Remuneration increase 3.5% (1)
3.5% (1)
Staff severance indemnity (TFR) - annual rate increase 3.0% 3.0%
(1) The possibility of a remuneration increase refers solely to Celly S.p.A as at 31 December 2014 and to Monclick S.r.l. as at 2013.
(2) the iBoxx Eurozone Corporates AA10++ index was used as parameter for the above mention calculation.
Sensitivity analyses Pursuant to IAS 19R, a sensitivity analysis of changes in main actuarial hypothesis used in the calculation model is required. As basic scenario the one above described was assumed and from that the most significant hypotheses (i.e. annual average discount rate, average cost of living increase and turn-over rate) were increased and decreased by half, a quarter and two percentage points respectively. The outputs so obtained are summarized as follows:
Sensitivity analysis
Esprinet Group
Past Service Liability
Annual discount rate +0.50% 4,309,581
-0.50% 4,741,689
Annual inflation rate +0.25% 4,578,479
-0.25% 4,456,320
Annual turnover rate +2.00% 4,448,624
-2.00% 4,615,376
(euro)
As required by IAS 19 Revised, the estimated expected payments (in nominal value) for the next years are as follows:
Year
0 - 2
1 - 2
2 - 3
3 - 4
4 - 5
5 - 6
6 - 7
7 - 8
8 - 9
9 - 10
Over 10 4,781,669
286,249
314,935
263,707
276,391
(Euro) Future Cash Flow
Esprinet Group
281,633
341,019
332,676
307,339
328,088
297,144

Esprinet 2014 Consolidated Financial Statement
108
49) Debts for investments in subsidiaries
(euro/000) 31/12/14 31/12/13 Var.
Debts for investments in subsidiaries 9,758 - 9,758
The debts for investments in subsidiaries refer to the discounted fair value of the forecast potential
compensation relating to the acquisition of the residual 40% of Celly S.p.A. as a consequence of the
mutually granted put/call options between Esprinet S.p.A. and Celly S.p.A. on the same shares.
The above mentioned debt, falling due between the 5th and the 7th year subsequent to the Celly Group
acquisition date occurred on 12 May 2014, was calculated from the management expectation referring to
Celly economic valuation as at the possible exercise date discounted-back using a 5-year IRS rate prevailing
at the reporting date.
26) Non-current provisions and other liabilities
(euro/000) 31/12/2014 31/12/2013 Var.
Long-term liabilities for cash incentives - 424 (424)
Provisions for pensions and similar obligations 1,433 1,304 129
Other provisions 1,301 605 696
Non-current provisions and other liabilities 2,734 2,333 401
The item Long-term liabilities for cash incentives refers to present value of cash incentives maturing by
beneficiaries of the ‘Long-term Incentive Plan’ payable on May 2015 solely both on achievement of profit
targets for the 3years period 2012-2014 and providing that the beneficiary will remain in the Group until the
presentation of the 2014 consolidated financial statement. The change in the abovementioned item is related
to the liability reclassification in the ‘Current provisions and other liabilities’ as consequence of its vesting
date.
The item Provisions for pensions includes the supplementary customer indemnity provision payable to
agents based on current regulations disciplining the subject. Movements in the year are as follows:
(euro/000) 31/12/2014 31/12/2013 Var.
Provisions for pensions: year-beginning 1,304 1,141 163
Uses (55) (104) 49
Accruals 194 267 (73)
Subtotal 139 163 (24)
Business combination acquisition 187 - 187
Reclassification in disposal group liabilities (197) - (197)
Total variation 129 163 (34)
Provisions for pensions: period-end 1,433 1,304 129
The amount, entered under Other provisions is intended as cover both for risks linked with current legal and
tax-related disputes, and for events related to the extraordinary transactions occurred in the year. Changes
in this item during the year are as follows:

Esprinet 2014 Consolidated Financial Statement
109
(euro/000) 31/12/2014 31/12/2013 Var.
Other provisions: year-beginning 605 390 215
Uses (87) (180) 93
Accruals 591 395 196
Subtotal 504 215 289
Business combination acquisition 250 - 250
Reclassification in disposal group liabilities (58) - (58)
Total variation 696 215 481
Other provisions: period-end 1,301 605 696
Development of disputes involving Esprinet S.p.A. and the Group
In 2014 the following developments occurred in relation to the main disputes involving the Group, for which the Company has conducted the pertinent risk assessments and, where deemed appropriate, recognized the ensuing allocations to the provision for risks. The list below summarizes the development of the main on-going tax disputes. Esprinet S.p.A.: direct taxes for the year 2002
In the tax dispute for tax period 2002 relating to VAT, IRPEG and IRAP, in connection with which Esprinet S.p.A. obtained favourable judgments in both the first and second instance, against the assessment notice issued in late 2007, and please note that, with reference to the appeal lodged by the Italian Revenue Office with the Italy’s Supreme Court of Appeal on 19 July 2011, there are no developments. Considering the grounds for the judgments in the two instances of the proceedings already completed, as well as the degree of likelihood of a favourable outcome for Esprinet S.p.A. before the Supreme Court of Appeal, no allocations have been recognized to account for this dispute, with the support of an opinion from tax advisors.
Actebis Computer S.p.A. (now Esprinet S.p.A.)
Indirect taxes for the year 2005
In the tax disputes involving Actebis Computer S.p.A. relating to periods prior to the acquisition of the company (subsequently merged into Esprinet S.p.A.), as also disclosed in the financial statements for the previous year, all outstanding litigation has been put to rest, with the exception of that pertaining to the year 2005, for which Esprinet, on indication from the seller of Actebis, after the attempted assessment by adhesion failed, proceeded to pay the reduced penalties and lodge an appeal before the Provincial Tax Commission. This appeal was rejected on 8 October 2012. Esprinet S.p.A., following seller consultant’s advice, presented an appeal which was registered at the Regional Tax Commission on 20 May 2013. On 7 January 2014 Esprinet paid the sums provisionally inscribed on the tax roll, after receipt of funding from the seller. On 13 November 2014 the amounts remaining to be paid as per the Regional Tax Commission decision were inscribed on the tax roll. Considering that the existing risks in connection with former Actebis Computer S.p.A. disputes are covered by contractual warranties previously granted to Esprinet S.p.A., it is believed that the cases in question will not result in significant impacts of an economic nature for the Company. Esprinet S.p.A.- direct taxes for the years 2005-2008 (black list)
A general audit of Esprinet S.p.A. by the Finance Police – Milan Tax Police Unit concerning direct taxes for the period 2005-2008 and VAT for the period 2005-2009 began in September 2010. The audit focused in particular, with respect to direct taxes, on purchase transactions undertaken with entities residing in countries with privileged tax regimes with the aim of verifying the proper deductibility of the costs concerned, and, with respect to VAT, on the invoicing cycle, and in particular on the proper taxation of commercial dealings with clients. The audit concluded on 29 February 2012, after 59 days of the presence of auditors in the Company’s offices.
Late 2012 saw the conclusion of the dispute that arose following the receipt by Esprinet S.p.A. of the assessment notices concerning IRES (corporate income tax) and IRAP (regional tax on productive activities)

Esprinet 2014 Consolidated Financial Statement
110
for the year 2005, through relative settlement agreements without significant financial expenditure for Esprinet S.p.A. At the hearing of 18 January 2013, the Provincial Tax Commission acknowledged the settlement and ruled that the subject matter of the dispute had been put to rest.
With respect to the years 2006 and 2007, in late December 2012 Esprinet S.p.A. received assessment notices relating to IRES and IRAP concerning the disallowance of costs incurred in dealings with suppliers residing in countries or territories having privileged tax regimes. With reference to the 2007 disputes, the activities undertaken by the Company brought the matter of dispute to an end through both the assessment by adhesion (signed on 17 May 2013) and the controversy facilitated procedure, with a total expense of approx. 19 thousand euro for the Company. With reference to the 2006 disputes, the Company appealed on 4 March 2013 against the inspection notifications. On the hearing of 9 December 2013, the Province Tax Commission acknowledged the cancellation of acts relating to the abovementioned tax year and decided to close the dispute on 7 January 2014. The amount paid by the Company for tax year 2006 was equal to approx. 16 thousand euro.
On 22 July 2013 the Company was presented with a questionnaire regarding 2008 operations carried out on subjects resident in countries with a ‘privileged tax regime’ and on 3 December 2013 the Company was served two notices of assessment relating to such tax year. On 17 January 2014 the Company filed a tax settlement proposal which was signed on 11 March 2014, thus closing the dispute. The amount paid by the Company for tax year 2008 was equal to approx. 25 thousand euro. Esprinet S.p.A.- direct taxes for the year 2009 (black list)
On 12 June 2014 the Company was presented by the Direzione Regionale Lombardia (Lombardy Regional Revenue Office) with a questionnaire regarding 2009 operations carried out on subjects resident in countries with a ‘privileged tax regime’. On 8 September the questionnaire answers were filed and on 28 November 2014, two verification notices related to IRES (i.e. the Italian Tax on Corporate Income) and IRAP (i.e. Regional Tax on Productive Activities) for the year 2009 have been notified. On 23 December 2014, the Company arranged the payment of the amounts due for the favorable settlement of such verification notices, having the Italian Revenue Agency recognized the deductibility of almost all of the bore costs. The amount paid for the settlement of the matter is approx.. equal to 16 thousand euros. Celly S.p.A. direct and indirect taxes for the year 2010
On 27 September 2013 the company received a tax audit by Monza e Brianza Revenue Office on the tax year 2010. On 24 October 2013 a tax audit report was also notified and the Company filed a statement of defence on 23 December 2013. In light of the aforementioned, an estimation of the risk was carried out, considering some of the findings totally or partially indefensible.
Current liabilities
27) Trade payables
(euro/000) 31/12/2014 31/12/2013 Var.
Trade payables - gross 508,948 463,697 45,251
Credit notes to be received (56,908) (63,331) 6,423
Trade payables 452,040 400,366 51,674
The ‘Receivables – credit notes’ mainly refer to the rebates related to commercial targets reached, to various incentives, to reimbursement of joint marketing activities with suppliers and to stocks contractual protections. For further information on this item trend and more generally on the Working Capital please refer to paragraph ‘Operating net working capital’ in the ‘Directors’ Report on Operations’.
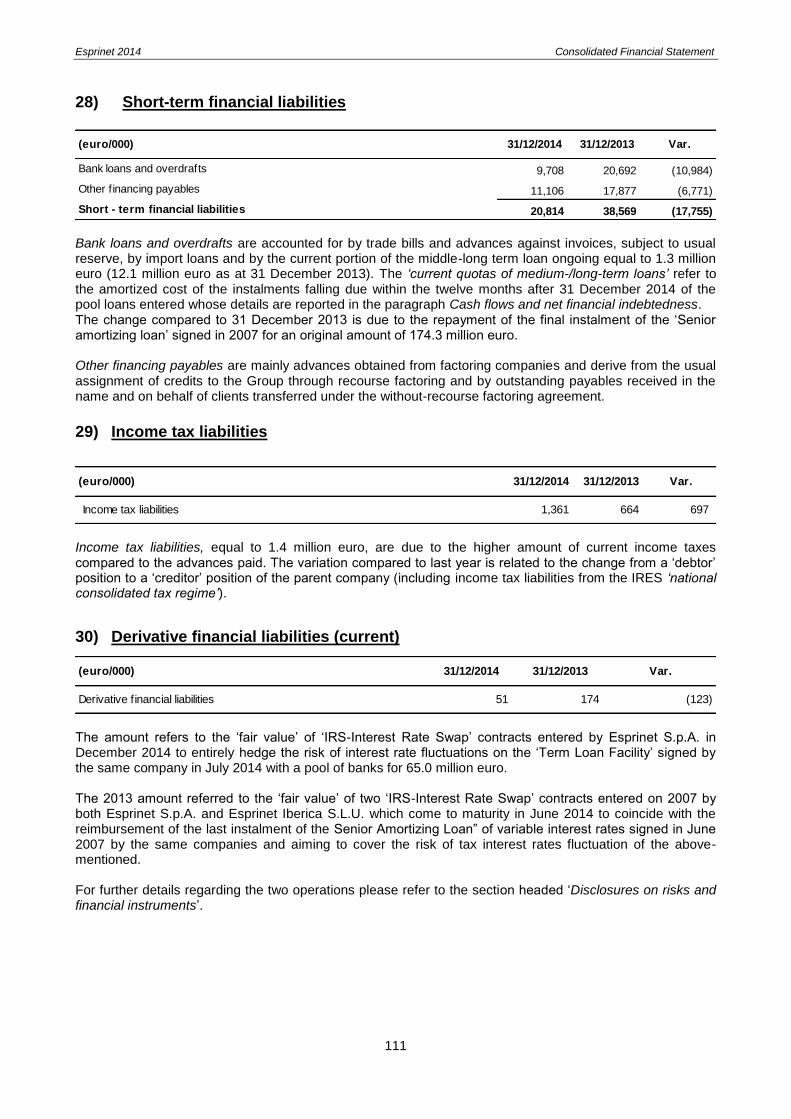
Esprinet 2014 Consolidated Financial Statement
111
28) Short-term financial liabilities
Bank loans and overdrafts are accounted for by trade bills and advances against invoices, subject to usual reserve, by import loans and by the current portion of the middle-long term loan ongoing equal to 1.3 million euro (12.1 million euro as at 31 December 2013). The ‘current quotas of medium-/long-term loans’ refer to the amortized cost of the instalments falling due within the twelve months after 31 December 2014 of the pool loans entered whose details are reported in the paragraph Cash flows and net financial indebtedness. The change compared to 31 December 2013 is due to the repayment of the final instalment of the ‘Senior amortizing loan’ signed in 2007 for an original amount of 174.3 million euro. Other financing payables are mainly advances obtained from factoring companies and derive from the usual assignment of credits to the Group through recourse factoring and by outstanding payables received in the name and on behalf of clients transferred under the without-recourse factoring agreement.
29) Income tax liabilities
Income tax liabilities, equal to 1.4 million euro, are due to the higher amount of current income taxes compared to the advances paid. The variation compared to last year is related to the change from a ‘debtor’ position to a ‘creditor’ position of the parent company (including income tax liabilities from the IRES ‘national consolidated tax regime’).
30) Derivative financial liabilities (current)
The amount refers to the ‘fair value’ of ‘IRS-Interest Rate Swap’ contracts entered by Esprinet S.p.A. in December 2014 to entirely hedge the risk of interest rate fluctuations on the ‘Term Loan Facility’ signed by the same company in July 2014 with a pool of banks for 65.0 million euro. The 2013 amount referred to the ‘fair value’ of two ‘IRS-Interest Rate Swap’ contracts entered on 2007 by both Esprinet S.p.A. and Esprinet Iberica S.L.U. which come to maturity in June 2014 to coincide with the reimbursement of the last instalment of the Senior Amortizing Loan” of variable interest rates signed in June 2007 by the same companies and aiming to cover the risk of tax interest rates fluctuation of the above-mentioned. For further details regarding the two operations please refer to the section headed ‘Disclosures on risks and financial instruments’.
(euro/000) 31/12/2014 31/12/2013 Var.
Bank loans and overdrafts 9,708 20,692 (10,984)
Other financing payables 11,106 17,877 (6,771)
Short - term financial liabilities 20,814 38,569 (17,755)
(euro/000) 31/12/2014 31/12/2013 Var.
Income tax liabilities 1,361 664 697
(euro/000) 31/12/2014 31/12/2013 Var.
Derivative financial liabilities 51 174 (123)
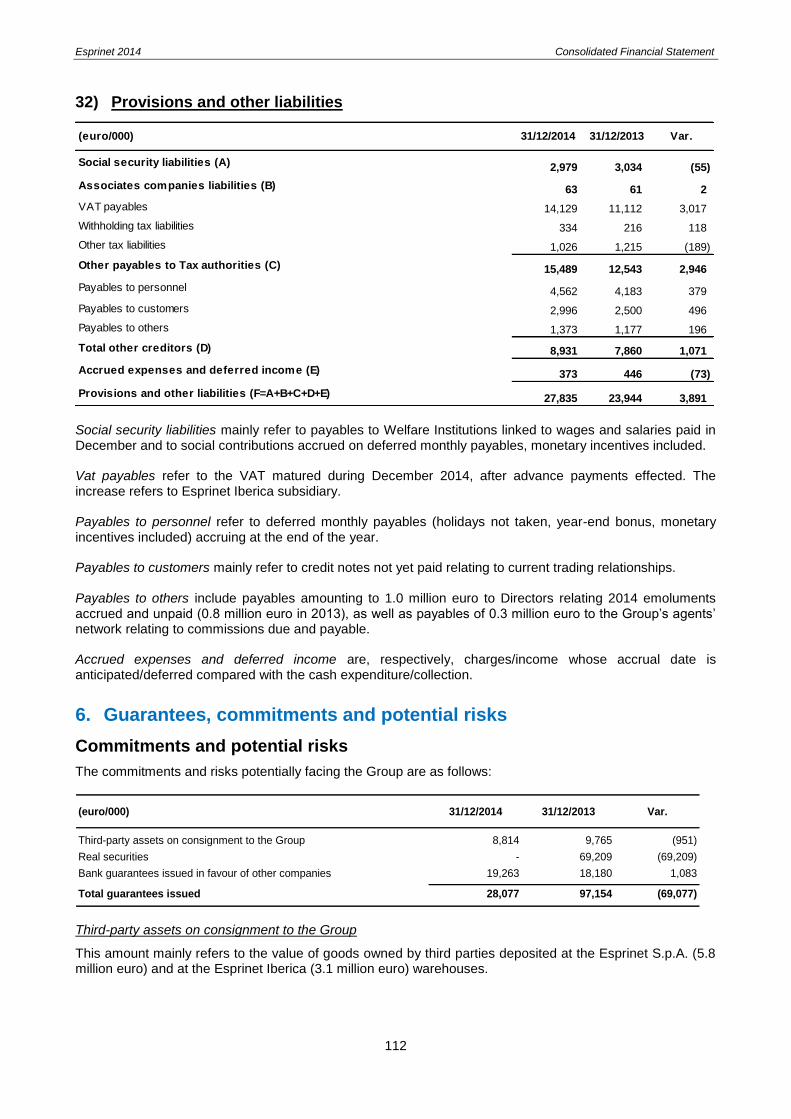
Esprinet 2014 Consolidated Financial Statement
112
32) Provisions and other liabilities
Social security liabilities mainly refer to payables to Welfare Institutions linked to wages and salaries paid in December and to social contributions accrued on deferred monthly payables, monetary incentives included. Vat payables refer to the VAT matured during December 2014, after advance payments effected. The increase refers to Esprinet Iberica subsidiary. Payables to personnel refer to deferred monthly payables (holidays not taken, year-end bonus, monetary incentives included) accruing at the end of the year. Payables to customers mainly refer to credit notes not yet paid relating to current trading relationships. Payables to others include payables amounting to 1.0 million euro to Directors relating 2014 emoluments accrued and unpaid (0.8 million euro in 2013), as well as payables of 0.3 million euro to the Group’s agents’ network relating to commissions due and payable. Accrued expenses and deferred income are, respectively, charges/income whose accrual date is anticipated/deferred compared with the cash expenditure/collection.
6. Guarantees, commitments and potential risks
Commitments and potential risks
The commitments and risks potentially facing the Group are as follows:
(euro/000) 31/12/2014 31/12/2013 Var.
Third-party assets on consignment to the Group 8,814 9,765 (951)
Real securities - 69,209 (69,209)
Bank guarantees issued in favour of other companies 19,263 18,180 1,083
Total guarantees issued 28,077 97,154 (69,077)
Third-party assets on consignment to the Group
This amount mainly refers to the value of goods owned by third parties deposited at the Esprinet S.p.A. (5.8 million euro) and at the Esprinet Iberica (3.1 million euro) warehouses.
(euro/000) 31/12/2014 31/12/2013 Var.
Social security liabilities (A) 2,979 3,034 (55)
Associates companies liabilities (B) 63 61 2
VAT payables 14,129 11,112 3,017
Withholding tax liabilities 334 216 118
Other tax liabilities 1,026 1,215 (189)
Other payables to Tax authorities (C) 15,489 12,543 2,946
Payables to personnel 4,562 4,183 379
Payables to customers 2,996 2,500 496
Payables to others 1,373 1,177 196
Total other creditors (D) 8,931 7,860 1,071
Accrued expenses and deferred income (E) 373 446 (73)
Provisions and other liabilities (F=A+B+C+D+E) 27,835 23,944 3,891
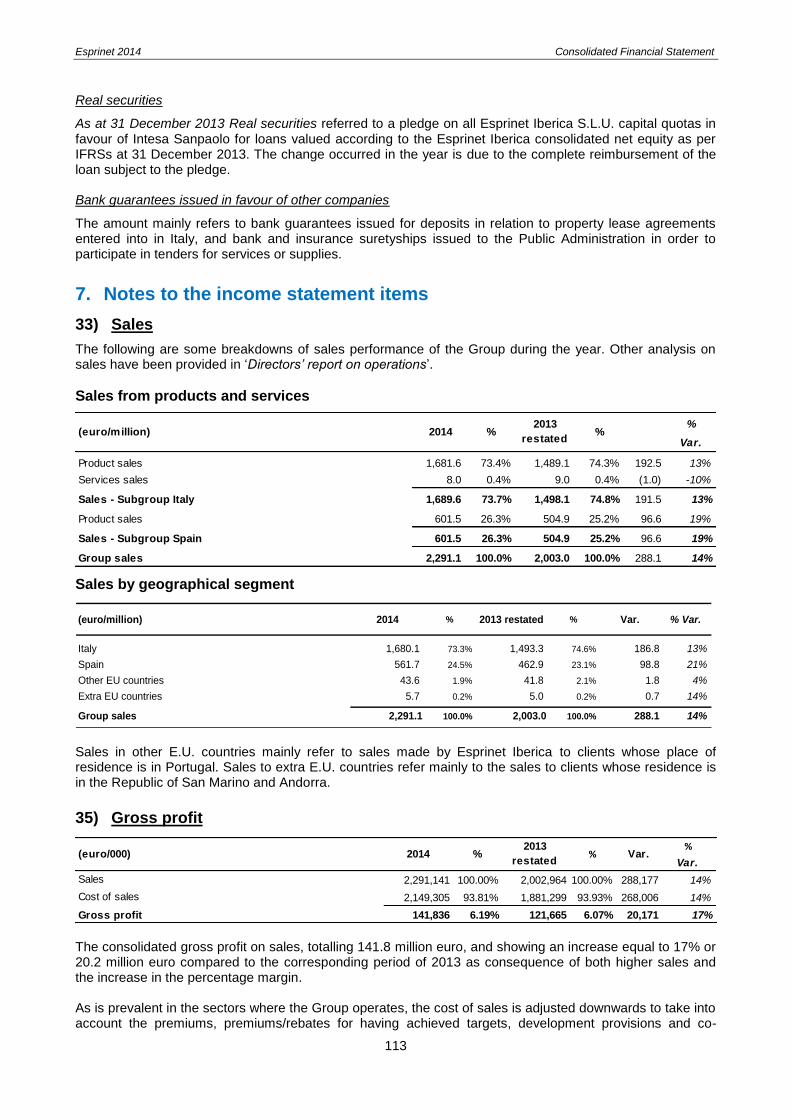
Esprinet 2014 Consolidated Financial Statement
113
Real securities
As at 31 December 2013 Real securities referred to a pledge on all Esprinet Iberica S.L.U. capital quotas in favour of Intesa Sanpaolo for loans valued according to the Esprinet Iberica consolidated net equity as per IFRSs at 31 December 2013. The change occurred in the year is due to the complete reimbursement of the loan subject to the pledge. Bank guarantees issued in favour of other companies
The amount mainly refers to bank guarantees issued for deposits in relation to property lease agreements entered into in Italy, and bank and insurance suretyships issued to the Public Administration in order to participate in tenders for services or supplies.
7. Notes to the income statement items
33) Sales
The following are some breakdowns of sales performance of the Group during the year. Other analysis on sales have been provided in ‘Directors’ report on operations’.
Sales from products and services
Sales by geographical segment
(euro/million) 2014 % 2013 restated % Var. % Var.
Italy 1,680.1 73.3% 1,493.3 74.6% 186.8 13%
Spain 561.7 24.5% 462.9 23.1% 98.8 21%
Other EU countries 43.6 1.9% 41.8 2.1% 1.8 4%
Extra EU countries 5.7 0.2% 5.0 0.2% 0.7 14%
Group sales 2,291.1 100.0% 2,003.0 100.0% 288.1 14%
Sales in other E.U. countries mainly refer to sales made by Esprinet Iberica to clients whose place of residence is in Portugal. Sales to extra E.U. countries refer mainly to the sales to clients whose residence is in the Republic of San Marino and Andorra.
35) Gross profit
The consolidated gross profit on sales, totalling 141.8 million euro, and showing an increase equal to 17% or 20.2 million euro compared to the corresponding period of 2013 as consequence of both higher sales and the increase in the percentage margin. As is prevalent in the sectors where the Group operates, the cost of sales is adjusted downwards to take into account the premiums, premiums/rebates for having achieved targets, development provisions and co-
%
Var.
Product sales 1,681.6 73.4% 1,489.1 74.3% 192.5 13%
Services sales 8.0 0.4% 9.0 0.4% (1.0) -10%
Sales - Subgroup Italy 1,689.6 73.7% 1,498.1 74.8% 191.5 13%
Product sales 601.5 26.3% 504.9 25.2% 96.6 19%
Sales - Subgroup Spain 601.5 26.3% 504.9 25.2% 96.6 19%
Group sales 2,291.1 100.0% 2,003.0 100.0% 288.1 14%
(euro/million) % %20142013
restated
%
Var.
Sales 2,291,141 100.00% 2,002,964 100.00% 288,177 14%
Cost of sales 2,149,305 93.81% 1,881,299 93.93% 268,006 14%
Gross profit 141,836 6.19% 121,665 6.07% 20,171 17%
(euro/000) % % Var.20142013
restated
Esprinet 2014 Consolidated Financial Statement
114
marketing, cash discounts (so-called ‘prompt payment discounts’) and other incentives. This is further reduced by the credit notes issued by vendors in relation to protection agreed for the value of stock. Gross profit is affected by the difference between the amount of trade receivables sold ‘without-recourse’ to factoring companies within the usual revolving programmes and the amounts collected. This is calculated as approx. 3.5 million euro for the 2014 operating year (2.8 million euro in 2013).
37-38) Operating costs (SG&A)
Recurring operating costs amount to 98.8 million euro and show a growth of +14% in relation to the previous year. The following table gives a detailed breakdown of the consolidated operating costs and their performance:
Sales and marketing costs mainly include the following: - costs relating to personnel working in the marketing, sales and Web functions, corresponding social
security contributions and accessory charges; - agents and other commercial freelance charges; - management cost for the Cash and Carry shops. Overheads and administrative costs include: - costs relating to management and administrative personnel, including the EDP area, human resources,
general services and logistic costs; - fees paid to corporate bodies and the related charges, travel, board and lodging expenses as well as
remuneration of the stock option plans; - business consultancy, EDP consultancy to develop software and assistance with IT systems and
payments to other consultants and free-lance personnel (for auditing services, real estate, tax, legal and various other consultancy services);
- postal, telephone and telecommunications costs; - depreciation of tangible fixed assets, goodwill write-downs, amortisation of intangible fixed assets (assets
relating to logistic equipment and plants allocated by function to sales costs excluded) and also provisions for risks and write-downs;
%
Var.
Sales 2,291,141 100.00% 2,002,964 100.00% 288,177 14%
Sales and marketing costs 38,381 1.68% 29,994 1.50% 8,387 28%
Overheads and administrative costs 62,369 2.72% 57,393 2.87% 4,976 9%
Operating costs 100,750 4.40% 87,387 4.36% 13,363 15%
- of w hich non recurring 918 0.04% 98 0.00% 820 837%
'Recurring' operating costs 99,832 4.36% 87,289 4.36% 12,543 14%
(euro/000) % % Var.20142013
restated
%
Var.
Sales 2,291,141 2,002,964 288,177 14%
Sales & marketing personnel costs 30,982 1.35% 25,844 1.29% 5,138 20%
Other sales & marketing costs 7,399 0.32% 4,150 0.21% 3,249 78%
Sales & marketing costs 38,381 1.68% 29,994 1.50% 8,387 28%
Administr., IT, HR and general service personnel costs 20,833 0.91% 19,691 0.98% 1,142 6%
Directors' compensation 4,482 0.20% 4,010 0.20% 472 12%
Consulting services 4,008 0.17% 4,271 0.21% (263) -6%
Logistics services 13,403 0.58% 12,231 0.61% 1,172 10%
Amortisation, depreciation and provisions 4,211 0.18% 3,764 0.19% 447 12%
Other overheads and administrative costs 15,432 0.67% 13,426 0.67% 2,006 15%
Overheads and administrative costs 62,369 2.72% 57,393 2.87% 4,976 9%
Totale SG&A 100,750 4.40% 87,387 4.36% 13,363 15%
Var.(euro/000) % %20142013
restated
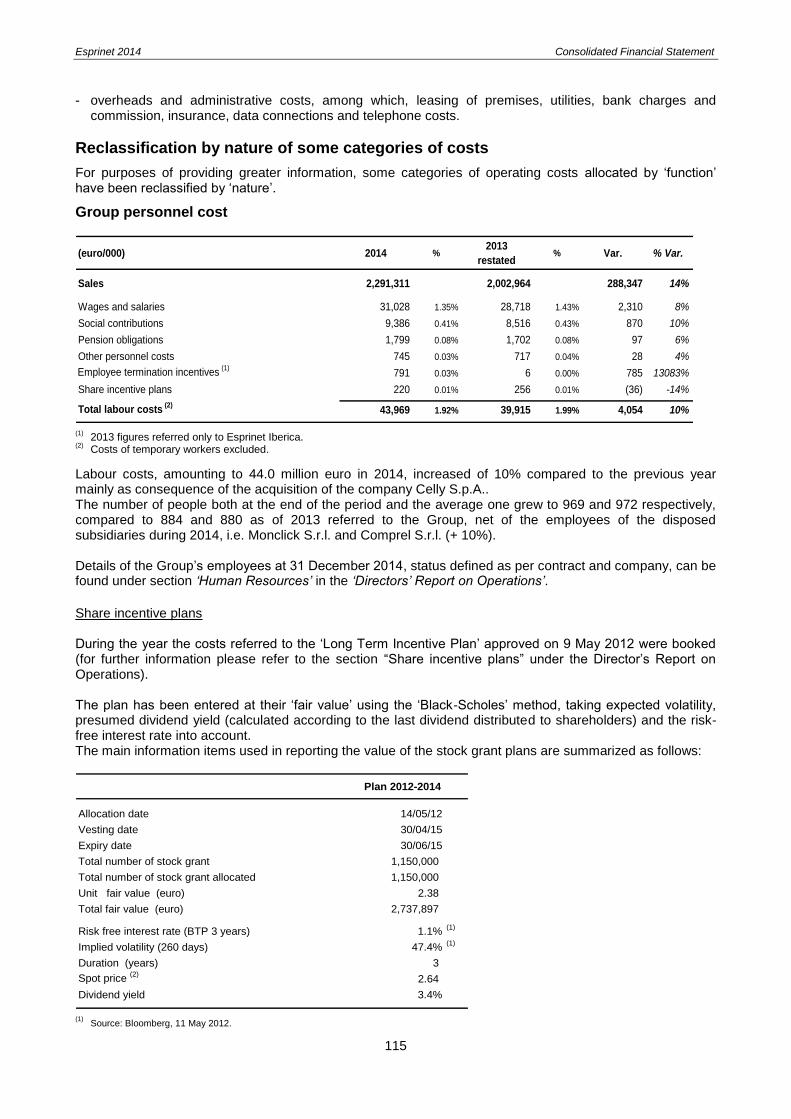
Esprinet 2014 Consolidated Financial Statement
115
- overheads and administrative costs, among which, leasing of premises, utilities, bank charges and commission, insurance, data connections and telephone costs.
Reclassification by nature of some categories of costs
For purposes of providing greater information, some categories of operating costs allocated by ‘function’ have been reclassified by ‘nature’.
Group personnel cost
(euro/000) 2014 %2013
restated% Var. % Var.
Sales 2,291,311 2,002,964 288,347 14%
Wages and salaries 31,028 1.35% 28,718 1.43% 2,310 8%
Social contributions 9,386 0.41% 8,516 0.43% 870 10%
Pension obligations 1,799 0.08% 1,702 0.08% 97 6%
Other personnel costs 745 0.03% 717 0.04% 28 4%
Employee termination incentives (1)
791 0.03% 6 0.00% 785 13083%
Share incentive plans 220 0.01% 256 0.01% (36) -14%
Total labour costs (2)
43,969 1.92% 39,915 1.99% 4,054 10%
(1) 2013 figures referred only to Esprinet Iberica.
(2) Costs of temporary workers excluded.
Labour costs, amounting to 44.0 million euro in 2014, increased of 10% compared to the previous year mainly as consequence of the acquisition of the company Celly S.p.A.. The number of people both at the end of the period and the average one grew to 969 and 972 respectively, compared to 884 and 880 as of 2013 referred to the Group, net of the employees of the disposed subsidiaries during 2014, i.e. Monclick S.r.l. and Comprel S.r.l. (+ 10%). Details of the Group’s employees at 31 December 2014, status defined as per contract and company, can be found under section ‘Human Resources’ in the ‘Directors’ Report on Operations’.
Share incentive plans During the year the costs referred to the ‘Long Term Incentive Plan’ approved on 9 May 2012 were booked (for further information please refer to the section “Share incentive plans” under the Director’s Report on Operations). The plan has been entered at their ‘fair value’ using the ‘Black-Scholes’ method, taking expected volatility, presumed dividend yield (calculated according to the last dividend distributed to shareholders) and the risk-free interest rate into account. The main information items used in reporting the value of the stock grant plans are summarized as follows:
Plan 2012-2014
Allocation date 14/05/12
Vesting date 30/04/15
Expiry date 30/06/15
Total number of stock grant 1,150,000
Total number of stock grant allocated 1,150,000
Unit fair value (euro) 2.38
Total fair value (euro) 2,737,897
Risk free interest rate (BTP 3 years) 1.1%(1)
Implied volatility (260 days) 47.4%(1)
Duration (years) 3
Spot price (2)
2.64
Dividend yield 3.4%
(1) Source: Bloomberg, 11 May 2012.
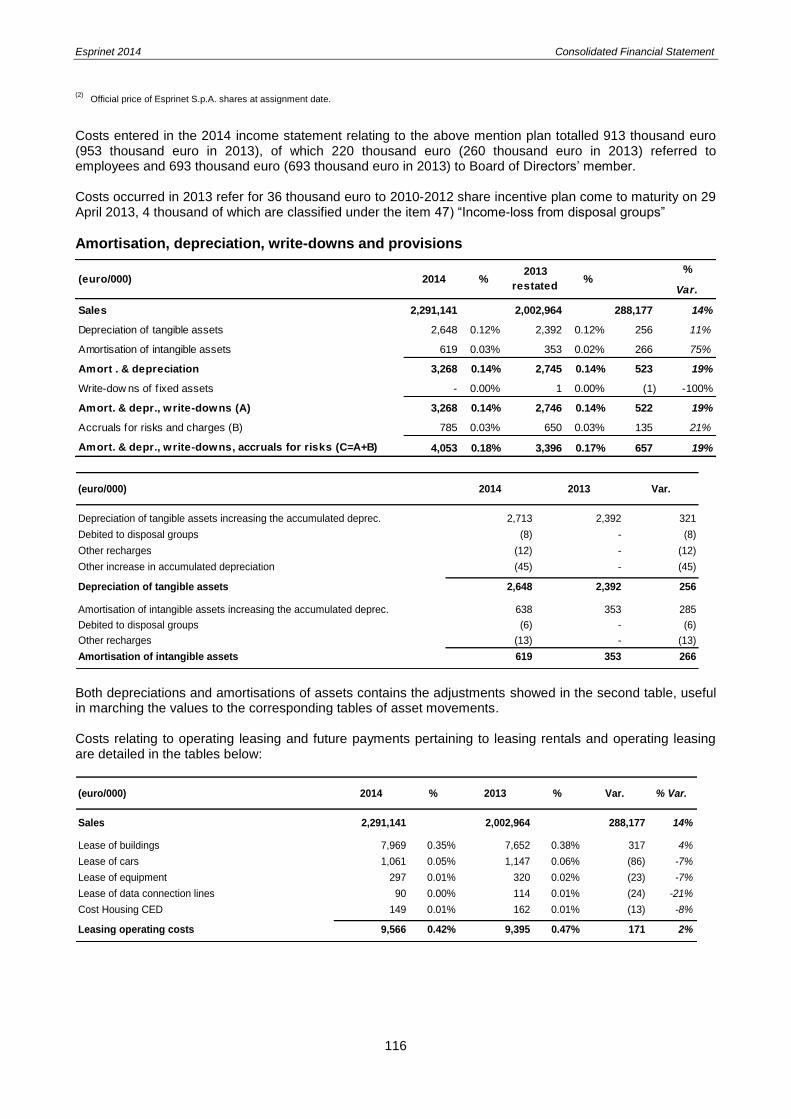
Esprinet 2014 Consolidated Financial Statement
116
(2) Official price of Esprinet S.p.A. shares at assignment date.
Costs entered in the 2014 income statement relating to the above mention plan totalled 913 thousand euro (953 thousand euro in 2013), of which 220 thousand euro (260 thousand euro in 2013) referred to employees and 693 thousand euro (693 thousand euro in 2013) to Board of Directors’ member. Costs occurred in 2013 refer for 36 thousand euro to 2010-2012 share incentive plan come to maturity on 29 April 2013, 4 thousand of which are classified under the item 47) “Income-loss from disposal groups”
Amortisation, depreciation, write-downs and provisions
(euro/000) 2014 2013 Var.
Depreciation of tangible assets increasing the accumulated deprec. 2,713 2,392 321
Debited to disposal groups (8) - (8)
Other recharges (12) - (12)
Other increase in accumulated depreciation (45) - (45)
Depreciation of tangible assets 2,648 2,392 256
Amortisation of intangible assets increasing the accumulated deprec. 638 353 285
Debited to disposal groups (6) - (6)
Other recharges (13) - (13)
Amortisation of intangible assets 619 353 266
Both depreciations and amortisations of assets contains the adjustments showed in the second table, useful in marching the values to the corresponding tables of asset movements. Costs relating to operating leasing and future payments pertaining to leasing rentals and operating leasing are detailed in the tables below:
(euro/000) 2014 % 2013 % Var. % Var.
Sales 2,291,141 2,002,964 288,177 14%
Lease of buildings 7,969 0.35% 7,652 0.38% 317 4%
Lease of cars 1,061 0.05% 1,147 0.06% (86) -7%
Lease of equipment 297 0.01% 320 0.02% (23) -7%
Lease of data connection lines 90 0.00% 114 0.01% (24) -21%
Cost Housing CED 149 0.01% 162 0.01% (13) -8%
Leasing operating costs 9,566 0.42% 9,395 0.47% 171 2%
%
Var.
Sales 2,291,141 ##### 2,002,964 ##### 288,177 14%
Depreciation of tangible assets 2,648 0.12% 2,392 0.12% 256 11%
Amortisation of intangible assets 619 0.03% 353 0.02% 266 75%
Amort . & depreciation 3,268 0.14% 2,745 0.14% 523 19%
Write-dow ns of f ixed assets - 0.00% 1 0.00% (1) -100%
Amort. & depr., write-downs (A) 3,268 0.14% 2,746 0.14% 522 19%
Accruals for risks and charges (B) 785 0.03% 650 0.03% 135 21%
Amort. & depr., write-downs, accruals for risks (C=A+B) 4,053 0.18% 3,396 0.17% 657 19%
(euro/000) % %20142013
restated

Esprinet 2014 Consolidated Financial Statement
117
(euro/000) 2015 2016 2017 2018 2019 Over Total
Lease of buildings 8,024 8,171 7,758 7,750 7,445 15,263 54,412
Lease of cars 1,001 740 525 291 186 - 2,744
Lease of equipment 329 325 288 288 286 270 1,786
Lease of data connection lines 90 90 67 - - - 247
Cost Housing CED 148 148 111 - - - 407
Leasing operating costs 9,592 9,474 8,750 8,329 7,917 15,533 59,595
42) Finance costs – net
The negative balance of 2.0 million euro between financial income and charges shows a slight worsening (-0.1 million euro) compared to the same period of previous year. This is mainly due to the increase in net foreign exchange losses, equal to 1.3 million euro, essentially due to the impact of US dollar strengthening vs euro with reference to the goods purchased in US dollar. Excluding the effects of foreign exchange losses, net finance costs show a negative balance of only 0.6 million euro, with a strengthening of 1.3 million euro compared to last year (-67%) This result is due to the 0.9 million euro decrease of net bank interest (-54%) as a consequence of the combined effect of: - a general improvement in the average financial indebtedness position of the Group; - a general decrease in spreads paid compared to the financial market parameters, which were on average
aligned to 2013 levels (with an increasing trend in the first half and a significant decrease in the second half).
The aforesaid increase is also strengthened by the positive effect of ineffective portions of derivatives whose equity reserve was reversed in the profit and loss as a consequence of their respective contracts coming to maturity during the year.
%
Var.
Sales 2,291,141 100.00% 2,002,964 100.00% 288,177 14%
Interest expenses on borrow ings 953 0.04% 1,155 0.06% (202) -18%
Interest expenses to banks 586 0.03% 762 0.04% (176) -23%
Other interest expenses 9 0.00% 69 0.00% (60) -87%
Upfront fees amortisation 209 0.01% 152 0.01% 57 38%
Interest on shareholdings acquired 34 0.00% - 0.00% 34 0%
IAS 19 expenses/losses 113 0.00% 108 0.01% 5 5%
Derivatives ineffectiveness - 0.00% - 0.00% - 0%
Total financial expenses (A) 1,904 0.08% 2,246 0.11% (342) -15%
Interest income from banks (799) -0.03% (321) -0.02% (478) 149%
Interest income from others (176) -0.01% (35) 0.00% (141) 397%
Derivatives ineffectiveness (310) -0.01% (7) 0.00% (303) 4253%
Total financial income(B) (1,285) -0.06% (363) -0.02% (922) 253%
Net financial exp. (C=A+B) 619 0.03% 1,883 0.09% (1,264) -67%
Foreign exchange gains (269) -0.01% (474) -0.02% 205 -43%
Foreign exchange losses 1,637 0.07% 493 0.02% 1,144 232%
Net foreign exch. (profit)/losses (D) 1,368 0.06% 19 0.00% 1,349 7082%
Net financial (income)/costs (E=C+D) 1,987 0.09% 1,902 0.09% 85 4%
(euro/000) % % Var.20142013
restated

Esprinet 2014 Consolidated Financial Statement
118
45) Income tax expenses
The following table illustrates the reconciliation between the theoretical and the effective tax rate:
GroupSubgroup
Italy
Subgroup
SpainGroup
Subgroup
Italy
Subgroup
Spain
Profit before taxes [A] 39,100 45,797 7,112 32,370 27,581 4,805
Operating profit (EBIT) 41,086 33,164 7,998 34,278 27,761 6,534
(+) personnel costs (1)
19,827 19,827 - 18,216 18,216 -
(+) bad debt provision 881 881 - 622 622 -
(+) provision for risks and charges 542 542 - 613 613 -
Taxable amout for IRAP [B] 62,336 54,414 - 53,729 47,212 -
Theoretical taxation IRES Subgroup Italy [A*27,5%] 8,797 12,594 - 7,585 7,585 -
Theoretical taxation IRAP Subgroup Italy [B*3,9%] 2,122 2,122 - 1,841 1,841 -
Theoretical tax. on Subgroup Spain's income [A*30,0%] 2,134 - 2,134 1,442 - 1,442
Total theoretical taxation [C] 13,052 14,716 2,134 10,868 9,426 1,442
Theoretical tax rate [C/A] 33.4% 32.1% 30.0% 33.6% 34.2% 30.0%
(-) tax relief - ACE (Aiuto alla Crescita Economica) (571) (571) - (312) (312) -
(-) recovery taxes previous years - - - 409 (92) 501
(+) non-deductible taxes 7 - 7 - - -
(-) change in tax rate 686 - 686 - - -
(-) reversal of the investment value in the Iberica subsidiary - (3,777) - - - -
Other permanent differences 239 242 - (170) (185) 20
Total effective taxation [D] 13,413 10,610 2,827 10,795 8,837 1,963
Effective tax rate [D/A] 34.3% 23.2% 39.7% 33.3% 32.0% 40.8%
31/12/2014 31/12/2013 restated
(euro/000)
(1) Staff costs are net of the effect of the ‘tax wedge’ and IRAP (Regional tax on productive activities) deductible costs.
46) Net income and earnings per share
%
Var.
Sales 2,291,141 ###### 2,002,964 ###### 288,177 14%
Current income taxes 12,092 0.53% 10,561 0.53% 1,531 14%
Deferred income taxes 1,321 0.06% 234 0.01% 1,087 465%
Taxes 13,413 0.59% 10,795 0.54% 290,795 24%
(euro/000) % % Var.20142013
restated
%
Var.
Profit from continuing operations 25,687 21,575 4,112 19%
Net income 26,813 23,095
Weighed average no. of shares in circulation: basic 51,222,940 51,166,276
Weighed average no. of shares in circulation: diluted 52,330,411 52,046,772
Earnings continuing operation per share - basic 0.51 0.42 0.09 21%
Earnings per share in euro: basic 0.53 0.45 0.08 18%
Earnings continuing operation per share - diluted 0.50 0.41 0.09 22%
Earnings per share in euro: diluted 0.52 0.44 0.08 18%
Var.(euro/000) 2014 2013 restated
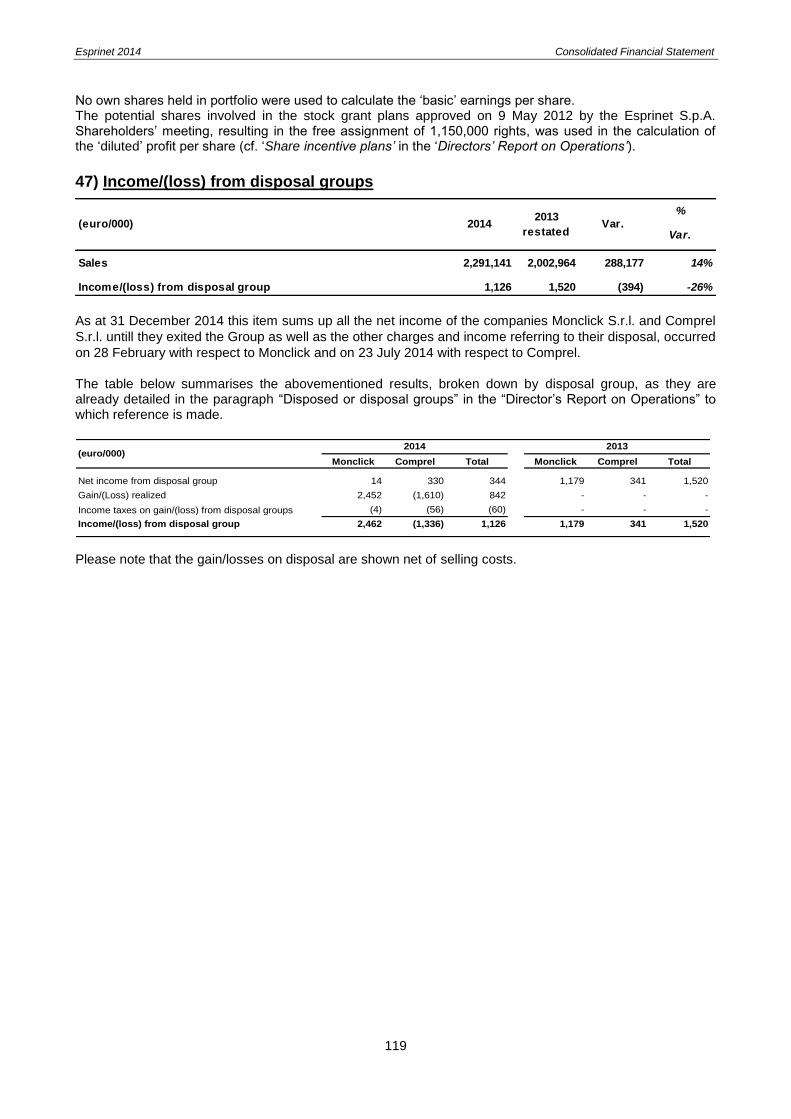
Esprinet 2014 Consolidated Financial Statement
119
No own shares held in portfolio were used to calculate the ‘basic’ earnings per share. The potential shares involved in the stock grant plans approved on 9 May 2012 by the Esprinet S.p.A. Shareholders’ meeting, resulting in the free assignment of 1,150,000 rights, was used in the calculation of the ‘diluted’ profit per share (cf. ‘Share incentive plans’ in the ‘Directors’ Report on Operations’).
47) Income/(loss) from disposal groups
As at 31 December 2014 this item sums up all the net income of the companies Monclick S.r.l. and Comprel
S.r.l. untill they exited the Group as well as the other charges and income referring to their disposal, occurred
on 28 February with respect to Monclick and on 23 July 2014 with respect to Comprel.
The table below summarises the abovementioned results, broken down by disposal group, as they are already detailed in the paragraph “Disposed or disposal groups” in the “Director’s Report on Operations” to which reference is made.
Monclick Comprel Total Monclick Comprel Total
Net income from disposal group 14 330 344 1,179 341 1,520
Gain/(Loss) realized 2,452 (1,610) 842 - - -
Income taxes on gain/(loss) from disposal groups (4) (56) (60) - - -
Income/(loss) from disposal group 2,462 (1,336) 1,126 1,179 341 1,520
2014 2013(euro/000)
Please note that the gain/losses on disposal are shown net of selling costs.
%
Var.
Sales 2,291,141 2,002,964 288,177 14%
Income/(loss) from disposal group 1,126 1,520 (394) -26%
2013
restatedVar.(euro/000) 2014

Esprinet 2014 Consolidated Financial Statement
120
8. Other significant information
8.1 Emoluments paid to the board members, statutory auditors and key managers
(euro/000) Office Term of officeEmoluments of
office (1)
Bonuses and
other benefits (2)
Non monetary
benefits (4)
Other emoluments (5) Total
Board of Directors
Francesco Monti Chairman 2012/14 400 200 3 603
Maurizio Rota Deputy Chairman and CEO 2012/14 400 200 4 604
Alessandro Cattani C.E.O. 2012/14 400 200 4 604
Giuseppe Calì Director 2012/14 28 28
Stefania Calì Director 2012/14 28 28
Valerio Casari Director 2012/14 286 150 4 440
Andrea Cavaliere Director (3)
2012/14 28 45 73
Mario Massari Director (3)
2012/14 28 45 73
Cristina Galbusera Director (3)
2012/14 28 22 50
Marco Monti Director 2012/14 28 28
Umberto Giovanni Quilici Director (3)
2012/14 28 28
Chiara Mauri Director (3)
2012/14 28 22 50
1,710 750 15 134 2,609
Board of Statutory Auditors
Giorgio Razzoli Chairman 2012/14 80 80
Emanuele Calcaterra Standing Statutory Auditor 2012/14 57 57
Mario Conti Standing Statutory Auditor 2012/14 61 61
198 - - - 198
Other key management personnel 257 58 4 - 319
(I) Payments in company preparing financial statements 2,165 808 19 134 3,126
Board of Statutory Auditors
Emanuele Calcaterra Standing Statutory Auditor 2012/14 21 21
Mario Conti Standing Statutory Auditor 2012/14 17 17
38 - - - 38
Other key management personnel 100 - - 121 221
(II) Payments from subsidiaries and affiliates 138 - - 121 259
(III) Total 2,303 808 19 255 3,385
(1)
Solely in the case of the director Casari (CFO), the item also includes Remuneration from subordinate employment. (2)
Includes the share of the monetary component accrued in the exercise for the ‘Long Term Incentive Plan’, the payment of which are linked to the
economic and financial results achievements. (3)
Independent Director. (4)
Company car fringe benefit. (5)
Solely in the case of directors, this item includes payments for membership of Committees.
In the above reported table, we provide information regarding the emoluments of directors, statutory auditors of Esprinet S.p.A. and ‘Key Managers’, payable to them in respect of the positions held by them in the latter company and in other Group companies during the year. As defined by accounting principle IAS 24 and quoted by Consob Resolution No. 17221 of 12 March 2010, ‘key managers are those persons having authority and responsibility for planning, directing and controlling the activities of the entity preparing the financial statements, including any director (whether executive or otherwise) of that entity’. Besides directors and statutory auditors, the definition of ’key managers’ includes the Country Manager Italy, the Country Manager Spain and to the Group CFO (this last also covering the role of executive director). The aforementioned compensation includes all the emolument items, benefits in kind and compensation received by Group company directors. The table below illustrates the Incentive Plan based on financial instruments other than Stock options, to members of the Board of Directors and other key managers.

Esprinet 2014 Consolidated Financial Statement
121
Options
held in
2014
Options
assigned
(taken up) in
2014
QuantityAverage
strike price Quantity Quantity Quantity
Average
strike price
Average
due date
Maurizio Rota 308,036 Free - - 308,036 Free
Alessandro Cattani 308,036 Free - - 308,036 Free
Valerio Casari (1)
256,695 Free - - 256,695 Free
Other key management personnel 92,411 Free - - 92,411 Free
Options held at
31 December 2014Beneficiaries
Options held at 1 January
2014
from
14/05/2012 to
30/04/2015
(1)
Director.
The table below illustrates the long term Monetary Incentive Plans for members of the Board and other key management personnel (in thousands of euro):
D ue fo r
payment/
P aid
D eferred P erio d
N o lo nger
eligible fo r
payment
P ayable/
P aid
Still
deferred
Maurizio Rota 55 three-year 93
Alessandro Cattani 55 three-year 93
Valerio Casari (1) 46 three-year 77
Other key management personnel 17 three-year 28
Total - 173 - - 291
B eneficiaries
B o nus fo r the year B o nus fro m previo us year
(1) Director.
8.2 Relationships with related parties
Next tables summarise balances of the statement of financial position and of the separate income statement deriving from operations with related parties (as defined by IAS 24) except for relationships with members of the key management personnel because shown in the previous paragraph. Operations between the Esprinet S.p.A. parent company and the subsidiaries included in the consolidation area have been eliminated from the consolidated financial statements and therefore do not figure in this section.
Relationships with ‘other related parties’
Sales regard consumer electronics products sold at normal market conditions, mainly to key managers and close members of their family. Services mainly refer to leasing agreements entered into at market conditions in periods prior to 2014 with the real estate companies, Immobiliare Selene S.r.l. in the case of the Cambiago (MI) logistics site and M.B. Immobiliare S.r.l. in the case of the Cavenago (MB) logistics site, respectively.
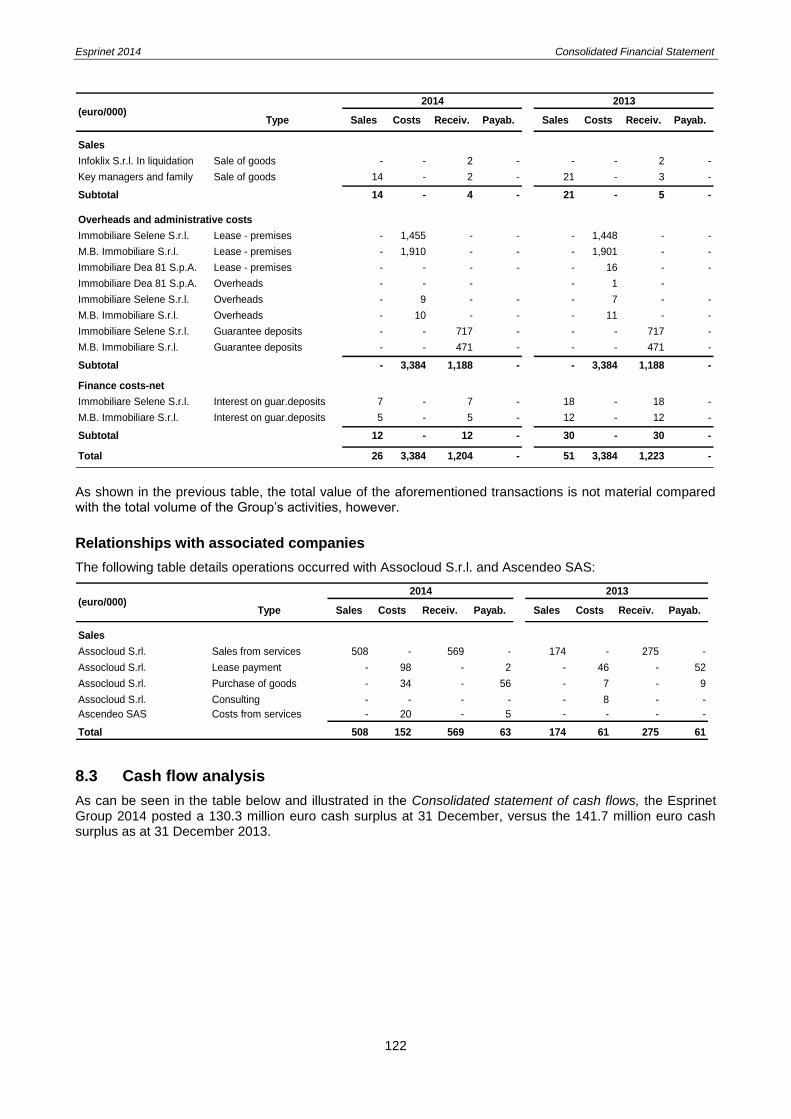
Esprinet 2014 Consolidated Financial Statement
122
2014 2013
Type Sales Costs Receiv. Payab. Sales Costs Receiv. Payab.
Sales
Infoklix S.r.l. In liquidation Sale of goods - - 2 - - - 2 -
Key managers and family Sale of goods 14 - 2 - 21 - 3 -
Subtotal 14 - 4 - 21 - 5 -
Overheads and administrative costs
Immobiliare Selene S.r.l. Lease - premises - 1,455 - - - 1,448 - -
M.B. Immobiliare S.r.l. Lease - premises - 1,910 - - - 1,901 - -
Immobiliare Dea 81 S.p.A. Lease - premises - - - - - 16 - -
Immobiliare Dea 81 S.p.A. Overheads - - - - 1 -
Immobiliare Selene S.r.l. Overheads - 9 - - - 7 - -
M.B. Immobiliare S.r.l. Overheads - 10 - - - 11 - -
Immobiliare Selene S.r.l. Guarantee deposits - - 717 - - - 717 -
M.B. Immobiliare S.r.l. Guarantee deposits - - 471 - - - 471 -
Subtotal - 3,384 1,188 - - 3,384 1,188 -
Finance costs-net
Immobiliare Selene S.r.l. Interest on guar.deposits 7 - 7 - 18 - 18 -
M.B. Immobiliare S.r.l. Interest on guar.deposits 5 - 5 - 12 - 12 -
Subtotal 12 - 12 - 30 - 30 -
Total 26 3,384 1,204 - 51 3,384 1,223 -
(euro/000)
As shown in the previous table, the total value of the aforementioned transactions is not material compared with the total volume of the Group’s activities, however.
Relationships with associated companies
The following table details operations occurred with Assocloud S.r.l. and Ascendeo SAS:
2014 2013
Type Sales Costs Receiv. Payab. Sales Costs Receiv. Payab.
Sales
Assocloud S.rl. Sales from services 508 - 569 - 174 - 275 -
Assocloud S.rl. Lease payment - 98 - 2 - 46 - 52
Assocloud S.rl. Purchase of goods - 34 - 56 - 7 - 9
Assocloud S.rl. Consulting - - - - - 8 - -
Ascendeo SAS Costs from services - 20 - 5 - - - -
Total 508 152 569 63 174 61 275 61
(euro/000)
8.3 Cash flow analysis
As can be seen in the table below and illustrated in the Consolidated statement of cash flows, the Esprinet Group 2014 posted a 130.3 million euro cash surplus at 31 December, versus the 141.7 million euro cash surplus as at 31 December 2013.
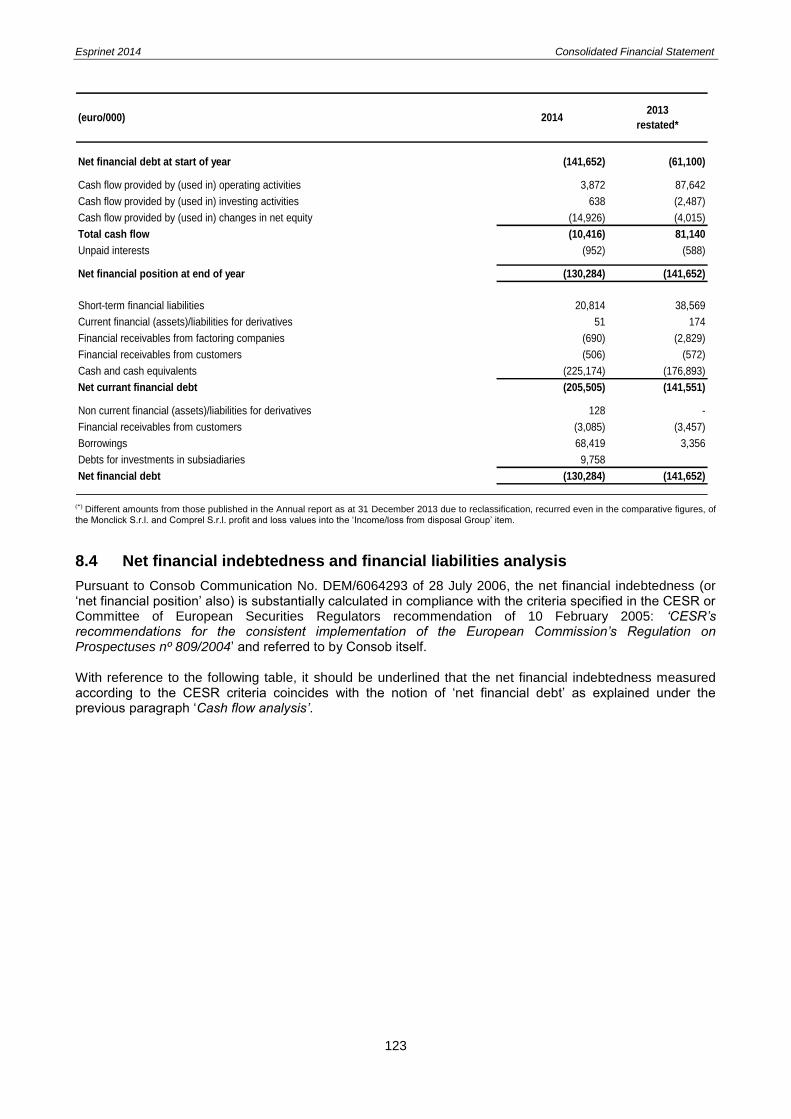
Esprinet 2014 Consolidated Financial Statement
123
(euro/000) 20142013
restated*
Net financial debt at start of year (141,652) (61,100)
Cash flow provided by (used in) operating activities 3,872 87,642
Cash flow provided by (used in) investing activities 638 (2,487)
Cash flow provided by (used in) changes in net equity (14,926) (4,015)
Total cash flow (10,416) 81,140
Unpaid interests (952) (588)
Net financial position at end of year (130,284) (141,652)
Short-term financial liabilities 20,814 38,569
Current financial (assets)/liabilities for derivatives 51 174
Financial receivables from factoring companies (690) (2,829)
Financial receivables from customers (506) (572)
Cash and cash equivalents (225,174) (176,893)
Net currant financial debt (205,505) (141,551)
Non current financial (assets)/liabilities for derivatives 128 -
Financial receivables from customers (3,085) (3,457)
Borrowings 68,419 3,356
Debts for investments in subsiadiaries 9,758
Net financial debt (130,284) (141,652)
(*) Different amounts from those published in the Annual report as at 31 December 2013 due to reclassification, recurred even in the comparative figures, of the Monclick S.r.l. and Comprel S.r.l. profit and loss values into the ‘Income/loss from disposal Group’ item.
8.4 Net financial indebtedness and financial liabilities analysis
Pursuant to Consob Communication No. DEM/6064293 of 28 July 2006, the net financial indebtedness (or ‘net financial position’ also) is substantially calculated in compliance with the criteria specified in the CESR or Committee of European Securities Regulators recommendation of 10 February 2005: ‘CESR’s recommendations for the consistent implementation of the European Commission’s Regulation on Prospectuses nº 809/2004’ and referred to by Consob itself. With reference to the following table, it should be underlined that the net financial indebtedness measured according to the CESR criteria coincides with the notion of ‘net financial debt’ as explained under the previous paragraph ‘Cash flow analysis’.

Esprinet 2014 Consolidated Financial Statement
124
The Group’s net financial debt, showing a surplus of 130.3 million euro, results from the balance between gross financial debt of 99.0 million euro, financial liabilities for derivatives of 0.2 million euro, financial receivables from factoring companies of 0.7 million euro, financial receivables from customers of 3.6 million euro and cash and cash equivalents of 225.2 million euro. Cash and cash equivalents, mainly made up of bank deposits, are not tied-up. These funds are of a partially transitory nature, accumulating at the end of the month, due to the Group’s peculiar kind of payment/encashment cycle. This cycle is characterised by the concentration of payments received from customers and from factoring companies – the latter as consequence of the ‘without-recourse’ sale of trade account receivables - at the end and middle of each month, while the maturities of payments to suppliers are distributed more evenly over the month. For this reason, the figure resulting at 31 December 2014, or at the end of each month, is not totally representative of the average net financial indebtedness or the average level of cash on hand customarily observable during the same period. The without-recourse sale of account receivables revolving programme focussing on the large-scale distribution sector in particular, continued during 2014 both in Italy and in Spain as part of the processes aimed at the structural optimisation of the management of working capital. The aforementioned programmes completely transfer the risks and benefits to the assignees so that receivables in question are removed from assets as per IAS 39.
A. Bank deposits and cash on hand 225,174 176,893
B. Cheques - -
C. Trading securities - -
D. Liquidity (A+B+C) 225,174 176,893
Financial assets for derivatives - -
Customer financial receivables 506 572
Financial receivables from factoring companies 690 2,829
E. Current f inancial receivables 1,196 3,401
F. Current bank debt 8,387 8,608
G. Current portion of non current debt 1,321 12,084
H. Other current f inancial debt and financial liability for derivatives 11,157 18,051
I. Current f inancial debt (F+G+H) 20,865 38,743
J. Net current financial indebtedness (I-E-D) (205,504) (141,551)
K. Non-current bank loans 68,419 3,356
L. Customers f inancial receivables (3,085) (3,457)
M. Other f inancial debt & non-current f inancial liabilities for derivatives 9,886 -
N. Non-current financial indebtedness (K+L+M) 75,220 (101)
O. Net financial indebtedness (J+N) (130,284) (141,652)
Breakdown of net financial indebtedness:
Short-term financial liabilities 20,814 38,569
Current f inancial (assets)/liabilities for derivatives 51 174
Customers f inancial receivables (506) (572)
Financial receivables from factoring companies (690) (2,829)
Cash and cash equivalents (225,174) (176,893)
Net current financial debt (205,505) (141,551)
Non-current f inancial (assets)/liabilities for derivatives 128 -
Customers f inancial receivables (3,085) (3,457)
Debts for investments in subsidiaries 9,758 -
Borrow ings 68,419 3,356
Net financial debt (130,284) (141,652)
(euro/000) 31/12/2014 31/12/2013

Esprinet 2014 Consolidated Financial Statement
125
The overall effect on the levels of financial debt as at 31 December 2014 can be quantified as approx. 193 million euro (approx. 154 million euro as at 31 December 2013). Details of the current portion of medium-/long-term financial debt and the portion falling due beyond the following year, regarding ‘Subgroup Italy’ and ‘Subgroup Spain’, are illustrated below. It has to be noted that amounts can differ from the book value of loan principal since they represent the amortised cost calculated on the basis of the real interest rate.
(euro/000) 31/12/14 31/12/13 Var.
Curr. Non-curr. Tot. Curr. Non-curr. Tot. Curr. Non-curr. Tot.
Pool loan (ag. Intesa Sanpaolo) - - - 4,964 - 4,964 (4,964) - (4,964)
Pool loan (ag. Banca IMI) - 64,550 64,550 - - - - 64,550 64,550
Intesa Sanpaolo (GdF loan) 350 3,006 3,356 - 3,356 3,356 350 (350) -
Credem 778 56 834 - - - 778 56 834
Unicredit 193 807 1,000 - - - 193 807 1,000
Total Subgroup Italy 1,321 68,419 69,740 4,964 3,356 8,320 (3,643) 65,063 61,420
Pool loan (ag. Intesa Sanpaolo) - - - 7,120 - 7,120 (7,120) - (7,120)
Total Subgroup Spain - - - 7,120 - 7,120 (7,120) - (7,120)
Total Group 1,321 68,419 69,740 12,084 3,356 15,440 (10,763) 65,063 54,300
8.5 Loans and loan covenants
The book value of loan principal of the loans granted to the Group is as follows:
(euro/000) 31/12/14 31/12/13 Var.
- 5,000 (5,000)
- 7,140 (7,140)
3,457 3,961 (504)
65,000 - 65,000
833 - 833
1,000 - 1,000
Total book value of loan principal 70,290 16,101 54,189
Unsecured pool loan (agent: Intesa Sanpaolo) to Esprinet S.p.A.
repayable in 1 six-monthly instalments by June 2014
Unsecured pool loan (agent: Intesa Sanpaolo) to Esprinet Iberica S.L.U.
repayable in 1 six-monthly instalments by June 2014
Unsecured pool loan to Esprinet S.p.A.
repayable in 1 six-monthly instalments by July 2019
Unsecured pool loan (agent: Unicredit) to Celly S.p.A.
repayable in monthly instalments by June 2019
Pool loan 'GdF' (agent: Intesa Sanpaolo) to Esprinet S.p.A.
repayable in 9 yearly instalments by January 2022
Unsecured pool loan (agent: Credem) to Celly S.p.A.
repayable in quarterly instalments by January 2016
The weighted average rate used during 2014 on the above loans was approx. 2.8% (approx. 4.0% in the previous year). The loan agreement with a book value of loan principal amounting to 65.0 million euro is a Term Loan Facility entered by Esprinet S.p.A. with a pool of banks, received in August 2014 and expiring within July 2019. Such loan is subject to the observance of covenants, the failure to observe of which allow the issuing institutes to claim its immediate reimbursement. These covenants, which are subject to 6-monthly checks against the audited and consolidated financial statements, are as follows: i) ratio between ‘extended net financial indebtedness’ and EBITDA; ii) ratio between EBITDA and net financial charges; iii) amount of ‘extended net financial indebtedness’;

Esprinet 2014 Consolidated Financial Statement
126
where ‘extended net financial indebtedness’ is the net financial indebtedness as measured in the previous paragraph Net financial indebtedness and financial liabilities analysis gross of non-current customers financial receivables and of the impact of prepayments received from factoring companies within the ‘without recourse’ sale of account receivables programs or from other financial counterparts within account receivables securitisations. Apart the aforementioned Term Loan Facility, also a not yet used Revolving Facility, entered in the same date, with a maximum loan principal and a maturity equal to those agreed for the Term Loan Facility, is subject to the observance of the above said covenants. Main purpose of the Revolving Facility and of the Term Loan Facility is to support Group’s financial needs by maintaining an adequate degree of stability and flexibility of the financial structure. At 31 December 2014, according to management estimates, the covenants were fully observed. Loan contracts also contain the usual ‘negative pledge’, ‘pari passu’ and similar type clauses none of which, at the time this report was drafted, had been violated.
8.6 Lines of credit
Apart from the uses described in the previous paragraphs, the Esprinet Group had a total 918 million euro (873 million ready money) at its disposal in bank credit lines as at 31 December 2014, subdivided as follows:
(euro/000) GroupSubgroup
Italy
Subgroup
Spain
Credit unblocking / import financing / credit lines 232,790 180,190 52,600
Medium/long-term borrowings 67,983 67,983 -
Endorsement credit 44,958 44,958 -
Factoring (trasferor) (1)
492,050 376,050 116,000
Bank overdrafts 6,422 6,422 -
Credit cards 500 500 -
Derivatives / forward currency transactions 7,885 7,885
Line revolving 65,000 65,000
Total 917,588 748,988 168,600
(1) Includes both with-recourse and without-recourse maximums.
The financial situation as at 31 December 2014, excluding the maximums granted by the banks for a without-recourse factoring scheme with a revolving credit facility and endorsement loans, shows that a total 28% (14% in the previous year) of credit lines was used, as can be seen in the table below:
(euro/000) Uses % Uses gross Credit lines
Credit unblocking / import financing / credit lines 4% 10,224 232,790
Medium/long-term borrowings 97% 65,863 67,983
Factoring (trasferor) - with recourse 34% 10,736 31,300
Total Group 28% 86,823 308,282
Maintaining short-term credit lines with contained usage rates and high flexibility of usage is the main liquidity risk management method used by the Group.
8.7 Seasonal nature of business
The table below highlights the impact of sales per solar quarter in the years 2014 and 2013:

Esprinet 2014 Consolidated Financial Statement
127
The IT and electronic markets both in Italy and in Spain are traditionally characterised by seasonal sales which involve an increase in demand in the fourth quarter of the solar year essentially in terms of purchases concentrated in the pre-Christmas and in the so-called ‘back-to-school’ seasons to consumers and by the spending dynamics of budgets dedicated to IT investments which are statistically concentrated around the months of November and December. The seasonable nature of IT and electronics sales has an influence both on the business volumes of the distribution industry and on the sales volumes of the Esprinet Group. The winter trend provides a contrast to the drop in demand in the summer months, in August, in particular. As a result of the increasing reluctance to suspend work during the summer months, this last trend also appears to be re-dimensioning, in the business sector in particular. In addition to the above, operating results are also seasonal, but even more so than those of sales since the absolute profit margin levels track the seasonal nature of sales, while overheads tend to be more regular during the year. The seasonal nature of sales described above also has an influence on the part of the levels of borrowings that is closely linked to working capital needs, which peak in the last part of each solar year. The level of net borrowings fluctuates dramatically not only along the calendar year but also during each month, due for the most part to the concentration of payments received from customers at the end and middle of each month, while the maturities of payments to suppliers are distributed more evenly over the month. For this reason, the figure resulting at the end of the period, or at the end of each month, is not much representative of the average net financial indebtedness customarily observable during the same period. The circumstances described above give rise to higher financial and commercial risk levels for the Group compared with those whose business is subject to less seasonable fluctuations.
8.8 Non-recurring significant events and operations
In 2014 employee termination indemnities in the parent company (equal to 700 thousand euro), the tax expenses in Spain mainly arising from the reduction of deferred tax assets related to previous losses due to the future cut of Spanish theoretical tax rate (equal to 689 thousand euro), as well as estimated transaction costs on Celly’s acquisition (equal to 218 thousand euro) were identified as non-recurring items. The costs incurred as a result of the 2010/2011 tax auditing final report regarding the subsidiary Esprinet Iberica have been highlighted as non-recurring events throughout 2013. The above mentioned costs refer to fiscal consultancy and interest matured for delayed tax payments as well as additional taxes resulting from re-instated costs previously deducted but presently disallowed. The following table shows effects of the above said events and operations on the income statement (included the related fiscal effects):
Group Italy Spain Group Italy Spain
Sales Q1 22.4% 23.3% 19.9% 24.1% 24.5% 23.1%
Sales Q2 22.7% 23.5% 20.8% 23.9% 24.6% 21.6%
Sales H1 45.1% 46.7% 40.7% 47.9% 49.1% 44.7%
Sales Q3 21.9% 21.7% 22.8% 21.5% 21.3% 22.2%
Sales Q4 33.0% 31.6% 36.5% 30.5% 29.6% 33.1%
Sales H2 54.9% 53.3% 59.3% 52.1% 50.9% 55.3%
Sales for the year 100.0% 100.0% 100.0% 100.0% 100.0% 100.0%
2014 2013

Esprinet 2014 Consolidated Financial Statement
128
(euro/000) Charge type 2014 2013 Var.
Overheads and administrative costs Transaction costs on Celly's acquisition (218) - (218)
Overheads and administrative costs Employee termination incentives (700) - (700)
Overheads and administrative costs Defence charges - (98) 98
Total SG&A (918) (98) (918)
Operating income (EBIT) (918) (98) (918)
Finance costs - net Interests on delayed tax payments - (66) 66
Profit before income taxes (918) (164) (852)
Income tax expenses Recovery of previous years taxes - (495) 495
Income tax expenses Changes in Spanish tax rate on initial losses (689) - (689)
Income tax expenses Non-recurring events impact 261 67 194
Profit for the period (1,346) (592) (163)
Non - controlling interest - - -
Net income / (loss) (1,346) (592) (163)
8.9 Main disputes pending
Developments in existing legal and tax-related disputes can be found in a similar section under the comment to the statement of financial position item ‘Non-current provisions and other liabilities’ in the ‘Notes to the consolidated financial statements’. Similarly, the ‘Directors’ Report on Operations’ also contains the Group’s policies regarding the management of legal and tax-related disputes under ‘Main risks and uncertainties facing the Group and Esprinet S.p.A.’.
8.10 Operations relating to derivative instruments
Disclosures regarding operations relating to derivative instruments can be found under the chapter ‘Disclosures on risks and financial instruments’.
8.11 Compensation for Group auditing services
The following table drafted pursuant to Article 149-duodecies of the Consob Issuing Regulation, shows the emoluments posted during the 2014 financial year on the accrual basis of accounting for auditing services and others performed by the same auditing company and/or bodies belonging to its network:
Fees (euro/000)
2014 2013
Auditing services:
Examination of the annual accounts of one single company, accompanied
by professional opinion Reconta 231.0 235.8
Examination of the annual consolidated accounts of a group of companies
accompanied by professional opinion Reconta 12.8 13.4
Quarterly examination of accounts of one single company or
group of companies during the year Reconta 39.4 40.0
Subtotal 283.2 289.2
Certification services:
Certification other then auditing Reconta 35.0 13.8
Subtotal 35.0 13.8
Total 318.2 303.0
Provider
of serviceDescription
Esprinet 2014 Consolidated Financial Statement
129
9. Publication of the Draft Annual Report
The draft annual report and its publication were approved by the Esprinet Board of Directors during the meeting of 16 March 2015, which also authorised the Chairman to make any necessary or appropriate changes or additions to the structure of the document, in order to complete or improve it in any of its parts. Vimercate, 16 March 2015 For and on behalf of the Board of Directors The Chairman Francesco Monti

Esprinet 2014 Consolidated Financial Statement
130
Statement on the ‘Consolidated financial statements’ pursuant to Article 81-ter of Consob Regulation No. 11971 of 14 May 1999, as amended
1. In consideration of the provisions of Article 154-bis, subsections 3 and 4, of legislative decree No. 58 of 24 February 1998, the undersigned Alessandro Cattani, Chief Executive Officer of Esprinet S.p.A and Pietro Aglianò, executive charged with drawing up the Esprinet S.p.A. accounting documents, hereby declare that the administrative and accounting procedures used in drawing up the consolidated financial statements relating to the period between 1 January 2014 – 31 December 2014 were: - appropriate to the features of the Group - effectively applied. 2. The assessment of the adequacy of the administrative and accounting procedures used for the preparation of the consolidated financial statements at 31 December 2014 was effected in accordance with the Internal Control - Integrated Framework model issued by the Committee of Sponsoring Organizations of the Treadway Commission, an internally-accepted reference framework. No significant aspects emerged. 3. We further declare that: 3.1 the consolidated financial statements as at 31 December 2014: a) have been prepared in accordance with International Financial Reporting Standards, as endorsed by the European Union through Regulation (EC) of the European Parliament and Counsel, dated 19 July 2002 as implemented in Italy by Article 9 of Legislative Decree no. 38 of 2005; b) correspond to the amounts shown in the Companies’ accounts, books and records; and c) provide a fair and correct representation of the financial conditions, results of operations and cash flows of the Company and its consolidated subsidiaries as of 31 December 2014. 3.2 The Directors’ Report on Operations includes a reliable operating and financial review of the Company and of the Group as well as a description of the main risks to which they are exposed.
Vimercate, 16 March 2015
Chief Executive Officer Executive charged with of Esprinet S.p.A. drafting the Esprinet S.p.A.
accounting documents. (Alessandro Cattani) (Pietro Aglianò)
2014 Esprinet S.p.A. Financial Statements
131
Esprinet S.p.A.
Separate Financial Statements 2014
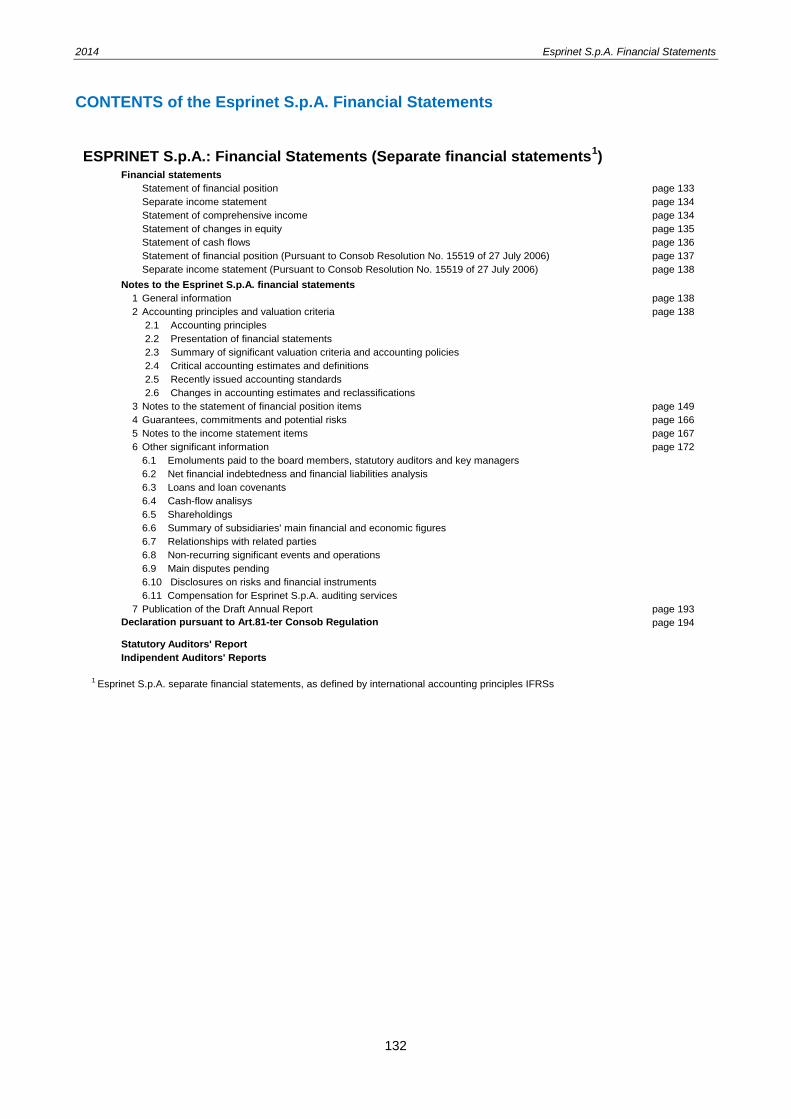
2014 Esprinet S.p.A. Financial Statements
132
CONTENTS of the Esprinet S.p.A. Financial Statements
ESPRINET S.p.A.: Financial Statements (Separate financial statements1)
Financial statements
Statement of financial position page 133
Separate income statement page 134
Statement of comprehensive income page 134
Statement of changes in equity page 135
Statement of cash flows page 136
Statement of financial position (Pursuant to Consob Resolution No. 15519 of 27 July 2006) page 137
Separate income statement (Pursuant to Consob Resolution No. 15519 of 27 July 2006) page 138
Notes to the Esprinet S.p.A. financial statements
1 General information page 138
2 Accounting principles and valuation criteria page 138
2.1 Accounting principles
2.2 Presentation of financial statements
2.3 Summary of significant valuation criteria and accounting policies
2.4 Critical accounting estimates and definitions
2.5 Recently issued accounting standards
2.6 Changes in accounting estimates and reclassifications
3 Notes to the statement of financial position items page 149
4 Guarantees, commitments and potential risks page 166
5 Notes to the income statement items page 167
6 Other significant information page 172
6.1 Emoluments paid to the board members, statutory auditors and key managers
6.2 Net financial indebtedness and financial liabilities analysis
6.3 Loans and loan covenants
6.4 Cash-flow analisys
6.5 Shareholdings
6.6 Summary of subsidiaries' main financial and economic figures
6.7 Relationships with related parties
6.8 Non-recurring significant events and operations
6.9 Main disputes pending
6.10 Disclosures on risks and financial instruments
6.11 Compensation for Esprinet S.p.A. auditing services
7 Publication of the Draft Annual Report page 193
Declaration pursuant to Art.81-ter Consob Regulation page 194
Statutory Auditors' Report
Indipendent Auditors' Reports
1 Esprinet S.p.A. separate financial statements, as defined by international accounting principles IFRSs

2014 Esprinet S.p.A. Financial Statements
133
Statement of financial position
The table below shows the Esprinet S.p.A. statement of financial position drawn up according to IFRS requirements
5:
5 Pursuant to Consob Resolution No. 15519 of 27 July 2006, the effects of relationships with related parties on the Esprinet S.p.A.
statement of financial position items can be found in the statement of financial position in the next pages and commented on in the ‘Notes to the Esprinet S.p.A. financial statements’.
ASSETS
Non-current assets
Property, plant and equipment 1 8,217,435 8,918,355
Goodw ill 2 10,625,555 10,625,555
Intangible assets 3 895,874 655,454
Investments in associates 5 17,818 6,000
Investments in others 83,601,657 66,159,225
Deferred income tax assets 6 2,957,044 2,645,429
Receivables and other non-current assets 9 4,418,653 4,789,590
110,734,036 93,799,608
Current assets
Inventory 10 188,012,731 160,976,448
Trade receivables 11 169,562,707 146,066,052
Income tax assets 12 1,311,693 1,721,134
Other assets 13 76,933,312 90,127,415
Cash and cash equivalents 17 177,048,866 115,018,452
612,869,309 513,909,501
Non-current assets held for sale -
Total assets 723,603,345 607,709,109
EQUITY
Share capital 19 7,860,651 7,860,651
Reserves 20 234,660,790 220,319,804
Net income for the period 21 39,596,642 18,470,383
282,118,083 246,650,838
Non-controlling interests
Total equity 282,118,083 246,650,838
LIABILITIES
Non-current liabilities
Borrow ings 22 67,555,675 3,355,661
Derivative f inancial liabilities 23 127,792 -
Deferred income tax liabilities 24 2,383,300 2,278,532
Retirement benefit obligations 25 3,965,002 3,958,743
Provisions and other liabilities 26 1,743,756 1,919,510
75,775,525 11,512,446
Current liabilities
Trade payables 27 337,101,288 311,100,536
Short-term financial liabilities 28 13,898,276 24,507,415
Income tax liabilities 29 1,082,253 276,250
Derivative f inancial liabilities 30 50,655 69,548
Provisions and other liabilities 32 13,577,265 13,592,076
365,709,737 349,545,825
Total liabilities 441,485,262 361,058,271
Total equity and liabilities 723,603,345 607,709,109
(euro) Note 31/12/2014 31/12/2013
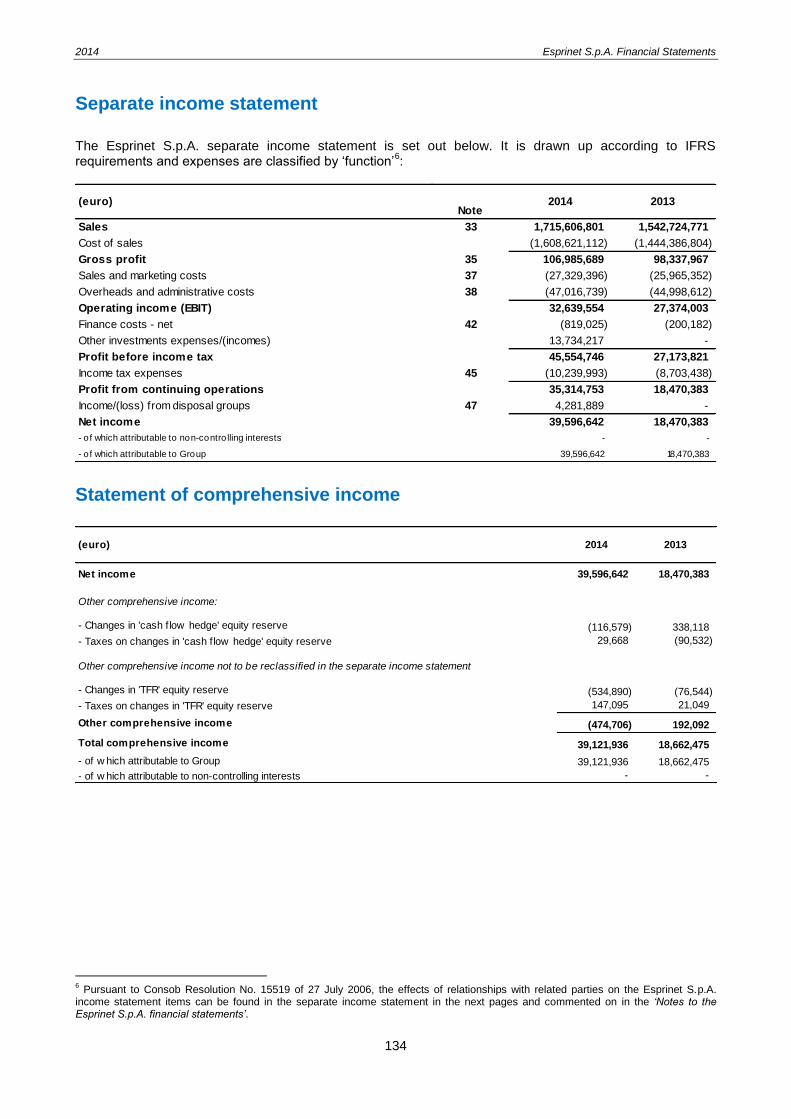
2014 Esprinet S.p.A. Financial Statements
134
Separate income statement
The Esprinet S.p.A. separate income statement is set out below. It is drawn up according to IFRS requirements and expenses are classified by ‘function’
6:
Statement of comprehensive income
6 Pursuant to Consob Resolution No. 15519 of 27 July 2006, the effects of relationships with related parties on the Esprinet S.p.A.
income statement items can be found in the separate income statement in the next pages and commented on in the ‘Notes to the Esprinet S.p.A. financial statements’.
Sales 33 1,715,606,801 1,542,724,771
Cost of sales (1,608,621,112) (1,444,386,804)
Gross profit 35 106,985,689 98,337,967
Sales and marketing costs 37 (27,329,396) (25,965,352)
Overheads and administrative costs 38 (47,016,739) (44,998,612)
Operating income (EBIT) 32,639,554 27,374,003
Finance costs - net 42 (819,025) (200,182)
Other investments expenses/(incomes) 13,734,217 -
Profit before income tax 45,554,746 27,173,821
Income tax expenses 45 (10,239,993) (8,703,438)
Profit from continuing operations 35,314,753 18,470,383
Income/(loss) from disposal groups 47 4,281,889 -
Net income 39,596,642 18,470,383
- o f which attributable to non-contro lling interests - -
- o f which attributable to Group 39,596,642 18,470,383
(euro)Note
20132014
Net income 39,596,642 18,470,383
Other comprehensive income:
- Changes in 'cash flow hedge' equity reserve (116,579) 338,118
- Taxes on changes in 'cash flow hedge' equity reserve 29,668 (90,532)
Other comprehensive income not to be reclassified in the separate income statement
- Changes in 'TFR' equity reserve (534,890) (76,544)
- Taxes on changes in 'TFR' equity reserve 147,095 21,049
Other comprehensive income (474,706) 192,092
Total comprehensive income 39,121,936 18,662,475
- of w hich attributable to Group 39,121,936 18,662,475
- of w hich attributable to non-controlling interests - -
(euro) 2014 2013

2014 Esprinet S.p.A. Financial Statements
135
Statement of changes in equity
Balance at 31 December 2012 7,861 218,361 (14,935) 20,308 231,595
Total comprehensive income/(loss) - 192 - 18,470 18,661
Allocation of last year net income/(loss) - 15,749 - (15,749) -
Dividend payment - - - (4,559) (4,559)
Transactions with owners - 15,749 - (20,308) (4,559)
Assignment of Esprinet ow n shares - (666) 1,865 - 1,199
Increase/(decrease) in 'stock grant' plan reserve - (245) - - (245)
Balance at 31 December 2013 7,861 233,390 (13,070) 18,470 246,651
Total comprehensive income/(loss) - (475) - 39,597 39,122
Allocation of last year net income/(loss) - 13,911 - (13,911) -
Dividend payment - - - (4,559) (4,559)
Transactions with owners - 13,911 - (18,470) (4,559)
Increase/(decrease) in 'stock grant' plan reserve - 913 - - 913
Variation in IAS/FTA reserve - (8) - - (8)
Assignment of Esprinet ow n shares - - - - -
Balance at 31 December 2014 7,861 247,731 (13,070) 39,597 282,119
(euro/000) Share capital Reserves Own sharesProfit for the
period
Total net
equity

2014 Esprinet S.p.A. Financial Statements
136
Statement of cash flows7
(euro/000) 2014 2013
Cash flow provided by (used in) operating activities (D=A+B+C) 13,559 54,405
Cash flow generated from operations (A) 40,032 31,127
Operating income (EBIT) 32,640 27,374
Net income from disposal groups 4,342 -
Depreciation, amortisation and other fixed assets write-downs 2,803 2,476
Net changes in provisions for risks and charges (176) 632
Net changes in retirement benefit obligations (490) (304)
Stock option/grant costs 913 949
Cash flow provided by (used in) changes in working capital (B) (13,311) 31,333
Inventory (27,037) 310
Trade receivables (17,625) 21,687
Other current assets 11,505 (7,426)
Trade payables 25,868 16,819
Other current liabilities (6,022) (57)
Other cash flow provided by (used in) operating activities (C) (13,162) (8,055)
Interests paid, net 1,533 396
Foreign exchange (losses)/gains (924) (135)
Gain on Monclick disposal (230) -
Gain on Comprel disposal (4,112) -
Income taxes paid (9,429) (8,316)
Cash flow provided by (used in) investing activities (E) (1,754) (2,247)
Net investments in property, plant and equipment (1,544) (2,199)
Net investments in intangible assets (799) (208)
Changes in other non current assets and liabilities (33) 95
Celly business combination (7,944) -
Monclick selling 3,966 -
Comprel selling 4,612 -
Investments in controlled subsidiaries (12) 65
Cash flow provided by (used in) financing activities (F) 50,224 (14,639)
Medium/long term borrowing 65,000 3,834
Repayment/renegotiation of medium/long-term borrowings (5,504) (10,000)
Net change in financial liabilities (7,094) 10,248
Borrowings due within 12 months granted - (10,000)
Net change in financial assets and derivative instruments 2,581 (4,415)
Dividend payments (4,559) (4,559)
Increase/(decrease) in 'cash flow hedge' equity reserve (200) 248
Equity reserve increase due to 'stock grant' plans to subsidiaries' employees - 5
Net increase/(decrease) in cash and cash equivalents (G=D+E+F) 62,029 37,519
Cash and cash equivalents at year-beginning 115,019 77,500
Net decrease (increase) in cash and cash equivalents 62,029 37,519
Cash and cash equivalents at year-end 177,048 115,019
7 No effects of relationships with related parties have been considered significant.

2014 Esprinet S.p.A. Financial Statements
137
Statement of financial position (Pursuant to Consob Resolution No. 15519 of 27 July 2006)
(*)
For further details regarding related parties please see the section ‘Relationships with related parties’ in the ‘Notes to Esprinet S.p.A. financial
statements’.
ASSETS
Non-current assets
Property, plant and equipment 8,217 8,918
Goodw ill 10,626 10,626
Intangible assets 896 655
Investments in associates 18 6
Investments in others 83,602 66,159
Deferred income tax assets 2,957 2,645
Receivables and other non-current assets 4,419 1,188 4,790 1,188
110,735 1,188 93,799 1,188
Current assets
Inventory 188,013 160,976
Trade receivables 169,563 16 146,066 35
Income tax assets 1,312 1,721
Other assets 76,933 69,110 90,128 82,592
Cash and cash equivalents 177,048 115,019
612,869 69,126 513,910 82,627
Non-current assets held for sale -
Total assets 723,604 70,314 607,709 83,815
EQUITY
Share capital 7,861 7,861
Reserves 234,661 220,320
Net income for the period 39,597 18,470
282,119 246,651
Non-controlling interests
Total equity 282,119 246,651
LIABILITIES
Non-current liabilities
Borrow ings 67,556 3,356
Derivative f inancial liabilities 128 -
Deferred income tax liabilities 2,383 2,279
Retirement benefit obligations 3,965 3,959
Provisions and other liabilities 1,744 1,919
75,776 11,513
Current liabilities
Trade payables 337,101 311,100 -
Short-term financial liabilities 13,898 24,507
Income tax liabilities 1,082 276
Derivative f inancial liabilities 51 70
Provisions and other liabilities 13,577 512 13,592 441
365,709 512 349,545 441
Total liabilities 441,485 512 361,058 441
Total equity and liabilities 723,604 512 607,709 441
related
parties*(euro/000) 31/12/2014
related
parties*31/12/2013

2014 Esprinet S.p.A. Financial Statements
138
Separate income statement (Pursuant to Consob Resolution No. 15519 of 27 July 2006)
(*)
Emoluments to key managers excluded.
Notes to the Esprinet S.p.A. financial statements
1. General information
Esprinet S.p.A. (or the ‘Company’) distributes IT products (hardware, software and services) pitching itself at a customer base made up of resellers that in turn target both consumer and business users. It is also the parent company with both direct and indirect shareholdings in companies operating in Italy and Spain. In Italy and in Spain, the Group operates solely in the ‘business-to-business’ (B2B) distribution of Information Technology (IT) and consumer electronics. Esprinet S.p.A. has its registered and administrative offices in Italy at Vimercate (Monza e Brianza). Ordinary shares in Esprinet S.p.A. (ticker: PRT.MI) have been listed in the ‘STAR’ segment (segment of securities with high qualification) of the MTA market of Borsa Italiana S.p.A., the Italian Stock Exchange, since 27 July 2001. The parent company, Esprinet S.p.A. drafted the Esprinet Group consolidated financial statements as at 31 December 2014.
2. Accounting principles and valuation criteria
The principal accounting policies applied in the preparation of these Esprinet S.p.A. financial statements are set out below. Unless otherwise stated, these policies have been consistently applied to all the years presented.
2.1 Accounting principles
The Esprinet S.p.A financial statements (or ‘separate financial statements’ as defined by IFRS) as at 31 December 2014 have been drawn up in compliance with IFRS requirements issued by the International Accounting Standards Board (IASB) and approved by the European Union, as well as the regulations issued as per art. 9 of D. Lgs. n. 38/2005. The acronym IFRS stands for the International Financial Reporting Standards (IFRS), which include the recent evolution of the International Accounting Standards (IAS) and all interpretations issued by the International Financial Reporting Interpretations Committee (IFRIC), previously known as the Standing Interpretations Committee (SIC). The financial statements have been drawn up using the historical cost, except for the assessment of some financial instruments, where the fair value criteria is applied, and also the going concern presumption.
Sales 1,715,607 - 51,158 1,542,725 - 133,681
Cost of sales (1,608,621) - (978) (1,444,387) - (1,232)
Gross profit 106,986 - 98,338 -
Sales and marketing costs (27,329) - (773) (25,965) - (445)
Overheads and administrative costs (47,017) (918) (1,966) (44,999) - (1,272)
Operating income (EBIT) 32,640 (918) 27,374 -
Finance costs - net (819) - 831 (200) - 758
Other investments expenses/(incomes) 13,734 13,734 - - - -
Profit before income tax 45,555 12,816 27,174 -
Income tax expenses (10,240) 261 - (8,704) - -
Profit from continuing operations 35,315 13,077 18,470 -
Income/(loss) from disposal groups 4,282 - - - - -
Net income 39,597 13,077 18,470 -
- o f which attributable to non-contro lling interests - -
- o f which attributable to Group 39,597 13,077 18,470 -
(euro/000) non-recurring related parties* non-recurring related parties*2014 2013
2014 Esprinet S.p.A. Financial Statements
139
2.2 Presentation of financial statements
The presentation formats of the financial position and income and cash-flow statements have the following characteristics: - statement of financial position: current and non-current assets and current and non-current liabilities are
reported separately; - statement of comprehensive income: income statement and statement of comprehensive income are
reported in two different statements; - separate income statement: costs have been analysed by function; - statement of cash flows: drawn up as per the indirect method set out in IAS 7. The choices made in terms of the presentation of the statement of accounts derive from the conviction that these contribute to an improvement in the quality of the information provided. The figures presented in this document are expressed in thousands of euro, unless otherwise indicated. Furthermore, in some cases the tables might have some inaccuracies due to the rounding-up to thousands. The figures presented in the separate and comprehensive income statements and in the statement of financial position are expressed in euro, whereas those in the statement of cash flows are expressed in thousands of euro. Furthermore, in some cases the tables might have some inaccuracies due to the rounding-up to thousands.
2.3 Summary of significant valuation criteria and accounting policies
Non-current assets
Intangible assets and goodwill
Intangible assets are assets that have no identifiable physical nature, that are controlled by the company and that are able to generate future income. They include goodwill, when it is acquired for a consideration. Intangibles and goodwill deriving from business combinations occurred until the end of 2009 are recorded at purchase cost, including incidentals and necessary costs to make them available for use. For business combinations occurred from 1 January 2010, except some particular cases, goodwill is measured as the excess of the acquisition-date fair value of the consideration transferred compared to the net of the acquisition-date amounts of the identifiable assets acquired and the liabilities assumed (any costs directly attributable to the combination, except costs of issuing debt or equity instruments, are expensed). Intangible assets with a defined useful life are systematically amortized over their useful life, taken as the estimate of the period that the assets shall be used by the Group. In particular the item ‘Industrial and other patent rights’ is amortized within three years. Goodwill and other intangible assets with indefinite useful lives are not amortized on a straight-line basis, but are subject to an annual impairment test. The Impairment test is described below in the section entitled ‘Impairment of non-financial assets’. The increased carrying amount of an intangible asset with defined or indefinite useful life attributable to a reversal of an impairment loss does not exceed the carrying amount that would have been determined (net of amortisation) had no impairment loss been recognised for the asset in prior years. This reversal is recognised in profit or loss unless the asset is carried at revalued amount, in which case it is treated as a revaluation increase. Revaluation of goodwill is not permitted, even in application of specific laws, as it is not reinstated when the reasons for a write-down no longer apply. Property, plant and equipment
Property, plant and equipment are shown in the financial statements at purchase or production cost, or at their conveyance value, including any directly attributable incidental costs and costs deemed necessary to make them operable. Ordinary maintenance and repair costs are charged to the income statement for the year in which they are incurred. Extraordinary maintenance costs leading to a significant and tangible increase in the productivity or useful life of an asset are added to the value of the asset concerned and amortised over a period representing its remaining useful life.
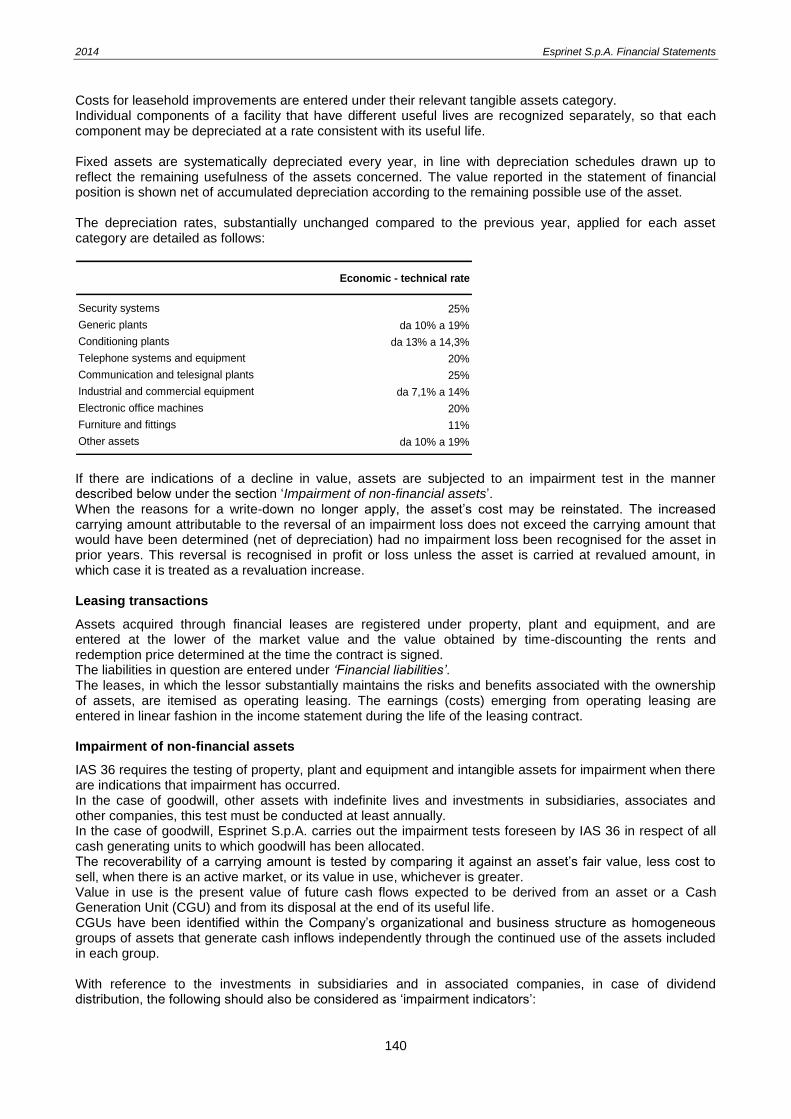
2014 Esprinet S.p.A. Financial Statements
140
Costs for leasehold improvements are entered under their relevant tangible assets category. Individual components of a facility that have different useful lives are recognized separately, so that each component may be depreciated at a rate consistent with its useful life. Fixed assets are systematically depreciated every year, in line with depreciation schedules drawn up to reflect the remaining usefulness of the assets concerned. The value reported in the statement of financial position is shown net of accumulated depreciation according to the remaining possible use of the asset. The depreciation rates, substantially unchanged compared to the previous year, applied for each asset category are detailed as follows:
Economic - technical rate
Security systems 25%
Generic plants da 10% a 19%
Conditioning plants da 13% a 14,3%
Telephone systems and equipment 20%
Communication and telesignal plants 25%
Industrial and commercial equipment da 7,1% a 14%
Electronic office machines 20%
Furniture and fittings 11%
Other assets da 10% a 19%
If there are indications of a decline in value, assets are subjected to an impairment test in the manner described below under the section ‘Impairment of non-financial assets’. When the reasons for a write-down no longer apply, the asset’s cost may be reinstated. The increased carrying amount attributable to the reversal of an impairment loss does not exceed the carrying amount that would have been determined (net of depreciation) had no impairment loss been recognised for the asset in prior years. This reversal is recognised in profit or loss unless the asset is carried at revalued amount, in which case it is treated as a revaluation increase. Leasing transactions
Assets acquired through financial leases are registered under property, plant and equipment, and are entered at the lower of the market value and the value obtained by time-discounting the rents and redemption price determined at the time the contract is signed. The liabilities in question are entered under ‘Financial liabilities’. The leases, in which the lessor substantially maintains the risks and benefits associated with the ownership of assets, are itemised as operating leasing. The earnings (costs) emerging from operating leasing are entered in linear fashion in the income statement during the life of the leasing contract. Impairment of non-financial assets
IAS 36 requires the testing of property, plant and equipment and intangible assets for impairment when there are indications that impairment has occurred. In the case of goodwill, other assets with indefinite lives and investments in subsidiaries, associates and other companies, this test must be conducted at least annually. In the case of goodwill, Esprinet S.p.A. carries out the impairment tests foreseen by IAS 36 in respect of all cash generating units to which goodwill has been allocated. The recoverability of a carrying amount is tested by comparing it against an asset’s fair value, less cost to sell, when there is an active market, or its value in use, whichever is greater. Value in use is the present value of future cash flows expected to be derived from an asset or a Cash Generation Unit (CGU) and from its disposal at the end of its useful life. CGUs have been identified within the Company’s organizational and business structure as homogeneous groups of assets that generate cash inflows independently through the continued use of the assets included in each group. With reference to the investments in subsidiaries and in associated companies, in case of dividend distribution, the following should also be considered as ‘impairment indicators’:

2014 Esprinet S.p.A. Financial Statements
141
Investment in subsidiary book value in the financial statement exceeding the consolidated carrying amount of the subsidiary net asset (possible connected goodwill included);
The dividend exceeding the total comprehensive income of the subsidiary in the period to which the dividends refer.
Investments in subsidiaries and other companies
Investments in subsidiaries, associates and other companies are valued at acquisition or subscription cost. Cost is reduced for long-term losses, where investments have endured losses and are not expected – in the immediate future at least – to realise profits that will be such to absorb the losses incurred; the original value is restored in later years, should the reasons for a given write-down cease to exist. Positive balances arising at the time of acquisition between the acquisition cost and the quota of net equity of the company invested in and belonging to the company at current values, is therefore included in the value charged to the investment.
Deferred income tax assets
Deferred income tax assets are recorded at face value. They are entered in the books when their recovery is deemed probable. See also the comment under item ‘Income taxes’. Financial assets
Receivables and financial fixed assets that will be held until their maturity are stated at the cost represented by the fair value of the initial payment given in exchange, increased by the costs of the transaction (e.g. commissions, consultancy fees, etc.). The initial statement value is subsequently modified to take into account any capital repayments, write-downs and amortization of the difference between the reimbursement value and the initial statement value. The amortization is carried out based on the effective internal rate which is the rate that renders the current value of expected cash flows and the initial statement value identical at the moment of the initial statement (so-called amortized cost method). Financial assets destined for negotiation and financial assets available for sale are stated at fair value with the effect accounted in the income statement item ‘Finance income/(cost)’ and the Shareholders’ Equity item ‘Other reserves’ respectively. When the purchase or sale of a financial asset foresees the payment for the transaction and the delivery of the asset within a set number of days, established by the market authorities or by convention (e.g. purchase of shares on regulated markets), the transaction is stated at the payment date. Financial assets that are sold are eliminated from the assets when the right to receive cash flow is transferred together the risks and benefits associated with the ownership of that asset. At each reporting date the Company assess whether there is any indication that a financial asset or a group of financial assets may be impaired.
Current assets
Inventory
Stock is taken at the lower of acquisition cost and realisable value, as obtained from market trends, whilst taking into account the features peculiar to the target sector of the Company concerned, which sells mainly IT products and consumer electronics that rapidly become obsolete. The configuration of cost adopted when valuating stock is based on the FIFO method of accounting. Purchase cost considers additional expenses as well as any discounts and allowances granted by vendors, in accordance with the sector’s standard business practice, in relation to predetermined sales targets being achieved and marketing activities being adequately developed in order to promote the brands being distributed and to develop the sales channels utilised. Cost includes ‘price protections’ on inventories granted by suppliers on the purchasing prices. Obsolete and surplus stock and stock characterised by slow turnover is written down to reflect the chances of selling it. Trade and other receivables
Trade and other receivables are initially stated at ‘fair value’.
2014 Esprinet S.p.A. Financial Statements
142
After first appraisal, receivables are stated at the amortised cost based on the real IRR (Internal Rate of Return), that is, the rate that renders the current value of expected cash flows and the initial statement value identical at the moment of the initial appraisal (so-called amortised cost method). The amount obtained using the amortised cost method, is then reduced to the realisable amount in the case of loss occurring. Write-downs are determined by considering the solvency of individual creditors, the insurance coverage and the level of credit risk, based on the available information and accumulated historical experience. Receivables assigned without recourse can be de-recognized only when they meet the de-recognition requirements of IAS 39. Income tax assets
Current taxation assets are stated at fair value; they include all those assets that are taxable by the Tax Authorities or that can be financially compensated in the short term. For further information please refer to the heading ‘Income taxes’. Other current assets
Other current assets are stated at the lesser of the cost and the net realisable value. Cash and cash equivalents
Cash in hand includes all liquid funds and deposits in bank accounts that are immediately available, as well as other liquidity with a duration of less than three months. The liquid funds in euro are stated at their face value, while liquid funds in other currencies are stated at the current exchange rate at the end of the year.
Net equity
Own shares
Where existing, own shares are stated at cost and deducted from equity. In the case of any subsequent sale, the difference between the cost of own shares and the selling price is recognized in equity.
Current and non-current liabilities
Financial liabilities
Financial liabilities are recognised in the statement of financial position when, and only when, the Company becomes a party to the contractual provisions of the instrument. Financial liabilities are initially stated at fair value, to which any eventual costs related to the transaction are added. Afterwards, financial liabilities are stated at the amortized cost using the actual interest rate for the discount calculation. Financial liabilities are removed from the income statement once the obligation specified in the contract has been fulfilled, cancelled or expired. The difference between the book value of the financial liability which is paid off or transferred to another party and the sum paid is reported in the income statement. The fair value of a financial asset or liability quoted in an active market is defined, at each reporting date, in terms of the quoted market price or of the dealers’ price (‘bid price’ for asset held or liability to be issued, ‘asking price’ for an asset to be acquired or a liability held), without any deduction for transaction costs. If the market for a financial instrument is not active the fair value is established by using a valuation technique. Valuation techniques include using recent arm’s length market transactions between knowledgeable, willing parties, if available, reference to the current fair value of another instrument that is substantially the same, discounted cash flow analysis or other valuation models. Provisions for risks and charges
Provisions are made when: (i) there is the probable existence of an obligation, be it actual, legal or implicit, due to past events; (ii) it is probable that the fulfilment of the obligation be against payment; (iii) the amount of the obligation can be reasonably ascertained. The provisions are stated at the value that represents the best estimate of the year. Where there is a significant financial effect over time and the payment date of the obligations can be reasonably estimated, the provisions are actualised; the increase in the provisions linked to the passing of time is stated in the separate income statement in the item ‘Finance costs’.

2014 Esprinet S.p.A. Financial Statements
143
Staff post-employment benefits
Staff post-employment benefits are defined on the basis of plans which even though not yet official are called either ‘fixed contribution’ or ‘defined benefit’ plans, depending on their characteristics. In the ‘fixed contribution’ plans the obligation of the company, limited to the payment of contributions to the State or entity or a distinct legal authority (fund), is calculated on the basis of the contributions owed. Until the 2007 Financial Law and relative enforcing decrees came into force, the uncertainty regarding payment times meant that staff severance indemnity (TFR) was likened to a defined benefit plan. Following the reform, the allocation of accruing staff severance indemnity quotas to the pension fund or to INPS, the Italian Social Security body, caused the transformation of the plan into a fixed contribution plan, where the company’s obligation is exclusively the payment of the contributions either to the fund or to INPS. Liabilities relating to past staff severance indemnity still represent a defined benefits plan calculated by independent actuaries using an actuarial-type method. During 2013 actuarial profits and losses, deriving from changes to actuarial hypotheses, are reported in an appropriate equity reserve figure as required by the IAS19 R. Pursuant to IAS 19, the above-mentioned reform has made it necessary to recalculate the value of the past staff severance indemnity provision due to the exclusion of the actuarial hypotheses linked to salary increases and the revision of financial-type hypotheses. This effect (curtailment) has been reported in the 2007 separate income statement in reduction of personnel costs. Payables, other debts, other liabilities
Payables, other debts and other liabilities are initially reported at their fair value increased by any costs linked to the transaction. They are later reported in the income statement at their face value, since no time-discounting or separate entry of interest payable is deemed necessary given the foreseen payment times. Provisions for presumed debt are liabilities paid for goods or services which have been received or supplied but not yet paid and include amounts due to staff or other subjects. The degree of uncertainty regarding the timing or amount of the allocations for ‘Other debt/liability’ is rather less than that of the provisions. For further details regarding trade payables please see ‘Definitions’ below.
Income statement
Revenues and expenses
Revenues from sales and services are stated at the moment of transfer of the typical risks and advantages of property or at the time the service is performed. Revenues are recognised at the time of shipment when the risk of loss is transferred to the buyer at that time. Revenues are stated net of returns, discount, allowances and bonuses, as well as directly related taxation. Costs are recognised when related to goods and services sold or used in the period or proportionally when their useful future life cannot be determined. The purchase cost of products is reported net of any discounts granted by vendors for ‘protection’ provided in respect of price-list reductions and product replacements. Credits arising from any such allowances are recorded by using the accrual method of accounting, based on information from the vendors concerned. Discounts granted for immediate cash payments of invoices payable upon presentation are used to reduce the cost of the products purchased, since – as is standard practice in the sector in which the Company operates – the commercial component is considered predominant. Dividends
Dividend payable is stated at the date of approval of the decision by the Assembly. Stock grants
Labour costs include stock options and/or stock grants awarded to managers in as much as they represent actual remuneration accruing at the closing date of the financial statements.

2014 Esprinet S.p.A. Financial Statements
144
The cost is calculated in reference to the fair value of the assignment awarded to the employee. The portion belonging to the period is calculated pro rata temporis over the vesting period. The fair value of assigned stock grants is measured by the ‘Black-Scholes’ and is stated in the form of a counterparty in the ‘Reserves’. Income taxes
Current income taxes are calculated with an estimate of taxable income; the forecast payable is stated in the item ‘Current income tax liabilities’ but, if surplus accounts have been paid, the receivable is stated in the item ‘Current income tax assets’. Tax payables and receivables for current taxation are stated at the value that it is expected to pay to or to recover from the Tax Authorities when applying the rates and current tax law or laws which have been substantially approved at the end of the period. Deferred and advance income taxes are calculated using the ‘liability method’ on the temporary differences between the values of assets and liabilities stated on the statement of financial position and the corresponding values recognised for tax purposes. The statement of assets for advanced taxation is made when their recovery is probable. Deferred and advance taxation are not stated if they are linked to the initial statement of an asset or liability in a different transaction by a business combination and that does not have an impact on the results and taxable income. Assets for advanced taxation and liabilities for deferred taxation are stated in the fixed assets and liabilities and are off-set for each single company if they are taxes that can be off-set. If the balance of this off-set is positive, it is stated in the item ‘Deferred income tax assets’; if it is negative, it is stated in the item ‘Deferred income tax liabilities’.
Foreign currency translation, transactions and balances
Functional and presentation currency
Items included in this financial statement are measured using the currency of the primary economic environment in which the entity operates (the functional currency). The consolidated financial statements are presented in euro, which is the Company’s functional and presentation currency. Currency transactions and balances
Foreign currency transactions are entered under functional currency using the exchange rates prevailing at the date of the transactions. Monetary assets and liabilities in foreign currency are converted into euro by applying the current exchange rate at the end of the period and the effect is stated in the separate income statement. Non-monetary assets and liabilities in foreign currency valued at cost are stated at the initial exchange rate; when they are valued at fair value or their recoverable or sale value, the current exchange rate is used on the date that the evaluation is made. Financial derivatives
Derivatives are financial assets and liabilities that are stated at their fair value. Derivatives are classified as hedging instruments when the relationship between the derivative and the underlying instrument is documented and the effectiveness of the hedge is both high and regularly verified. When a derivative covers the risk of variation of cash flow of the underlying instrument (cash flow hedge; e.g. to cover the variability of cash flow of assets/liabilities due to changes in interest rates), the variation in the fair value of the derivative is initially stated in the shareholders’ equity (and, consequently, in the statement of comprehensive income) and afterwards in the separate income statement in line with the economic effects produced by the covered transaction. If the hedging instrument expires or is sold, terminated or exercised (replacement excluded), or if the entity revokes the designation of the hedging relationship, the cumulative gain or loss on the hedging instrument recognised directly in equity from the period when the hedge was effective shall remain separately recognised in equity until the forecast transaction occurs. Variations of fair value derivatives that do not fulfil the requirements necessary to be defined as hedging instruments are stated in the separate income statement.

2014 Esprinet S.p.A. Financial Statements
145
Other information
Please note that the information required by Consob regarding significant operations and balances with related parties has been entered separately in the statement of accounts solely when significant and can also be found under ‘Other significant information’.
2.4 Critical accounting estimates and definitions
2.4.1 Introduction
The IT and electronic consumables distribution sector presents some significant specific features, as it is to some extent independent of geographic constraints, especially as regards commercial relations with suppliers of products or vendors. This is particularly evident in the conditions and formation of the so-called back-end profit margin, which results from the difference between the purchase price of the products and the sales price to the final consumer or reseller according to the terms of each supplier (with respect of the distributor’s main function which naturally remains that of brokering the flow of products between supplier/producer and reseller/retailer). Purchase conditions typically provide for a basic discount on end-users’/resellers’ price lists and a series of additional conditions that vary from vendor to vendor in terms of function and terminology but which can normally be summarised in the following categories: - bonuses/rebates for attaining targets (‘sell-in’, ‘sell-out’, number of clients, logistic efficiency); - development funds, co-marketing and other incentives; - cash discounts (so-called ‘prompt payment discounts’). Esprinet S.p.A. further benefits from current agreements with almost all the vendors in the form of specific contractual protections concerning the value of unsold stock, the aim of which is to neutralise the financial risk associated with variations in list prices of products ordered (‘price protection’) or already present in the distributor’s warehouses (‘stock protection’), within certain limits. In the first case, the protection is generally recognised through the invoicing of products ordered and not yet sent at the new price; in the second case, the vendor usually accords a credit equal to the reduction in price of the products. As for the cash discounts, these are generally recognised following respect of the contractually fixed payment terms and provide an incentive to pay punctually. These conditions allow for deferred payments in all cases with respect to the issue of the relative invoice or sending of the merchandise. In line with what happens for the financial discounts offered to some selected groups of customers, which are accounted for as reduced earnings, the cash discounts are accounted for in the form of reduced purchase costs. It is not possible within the sector to establish mid-norm payment terms policies regarding payment to suppliers as there is a considerable variety of conditions according to supplier. More in particular, the intervals in deferral of payments set out in the invoices range from a minimum of 7 to a maximum of 120 days, and in only one case is cash payment required. In some cases, the payment terms set out in the invoice are the object of further agreed deferrals, for each shipment or on the basis of clearly-defined commercial programmes set up by the suppliers. In the cases in which the above-mentioned deferrals carry an additional charge, the interest rate applied is not explicit, except in rare cases. Further, it often happens that implicit deferral terms – sometimes applied through a reduction in the contractually agreed cash discounts – have no connection with the current financial market rates, thus revealing how the commercial item takes precedence over the strictly financial item compensating for the delay between the date the debt arises and its effective payment. This element is also suborned by the relatively brief duration, on average, of the deferral period, even when extended, which never, except in rare cases, exceeds 90 days. 2.4.2 Critical Definitions
For the purposes of the drafting of the present statement of accounts, and as a further qualification of the definitions contained in the IFRS, some conventional definitions regarding the nature of the liability entries have been adopted.

2014 Esprinet S.p.A. Financial Statements
146
Financial debt
‘Financial debt’ is the term used to describe obligations to pay given amounts on a given date arising from the obtaining of financial liquidity as a loan. These include the type of transaction set out below, prevalently of a financial character and explicitly remunerated, and, in terms of the identity of the creditor, typically represented by a financial body or institution. As examples, and regardless of the item’s current or non-current character, the following liabilities are considered financial debt: - payables to banks; - payables to leasing companies (financial leasing operations); - payables to factoring companies (without recourse advances). Not included in the category of financial debt are those liabilities which, although not deferred payment for the purchase of goods or services, nevertheless do not strictly constitute loans. By contrast, costs deriving from the above-mentioned loans, including interest on current account overdrafts, on short and medium/long-term loans, the amortisation of initial loan operation costs, costs associated with financial leasing and exchange-rate differences, are entered in the books among the financial costs. Trade payables
The category ‘payables to suppliers’ includes liabilities arising from the deferred purchase of goods or services. Liabilities representing the deferred payment of goods or services are therefore entered under payables to suppliers at their face value, since no updating and separate itemisation in the income statement in terms of explicit or separate interest due is deemed necessary for considering the expected payment times. 2.4.3 Critical accounting estimates and assumptions
The preparation of the financial statements and the related notes has required the use of estimates and assumptions both in the measurement of certain assets and liabilities and in the valuation of contingent assets and liabilities. Estimates and assumptions have been made based on historical experience and other factors, including expectations of future events, the manifestation of which are deemed reasonable. Estimates and assumptions are revised on a regular basis, and the impact of such revision is immediately recognised in the income statement in the period of the change, if the change affects that period only, or in the period of the change and future periods if the change affects both. The assumptions regarding future performance are characterized by uncertainties. This means that different results - obviously neither estimable nor foreseeable, today – which might even cause significant adjustments to the book values of the relative items, cannot be excluded for the next financial year. The financial statement items mainly affected by these situations of uncertainty are certain sales revenues, some sales reversals, the provisions for risks and charges, the allowances for doubtful accounts, depreciations and amortisation, employee benefits, income taxes and goodwill. The critical valuation processes and the estimates and assumptions deemed likely to produce significant effects on the financial situation of the Esprinet S.p.A., should the future events set out not take place in whole or in part, are summarised below. Goodwill
For purposes of verifying loss of goodwill value entered in the books, the ‘value in use’ of the Cash Generating Units (‘CGUs’) to which a goodwill value has been attributed has been calculated. The CGUs have been identified within the Company’s organisational and business structure as homogeneous groups of assets that generate cash inflows independently, through the continued use of the assets included in each group. The use value has been calculated by the discounting back of expected cash-flows for each CGU as well as of the value expected from its disposal at the end of its useful life.

2014 Esprinet S.p.A. Financial Statements
147
To this end, the so-called Discounted Cash Flow Model (DCF) has been used, which requires that future financial flows be discounted at a rate adjusted to the specific risks of each single CGU.
‘Fair value’ of derivatives
For purposes of the present statement of accounts it has been necessary to measure the fair value of the IRS - Interest Rate Swap contracts signed in December 2014 in order to hedge the risk of changes in future cash flows of the hedged loans technically defined as ‘amortising - forward start’. Their conditions fully comply with International Accounting Standard 39 regarding ‘hedge accounting’(formal designation and documentation of the hedging relationship; hedge expected to be highly effective and reliably measured; forecast transaction highly probable and affecting profit or loss) and as a consequence, the derivative contracts were subject to the ‘cash flow hedge’ accounting rules. At inception date the portion of the gain or loss on the hedging instrument (that has been determined to be an effective hedge) has been recognised directly in equity. Subsequent changes in fair value of the expected future cash flows on the hedge item from inception of the hedge (due to changes in the interest rate curve) have been similarly recognised directly in equity (always within limits of being an effective hedge) and, consequently, shown in the statement of comprehensive income. Stock grant
For the purposes of the present statement of accounts, it has been necessary to include in the books the economic/asset effects associated with the stock grant plans in favour of some managers of Esprinet S.p.A., the operation of which is better illustrated in the paragraphs ‘Share incentive plans’ and ‘Share capital’. The cost of these plans has been specifically determined with reference to the fair value of the rights assigned to the single beneficiaries at assignment date. Bearing in mind the unusual and manifold operating conditions – in part governed by the consolidated financial results of the Group and in part by the permanence of the beneficiary in the Group until the vesting date of the plans – this fair value has been measured using the ‘Black-Scholes’ method, taking expected volatility, presumed dividend yield and the risk-free interest rate into account. Revenue recognition
For purposes of recognising earnings on sales and services, insufficient information regarding haulers’ actual consignment dates, means that dates are usually estimated by the Group on the basis of historical experience of average delivery times which differ according to the geographical location of the destination. Credit notes due from vendors
Bearing in mind the unusual practices of the sector regarding the way purchase and sale conditions are defined and, ultimately, the way the trading margin is formed and stated, estimates are usually effected by the Company, especially where the occurrence of events might provoke significant financial effects. Estimates of the sums of credit notes due from vendors to suppliers as rebates for the achieving of targets and incentives of various kinds, reimbursements for joint marketing activities, contractual stock protection, etc. at the drafting date of this document are referred to in particular. The Company has developed a series of procedures and checks to minimise possible errors in evaluations and estimates of the credit notes due. The possibility of differences emerging from between the estimated sums and those actually received in the final statement of financial position cannot be excluded, however. Depreciation and amortisation of fixed assets
Tangible and intangible assets with a defined useful life are systematically depreciated throughout their useful life. Useful life is defined as the period in which the activities will be used by the Company. This is estimated on the basis of experience with similar assets, market conditions and other events likely to exercise any influence on the useful life including, just as an example, significant technological changes. As a result, the actual economic life may differ from the estimated useful life. The validity of the expected useful life in terms of its asset category is regularly checked by the Company. This revision may result in variations to the periods of depreciation and amortization quotas in future accounting periods.

2014 Esprinet S.p.A. Financial Statements
148
Bad debt provision
For purposes of calculating the presumed degree of encashment of receivables, the Company makes forecasts concerning the degree of solvency of the other parties, on the basis of available information and historical experience. The actual value of encashment of receivables may differ from that estimated because of uncertainties regarding the conditions underlying the appraisal of solvency made. Any extension and/or deterioration of the present economic and financial crisis may cause a further worsening in the financial conditions of the Company’s debtors as opposed to that already taken into consideration when estimating the provision entered in the statement of financial position. Stock obsolescence provision
The Company usually effects forecasts regarding the value of encashment of obsolete, surplus or slow-moving warehouse stocks. This estimate is mainly based on historical experience and takes into consideration the peculiarities of the respective stock sectors. The value of encashment of the stocks may differ from that estimated because of the uncertainty affecting the conditions underlying the estimates made. The present economic and financial crisis may cause a further worsening in market conditions compared with that taken into consideration when estimating the provision entered in the financial statements. Provision for risks and charges
The Company makes provision for risks and charges on the basis of assumptions referred essentially to sums that might reasonably be paid to meet obligations for payment relating to past events. The estimate is the result of a complex process including the involvement of legal and tax consultants and which also includes personal opinions on the part of the Company's management. The sums actually paid to extinguish or transfer the obligations for payment to third parties may also differ significantly from those estimated for purposes of provision. Benefits to employees
Liabilities arising from benefits to employees subsequent to the employment noted in the statement of accounts are calculated by the application of actuarial methods as per IAS 19. These methods have required the identification of several employment possibilities and estimates of a demographic (probability of death, disability, leaving the labour market, etc.) and financial nature (technical rate of discounting back, inflation rate, rate of increase in remuneration, rate of increase of severance indemnity). The validity of the estimates made depends essentially on the stability of the regulations used as a reference point, the progress of market interest rates, the progress of the remuneration dynamics and eliminations, and also on the frequency of access to advances on the part of employees. Taxes
Current income taxes are calculated on the basis of the estimate of liable earnings, by applying the current fiscal rates pertaining on the date of the drafting of the statement of accounts. Deferred and advance taxes are determined by the temporary differences arising between the values of the assets and liabilities reported and the corresponding values recognised for tax purposes, using those tax rates considered possible upon encashment of the asset or extinguishment of the liability. Deferred tax assets are registered when the associated recovery is deemed probable; this probability depends upon the effective existence of taxable results in the future enabling deductible temporary differences to be used. The future taxable results have been estimated by taking into consideration the budget results and the plans consistent with those used to effect impairment tests. The fact that deferred tax assets refer to temporary tax differences/losses, a significant amount of which may be recovered over a very long time-span, compatible therefore with a situation where overcoming the crisis and economic recovery might extend beyond the time-frame implicit in the aforementioned plans, has also been taken into account.
2.5 Recently issued accounting standards
Information regarding the new approved accounting principles starting from 1 January 2014, as well as the principles applicable starting from 1 January 2015, together with the specifications concerning the approach

2014 Esprinet S.p.A. Financial Statements
149
of the Group towards them and the effects on the Esprinet S.p.A. financial statements can be found in the ‘Notes to the consolidated financial statements’.
2.6 Changes in accounting estimates and reclassifications
Changes in critical accounting estimates
Pursuant to IAS 8, no changes in the critical accounting estimates regarding previous periods, have been made in this financial statements.
Reclassifications in income statement No reclassifications in income statement regarding previous periods, have been made in this financial statements.
3. Notes to the statement of financial position items Non-current assets 4) Property, plant and equipment
(euro/000)Plant and
machinery
Ind. & comm.
equipment &
other assets
Assets under
construction &
advances
Total
Historical cost 7,745 16,625 479 24,849
Accumulated depreciation (5,556) (10,375) - (15,931)
Balance at 31 December 2013 2,189 6,250 479 8,918
Historical cost increase 202 1,045 351 1,598
Historical cost decrease (50) (87) (3) (140)
Historical cost reclassification 377 99 (476) -
Write-down - - - -
Increase in accumulated depreciation (607) (1,638) - (2,245)
Decrease in accumulated depreciation 50 36 - 86
Total changes (28) (545) (128) (701)
Historical cost 8,274 17,682 351 26,307
Accumulated depreciation (6,113) (11,977) - (18,090)
Balance at 31 December 2014 2,161 5,705 351 8,217
The tangible assets as at 31 December 2014 amount to 8.2 million euro, showed a decrease compare to the value of 2013, mainly due to the effect of the annual depreciation. Investments mainly refer to the ‘industrial & commercial equipment & other assets’ category (1.0 million euro), and are almost entirely related to the purchase of electronic machines and warehouse equipment. The following is the breakdown of the item ‘Industrial and commercial equipment and other assets’:
(euro/000) 31/12/2014 31/12/2013 Var.
Electronic machines 2,276 2,100 176
Furniture and fittings 2,436 2,772 (336)
Industrial and commercial equipment 281 382 (101)
Other assets 712 996 (284)
Total 5,705 6,250 (545)

2014 Esprinet S.p.A. Financial Statements
150
The useful life related to the various asset categories remained unchanged compared to the previous year. Please note that there are no temporarily unused tangible fixed assets intended for sale and that supply contracts signed within the financial year, but not recognised in the financial statements are insignificant.
5) Goodwill
Goodwill amounted to 10.6 million euro. The following table summarises the values of the single goodwill items in terms of the business combinations from which they arose:
(euro/000) 31/12/2014 31/12/2013 Var.
Assotrade S.p.A. 5,500 5,500 -
Pisani S.p.A. 3,878 3,878 -
Esprilog S.r.l. 1,248 1,248 -
Total 10,626 10,626 -
The Assotrade S.p.A. goodwill arose from the Esprinet’s combination of the Assotrade ‘IT Distribution’ business unit. The Pisani S.p.A. and the EspriLog S.r.l. goodwill items refer to the merger deficit arisen from the merger into Esprinet S.p.A. of Pisani S.p.A. and EspriLog S.r.l..
Disclosures about impairment tests of assets: goodwill
IAS 36 requires the testing of property, plant and equipment and intangible assets with an indefinite useful life for impairment whether there are indications that impairment has occurred. In the case of goodwill and other intangible assets with an indefinite useful life, this test, so said ‘impairment test’, must be conducted at least annually and whenever ‘triggering events’ occur, i.e. extraordinary negative events implying the asset may be impaired.
Goodwill does not generate cash flows independently of other assets or group of assets so, in compliance with IFRS, it is not an ‘individual asset‘ and may not be subjected to a separate impairment test being tested for impairment together with the group of activities to which it has been allocated. For the purposes of impairment testing, goodwill acquired in a business combination shall, from the acquisition date, be allocated to each of the acquirer’s ‘CGU - Cash-Generating Units’, or groups of CGUs that must not to be larger than an operating segment determined in accordance with IFRS 8. In this case it was only possible to consider the company as a whole, since no smaller independent CGU-Cash Generating Units were identified where all or part of the goodwill items could be allocated.
The method of testing the recoverable amount of the above goodwill items and the valuation system used can be found in the same section of the Consolidated Financial Statements and in the subsequent section ‘Investments in subsidiaries and other companies’, to which refer.
The tests performed did not highlight any impairment. Consequently no write-downs appear in the financial statements as at 31 December 2013 and goodwill amounts have therefore not changed versus the previous year. In addition, the management believes it unlikely that there will be key assumption changes able to generate a reduction in the Esprinet S.p.A.’s net asset recoverable amount below the respective carrying amount. Consequently, also in compliance with joint Bank of Italy/Consob/Isvap document n. 4 of 3 March 2010, a sensitivity test was performed on the results of the test regarding the combined variation in the following basic assumptions:
- the long term growth rate ‘g’ in order to obtain the cash flows beyond plan horizon; - the cash flow discounted rate; - the forecasted EBIT;
The variation range compared to the ‘normal’ case taken into account are as follows: - ‘g’ equal to 0% and to 1%; - WACC lower than -2% and -1%; - EBITDA lower than -10% and -20%.
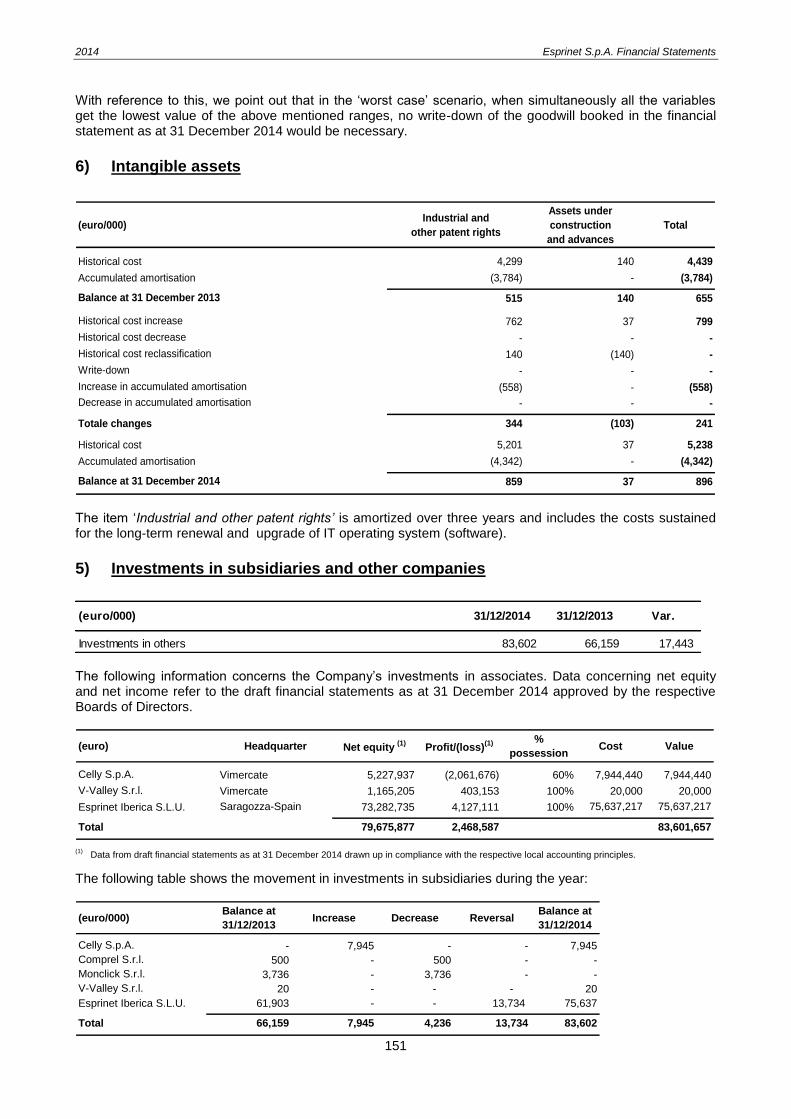
2014 Esprinet S.p.A. Financial Statements
151
With reference to this, we point out that in the ‘worst case’ scenario, when simultaneously all the variables get the lowest value of the above mentioned ranges, no write-down of the goodwill booked in the financial statement as at 31 December 2014 would be necessary.
6) Intangible assets
(euro/000)Industrial and
other patent rights
Assets under
construction
and advances
Total
Historical cost 4,299 140 4,439
Accumulated amortisation (3,784) - (3,784)
Balance at 31 December 2013 515 140 655
Historical cost increase 762 37 799
Historical cost decrease - - -
Historical cost reclassification 140 (140) -
Write-down - - -
Increase in accumulated amortisation (558) - (558)
Decrease in accumulated amortisation - - -
Totale changes 344 (103) 241
Historical cost 5,201 37 5,238
Accumulated amortisation (4,342) - (4,342)
Balance at 31 December 2014 859 37 896
The item ‘Industrial and other patent rights’ is amortized over three years and includes the costs sustained for the long-term renewal and upgrade of IT operating system (software).
5) Investments in subsidiaries and other companies
The following information concerns the Company’s investments in associates. Data concerning net equity and net income refer to the draft financial statements as at 31 December 2014 approved by the respective Boards of Directors.
(euro) Headquarter Net equity (1)
Profit/(loss)(1) %
possessionCost Value
Celly S.p.A. Vimercate 5,227,937 (2,061,676) 60% 7,944,440 7,944,440
V-Valley S.r.l. Vimercate 1,165,205 403,153 100% 20,000 20,000
Esprinet Iberica S.L.U. Saragozza-Spain 73,282,735 4,127,111 100% 75,637,217 75,637,217
Total 79,675,877 2,468,587 83,601,657
(1)
Data from draft financial statements as at 31 December 2014 drawn up in compliance with the respective local accounting principles.
The following table shows the movement in investments in subsidiaries during the year:
(euro/000)Balance at
31/12/2013Increase Decrease Reversal
Balance at
31/12/2014
Celly S.p.A. - 7,945 - - 7,945
Comprel S.r.l. 500 - 500 - -
Monclick S.r.l. 3,736 - 3,736 - -
V-Valley S.r.l. 20 - - - 20
Esprinet Iberica S.L.U. 61,903 - - 13,734 75,637
Total 66,159 7,945 4,236 13,734 83,602
(euro/000) 31/12/2014 31/12/2013 Var.
Investments in others 83,602 66,159 17,443

2014 Esprinet S.p.A. Financial Statements
152
During 2014 it should be noted the disposal of two subsidiaries, Monclick S.r.l. and Comprel S.r.l. as well as the acquisition of a 60% share of Celly S.p.A. occurred on 12 May 2014 for an amount of 7.9 million euro. In addition to the above should be highlighted the full reversal of the investment in Esprinet Iberica value written-down in 2011 for 13.7 million euro, as a consequence of the relevant increase in recoverable amount emerged from the results of its impairment test, as required by IAS 36 The company V-Valley has a role of ‘sales dealer’, managing the sales operations in its own name and on behalf of its parent company. It develops a service activity towards that of the headquarters, in totally subordinated conditions, representing a company vehicle where part of the ‘value chain’ of the parent company is merged (basically the invoicing and the credit management, included the management of the insurance related to the factoring programmes). No specific impairment test was conducted for the above mentioned company, on one hand because of the complete subordination to Esprinet, given also by the inclusion into the same CGU tested for the goodwill ‘impairment test’, and on the other hand considering the non-material value of the same (the company is booked for 20 thousand euro in the financial statement as per the initial establishment payment from the unique shareholder, Esprinet S.p.A). In compliance with IAS 36, in order to verify whether there is any indication that its investments in subsidiaries may be impaired, the entity perform at least annually an impairment test by comparing the value in use and the carrying amount of these investments.
A) Valuation system
In the case of the abovementioned investments, their value in use was calculated starting with the cash flow reasonably obtainable from operations, discounted-back to the date of the analysis. The abovementioned cash flows were primarily estimated on the basis of the Group’s plans forecast approved by the Board of Directors. These plans were drawn up, starting from the analytical budget of 2015 considered a ‘pivot’ year, thanks to forecasting techniques useful both for a separate management of fixed and variables costs, and for defining the revenues and product gross margin trend. This was done utilising a ‘benchmarking’ of the sector trends and of the end market in its entirety, as evaluated by reliable external sources, as well as assuming, for each investments, different trends according to the current and prospective competitive position.
Projections are thus based on forecasts covering normally a 5-year period and the ‘value in use’ was estimated using the Discounted Cash Flow (DCF) model which, in order to estimate the discounting back of future cash flows, requires an appropriate discount rate reflecting the degree of risk of the same cash flows. An ‘asset side’ approach was used which presupposes discounting unlevered cash flows, gross of financial components, generated by operations. These cash flows were calculated net of ‘figurative income taxes’ measured by applying an est imated tax rate to the operating income (EBIT). The discount rate includes the effect of price increases attributable to general inflation so future cash flows are estimated in nominal terms. In order to calculate the value in use of the investments in subsidiaries needed to assess their recoverable value versus their book value the respective net financial debt was deducted for each company at 31 December 2014. To estimate the discount rate the WACC’, or Weighted Average Cost of Capital, has been used. Its cost of the capital (Ke) has been calculated using a Capital Asset Pricing Model (‘CAPM’) approach. The terminal value recorded at the end of the forecast period was calculated using the ‘Perpetuity Method’ (unlimited capitalisation model of the last year’s cash flow). The approach used presupposes that from the end of the 5
th year on, the cash flow will grow at a constant
rate of ‘g’ and that therefore the terminal value will be calculated as perpetual income through the capitalisation of the last cash flow of the plan at a rate corresponding to the discount-back rate used (WACC) corrected by a growth factor. This last factor is seen as 2%. As a precaution, with reference to Terminal Value, no working capital reductions/releases are foreseen in the ‘basis’ year but, consistently with the past, the achievement of a ‘steady state’ is assumed, characterized by an absence of incremental investments, also with reference to the working capital.

2014 Esprinet S.p.A. Financial Statements
153
Please note that, in compliance with IAS 36 (A20) provisions that require a discount rate used to be a pre-tax rate, the post-tax version CAPM- calculated WACC was adjusted into the pre-tax equivalent defined as pre-tax WACC which leads to the same result when discounting back pre-tax cash flows.
B) Basic assumptions/ critical variables
In addition to the basic assumptions already above explained, such as the analytical forecast horizon and the growth rate ‘g’, information referring to the definition method of the discounted rates applied to the most relevant impairment tests are reported in the following table.
Celly S.p.A. Esprinet Iberica S.L.U.
Discount rates:
Equity Risk Premium 5.0% 5.0%
ß "unlevered " di industry 0.76 0.76
Target financial structure (D/D+E) 9% 9%
Target financial structure (E/D+E) 91% 91%
WACC post-tax 5.89% 5.65%
WACC pre-tax 8.45% 6.89%
C) Value adjustments
The impairment test regarding the Celly S.p.A. and Esprinet Iberica S.L.U. investments did not reveal any need for write-downs. On the contrary, as already mentioned, the entire reversal of Iberica investment value, written down in 2011, occurred during the year.
D) Sensitivity analysis
In addition, the management believes it unlikely that there will be key assumption changes able to generate a reduction in the CGUs below the carrying amount. More specifically, different sensitivity analysis of the test results were performed taking into account simultaneously the variation of the following basic assumptions.
- the long term growth rate ‘g’ in order to obtain the cash flows beyond plan horizon; - the cash flow discounted rate; - the forecasted EBIT. The variation range compared to the ‘normal’ case taken into account are as follows: - ‘g’ equal to 0% and to 1%; - WACC lower than -2% and -1%; - EBITDA lower than -10% and -20%. The outcomes of the basic assumption variations compared to the recoverable amount are summarised as follows. With reference to the ‘Iberica’ investment we point out that, even in the ‘worst case scenario’, i.e. with all the three variables set in the most adverse extremes of the possible range fluctuation, no write-downs of the investment value subject to impairment test would be necessary
8.
With reference to the ‘Celly’ investment, a similar scenario (‘g’ equal to 0%, WACC equal to 7.89% and EBITDA lower than -20%) would lead to a 0.1 million euro write-down. On the contrary, no other scenario would show any investment value write-downs. The abovementioned sensitivity analysis was performed as required by IAS 36 solely for purposes of information and the directors do not believe write-downs will be necessary since the cash flow forecasts and basic assumptions used in the impairment test are considered reasonably representative of ‘unique scenarios’ where a certain symmetry between ‘best’ and ‘worst’ scenarios can be expected.
8 With reference to the investment value preceding the reversal occurred in the period.

2014 Esprinet S.p.A. Financial Statements
154
6) Deferred income tax assets
The balance of this item is represented by taxed provisions and other temporary differences between carrying amounts and other values recognised for tax purposes which the Company expects to recover in future operating years when tax when taxable earnings will be accounted.
Temporary
differences
Fiscal effect (tax
rate)Amount
Temporary
differences
Fiscal effect (tax
rate)Amount
Bad debt provision 5,736 27.50% 1,577 5,455 27.50% 1,500
Excessive amortisation 19 27.50% 5 43 27.50% 12
Excessive amortisation 19 3.90% 1 43 3.90% 2
Director's fees not paid 1,260 27.50% 347 1,068 27.50% 294
Inventory obsolescence provision 1,349 27.50% 371 1,302 27.50% 358
Inventory obsolescence provision 1,349 3.90% 53 1,302 3.90% 51
Agent suppl. indemnity provision 797 27.50% 219 811 27.50% 223
Agent suppl. indemnity provision 797 3.90% 31 811 3.90% 32
Provisions for risks 346 27.50% 95 361 27.50% 99
Provisions for risks 318 3.90% 12 335 3.90% 13
Ineffec. on cash-flow hedge derivatives - 27.50% - 122 27.50% 34
Derivative instruments 179 27.50% 49 69 27.50% 19
TFR' - Actuarial gain/loss 437 27.50% 120 - 27.50% -
Valuation exchange loss 227 27.50% 62 25 27.50% 7
Other 44 31.40% 14 - 31.40% -
Other 27.50% - 9 27.50% 2
Deferred income tax assets 2,957 2,645
31/12/2014 31/12/2013
(euro/000)
The time-related allocation of this item is as follows:
(euro/000) Whitin 1 year 1-5 year Over 5 years Total
Deferred income tax assets 31/12/2014 2,907 50 2,957
31/12/2013 2,552 93 - 2,645
9) Receivables and other non-current assets
The trade receivables refer to the portion of credit toward the customer ‘Revenue Guard Corps’ (so called Guardia di Finanza – GdF) which expiring date is after one year and arose from a delivery of goods from Esprinet S.p.A. toward the GdF in 2011. This credit consists of annuals payments plan until January 2022 against which the Holding Company obtained a loan with Intesa Sanpaolo during 2013 whose instalments would be paid directly by the customer.
(euro/000) 31/12/2014 31/12/2013 Var.
Deferred income tax assets 2,957 2,645 312
(euro/000) 31/12/2014 31/12/2013 Var.
Guarantee deposits receivables 1,313 1,312 1
Trade receivables 3,085 3,457 (372)
Other receivables 21 21 -
Receivables and other non-current assets 4,419 4,790 (371)

2014 Esprinet S.p.A. Financial Statements
155
Since the counterparts of the two transactions are different it was deemed necessary to maintain separately booked on one hand the credit toward the customer and on the other correspondently the debt toward the financial entity until the repayment of the loan in its entirety. The variation compared to 31 December 2013 is due to the allocation in the current receivables of the portion expiring within next fiscal year. The item Guarantee deposits receivables includes guarantee deposits relating to utilities and renting agreements ongoing. The amount entered under Other receivables refers to the Ecor’it consortium membership fees.
Current assets
10) Inventory
(euro/000) 31/12/2014 31/12/2013 Var.
Finished products and goods 189,362 162,278 27,084
Provision for obsolescence (1,349) (1,302) (47)
Inventory 188,013 160,976 27,037
Inventory totalled 188.0 million euro shows an increase of +17% as a consequence of the revenues increase of the year and the increase of the turnovers days (from 41 to 43 days). The 1.3 million euro allocated to Provision for obsolescence is intended to address the risks associated with the presumed lower realisable value of obsolete and slow-moving stock. The movement in the provision during the period was as follows:
(euro/000) 31/12/2014 31/12/2013 Var.
Provision for obsolescence: year-beginning 1,302 663 639
Uses (123) (59) (64)
Accruals 170 698 (528)
Provision for obsolescence: year-end 1,349 1,302 47
11) Trade receivables
(euro/000) 31/12/2014 31/12/2013 Var.
Trade receivables - gross 175,754 152,045 23,709
Bad debt provison (6,191) (5,979) (212)
Trade recevables - net 169,563 146,066 23,497
Trade receivables arise from normal sales dealings engaged in by the Company in the context of ordinary marketing activities. These operations are effected almost entirely with customers resident in Italy, are wholly in euro and are short-term. The increase in the item trade receivables-gross was mainly caused by the significant improvement in Group turnover and partially by the improvement in trade receivables turnover (went down from 31 to 30 days), also as a result of the increase in without recourse assignments in 2014 compared to last year (i.e. equal to approx. 68 million euro at the end of 2014 compared to 66 million euro in 2013). The Trade receivables balance includes 10.0 million euro of receivables transferred to factoring firms under the ‘with-recourse’ factoring agreement (13.6 million euro in 2013). Adjustments to the presumed net realisable value of receivables collected is effected through bad debt provision. This provision is made up of allocations estimated on the basis of a valuation analysis of each

2014 Esprinet S.p.A. Financial Statements
156
single customer in terms of the relevant receivables overdue, or existing trade disputes and by also taking into account insurance covers, however (further information can be found under ‘Disclosures on risks and financial instruments’). The table below illustrates the movements in the bad debt provision:
(euro/000) 31/12/2014 31/12/2013 Var.
Bad debt provision: year-beginning 5,979 6,263 (284)
Uses (527) (870) 343
Accruals 739 586 153
Bad debt provision: year-end 6,191 5,979 212
12) Income tax assets
The Income tax assets refer to the repayment claim of IRES tax paid by the companies of the Group that opted for the ‘National consolidated tax regime’ as a result of the non-deduction of the IRAP tax on personnel costs in fiscal years 2004-2007 and 2007-2011.
13) Other assets
The following tables show Receivables from subsidiaries detailed by type and by single company. For further information regarding the source figures please refer to the section headed ‘Relationships with related parties’.
(euro/000) 31/12/2014 31/12/2013 Var.
Income tax assets 1,312 1,721 (409)
(euro/000) 31/12/2014 31/12/2013 Var.
Receivables from subsidiaries (A)68,541 82,317 (13,776)
Receivables from associates (B)569 275 294
VAT receivables 294 399 (105)
Other tax assets 14 46 (32)
Other receivables from Tax authorities (C)308 445 (137)
Receivables from factoring companies 689 2,721 (2,032)
Customer f inancial receivables 506 572 (66)
Receivables from insurance companies 1,834 1,729 105
Receivables from suppliers 2,897 1,384 1,513
Receivables from employees 1 3 (2)
Receivables from others 110 - 110
Other receivables (D)6,037 6,409 (372)
Prepayments (E) 1,478 682 796
Other assets (F= A+B+C+D+E) 76,933 90,128 (13,195)

2014 Esprinet S.p.A. Financial Statements
157
(euro/000) 31/12/2014 31/12/2013 Var.
Celly S.p.A. 1,313 - 1,313
Comprel S.r.l. - 495 (495)
Monclick S.r.l. - 4,854 (4,854)
V-Valley S.r.l. 22,654 25,231 (2,577)
Esprinet Iberica S.L.U. 4,546 11,100 (6,554)
Trade receivables (A) 28,513 41,680 (13,167)
V-Valley S.r.l. 28 - 28
Comprel S.r.l. - 20 (20)
Monclick S.r.l. - 617 (617)
Receivables as per national cons. tax regime (B) 28 637 (609)
Esprinet Iberica S.L.U. 40,000 40,000 -
Financial receivables (C) 40,000 40,000 -
Total receivables from subsidiaries (A+B+C) 68,541 82,317 (13,776)
(euro/000) 31/12/2014 31/12/2013 Var.
Celly S.p.A. 1,313 - 1,313
Comprel S.r.l. - 515 (515)
Monclick S.r.l. - 5,471 (5,471)
V-Valley S.r.l. 22,682 25,231 (2,549)
Esprinet Iberica S.L.U. 44,546 51,100 (6,554)
Total receivables from subsidiaries 68,541 82,317 (15,089)
Vat receivables refers to reimbursement claims which are not allowed to be offset against operating tax liabilities. The change was due to the reimbursement made during the year by the tax authorities. Other tax receivables are mainly reimbursements of sanctions and/or duties recognized by the tax authorities but not yet paid. Receivables from factoring companies include sums owed to the Company as a result of ‘without recourse’ factoring operations effected. At the draft date of this report was drafted, all the receivables payable had been paid. Customer financial receivables refer to the short portion of receivables collectable within the subsequent year that arose from a delivery of goods in 2011 from Esprinet S.p.A. to the customer ‘Guardia di finanza - GdF’. For further information please refer also to paragraph “Receivables and other non-current assets”. Receivables from insurance companies include the insurance compensation – after deductibles – recognized by the insurance companies for claims of various kinds not yet paid, but which are reasonably expected to be collected within the following year. Receivables from suppliers refer to credit notes received exceeding the amount owed at the end of the year as a consequence of a timing mismatch between their calculation and their payment. This item also includes receivables from hauliers for advance VAT payments and customs duties pertaining to imports, to receivables from suppliers for advance payments demanded by suppliers before purchase orders are executed. Prepayments are costs the accrual date of which is deferred compared with that of the cash movement (mainly payables for leasing contracts, maintenance fees, service fees).
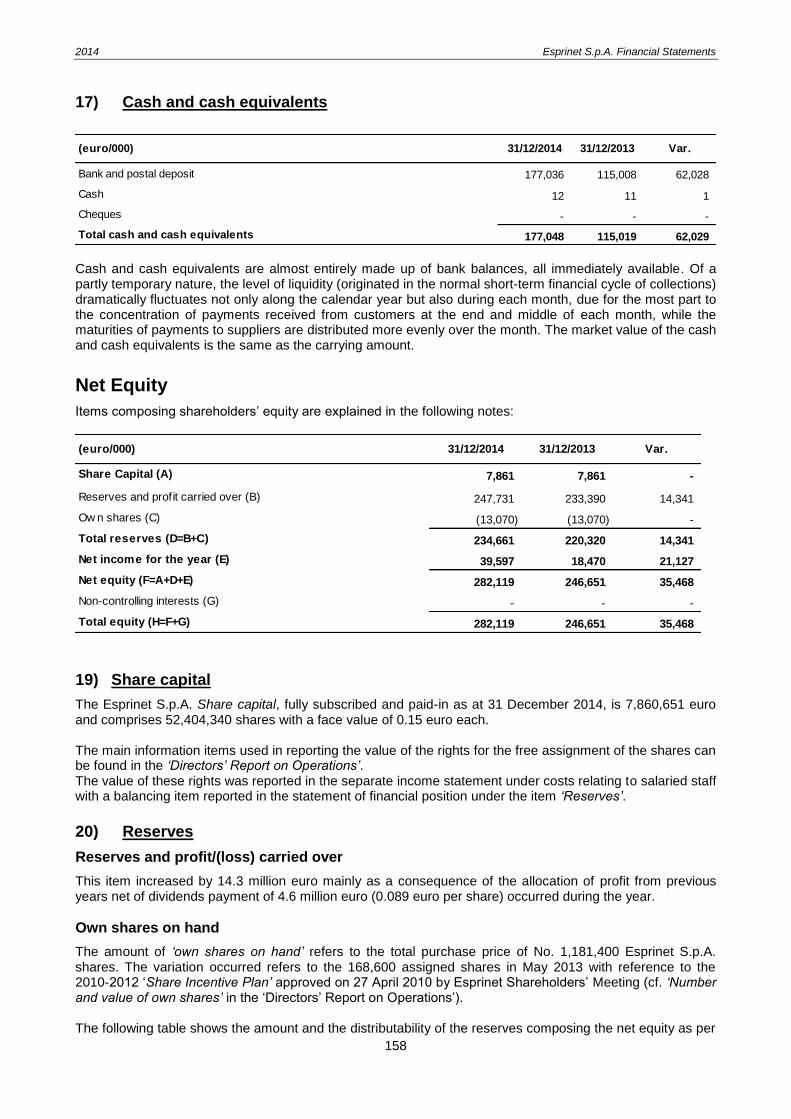
2014 Esprinet S.p.A. Financial Statements
158
17) Cash and cash equivalents
Cash and cash equivalents are almost entirely made up of bank balances, all immediately available. Of a partly temporary nature, the level of liquidity (originated in the normal short-term financial cycle of collections) dramatically fluctuates not only along the calendar year but also during each month, due for the most part to the concentration of payments received from customers at the end and middle of each month, while the maturities of payments to suppliers are distributed more evenly over the month. The market value of the cash and cash equivalents is the same as the carrying amount.
Net Equity
Items composing shareholders’ equity are explained in the following notes:
19) Share capital
The Esprinet S.p.A. Share capital, fully subscribed and paid-in as at 31 December 2014, is 7,860,651 euro and comprises 52,404,340 shares with a face value of 0.15 euro each. The main information items used in reporting the value of the rights for the free assignment of the shares can be found in the ‘Directors’ Report on Operations’. The value of these rights was reported in the separate income statement under costs relating to salaried staff with a balancing item reported in the statement of financial position under the item ‘Reserves’.
20) Reserves
Reserves and profit/(loss) carried over
This item increased by 14.3 million euro mainly as a consequence of the allocation of profit from previous years net of dividends payment of 4.6 million euro (0.089 euro per share) occurred during the year.
Own shares on hand
The amount of ‘own shares on hand’ refers to the total purchase price of No. 1,181,400 Esprinet S.p.A. shares. The variation occurred refers to the 168,600 assigned shares in May 2013 with reference to the 2010-2012 ‘Share Incentive Plan’ approved on 27 April 2010 by Esprinet Shareholders’ Meeting (cf. ‘Number and value of own shares’ in the ‘Directors’ Report on Operations’). The following table shows the amount and the distributability of the reserves composing the net equity as per
(euro/000) 31/12/2014 31/12/2013 Var.
Bank and postal deposit 177,036 115,008 62,028
Cash 12 11 1
Cheques - - -
Total cash and cash equivalents 177,048 115,019 62,029
(euro/000) 31/12/2014 31/12/2013 Var.
Share Capital (A) 7,861 7,861 -
Reserves and profit carried over (B) 247,731 233,390 14,341
Ow n shares (C) (13,070) (13,070) -
Total reserves (D=B+C) 234,661 220,320 14,341
Net income for the year (E) 39,597 18,470 21,127
Net equity (F=A+D+E) 282,119 246,651 35,468
Non-controlling interests (G) - - -
Total equity (H=F+G) 282,119 246,651 35,468

2014 Esprinet S.p.A. Financial Statements
159
Article 2427, 7-bis of the Italian civil Code and their past usage:
(euro/000)
Type/description Amount Possible usesQuota
availableTo cover losses For other reasons
Share capital 7,861 --- -
Reserves as per OIC:
Share premium reserve (*)
22,281 A,B,C 22,281
Revaluation reserve 30 A,B,C 30
Legal reserve 1,572 B -
Own shares on hand 13,070 --- -
Merger surplus 5,369 A,B,C 5,369
Extraordinary reserve 197,481 A,B,C 197,481
Net profit from exchange operations reserve --- -
IFRS reserve 7,929 --- -
Total Reserves 247,732 225,161 - -
Total share capital and reserves 255,593 225,161
Non-distributable quota (**)
-
Residual distributable quota 225,161
Summary of the uses in the three
previous years:
(*)
Pursuant to Article 2431 of the Civil Code the whole amount of this reserve can be distributed solely provided that the legal reserve has reached the limit established by Article 2430 of the Civil Code, including through the transfer of the share premium reserve. This limit had been reached as at 31 December 2008.
(**) Pursuant to Article 2426, 5), this is the non-distributable quota allocated to cover long-term costs not yet amortised.
Key: A: share capital increase. B: cover of losses. C: distribution to shareholders.
The main changes in net equity during 2014 can be found in the ‘Statement of changes in equity’.
21) Net income
The year’s profits amount to 39.6 million euro, increasing by 21.1 million euro from previous year’s 18.5 million.
Non-current liabilities
22) Borrowings
The borrowings value as at 31 December 2014 refers to the valuation at the amortized cost of the portion falling due beyond next year of the following medium-long term loans: - a “Term loan Facility” of 65 million euro as booked value of loan principal signed on July 2014 with a pool of banks, granted on August 2014 and due by July 2019; - a loan, still existing as at 31 December 2014 for 3.5 million euro in book value of loan principle, signed and granted in December 2013 and expiring by January 2022 referring to the delivery of goods to the customer ‘Guardia di Finanza – GdF’. The “Term loan Facility” is subject to the observance of 3 covenants, which details can be found under next paragraph ‘Loans and loan covenants’.
Borrow ings 67,556 3,356 64,200
(euro/000) 31/12/2014 31/12/2013 Var.

2014 Esprinet S.p.A. Financial Statements
160
The ‘GdF’ borrowing, as already mentioned in paragraph 9 ‘Receivables and other non-current assets’, led to the simultaneous recording of a long-term receivable towards the customer ‘Guardia di Finanza’ of the same amount (loan principal). Further details can be found in the following paragraph “Net financial indebtedness and financial liabilities analysis”.
23) Derivative financial liabilities (non-current)
The amount refers to the ‘fair value’ of ‘IRS-Interest Rate Swap’ contracts entered in December 2014 to entirely hedge the risk of interest rate fluctuations on the ‘Term Loan Facility’ signed in July 2014 with a pool of banks for 65.0 million euro. For further details regarding the operation please refer to the section headed ‘Disclosures on risks and financial instruments’.
24) Deferred income tax liabilities
The balance of this item depends on higher taxes that the Company has to pay in the next operating years due to temporary differences between the carrying amounts of assets and liabilities in the financial statements and the corresponding values recognised for tax purposes. As shown in the next table, these differences mainly arise from the elimination of the tax amortisation of goodwill, and the adjustment of the staff severance provision (‘TFR’) to the actuarial valuation.
Temporary
differences
Fiscal effect (tax
rate)Amount
Temporary
differences
Fiscal effect (tax
rate)Amount
Goodwills' amortisation 7,382 27.50% 2,030 7,032 27.50% 1,934
Goodwills' amortisation 7,382 3.90% 288 7,032 3.90% 274
Change TFR provision 141 27.50% 39 150 27.50% 41
Estimated foreign exchange gains 97 27.50% 26 107 27.50% 30
Total deferred income tax liabilities 2,383 2,279
31/12/2014 31/12/2013
(euro/000)
The time-related allocation of deferred income tax liabilities is as follows:
(euro/000) Within 1 year 1-5 years Over 5 years Total
Deferred income tax liabilities 31/12/2014 65 - 2,318 2,383
31/12/2013 71 - 2,208 2,279
25) Retirement benefit obligations
Retirement benefit obligations reflects the staff severance indemnities (‘TFR’) and other benefits accruing to salaried staff at the close of the period, assessed in accordance with actuarial criteria, pursuant to IAS 19.
(euro/000) 31/12/2014 31/12/2013 Var.
Derivative financial liabilities 128 - 128
(euro/000) 31/12/2014 31/12/2013 Var.
Deferred income tax liabilities 2,383 2,279 104
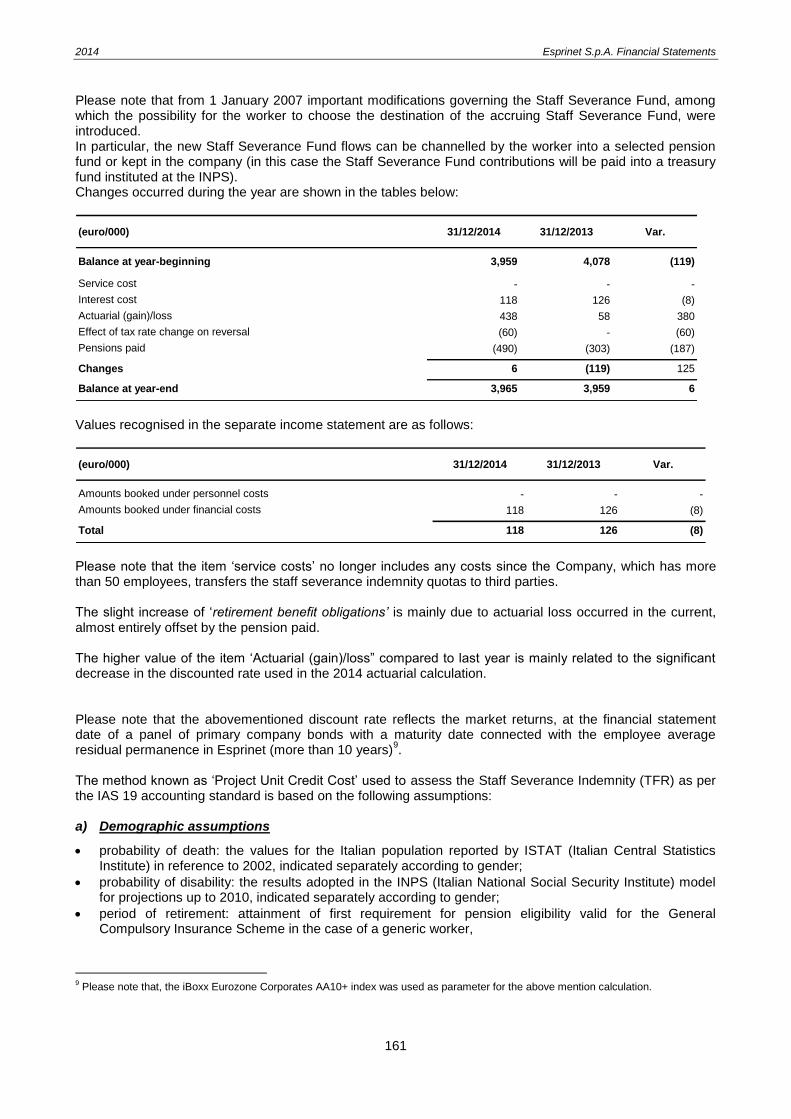
2014 Esprinet S.p.A. Financial Statements
161
Please note that from 1 January 2007 important modifications governing the Staff Severance Fund, among which the possibility for the worker to choose the destination of the accruing Staff Severance Fund, were introduced. In particular, the new Staff Severance Fund flows can be channelled by the worker into a selected pension fund or kept in the company (in this case the Staff Severance Fund contributions will be paid into a treasury fund instituted at the INPS). Changes occurred during the year are shown in the tables below:
(euro/000) 31/12/2014 31/12/2013 Var.
Balance at year-beginning 3,959 4,078 (119)
Service cost - - -
Interest cost 118 126 (8)
Actuarial (gain)/loss 438 58 380
Effect of tax rate change on reversal (60) - (60)
Pensions paid (490) (303) (187)
Changes 6 (119) 125
Balance at year-end 3,965 3,959 6
Values recognised in the separate income statement are as follows:
(euro/000) 31/12/2014 31/12/2013 Var.
Amounts booked under personnel costs - - -
Amounts booked under financial costs 118 126 (8)
Total 118 126 (8)
Please note that the item ‘service costs’ no longer includes any costs since the Company, which has more than 50 employees, transfers the staff severance indemnity quotas to third parties. The slight increase of ‘retirement benefit obligations’ is mainly due to actuarial loss occurred in the current, almost entirely offset by the pension paid. The higher value of the item ‘Actuarial (gain)/loss” compared to last year is mainly related to the significant decrease in the discounted rate used in the 2014 actuarial calculation. Please note that the abovementioned discount rate reflects the market returns, at the financial statement date of a panel of primary company bonds with a maturity date connected with the employee average residual permanence in Esprinet (more than 10 years)
9.
The method known as ‘Project Unit Credit Cost’ used to assess the Staff Severance Indemnity (TFR) as per the IAS 19 accounting standard is based on the following assumptions: a) Demographic assumptions
probability of death: the values for the Italian population reported by ISTAT (Italian Central Statistics Institute) in reference to 2002, indicated separately according to gender;
probability of disability: the results adopted in the INPS (Italian National Social Security Institute) model for projections up to 2010, indicated separately according to gender;
period of retirement: attainment of first requirement for pension eligibility valid for the General Compulsory Insurance Scheme in the case of a generic worker,
9 Please note that, the iBoxx Eurozone Corporates AA10+ index was used as parameter for the above mention calculation.
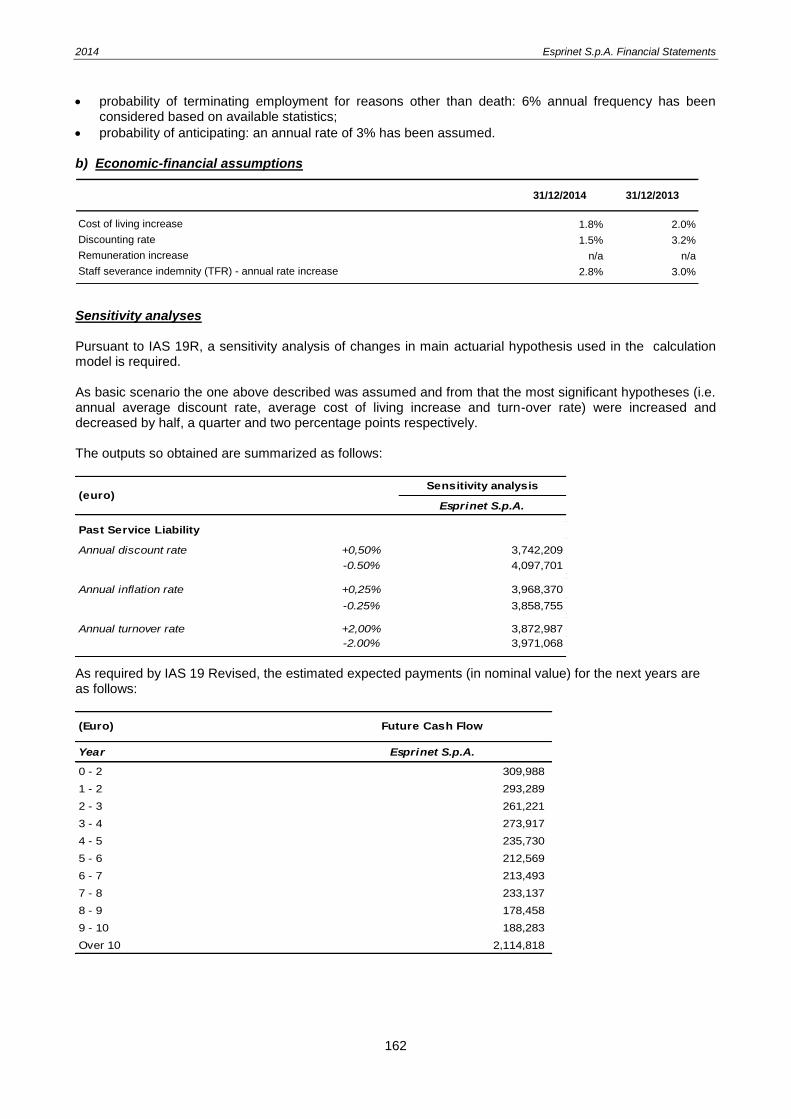
2014 Esprinet S.p.A. Financial Statements
162
probability of terminating employment for reasons other than death: 6% annual frequency has been considered based on available statistics;
probability of anticipating: an annual rate of 3% has been assumed.
b) Economic-financial assumptions
31/12/2014 31/12/2013
Cost of living increase 1.8% 2.0%
Discounting rate 1.5% 3.2%
Remuneration increase n/a n/a
Staff severance indemnity (TFR) - annual rate increase 2.8% 3.0%
Sensitivity analyses Pursuant to IAS 19R, a sensitivity analysis of changes in main actuarial hypothesis used in the calculation model is required. As basic scenario the one above described was assumed and from that the most significant hypotheses (i.e. annual average discount rate, average cost of living increase and turn-over rate) were increased and decreased by half, a quarter and two percentage points respectively. The outputs so obtained are summarized as follows:
Sensitivity analysis
Esprinet S.p.A.
Past Service Liability
Annual discount rate +0,50% 3,742,209
-0.50% 4,097,701-
Annual inflation rate +0,25% 3,968,370
-0.25% 3,858,755-
Annual turnover rate +2,00% 3,872,987
-2.00% 3,971,068
(euro)
As required by IAS 19 Revised, the estimated expected payments (in nominal value) for the next years are as follows:
Year Esprinet S.p.A.
0 - 2 309,988
1 - 2 293,289
2 - 3 261,221
3 - 4 273,917
4 - 5 235,730
5 - 6 212,569
6 - 7 213,493
7 - 8 233,137
8 - 9 178,458
9 - 10 188,283
Over 10 2,114,818
Future Cash Flow(Euro)

2014 Esprinet S.p.A. Financial Statements
163
26) Non-current provisions and other liabilities
(euro/000) 31/12/2014 31/12/2013 Var.
Long-term liabilities for cash incentives - 424 (424)
Provisions for pensions an similar obligations 1,211 1,107 104
Other provisions 533 388 145
Non-current provisions and other liabilities 1,744 1,919 (175)
The item Long-term liabilities for cash incentives refers to present value of cash incentives maturing by
beneficiaries of the ‘Long-term Incentive Plan’ payable on May 2015 solely both on achievement of profit
targets for the 3years period 2012-2014 and providing that the beneficiary will remain in the Group until the
presentation of the 2014 consolidated financial statement.
The zeroing in the abovementioned item is related to the liability reclassification in the “Current provisions
and other liabilities” as consequence of its vesting date.
The item Provisions for pensions includes the supplementary customer indemnity provision payable to agents based on current regulations disciplining the subject. Movements in the year are as follows:
(euro/000) 31/12/2014 31/12/2013 Var.
Provisions for pensions: year - beginning 1,107 912 195
Uses (56) (60) 4
Accruals 160 255 (95)
Provisions for pensions: year - end 1,211 1,107 104
The amount, entered under Other provisions is intended as cover both for risks linked with current legal and
tax-related disputes, and for events related to the extraordinary transactions occurred in the year. Changes
in this item during the year are as follows:
(euro/000) 31/12/2014 31/12/2013 Var.
Other provisions: year-beginning 388 206 182
Uses (71) (171) 100
Accruals 216 353 (137)
Other provisions: year-end 533 388 145
The notes regarding developments on the main disputes involving the Group, for which the company
effected the relevant risk assessments and consequently effected accruals to the provision for risks, where
considered appropriate, can be found under ‘Developments in legal and tax-related disputes’ in the notes to
the item ‘Non-current provisions and other liabilities’, in turn in the ‘Notes to the consolidated financial
statements’.
The Company’s and the Group’s policies regarding the management of legal and tax-related disputes can be
found under ‘Main risks and uncertainties facing the Group and Esprinet S.p.A.’ in the ‘Directors’ Report on
Operations’.
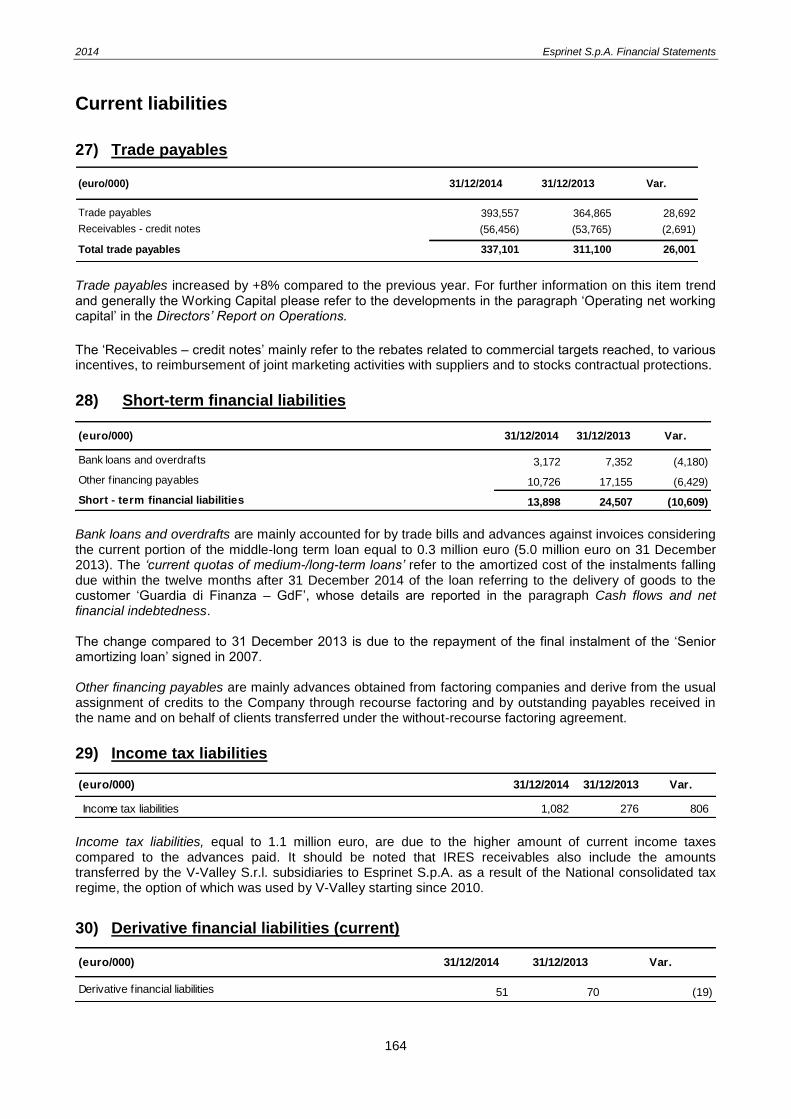
2014 Esprinet S.p.A. Financial Statements
164
Current liabilities
27) Trade payables
(euro/000) 31/12/2014 31/12/2013 Var.
Trade payables 393,557 364,865 28,692
Receivables - credit notes (56,456) (53,765) (2,691)
Total trade payables 337,101 311,100 26,001
Trade payables increased by +8% compared to the previous year. For further information on this item trend and generally the Working Capital please refer to the developments in the paragraph ‘Operating net working capital’ in the Directors’ Report on Operations.
The ‘Receivables – credit notes’ mainly refer to the rebates related to commercial targets reached, to various incentives, to reimbursement of joint marketing activities with suppliers and to stocks contractual protections. 28) Short-term financial liabilities
Bank loans and overdrafts are mainly accounted for by trade bills and advances against invoices considering the current portion of the middle-long term loan equal to 0.3 million euro (5.0 million euro on 31 December 2013). The ‘current quotas of medium-/long-term loans’ refer to the amortized cost of the instalments falling due within the twelve months after 31 December 2014 of the loan referring to the delivery of goods to the customer ‘Guardia di Finanza – GdF’, whose details are reported in the paragraph Cash flows and net financial indebtedness. The change compared to 31 December 2013 is due to the repayment of the final instalment of the ‘Senior amortizing loan’ signed in 2007. Other financing payables are mainly advances obtained from factoring companies and derive from the usual assignment of credits to the Company through recourse factoring and by outstanding payables received in the name and on behalf of clients transferred under the without-recourse factoring agreement.
29) Income tax liabilities
Income tax liabilities, equal to 1.1 million euro, are due to the higher amount of current income taxes compared to the advances paid. It should be noted that IRES receivables also include the amounts transferred by the V-Valley S.r.l. subsidiaries to Esprinet S.p.A. as a result of the National consolidated tax regime, the option of which was used by V-Valley starting since 2010.
30) Derivative financial liabilities (current)
(euro/000) 31/12/2014 31/12/2013 Var.
Bank loans and overdrafts 3,172 7,352 (4,180)
Other financing payables 10,726 17,155 (6,429)
Short - term financial liabilities 13,898 24,507 (10,609)
(euro/000) 31/12/2014 31/12/2013 Var.
Income tax liabilities 1,082 276 806
(euro/000) 31/12/2014 31/12/2013 Var.
Derivative financial liabilities 51 70 (19)
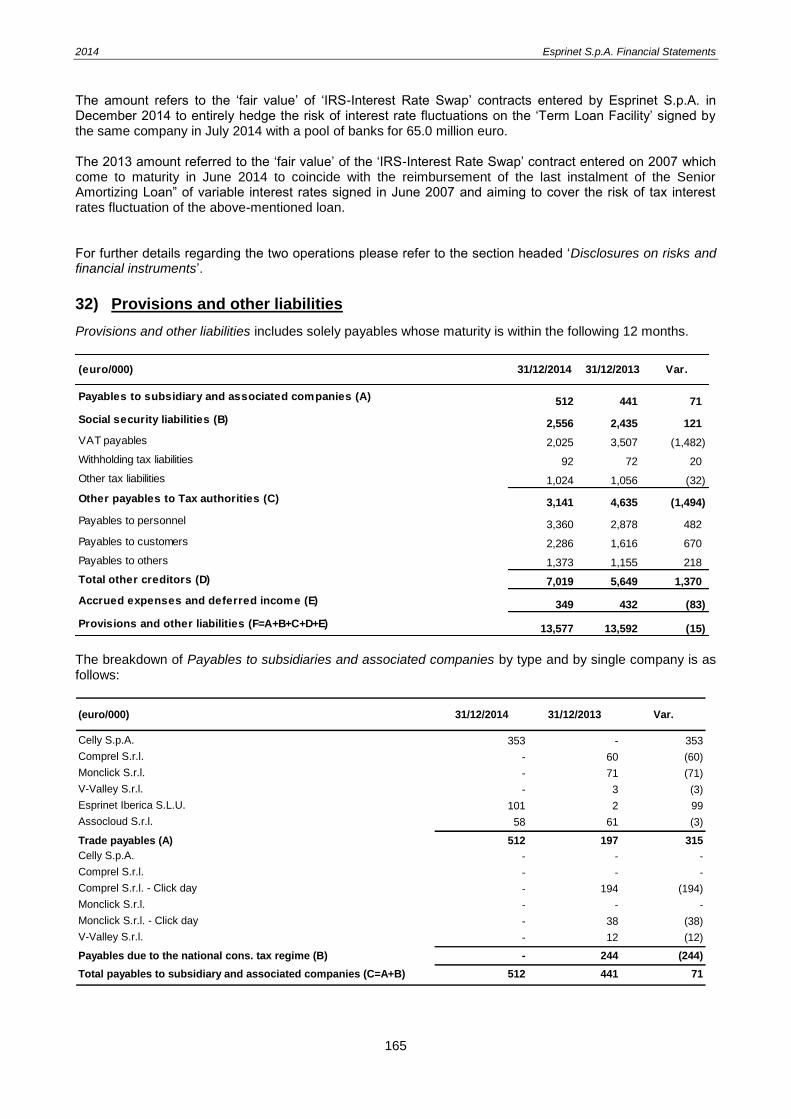
2014 Esprinet S.p.A. Financial Statements
165
The amount refers to the ‘fair value’ of ‘IRS-Interest Rate Swap’ contracts entered by Esprinet S.p.A. in December 2014 to entirely hedge the risk of interest rate fluctuations on the ‘Term Loan Facility’ signed by the same company in July 2014 with a pool of banks for 65.0 million euro. The 2013 amount referred to the ‘fair value’ of the ‘IRS-Interest Rate Swap’ contract entered on 2007 which come to maturity in June 2014 to coincide with the reimbursement of the last instalment of the Senior Amortizing Loan” of variable interest rates signed in June 2007 and aiming to cover the risk of tax interest rates fluctuation of the above-mentioned loan. For further details regarding the two operations please refer to the section headed ‘Disclosures on risks and financial instruments’.
32) Provisions and other liabilities
Provisions and other liabilities includes solely payables whose maturity is within the following 12 months.
The breakdown of Payables to subsidiaries and associated companies by type and by single company is as follows:
(euro/000) 31/12/2014 31/12/2013 Var.
Celly S.p.A. 353 - 353
Comprel S.r.l. - 60 (60)
Monclick S.r.l. - 71 (71)
V-Valley S.r.l. - 3 (3)
Esprinet Iberica S.L.U. 101 2 99
Assocloud S.r.l. 58 61 (3)
Trade payables (A) 512 197 315
Celly S.p.A. - - -
Comprel S.r.l. - - -
Comprel S.r.l. - Click day - 194 (194)
Monclick S.r.l. - - -
Monclick S.r.l. - Click day - 38 (38)
V-Valley S.r.l. - 12 (12)
Payables due to the national cons. tax regime (B) - 244 (244)
Total payables to subsidiary and associated companies (C=A+B) 512 441 71
(euro/000) 31/12/2014 31/12/2013 Var.
Payables to subsidiary and associated companies (A) 512 441 71
Social security liabilities (B) 2,556 2,435 121
VAT payables 2,025 3,507 (1,482)
Withholding tax liabilities 92 72 20
Other tax liabilities 1,024 1,056 (32)
Other payables to Tax authorities (C) 3,141 4,635 (1,494)
Payables to personnel 3,360 2,878 482
Payables to customers 2,286 1,616 670
Payables to others 1,373 1,155 218
Total other creditors (D) 7,019 5,649 1,370
Accrued expenses and deferred income (E) 349 432 (83)
Provisions and other liabilities (F=A+B+C+D+E) 13,577 13,592 (15)

2014 Esprinet S.p.A. Financial Statements
166
(euro/000) 31/12/2014 31/12/2013 Var.
Celly S.p.A. 353 - 353
Monclick S.r.l. - 109 (109)
V-Valley S.r.l. - 15 (15)
Comprel S.r.l. - 254 (254)
Esprinet Iberica S.L.U. 101 2 99
Assocloud S.r.l. 58 61 (3)
Total payables to subsidiary and associated companies 512 441 71
Social security liabilities mainly refer to payables to Welfare Institutions linked to wages and salaries paid in December and to social contributions accrued on deferred monthly payables, monetary incentives included. Vat payables refer to the VAT matured during December 2014, after advance payments effected compared to a positive position in the previous year. Other tax liabilities are mainly taxes withheld by the Company from employees’ income of December and from fees to consultants. Payables to customers refer to credit notes not yet paid relating to current trading relationships. Payables to personnel refer to deferred monthly payables (holidays not taken, year-end bonus, summer salary, monetary incentives included) accrued at the end of the year. Payables to others include payables amounting to 1.0 million euro to Directors for fees accrued and unpaid relating to the year (0.8 million in 2013), as well as payables of 0.3 million euro to the Company’s agents’ network relating to commissions due and payable. Accrued expenses and deferred income are, respectively, charges/income whose accrual date is anticipated/deferred compared with the cash expenditure/collection.
4. Guarantees, commitments and potential risks
Commitments and potential risks
(euro/000) 31/12/2014 31/12/2013 Var.
Third-party assets on consignment to the Company 5,755 7,130 (1,375)
Real securities - 69,209 (69,209)
Bank guarantees issued in favour of subsidiaries 121,306 234,826 (113,520)
Bank guarantees issued in favour of other companies 17,676 16,359 1,317
Total guarantees issued 144,737 327,524 (182,787)
Third-party assets on consignment to the Company
It refers to the value of goods owned by third parties deposited at the Esprinet S.p.A. warehouses.
Real securities
As at 31 December 2013 Real securities referred to a pledge on all Esprinet Iberica S.L.U. capital quotas in favour of Intesa Sanpaolo for loans valued according to the Esprinet Iberica consolidated net equity as per IFRSs at 31 December 2013. The change occurred in the year is due to the complete reimbursement of the loan subject to the pledge. Bank guarantees issued for the benefit of subsidiaries
The amount refers to letters of credit or comfort letters issued in favour of some banks and factor companies as guarantee for credit limits granted to Esprinet’ subsidiaries as well as guarantees to some suppliers in the

2014 Esprinet S.p.A. Financial Statements
167
interest of Esprinet Iberica. The change compared to the previous year refers mainly to the termination of the guarantee on the behalf of Esprinet Iberica for the loan granted to the latter.
Bank guarantees issued in favour of other companies
The amount mainly refers to bank guarantees issued for deposits in relation to property lease agreements entered into in Italy, and bank and insurance suretyships issued to the Public Administration in order to participate in tenders for services or supplies. 5. Notes to the income statement items
In order to complete this section, please consider that other analysis on Esprinet S.p.A. economic results have been provided in the Directors’ report on operations, after tables on Group results.
33) Sales
The following are some breakdowns of sales performance. Sales by product family and by customer type has been moved to Directors’ report on operations.
Sales from products and services
Sales by geographical segment
(euro/million) 2014 % 2013 % Var. % Var.
Italy 1,665.1 97.1% 1,493.3 96.8% 171.8 12%
Other EU countries 47.6 2.8% 46.2 3.0% 1.4 3%
Extra EU countries 3.0 0.2% 3.2 0.2% (0.2) -8%
Sales 1,715.6 100.0% 1,542.7 100.0% 172.9 11%
Sales in other E.U. countries mainly refer to sales to the Spanish subsidiary Esprinet Iberica; sales to extra E.U. countries refer almost wholly to sales to clients whose residence is in the San Marino Republic.
35) Gross profit
Gross profit is 107.0 million euro and reflects an increase of +9% compared to 98.3 million euro of previous year as a consequence of higher turnover, only partially counterbalanced by a lower gross profit margin on sales (from 6.37% to 6.24%). As it is prevalent in the sectors where the Company operates, the cost of sales is adjusted downwards to take into account the premiums, premiums/rebates for having achieved targets, development provisions and co-marketing, cash discounts (so-called ‘prompt payment discounts’) and other incentives. This is further reduced by the credit notes issued by vendors in relation to protection agreed for the value of stock. Gross profit is affected by the difference between the amount of trade receivables sold ‘without-recourse’ to factoring companies within the usual revolving programmes and the amounts collected.
%
Var.
Product sales 1,707.5 85.2% 1,533.7 86.0% 173.8 12%
Services Sales 8.1 0.2% 9.0 0.2% (0.9) -10%
Sales 1,715.6 85.4% 1,542.7 86.2% 172.9 12%
(euro/million) % %20132014
%
Var.
Sales 1,715,607 100.00% 1,542,725 100.00% 172,882 11%
Cost of sales 1,608,621 93.76% 1,444,387 93.63% 164,234 11%
Gross profit 106,986 6.24% 98,338 6.37% 8,648 9%
(euro/000) % % Var.2014 2013

2014 Esprinet S.p.A. Financial Statements
168
This is calculated as approx. 1.2 million euro for this operating year (1.1 million euro in 2013).
37-38) Operating costs (SG&A)
2014 operating costs of 74.3 million euro increased by 5% in 2013 while they show a reduction of -0.27% in percentage terms compared to the previous year. The following table gives a detailed breakdown of operating costs and their performance in the two years compared:
Sales and marketing costs mainly include the following: - costs relating to personnel working in the marketing, sales and Web functions, corresponding social
security contributions and accessory charges; - agents and other commercial collaborators; - management cost for the Cash and Carry shops. Overheads and administrative costs include: - costs relating to management and administrative personnel, including the EDP area, human resources,
general services and logistic; - fees paid to corporate bodies and the related charges, travel, board and lodging expenses as well as
remuneration of the stock option plans; - business consultancy, EDP consultancy to develop software and assistance with IT systems and
payments to other consultants and free-lance personnel (for auditing services, real estate, tax, legal and various other consultancy services);
- postal, telephone and telecommunications costs; - depreciation of tangible fixed assets and amortisation of intangible fixed assets (assets relating to logistic
equipment and plants allocated by function to sales costs excluded) and also provisions for risks and write-downs;
- overheads and administrative costs, among which, leasing of premises, utilities, bank charges and commission, insurance, data connections and telephone costs.
%
Var.
Sales 1,715,607 100.00% 1,542,725 100.00% 172,882 11%
Sales and marketing costs 27,329 1.59% 25,965 1.68% 1,364 5%
Overheads and administrative costs 47,017 2.74% 44,999 2.92% 2,018 4%
Operating costs 74,346 4.33% 70,964 4.60% 3,382 5%
- of w hich non recurring 918 0.05% 98 0.01% 820 837%
'Recurring' operating costs 73,428 4.28% 70,866 4.59% 2,562 4%
(euro/000) % %2014 2013 Var.
%
Var.
Sales 1,715,607 1,542,725 172,882 11%
Sales & marketing personnel costs 23,230 1.35% 22,103 1.43% 1,127 5%
Other sales & marketing costs 4,099 0.24% 3,862 0.25% 237 6%
Sales & marketing personnel costs 27,329 1.59% 25,965 1.68% 1,364 5%
Administr., IT, HR and general service personnel costs 15,255 0.89% 14,442 0.94% 813 6%
Directors' compensation 3,887 0.23% 3,849 0.25% 38 1%
Consulting services 2,990 0.17% 3,551 0.23% (561) -16%
Logistics services 11,168 0.65% 10,648 0.69% 520 5%
Amortisation, depreciation and provisions 3,044 0.18% 2,729 0.18% 315 12%
Other overheads and administrative costs 10,673 0.62% 9,780 0.63% 893 9%
Overheads and administrative costs 47,017 2.74% 44,999 2.92% 2,018 4%
Total SG&A 74,346 4.33% 70,964 4.60% 3,382 5%
Var.(euro/000) 2014 % 2013 %
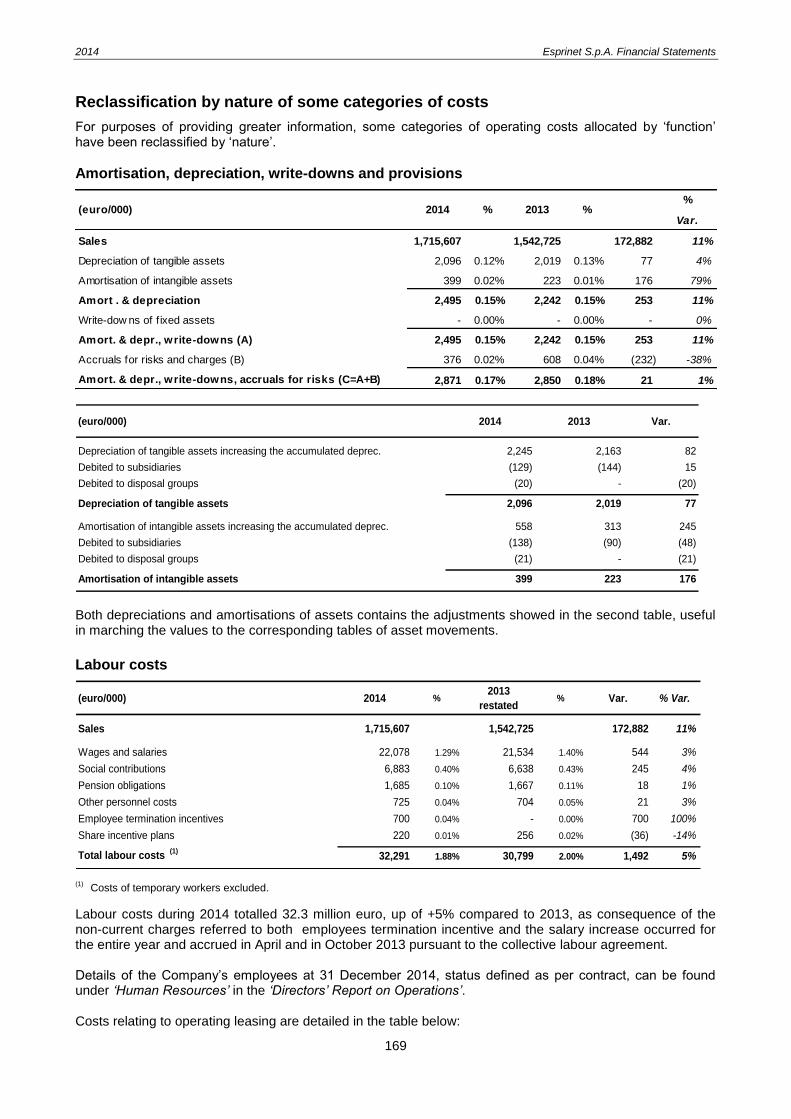
2014 Esprinet S.p.A. Financial Statements
169
Reclassification by nature of some categories of costs
For purposes of providing greater information, some categories of operating costs allocated by ‘function’ have been reclassified by ‘nature’.
Amortisation, depreciation, write-downs and provisions
(euro/000) 2014 2013 Var.
Depreciation of tangible assets increasing the accumulated deprec. 2,245 2,163 82
Debited to subsidiaries (129) (144) 15
Debited to disposal groups (20) - (20)
Depreciation of tangible assets 2,096 2,019 77
Amortisation of intangible assets increasing the accumulated deprec. 558 313 245
Debited to subsidiaries (138) (90) (48)
Debited to disposal groups (21) - (21)
Amortisation of intangible assets 399 223 176
Both depreciations and amortisations of assets contains the adjustments showed in the second table, useful in marching the values to the corresponding tables of asset movements.
Labour costs
(euro/000) 2014 %2013
restated% Var. % Var.
Sales 1,715,607 1,542,725 172,882 11%
Wages and salaries 22,078 1.29% 21,534 1.40% 544 3%
Social contributions 6,883 0.40% 6,638 0.43% 245 4%
Pension obligations 1,685 0.10% 1,667 0.11% 18 1%
Other personnel costs 725 0.04% 704 0.05% 21 3%
Employee termination incentives 700 0.04% - 0.00% 700 100%
Share incentive plans 220 0.01% 256 0.02% (36) -14%
Total labour costs (1)
32,291 1.88% 30,799 2.00% 1,492 5%
(1) Costs of temporary workers excluded.
Labour costs during 2014 totalled 32.3 million euro, up of +5% compared to 2013, as consequence of the non-current charges referred to both employees termination incentive and the salary increase occurred for the entire year and accrued in April and in October 2013 pursuant to the collective labour agreement. Details of the Company’s employees at 31 December 2014, status defined as per contract, can be found under ‘Human Resources’ in the ‘Directors’ Report on Operations’. Costs relating to operating leasing are detailed in the table below:
%
Var.
Sales 1,715,607 ##### 1,542,725 ##### 172,882 11%
Depreciation of tangible assets 2,096 0.12% 2,019 0.13% 77 4%
Amortisation of intangible assets 399 0.02% 223 0.01% 176 79%
Amort . & depreciation 2,495 0.15% 2,242 0.15% 253 11%
Write-dow ns of f ixed assets - 0.00% - 0.00% - 0%
Amort. & depr., write-downs (A) 2,495 0.15% 2,242 0.15% 253 11%
Accruals for risks and charges (B) 376 0.02% 608 0.04% (232) -38%
Amort. & depr., write-downs, accruals for risks (C=A+B) 2,871 0.17% 2,850 0.18% 21 1%
(euro/000) % %2014 2013

2014 Esprinet S.p.A. Financial Statements
170
(euro/000) 2014 % 2013 % Var. % Var.
Sales 1,715,607 1,542,725 172,882 11%
Lease of buildings 6,561 0.38% 6,359 0.41% 202 3%
Lease of cars 780 0.05% 749 0.05% 31 4%
Lease of equipment 52 0.00% 52 0.00% - 0%
Lease of data connection lines 90 0.01% 114 0.01% (24) -21%
Housing CED 149 0.01% 162 0.01% (13) -8%
Leasing costs 7,632 0.44% 7,436 0.48% 196 3%
Commitments for future payments pertaining to leasing rentals and operating leasing are as follows:
(euro/000) 2015 2016 2017 2018 2019 Over Total
Lease of buildings 6,591 6,472 6,053 5,999 5,814 13,729 44,658
Lease of cars 731 488 314 111 2 - 1,646
Lease of equipment 46 42 4 3 - - 96
Lease of data connection lines 90 90 67 - - - 247
Housing CED 148 148 111 - - 407
Leasing costs 7,606 7,240 6,550 6,114 5,816 13,729 47,054
42) Finance costs - net
The negative balance of 0.8 million euro between financial income and charges shows a worsening (-0.6 million euro) compared to the same period of previous year. This is mainly due to the increase in net foreign exchange losses, equal to 1.0 million euro, essentially due to the impact of US dollar strengthening vs euro with reference to the goods purchased in US dollar. Excluding the effects of foreign exchange losses, net finance costs show a negative balance of 0.2 million euro, with a strengthening of 0.4 million euro compared to last year.
%
Var.
Sales 1,715,607 ###### 1,542,725 ###### 172,882 11%
Interest expenses on borrow ings 831 0.05% 491 0.03% 340 69%
Interest expenses to banks 434 0.03% 465 0.03% (31) -7%
Other interest expenses 8 0.00% 2 0.00% 6 165%
Upfront fees amortisation 189 0.01% 52 0.00% 137 266%
IAS 19 expenses/losses 106 0.01% 108 0.01% (2) -1%
Total financial expenses (A) 1,568 0.09% 1,118 0.07% 450 40%
Interest income from banks (703) -0.04% (205) -0.01% (498) 243%
Interest income from others (161) -0.01% (35) 0.00% (126) 354%
Interest incomes from intercompany (819) -0.05% (728) -0.05% (91) 13%
Derivatives ineffectiveness (124) -0.01% (3) 0.00% (121) 4250%
Total financial income(B) (1,807) -0.11% (971) -0.06% (836) 86%
Net financial exp. (C=A+B) (239) -0.01% 147 0.01% (386) -261%
Foreign exchange gains (152) -0.01% (368) -0.02% 216 -59%
Foreign exchange losses 1,210 0.07% 421 0.03% 789 188%
Net foreign exch. (profit)/losses (D) 1,058 0.06% 53 0.00% 1,005 1922%
Net financial (income)/costs (E=C+D) 819 0.05% 200 0.01% 619 309%
(euro/000) % %20142013
restatedVar.

2014 Esprinet S.p.A. Financial Statements
171
This result is due to the 0.2 million euro decrease of net bank interest (-54%) as a consequence of the combined effect of: - a general improvement in the average financial indebtedness position of the Group; - a general decrease in spreads paid compared to the financial market parameters, which were on average
aligned to 2013 levels (with an increasing trend in the first half and a significant decrease in the second half).
The aforesaid increase is also strengthened by the positive effect of ineffective portions of derivatives whose equity reserve was reversed in the profit and loss as a consequence of the respective contract coming to maturity during the year.
45) Income tax expenses
(euro/000) 2014 % 2013 % Var. % Var.
Sales 1,715,607 1,542,725 172,882 11%
Current tax - IRES (Corporation income tax) 8,164 0.48% 7,076 0.46% 1,088 15%
Current tax - IRAP (Regional tax on productive activities) 2,157 0.13% 2,010 0.13% 147 7%
Rainboursement IRES (11) 0.00% (333) -0.02% 322 -97%
Current income taxes 10,310 0.60% 8,753 0.57% 1,557 18%
Deferred tax - IRES (Corporation income tax) (83) 0.00% (37) 0.00% (46) 124%
Deferred tax - IRAP (Regional tax on productive activities) 13 0.00% (12) 0.00% 25 -208%
Deferred income taxes (70) 0.00% (49) 0.00% (21) 43%
Total tax - IRES (Corporation income tax) 8,070 0.47% 6,706 0.43% 1,364 20%
Total tax - IRAP (Regional tax on productive activities) 2,170 0.13% 1,998 0.13% 172 9%
Total taxes 10,240 0.60% 8,704 0.56% 1,536 18%
Income taxes, amounting to 10.2 million euro, grew by +1.5 million euro versus last year. The following table illustrates the reconciliation between the theoretical and the effective tax rate:
(euro/000) 2014 2013
Profit before taxes [A] 45,555 27,174
Operating profit (EBIT) 32,640 27,374
(+) personnel costs (1)
18,028 18,216
(+) bad debt provision 739 586
(+) provision for risks and charges 376 608
Taxable amout for IRAP [B] 51,783 46,784
Theoretical taxation IRES [A*27,5%] 12,528 7,473
Theoretical taxation IRAP [B*3,9%] 2,020 1,825
Total theoretical taxation [C] 14,547 9,297
Theoretical tax rate [C/A] 31.9% 34.2%
(-) tax relief - ACE (Aiuto alla Crescita Economica) (563) (308)
(-) reversal of the investment value in the Iberica subsidiary (3,777) -
(-) right of tax refund (click day) - (92)
(-) non recurring incomes from previous taxes - (333)
(+) non-deductible bad-debts provisions 13 33
Other permanent differences 20 106
Total effective taxation [D] 10,240 8,704
Effective tax rate [D/A] 22.5% 32.0%

2014 Esprinet S.p.A. Financial Statements
172
(1) Staff costs are net of the effect of the ‘tax wedge’ and IRAP (Regional tax on productive activities) deductible costs, totalling 14.0 million euro in 2014
and 12.6 million euro in 2013.
47) Income/(loss) from disposal groups
As at 31 December 2014 this item sums up the gain on disposal of the wholly owned subsidiaries Monclick
S.r.l. and Comprel S.r.l., (disposed on 28 February 2014 and 23 July 2014 respectively) as well as the other
charges occurred referring to the two transactions. The table below summarises the abovementioned results, broken down by disposed investment in subsidiaries.
(euro/000)
Monclick Comprel Total
Subsidiaries value 3,736 500 4,236
Disposal price 4,000 5,900 9,900
Gain / (loss) 264 5,400 5,664
Selling costs (34) (1,288) (1,322)
Income taxes on gain/(loss) from disposal groups (4) (56) (60)
Income/(loss) from disposal group 226 4,056 4,282
2014
For further details with reference to the two extraordinary transactions please refer to the paragraph “Disposed or disposal groups” in the “Director’s Report on Operations”.
6. Other significant information
6.1 Emoluments paid to the board members, statutory auditors and key managers
Disclosure in accordance with CONSOB Resolution 11971 dated 14 May 1999 and in compliance with the following amendments introduced with resolution 15520 dated 27 July 2006, regarding the emoluments of directors, statutory auditors of Esprinet S.p.A. and ‘Key Managers’, payable to them in respect of the positions held by them in the company during the year can be found in the paragraph of the same name in the ‘Notes to the consolidated financial statements’.
6.2 Net financial indebtedness and financial liabilities analysis
Pursuant to Consob Communication No. DEM/6064293 of 28 July 2006, the net financial indebtedness (or ‘net financial position’ also) is substantially calculated in compliance with the criteria specified in the CESR or Committee of European Securities Regulators recommendation of 10 February 2005: ‘CESR’s recommendations for the consistent implementation of the European Commission’s Regulation on Prospectuses nº 809/2004’ and referred to by Consob itself.
%
Var.
Sales 1,715,607 1,542,725 172,882 11%
Income/(loss) from disposal group 4,282 - 4,282 N.S.
2014 2013 Var.(euro/000)

2014 Esprinet S.p.A. Financial Statements
173
With reference to the previous table, it should be underlined that the net financial indebtedness measured according to the CESR criteria coincides with the notion of ‘net financial debt’ as explained under the paragraph ‘Cash flow analysis’. The Company’s net financial debt, showing a surplus of 139.7 million euro, results from the balance between gross financial debt of 81.4 million euro, financial liabilities for derivatives of 0.2 million euro, financial receivables from factoring companies of 0.7 million euro, financial receivables from Group companies of 40.0 million euro, customers financial receivables of 3.6 million euro and cash and cash equivalents of 177.0 million euro. Cash and cash equivalents, mainly made up of bank deposits and not tied-up, are of a partially transitory nature, accumulating at the end of the month, due to the Company’s peculiar kind of payment/encashment cycle. This cycle is characterised by the concentration of payments received from customers and from factoring companies – the latter as consequence of the ‘without-recourse’ sale of trade account receivables - at the end and middle of each month, while the maturities of payments to suppliers are distributed more evenly over the month. For this reason, the figure resulting at 31 December 2014, or at the end of each month, is not totally representative of the average net financial indebtedness or the average level of cash on hand customarily observable during the same period.
A. Bank deposits and cash on hand 177,048 115,019
B. Cheques - -
C. Trading securities - -
D. Liquidity (A+B+C) 177,048 115,019
Customer financial receivables 506 572
Financial receivables from factoring companies 689 2,721
Financial receivables from Group companies 40,000 40,000
E. Current f inancial receivables 41,195 43,293
F. Current bank debt 2,822 2,387
G. Current portion of non current debt 350 4,965
H. Other current f inancial debt and financial liability for derivatives 10,777 17,225
I. Current f inancial debt (F+G+H) 13,949 24,577
J. Net current financial indebtedness (I-E-D) (204,294) (133,735)
K. Non-current bank loans 67,556 3,356
L. Customers f inancial receivables (3,085) (3,457)
M. Non-current f inancial liabilities for derivatives 128 -
N. Non-current financial indebtedness (K+L+M) 64,599 (101)
O. Net financial indebtedness (J+N) (139,694) (133,837)
Breakdown of net financial indebtedness:
Short-term financial liabilities 13,898 24,507
Current f inancial (assets)/liabilities for derivatives 51 69
Customers f inancial receivables (506) (572)
Financial receivables from factoring companies (689) (2,721)
Financial receivables/liabilities from/to Group companies (40,000) (40,000)
Cash and cash equivalents (177,048) (115,019)
Net current financial debt (204,294) (133,736)
Non-current f inancial (assets)/liabilities for derivatives 128 -
Customers f inancial receivables (3,085) (3,457)
Borrow ings 67,556 3,356
Net financial debt (139,694) (133,837)
(euro/000) 31/12/2014 31/12/2013

2014 Esprinet S.p.A. Financial Statements
174
The without-recourse sale of account receivables revolving programme focussing on the large-scale distribution sector in particular, continued during 2014 as part of the processes aimed at the structural optimisation of the management of working capital. The aforementioned programmes completely transfer the risks and benefits to the assignees so that receivables in question are removed from assets as per IAS 39. The overall effect on the levels of financial debt as at 31 December 2014 can be quantified as approx. 68 million euro (approx. 66 million euro as at 31 December 2013). Details of the current portion of medium-/long-term financial debt and the portion falling due beyond the following year are illustrated below. It has to be noted that amounts can differ from the book value of loan principal since they represent the amortised cost calculated on the basis of the real interest rate.
(euro/000) 31/12/14 31/12/13 Var.
Curr. Non-curr. Tot. Curr. Non-curr. Tot. Curr. Non-curr. Tot.
Pool loan (ag. Intesa Sanpaolo) - - - 4,965 - 4,965 (4,965) - (4,965)
Pool loan (ag. Banca IMI) - 64,550 64,550 - - - - 64,550 64,550
Intesa Sanpaolo (GdF loan) 350 3,006 3,356 - 3,356 3,356 350 (350) -
Total loan 350 67,556 67,906 4,965 3,356 8,321 (4,615) 64,200 59,585
6.3 Loans and loan covenants
The book value of loan principal of the loans granted to the Company is as follows:
(euro/000) 31/12/14 31/12/13 Var.
- 5,000 (5,000)
3,590 3,961 (371)
65,000 - 65,000
Total book value of loan principal 68,590 8,961 59,629
Unsecured pool loan (agent: Intesa Sanpaolo) to Esprinet S.p.A. repayable in 1 six-
monthly instalments by June 2014
Unsecured pool loan (agent: Banca IMI) to Esprinet S.p.A. repayable in 1 six-
monthly instalments by July 2019
Pool loan 'GdF' (agent: Intesa Sanpaolo) to Esprinet S.p.A. repayable in 9 yearly
instalments by January 2022
The weighted average rate used during 2014 on the above loans was approx. 1.4% (approx. 3.9% in the previous year). The loan agreement with a book value of loan principal amounting to 65.0 million euro is a Term Loan Facility entered with a pool of banks, received in August 2014 and expiring within July 2019. Such loan is subject to the observance of covenants, the failure to observe of which allow the issuing institutes to claim its immediate reimbursement. These covenants, which are subject to 6-monthly checks against the audited and consolidated financial statements, are as follows: iv) ratio between ‘extended net financial indebtedness’ and EBITDA; v) ratio between EBITDA and net financial charges; vi) amount of ‘extended net financial indebtedness’; where ‘extended net financial indebtedness’ is the net financial indebtedness as measured in the previous paragraph Net financial indebtedness and financial liabilities analysis gross of non-current customers financial receivables and of the impact of prepayments received from factoring companies within the ‘without recourse’ sale of account receivables programs or from other financial counterparts within account receivables securitisations. Apart the aforementioned Term Loan Facility, also a not yet used Revolving Facility, entered in the same date, with a maximum loan principal and a maturity equal to those agreed for the Term Loan Facility, is subject to the observance of the above said covenants. Main purpose of the Revolving Facility and of the Term Loan Facility is to support Group’s financial needs by maintaining an adequate degree of stability and flexibility of the financial structure.
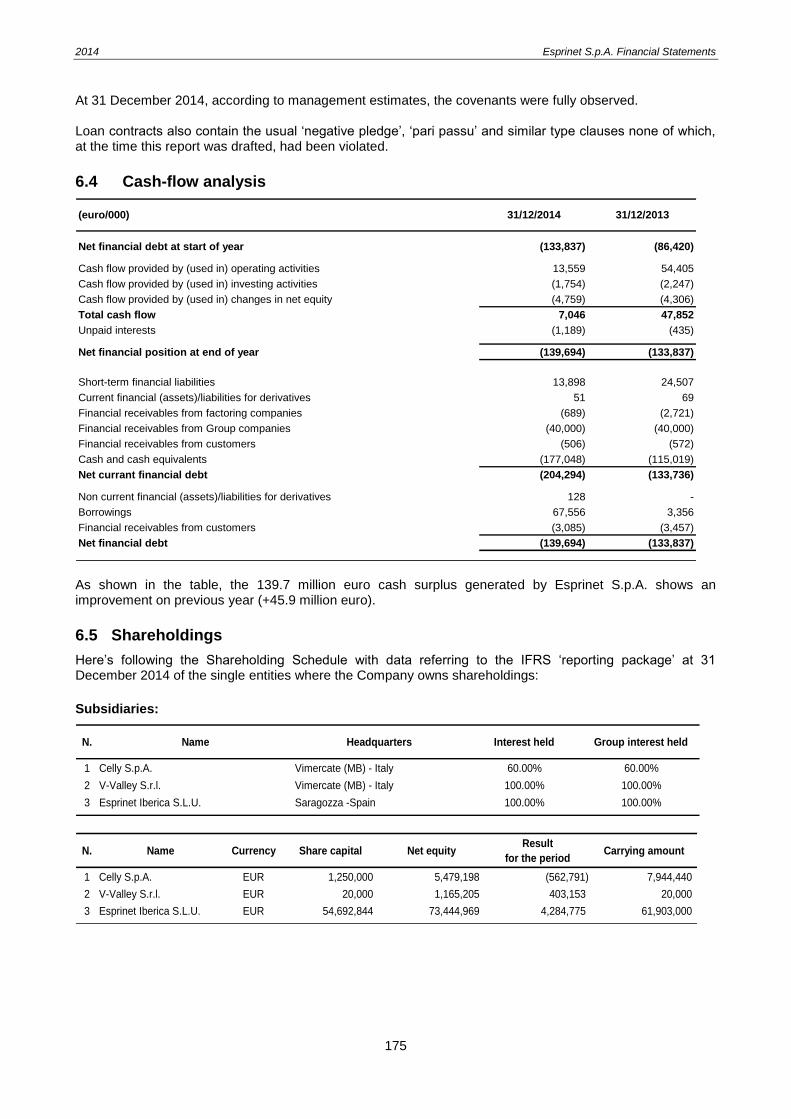
2014 Esprinet S.p.A. Financial Statements
175
At 31 December 2014, according to management estimates, the covenants were fully observed. Loan contracts also contain the usual ‘negative pledge’, ‘pari passu’ and similar type clauses none of which, at the time this report was drafted, had been violated.
6.4 Cash-flow analysis
(euro/000) 31/12/2014 31/12/2013
Net financial debt at start of year (133,837) (86,420)
Cash flow provided by (used in) operating activities 13,559 54,405
Cash flow provided by (used in) investing activities (1,754) (2,247)
Cash flow provided by (used in) changes in net equity (4,759) (4,306)
Total cash flow 7,046 47,852
Unpaid interests (1,189) (435)
Net financial position at end of year (139,694) (133,837)
Short-term financial liabilities 13,898 24,507
Current financial (assets)/liabilities for derivatives 51 69
Financial receivables from factoring companies (689) (2,721)
Financial receivables from Group companies (40,000) (40,000)
Financial receivables from customers (506) (572)
Cash and cash equivalents (177,048) (115,019)
Net currant financial debt (204,294) (133,736)
Non current financial (assets)/liabilities for derivatives 128 -
Borrowings 67,556 3,356
Financial receivables from customers (3,085) (3,457)
Net financial debt (139,694) (133,837)
As shown in the table, the 139.7 million euro cash surplus generated by Esprinet S.p.A. shows an improvement on previous year (+45.9 million euro).
6.5 Shareholdings
Here’s following the Shareholding Schedule with data referring to the IFRS ‘reporting package’ at 31 December 2014 of the single entities where the Company owns shareholdings:
Subsidiaries:
N. Name Headquarters Interest held Group interest held
1 Celly S.p.A. Vimercate (MB) - Italy 60.00% 60.00%
2 V-Valley S.r.l. Vimercate (MB) - Italy 100.00% 100.00%
3 Esprinet Iberica S.L.U. Saragozza -Spain 100.00% 100.00%
N. Name Currency Share capital Net equityResult
for the periodCarrying amount
1 Celly S.p.A. EUR 1,250,000 5,479,198 (562,791) 7,944,440
2 V-Valley S.r.l. EUR 20,000 1,165,205 403,153 20,000
3 Esprinet Iberica S.L.U. EUR 54,692,844 73,444,969 4,284,775 61,903,000
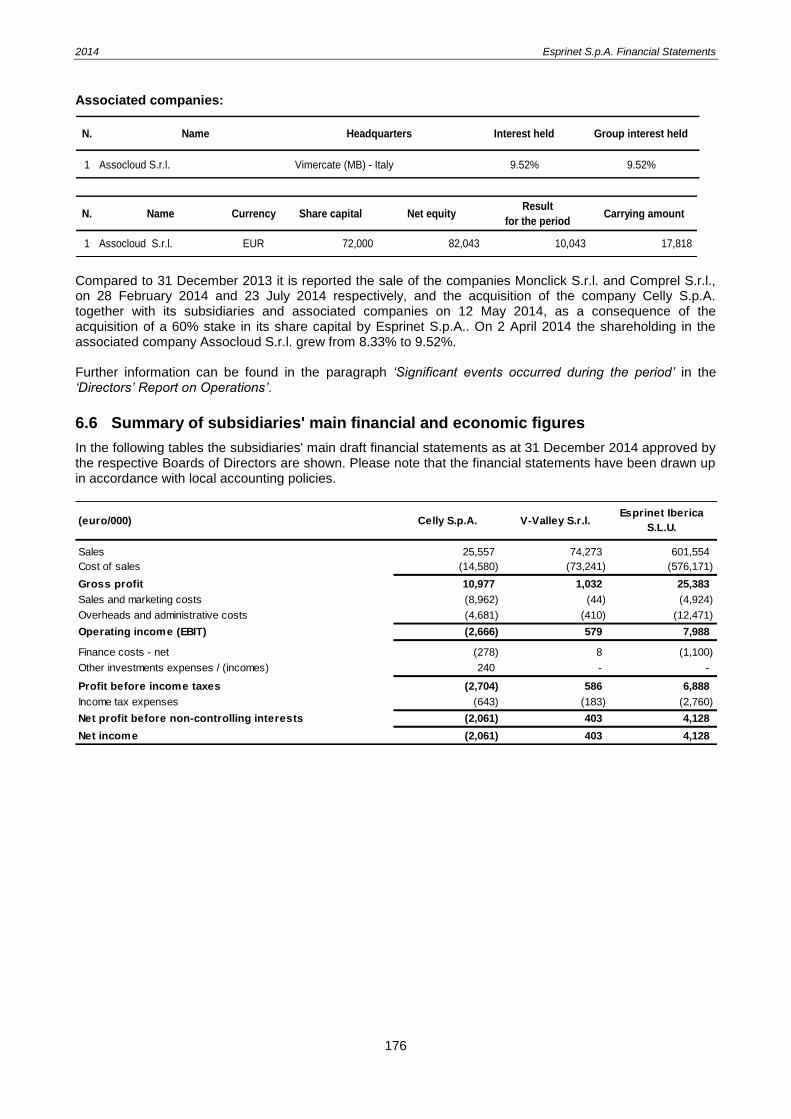
2014 Esprinet S.p.A. Financial Statements
176
Associated companies:
N. Name Headquarters Interest held Group interest held
1 Assocloud S.r.l. Vimercate (MB) - Italy 9.52% 9.52%
N. Name Currency Share capital Net equityResult
for the periodCarrying amount
1 Assocloud S.r.l. EUR 72,000 82,043 10,043 17,818
Compared to 31 December 2013 it is reported the sale of the companies Monclick S.r.l. and Comprel S.r.l., on 28 February 2014 and 23 July 2014 respectively, and the acquisition of the company Celly S.p.A. together with its subsidiaries and associated companies on 12 May 2014, as a consequence of the acquisition of a 60% stake in its share capital by Esprinet S.p.A.. On 2 April 2014 the shareholding in the associated company Assocloud S.r.l. grew from 8.33% to 9.52%. Further information can be found in the paragraph ‘Significant events occurred during the period’ in the ‘Directors’ Report on Operations’.
6.6 Summary of subsidiaries' main financial and economic figures
In the following tables the subsidiaries' main draft financial statements as at 31 December 2014 approved by the respective Boards of Directors are shown. Please note that the financial statements have been drawn up in accordance with local accounting policies.
Sales 25,557 74,273 601,554
Cost of sales (14,580) (73,241) (576,171)
Gross profit 10,977 1,032 25,383
Sales and marketing costs (8,962) (44) (4,924)
Overheads and administrative costs (4,681) (410) (12,471)
Operating income (EBIT) (2,666) 579 7,988
Finance costs - net (278) 8 (1,100)
Other investments expenses / (incomes) 240 - -
Profit before income taxes (2,704) 586 6,888
Income tax expenses (643) (183) (2,760)
Net profit before non-controlling interests (2,061) 403 4,128
Net income (2,061) 403 4,128
V-Valley S.r.l.(euro/000) Celly S.p.A.Esprinet Iberica
S.L.U.

2014 Esprinet S.p.A. Financial Statements
177
6.7 Relationships with related parties
In next paragraphs balances of the statement of financial position and of the separate income statement deriving from operations with related parties (as defined by IAS 24), except for relationships with members of the key management that are detailed in the paragraph with the same name are summarised and explained.
6.7.1 Intercompany costs and revenues
Details of revenues and costs recorded by Esprinet S.p.A. in relation to the companies belonging to the Group are as follows:
(euro/000) Celly S.p.A. V-Valley S.r.l.Esprinet Iberica
S.L.U.
ASSETS
Non-current assets
Property, plant and equipment 936 - 1,080
Goodw ill 104 - 58,561
Intangible assets 412 - 77
Investments in associates 9 - -
Investments in others 19 - -
Deferred income tax assets 765 18 5,850
Receivables and other non-current assets 107 - 197
2,352 18 65,765
Current assets
Inventory 6,351 - 58,127
Trade receivables 9,415 21,559 74,883
Income tax assets 462 - -
Other assets 1,473 464 398
Cash and cash equivalents 360 2,415 44,980
18,061 24,438 178,388
Total assets 20,413 24,456 244,153
EQUITY
Share capital 1,250 20 55,203
Reserves 6,040 742 13,953
Net income for the period (2,061) 403 4,127
Total equity 5,229 1,165 73,283
LIABILITIES
Non-current liabilities
Borrow ings 863 - -
Derivative f inancial liabilities - - -
Deferred income tax liabilities - 1 2,035
Retirement benefit obligations 452 - -
Provisions and other liabilities 603 - 387
1,918 1 2,422
Current liabilities
Trade payables 5,086 51 109,474
Short-term financial liabilities 6,003 509 40,376
Income tax liabilities - 5 250
Derivative f inancial liabilities - - -
Provisions and other liabilities 2,177 22,725 18,348
13,266 23,290 168,448
Total liabilities 15,184 23,291 170,870
Total equity and liabilities 20,413 24,456 244,153

2014 Esprinet S.p.A. Financial Statements
178
2014 2013
Type Sales Costs Sales Costs
Sales
Comprel S.r.l. Sale of goods 108 - 173 -
Monclick S.r.l. Sale of goods 5,604 - 88,872 -
Esprinet Iberica S.L.U. Sale of goods 43,661 - 44,452 -
Celly S.p.A. Sale of goods 1,264 - - -
Subtotal 50,637 - 133,497 -
Cost of sales
Comprel S.r.l. Service costs - (11) - (22)
Comprel S.r.l. Purchase of goods - 169 - 350
Monclick S.r.l. Services/rebates costs - - - (3)
Monclick S.r.l. Purchase of goods - - - 727
V-Valley S.r.l. Service costs - 23 - (9)
Esprinet Iberica S.L.U. Service costs - 3 - 7
Esprinet Iberica S.L.U. Purchase of goods - 270 - 175
Celly S.p.A. Service costs - (3) - -
Celly S.p.A. Purchase of goods - 493 - -
Subtotal - 944 - 1,225
Sales and marketing costs
Comprel S.r.l. Labour costs - (7) - (41)
Monclick S.r.l. Marketing costs - - - 7
V-Valley S.r.l. Fees on sales - 1,098 - 1,008
V-Valley S.r.l. Labour costs - (39) - (51)
V-Valley S.r.l. Marketing costs - (5) - (5)
Esprinet Iberica S.L.U. Marketing costs - 71 - (17)
Esprinet Iberica S.L.U. Labour costs - (345) - (456)
Subtotal - 773 - 445
Overheads and administrative costs
Comprel S.r.l. Lease - premises - - - (69)
Comprel S.r.l. Directors' costs - (101) - (205)
Comprel S.r.l. Administrative services - (226) - (515)
Monclick S.r.l. Administrative services - (75) - (425)
V-Valley S.r.l. Administrative services - (134) - (126)
Esprinet Iberica S.L.U. Lease - equipment - (111) - (65)
Esprinet Iberica S.L.U. Administrative services - (767) - (761)
Celly S.p.A. Administrative services - (102) - -
Subtotal - (1,516) - (2,166)
Finance costs - net
Esprinet Iberica S.L.U. Interest income 819 - 728 -
Subtotal 819 - 728 -
Total 51,456 201 134,225 (496)
(euro/000)
Relationships with associated companies
The relationships with the associated company Assocloud S.r.l. are shown in the table below.
2014 2013
Type Sales Costs Receiv. Payab. Sales Costs Receiv. Payab.
Sales
Assocloud S.rl. Sales from services 508 - 569 - 174 - 275 -
Assocloud S.rl. Lease payment - 98 - 2 - 46 - 52
Assocloud S.rl. Purchase of goods - 34 - 56 - 7 - 9
Assocloud S.rl. Consulting - - - - - 8 - -
Total 508 132 569 58 174 61 275 61
(euro/000)
2014 Esprinet S.p.A. Financial Statements
179
During the year Esprinet S.p.A. had no relationships with subsidiaries or associated companies outside the consolidation perimeter. 6.7.2 Relationships with subsidiaries
The following is a summary of the Esprinet S.p.A.’s relationships with its subsidiaries. Intercompany receivables and payables have been detailed in the ‘Notes to the statement of financial position items’ whereas intercompany costs and revenues have been detailed in the previous paragraph. Please note that the relationships between Esprinet S.p.A. and its subsidiaries have been conducted in accordance with market conditions. Relationships with subsidiaries subject to management and coordination activities
Esprinet S.p.A. manages and co-ordinates activities of the subsidiaries resident in Italy. This activity consists in setting general and operational strategic policies for the Group, drafting general policies regarding human and financial resources management, defining and adapting:
- the corporate governance and internal control model; - the Group Organisational Model pursuant to Legislative Decree 231/01; - the System Security Planning Paper (SSPP) pursuant to Legislative Decree 196/2003; - the Code of Ethics; - administrative-accounting procedures regarding financial reports.
Group co-ordination especially involves the centralised management of administrative, corporate and cash services which, in addition to enabling the subsidiary companies to achieve economies of scale, also enable them to focus their internal resources on managing the core business. National consolidated tax regime – Subgroup Italy
In June 2011 Esprinet S.p.A. and its subsidiaries Comprel S.r.l., Monclick S.r.l. renewed for the triennium 2011-2013 their option for the tax regime as established in the ‘National consolidated tax regime’, as per Article 117 and followings of Presidential Decree 917/86 (TUIR - Italian Income Tax Code). In 2013 V-Valley renewed for the triennium 2013-2015 its option for the ‘National consolidated tax regime’ with Esprinet. S.p.A.. The economic ratios, as well as the responsibilities and mutual obligations, between the consolidating company and the aforementioned subsidiaries are defined in the ‘Consolidation regulations governing Esprinet Group member companies’. Tax liabilities are usually reported under the item ‘Current income tax liabilities’, net of advances and the withholding taxes paid and tax credits, in general. The current Corporate Income Tax (IRES) is also reported under ‘Current income tax liabilities’ calculated by using estimates of positive and negative taxable amounts of the subsidiary companies which have accepted the National consolidated tax regime, net of advances and withholding taxes paid and the accruing tax credits of the companies in question; the corresponding receivables of the consolidating company referring to Group member companies and regarding the current tax corresponding to the positive taxable amounts transferred in the framework of the National consolidated tax regime, represent the balancing item of the tax liabilities reported. Payables for compensations due to subsidiaries with negative taxable amounts are reported under the item ‘Payables to subsidiaries and associated companies’. The deferred and prepaid Corporate Income Tax (IRES) is calculated on the temporary differences between the values of assets and liabilities determined in accordance with the requirements of the Italian civil code and the corresponding tax values referring exclusively to the single companies. The current, deferred and pre-paid Regional Business Tax (IRAP) is determined exclusively in the case of single companies.
Celly S.p.A.
During 2014, since its entry in the consolidation area, Celly S.p.A. purchased products from Parent Company totalling 0.5 million euro and also sold products to it totalling 1.3 million euro. Celly S.p.A. moreover paid a fee of approx.. 0.1 million euro to Esprinet S.p.A. mainly for the use of premises.

2014 Esprinet S.p.A. Financial Statements
180
V-Valley S.r.l.
As a result of the contract for commission signed on 20 October 2010, V-Valley concluded purchase agreements with its own business name, but on behalf of Esprinet S.p.A.. The total amount of the agreements signed was 73.2 million euro (67.2 million euro in 2013), maturing 1.1 million euro in commission on sales (1.0 million euro in 2013).
Moreover, on the basis of a ‘service agreement’ signed between Esprinet S.p.A. and V-Valley, the latter paid a fee of 0.2 million euro to the parent company in 2014 for the hiring of equipment, the debiting of general expenses, telephone charges, IT costs and expenses for the maintenance and management of its ledgers, books and registers, as well as for administrative activities related to its business purpose. In 2010 Esprinet S.p.A. gave V-Valley a warranty grant of 1 million euro (at Intesa San Paolo and still current in 2014), by which Esprinet S.p.A. stands guarantee in favour of the company’s use of the same. Likewise in 2011 Esprinet S.p.A. gave V-Valley a warranty grant today amounting to 20 million euro (at Aosta Factor and still current in 2014), by which Esprinet stands guarantee in favour of the company’s use of the same. Esprinet Iberica S.L.U.
During the year Esprinet Iberica purchased goods from Esprinet S.p.A. totalling 43.7 million euro and also sold products to Esprinet S.p.A. totalling 0.3 million euro. Esprinet Iberica also paid approx. 1.2 million euro according to a service agreement to lease equipment, for the use of data lines and administrative services, and loan interests of about 0.8 million euro.
6.7.3 Relationships with ‘other related parties’
The following table details operations occurred between Esprinet S.p.A. and the companies where its directors and shareholders play important roles.
2014 2013
Type Sales Costs Receiv. Payab. Sales Costs Receiv. Payab.
Sales
Infoklix S.r.l. In liquidation Sales of goods - - 2 - - - 2 -
Key managers and relatives Sales of goods 13 - 2 - 10 - 3 -
Subtotal 13 - 4 - 10 - 5 -
Overheads and administrative costs
Immobiliare Selene S.r.l. Lease - premises - 1,455 - - - 1,448 - -
M.B. Immobiliare S.r.l. Lease - premises - 1,910 - - - 1,901 - -
Immobiliare Dea 81 S.p.A. Lease - premises - - - - - 16 - -
Immobiliare Dea 81 S.p.A. Overheads - - - - 1 -
Immobiliare Selene S.r.l. Overheads - 9 - - - 7 - -
M.B. Immobiliare S.r.l. Overheads - 10 - - - 11 - -
Immobiliare Selene S.r.l. Deposits - - 717 - - - 717 -
M.B. Immobiliare S.r.l. Deposits - - 471 - - - 471 -
Subtotal - 3,384 1,188 - - 3,384 1,188 -
Finance costs-net
Immobiliare Selene S.r.l. Interest on deposits 7 - 7 - 18 - 18 -
M.B. Immobiliare S.r.l. Interest on deposits 5 - 5 - 12 - 12 -
Subtotal 12 - 12 - 30 - 30 -
Total 25 3,384 1,204 - 40 3,384 1,223 -
(euro/000)
Sales concern consumer electronics products sold at normal market conditions to, mainly, key managers and their parents. Services received mainly refer to leasing agreements entered into at market conditions in previous years with the real estate companies, Immobiliare Selene S.r.l. in the case of the Cambiago (MI) logistics site and M.B. Immobiliare S.r.l. in the case of the Cavenago (MB) logistics site, respectively.

2014 Esprinet S.p.A. Financial Statements
181
As shown in the previous table, the total value of the aforementioned transactions is not material compared with the total volume of the Company’s activities, however.
6.8 Non-recurring significant events and operations
In 2014 employee termination indemnities (equal to 700 thousand euro) and estimated transaction costs on Celly’s acquisition (equal to 218 thousand euro) were identified as non-recurring items. In 2013 no ‘non-recurring significant events’ were posted. The following table shows effects of the above said events and operations on the income statement (included the related fiscal effects):
(euro/000) Type 2014 2013 Var.
Sales - - -
Cost of sales - - -
Gross profit - - -
Overheads and administrative costs Transaction costs on Celly's acquisition (218) - (218)
Overheads and administrative costs Employee termination incentives (700) - (700)
Total SG&A (918) - (918)
Operating income (EBIT) (918) - (918)
Finance costs - net - - -
Other investments expenses / (incomes)Reversal of the investment value in the
Iberica Subsidiary 13,734 - 13,734
Profit before income taxes 12,816 - 12,816
Income tax expenses - - -
Income tax expenses Non-recurring events impact 261 - 261
Profit for the period 13,077 - 13,077
Non - controlling interest - - -
Net income / (loss) 13,077 - 13,077
6.9 Main disputes pending
Developments in existing legal and tax-related disputes can be found in a similar section under the comment to the consolidated statement of financial position item ‘Non-current provisions and other liabilities’ in the ‘Notes to the consolidated financial statements’. Similarly, the ‘Directors’ Report on Operations’ also contains the Group’s policies regarding the management of legal and tax-related disputes under ‘Main risks and uncertainties facing the Group and Esprinet S.p.A.’.
6.10 Disclosures on risks and financial instruments
6.10.1 Definition of risks
The international accounting principle IFRS 7 requires entities to provide disclosures in their financial statements that enable users to evaluate: - the significance of financial instruments for the entity’s financial position and performances;
- the nature and extent of risks arising from financial instruments to which the entity is exposed during the year and at the reporting date, and how the entity managed those risks.
Disclosure regarding financial risks able to influence the Esprinet S,p.A.’s asset structure, performance and cash flows can be found under ‘Main risks and uncertainties facing the Group and Esprinet S.p.A.’ in the ‘Directors’ Report on Operations’. Similarly, accounting principles regarding financial instruments used in preparing the Esprinet S.p.A. financial statements can be found in the section ‘Accounting principles and valuation criteria’.
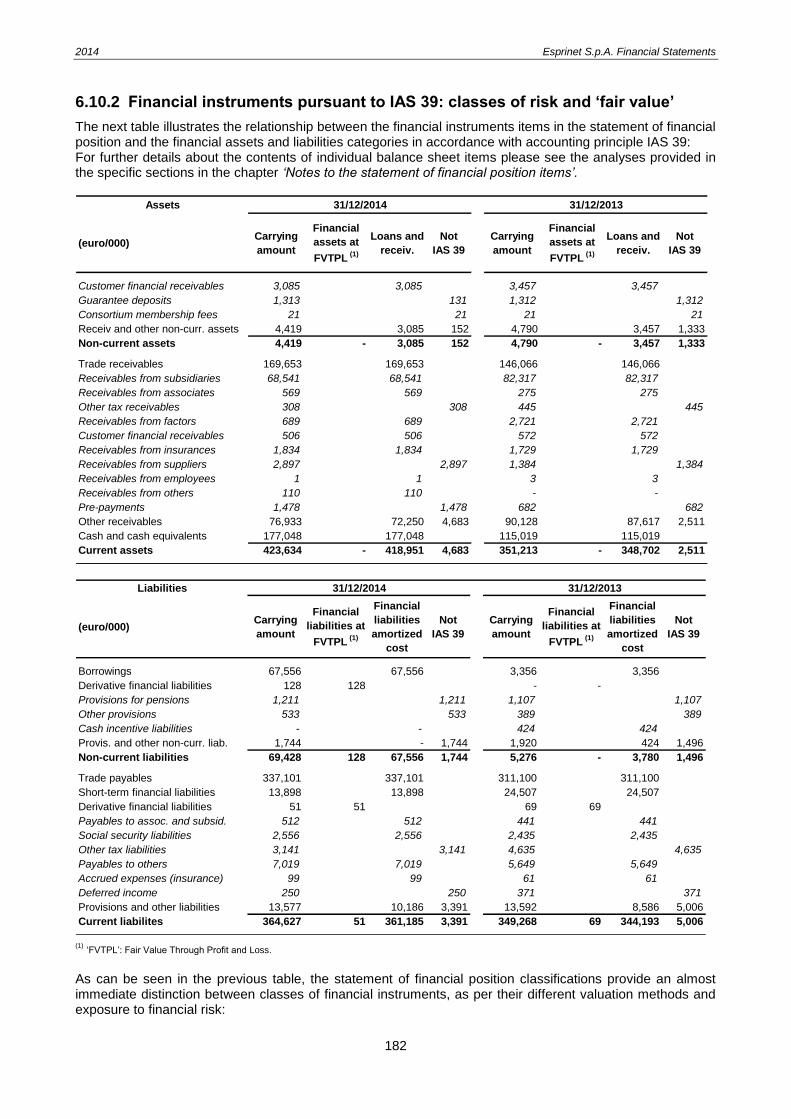
2014 Esprinet S.p.A. Financial Statements
182
6.10.2 Financial instruments pursuant to IAS 39: classes of risk and ‘fair value’
The next table illustrates the relationship between the financial instruments items in the statement of financial position and the financial assets and liabilities categories in accordance with accounting principle IAS 39: For further details about the contents of individual balance sheet items please see the analyses provided in the specific sections in the chapter ‘Notes to the statement of financial position items’.
Assets 31/12/2014 31/12/2013
(euro/000)Carrying
amount
Financial
assets at
FVTPL (1)
Loans and
receiv.
Not
IAS 39
Carrying
amount
Financial
assets at
FVTPL (1)
Loans and
receiv.
Not
IAS 39
Customer financial receivables 3,085 3,085 3,457 3,457
Guarantee deposits 1,313 131 1,312 1,312
Consortium membership fees 21 21 21 21
Receiv and other non-curr. assets 4,419 3,085 152 4,790 3,457 1,333
Non-current assets 4,419 - 3,085 152 4,790 - 3,457 1,333
Trade receivables 169,653 169,653 146,066 146,066
Receivables from subsidiaries 68,541 68,541 82,317 82,317
Receivables from associates 569 569 275 275
Other tax receivables 308 308 445 445
Receivables from factors 689 689 2,721 2,721
Customer financial receivables 506 506 572 572
Receivables from insurances 1,834 1,834 1,729 1,729
Receivables from suppliers 2,897 2,897 1,384 1,384
Receivables from employees 1 1 3 3
Receivables from others 110 110 - -
Pre-payments 1,478 1,478 682 682
Other receivables 76,933 72,250 4,683 90,128 87,617 2,511
Cash and cash equivalents 177,048 177,048 115,019 115,019
Current assets 423,634 - 418,951 4,683 351,213 - 348,702 2,511
Liabilities 31/12/2014 31/12/2013
(euro/000)Carrying
amount
Financial
liabilities at
FVTPL (1)
Financial
liabilities
amortized
cost
Not
IAS 39
Carrying
amount
Financial
liabilities at
FVTPL (1)
Financial
liabilities
amortized
cost
Not
IAS 39
Borrowings 67,556 67,556 3,356 3,356
Derivative financial liabilities 128 128 - -
Provisions for pensions 1,211 1,211 1,107 1,107
Other provisions 533 533 389 389
Cash incentive liabilities - - 424 424
Provis. and other non-curr. liab. 1,744 - 1,744 1,920 424 1,496
Non-current liabilities 69,428 128 67,556 1,744 5,276 - 3,780 1,496
Trade payables 337,101 337,101 311,100 311,100
Short-term financial liabilities 13,898 13,898 24,507 24,507
Derivative financial liabilities 51 51 69 69
Payables to assoc. and subsid. 512 512 441 441
Social security liabilities 2,556 2,556 2,435 2,435
Other tax liabilities 3,141 3,141 4,635 4,635
Payables to others 7,019 7,019 5,649 5,649
Accrued expenses (insurance) 99 99 61 61
Deferred income 250 250 371 371
Provisions and other liabilities 13,577 10,186 3,391 13,592 8,586 5,006
Current liabilites 364,627 51 361,185 3,391 349,268 69 344,193 5,006
(1) ‘FVTPL’: Fair Value Through Profit and Loss.
As can be seen in the previous table, the statement of financial position classifications provide an almost immediate distinction between classes of financial instruments, as per their different valuation methods and exposure to financial risk:

2014 Esprinet S.p.A. Financial Statements
183
financial instruments measured at amortised cost: - cash and cash equivalents and receivables from factoring companies - receivables from insurance companies - intercompany receivables - trade receivables - customer financial receivables (current and non-current) - other receivables - receivables from employees - trade payables - financial liabilities - intercompany payables - other debts (current and non-current)
financial instruments measured at ‘fair value’ since initial recognition: - derivative financial assets - derivative financial liabilities
Qualitative disclosures regarding the different risk classes can be found under the same section in the ‘Notes to the consolidated financial statements’.
The followings are the fair value measurement of financial assets and liabilities reported in the statement of financial position and provided by IAS 39 and governed by IFRS 7, grouped into classes of risk, and the methods and the assumptions applied in determining them:
31/12/2014 31/12/2013
Fair value Fair value
(euro/000)
Trade
receiv.
Financial
receiv.
Receiv.
from
insurers
Receiv.
from
Group
Rec.
from
employ.
Trade
receiv.
Financial
receiv.
Receiv.
from
insurers
Receiv.
from
Group
Rec.
from
employ.
Customer financial receiv. 3,085 3,040 3,457 3,229 -
Other non-curr. assets 3,085 3,040 - 3,457 3,229 -
Non-current assets 3,085 - 3,040 - - - 3,457 - 3,229 - - -
Trade receivables 169,653 169,653 146,066 146,066
Receivables from subsid. 68,541 68,541 82,317 82,317
Receivables from associat. 569 569 275 275
Receiv. from factors 689 689 2,721 2,721
Customer financial receiv. 506 506 572 572
Receiv. from insurances 1,834 1,834 1,729 1,729
Receiv. from employees 1 1 3 3
Receiv. From others 110 110 - -
Other receivables 72,250 1,195 1,834 69,110 111 87,617 3,293 1,729 82,592 3
Cash and cash equival. 177,048 177,048 115,019 115,019
Current assets 418,951 169,653 178,243 1,834 69,110 111 348,702 146,066 118,312 1,729 82,592 3
Assets
Carrying
amount
Carrying
amount

2014 Esprinet S.p.A. Financial Statements
184
31/12/2014 31/12/2013
Fair value Fair value
(euro/000)
Trade
payables
Financial
liabilities
FVTPL
derivat.
Other
payab.
Payab.
to
Group
Trade
payables
Financial
liabilities
FVTPL
derivat.
Other
payab.
Payab.
to
Group
Borrowings 67,556 67,106 3,356 3,134
Financial derivatives 128 128 - -
Cash incentive liabilities - - 424 424
Provis. and other liabil. - - 424 424
Non-current liabilites 67,684 - 67,106 128 - - 3,780 - 3,134 - 424 -
Trade payables 337,101 337,101 311,100 311,100
Short-term financial liab. 13,898 13,898 24,507 24,498
Financial derivatives 51 51 69 69
Intercompany payables 512 512 441 441
Social security liabilities 2,556 2,556 2,435 2,435
Payables to others 7,019 7,019 5,649 5,649
Accrued exp. (insurance) 99 99 61 61
Provis. and other liabil. 10,186 9,674 512 8,586 8,145 441
Current liabilities 361,236 337,101 13,898 51 9,674 512 344,262 311,100 24,498 69 8,145 441
Carrying
amount
Carrying
amount
Liabilities
The corresponding hierarchy level for each of the abovementioned fair value list is described below:
Assets 31/12/2014 31/12/2013
Customer financial receiv. 3,085 3,040 level 2 3,457 3,229 level 2
Other non-curr. assets 3,085 3,040 3,457 3,229
Non-current assets 3,085 3,040 3,457 3,229
Trade receivables 169,653 169,653 level 2 146,066 146,066 level 2
Receivables from subsid. 68,541 68,541 level 2 82,317 82,317 level 2
Receivables from associat. 569 569 level 2 275 275 level 2
Receiv. from factors 689 689 level 2 2,721 2,721 level 2
Customer financial receiv. 506 506 level 2 572 572 level 2
Receiv. from insurances 1,834 1,834 level 2 1,720 1,720 level 2
Receiv. from employees 1 1 level 2 3 3 level 2
Receiv. From others 110 110 level 2 - - level 2
Other receivables 72,250 72,250 87,617 87,617
Cash and cash equival. 177,048 177,048 115,019 115,019
Current assets 418,951 418,951 348,702 348,702
Fair valueFair value
hierarchy
Carrying
amount
Carrying
amount(euro/000) Fair value
Fair value
hierarchy
Liabilities 31/12/2014 31/12/2013
Borrowings 67,556 67,106 livello 2 3,356 3,134 livello 2
Financial derivatives 128 128 livello 2 - -
Cash incentive liabilities - - livello 2 424 424 livello 2
Provis. and other liabil. - - 424 424
Non-current liabilites 67,684 67,234 3,780 3,558
Trade payables 337,101 337,101 livello 2 311,100 311,100 livello 2
Short-term financial liab. 13,898 13,898 livello 2 24,507 24,298 livello 2
Financial derivatives 51 51 livello 2 69 69 livello 2
Debiti per acq. part. 512 512 livello 2 441 441 livello 2
Social security liabilities 2,556 2,556 livello 2 2,435 2,435 livello 2
Payables to others 7,019 7,019 livello 2 5,649 5,649 livello 2
Accrued exp. (insurance) 99 99 livello 2 61 61 livello 2
Provis. and other liabil. 10,186 10,186 8,586 8,586
Current liabilities 361,236 361,236 344,262 344,053
Fair value
hierarchyFair value
Carrying
amount
Carrying
amount(euro/000) Fair value
Fair value
hierarchy

2014 Esprinet S.p.A. Financial Statements
185
Given their short-term due date, in the case of current assets (excluding those of derivatives), trade payables, short-term financial liabilities and other payables (excluding liabilities for cash incentives), the carrying amount is a reasonable approximation of ‘fair value’ value’ (classified as level 2 in the so called ‘fair value hierarchy’). In order to hedge the risk of interest rate fluctuations, on 22 December 2014 Esprinet S.p.A. entered into eight ‘IRS - Interest Rate Swap’ contracts (‘hedging instruments’), one with each of the banks lenders of the 65.0 million euro Term Loan Facility signed on 31 July 2014. Each IRS contracts had different notional and fix rate to be paid but the same conditions. The ‘fair value’ of ‘IRSs-Interest Rate Swaps’ has been measured by discounting expected cash flows according to the due dates of each derivative contract using the market interest curve at the closing date of the financial year and adjusting it by the DVA (Debit Value Adjustment) and the CVA (Credit Value Adjustment). In detail, the interest rates used were obtained from the ‘Forward’ and the ‘Spot’ Curve Euro at 31 December as provided by Bloomberg. Since all inputs entered in the valuation model were based on observable market data instruments are classified at hierarchy level 2. The soundness of the measurement made with this valuation technique was confirmed by the comparison with the value provided by the issuer banks. The ‘fair value’ of non-current assets and medium/long-term loans was estimated by discounting expected cash flows, according to the due dates of each contract, of capital and interests, and using the market interest curve at the ending date of the financial year and adjusted by the DVA (Debit Value Adjustment) or the CVA (Credit Value Adjustment). The spot interest rates used to quantify the amount at the due date and discount the expected cash flows were obtained from the ‘Forward Curve Euro’ at 31 December, provided by Bloomberg, increased whereas present by a spread as per clauses in the contract (no spread when using the market interest curve for discounting cash flows). The above determined fair value corresponds to a level 2 in the fair value hierarchy. Disclosures regarding net gains or net losses, interest income and interest expenses, fee income and expenses arising from financial instruments have been already given in the table dedicated to finance costs under ‘42) Finance costs’. Also consider that general and administrative expenses include 0.7 million euro (0.6 million euro in 2013) of write-down for doubtful accounts estimated on the basis of analyses of each single debtor’s solvency.
6.10.3 Additional information about financial assets
As during the previous year, no reclassification of a financial asset as one measured at cost or amortised cost, rather than at fair value, or vice versa, was made (the initial recognition of a financial instrument at fair value and the subsequent measurement at cost or amortised cost for some specified financial assets not being effected for this purpose, as per the international accounting principles). As highlighted in the section ‘Trade and other receivables’ in the paragraph ‘Summary of significant valuation criteria and accounting policies’, in case of impairment by credit losses, the value of receivables is adjusted. This operation is effected by specially allocating a bad debt provision that directly reduces the carrying amount of the devaluated financial asset. In the year closed at 31 December 2014, and in the previous one, it was used solely in the case of trade receivables, since it was not deemed necessary in the case of other financial assets. The following table illustrates the abovementioned movements of trade receivables bad debt provision during the year:
(euro/000) Starting provision Additions Uses Final provision
2014 financial year 5,979 739 (527) 6,191
2013 financial year 6,263 586 (870) 5,979
Esprinet S.p.A. Group usually transfers financial assets. These operations involve giving factoring companies trade receivables, for both discounting-back and without-recourse factoring schemes, as well as presenting promissory notes (known by their Italian acronym as RIBA) to banks as credit operations on realisation under usual reserves.

2014 Esprinet S.p.A. Financial Statements
186
In the case of transfers of receivables for without-recourse factoring and advances under usual reserves, this operation not qualifying for derecognition, the Company continues to recognise all of these assets, the carrying amount of which continues to appear in the statement of financial position, under ‘trade receivables’ with an offsetting entry under the current financial liabilities as ‘other financing payables’ and ‘payables to banks’. As at 31 December 2014 the with-recourse sold receivables which obtained advances under usual reserves amounted to 6.0 million euro (11.0 million euro at 31 December 2013); same kind of advances (under usual reserves) about effects amounted to 1.9 million euro (1.5 million euro at 31 December 2013). The financial assets’ gross book value is the Company’s maximum exposure to credit risk. The following tables shows an analysis of the status of trade receivables and the aging of those not overdue and not impaired by credit losses:
(euro/000) 31/12/2014 Receivables impaired
Receivables
past due
not impaired
Receivables
not past due
not impaired
Gross trade receivables 175,754 7,338 17,995 150,421
Bad debt provision (6,191) (6,191) - -
Net trade receivables 169,563 1,147 17,995 150,421
(euro/000) 31/12/2013 Receivables impaired
Receivables
past due
not impaired
Receivables
not past due
not impaired
Gross trade receivables 152,045 8,735 18,753 124,557
Bad debt provision (5,979) (5,979) - -
Net trade receivables 146,066 2,756 18,753 124,557
(euro/000) Total Past due
over 90 days
Past due
60 - 90 days
Past due
30 - 60 days
Past due
under 30 days
Receiv. past due not impaired at 31/12/2014 17,995 (283) 285 (47) 18,040
Receiv. past due not impaired at 31/12/2013 18,753 1,590 487 1,626 15,050
Due to its historical experience and to its policy of not accepting orders from insolvent customers unless paid in advance, Esprinet S.p.A. does not believe that the premise for allocating provisions for doubtful receivables for amounts not yet overdue exist. There are no financial assets which would otherwise be past due or impaired whose terms have been re-negotiated, except for some re-entry plans agreed with customers for not-material amounts. The following instruments are usually used by the Company to limit its credit risk (the percentages refer to trade receivables at 31 December 2012): - traditional credit insurance (covering approx. 90% of the face value of the insured receivables provided
they are within the limit of the credit line given by the insurance company) covering approx. 64% of the total amount of trade receivables;
- without-recourse factoring with leading factoring companies covering 7% of the receivables (the amount refers to receivables existing at the ending date of the financial year but subject to revolving credit at the times and with the methods of the schemes);
- real guarantees (bank guarantees and asset mortgagees) in the case of approx. 3% of total gross amount of trade receivables.
No financial or non-financial assets were obtained by the Company during the period by taking possession of collateral it holds as security or calling on other credit enhancements (e.g. guarantees). Nor Esprinet S.p.A. hold collateral (of financial or non-financial assets) it was permitted to sell or re-pledge in the absence of default by the owner of the collateral. No other financial assets regulated by IFRS 7 and IFRS 13 have been impaired in the current or in the previous year. The two following tables illustrate their status and the aging of those not overdue and not impaired by credit losses:

2014 Esprinet S.p.A. Financial Statements
187
31/12/2014 31/12/2013
(euro/000)Carrying
amount
Receiv.
impaired
Receiv.
past due
not impaired
Receiv.
not past due
not impaired
Carrying
amount
Receiv.
impaired
Receiv.
past due
not impaired
Receiv.
not past due
not impaired
Customer financial receiv. 3,085 3,085 3,457 3,457
Other non-current assets 3,085 3,085 3,457 3,457
Non-current assets 3,085 - - 3,085 3,457 - - 3,457
Receivables from subsid. 68,541 (189) 68,730 82,317 14,749 67,568
Receivables from asscociat. 569 162 407 275 240 35
Receivables from factors 689 677 12 2,721 (7) 2,728
Customer financial receiv. 506 - 506 572 - 572
Receivables from insurances 1,834 1,834 1,729 1,729
Receivables from employees 1 1 3 3
Receivables from others 110 110 - -
Other receivables 72,250 2,484 69,766 87,617 16,711 70,906
Cash and cash equivalents 177,048 177,048 115,019 115,019
Current assets 249,298 - 179,532 69,766 202,636 - 131,730 70,906
(euro/000) Total Past due
over 90 days
Past due
60 - 90 days
Past due
30 - 60 days
Past due
under 30 days
Receivables from subsid. (189) - 21 - (210)
Receivables from associat. 162 81 - - 81
Receivables from factoring companies 12 - - - 12
Receivables from insurance companies 1,834 1,694 58 47 35
Receivables from others - - - - -
Receiv. past due not impaired at 31/12/2014 1,819 1,775 79 47 (82)
Receivables from subsid. 14,749 (1) - (48) 14,798
Receivables from associat. 240 183 - 60 (3)
Receivables from factoring companies (7) - - - (7)
Receivables from insurance companies 1,729 1,530 23 28 148
Receivables from others - - - - -
Receiv. past due not impaired at 31/12/2013 16,711 1,712 23 40 14,936
Receivables from factoring companies relate wholly to ‘without-recourse’ factoring operations, where the ownership and connected risks of the sold receivables have therefore been wholly transferred to factoring companies. The past due quota relates to sums due at the ending date of the year which were paid during the first days of the following year for technical reasons. The not yet due quota regards amounts collectable by contract only at the original due date of the receivable existing between the sold customers and the Company. It should be noted, however, that these receivables had also been entirely paid by the time this report was drawn up, as the deadlines had been met.
6.10.4 Additional information about financial liabilities
Amounts detailed in the following maturity analysis are the contractual undiscounted cash flows, including interests to be paid and excluding the effects of netting agreements:
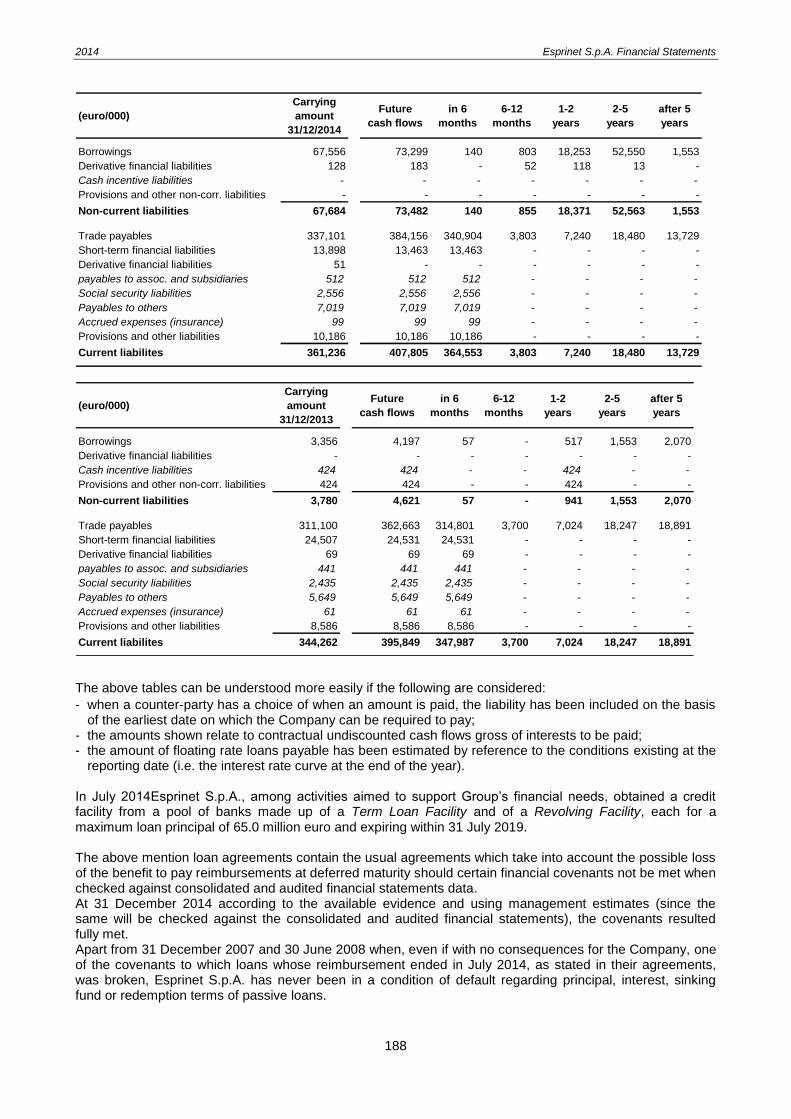
2014 Esprinet S.p.A. Financial Statements
188
(euro/000)
Carrying
amount
31/12/2014
Future
cash flows
in 6
months
6-12
months
1-2
years
2-5
years
after 5
years
Borrowings 67,556 73,299 140 803 18,253 52,550 1,553
Derivative financial liabilities 128 183 - 52 118 13 -
Cash incentive liabilities - - - - - - -
Provisions and other non-corr. liabilities - - - - - - -
Non-current liabilities 67,684 73,482 140 855 18,371 52,563 1,553
Trade payables 337,101 384,156 340,904 3,803 7,240 18,480 13,729
Short-term financial liabilities 13,898 13,463 13,463 - - - -
Derivative financial liabilities 51 - - - - - -
payables to assoc. and subsidiaries 512 512 512 - - - -
Social security liabilities 2,556 2,556 2,556 - - - -
Payables to others 7,019 7,019 7,019 - - - -
Accrued expenses (insurance) 99 99 99 - - - -
Provisions and other liabilities 10,186 10,186 10,186 - - - -
Current liabilites 361,236 407,805 364,553 3,803 7,240 18,480 13,729
(euro/000)
Carrying
amount
31/12/2013
Future
cash flows
in 6
months
6-12
months
1-2
years
2-5
years
after 5
years
Borrowings 3,356 4,197 57 - 517 1,553 2,070
Derivative financial liabilities - - - - - - -
Cash incentive liabilities 424 424 - - 424 - -
Provisions and other non-corr. liabilities 424 424 - - 424 - -
Non-current liabilities 3,780 4,621 57 - 941 1,553 2,070
Trade payables 311,100 362,663 314,801 3,700 7,024 18,247 18,891
Short-term financial liabilities 24,507 24,531 24,531 - - - -
Derivative financial liabilities 69 69 69 - - - -
payables to assoc. and subsidiaries 441 441 441 - - - -
Social security liabilities 2,435 2,435 2,435 - - - -
Payables to others 5,649 5,649 5,649 - - - -
Accrued expenses (insurance) 61 61 61 - - - -
Provisions and other liabilities 8,586 8,586 8,586 - - - -
Current liabilites 344,262 395,849 347,987 3,700 7,024 18,247 18,891
The above tables can be understood more easily if the following are considered:
- when a counter-party has a choice of when an amount is paid, the liability has been included on the basis of the earliest date on which the Company can be required to pay;
- the amounts shown relate to contractual undiscounted cash flows gross of interests to be paid; - the amount of floating rate loans payable has been estimated by reference to the conditions existing at the
reporting date (i.e. the interest rate curve at the end of the year). In July 2014Esprinet S.p.A., among activities aimed to support Group’s financial needs, obtained a credit facility from a pool of banks made up of a Term Loan Facility and of a Revolving Facility, each for a maximum loan principal of 65.0 million euro and expiring within 31 July 2019. The above mention loan agreements contain the usual agreements which take into account the possible loss of the benefit to pay reimbursements at deferred maturity should certain financial covenants not be met when checked against consolidated and audited financial statements data. At 31 December 2014 according to the available evidence and using management estimates (since the same will be checked against the consolidated and audited financial statements), the covenants resulted fully met. Apart from 31 December 2007 and 30 June 2008 when, even if with no consequences for the Company, one of the covenants to which loans whose reimbursement ended in July 2014, as stated in their agreements, was broken, Esprinet S.p.A. has never been in a condition of default regarding principal, interest, sinking fund or redemption terms of passive loans.

2014 Esprinet S.p.A. Financial Statements
189
The Company also has a loan due in January 2022, with a remaining value as notional of 3.5 million euro and registered as 3.4 million euro by effect of the amortising costs accounting method, achieved in December 2013 under the contractual terms of payment from the Public Administration for the supply of personal computers to the same. The issuing bank was granted by the Company an irrevocable collection derogation for multi-year contribution’s collection due from the Public Administration and equal, in both the amounting and due dates, to the reimbursement loan plan that, for the above mentioned reason, do not contains dealings for a possible shirk benefitting from the reimbursement terms. Up to now Esprinet S.p.A. has not issued any instruments containing both a liability and an equity component.
6.10.5 Hedge accounting
Introduction
Esprinet S.p.A. signs derivative contracts in order to hedge some loan agreements against fluctuating interest rates by means of a strategy of cash flow hedge. The aim of these hedging transactions against the interest rate risk is to fix the funding cost of middle/long-term floating-rate loans by entering into a derivative contract that enables the Company the floating rate to be received and the fixed rate to be paid. Hedging operations are therefore reported in the financial statements according to the instructions of the IAS 39 accounting principle regarding ‘hedge accounting’ and in order to verify the hedge effectiveness, the Company periodically carry out prospective and retrospective tests. Derivative instruments matured during the year
On 27 June 2014 came to maturity the ‘IRS-Interest Rate Swap’ contract entered into with Intesa Sanpaolo S.p.A. at the end of November 2007, provided for a residual notional amount of 3.5 million euro and whose disclosure (type, purpose, accounting methods, loan covered etc.) can be found in the same section of the ‘Notes to the consolidated financial statements’. The main features of the contract are summarized below, however:
Trade date 20 November 2007
Effective date 27 December 2007
Termination date 27 June 2014 subject to adjustment in accordance with the modified business day convention
Notional amount 45.5 million euro (subject to an amortisation plan)
Fixed rate 4,33%, act/360
Fixed and floating rates payment dates 27/06/08, 29/12/08, 29/06/09, 28/12/09, 28/06/10, 27/12/10, 27/06/11, 27/12/11, 27/06/12, 27/12/12, 27/06/13, 27/12/13, 27/06/14 subject to adjustment in accordance with the modified business day convention
Fixed rate payer Esprinet S.p.A.
Floating rate Euribor 6M, act/360, fixed as the first day of each interest calculation period
Floating rate payer Intesa Sanpaolo S.p.A.
Since, until 30 November 2012, it was fully in compliance with International Accounting Standard 39 regarding ‘hedge accounting’ (formal designation and documentation of the hedging relationship; hedge expected to be highly effective and reliably measured; forecast transaction highly probable and affecting profit or loss) the derivative contract had been subject to the ‘cash flow hedge’ accounting rules until that date. After 30 November 2012, and thus for all of 2014, as a consequence of the ‘high’ effectiveness termination proved by retrospective tests, the fair value variation of the derivative instrument has been booked as financial costs directly in the separate income statement. Derivative instruments entered during the year
In order to hedge the risk of interest rate fluctuations, on 22 December 2014 Esprinet S.p.A. entered into eight ‘IRS - Interest Rate Swap’ contracts (‘hedging instruments’), one with each of the banks lenders of the 65.0 million euro Term Loan Facility signed on 31 July 2014. Each IRS contracts had different notional and fix rate to be paid but the same conditions.

2014 Esprinet S.p.A. Financial Statements
190
Each participating bank to the hedged loan entered a derivative contract for a notional amount equivalent to that of the own quote of the underlying loan to which hedging the derivative contract is aimed by the floating rate collection and the fixed rate payment. The main features of the eight contracts are summarized below:
Trade date 22 December 2014
Effective date 30 January 2015
Terminantion date 31 July 2019
Notional amount 65.0 million euro (subject to an amortisation plan)
Fixed rate From 0.33% to 0.37%, act/360
Fixed and floating rates payment dates Every 31 January and 31 July starting from 31 July 2015 up to 31 July 2019, subject to adjustment in accordance with the modified business day convention
Fixed rate payer Esprinet S.p.A.
Floating rate Euribor 6M, act/360, fixed two days before the interest calculation period
Floating rate payer Intesa Sanpaolo S.p.A., Banca Nazionale del Lavoro S.p.A., Unicredit S.p.A., Banca Monte dei Paschi di Siena S.p.A., UBI Banca - Società Cooperativa per Azioni, Banco Popolare – Società Cooperativa, Caixabank S.A., Cassa di Risparmio di Parma e Piacenza S.p.A., each for its own contract
Since it is fully in compliance with International Accounting Standard 39 regarding ‘hedge accounting’ (formal designation and documentation of the hedging relationship; hedge expected to be highly effective and reliably measured; forecast transaction higly probable and affecting profit or loss) both of the eight derivative contracts have been subject to the ‘cash flow hedge’ accounting rules. Information regarding derivative contracts existing during the year
The next table illustrates the following information regarding the derivative contracts with reference to the cash flow hedge accounting technique (until 30 November 2012 for derivatives matured during 2014): - the notional amount at 31 December 2014 and 2013 shared into portions maturing within or beyond a 12-
months period; - the amount recognised in the statement of financial position as at 31 December 2014 and 2013 with
reference to the ‘fair value’ of the contracts with ‘highly ‘effective hedge conditions (30 November 2012 for the financial year 2013);
- the cumulative change in fair value from the inception to the date of ‘highly ‘effective hedge termination with reference to the instalments still effective at the financial statement closing date;
- the ineffective portion of gains/losses on the hedging instrument computed to the income statement under ‘Finance costs’ from the inception with reference to the instalments still effective at the same date.
within
1 year
beyond
1 year
Interest rate risk management
- cash flow hedge pursuant to IAS 39: 2014 - 65,000 179 - (50) (129)
2013 3,500 - 70 122 (19) 71
Notional amountFair value
(1)
Income
statement(2)
Retained
earnings(4)
(euro/000) Year
Taxes on
FV
contracts (3)
(1)
Amount of the (assets)/liabilities recorded in the statement of financial position as per the ‘fair value’ measurement of derivatives using cash flow hedge
accounting technique. (2)
Ineffective portion of the gain or loss on the hedging instrument as per IAS 39. (3)
Deferred income taxes related to the fair value of the derivative contracts using cash flow hedge accounting technique. (4)
Cumulative change in fair value from inception to the statement of financial position date recognised in equity using cash flow hedge accounting
technique.
The events that caused the changes in the amount of the ‘cash flow hedge’ equity reserve during the year are so detailed:

2014 Esprinet S.p.A. Financial Statements
191
2014
Equity reserve on derivatives 2014: (179) - - 50 (129)
Equity reserve on derivatives 2007: - 70 (122) (19) (71)
Total (179) 70 (122) 31 (200)
(euro/'000)
Ineffective
portion of
(gain)/loss
to P&L
Taxes on
fair value of
derivatives
Change in
equity reserve
Change in
fair value of
derivatives
Transfer to P&L (1)
2013
Equity reserve on derivatives 2014: - - - - -
Equity reserve on derivatives 2007: - 329 9 (90) 248
Total - 329 9 (90) 248
(euro/000)
Ineffective
portion of
(gain)/loss
to P&L
Taxes on
fair value of
derivatives
Change in
equity reserve
Change in
fair value of
derivatives
Transfer to P&L (1)
(1) Accounted as increase/(decrease) of ‘Financial charges’.
The following are the periods when the cash flows relating to the hedged items are expected to occur and when they are expected to affect the Income Statement:
(euro/000)Expected
cash flows
0-6
months
6-12
months
1-2
years
2-5
years
After 5
years
Loans: 31/12/2014 Cash flows 4,671 136 803 1,485 2,247 -
Impact on P&L 4,671 805 792 1,344 1,730 -
31/12/2013 Cash flow and impact on P&L 23 23 - - - -
As a consequence of the derivatives fair value variation directly reported in the Income Statement, 7 thousand euro financial costs were recorded in 2013 as mentioned in paragraph ’42) Financial costs – net’. No costs were posted in 2014 due to the maturity of the derivatives. The derivative instrument changes referring to the fair value variations recorded in the Income Statement are reported below:
Derivatives 2014: 2014 n.a. n.a. n.a. n.a.
2013 n.a. n.a. n.a. n.a.
Derivatives 2007: 2014 (69) 69 - -
2013 (411) 339 3 (69)
Total (480) 408 3 (69)
Variation FV
rates not past due
FV
31/12/c.y.2
Rates past due(euro/000) Year
FV
31/12/p.y.1
(1)
Previous year
(2) Current year
6.10.6 Sensitivity analysis
Since Esprinet S.p.A. is exposed to a limited currency risk it has decided not to effect sensitivity analyses regarding this type of risk (for more details see section ‘Main risks and uncertainties facing the Group and Esprinet S.p.A.’ in the ‘Director’s Report on Operations’). A sensitivity analysis regarding the interest rate risk was performed in order to show how profit or loss and equity would have been affected by changes in the interest rate curve that were reasonably possible during the period. For these purposes, the 2014 market interest rate trend was taken into account together with the Company’s estimates on rates in the immediate future and a forward shifting of spot/forward interest rate curves +/-100 basis points was simulated. The following table shows the results of the simulation (net of tax effects):

2014 Esprinet S.p.A. Financial Statements
192
Scenario 1: +100 basis points
(euro/000) Net equity Profit/(loss) Net equity Profit/(loss)
Financial assets 286 286 249 249
Cash and cash equivalents 377 377 154 154
Short-term financial liabilities (11) (11) (75) (75)
Borrowings (1) (2)
(165) (165) 11 11
Derivative financial liabilities 1,305 - 37 37
Total 1,792 487 376 376
31/12/2014 31/12/2013
(1)
Medium/long-term loans include the portion falling due within 12 months. (2)
Impact on the loans hedged by IRS regards solely the uncovered portion of the loans.
Scenario 2: -100 basis points
(euro/000) Net equity Profit/(loss) Net equity Profit/(loss)
Financial assets (66) (66) (53) (53)
Cash and cash equivalents (377) (377) (148) (148)
Short-term financial liabilities 11 11 75 75
Borrowings (1) (2)
43 43 11 11
Derivative financial liabilities (129) - (14) (14)
Total (518) (389) (129) (129)
31/12/2014 31/12/2013
(1)
Medium/long-term loans include the portion falling due within 12 months. (2)
Impact on the loans hedged by IRS regards solely the uncovered portion of the loans.
6.11 Compensation for Esprinet S.p.A. auditing services
The following table drafted pursuant to Article 149-duodecies of the Consob Issuing Regulation, shows the emoluments posted during the 2014 financial year on the accrual basis of accounting for auditing services and others performed by the same auditing company and/or bodies belonging to its network:
Fees
2014 2013
Auditing services:
Examination of the annual accounts of one single company, accompanied
by professional opinion Reconta (1)
153.8 153.3
Examination of the annual consolidated accounts of a group of companies
accompanied by professional opinion Reconta (1)
11.8 11.8
Quarterly examination of accounts of one single company or
group of companies during the year Reconta (1)
27.9 27.9
Subtotal 193.5 193.0
Certification services:
Certification services other than audit Reconta 25.0 4.0
Subtotal 25.0 4.0
Total 218.5 197.0
Provider of
serviceDescription
(1)
Reconta Ernst & Young S.p.A. – Milan.

2014 Esprinet S.p.A. Financial Statements
193
7. Publication of the Draft Annual Report
The draft annual report and its publication were approved by the Esprinet Board of Directors during the meeting of 16 March 2015, which also authorised the Chairman to make any necessary or appropriate changes or additions to the structure of the document, in order to complete or improve it in any of its parts. Vimercate, 16 March 2015 For and on behalf of the Board of Directors The Chairman Francesco Monti

2014 Esprinet S.p.A. Financial Statements
194
Statement on the ‘separate financial statements’ pursuant to Article 81-ter of Consob Regulation No. 11971 of 14 May 1999, as amended 1. In consideration of the provisions of Article 154-bis, subsections 3 and 4, of legislative decree No. 58 of 24 February 1998, the undersigned Alessandro Cattani, Chief Executive Officer of Esprinet S.p.A and Pietro Aglianò, executive charged with drawing up the Esprinet S.p.A. accounting documents, hereby declare that the administrative and accounting procedures used in drawing up the separate financial statements relating to the period between 1 January 2014 – 31 December 2014 were: - appropriate to the features of the Company - effectively applied. 2. The assessment of the adequacy of the administrative and accounting procedures used for the preparation of the separate financial statements at 31 December 2014 was effected in accordance with the Internal Control - Integrated Framework model issued by the Committee of Sponsoring Organizations of the Treadway Commission, an internally-accepted reference framework. No significant aspects emerged. 3. We further declare that: 3.1 the separate financial statements as at 31 December 2014: a) have been prepared in accordance with International Financial Reporting Standards, as endorsed by the European Union through Regulation (EC) of the European Parliament and Counsel, dated 19 July 2002 as implemented in Italy by Article 9 of Legislative Decree no. 38 of 2005; b) correspond to the amounts shown in the Company’s accounts, books and records; and c) provide a fair and correct representation of the financial conditions, results of operations and cash flows of the Company as at 31 December 2014. 3.2 The Directors’ Report on Operations includes a reliable operating and financial review of the Company as well as a description of the main risks to which it is exposed.
Vimercate, 16 March 2015
Chief Executive Officer Executive charged with of Esprinet S.p.A. drafting the Esprinet S.p.A.
accounting documents. (Alessandro Cattani) (Pietro Aglianò)

2014 Esprinet S.p.A. Financial Statements
195
Statutory Auditors’ Report
Statutory Auditors have audited the financial statements of Esprinet S.p.A. as of 31 December 2014 and their opinion is attached to the Italian version of the document. The financial statements referred to in the previous page of this document have been translated by the company from those issued in Italy from the Italian into the English language solely for the convenience of international readers. The translation has not been examined by Statutory Auditors and consequently their opinion in English on this document is not available.
Independent Auditors’ Reports
Reconta Ernst & Young S.p.A. has audited both the consolidated financial statements of Esprinet S.p.A. and the separate financial statements of Esprinet S.p.A. as of 31 December 2014 and its opinions are attached to the Italian version of the document. The financial statements referred to in the previous page of this document have been translated by the company from those issued in Italy from the Italian into the English language solely for the convenience of international readers. The translations have not been examined by Reconta Ernst & Young S.p.A. and consequently its opinions in English on those documents are not available.