esmo asia gi preceptorship 2017 new targets for metastatic...
TRANSCRIPT

Sun Young Rha, MD, PhDYonsei Cancer Center, Institute for Cancer Research, Yonsei University College of Medicine
New targets for metastatic gastric cancerESMO Asia GI Preceptorship 2017

Disclosures• I have nothing to disclose for this presentation.

Beyond histological classification
1) Deng N, Goh LK et al, GUT 2012:61:673, 2) Wang K, Yuen ST et al. Nature Genetics 2014;46; 573, 3) TCGA Nature 2014:513:202, 4) Cristescu R, Lee J et al, Nat Med 2015: 21:449
Singapore HK
TCGA ACRG
Angiogenesis c-MET, FGFR, mTOR etc PD-1/PD-L1 inhibitor

1. Killing the proliferating cells
2. Enhance Immunity! (Cytokines/IFN, IL-2, vaccine, immune checkpoint inhibitor)
5. Intracellular signaling (mTOR inhibitors, MEK inhibitors)
6. Targeting both(sunitinib, sorafenib)
4. GF RTKHerceptin, cetuximab, Glivec
3. Angiogenesis inhibitor: (avastin, pazopanib, axitinib, cabozantinib
Strategies of targeting cancer

Schematic view of targeted therapies in gastric cancer and sites of action
World J Gastroenterol. 2016 Jan 14;22(2):471-89
SuccessFail
Low efficacy (Ph II)
AMG337

Phase III trials targeting HGF/c-Met pathway
Patients with MET+, un-resectable metastatic or locally advanced gastric
or GEJ cancer(Planned N = 450)
Rilotumumab (AMG102) 15 mg/kg q21d +Epirubicin, Cisplatin, Capecitabine (ECX)
Placebo q21d +Epirubicin, Cisplatin, Capecitabine (ECX)
Patients with MET+, HER2-negative, metastatic gastric
or GEJ cancer(planned N = 800)
OnartuzumabmFOLFOX6*
PlacebomFOLFOX6*
• Primary endpoint: OS
• Primary endpoint: OS in MET 2+/3+ and ITT populations
RILOMET-1
MetGastric
ClinicalTrials.gov. NCT01697072 & NCT01662869

Rilotumumab and Onartuzumabas a 1st line
1. ASCO 2015 (abstr #4000); 2. JAMA Oncol. 2017;3:620-7
RILOMET-11 METGastric2

Why did MET blockage fail?• MET overexpression might not be an appropriate target for MET
blockage
RILOMET-11
METGastric2
1. ASCO 2015 (abstr #4000); 2. JAMA Oncol. 2017;3:620-7

FGFR2b Protein Over-Expression
Han et al. 2015O
vera
ll S
urvi
val
Follow-up (months)
Han et al. 2015
FGFR2 Dysregulation is Linked to Shorter Survival in GC Patients
FGFR2 Gene Amplification
Jung et al. 2009
444
Ove
rall
Sur
viva
l
FGFR2 amplified (n=14)
FGFR2 non-amplified (n=299)
FGFR2 FISH; p=.012
Follow-up (months)
FGFR2b IHC pos(n=9)
FGFR2b IHC neg (n=353)
p < 0.001

SHINE study: AZD4547 vs. paclitaxel asa 2nd line Tx
Bang YJ et al. ASCO 2015
AZD4547
Paclitaxel
GC2nd-line
FGFR2 polysomyor gene amplificati
on (n=55)

Pearson A et al. Cancer Discovery 2016
High level FGFR2 amplification predicts response to AZD4547

Summary of Initial Monotherapy Antitumor Activity of FPA144 in FGFR2b+ Gastric Patients
OutcomeFPA144 Treated(N=9)
ORR *(95% CI)
33%(7%, 70%)
Best Objective Response (%)
Complete Response 0 (0%)
Partial Response 3* (33%)
Stable Disease 4 (44%)
Progressive Disease 2 (23%)Disease Control Rate(95% CI)
77%(40%, 97%)
12-Week PFS(95% CI)
67%(30%, 93%)
Median Duration of Treatment, days (Range)
112 (42-182)
* Pooled across all dosing cohorts (1 at 6 mg/kg, 1 at 10 mg/kg and 1 at 15 mg/kg). All responses were confirmed (one after the data cutoff with the patient still on treatment). Investigator review was used for assessments. Data cutoff was April 1, 2016. Lee et al. ASCO 2017
Partial Response in Patient Treatedwith 6 mg/kg FPA144Screening (Day -14)
Cycle 4 Day 1 (Day 83)

Susana B et al. Nature Reviews Clinical Oncology 2010
-HRD (Homologous Recombination Defect) leads to massive genome instability-Genes of HR pathway are found to be deregulated in tumor HRD as therapeutic target
BRCA1/2 Mutation, PALB2 mutation, RAD51B, RAD54B mutation, etc
DDR (DNA Damage Response) in GC

GOLD: Phase III study
Olaparib 100 mg tablet twice daily + weekly paclitaxel 80 mg/m2 ivN=263
Placebo + weekly paclitaxel 80 mg/m2 iv N=262
Co-primary endpoint - OS all patients (FAS‡)- OS for patients with an ATM protein-negative tumour§
1:1
• Secondary endpoints included: PFS; ORR; HRQoL||; safety and tolerability
Patients with advanced gastric cancer* who progressed following first-line therapy (n=525)
China (n=202) Japan (n=102) Korea (n=201) Taiwan (n=20)
*Including the gastro-oesophageal junction (GEJ); †Evaluated by RECIST 1.1; ‡adjusted for ATM status, country and gastrectomystatus at baseline. §adjusted for country & gastrectomy status at baseline; ||Assessed by the EORTC QLQ-C30 global HRQoL scale
• Study designed to detect HR=0.7 with a median OS improvement of 8.0–>11.4 months in the overall population, and HR=0.35 with a median OS improvement of 8.0–>22.9 months in the ATM protein-negative population
− Statistical significance was 0.025 (the Hochberg approach)
Paclitaxel treatment was on days 1, 8 and 15 of a 28-day cycle until progression,† unmanageable toxicity or consent withdrawal
Bang YJ et al. ESMO 2016

0
0.1
0.2
0.3
0.4
0.5
0.6
0.7
0.8
0.9
1.0
0 1 2 3 4 5 6 7 8 9 10 11 12 13 14 15 16 17 18 19 20 21 22 23 24 25 26 27 28 29
Time from randomization (months)
Prob
abilit
y of O
S
263 258 248 234 210 192 163 135 121 105 82 72 62 48 42 37 35 30 25 20 15 13 11 7 7 2 1 1 0 0Olaparib/paclitaxel
Number of patients at risk
262 256 247 213 192 174 156 119 100 80 66 53 47 44 40 31 28 24 20 17 13 11 9 4 3 2 1 1 1 0Placebo/paclitaxel
Olaparib/paclitaxel (N=263)Placebo/paclitaxel (N=262)
Overall survival in the FAS
*Due to Hochberg’s multiple testing procedure, statistical significance was P<0.025 for each population
FAS (n=525; 72.6% OS maturity)
Olaparib/paclitaxel Placebo/paclitaxel
Events:total patients (%) 181:263 (68.8) 200:262 (76.3)
Median OS, months 8.8 6.9HR=0.79
97.5% CI (0.63, 1.00); P=0.0262*
Bang YJ et al. ESMO 2016

New agents in development• New agents targeting known targets: Her-2, MET,
FGFR, angiogenesis • Ab-drug conjugates• GS-5745 (MMP-9 inhibitor)• Napabucasin(BBI608) – stemness inhibitor• IMAB362: Anti-CLDN18.2 antibody• Anetumab- targeting mesothelin• CDK4/6 inhibitors• Epigenetics modulators: BET inhibitor• TGF-b inhibitor• Etc …
• Immunotherapy
Proper patients selection: Precision Medicine

Role of Immune Therapy for GC ?
Sep 22, 2017 FDA Approves Merck’s Keytruda (pembrolizumab) for Previously Treated
Patients with Recurrent Locally Advanced or Metastatic Gastric or
Gastroesophageal Junction Cancer Whose Tumors Express PD-L1 based on
KEYNOTE-059 trial.
Japanese Ministry of Health, Labor and Welfare (MHLW) approved nivolumab
(Opdivo) for the treatment of unresectable advanced or recurrent gastric cancer
which has progressed after chemotherapy based on ATTRACTION-2 (ONO-
4538-12) trial.
May 23 2017: Pem for MSI-H tumors
Aug 2017 Nivolumab for MSI-H CRC
YES!

1. J Gastroenterol Hepatol. 2014;29(7):1435-41. 2. Clin exp immunol 2011;164(1);50-56. 3. Clin Cancer Res. 2003;9;4404-4408, 4. Clin Cancer Res. 2003;9;4404-4408, 5. PLoS One. 2013 Sep 5;8(9):e74430.
Immune cell (CD3, CD4+/CD8+ T-cell) infiltration showed a better survival
PD-L1/2 positive, CD4(+)CD25high/Treg positive patients have a poorer prognosis
Immunity is important in survival of esophagogastric cancer-> Potential applicability of immune therapies

Estimate of Neoantigen Repertoire: potential immune therapy for GC
Science 3 April 2015
Somatic mutation frequencies (mutation burden) in “exomes”from 3,083 tumor–normal pairs

5-fluorouracil/platinum(+/- docetaxel) 5-7 Mo
Paclitaxel or Irinotecan (3-5 Mo)
+ Trastuzumab in Her-2 + + Ramucirumab
Current treatment of metastatic GC (median 16-18months)
90 % 60-65% 30-40%
Supportive2nd line Tx (3rd - 4th line Tx)1st line Tx
Chemotherapy
* CTLA-4 targeting agents, PD-1/PD-L1 targeting agents
Tremelimumab monotherapyIpilimumab monotherapy (maintenance)
Pembrolizumab monotherapy (KN-12) Avelumab monotherapy (Javelin 100)
Ipilimumab + Nivolumab combo(CM 032)
Atezolizumab/ Durvalumab monotherapyDurvalumab + Ramucirumab, Durvalumab+ Tremelimumab
Pem/nivo + CTx(III) Pembrolizumab vs Pac(III)
Avelumab vs SOC (III)
Ipilimumab + Nivolumab vs SOC (III)
Ongoing
Presented
I
Nivolumab vs BSC (III, Attraction-2)
Apatinib?
Pembrolizumab in PD-L1 + Nivolumab
Pembrolizumab in MSI-H/dMMR

22
Tremelimumab (Phase II) • 18 Western patients (6 GC, 6 GEJ, 6 Eso)• 15mg/kg every 90 days• 2nd line (n=15), 3rd line (n=3) • RR 6 % : 1 PR (Tx for 32.7 Mo), 4 SD• TTP : 2.83 Mo (2.7 ~ 3.0)• OS : 4.83 Mo (4.1 ~ 5.6)
Toxicity Grade
Cycle 1
(n=18)
Cycle 2
(n=6)
Cycle 3
(n=1)ItchRashDizzinessDiarrhea(pancolitis & perforation*)
11115*
84141
2311-
5263-
Treatment-related toxicities
*0.6%: ipilimumab >3mg/kg Ralph et al., Clin Cancer Res 2010

- Median iPFS (95% CI) Ipilimumab: 2.9 months(1.6-5.2) vs BSC: 4.9 months (3.5-6.5)No improvement in iPFS(HR=1.44: 80% CI 1.09-1.91, P=0.097)
- Overall survival Ipi: 12.7mo, BSC: 12.1mo (NS)
Randomized phase II study of ipilimumab vs. BSCfollowing first line therapy
1. Moehler M et al. ASCO 2016.4011. 2. ClinicalTrials.gov. NCT01585987.

Keynote-012: pembrolizumab phase Ib
• 39 patients (19 East Asia, 20 ROW) • Pembrolizumab 10mg/Kg every 2 weeks • PD-L1 enriched : 22C3 pharmDx kit (Dako)
- screen : 65/162 (40%) by prototype (tumor cell ≥ 1%)
• Mostly ≥ 3rd linesRR PR 13
(33%)PFS 1.9 MoOS 11.4 Mo
Bang et al. ASCO 2015

KEYNOTE-059: Efficacy and Safety of Pembrolizumab Alone or in Combination With Chemotherapy in Patients With Advanced Gastric or Gastroesophageal Cancer
Zev A. Wainberg,1 Shadia I. Jalal,2 Kei Muro,3 Harry H. Yoon,4 Marcelo Garrido,5 Talia Golan,6 Toshihiko Doi,7Daniel V. Catenacci,8 Ravit Geva,9 Geoffrey Ku,10 Jonathan Bleeker,11 Yung-Jue Bang,12 Hiroki Hara,13 Hyun Cheol Chung,14
Mary J. Savage,15 Jiangdian Wang,15 Minori Koshiji,15 Rita P. Dalal,15 Charles S. Fuchs16
1David Geffen School of Medicine at University of California, Los Angeles, Los Angeles, CA, USA; 2Indiana University School of Medicine, Indianapolis, IN, USA; 3Aichi Cancer Center Hospital, Nagoya, Aichi, Japan; 4Mayo Clinic, Rochester, MN, USA; 5Pontificia Universidad Católica de Chile, Santiago, Chile; 6Sheba Medical Center and the Sackler School of Medicine, Tel Aviv, Israel; 7National Cancer Center East, Chiba, Japan; 8University of Chicago Medicine, Chicago, IL, USA; 9Tel Aviv-SouraskyMedical Center, Tel Aviv University, Tel Aviv, Israel; 10Memorial Sloan Kettering Cancer Center, New York, NY, USA; 11Sanford Health, Sioux Falls, SD, USA; 12Seoul National University Hospital, Seoul, Republic of Korea; 13Saitama Cancer Center, Saitama, Japan; 14Yonsei Cancer Center, Yonsei University College of Medicine, Seoul, Republic of Korea; 15Merck & Co., Inc., Kenilworth, NJ, USA; 16Yale Cancer Center, New Haven, CT, USA

.
Cohort 3 No prior therapyPD-L1 positive
Treat for up to 35 cycles
(~2 years), or until progression or
intolerable toxicity
Follow-up for survival by telephone until
death, withdrawal, or study end
Cohort 2 No prior therapy
PD-L1 positive or negative
Pembrolizumab 200 mg Q3W + Cisplatin 80 mg/m2 Q3W + 5-FU 800 mg/m2 Q3W or
Capecitabine 1000 mg/m2 BID Q3Wa
Cohort 1 ≥2 prior lines of chemotherapy
PD-L1 positive or negativePembrolizumab
200 mg Q3W
Pembrolizumab 200 mg Q3W
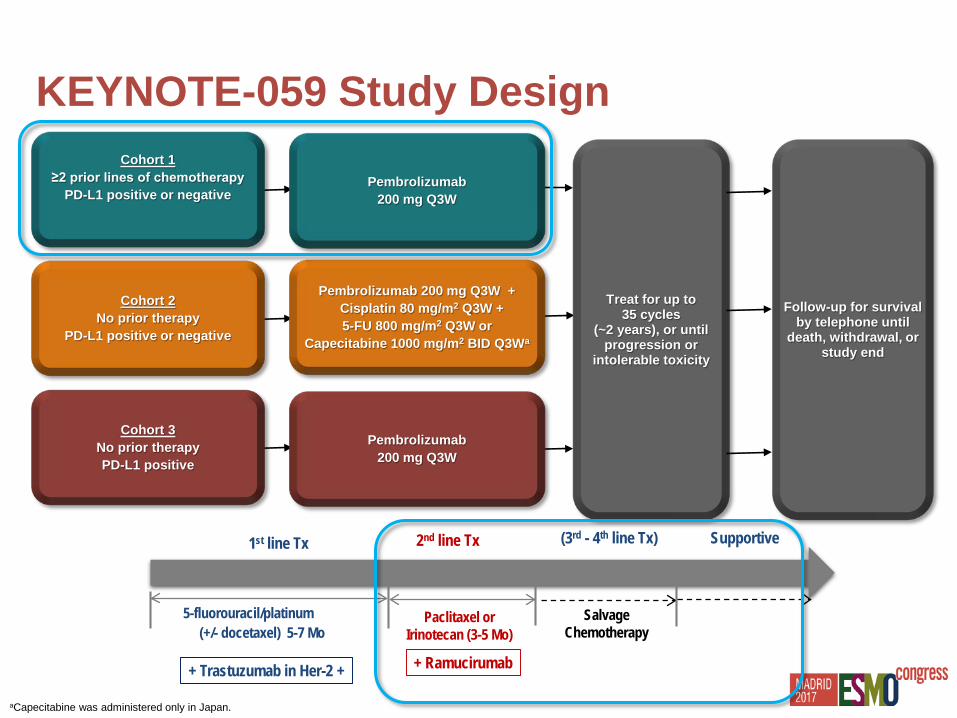
Response assessment per RECIST v1.1: First scan 9 weeks after cycle 1, then every 6 weeks for year 1 and every 9 weeks thereafterPrimary end points: Safety (all cohorts); ORR by central review per RECIST v1.1 (cohort 1: all patients and patients with PD-L1–positive expression); ORR by central review per RECIST v1.1 (cohort 3)PD-L1 positive was defined as combined positive score (CPS) ≥1 (previously reported as and equivalent to CPS ≥1%), where CPS = the number of PD-L1–positive cellsb (tumor cells, lymphocytes, and macrophages) divided by the total number of tumor cells × 100
aCapecitabine was administered only in Japan.bPD-L1 IHC 22C3 pharmDx (Agilent Technologies, Carpinteria, CA, USA).
KEYNOTE-059 (NCT02335411) Study Design
Cohort 3 No prior therapyPD-L1 positive
Treat for up to 35 cycles
(~2 years), or until progression or
intolerable toxicity
Follow-up for survival by telephone until
death, withdrawal, or study end
Cohort 2 No prior therapy
PD-L1 positive or negative
Pembrolizumab 200 mg Q3W + Cisplatin 80 mg/m2 Q3W + 5-FU 800 mg/m2 Q3W or
Capecitabine 1000 mg/m2 BID Q3Wa
Cohort 1 ≥2 prior lines of chemotherapy
PD-L1 positive or negativePembrolizumab
200 mg Q3W
Pembrolizumab 200 mg Q3W
aCapecitabine was administered only in Japan.
KEYNOTE-059 Study Design
5-fluorouracil/platinum(+/- docetaxel) 5-7 Mo
Paclitaxel or Irinotecan (3-5 Mo)
+ Trastuzumab in Her-2 + + Ramucirumab
Supportive2nd line Tx (3rd - 4th line Tx)1st line Tx
Salvage Chemotherapy

Data cutoff: April 21, 2017.
Cohort 1: Baseline CharacteristicsCharacteristic N = 259
Median age (range), y 62 (24-89)
Male, n (%) 198 (76)
Race, n (%)WhiteAsianOther
200 (77)41 (16)7 (3)
ECOG PS, n (%)01
107 (41)151 (58)
No. of prior therapies, n (%)23≥4
134 (52)75 (29)50 (19)
Characteristic N = 259
Location of primary tumor, n (%)
GEJGastric
134 (52)124 (48)
Prior gastrectomy, n (%)Total Partial No
49 (19)17 (7)
193 (75)
PD-L1 expression, n (%)PositiveNegativeUnknown
148 (57)109 (42)
2 (1)
HER2 status, n (%)PositiveNegativeIntermediate
63 (24)194 (75)
2 (1)

aPD-L1 positive was defined as combined positive score (CPS) ≥1 (previously reported as and equivalent to CPS ≥1%), where CPS = ratio of PD-L1–positive cells (tumor cells, lymphocytes, and macrophages) to the total number of tumor cells × 100. bOnly confirmed responses were included. cCR + PR + SD ≥2 months.Data cutoff: April 21, 2017.
Cohort 1: Response
• Median (range) follow-up in cohort 1: 5.6 (0.5-24.7) months• 134 patients received pembrolizumab as third-line therapy; ORR was 16%, and DCR was 31%• 125 patients received pembrolizumab as fourth plus–line therapy; ORR was 7%, and DCR was 23%
Responseb
All Patients PD-L1 Positivea PD-L1 NegativeN = 259 n = 148 n = 109
% 95% CI % 95% CI % 95% CI
ORR 12 8-17 16 11-23 6 3-13
DCRc 27 22-33 34 26-42 19 12-28
BORCR 3 1-6 3 1-8 3 1-8PR 9 6-13 13 8-19 4 1-9
SD 16 12-21 18 12-25 15 9-23
PD 56 49-62 53 44-61 60 50-69

Cohort 1: Best Percentage Change and Longitudinal Change in Target Lesion Size
PD-L1 positive
PD-L1 expression unknown
PD-L1 negative
Cha
nge
From
Bas
elin
e, %
95 patients (42%) experienced a reduction in target lesion size
–140
–120
–100
–80
–60
–40
–20
0
20
40
60
80
100
120
140
30% decrease
20% increase
Median (range) duration of response: 14.2 (2.4-19.4+) months
aOnly patients with measurable disease per RECIST v1.1 by central review at baseline who had ≥1 postbaseline assessment were included (n = 223); assessment was nonevaluable in 1 patient.
bLongitudinal change in the sum of the longest target lesion diameters from baseline in responders (n = 31).+No progressive disease at last disease assessment.Data cutoff: April 21, 2017.
Cha
nge
From
Bas
elin
e, %
Time Since Treatment Initiation, months
20% increase
30% decrease
On-treatment responderDiscontinued responder
0 2 4 6 8 10 12 14 16 18 20 22 24
–100
–80
–60
–40
–20
0
20
40
60
80
100
120
140Best Percentage Change in All Patients (n = 224)a Longitudinal Change in Responders (n = 31)b

Data cutoff: April 21, 2017.
Cohort 1: PFS and OS in All Patients
259 137 55 37 28 25 8 6 4 2 1 0 0 0 259 203 147 115 95 78 54 36 27 14 8 2 1 0
0 2 4 6 8 10 12 14 16 18 20 22 24 26
100
90
80
70
60
50
40
30
20
10
00 2 4 6 8 10 12 14 16 18 20 22 24 26
100
90
80
70
60
50
40
30
20
10
0
Prog
ress
ion-
Free
Sur
viva
l, %
Ove
rall
Surv
ival
, %
No. at risk No. at riskTime, months Time, months
PFSMedian (95% CI) 6-mo rate
2.0 (2.0-2.1) mo 14.6%
OSMedian (95% CI) 6-mo rate
5.5 (4.2-6.5) mo 45.7%

Data cutoff: April 21, 2017.
Cohort 1: PFS and OS by PD-L1 Expression
No. at risk
0 2 4 6 8 10 12 14 16 18 20 22 24 26
100
90
80
70
60
50
40
30
20
10
00 2 4 6 8 10 12 14 16 18 20 22 24 26
100
90
80
70
60
50
40
30
20
10
0
148PD-L1+ 89 39 27 21 20 7 6 4 2 1 0 0 0 148 124 92 69 57 50 36 26 23 10 5 1
PD-L1– 109 48 16 10 7 5 1 0 0 0 0 0 0 0 109 79 55 46 38 28 18 10 4 4 3 1 1 0
Prog
ress
ion-
Free
Sur
viva
l, %
Ove
rall
Surv
ival
, %
No. at risk
Time, months Time, months
PFSMedian (95% CI)
6-morate
PD-L1+ 2.1 (2.0-2.1) mo
18.2%
PD-L1– 2.0 (1.9-2.0) mo
9.9%
OSMedian (95% CI)
6-morate
PD-L1+ 5.8 (4.4-7.8) mo
48.4%
PD-L1– 4.6 (3.2-6.5) mo
42.9%
00
FDA approved Pembrolizumab
as of Sep. 22th 2017

Cohort 3 No prior therapyPD-L1 positive
Treat for up to 35 cycles
(~2 years), or until progression or
intolerable toxicity
Follow-up for survival by telephone until
death, withdrawal, or study end
Cohort 2 No prior therapy
PD-L1 positive or negative
Pembrolizumab 200 mg Q3W + Cisplatin 80 mg/m2 Q3W + 5-FU 800 mg/m2 Q3W or
Capecitabine 1000 mg/m2 BID Q3Wa
Cohort 1 ≥2 prior lines of chemotherapy
PD-L1 positive or negativePembrolizumab
200 mg Q3W
Pembrolizumab 200 mg Q3W
KEYNOTE-059 Study Design
5-fluorouracil/platinum(+/- docetaxel) 5-7 Mo
Paclitaxel or Irinotecan (3-5 Mo)
+ Trastuzumab in Her-2 + + Ramucirumab
Supportive2nd line Tx (3rd - 4th line Tx)1st line Tx
Salvage Chemotherapy

Cohort 2: Response
Responseb
All Patients PD-L1 Positivea PD-L1 NegativeN = 25 n = 16 n = 8
% 95% CI % 95% CI % 95% CI
ORR 60 39-79 69 41-89 38 9-76DCRc 80 59-93 75 48-93 75 35-97BOR
CR 4 0-20 0 0-22 13 0-53PR 56 35-76 69 41-89 25 3-65SD 32 15-54 19 4-48 50 16-84PD 4 0-20 6 0-30 0 0-37
• Median (range) follow-up in cohort 2: 13.8 (1.8-24.1) monthsaPD-L1 positive was defined as combined positive score (CPS) ≥1 (previously reported as and equivalent to CPS ≥1%), where CPS = number of PD-L1–positive cells (tumor cells, lymphocytes, and macrophages) divided by the total number of tumor cells × 100.bOnly confirmed responses were included.cCR + PR + SD ≥6 months.Data cutoff: April 21, 2017.

Cohort 2: Best Percentage Change and Longitudinal Change in Target Lesion Size
aOnly patients with measurable disease per RECIST v1.1 by central review at baseline who had ≥1 postbaseline assessment were included (n = 25); assessment was nonevaluable for 1 patient.bLongitudinal change in the sum of the longest target lesion diameters from baseline in patients with ≥1 postbaseline assessment (n = 25).+No progressive disease at last disease assessment.Data cutoff: April 21, 2017.
24 patients (96%) experienced a reduction in target lesion size
–100
–80
–60
–40
–20
0
20
Cha
nge
From
Bas
elin
e, %
PD-L1 positivePD-L1 expression unknownPD-L1 negative 0 2 4 6 8 10 12 14 16 18 20 22 24
–100
–75
–50
–25
0
25
50
Cha
nge
From
Bas
elin
e, %
On-treatment responderDiscontinued responderOn-treatment nonresponderDiscontinued nonresponder
Time Since Treatment Initiation, months
Median (range) duration of response: 4.6 (2.6-20.3+) months
Best Percentage Change in All Patients (n = 24)a Longitudinal Change in All Patients (n = 25)b

Cohort 2: PFS and OS
25
No. at risk24 21 17 8 8 5 4 3 3 3 3 0 0 25
No. at risk24 22 19 18 17 13 12 12 10 8 7 1 0
0 2 4 6 8 10 12 14
Time, months
16 18 20 22 24 26
100
90
80
70
60
50
40
30
20
10
0Prog
ress
ion-
Free
Sur
viva
l, %
Ove
rall
Surv
ival
, %
0 2 4 6 8 10 12 14
Time, months
16 18 20 22 24 26
100
90
80
70
60
50
40
30
20
10
0
Data cutoff: April 21, 2017.
PFSMedian (95% CI)
6-mo rate
6.6 (5.9-10.6)mo
68.0%
OSMedian (95% CI)
6-morate
13.8 (8.6-NR) mo
76.0%

Cohort 3 No prior therapyPD-L1 positive
Treat for up to 35 cycles
(~2 years), or until progression or
intolerable toxicity
Follow-up for survival by telephone until
death, withdrawal, or study end
Cohort 2 No prior therapy
PD-L1 positive or negative
Pembrolizumab 200 mg Q3W + Cisplatin 80 mg/m2 Q3W + 5-FU 800 mg/m2 Q3W or
Capecitabine 1000 mg/m2 BID Q3Wa
Cohort 1 ≥2 prior lines of chemotherapy
PD-L1 positive or negativePembrolizumab
200 mg Q3W
Pembrolizumab 200 mg Q3W
KEYNOTE-059 Study Design
5-fluorouracil/platinum(+/- docetaxel) 5-7 Mo
Paclitaxel or Irinotecan (3-5 Mo)
+ Trastuzumab in Her-2 + + Ramucirumab
Supportive2nd line Tx (3rd - 4th line Tx)1st line Tx
Salvage Chemotherapy

Cohort 3: Baseline Characteristics
Data cutoff: April 21, 2017.
Characteristic N = 31
Median age (range), y 62 (32-75)
Male, n (%) 19 (61)
Race, n (%)WhiteAsian
16 (52)15 (48)
ECOG PS, n (%)01
14 (45)17 (55)
No. of prior therapies, n (%) 0
Characteristic N = 31
Location of primary tumor, n (%)
GEJ Gastric
Prior gastrectomy, n (%)Total PartialNo
12 (39)19 (61)
9 (29)3 (10)19 (61)
PD-L1 positive, n (%) 31 (100)
HER2 negative, n (%) 31 (100)

Cohort 3: Response
Median (range) follow-up: 17.5 (1.7-20.7) months
aOnly confirmed responses were included.bCR + PR + SD ≥6 months.Data cutoff: April 21, 2017.
Responsea
N = 31
% 95% CI
ORR 26 12-45DCRb 36 19-55BOR
CR 7 1-21PR 19 8-38SD 29 14-48PD 39 22-58
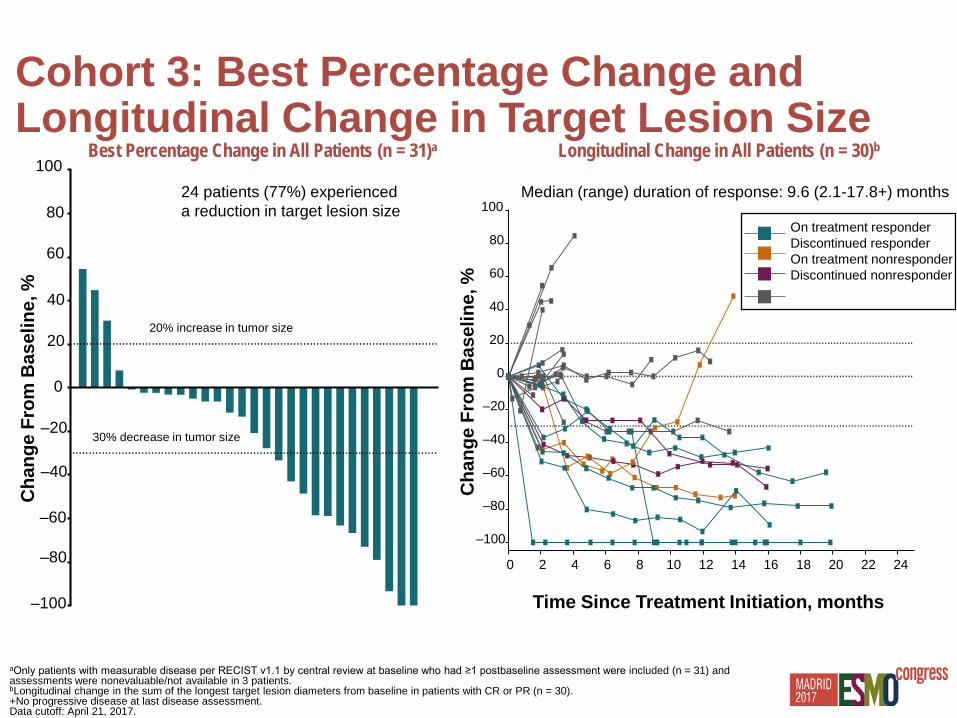
Cohort 3: Best Percentage Change and Longitudinal Change in Target Lesion Size
aOnly patients with measurable disease per RECIST v1.1 by central review at baseline who had ≥1 postbaseline assessment were included (n = 31) and assessments were nonevaluable/not available in 3 patients.bLongitudinal change in the sum of the longest target lesion diameters from baseline in patients with CR or PR (n = 30).+No progressive disease at last disease assessment.Data cutoff: April 21, 2017.
24 patients (77%) experienceda reduction in target lesion size
Cha
nge
From
Bas
elin
e, %
30% decrease in tumor size
–100
–80
–60
–40
–20
0
20
40
60
80
100
Cha
nge
From
Bas
elin
e, %
20% increase in tumor size
0 2 4 6 8 10 12 14 16 18 20 22 24
–100
–80
–60
–40
–20
0
20
40
60
80
100On treatment responderDiscontinued responderOn treatment nonresponderDiscontinued nonresponder
Median (range) duration of response: 9.6 (2.1-17.8+) months
Time Since Treatment Initiation, months
Best Percentage Change in All Patients (n = 31)a Longitudinal Change in All Patients (n = 30)b

Cohort 3: PFS and OS
Data cutoff: April 21, 2017.
31
No. at risk
23 12 10 8 4 4 4 3 3 0 0 0 0 31
No. at risk
29 23 21 21 19 18 17 14 9 3 0 0 0
0 2 4 6 8 10 12 14
Time, months16 18 20 22 24 26
100
90
80
70
60
50
40
30
20
10
0Prog
ress
ion-
Free
Sur
viva
l, %
Ove
rall
Surv
ival
, %
0 2 4 6 8 10 12 14
Time, months
16 18 20 22 24 26
100
90
80
70
60
50
40
30
20
10
0
PFSMedian (95% CI)
6-mo rate
3.3 (2.0-6.0) mo 34.9%
OSMedian (95% CI) 6-mo rate20.7 (9.2-20.7) mo
72.9%

Updated KEYNOTE-059 results • Pembrolizumab continues to demonstrate, in patients with advanced G/GEJ cancer,
– Promising antitumor activity and durable response as monotherapy in patients whose disease has progressed after ≥2 prior lines of therapy
– Encouraging antitumor activity in combination with chemotherapy in previously untreated patients
– Encouraging antitumor activity as monotherapy in previously untreated patients with PD-L1–positive tumors
• Responses were regardless of PD-L1 expression, but higher in patients with PD-L1–positive tumors in cohorts 1 and 2
• Safety was manageable and consistent with that of previous reports: no new safety signals
Summary and Conclusions

ATTRACTION-02
• Patients were permitted to continue treatment beyond initial RECIST v1.1–defined disease progression, as assessed by the investigator, if receiving clinical benefit and tolerating study drug
• Retrospective determination of tumor PD-L1 expression, defined as positive if staining in ≥1% (or ≥5%) of tumor cells, was performed in a central laboratory using immunohistochemistry (28-8 pharmDx assay) for patients with available tumor samples
2:1
Nivolumab3 mg/kg IV Q2W
Placebo
Key eligibility criteria: • Unresectable advanced or
recurrent gastric or gastroesophageal junction cancer
• Refractory to/intolerant of ≥2 standard therapy regimens
• ECOG PS of 0 or 1
Primary endpoint:• OS
Secondary endpoints:• Efficacy (PFS, BOR,
ORR, TTR, DOR, DCR)• Safety
Exploratory endpoint:• Efficacy by tumor PD-
L1 expression
Stratification:• Country (Japan vs South Korea
vs Taiwan)• ECOG PS (0 vs 1)• Number of organs with
metastases (<2 vs ≥2)
Study design of ATTRACTION-02
Ran
dom
izat
ion

ATTRACTION-02
Baseline characteristicsNivolumab
N = 330Placebo N = 163
Median age (range), years 62 (20–83) 61 (26–83)Male sex, n (%) 229 (69) 119 (73)Country, n (%)
JapanSouth KoreaTaiwan
152 (46)146 (44)32 (10)
74 (45)74 (45)15 (9)
ECOG PS, n (%) 01
95 (29)235 (71)
48 (29)115 (71)
Primary site of disease, n (%)Gastrica
Gastroesophageal junctionUnknown
272 (82)30 (9)28 (8)
135 (83)12 (7)16 (10)
Organs with metastases (≥2), n (%) 246 (75) 119 (73)Prior treatment regimens, n (%)
23
≥4
69 (21)137 (42)124 (38)
29 (18)62 (38)72 (44)
Evaluable for PD-L1 expression, n (%)≥1% vs <1%≥5% vs <5%
130 (39)16 (12) vs 114 (88)10 (8) vs 120 (92)
62 (38)10 (16) vs 52 (84)7 (11) vs 55 (89)
7
• Among PD-L1–evaluable patients, baseline characteristics between nivolumab and placebo arms were similar
aIncludes patients who have either gastric cancer or both gastric and gastroesophageal junction cancer

Efficacy: Survival
OS
PFS
Japan approved Nivolumab
as of Sep. 22th 2017

ATTRACTION-02
Best reduction from baseline in tumor burden
11
Nivolumab Placebo
• Tumor burden reduction was observed regardless of PD-L1 expression level
–100
–80
–60
–30
0
20
40
60
80
100
Bes
t Cha
nge
From
Bas
elin
e in
Tar
get L
esio
n (%
)
0
20
40
60
80
100
PD-L1 Positive
–40
–20
a a
Negative Not quantifiable
–100
–80
–60
–30–40
–20
aChange truncated to 100%
n = 113
Any reduction 12%
≥30% reduction <1%
n = 234
Any reduction 40%
≥30% reduction 19%Patient Patient
ORR, n (%)95% CI
31 (12)8–16

ATTRACTION-02
0
10
20
30
40
50
60
70
80
90
100
0 2 4 6 8 10 12 14 16 18 20 22 24 26 28
Prob
abili
ty o
f Sur
viva
l (%
)
0
10
20
30
40
50
60
70
80
90
100
0 2 4 6 8 10 12 14 16 18 20 22 24 26 28
ONO-4538
Placebo
PD-L1 <1% PD-L1 ≥1%
Hazard ratio, 0.58 (95% CI, 0.24–1.38)
Median OS, months (95% CI)
Nivolumab (n=16)
5.2 (2.8–9.4)
Placebo (n=10)
3.8 (0.8–5.0)
Prob
abili
ty o
f Sur
viva
l (%
)
114 100 75 56 49 42 37 24 15 11 7 4 3 1 0
52 40 27 22 16 14 11 6 5 4 3 2 2 2 0
16 15 10 7 5 4 4 2 2 0 0 0 0 0 0
10 8 4 2 1 1 1 0 0 0 0 0 0 0 0
Nivolumab
Placebo
Months MonthsNo. at Risk
12
Median OS, months (95% CI)
Nivolumab (n=114)
6.1 (4.8–8.6)
Placebo (n=52) 4.2 (3.0–6.9)
Hazard ratio, 0.71 (95% CI, 0.50–1.01)
Overall survival by PD-L1 expression <1% vs ≥1%
PD-L1 evaluable patients (N=192)

Patients with Stage IV G/E/GEJa N = 160 unselected for PDL1 expression,range of prior therapy 0 to >3 (mostly 2-3) sequentially enrolled
Nivolumab 3 mg/kg IV Q2W(n = 59)
Nivolumab 1 mg/kg + Ipilimumab 3 mg/kg IV Q3W
for 4 cycles (n = 49)
Nivolumab 3 mg/kg + Ipilimumab 1 mg/kg IV Q3W
for 4 cycles (n = 52)
Nivolumab 3 mg/kg IV Q2W
Checkmate-032: Nivo+Ipi Phase Ib
Janjigian et al., ASCO 2016, updated ASCO 2017
• All comers
• Exploratory Endpoints: Biomarkers (PD-L1 by Dako, MSI)

NIVO 3n = 59
NIVO 1 + IPI 3n = 49
NIVO 3 + IPI 1n = 52
ORR, n (%)* 7 (12) 12 (24) 4 (8)[95% CI] [5, 23] [13, 39] [2, 19]
BOR, n (%)*Complete response 1 (2) 1 (2) 0Partial response 6 (10) 11 (22) 4 (8)Stable disease 12 (20) 8 (16) 15 (29)Progressive disease 34 (58) 23 (47) 24 (46)Not evaluable 6 (10) 6 (12) 9 (17)
DCR, n (%)† 19 (32) 20 (41) 19 (37)Median TTR (range), months 1.6 (1.2 to 4.0) 2.7 (1.2 to 14.5) 2.6 (1.3 to 2.8)
Median DOR (95% CI), months 7.1 (3.0, 13.2) 7.9 (2.8, NE) NR (2.5, NE)BOR, best objective response; DCR, disease control rate; NE, not estimable; NR, not reached.* Investigator review.† Patients with a BOR of complete response, partial response, or stable disease.
Objective Response

†
##
#
#
#
#
##
## #
100
75
50
25
0
-25
-50
-75
-100
Bes
t Red
uction
from
Bas
elin
e in
Tar
get
Les
ions
* (%
)
#
#
##
#
100
75
50
25
0
-25
-50
-75
-100
Bes
t Red
uction
from
Bas
elin
e in
Tar
get
Les
ions
* (%
)
†
PD-L1 <1% PD-L1 ≥1% PD-L1 not evaluable/missing
100
75
50
25
0
-25
-50
-75
-100
Bes
t Red
uction
from
Bas
elin
e in
Tar
get
Les
ions
* (%
)
#
#
#
##
#
#
† †
NIVO 1 + IPI 3PD-L1–evaluable patients, 38 of 42
NIVO 3PD-L1–evaluable patients, 38 of 53
NIVO 3 + IPI 1PD-L1–evaluable patients, 34 of 41
Best Reduction in Target Lesions
* Investigator review.# Patients with confirmed response (complete or partial response).† Patients with 0% best reduction in target lesion, including 3 patients with PD-L1 ≥1% (NIVO 3, n = 2; NIVO 3 + IPI 1, n = 1) and 1 patient with PD-L1 <1% (NIVO 1 + IPI 3).
Change truncated to 100%.

* Investigator review.# Patients with confirmed response (complete or partial response).† Patients with 0% best reduction in target lesion, including 3 patients with PD-L1 ≥1% (NIVO 3, n = 2; NIVO 3 + IPI 1, n = 1) and 1 patient with PD-L1 <1% (NIVO 1 + IPI 3).
Change truncated to 100%.
Best Reduction in Target Lesions
• Responses were observed regardless of PD-L1 expression
†† †
ORR by PD-L1:PD-L1 ≥1%, 19%PD-L1 <1%, 12%
ORR by PD-L1:PD-L1 ≥1%, 40%PD-L1 <1%, 22%
ORR by PD-L1:PD-L1 ≥1%, 23%PD-L1 <1%, 0%
NIVO 1 + IPI 3NIVO 3 NIVO 3 + IPI 1
##
#
#
#
#
##
## #
100
75
50
25
0
-25
-50
-75
-100
Bes
t Red
uction
from
Bas
elin
e in
Tar
get
Les
ions
* (%
)
#
#
##
#
100
75
50
25
0
-25
-50
-75
-100
Bes
t Red
uction
from
Bas
elin
e in
Tar
get
Les
ions
* (%
)
†
PD-L1 <1% PD-L1 ≥1% PD-L1 not evaluable/missing
100
75
50
25
0
-25
-50
-75
-100
Bes
t Red
uction
from
Bas
elin
e in
Tar
get
Les
ions
* (%
)
#
#
#
##
#
#

No. at risk:NIVO 3
NIVO 1 + IPI 3NIVO 3 + IPI 1
594952
131613
10105
674
564
353
152
142
110
100
000
Pro
bab
ility
of
Pro
gre
ssio
n-F
ree
Surv
ival
*
Time (Months)
0
0.0
0.1
0.2
0.3
0.4
0.5
0.6
0.7
0.8
0.9
1.0
3 6 9 12 15 18 21 24 27 30
mPFS, median PFS.* Investigator review.
mPFS (95% CI), months
1.4 (1.2, 1.5)
1.4 (1.2, 3.8)
1.6 (1.4, 2.6)
6-monthPFS rate, %
17
24
12
NIVO 3
NIVO 1 + IPI 3
NIVO 3 + IPI 1
12-monthPFS rate, %
8
17
10
Progression-Free Survival

mOS, median OS.
No. at risk:NIVO 3
NIVO 1 + IPI 3NIVO 3 + IPI 1
594952
403533
262420
211918
201411
15148
11114
583
530
400
100
000
Time (Months)
Pro
bab
ility
of
Surv
ival
00.0
0.1
0.2
0.3
0.4
0.5
0.6
0.7
0.8
0.9
1.0
3 6 9 12 15 18 21 24 27 30 33
mOS (95% CI), months
6.2 (3.4, 12.4)
6.9 (3.7, 11.5)
4.8 (3.0, 8.4)
12-monthOS rate, %
39
35
24
NIVO 3
NIVO 1 + IPI 3
NIVO 3 + IPI 1
18-monthOS rate, %
25
28
13
Overall Survival

OS rate (95% CI), % NIVO 3NIVO 1 +
IPI 3NIVO 3 +
IPI 1
Patients with PD-L1 ≥1% n = 16 n = 10 n = 13
12 months 34 (12, 57) 50 (18, 75) 23 (6, 47)
Patients with PD-L1 <1% n = 26 n = 32 n = 30
12 months 45 (25, 62) 32 (16, 48) 25 (11, 42)
Overall Survival by PD-L1 Status

Treatment-Related Adverse Events
• One grade 5 TRAE was reported (tumor lysis syndrome in a patient treated with NIVO 3 + IPI 1)
Patients, n (%)
NIVO 3 n = 59
NIVO 1 + IPI 3n = 49
NIVO 3 + IPI 1n = 52
Any grade
Grade 3/4
Any grade
Grade 3/4
Any grade
Grade 3/4
Any TRAE 41 (69) 10 (17) 41 (84) 23 (47) 39 (75) 14 (27)Serious TRAEs 6 (10) 3 (5) 21 (43) 17 (35) 13 (25) 9 (17)TRAEs leading to treatment discontinuation
2 (3) 2 (3) 10 (20) 10 (20) 7 (13) 5 (10)
TRAEs in ≥15% of patients in any treatment arm
ALT increased 5 (8) 2 (3) 8 (16) 7 (14) 5 (10) 2 (4)AST increased 7 (12) 3 (5) 8 (16) 5 (10) 2 (4) 1 (2)Decreased appetite 9 (15) 0 5 (10) 0 3 (6) 0Diarrhea 9 (15) 1 (2) 15 (31) 7 (14) 5 (10) 1 (2)Fatigue 20 (34) 1 (2) 14 (29) 3 (6) 10 (19) 0Pruritus 10 (17) 0 9 (18) 1 (2) 12 (23) 0Rash 5 (8) 0 10 (20) 0 8 (15) 0
TRAE, treatment-related adverse event.

aPatients may continue treatment for up to 35 cycles, until confirmed progressive disease or discontinuation for any other reason. DLT dose-limiting toxicity; PK pharmacokinetics; Ram ramucirumab; Pembro pembrolizumab
Interim safety & clinical activity in patients with advanced gastric or GE junction adenocarcinoma from a multi-cohort phase 1 study of ramucirumab plus pembrolizumab: JVDF (NCT02443324) Phase 1a/b
Schedule 2: Gastric/GEJ, NSCLC, UC3+3 design (n= 3 to 6 patients)Ram 10 mg/kg, Day 1Pembro 200 mg fixed, Day 1Both IV every 3 weeks
Cohort A: 15 Gastric/GEJ (2nd-3rd Line)Schedule 1: Gastric/GEJ, BTC 3+3 design (n= 3 to 6 patients)Ram 8 mg/kg, Day 1 and 8Pembro 200 mg fixed, Day 1 Both IV every 3 weeks
Phase 1a: DLT Assessment (n=6 to 12)
Phase 1b: Cohort Expansion(n=155)a
Cohort B: 15 Gastric/GEJ (2nd-3rd Line)
Cohort C: 25 NSCLC (2nd-4th Line)
Cohort D: 25 UC (2nd-4th Line)
Cohort E: 25 NSCLC (1st Line)
Cohort A1: 25 BTC (2nd-3rd Line)
Cohort A2: 25 Gastric/GEJ (1st Line)In
terim
Ana
lysi
s
Primary: Safety and tolerabilitySecondary: PK
Primary: Safety and tolerabilitySecondary: PK and preliminary efficacy Exploratory: Biomarkers and immunogenicity
Fina
l Ana
lysi
s
Ian Chau et al. GI ASCO 2016, 2017


Keynote-012
Javelin-Ib Checkmate-032 ATTRACTION-02
Patient number
39 62 160 (N3 59, N1I3 39, N3I1 52)
330
2nd line (%) 85% 89% 100/98/100% 29%RRDCR
22%36%
10%29%
16% (14/ 26/10%)38% (32/43/41%)
11.2%40.3%
PFS (Mo) 1.9 1.5 1.4/1.5/1.6 1.61OS (Mo) ≥ 11.4 NA 5/6.9/4.8 5.32Asian 50% 40% 2% 100%Biomarker enrichment
PD-L1(+) All comers All comers All comers
PD-L1 (+) ≥1% 40% 50% 21.9% NA
ORR in PD-L1(+) ≥1%
22.2% 18.2% 27/44/27 NA
PD-L1(-) - 9.1% 12/21/0 NA
Summary of 2nd/3rd line trials with PD-1/PD-L1 inhibitor

Significant prolongation of survival in 2nd/3rd line Tx?
OS 4.5-9 months with current standard treatment in 2nd line Tx
Phase III
PD-L1 +, Phase Ib

How to select the proper patients?
• Immunoscore• PD-L1 IHC• Immune signature• TMB• Neoantigen• Novel biomarkers??

Screening: 65 of 162 (40%) patients had PDL1 (+) tumor
Muro et al. Lancet Oncol 2016
KN-012

Kim et al. ASO 2017
PD-L1 expression by IHC in Bx tissue of metastatic GCObjectivesI: Feasibility and positive rate of PD-L1 IHC in biopsy tissueII: Prognostic role and ethnic differencesIII: coevaluation of MSI, RNA signature, mutation load
In collaboration with MDACC, MSKCC

- PD-L1 positivity was 71.9%- Not prognostic nor correlation with any clinicopathologic parameters
Preliminary data of Korean patients (n=220, 2007-2014)
Different cut-off ?
Need validation of clinical relevance in conjunction with
clinical trials

Incorporation of PD-L1 IHC with histologic molecular subgroup (n=296)
- IHC for PD L1 IHC 22C3 PharmDx assay (Agilent) - Standard protocol as using a Autostainer link 48 (Dako)
Kim et al. In revision

1-49%<1%
P=0.009≥ 50%
Prop
ortio
n (%
)
EBV MSI CIN GS
0%
25%
50%
75%
100%
PD-L1 TPS
Prop
ortio
n (%
)
EBV MSI CIN GS
0%
25%
50%
75%
100%
moderatmild
P=0.007marked
0
IC PD-L1
OS TPS OS ICPS
OS
prob
abilit
y
P=0.0155 year OS 72.8% vs 49.7%
TPS <1TPS ≥1
Time (months)
P=0.0355 year OS 74.5% vs 66.7%
OS
prob
abilit
y
Time (months)
ICPS (-)ICPS (+)

MK3475 *4 cycles MK3475 *8 cycles MK3475 *11 cycles
• TL1 (LN at anterior aspect of pancreas) > 71.6→41.4→35.4→44.9mm
• TL2(LN at retropancreatic area) > 53.0→26.8→20.9→21.5mm
• Target lesion : 124.6→68.2 (- 46.7%) →56.3→66.4mm • PR at 8 weeks• PFS 8.8 (9.7 by irRECIST) months
Case (M/72, after 4th line of Tx)

Cases with peritoneal carcinomatosis
• M/72 after 3rd line Tx
TL1(abdominal wall mass) : 26.8→32.6mm (+21.6%), Ascites and pleural effusion increase PD
PFS 1.6 months
• M/35 after 4th line of Tx
SD (+1.6%)
PFS 1.2 months
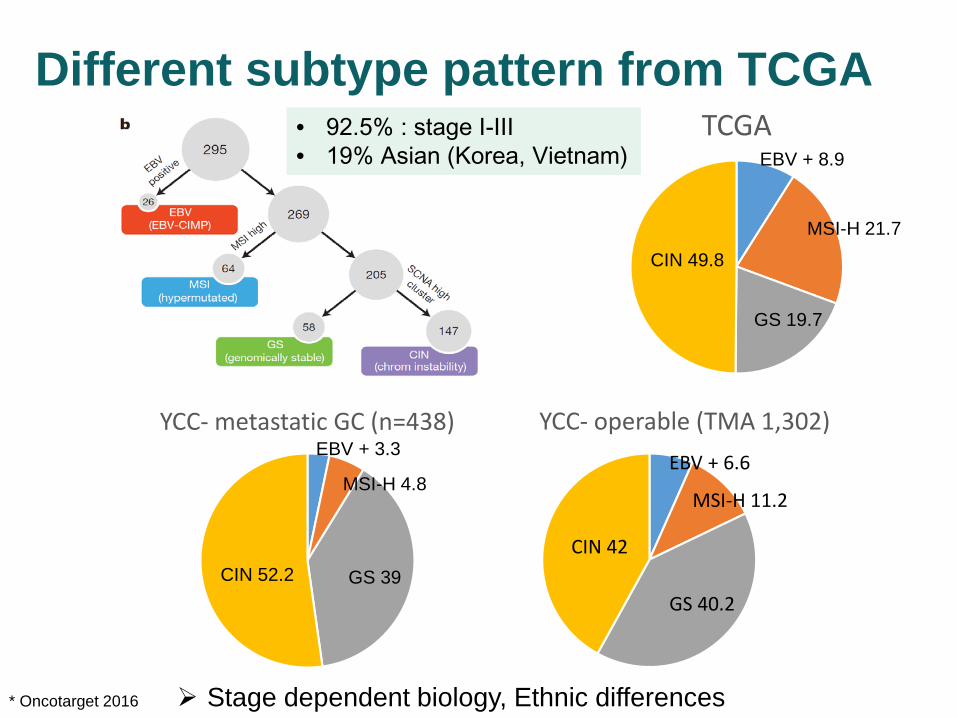
Stage dependent biology, Ethnic differences * Oncotarget 2016
Different subtype pattern from TCGA TCGA
EBV + 8.9
MSI-H 21.7
GS 19.7
CIN 49.8
YCC- metastatic GC (n=438)EBV + 3.3
MSI-H 4.8
GS 39CIN 52.2
YCC- operable (TMA 1,302)
MSI-H 11.2
EBV + 6.6
GS 40.2
CIN 42
• 92.5% : stage I-III • 19% Asian (Korea, Vietnam)

• Most common (~40%)• With druggable targets • HER2 negative group (~90%)
-> in need of drug development
Triple Negative Gastric Cancer (EBV negative, MSI negative, HER2 negative)
-> Proper screening and new drug development!
• Most common in Korea/ Asia(30~40%)• No druggable targets• Necessity of new targets/drugs
• Potential for Immune Tx• Less incidence( ~12%)
PD-L1 / CD27476543210
mR
NA
Expr
essi
on (R
NA
Seq
RPK
M)(l
og2)
CIN EBV GS MSIMolecular Subtype

Control Group(n=80)
Random1: 4
(N=400)
1st line GC
Consent #1
Paclitaxel(n=80)
PTEN loss(n=50)
GKS2636771+paclitaxel
EGFR positive(2+ or 3+)
(N=80)
Biomarker Group
(N=320)
Therapy based on molecular
profile
Apatinib+paclitaxel
Paclitxel (control) (n=30)
TGF-b inhibitor + paclitaxel
Consent #2
Molecular profiling
EBV+/MSI-H/PD-L1+(N=50) Nivolumab+ paclitaxel
None
Power=79.0 %
Power=70 %
To detect a difference in PFS(2.9→4.4months,HR=0.659, alpha=0.136months accrual, 6months f/uDrop out=10% in f/u
INCB805428+paclitaxel
VEGF-A/Ang-2 inhibitor + paclitaxel
Power=90%
Molecular profiling
IHC screening at Central lab
+ NGS (522genes)
with Mutation load
Current status
Start screening at April 2016 1st patient enrollment at August
2016
-> As of 1st November, 2017 Screening: 204 Enrollment: 82
Biomarker-driven umbrella trial of Her-2(-) metastatic GC as a 2nd line Tx in combination with paclitaxel

Future directions
FP/Pt ± RT• Irinotecan,
docetaxel orpaclitaxel1
• Ramucirumab± paclitaxel3,4
2L• Pt + FP doublet/triplet
based regimen
• Trastuzumab + cisplatin+5-FU analogue
(Neo)Adjuvant1
HER2 positive
HER2 negative1L1
• 6–8 cycles or until disease progression
Maintenance
Potential for checkpoint inhibitor Ab therapy± other I-O agents± antiangiogenics
± cytotoxics± other targeted therapy
If prolonged progression-free interval after 1L, can rechallenge
with Pt/FP2
May discontinue due to toxicity or
infection
*Not yet approved in EU. 1L, first-line; Ab, antibody; FP/5-FU, 5-fluorouracil; HER, human epidermal growth factor; I-O, immunotherapy, Pt, cisplatin; RT; radiation therapy. 1. Waddell Tet al. Ann Oncol. 2013;24(suppl 6):vi57-vi63. 2. Hershman DL et al. J Clin Oncol. 2014;32(18):1941-1967. 3. Fuchs CS, et al. Lancet. 2014;383(9911):31-39. 4. Wilke H et al. Lancet Oncol. 2014;15(11):1224-1235.
• CTxmonotherapy
• Nivolumab/pembrolizumab
3L