eskom tariff history · it has long been necessary that a comprehensive history of eskom's...
TRANSCRIPT

Eskom
Tariff History
1973 - 1991

ESKOM TARIFF HISTORY
1973 TO 1991
INDEX : Page numbers EXECUTIVE SUMMARY 3
SECTION 1 - GENERAL DESCRIPTION (WHITE)
1.1 INTRODUCTION 4 1.2 HISTORICAL TARIFF PRACTICES 4
1.2.1 TRADITIONAL LPU / SPU RELATIONSHIP 4 1.2.2 TARIFF VERSUS ADDITIONAL CHARGES 4 1.2.3 REGIONAL TARIFFS 5 1.2.4 COAL COST ADJUSTMENT 5 1.2.5 THE SURCHARGE / DISCOUNT CONCEPT 7
1.3 MILESTONE DEVELOPMENTS 1.3.1 INTRODUCTION OF TARIFF D FOR RURAL APPLICATION 7 1.3.2 THE DE VILLIERS COMMISSION OF INQUIRY 9 1.3.3 1986 NATIONALISATION OF TARIFFS 9 1.3.4 INTRODUCTION OF TARIFF E(OFF-PEAK) AND
TARIFF F(VARIABLE USE) 11
1.3.5 INTRODUCTION OF TARIFF S1 FOR SMALL POWER CUSTOMERS WITH LOW USAGE, USING A PREPAYMENT MEASUREMENT SYSTEM
11
1.3.6 INTRODUCTION OF TIME-OF-USE TARIFFS FOR LARGE POWER CUSTOMERS
12
1.4 THE TARIFF INCREASE / TARIFF REVISION PROCESS 13 1.5 SPECIAL PRICES 13 1.6 TARIFF INCREASES 14
SECTION 2 - AVERAGE ESKOM PRICE INCREASES (BLUE) 15
SECTION 3 - INDIVIDUAL TARIFFS 1973 TO 1985 (YELLOW) 24
SECTION 4 - INDIVIDUAL TARIFFS 1986 TO 1991 (GREEN) 58
SECTION 5 - TRENDS & GRAPHS (WHITE) 65
SECTION 6 - CONCLUSION & REFERENCES
79

EXECUTIVE SUMMARY 1. It has long been necessary that a comprehensive history of Eskom's tariffs be compiled from the
various sources of information available. 2. The cumulative real price increase since 1973 is 11,27% below inflation. The cumulative revenue
increase is 35,61% above inflation. This difference is due to tariff restructuring and a change in customer mix and customer consumption profiles over this period.
3. The standard tariffs applicable as at 1973 were Tariff (A) for large power users; Tariff (B) for small
power users other than domestic; and Tariff (C) for domestic users. The tariff structures were much the same throughout Eskom's eight Undertakings, although the tariff parameters differed greatly. The differentiation was generally effected by means of a surcharge or discount applied to the tariff.
4. By 1991 the tariff range consisted of Tariff (A) for large power users; Tariff (B) for small power users,
general; and Tariff (C) for domestic users; Tariff (D) for small power use, general (mainly applicable to rural supplies); Tariff (E) for large power off-peak use; Tariff (F) for large power variable use; and Tariff S1 for small power, low use where a prepayment measurement system is used. A number of special pricing options such as Time-of-Use options have also been introduced during the past few years.
5. The eight undertakings became five undertakings as from 1985, and at this time the tariff differences
between the undertakings were relatively small. Tariffs were rationalised as a result of the De Villiers Commission of Inquiry convened in 1984.
6. The 1986 nationalisation of the tariffs made the application of tariffs easier. Neighbouring customers
were no longer charged different tariffs. The transmission percentage surcharge applied to large power tariffs accounted for small differences in transmission charges for varying distances from Johannesburg.
7. The 1986 nationalisation also saw changes to the components included in the tariffs, and those
costs which had to be recovered by means of additional charges. This aspect has made it difficult to compare pre-1986 tariffs with post-1986 tariffs. As a result, the historical tariff figures have been covered in two sections, the first from 1973 until the end of 1985, the second from the nationalisation in 1986 until 1991.

SECTION 1
GENERAL DESCRIPTION
1.1 INTRODUCTION Historical information is important for any organisation, in order to understand the present situation in terms of past decisions and operating procedures. Many queries are received from customers and other interested parties regarding historical Eskom tariffs. Lessons learnt from past pricing practices must be taken into account when examining different new pricing options. The role of tariffs in Eskom's operations are of major importance, firstly because they are a source of funds to continue operation, and secondly because of the attention they receive from Eskom customers, who are deeply interested in the price levels and the philosophy behind our pricing policy. Although the information has previously been available, this has been in a number of diverse records, which needed to be consolidated into one document containing the essential information. An ordered, comprehensive document containing historical tariff information will prove invaluable in providing replies to the queries received, efficiently and timeously, and in referencing particular data needed for tariff studies. The various relevant Government Gazettes, annual tariff books and other supporting documentation are available at the Pricing Policy Department in Megawatt Park for further reference if necessary.
1.2 HISTORICAL TARIFF PRACTICES
1.2.1 TRADITIONAL LPU / SPU RELATIONSHIP Traditionally the Large Power User (LPU) tariff (Tariff A) was calculated, based on a 60:40 demand:energy ratio for a hypothetical unity power factor and unity load factor customer, based on historical costs and revenue requirements. The Small Power User (SPU) tariffs were then derived from Tariff A.
1.2.2 TARIFF VERSUS ADDITIONAL CHARGES Any Pricing Policy requires that a decision be made as to which costs must be covered by tariffs, and which costs must be recovered by means of other, non-tariff charges, such as connection fees, service charges, extension and capital charges. Eskom's standard tariffs cover the average costs of providing supply. These include the costs of generation, transmission and distribution, a certain amount of capital expenditure on local reticulation networks, and administrative costs. Extension or capital charges are levied when the costs associated with a particular supply are significantly higher than the corresponding average cost recovered by the standard tariff applicable to the customer concerned, or if the service required by a particular customer includes features not normally provided to other customers. This expenditure could be recovered by means of a monthly extension charge or monthly

capital charge. In certain cases the customer could be required to make an up-front payment before supply is made available.
1.2.3 REGIONAL TARIFFS Prior to January 1986, Eskom applied different tariffs in the various Undertakings, on the basis that transmission costs to different areas differed substantially, and that distribution and reticulation costs differed greatly depending on local conditions. Following the De Villiers Commission of Inquiry (see paragraph 1.3.2) in November 1984, Eskom nationalised its tariffs, and these nationalised tariffs came into effect as from January 1986. (There is still some debate whether this was the intent of the recommendations made by the De Villiers Commission).
1.2.4 COAL COST ADJUSTMENT Until the tariffs were nationalised in 1986, the advertised tariffs were subject to a coal cost adjustment on a quarterly basis. In effect, the energy rates were adjusted by a specified amount per number of cents that the actual cost of coal differed from a "base" cost of coal defined at a specified time. Before Eskom's distribution undertakings were interconnected by a national transmission network, the "base" cost of coal specified in the licence granted to each undertaking reflected the cost to Eskom of the coal burnt in the local power stations involved. Even after national interconnection in the early seventies, and the coordinated operation of all Eskom's power stations by a Central Generating Undertaking from January 1972, the regional influence on the "base" cost of coal persisted for many years. An example of the coal cost adjustment clause is the following one for Natal Undertaking during 1976: "an energy charge at the rate of 0.27c ... for each kilowatt hour (kW.h) supplied in the month ; provided that the said kW.h having been based on the cost of coal consumed at Congella, Umgeni, Colenso and Ingagane Power Stations being R 4.11 per metric ton shall be adjusted from time to time in the following manner : The average cost of coal consumed at the said power station shall be determined in Rand per metric ton for each three-monthly period to the end of March, June, September and December. The adjustment to the energy charge rate applicable during the succeeding three months shall be the difference between the average coal cost for the period of three months immediately passed and the aforesaid basic coal cost of R4.11 per metric ton, multiplied by the number of metric tons consumed during the period of three months immediately passed, divided by the total number of kW.h sold by the Licensee in its Natal Undertaking during the same period; provided that the adjustment shall be in complete multiples of 0.005c and that incomplete parts of such multiples shall be neglected. The adjustment so determined shall be added to the basic energy charge rate of 0.27c per kW.h if the aforesaid average coal cost exceeds R4.11, or subtracted from the basic energy charge rate if the average coal cost is less than R4.11 per metric ton." The survival of the regional influence on the "base" cost of coal after national interconnection in the early seventies was due to the bureaucratic inertia of revising licences granted by the Electricity Control Board. Furthermore, particularly due to the "tilting" of the tariff components to achieve to achieve the 60:40 ratio referred to in paragraph 1.2.1 above, the level of the "base" cost of coal was considered far less

important than the need for a mechanism to adjust tariff energy rates as coal costs changed. The De Villiers Commission of Inquiry gave much attention to the manner in which Eskom raised its tariff levels whenever required to cover its costs of supply. The Commission found that a significant cause for customer dissatisfaction was the covert nature of the coal cost adjustment mechanism, giving rise to a tariff increase over and above the effect of any surcharge increase announced officially. The quarterly adjustment of energy rates for changes in coal cost was abandoned from the beginning of 1986, as a result of the De Villiers Commission of Inquiry recommendation that any increases in the price of electricity should occur only once a year and that such increases should include the coal price adjustment for the year concerned. At the same time, the cost of coal had become relatively unimportant when weighed against the large capital costs of new generation capacity, and the confusion and large workload involved in adjusting these rates on a quarterly basis, as compared to the relatively small effect on Eskom's income, made the dropping of the concept a welcome move.
1.2.5 THE SURCHARGE / DISCOUNT CONCEPT The concept of applying a surcharge or discount to a defined tariff formula originated from the legislation governing Eskom's manner of charging for supplies of electricity. To avoid cumbersome bureaucratic obstacles to periodic tariff increases, the Electricity Act (Act no 40 of 1958) allowed Eskom to adjust tariff levels to cover its costs of supply, provided such adjustments affected all customers "in equal proportions". Eskom's approach in complying with this legal requirement was to obtain the Electricity Control Board's approval of any changes to tariff formulae. The approved tariff formulae were then made subject to discounts or surcharges for the purpose of calculating customers' accounts. For many years when inflation had not yet become rampant, regular upward adjustments were made to surcharges without seeking the approval of the Electricity Control Board. The tariffs are set with particular rates at a particular time. Instead of changing these rates on a regular basis (sometimes a number of times during one year), any future changes to the tariffs are effected by applying a surcharge or discount. For example, where a surcharge of 2.5 percent is applicable, the notified tariff rates are applied, the total amount calculated, and the surcharge of 2.5 percent added to the total. In some cases, the same formulae are applied in different undertakings, but the surcharge or discount may differ depending on local costs. The procedure followed in terms of current legislation when amendments to tariffs become necessary is described in section 1.4 below.
1.3 MILESTONE DEVELOPMENTS
1.3.1 INTRODUCTION OF TARIFF D FOR RURAL APPLICATION Prior to 1982, Eskom had three basic tariffs, viz Tariff A for Large Power customers; Tariff B for Small Power customers other than those supplied under Tariff C; and Tariff C for domestic supplies. Although there was a Tariff D applicable in the Rand and Orange

Free State Region during the early '70's, this was dropped in 1974, after which most farming supplies were charged in terms of Tariff B. After prolonged representations on the part of the South African Agricultural Union (SAAU) to both the Government and Eskom, Tariff D was introduced by Eskom in January 1982 for application in rural areas. The new tariff was structured in much the same way as Tariff B, except that the high energy rate was now applied to the first 800 kW.h of consumption per month instead of 500 kW.h as for Tariff B. This was done in order to partly recover the higher costs associated with rural electrification. The remaining costs of providing supply not covered by the standard tariff were recovered by means of an additional fixed monthly charge (Monthly Extension Charge - MEC) now known as a "Monthly Rental". This MEC was calculated according to a formula based on recovering these additional costs over a period of 23 years. The MECs applied were in many cases amounts of hundreds of rands, and the main thrust of the SAAU drive for nationalisation of tariffs and pooling of costs was in order to bring these high MECs down. With the nationalisation of the tariffs incorporating the pooling of costs and the inclusion of a larger amount of capital expenditure into the standard tariff (see 1.3.3 below), a "kilometer factor" was introduced. Although the new tariff was designed to include the cost of 1 km of line, last minute representation to Eskom by the SAAU and the Minister of Agriculture resulted in a 2 km factor being introduced. In effect, existing customers had their capital charges reduced by an amount equivalent to the cost of 2 km of line, and monthly capital charges for new customers were only charged on line lengths in excess of 2 km per customer. After the investigation into the profitability of Tariff D done during 1988, it was seen that Tariff D was not covering the costs of supply. This was because the tariff was designed based on an average consumption of 1000 kW.h per month, whereas the actual average usage was in the region of 750 kW.h per month; and also because the costs of construction had risen drastically over the intervening years. As a result of this investigation, a change was made during 1989 to the monthly capital charges structure, whereby the costs of only 200 meters of line were calculated to be included in the standard tariff (not 2 km), beyond which a R/meter monthly capital charge was applied.
1.3.2 DE VILLIERS COMMISSION OF INQUIRY The De Villiers Commission of Inquiry was appointed in May 1983, chaired by Dr W J De Villiers. The terms of reference of this Commission included "to inquire into and report on the principles of electricity supply and the impact of price determination and existing tariff structures on the financial policy of the country, with special reference to inflation and economic growth." The following basic requirements were identified in order to achieve an economically justifiable and understandable tariff structure according to the guidelines of the Commission of Inquiry :
The establishment of a uniform national tariff structure.
To the extent that it could be economically justified, extension charges were to be removed and costs pooled.

To encourage customers, by means of the tariff, to make the best use of Eskom's generation equipment during periods when such equipment is not fully utilised, and avoid load patterns which added disproportionately to the demand during periods when Eskom's generation capacity was fully utilised.
To encourage customers to use electricity more efficiently.
To promote the possibility of interruptible supplies to some larger customers with compensatory tariff benefits.
The first step towards implementing the nationalised tariffs recommended by the Commission was for the six existing licences to be consolidated. The Eskom National Licence, 1986 was granted to Eskom in terms of the Electricity Act, 1958 (Act 40 of 1958) on 8 October 1985.
1.3.3 1986 NATIONALISATION OF TARIFFS It is difficult to compare tariffs prior to 1986 with those after 1986, because the nationalisation opportunity was used to make other adjustments at the same time, such as rectifying the imbalance of the 60:40 ratio which had developed over the past few years, and including a larger amount of capital redemption in Tariff D. The following salient points arising out of Recommendation 6 of the Commission of Inquiry were put to the Electricity Council and the Electricity Control Board, for implementation from 1 January 1986 :
Discard the concept of undertakings, and implement a national tariff structure, with annual tariff increases;
distinguish between demand and energy costs, where applicable ;
determine cost of transmission to agreed reference points ;
pool costs for groups of consumers; and
create tariff structures that satisfy load management requirements. Due to the nationalisation and restructuring of the tariffs and the rectifying of certain imbalances, certain customers on particular tariffs enjoyed a decrease of as much as 28 % in their electricity costs, while other customers faced increases in the order of 6 %. At the same time, the monthly extension charges and capital charges, particularly for supplies in rural areas, were recalculated, because the tariff itself contained a larger capital component. For many of the smaller supplies which had been in existence for some time, this meant that the monthly capital charges were cancelled completely, while most of the newer supplies enjoyed a substantial reduction. Tariff D supplies were particularly affected by this reduction of monthly capital charges. Prior to the nationalisation of the tariffs, extension charge revenue formed a relatively small percentage of the total revenue by tariff category of all tariffs except Tariff D (Tariff A - 1.4 % ; Tariff B - 4.1 % ; Tariff C - 1.0 % ; Tariff D - 16.7 %). The pooling of costs was viewed favourably by the SAAU, although their interpretation of the Commission recommendation was that this pooling would be of the costs of ALL customers, not only pooling within particular customer groups. This created the expectation that large businesses would in fact subsidise the agricultural sector. This was not the aim of the recommendation to pool costs, and this would not have been acceptable to Eskom's larger customers. The transmission percentage charge was introduced to take account of differences of transmission costs between different areas (see Section 3 for further information).

1.3.4 INTRODUCTION OF TARIFF E (OFF-PEAK) AND TARIFF F (VARIABLE USE) As a direct result of the De Villiers Commission recommendation, Tariff E for off-peak use was introduced for large power users at the same time as the nationalisation of Eskom's tariffs. This tariff was based on Tariff A, but allowed for the maximum demand charge to be levied on the maximum demand measured during peak hours only. This encouraged customers to move their peak demand so that it did not occur at the same time as Eskom's system peak demand. A minimum overall c/kW.h rate was applied to prevent the case whereby load shifting could result in the customer actually paying less than the cost of generating the supply. Tariff F for variable use, also applicable to large power users, was introduced with effect from July 1987, to address problems experienced by some large power farming customers. Due to their very low load factor operations, on Tariff A they were having to pay very high demand charges and almost zero energy charges. Tariff F only catered for kV.A demand (not kW), at 380/220 volts or 11 kV or 22 kV. The qualifying voltage contrived to limit this tariff to large power farming customers only. A maximum overall c/kW.h rate was applied to prevent the customer paying excessive electricity costs. At first there was some reluctance on the part of some Eskom personnel to apply this tariff, as the related loss of revenue caused some concern. This tariff was of particular interest to the larger irrigation farming operations, and grew in popularity in this sector over the years, until now when it is accepted as a valid pricing tool for a particular market segment.
1.3.5 INTRODUCTION OF TARIFF S1 FOR SMALL POWER CUSTOMERS WITH LOW
USAGE, USING A PREPAYMENT MEASUREMENT SYSTEM In the late 1980's, Eskom saw the need to electrify the many millions in the country without electricity. This was a unique market for many reasons, and could not be reached using conventional methods, mainly due to the large numbers and the associated exorbitant costs, and because of the social circumstances of most of these customers. In order to begin reaching these customers, it was found that prepayment measurement systems would be most efficient and cost-effective. Due to the fact that the existing standard tariffs included amounts to cover the costs of meter-reading and billing, which would in this case would not be applicable, and also because the costs of providing supply differed substantially from the conventional methods, it was necessary to develop a pricing package for this "new" type of supply. The aim of the tariff was to provide electricity at an affordable price while still covering the costs of generation, transmission and distribution, including all the capital needed to provide the supply. The tariff was called "S1" as it was the first of an envisaged range of small power user tariffs which would ultimately replace the existing small power Tariffs B, C and D. The tariff was approved by the Electricity Council as a starting point to begin electrifying this market, on the understanding that once experience of this market was obtained, the tariff could be adjusted if necessary. The Tariff was published in the Government Gazette according to the legal requirements, and came into effect as from 1 September 1989. As the tariff had only just been introduced and was in fact only applied to a handful of customers at the time, it was exempted from the January 1990 tariff increase, but since then has increased at the same time and rate as Eskom's other tariffs.

1.3.6 INTRODUCTION OF TIME-OF-USE PRICES FOR LARGE POWER CUSTOMERS During 1989 and 1990 two time-of-use pricing options were developed, one (T1) for supplies of 1 megavolt-ampere or larger with a maximum demand charge, and the other (T2) without a maximum demand charge for supplies of 100 kilovolt-ampere up to 5 megavolt-ampere. Due to this being a completely new direction for electricity pricing in South Africa, these prices were viewed with some degree of suspicion by customers, particularly as there was little information available as to how this would affect them in the long-term. Due to this uncertainty and the need for more practical information regarding the effect on customers, the Electricity Control Board instructed that these time-of-use prices should be introduced as pricing options available by choice to particular customers in particular circumstances. The first Time-of-Use customer, Henry Ford, was taken onto the system on Friday 10 May 1991.
1.4 THE TARIFF INCREASE / TARIFF REVISION LEGAL PROCESS The legal process to be followed when increasing Eskom's tariffs by a certain percentage across the board differs from that followed when increasing or altering only one of the tariffs, or introducing a new tariff (i.e. when there is a change in the status quo). When effecting an amendment to prices in general in equal proportions, the following procedure is followed:
The increase is advertised in the press prior to the date of application.
The increase is applied as from the notified date (accounts may be pro-rated depending on when meter reading takes place).
When however, the tariffs are not being increased in the same proportion for some reason, or a tariff structure is being altered, or a tariff introduced or deleted, the procedure followed in terms of section 15 of the Eskom Act, 1987 (Act 40 of 1987), is:
The proposed change is advertised in the Government Gazette and two national newspapers with a countrywide circulation, one English and the other Afrikaans.
The interested public are given a period (at least 60 days) during which objections to the proposed changes may be lodged with the Electricity Control Board.
Any objections are heard by the Electricity Control Board who make a decision or recommendation.
Subject to the approval of the Electricity Control Board the changes are implemented as advertised.
It is important to note that in order to introduce any new tariff, or make any changes to the tariff structure in terms of existing legislation, a lengthy process must be followed. Before the proposed changes can be advertised, the change must first be thoroughly researched for possible revenue and other implications; and the proposals must be put to the Management Board and Electricity Council for their approval.
1.5 SPECIAL PRICES

Over the years certain special prices have been applied in particular instances, to suit particular special circumstances. These special prices are negotiated with individual customers and are applied in few cases. More recent examples of special, non-standard pricing options include the application of capacity allocation in certain cases (made possible because of Eskom's excess generating capacity), the development of pricing packages for remote area power supplies, and the introduction of the Time-of-Use pricing options during 1991.
1.6 TARIFF INCREASES In the earlier period covered, tariff increases were calculated bearing in mind Eskom's revenue requirements. Modelling was done to ensure that no individual customer in a particular undertaking should have an unacceptably high increase. The proposed increases were discussed at parliamentary level, and the increase allowed was sometimes adjusted for "strategic" reasons. In some years the tariff increases were thus kept artificially low, which in most cases resulted in higher increases in the following years in order to address issues such as cash flow and capital constraints. In later years however, as organisations became more cost effective, Eskom attempted to keep tariff increases to a minimum. Over the past few years the tariff increases have been kept below the inflation rate in an attempt to slow the inflation rate and assist economic recovery, and this trend is set to continue in the immediate future.

SECTION 2
AVERAGE ESKOM INCREASES
Although the tariffs differed between the various undertakings, uniform tariff increases were sometimes applied. Based on the tariff increase announced, various trends can be seen, which are useful for comparison purposes. Table 1 shows these figures and various price and revenue comparisons, covering the period from April 1973 to January 1992.
NOTES TO TABLE 1 - ESKOM PRICE AND REVENUE INCREASES IN REAL AND ACTUAL
TERMS 1973-1992
1. Month / Year of Increase This column shows the month and year in which an increase became effective.
2. CPI The Consumer Price Index (CPI) is based on 1990 = 100. The figures shown are the CPI values for the particular month in which the increase was applied, not the annual CPI.
3. CPI % Increase This shows the % increase in CPI from one price increase to the next.
4. Notified Average Price Increase % Prior to 1986, the tariff increases were not standard across all tariffs and Undertakings/Regions. In some cases in earlier years the average increase has been estimated, where this information is not available. In January 1980 there was a tariff increase of 5.5 % in the Orange River Undertaking only. As this was a very small Undertaking and the increase had only a very small effect on Eskom's financial position, this increase has not been included in the table.
5. Real Price Increase % The real price increase shows the notified average price increase deflated by the CPI for that month.
6 & 7. Cumulative Real Price Increase % The cumulative real price increase shows the effect of adding the year on year real price changes over the total period based on the past 19 and 10 years respectively.
8. Total Eskom Revenue (R million) This figure represents Eskom's total actual revenue for the year. (1992 figures not available yet).
9. Annual CPI % increase This is the % increase in CPI average from year to year.
10. Actual Revenue (c/kW.h) This is Eskom's average selling price in c/kW.h.
11. Percentage change in actual revenue (c/kW.h)

12. Real Revenue (c/kW.h) This shows the actual revenue (in c/kW.h) after being deflated by the CPI. This index is based on 1990 = 100.
13. % Change in Real Revenue (c/kW.h) This shows the % change in real revenue in c/kW.h from year to year.
14. Cumulative Real Revenue Increase (c/kW.h) This shows the effect of adding the year on year changes of real revenue, in c/kW.h, using 1973 as the base year.
THE FOLLOWING GRAPHS ARE ATTACHED : GRAPH 1: ESKOM ANNUAL PRICE INCREASES (NOTIFIED VS REAL) GRAPH 2: ESKOM C/KWH REVENUE INCREASE COMPARED WITH INFLATION GRAPH 3: ESKOM CUMULATIVE REAL INCREASES (VS PRICE) C/KWH REVENUE GRAPH 4: ESKOM ANNUAL REAL INCREASES (VS PRICE) C/KWH REVENUE

TABLE 1 - ESKOM PRICE INCREASES IN REAL AND ACTUAL TERMS
1973 - 1992
1 2 3 4 5 6 7 8 9 10 11 12 13 14
MONTH / YEAR CPI CPI NOTIFIED REAL CUM. CUM. TOTAL ANNUAL ACTUAL % CHANGE REAL % CHANGE % CUM. REAL
OF INCREASE MONTH % AV. PRICE PRICE REAL PRICE REAL PRICE REVENUE CPI REVENUE IN ACTUAL REVENUE IN REAL REVENUE
OF INC. INCREASE INCREASE INCREASE INCREASE INCREASE R MILL INCREASE c/kW.h REVENUE c/kW.h REVENUE INCREASE
1990=100 % % (1973 BASE) (1981 BASE) 1990=100 c/kW.h (1990 BASE) c/kW.h (1973 BASE)
APRIL 73 11.2 4.67% 7.50% 2.83% 2.83% £302 9.40% 0.6484 ****** 5.4411 ****** ******
APRIL 74 12.3 9.82% 1.10% -8.72% -5.89% £359 11.60% 0.6822 5.21% 5.2328 -3.83% -3.83%
JANUARY 75 13.7 11.38% 16.20% 4.82% -1.08% £460 13.50% 0.7950 16.53% 5.4642 4.42% 0.43%
APRIL 76 15.7 14.60% 15.00% 0.40% -0.67% £656 11.20% 1.0360 30.31% 6.2737 14.81% 15.30%
SEPT 76 16.4 4.46% 13.00% 8.54% 7.87%
JANUARY 77 16.9 3.05% 25.00% 21.95% 29.82% £1,031 11.00% 1.5353 48.19% 8.3609 33.27% 53.66%
JANUARY 78 18.8 11.24% 14.50% 3.26% 33.08% £1,302 11.00% 1.7887 16.50% 8.7756 4.96% 61.28%
JANUARY 79 21 11.70% 4.10% -7.60% 25.47% £1,529 13.20% 1.8980 6.11% 8.3890 -4.40% 54.18%
JULY 80 25.6 21.90% 7.30% -14.60% 10.87% £1,772 13.80% 2.0242 6.65% 7.9035 -5.79% 45.26%
JANUARY 81 27.5 7.42% 5.50% -1.92% 8.95% 0.00% £2,141 15.20% 2.2811 12.69% 7.8266 -0.97% 43.84%
JANUARY 82 31.4 14.18% 13.10% -1.08% 7.86% -1.08% £2,695 14.70% 2.8038 22.91% 8.3507 6.70% 53.47%
JULY 82 33.8 7.64% 6.60% -1.04%
JANUARY 83 35.9 6.21% 14.50% 8.29% 15.11% 6.16% £3,302 12.40% 3.3607 19.86% 8.7265 4.50% 60.38%
JANUARY 84 39.6 10.31% 6.00% -4.31% 10.80% 1.86% £3,832 11.50% 3.5842 6.65% 8.2801 -5.11% 52.18%
JANUARY 85 45.1 13.89% 10.00% -3.89% 6.91% -2.03% £4,625 16.30% 4.1179 14.89% 8.5319 3.04% 56.80%
SEPT 85 50.4 11.75% 10.00% -1.75%
JANUARY 86 54.5 8.13% 10.00% 1.87% 7.03% -1.92% £5,845 18.60% 4.9803 20.94% 8.8725 3.99% 63.06%
JULY 86 58.3 6.97% 10.00% 3.03%
JANUARY 87 63.2 8.40% 12.00% 3.60% 13.65% 4.70% £7,047 16.10% 5.7512 15.48% 8.6390 -2.63% 58.77%
JANUARY 88 72.2 14.24% 10.00% -4.24% 9.41% 0.46% £8,159 12.80% 6.3004 9.55% 8.1516 -5.64% 49.81%
JANUARY 89 81.8 13.30% 10.00% -3.30% 6.11% -2.83% £9,272 14.70% 6.9012 9.54% 7.9157 -2.89% 45.48%
JANUARY 90 94.2 15.16% 14.00% -1.16% 4.95% -3.99% £10,736 14.30% 7.8842 14.24% 7.8842 -0.40% 44.90%
JANUARY 91 107.7 14.33% 8.00% -6.33% -1.38% -10.32% £11,726 15.30% 8.4551 7.24% 7.3331 -6.99% 34.77%
JANUARY 92 125 16.06% 9.00% -7.06% -8.44% -17.39% NA NA NA NA NA NA NA

DISCUSSION OF TRENDS Following are some discussion of the graphs and observations made from these: Graph 1 shows the Eskom price increases comparing notified with real price. Where more than one increase were applied in a year the combined effect for the year is shown.
There has always been a strong correlation between the Eskom price increase and the rate of inflation. Increases below inflation are usually followed by increases above inflation except for the period from 1988 in which increases have been steadily below inflation.
The sharp rise in prices in 1977 can be explained by the fact that tariffs were kept artificially low prior to 1977 for political and rational economic reasons despite the fact that new power stations were being built at the time, requiring higher levels of revenue.
Graph 2 shows Eskom's Revenue increase in c/kWh sold compared with inflation (Annual CPI increase).
Up to the period 1978, c/kWh revenue increased at a much higher rate than inflation. In the period up to 1992, c/kWh revenue correlates closely with inflation. Since 1988, c/kWh revenue increases have been below inflation.
This graph shows the combined effect of the Eskom notified price increases and the changes in tariff structure, customer mix and customer behaviour which affect the effective price increase (c/kWh revenue increase). This is better explained in graphs 3 and 4.
Graph 3 shows Eskom's cumulative real increases comparing price with c/kWh revenue.
From 1973 to 1992 Eskom notified price increases have dropped in real terms by 11,27%. From 1982 to 1992 notified price increases dropped by 16,31% in real terms.
It is clear that since 1973 there has been a buildup in difference between the notified price increases and the revenue (c/kWh) achieved. Revenue has increased in relation to notified prices from 1973 to 1991 by 40,02%.
The year to year contributions to this difference is shown in Graph 4, with the revenue increase being higher than the price increase. Since 1988 increases have been much the same.
This trend can be explained by the following :
Since 1973 many more small customers than large customers were connected. These customers typically pay higher prices.
High growth in small customer consumption, including that in municipalities, which usually come at a higher price.
This effect would have been greater had it not been for the fact that many large customers have changed their usage patterns so as to reduce the effective price paid.
A smaller percentage of very large, high load factor customers were connected than medium sized customers with poorer load factors.
During this period tariffs have been restructured and new tariffs added. This also affected this relationship between price and revenue.
_____________________________

ESKOM PRICE INCREASE
NOTIFIED VS REAL
-15.00%
-10.00%
-5.00%
0.00%
5.00%
10.00%
15.00%
20.00%
25.00%
73 74 75 76 76 77 78 79 80 81 82 82 83 84 85 85 86 86 87 88 89 90 91 92
ACTUAL PRICE INC REAL PRICE INC

REVENUE (C/KWH) INCREASE
COMPARED WITH INFLATION (1973-1991)
0%
10%
20%
30%
40%
50%
74 75 76 77 78 79 80 81 82 83 84 85 86 87 88 89 90 91
YEARS
REVENUE INCREASE INFLATION

ESKOM CUMULATIVE INCREASES
PRICE VS REVENUE (1973-1991)
-10%
0%
10%
20%
30%
40%
50%
60%
70%
73 74 75 76 77 78 79 80 81 82 83 84 85 86 87 88 89 90 91
YEARS
I
N
C
R
E
A
S
E
REAL PRICE REAL REVENUE

ESKOM - REAL PRICE OF ELECTRICITY
1973-1991
YEARS
C/KWH
73 74 75 76 77 78 79 80 81 82 83 84 85 86 87 88 89 90 910
2
3
4
5
6
7
8
9
C
/
K
W
H
73 74 75 76 77 78 79 80 81 82 83 84 85 86 87 88 89 90 91
1

ESKOM ANNUAL INCREASE
REAL PRICE VS REAL REVENUE (1973-1991)
REAL PRICE REAL REVENUE
-20%
-10%
0%
10%
20%
30%
40%
73 74 75 76 77 78 79 80 81 82 83 84 85 86 87 88 89 90 91
YEARS
I
N
C
R
E
A
S
E

SECTION 3
INDIVIDUAL TARIFFS - 1973 TO 1985 This section covers the individual regional tariffs applied in the different Undertakings until the 1986 nationalisation of the tariffs. The concept of a surcharge or discount is applied. Table 2 contains the different surcharges or discounts applied at different times in each of the undertakings. Each tariff is broken down into different tables showing, first, the different components as published in the Schedule of Standard Prices before application of the percentage surcharge or discount, and thereafter, each component after application of the surcharge or discount.
Terminology A "charge" is the amount actually charged to the customer, whereas a "rate" is the figure which is applied to another figure in order to determine the charge. e.g. A demand charge at the rate of *** R/kV.A. The rate is applied to the number of kV.A to determine the charge in Rands.
3.1 NOTES APPLICABLE TO ALL TABLES
All charges are applied per month.
The basic charge is applied whether any electricity is taken or not.
The Rand and Orange Free State Extension Area was absorbed by the Rand and Orange Free State Undertaking as from July 1980.
Cape Eastern Undertaking was incorporated into Orange River Undertaking from 1981, and the Border and Orange River Undertakings became the Eastern Cape Undertaking as from 1985. At the same time, Cape Western Undertaking and Cape Northern Undertaking amalgamated to form the Northern and Western Cape Undertaking.
TABLE 2 - PERCENTAGE SURCHARGE (+) /DISCOUNTS (-) APPLIED PER UNDERTAKING
TO THE NOTIFIED TARIFFS
In order to limit the need to restructure tariffs each time that an adjustment for inflation was required, the surcharge/discount concept was introduced. This allowed the different conditions in different regions (undertakings) to be taken into account without having to go the long legal route of having to publish the proposed changes in the Government Gazette, and await and deal with any objections thereto.
The surcharge or discount changed in different areas at different times.
The surcharge or discount is applied by calculating the total account and then applying the surcharge (+) or discount (-).
The concept of a surcharge or discount was dropped with effect from July 1987.
Two tariff increases were imposed during 1976 due to the continued escalation of costs and the need to raise more of the capital requirement by internal financing. An increase was applied from April 1976 and a further increase was applied from September 1976. The tariffs were amended whilst incorporating the September increase, with initial discounts being applied in all Undertakings.
3.2 TARIFF A : LARGE POWER USERS

Although the definition of Tariff A varied across the different undertakings, this tariff was generally applied to a consumer whose notified maximum demand was 25 kilovolt ampere or more of three phase alternating current at a frequency of 50 cycles per second and at a particular voltage (see notes to table 3).
The tariff structure consisted of :
Basic Charge per month (R) plus Demand Charge (R/kV.A or R/kW) plus Energy Charge (c/kW.h) times Percentage Surcharge or Discount
TABLE 3 - TARIFF A : BASIC CHARGE IN RANDS NOTIFIED IN THE SCHEDULE OF
STANDARD PRICES (BEFORE APPLICATION OF THE SURCHARGE/DISCOUNT) The "basic" charge reflected is the charge notified in the relevant published licence. This charge is payable whether any electricity is taken or not. The basic charge is applied irrespective of supply voltage.
TABLE 4 - TARIFF A : DEMAND RATES NOTIFIED IN THE SCHEDULE OF STANDARD
PRICES (BEFORE APPLICATION OF THE SURCHARGE/DISCOUNT) The demand rates are per kV.A, except for the Rand and Orange Free State Undertaking, where until December 1983 the demand was measured in kilowatt. From January 1984 all new supplies were measured in kV.A, and existing kW customers could elect to convert their supplies to kV.A. The demand rates which apply are for the following supply voltages :
Cape Eastern Undertaking : January 1973 - August 1976
11 000 volts or as otherwise agreed September 1976 - December 1980
(a) above 380/220 volts (b) at 380/220 volts
Border Undertaking : January 1973 - August 1976
(a) 11 000 volts or 3 300 volts or 2 200 volts September 1976 - December 1984
(a) above 380/220 volts (b) at 380/220 volts
Orange River Undertaking : January 1973 - August 1976

11 000 volts or as otherwise agreed September 1976 - December 1984
(a) above 380/220 volts (b) at 380/220 volts
Cape Western Undertaking : January 1973 - August 1976
(a) 2 000 volts or higher (b) less than 2 000 volts
September 1976 - December 1984
(a) above 380/220 volts (b) at 380/220 volts
Cape Northern Undertaking : January 1973 - June 1981
11 000 volts July 1981 - December 1984
(a) above 380/220 volts (b) at 380/220 volts
Natal Undertaking : January 1973 - August 1976
(a) 132 000 volts (b) 58 000 volts (c) 33 000 or 22 000 or 11 000 or 6 600 or 2 200 volts (d) 380/220 volts
September 1976 - December 1985
(a) 132 000 volts (b) above 380 volts below 132 000 volts (c) at 380/220 volts
Eastern Transvaal Undertaking : January 1973 - September 1973
(a) 11 000 volts or 6 600 volts or 3 300 volts or 2 200 volts October 1973 - December 1985
(a) above 380/220 volts (b) at 380/220 volts
Rand and Orange Free State Undertaking : January 1973 - December 1983
An agreed voltage January 1984 - December 1985
(a) above 380/220 volts (kV.A charge)
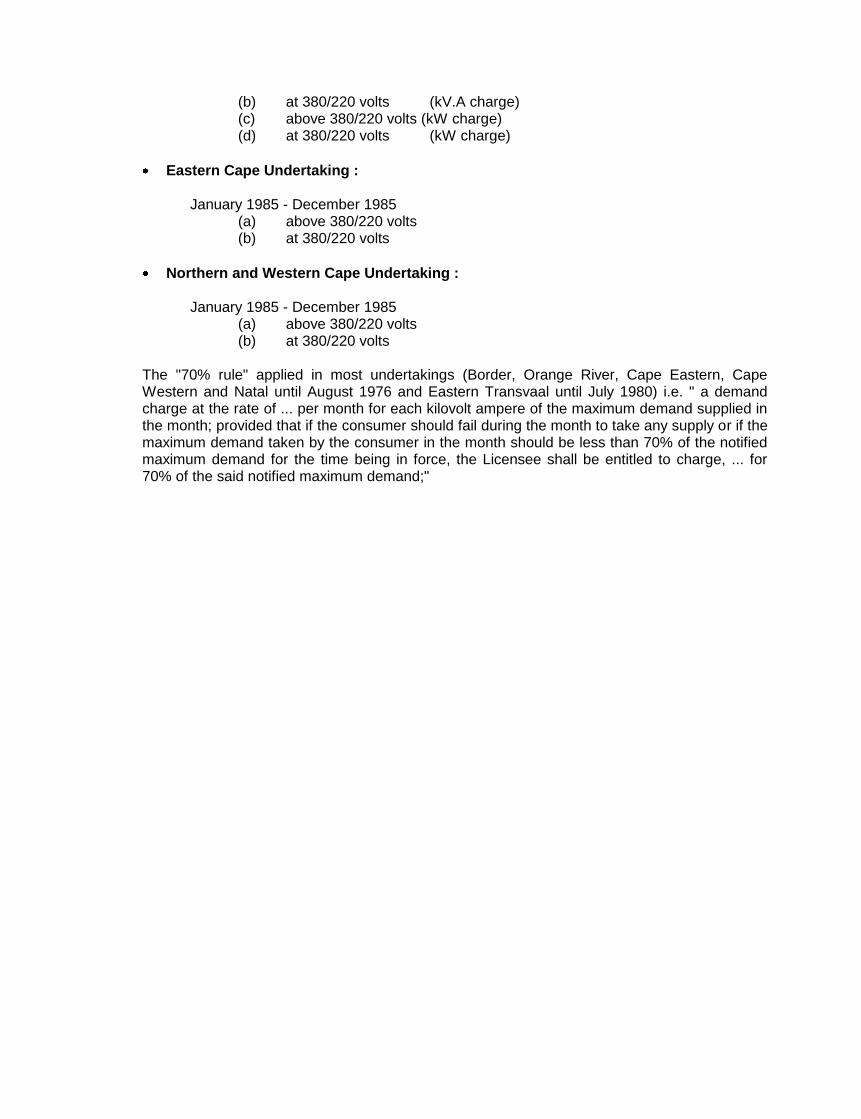
(b) at 380/220 volts (kV.A charge) (c) above 380/220 volts (kW charge) (d) at 380/220 volts (kW charge)
Eastern Cape Undertaking : January 1985 - December 1985
(a) above 380/220 volts (b) at 380/220 volts
Northern and Western Cape Undertaking : January 1985 - December 1985
(a) above 380/220 volts (b) at 380/220 volts
The "70% rule" applied in most undertakings (Border, Orange River, Cape Eastern, Cape Western and Natal until August 1976 and Eastern Transvaal until July 1980) i.e. " a demand charge at the rate of ... per month for each kilovolt ampere of the maximum demand supplied in the month; provided that if the consumer should fail during the month to take any supply or if the maximum demand taken by the consumer in the month should be less than 70% of the notified maximum demand for the time being in force, the Licensee shall be entitled to charge, ... for 70% of the said notified maximum demand;"

TABLE 5 - TARIFF A : NOTIFIED ENERGY RATES IN c/kW.h TAKING INTO ACCOUNT THE
QUARTERLY COAL COST ADJUSTMENT (BEFORE APPLICATION OF THE
SURCHARGE/DISCOUNT, NOT ADJUSTED 1973 TO 1975) The figures reflected for 1973 to 1975 inclusive are the energy charge rates as notified in the Schedule of Standard Prices, and have not been adjusted for the coal cost, as these figures are not available. The figures reflected from 1976 to 1985 are the energy rates after application of the coal cost adjustment.
TABLE 6 - TARIFF A : EFFECTIVE BASIC CHARGE IN RANDS (AFTER APPLICATION OF
THE SURCHARGE/DISCOUNT) This table reflects the basic charges from Table 3 after application of the surcharges or discounts from Table 2.
TABLE 7 - TARIFF A : EFFECTIVE DEMAND RATES (AFTER APPLICATION OF THE
SURCHARGE/DISCOUNT) This table reflects the demand charges from Table 4 after application of the surcharges or discounts from Table 2.
TABLE 8 - TARIFF A : EFFECTIVE ENERGY RATES IN c/kW.h (AFTER APPLICATION OF
THE SURCHARGE/DISCOUNT) This table reflects the adjusted energy rates from Table 5 after application of the surcharges or discounts from Table 2.
3.3 TARIFF B : SMALL POWER USERS Once again the tariff definition varied across the different Undertakings. In most cases this tariff was initially applied to "...a consumer whose maximum demand rarely exceeds 50 kilovolt ampere and at no time exceeds 75 kilovolt ampere, made available at a nominal voltage of 380 volts between phases and 220 volts between phase and neutral, for use as motive power or for heating or for electro-chemical process, ..." In the Rand and Orange Free State Undertaking, Tariff B was used for the mines, and not for small power users. Tariff D was at that time (1973 - 1974) the tariff equivalent to Tariff B in the other Undertakings. By 1982 the tariff definition had changed to "... whose maximum demand at no time exceeds 100 kV.A (or kW) made available at a nominal voltage of 380 volts between phases and 220 volts between phase and neutral or as otherwise agreed, excepting supplies provided under Tariffs (C) and (D), ..." The tariff structure initially consisted of :
Basic Charge per month (R) plus Demand Charge (R/kW in R&OFS, R/A elsewhere) plus Energy Charge (c/kW.h) times Percentage Surcharge or Discount

By the early seventies, the Rand and Orange Free State Undertaking in particular was expressing dissatisfaction with the ampere demand tariff. The test engineers of the undertakings also condemned ampere demand meters on the grounds that they were inaccurate, unreliable, and costly to test and calibrate. By the mid-seventies it had also become apparent from discussions with the agricultural sector that the ampere demand tariff had not fulfilled its purpose of reducing costs by improvement of load factors. By 1977 the demand charge concept had been dropped by all except the Northern Cape Undertaking, where it was dropped in July 1981. The tariff structure then consisted of :
Basic Charge per month (R) plus High Energy Charge (c/kW.h) for first 500 kW.h plus Energy Charge (c/kW.h) for balance of consumption times Percentage Surcharge or Discount
Notes to Tables :
TABLE 9 - TARIFF B : BASIC CHARGE IN RANDS NOTIFIED IN THE SCHEDULE OF
STANDARD PRICES (BEFORE APPLICATION OF THE SURCHARGE/DISCOUNT) This tariff was applied to all Small Power Users excluding domestic users. The basic charge reflected is the charge notified in the relevant published licence. The Rand and Orange Free State Undertaking did not apply a basic charge until April 1974. From then until December 1979, they applied two basic charges, one for a single phase supply and the other for a three phase supply. The revised tariff structure was implemented in the Rand and Orange Free State Undertaking as from April 1974 and in the Eastern Transvaal Undertaking as from July 1974. It was then implemented in the Cape Eastern, Border, Orange River, Cape Western and Natal Undertakings as from September 1976, and in the Cape Northern Undertaking as from July 1981.

TABLE 10 - TARIFF B : DEMAND RATES NOTIFIED IN THE SCHEDULE OF STANDARD
PRICES (BEFORE APPLICATION OF THE SURCHARGE/DISCOUNT) The notified demand rates were applied per completed ampere of maximum demand, except for the Rand and Orange Free State Undertaking, where the demand was measured in kilowatt. The Licensee was entitled to charge not less than the minimum charge for the metering installation installed at the time for the consumer's supply, being :
BU ORU CNU CWU ETU NU
CEU
R R R R R R
less than 17 amp 0.60 1.00 0.90 1.04 0.75 0.45
from 17 to 24 amp 0.90 1.00 1.20 1.04 0.75 0.60
from 25 to 33 amp 1.20 1.50 1.80 1.56 0.75 0.90
from 34 to 49 amp 1.80 1.75 2.70 2.34 1.12 1.35
from 50 to 66 amp 2.40 3.00 3.60 3.12 1.50 1.80
from 67 to 99 amp 3.60 4.50 5.40 4.68 2.25 2.70
from 100 to 132 amp 4.80 6.00 7.20 6.24 3.00 3.60
from 133 to 198 amp 7.20 9.00 10.80 9.36 4.50 5.40
from 199 to 297 amp 10.80 13.50 16.20 14.04 6.75 8.10
over 297 ampere 14.40 18.00 21.60 18.72 9.00 10.80
Demand metering was initially installed for most small power users, until the number of small power users escalated, making the costs and logistics of installing and reading demand metering exorbitant. To address these problems the tariff was restructured so as not to include demand charges. Changes were made to the tariff structure (excluding demand charges) at different times for different undertakings. From September 1976 only the Cape Northern Undertaking was still applying demand charges, and these were scrapped as from July 1981.
TABLE 11 - TARIFF B : NOTIFIED ENERGY RATES IN c/kW.h TAKING INTO ACCOUNT
THE QUARTERLY COAL COST ADJUSTMENT (NOT ADJUSTED 1973 TO 1975) The figures reflected for 1973 to 1975 inclusive are the energy charge rates as notified in the Schedule of Standard Prices, and have not been adjusted for the coal cost, as these figures are not available. The figures reflected from 1976 to 1985 are the energy rates notified in the Schedule of Standard Prices after application of the quarterly coal cost adjustment. These figures are the energy rates before application of the surcharge/discount. Initially, the energy charge was applied to the total kW.h consumed. As from April 1974, the concept of a "high rate" and "low rate" energy charge was introduced in the Rand and Orange Free State Undertaking, whereby the first 500 units of the monthly consumption, or the monthly consumption, whichever was the lesser number, were charged at the high rate, and the balance of the consumption charged at the low rate. This charging concept was gradually introduced in the other undertakings, and by July 1981 all undertakings were applying a high rate to the first 500 kW.h and a low rate to the balance of consumption.

TABLE 12 - TARIFF B : EFFECTIVE BASIC CHARGE IN RANDS (AFTER APPLICATION OF
THE SURCHARGE/DISCOUNT) This table reflects the figures from Table 9 after application of the surcharge or discount from Table 2.
TABLE 13 - TARIFF B : EFFECTIVE DEMAND RATES (AFTER APPLICATION OF THE
SURCHARGE/DISCOUNT) This table reflects the figures from Table 10 after application of the surcharge or discount from Table 2.
TABLE 14 - TARIFF B : EFFECTIVE ENERGY RATES IN c/kW.h (AFTER APPLICATION OF
THE SURCHARGE/DISCOUNT) This table reflects the figures from Table 11 after application of the surcharge or discount from Table 2.
3.4 TARIFF C : LIGHTING AND DOMESTIC USERS Prior to 1974, the tariff for "lighting and domestic" customers had the same structure in all seven of Eskom's undertakings other than its Rand and OFS Undertaking. The structure afforded these customers the option of being charged either on a "flat rate tariff" or a "room rate tariff". In the Rand and OFS Undertaking, the "urban residential" Tariff C was a room rate tariff, with provision for a kW demand charge in the event of the premises being used for business purposes. During 1974, these versions of Tariff C were done away with in the Rand and OFS and Eastern Transvaal Undertakings, and a revised Tariff C Once again the tariff definition varied across the different Undertakings. Small Power User customers had the choice of Tariff B or Tariff C. In all Undertakings except the Rand and Orange Free State Undertaking, Tariff C consisted of two alternatives, the Flat Rate Tariff or the Room Rate Tariff. Tariff C was applied "... to private residences, in respect of which a "room" assessment has been or may be made ...". In the Rand and Orange Free State Undertaking the Tariff was applied "In any urban area used predominantly for residential purposes ...". By July 1981 Tariff C (Urban Domestic Users) was applied in all Undertakings "For a supply of electricity for domestic purposes for a private house or a block of flats, within a legally constituted township or within an area considered by the Licensee to be similar to a legally constituted township, ..." The tariff structure in all undertakings except Rand and OFS Undertaking initially consisted of : Alternative (a) : Flat Rate Tariff Basic Charge per month (R) plus Unit Charge (c/kW.h) times Percentage Surcharge or Discount
or

Alternative (b) : Room Rate Tariff Basic Charge per month (R) plus Charge per Room per month (R) plus Unit Charge (c/kW.h) times Percentage Surcharge or Discount
In the Rand and OFS Undertaking the tariff structure initially consisted of the room rate tariff as alternative (b) above, with the option of a kW demand charge when premises were being used for business purposes. By September 1976 all but the Northern Cape Undertaking had changed the tariff structure to : Basic Charge per month (R) plus High Energy Charge (c/kW.h) for first 300 kW.h plus Energy Charge (c/kW.h) for balance of consumption times Percentage Surcharge or Discount
The Northern Cape Undertaking began using this tariff structure as from July 1981. Notes to Tables :
TABLE 15 - TARIFF C : BASIC CHARGE IN RANDS NOTIFIED IN THE SCHEDULE OF
STANDARD PRICES (BEFORE APPLICATION OF THE SURCHARGE/DISCOUNT) Flat rate
tariff (alternative (a)) initially in all undertakings except Rand and Orange Free State
Undertaking A flat rate tariff (alternative (a)) was initially in force in all undertakings except Rand and Orange Free State Undertaking. This table shows the basic charges associated initially with the flat rate tariff and subsequently with the declining block rate tariff which replaced it (in different years in the different undertakings). No basic charge was applied with the room rate in force in the Rand & Orange Free State Undertaking until April 1974.
TABLE 16 - TARIFF C : NOTIFIED ENERGY RATES IN c/kW.h TAKING INTO ACCOUNT
THE QUARTERLY COAL COST ADJUSTMENT (NOT ADJUSTED 1973 TO 1975) The high and low rates shown initially for Rand and Orange Free State Undertaking (5,00 and 0,675 c/kW.h) were applicable to the room rate tariff until it was replaced in April 1974 with a declining block rate tariff. Once the concept of a two-part energy rate was introduced (in April and July 1974 in Rand and OFS and Eastern Transvaal, and in September 1976 in other undertakings), the high rate was applied to the first 300 kW.h of consumption, and the low rate to any balance of consumption, in excess of 300 kW.h.
TABLE 17 - TARIFF C : EFFECTIVE BASIC CHARGE IN RANDS (AFTER APPLICATION OF
THE SURCHARGE/DISCOUNT)
This table reflects the basic charge from Table 15 after application of the surcharge or discount from Table 2.
TABLE 18 - TARIFF C : EFFECTIVE ENERGY RATES IN c/kW.h (AFTER APPLICATION OF
THE SURCHARGE/DISCOUNT) This table reflects the energy charge from Table 16 after application of the surcharge or discount from Table 2.
TABLE 19 - TARIFF C : ROOM RATE TARIFF (ALTERNATIVE (b)) NOTIFIED IN THE
SCHEDULE OF STANDARD PRICES TAKING INTO ACCOUNT THE QUARTERLY COAL
COST ADJUSTMENT (BEFORE APPLICATION OF THE SURCHARGE/DISCOUNT, NOT
ADJUSTED 1973 TO 1975) The service charge and room rate were charged per month, whether any electricity was taken or not. The room rate was applied to a minimum of two rooms. The Rand and Orange Free State did not apply a Room Rate Tariff.
TABLE 20 - TARIFF C : EFFECTIVE ROOM RATE TARIFF (ALTERNATIVE (b)) (AFTER
APPLICATION OF THE SURCHARGE/DISCOUNT) This table reflects the charges from Table 19 after application of the surcharge or discount from Table 2.
3.5 TARIFF D : RURAL SMALL USERS During 1973 until April 1974 the Rand and Orange Free State Undertaking applied a Tariff D "in any rural area for any supply of electricity ...". This tariff consisted of : Basic Charge per month (R) plus High Energy Charge (c/kW.h) for first 1000 kW.h plus Energy Charge (c/kW.h) for balance of consumption times Percentage Surcharge or Discount
Between April 1974 and January 1982 these rural supplies were charged in terms of Tariff B or sometimes Tariff C as in the other Undertakings, with the additional costs being recovered by means of other (non-tariff) charges. As from January 1982 a new Tariff D for Rural Small Users was introduced in all Undertakings, for "... a consumer whose maximum demand at no time exceeds 100 kV.A or kW, made available at a nominal voltage of 380 volts between phases and 220 volts between phase and neutral or as otherwise agreed and whose point of supply is situated within an area defined as "agricultural land" ... or ... within an area deemed by Eskom to be similar to such a defined area, ...". The tariff structure was the same as that applied in the early 70's in Rand and Orange Free State Undertaking, except that the high energy charge was applied to the first 800 kW.h of consumption. Notes to Tables :

TABLE 21 - HISTORICAL TARIFF D : RAND AND ORANGE FREE STATE UNDERTAKING
(1973, 1974) NOTIFIED AND EFFECTIVE CHARGES Only the Rand and Orange Free State Undertaking applied a Tariff D for 1973 until April 1974. The Demand Charge consisted of two components viz. a charge of R 3.00 per month, payable whether any electricity was taken or not, and a rate of 10 cents for each completed ampere of the maximum demand taken by the consumer in the month in excess of 30 amperes. The unit rates were not subject to adjustment to take account of the coal cost.
TABLE 22 - TARIFF D : BASIC CHARGE IN RANDS NOTIFIED IN THE SCHEDULE OF
STANDARD PRICES (BEFORE APPLICATION OF THE SURCHARGE/DISCOUNT) 1882-
1985 The basic charge was applied independent of supply voltage.
TABLE 23 - TARIFF D : ENERGY RATES IN c/kW.h NOTIFIED IN THE SCHEDULE OF
STANDARD PRICES TAKING INTO THE QUARTERLY COAL COST ADJUSTMENT
(BEFORE APPLICATION OF THE SURCHARGE/DISCOUNT) 1982-1985 When Tariff D was introduced in January 1982, the high energy rate was applied to the first 800 kW.h of consumption, and the low energy rate was applied to the balance of the consumption.
TABLE 24 - TARIFF D : EFFECTIVE BASIC CHARGE IN RANDS (AFTER APPLICATION OF
THE SURCHARGE/DISCOUNT) 1982-1985 This table reflects the figures from Table 22 after application of the surcharge or discount from Table 2.
TABLE 25 - TARIFF D : EFFECTIVE ENERGY RATES IN c/kW.h (AFTER APPLICATION OF
THE SURCHARGE/DISCOUNT) 1982-1985 This table reflects the figures from Table 23 after application of the surcharge or discount from Table 2.

TABLE 2 - PERCENTAGE SURCHARGE (+)/ DISCOUNT (-) APPLIED PER UNDERTAKING TO THE NOTIFIED TARIFFS
UNDERTAKING CAPE BORDER ORANGE CAPE CAPE NATAL EASTERN RAND R & OFS
EASTERN RIVER WESTERN NORTHERN TVL & OFS EXT
DATE
Jan 1973 10.0 5.0 5.0 10.0 -15.0 5.0 5.0 20.0 38.0
April 1973 17.5 17.5 12.5 17.5 -7.5 12.5 12.5 20.0 38.0
July 1973 17.5 17.5 12.5 17.5 -7.5 12.5 12.5 20.0 38.0
Oct 1973 17.5 17.5 12.5 17.5 -7.5 12.5 12.5 20.0 38.0
Jan 1974 17.5 17.5 12.5 17.5 -7.5 12.5 12.5 20.0 38.0
April 1974 20.0 17.5 20.0 17.5 -7.5 15.0 20.0 -13.0 0.0
July 1974 20.0 17.5 20.0 17.5 -7.5 15.0 -15.0 -13.0 0.0
Oct 1974 20.0 17.5 20.0 17.5 -7.5 15.0 -15.0 -13.0 0.0
Jan 1975 20.0 17.5 20.0 17.5 -7.5 15.0 -15.0 -13.0 0.0
April 1975 40.0 30.0 40.0 22.5 7.5 25.0 -7.5 2.0 17.5
July 1975 40.0 30.0 40.0 22.5 7.5 25.0 -7.5 2.0 17.5
Oct 1975 40.0 30.0 40.0 22.5 7.5 25.0 -7.5 2.0 17.5
Jan 1976 40.0 30.0 40.0 22.5 7.5 25.0 -7.5 2.0 17.5
April 1976 60.0 50.0 60.0 40.0 22.5 42.5 5.0 17.5 35.0
July 1976 60.0 50.0 60.0 40.0 22.5 42.5 5.0 17.5 35.0
Sept 1976 -2.5 -25.0 -25.0 -25.0 40.0 -25.0 20.0 32.5 52.5
Oct 1976 -2.5 -25.0 -25.0 -25.0 40.0 -25.0 20.0 32.5 52.5
Jan 1977 22.5 -5.0 -5.0 -5.0 75.0 -5.0 47.5 65.0 90.0
April 1977 22.5 -5.0 -5.0 -5.0 75.0 -5.0 47.5 65.0 90.0
July 1977 22.5 -5.0 -5.0 -5.0 75.0 -5.0 47.5 65.0 90.0
Oct 1977 22.5 -5.0 -5.0 -5.0 75.0 -5.0 47.5 65.0 90.0
Jan 1978 40.0 -5.0 20.0 0.0 112.5 -5.0 77.5 97.5 127.0
April 1978 40.0 -5.0 20.0 0.0 112.5 -5.0 77.5 97.5 127.0
July 1978 40.0 -5.0 30.0 0.0 112.5 -5.0 77.5 97.5 127.0
Oct 1978 40.0 -5.0 30.0 0.0 112.5 -5.0 77.5 97.5 127.0
Jan 1979 45.0 0.0 37.5 5.0 112.5 -5.0 87.5 108.0 139.0
April 1979 45.0 0.0 37.5 5.0 112.5 -5.0 87.5 108.0 139.0
July 1979 45.0 0.0 37.5 5.0 112.5 -5.0 87.5 108.0 139.0
Oct 1979 45.0 0.0 37.5 5.0 112.5 -5.0 87.5 108.0 139.0
Jan 1980 45.0 0.0 45.0 5.0 112.5 -5.0 87.5 108.0 139.0
April 1980 45.0 0.0 45.0 5.0 112.5 -5.0 87.5 108.0 139.0
July 1980 55.0 7.5 55.0 12.5 125.0 0.0 -10.0 -8.0 <--------
Oct 1980 55.0 7.5 55.0 12.5 125.0 0.0 -10.0 -8.0
Jan 1981 --------> 12.5 65.0 20.0 135.0 5.0 -5.0 -3.0
April 1981 12.5 65.0 20.0 135.0 5.0 -5.0 -3.0
July 1981 12.5 65.0 20.0 -25.0 5.0 -5.0 -3.0
Oct 1981 12.5 65.0 20.0 -25.0 5.0 -5.0 -3.0
Jan 1982 -16.0 -14.0 -14.0 -16.0 20.0 9.0 9.0
April 1982 -16.0 -14.0 -14.0 -16.0 20.0 9.0 9.0
July 1982 -11.0 -9.0 -9.0 -11.0 29.0 17.0 16.0
Oct 1982 -11.0 -9.0 -9.0 -11.0 29.0 17.0 16.0
Jan 1983 -3.0 4.0 0.0 -1.0 -13.5 36.0 33.5
April 1983 -3.0 4.0 0.0 -1.0 -13.5 36.0 33.5
July 1983 -3.0 4.0 0.0 -1.0 -13.5 36.0 33.5
Oct 1983 -3.0 4.0 0.0 -1.0 -13.5 36.0 33.5
Jan 1984 2.5 10.0 6.0 5.0 -8.5 -20.5 -20.5
April 1984 2.5 10.0 6.0 5.0 -8.5 -20.5 -20.5
July 1984 2.5 10.0 6.0 5.0 -8.5 -20.5 -20.5
Oct 1984 2.5 10.0 6.0 5.0 -8.5 -20.5 -20.5
AMALGAMATION AMALGAMATION
EASTERN CAPE NORTH WESTERN CAPE
UNDERTAKING UNDERTAKING
Jan 1985 -21.0 -17.0 1.0 -13.0 -12.0
April 1985 -21.0 -17.0 1.0 -13.0 -12.0
July 1985 -21.0 -17.0 1.0 -13.0 -12.0
Sept 1985 -13.1 -8.7 11.1 -4.3 -3.2
Oct 1985 -13.1 -8.7 11.1 -4.3 -3.2
NATIONAL AMALGAMATION
Jan 1986 10.0
July 1986 21.0
Jan 1987 35.5

TABLE 3 - TARIFF A : BASIC CHARGE IN RANDS NOTIFIED IN THE SCHEDULE OF STANDARD PRICES
(BEFORE APPLICATION OF THE SURCHARGE/DISCOUNT)
UNDERTAKING CAPE BORDER ORANGE CAPE CAPE NATAL EASTERN RAND & OFS
EASTERN RIVER WESTERN NORTHERN TVL
DATE
Jan 1973 6.80 6.80 10.00 6.60 7.30 6.60 6.00 10.00
April 1973 6.80 6.80 10.00 6.60 7.30 6.60 6.00 10.00
July 1973 6.80 6.80 10.00 6.60 7.30 6.60 6.00 10.00
Oct 1973 6.80 6.80 10.00 6.60 7.30 6.60 6.00 10.00
Jan 1974 6.80 6.80 10.00 6.60 7.30 6.60 6.00 10.00
April 1974 6.80 6.80 10.00 6.60 7.30 6.60 6.00 20.00
July 1974 6.80 6.80 10.00 6.60 7.30 6.60 15.00 20.00
Oct 1974 6.80 6.80 10.00 6.60 7.30 6.60 15.00 20.00
Jan 1975 6.80 6.80 10.00 6.60 7.30 6.60 15.00 20.00
April 1975 6.80 6.80 10.00 6.60 7.30 6.60 15.00 20.00
July 1975 6.80 6.80 10.00 6.60 7.30 6.60 15.00 20.00
Oct 1975 6.80 6.80 10.00 6.60 7.30 6.60 15.00 20.00
Jan 1976 6.80 6.80 10.00 6.60 7.30 6.60 15.00 20.00
April 1976 6.80 6.80 10.00 6.60 7.30 6.60 15.00 20.00
July 1976 6.80 6.80 10.00 6.60 7.30 6.60 15.00 20.00
Sept 1976 20.00 20.00 20.00 20.00 7.30 20.00 15.00 20.00
Oct 1976 20.00 20.00 20.00 20.00 7.30 20.00 15.00 20.00
Jan 1977 20.00 20.00 20.00 20.00 7.30 20.00 15.00 20.00
April 1977 20.00 20.00 20.00 20.00 7.30 20.00 15.00 20.00
July 1977 20.00 20.00 20.00 20.00 7.30 20.00 15.00 20.00
Oct 1977 20.00 20.00 20.00 20.00 7.30 20.00 15.00 20.00
Jan 1978 20.00 20.00 20.00 20.00 7.30 20.00 15.00 20.00
April 1978 20.00 20.00 20.00 20.00 7.30 20.00 15.00 20.00
July 1978 20.00 20.00 20.00 20.00 7.30 20.00 15.00 20.00
Oct 1978 20.00 20.00 20.00 20.00 7.30 20.00 15.00 20.00
Jan 1979 20.00 20.00 20.00 20.00 7.30 20.00 15.00 20.00
April 1979 20.00 20.00 20.00 20.00 7.30 20.00 15.00 20.00
July 1979 20.00 20.00 20.00 20.00 7.30 20.00 15.00 20.00
Oct 1979 20.00 20.00 20.00 20.00 7.30 20.00 15.00 20.00
Jan 1980 20.00 20.00 20.00 20.00 7.30 20.00 15.00 20.00
April 1980 20.00 20.00 20.00 20.00 7.30 20.00 15.00 20.00
July 1980 20.00 20.00 20.00 20.00 7.30 20.00 25.00 20.00
Oct 1980 20.00 20.00 20.00 20.00 7.30 20.00 25.00 20.00
Jan 1981 -------->--------> 20.00 20.00 20.00 7.30 20.00 25.00 20.00
April 1981 20.00 20.00 20.00 7.30 20.00 25.00 20.00
July 1981 20.00 20.00 20.00 25.00 20.00 25.00 20.00
Oct 1981 20.00 20.00 20.00 25.00 20.00 25.00 20.00
Jan 1982 25.00 25.00 25.00 25.00 20.00 25.00 20.00
April 1982 25.00 25.00 25.00 25.00 20.00 25.00 20.00
July 1982 25.00 25.00 25.00 25.00 20.00 25.00 20.00
Oct 1982 25.00 25.00 25.00 25.00 20.00 25.00 20.00
Jan 1983 25.00 25.00 25.00 25.00 35.00 25.00 20.00
April 1983 25.00 25.00 25.00 25.00 35.00 25.00 20.00
July 1983 25.00 25.00 25.00 25.00 35.00 25.00 20.00
Oct 1983 25.00 25.00 25.00 25.00 35.00 25.00 20.00
Jan 1984 25.00 25.00 25.00 25.00 35.00 45.00 45.00
April 1984 25.00 25.00 25.00 25.00 35.00 45.00 45.00
July 1984 25.00 25.00 25.00 25.00 35.00 45.00 45.00
Oct 1984 25.00 25.00 25.00 25.00 35.00 45.00 45.00
AMALGAMATION AMALGAMATION
EASTERN CAPE NORTHERN & WESTERN CAPE
UNDERTAKING UNDERTAKING
Jan 1985 45.00 45.00 35.00 45.00 45.00
April 1985 45.00 45.00 35.00 45.00 45.00
July 1985 45.00 45.00 35.00 45.00 45.00
Sept 1985 45.00 45.00 35.00 45.00 45.00
Oct 1985 45.00 45.00 35.00 45.00 45.00

TABLE 4 - TARIFF A : DEMAND RATES NOTIFIED IN THE SCHEDULE OF STANDARD PRICES (BEFORE APPLICATION OF THE SURCHARGE/DISCOUNT)
UNDERTAKING CAPE BORDER ORANGE CAPE CAPE NATAL EASTERN RAND & OFS
EASTERN RIVER WESTERN NORTHERN TVL
DATE R/kV.A R/kV.A R/kV.A R/kV.A R/kV.A R/kV.A R/kV.A R/kW OR R/kVA.
Jan 1973 2.05 2.05 2.10 1.63/1.75 2.30 1.61/1.75/1.79/1.89 1.00 4.60
April 1973 2.05 2.05 2.10 1.63/1.75 2.30 1.61/1.75/1.79/1.89 1.00 4.60
July 1973 2.05 2.05 2.10 1.63/1.75 2.30 1.61/1.75/1.79/1.89 1.00 4.60
Oct 1973 2.05 2.05 2.10 1.63/1.75 2.30 1.61/1.75/1.79/1.89 2.20/2.30 4.60
Jan 1974 2.05 2.05 2.10 1.63/1.75 2.30 1.61/1.75/1.79/1.89 2.20/2.30 4.60
April 1974 2.05 2.05 2.10 1.63/1.75 2.30 1.61/1.75/1.79/1.89 2.20/2.30 2.50
July 1974 2.05 2.05 2.10 1.63/1.75 2.30 1.61/1.75/1.79/1.89 2.20/2.30 2.50
Oct 1974 2.05 2.05 2.10 1.63/1.75 2.30 1.61/1.75/1.79/1.89 2.20/2.30 2.50
Jan 1975 2.05 2.05 2.10 1.63/1.75 2.30 1.61/1.75/1.79/1.89 2.20/2.30 2.50
April 1975 2.05 2.05 2.10 1.63/1.75 2.30 1.61/1.75/1.79/1.89 2.20/2.30 2.50
July 1975 2.05 2.05 2.10 1.63/1.75 2.30 1.61/1.75/1.79/1.89 2.20/2.30 2.50
Oct 1975 2.05 2.05 2.10 1.63/1.75 2.30 1.61/1.75/1.79/1.89 2.20/2.30 2.50
Jan 1976 2.05 2.05 2.10 1.63/1.75 2.30 1.61/1.75/1.79/1.89 2.20/2.30 2.50
April 1976 2.05 2.05 2.10 1.63/1.75 2.30 1.61/1.75/1.79/1.89 2.20/2.30 2.50
July 1976 2.05 2.05 2.10 1.63/1.75 2.30 1.61/1.75/1.79/1.89 2.20/2.30 2.50
Sept 1976 4.40/4.65 8.80/9.05 4.40/4.65 5.60/5.80 2.30 5.25/5.50/5.65 2.20/2.30 2.50
Oct 1976 4.40/4.65 8.80/9.05 4.40/4.65 5.60/5.80 2.30 5.25/5.50/5.65 2.20/2.30 2.50
Jan 1977 4.40/4.65 8.80/9.05 4.40/4.65 5.60/5.80 2.30 5.25/5.50/5.65 2.20/2.30 2.50
April 1977 4.40/4.65 8.80/9.05 4.40/4.65 5.60/5.80 2.30 5.25/5.50/5.65 2.20/2.30 2.50
July 1977 4.40/4.65 8.80/9.05 4.40/4.65 5.60/5.80 2.30 5.25/5.50/5.65 2.20/2.30 2.50
Oct 1977 4.40/4.65 8.80/9.05 4.40/4.65 5.60/5.80 2.30 5.25/5.50/5.65 2.20/2.30 2.50
Jan 1978 4.40/4.65 8.80/9.05 4.40/4.65 5.60/5.80 2.30 5.25/5.50/5.65 2.20/2.30 2.50
April 1978 4.40/4.65 8.80/9.05 4.40/4.65 5.60/5.80 2.30 5.25/5.50/5.65 2.20/2.30 2.50
July 1978 4.40/4.65 8.80/9.05 4.40/4.65 5.60/5.80 2.30 5.25/5.50/5.65 2.20/2.30 2.50
Oct 1978 4.40/4.65 8.80/9.05 4.40/4.65 5.60/5.80 2.30 5.25/5.50/5.65 2.20/2.30 2.50
Jan 1979 4.40/4.65 8.80/9.05 4.40/4.65 5.60/5.80 2.30 5.25/5.50/5.65 2.20/2.30 2.50
April 1979 4.40/4.65 8.80/9.05 4.40/4.65 5.60/5.80 2.30 5.25/5.50/5.65 2.20/2.30 2.50
July 1979 4.40/4.65 8.80/9.05 4.40/4.65 5.60/5.80 2.30 5.25/5.50/5.65 2.20/2.30 2.50
Oct 1979 4.40/4.65 8.80/9.05 4.40/4.65 5.60/5.80 2.30 5.25/5.50/5.65 2.20/2.30 2.50
Jan 1980 4.40/4.65 8.80/9.05 4.40/4.65 5.60/5.80 2.30 5.25/5.50/5.65 2.20/2.30 2.50
April 1980 4.40/4.65 8.80/9.05 4.40/4.65 5.60/5.80 2.30 5.25/5.50/5.65 2.20/2.30 2.50
July 1980 4.40/4.65 8.80/9.05 4.40/4.65 5.60/5.80 2.30 5.25/5.50/5.65 5.75/5.90 7.00
Oct 1980 4.40/4.65 8.80/9.05 4.40/4.65 5.60/5.80 2.30 5.25/5.50/5.65 5.75/5.90 7.00
Jan 1981 ------------------ > 8.80/9.05 4.40/4.65 5.60/5.80 2.30 5.25/5.50/5.65 5.75/5.90 7.00
April 1981 8.80/9.05 4.40/4.65 5.60/5.80 2.30 5.25/5.50/5.65 5.75/5.90 7.00
July 1981 8.80/9.05 4.40/4.65 5.60/5.80 9.75/10.00 5.25/5.50/5.65 5.75/5.90 7.00
Oct 1981 8.80/9.05 4.40/4.65 5.60/5.80 9.75/10.00 5.25/5.50/5.65 5.75/5.90 7.00
Jan 1982 12.35/12.60 12.00/12.25 9.90/10.15 9.75/10.00 5.25/5.50/5.65 5.75/5.90 7.00
April 1982 12.35/12.60 12.00/12.25 9.90/10.15 9.75/10.00 5.25/5.50/5.65 5.75/5.90 7.00
July 1982 12.35/12.60 12.00/12.25 9.90/10.15 9.75/10.00 5.25/5.50/5.65 5.75/5.90 7.00
Oct 1982 12.35/12.60 12.00/12.25 9.90/10.15 9.75/10.00 5.25/5.50/5.65 5.75/5.90 7.00
Jan 1983 12.35/12.60 12.00/12.25 9.90/10.15 9.75/10.00 10.40/10.70/10.95 5.75/5.90 7.00
April 1983 12.35/12.60 12.00/12.25 9.90/10.15 9.75/10.00 10.40/10.70/10.95 5.75/5.90 7.00
July 1983 12.35/12.60 12.00/12.25 9.90/10.15 9.75/10.00 10.40/10.70/10.95 5.75/5.90 7.00
Oct 1983 12.35/12.60 12.00/12.25 9.90/10.15 9.75/10.00 10.40/10.70/10.95 5.75/5.90 7.00
Jan 1984 12.35/12.60 12.00/12.25 9.90/10.15 9.75/10.00 10.40/10.70/10.95 10.55/10.95 10.55/10.95/11.30/11.70
April 1984 12.35/12.60 12.00/12.25 9.90/10.15 9.75/10.00 10.40/10.70/10.95 10.55/10.95 10.55/10.95/11.30/11.70
July 1984 12.35/12.60 12.00/12.25 9.90/10.15 9.75/10.00 10.40/10.70/10.95 10.55/10.95 10.55/10.95/11.30/11.70
Oct 1984 12.35/12.60 12.00/12.25 9.90/10.15 9.75/10.00 10.40/10.70/10.95 10.55/10.95 10.55/10.95/11.30/11.70
AMALGAMATION AMALGAMATION
EASTERN CAPE NORTHERN & WESTERN CAPE
UNDERTAKING UNDERTAKING
Jan 1985 15.15/15.45 12.60/13.00 10.40/10.70/10.95 10.55/10.95 10.55/10.95/11.30/11.70
April 1985 15.15/15.55 12.60/13.00 10.40/10.70/10.95 10.55/10.95 10.55/10.95/11.30/11.70
July 1985 15.15/15.55 12.60/13.00 10.40/10.70/10.95 10.55/10.95 10.55/10.95/11.30/11.70
Sept 1985 15.15/15.55 12.60/13.00 10.40/10.70/10.95 10.55/10.95 10.55/10.95/11.30/11.70
Oct 1985 15.15/15.55 12.60/13.00 10.40/10.70/10.95 10.55/10.95 10.55/10.95/11.30/11.70

TABLE 5 - TARIFF A : ENERGY RATES NOTIFIED IN THE SCHEDULE OF STANDARD PRICES IN c/kW.h TAKING INTO ACCOUNT THE
QUARTELY COAL ADJUSTMENT (NOT ADJUSTED 1973 TO 1975)
UNDERTAKING CAPE BORDER ORANGE CAPE CAPE NATAL EASTERN RAND
EASTERN RIVER WESTERN NORTHERN TVL & OFS
DATE COAL COST
(c/ton)
Jan 1973 N/A 0.445 0.385 0.225 0.460 0.275 0.270 0.198 0.245
April 1973 N/A 0.445 0.385 0.225 0.460 0.275 0.270 0.198 0.245
July 1973 N/A 0.445 0.385 0.225 0.460 0.275 0.270 0.198 0.245
Oct 1973 N/A 0.445 0.385 0.225 0.460 0.275 0.270 0.198 0.245
Jan 1974 N/A 0.445 0.570 0.225 0.460 0.275 0.270 0.198 0.245
April 1974 N/A 0.445 0.570 0.225 0.460 0.275 0.270 0.198 0.225
July 1974 N/A 0.445 0.570 0.225 0.460 0.275 0.270 0.180 0.225
Oct 1974 N/A 0.445 0.570 0.225 0.460 0.275 0.270 0.180 0.225
Jan 1975 N/A 0.445 0.570 0.225 0.460 0.275 0.270 0.180 0.225
April 1975 N/A 0.445 0.570 0.225 0.460 0.275 0.270 0.180 0.225
July 1975 N/A 0.445 0.570 0.225 0.460 0.275 0.270 0.180 0.225
Oct 1975 N/A 0.445 0.570 0.225 0.460 0.275 0.270 0.180 0.225
Jan 1976 N/A 0.700 0.710 0.347 0.570 0.397 0.385 0.302 0.378
April 1976 N/A 0.700 0.740 0.379 0.605 0.429 0.400 0.334 0.418
July 1976 N/A 0.700 0.750 0.379 0.605 0.429 0.395 0.334 0.418
Sept 1976 N/A 0.640 0.710 0.640 0.710 0.429 0.640 0.334 0.418
Oct 1976 N/A 0.668 0.738 0.668 0.738 0.457 0.668 0.362 0.453
Jan 1977 N/A 0.674 0.744 0.674 0.744 0.463 0.674 0.368 0.460
April 1977 N/A 0.684 0.754 0.684 0.754 0.475 0.684 0.380 0.475
July 1977 N/A 0.696 0.766 0.696 0.766 0.487 0.696 0.392 0.490
Oct 1977 N/A 0.704 0.774 0.704 0.774 0.495 0.704 0.400 0.500
Jan 1978 N/A 0.708 0.778 0.708 0.778 0.499 0.708 0.404 0.505
April 1978 N/A 0.728 0.798 0.728 0.798 0.519 0.728 0.424 0.530
July 1978 N/A 0.716 0.786 0.716 0.786 0.507 0.716 0.412 0.515
Oct 1978 N/A 0.728 0.798 0.728 0.798 0.519 0.728 0.424 0.530
Jan 1979 608 0.730 0.800 0.730 0.800 0.521 0.730 0.426 0.533
April 1979 629 0.742 0.812 0.742 0.812 0.533 0.742 0.438 0.548
July 1979 639 0.748 0.818 0.748 0.818 0.539 0.748 0.444 0.555
Oct 1979 661 0.760 0.830 0.760 0.830 0.551 0.760 0.456 0.570
Jan 1980 677 0.770 0.840 0.770 0.840 0.561 0.770 0.466 0.583
April 1980 681 0.772 0.842 0.772 0.842 0.563 0.772 0.468 0.585
July 1980 727 0.798 0.868 0.798 0.868 0.589 0.798 0.906 1.002
Oct 1980 749 0.812 0.882 0.812 0.882 0.603 0.812 0.919 1.017
Jan 1981 787 --------> 0.904 0.834 0.904 0.623 0.834 0.942 1.041
April 1981 815 0.920 0.850 0.920 0.639 0.850 0.959 1.059
July 1981 847 0.938 0.868 0.938 1.335 0.868 0.977 1.079
Oct 1981 894 0.964 0.894 0.964 1.369 0.894 1.005 1.109
Jan 1982 1056 1.758 1.707 1.477 1.438 0.946 1.059 1.172
April 1982 1190 1.848 1.795 1.565 1.528 1.010 1.129 1.249
July 1982 1175 1.832 1.779 1.549 1.512 0.997 1.115 1.234
Oct 1982 1170 1.827 1.775 1.545 1.507 0.994 1.112 1.231
Jan 1983 1150 1.806 1.750 1.524 1.484 1.455 1.091 1.209
April 1983 1130 1.796 1.741 1.514 1.474 1.442 1.084 1.201
July 1983 1280 1.884 1.823 1.600 1.561 1.541 1.147 1.271
Oct 1983 1280 1.884 1.823 1.600 1.561 1.541 1.147 1.271
Jan 1984 1293 1.881 1.820 1.596 1.558 1.554 2.007 2.077
April 1984 1249 1.858 1.799 1.573 1.535 1.526 2.045 2.045
July 1984 1244 1.854 1.795 1.570 1.531 1.523 2.042 2.042
Oct 1984 1250 1.858 1.799 1.573 1.535 1.528 2.045 2.045
AMALGAMATION AMALGAMATION
EASTERN CAPE NORTHERN & WESTERN CAPE
UNDERTAKING UNDERTAKING
Jan 1985 1301 3.060 2.547 1.564 2.113 2.117
April 1985 1273 3.040 2.528 1.548 2.095 2.099
July 1985 1341 3.088 2.574 1.588 2.138 2.142
Sept 1985 1341 3.088 2.574 1.588 2.138 2.142
Oct 1985 1307 3.097 2.583 1.573 2.147 2.150

TABLE 6 - TARIFF A : EFFECTIVE BASIC CHARGE IN RANDS (AFTER APPLICATION OF THE SURCHARGE/DISCOUNT)
CAPE BORDER ORANGE CAPE CAPE NATAL EASTERN RAND R&OFS
EASTERN RIVER WESTERN NORTHERN TVL & OFS EXT
DATE
Jan 1973 7.48 7.14 10.50 7.26 6.21 6.93 6.30 12.00 13.80
April 1973 7.99 7.99 11.25 7.76 6.75 7.43 6.75 12.00 13.80
July 1973 7.99 7.99 11.25 7.76 6.75 7.43 6.75 12.00 13.80
Oct 1973 7.99 7.99 11.25 7.76 6.75 7.43 6.75 12.00 13.80
Jan 1974 7.99 7.99 11.25 7.76 6.75 7.43 6.75 12.00 13.80
April 1974 8.16 7.99 12.00 7.76 6.75 7.59 7.20 17.40 20.00
July 1974 8.16 7.99 12.00 7.76 6.75 7.59 12.75 17.40 20.00
Oct 1974 8.16 7.99 12.00 7.76 6.75 7.59 12.75 17.40 20.00
Jan 1975 8.16 7.99 12.00 7.76 6.75 7.59 12.75 17.40 20.00
April 1975 9.52 8.84 14.00 8.09 7.85 8.25 13.88 20.40 23.50
July 1975 9.52 8.84 14.00 8.09 7.85 8.25 13.88 20.40 23.50
Oct 1975 9.52 8.84 14.00 8.09 7.85 8.25 13.88 20.40 23.50
Jan 1976 9.52 8.84 14.00 8.09 7.85 8.25 13.88 20.40 23.50
April 1976 10.88 10.20 16.00 9.24 8.94 9.41 15.75 23.50 27.00
July 1976 10.88 10.20 16.00 9.24 8.94 9.41 15.75 23.50 27.00
Sept 1976 19.50 15.00 15.00 15.00 10.22 15.00 18.00 26.50 30.50
Oct 1976 19.50 15.00 15.00 15.00 10.22 15.00 18.00 26.50 30.50
Jan 1977 24.50 19.00 19.00 19.00 12.78 19.00 22.13 33.00 38.00
April 1977 24.50 19.00 19.00 19.00 12.78 19.00 22.13 33.00 38.00
July 1977 24.50 19.00 19.00 19.00 12.78 19.00 22.13 33.00 38.00
Oct 1977 24.50 19.00 19.00 19.00 12.78 19.00 22.13 33.00 38.00
Jan 1978 28.00 19.00 24.00 20.00 15.51 19.00 26.63 39.50 45.40
April 1978 28.00 19.00 24.00 20.00 15.51 19.00 26.63 39.50 45.40
July 1978 28.00 19.00 26.00 20.00 15.51 19.00 26.63 39.50 45.40
Oct 1978 28.00 19.00 26.00 20.00 15.51 19.00 26.63 39.50 45.40
Jan 1979 29.00 20.00 27.50 21.00 15.51 19.00 28.13 41.60 47.80
April 1979 29.00 20.00 27.50 21.00 15.51 19.00 28.13 41.60 47.80
July 1979 29.00 20.00 27.50 21.00 15.51 19.00 28.13 41.60 47.80
Oct 1979 29.00 20.00 27.50 21.00 15.51 19.00 28.13 41.60 47.80
Jan 1980 29.00 20.00 29.00 21.00 15.51 19.00 28.13 41.60 47.80
April 1980 29.00 20.00 29.00 21.00 15.51 19.00 28.13 41.60 47.80
July 1980 31.00 21.50 31.00 22.50 16.43 20.00 22.50 18.40 <--------
Oct 1980 31.00 21.50 31.00 22.50 16.43 20.00 22.50 18.40
Jan 1981 --------> 22.50 33.00 24.00 17.16 21.00 23.75 19.40
April 1981 22.50 33.00 24.00 17.16 21.00 23.75 19.40
July 1981 22.50 33.00 24.00 18.75 21.00 23.75 19.40
Oct 1981 22.50 33.00 24.00 18.75 21.00 23.75 19.40
Jan 1982 21.00 21.50 21.50 21.00 24.00 27.25 21.80
April 1982 21.00 21.50 21.50 21.00 24.00 27.25 21.80
July 1982 22.25 22.75 22.75 22.25 25.80 29.25 23.20
Oct 1982 22.25 22.75 22.75 22.25 25.80 29.25 23.20
Jan 1983 24.25 26.00 25.00 24.75 30.28 34.00 26.70
April 1983 24.25 26.00 25.00 24.75 30.28 34.00 26.70
July 1983 24.25 26.00 25.00 24.75 30.28 34.00 26.70
Oct 1983 24.25 26.00 25.00 24.75 30.28 34.00 26.70
Jan 1984 25.63 27.50 26.50 26.25 32.03 35.78 35.78
April 1984 25.63 27.50 26.50 26.25 32.03 35.78 35.78
July 1984 25.63 27.50 26.50 26.25 32.03 35.78 35.78
Oct 1984 25.63 27.50 26.50 26.25 32.03 35.78 35.78
AMALGAMATION AMALGAMATION
EASTERN CAPE NORTHERN & WESTERN CAPE
UNDERTAKING UNDERTAKING
Jan 1985 35.55 37.35 35.35 39.15 39.60
April 1985 35.55 37.35 35.35 39.15 39.60
July 1985 35.55 37.35 35.35 39.15 39.60
Sept 1985 39.11 41.09 38.89 43.07 43.56
Oct 1985 39.11 41.09 38.89 43.07 43.56

TABLE 7 - TARIFF A : EFFECTIVE DEMAND RATES (AFTER APPLICATION OF THE SURCHARGE/DISCOUNT)
(SEE NOTES ON VOLTAGES)
UNDERTAKING CAPE BORDER ORANGE CAPE CAPE NATAL EASTERN RAND & OFS R&OFS
EASTERN RIVER WESTERN NORTHERN TVL EXT
DATE R/kV.A R/kV.A R/kV.A R/kV.A R/kV.A R/kV.A R/kW OR R/kVA. R/kW
Jan 1973 2.26 2.15 2.21 1.79 1.93 1.96 1.69 1.84 1.88 1.98 1.05 5.52 6.35
April 1973 2.41 2.41 2.36 1.92 2.06 2.13 1.81 1.97 2.01 2.13 1.13 5.52 6.35
July 1973 2.41 2.41 2.36 1.92 2.06 2.13 1.81 1.97 2.01 2.13 1.13 5.52 6.35
Oct 1973 2.41 2.41 2.36 1.92 2.06 2.13 1.81 1.97 2.01 2.13 2.48 2.59 5.52 6.35
Jan 1974 2.41 2.41 2.36 1.92 2.06 2.13 1.81 1.97 2.01 2.13 2.48 2.59 5.52 6.35
April 1974 2.46 2.41 2.52 1.92 2.06 2.13 1.85 2.01 2.06 2.17 2.64 2.76 2.18 2.50
July 1974 2.46 2.41 2.52 1.92 2.06 2.13 1.85 2.01 2.06 2.17 1.87 1.96 2.18 2.50
Oct 1974 2.46 2.41 2.52 1.92 2.06 2.13 1.85 2.01 2.06 2.17 1.87 1.96 2.18 2.50
Jan 1975 2.46 2.41 2.52 1.92 2.06 2.13 1.85 2.01 2.06 2.17 1.87 1.96 2.18 2.50
April 1975 2.87 2.67 2.94 2.00 2.14 2.47 2.01 2.19 2.24 2.36 2.04 2.13 2.55 2.94
July 1975 2.87 2.67 2.94 2.00 2.14 2.47 2.01 2.19 2.24 2.36 2.04 2.13 2.55 2.94
Oct 1975 2.87 2.67 2.94 2.00 2.14 2.47 2.01 2.19 2.24 2.36 2.04 2.13 2.55 2.94
Jan 1976 2.87 2.67 2.94 2.00 2.14 2.47 2.01 2.19 2.24 2.36 2.04 2.13 2.55 2.94
April 1976 3.28 3.08 3.36 2.28 2.45 2.82 2.29 2.49 2.55 2.69 2.31 2.42 2.94 3.38
July 1976 3.28 3.08 3.36 2.28 2.45 2.82 2.29 2.49 2.55 2.69 2.31 2.42 2.94 3.38
Sept 1976 4.29 4.53 6.60 6.79 3.30 3.49 4.20 4.35 3.22 3.94 4.13 4.24 2.64 2.76 3.31 3.81
Oct 1976 4.29 4.53 6.60 6.79 3.30 3.49 4.20 4.35 3.22 3.94 4.13 4.24 2.64 2.76 3.31 3.81
Jan 1977 5.39 5.70 8.36 8.60 4.18 4.42 5.32 5.51 4.03 4.99 5.23 5.37 3.25 3.39 4.13 4.75
April 1977 5.39 5.70 8.36 8.60 4.18 4.42 5.32 5.51 4.03 4.99 5.23 5.37 3.25 3.39 4.13 4.75
July 1977 5.39 5.70 8.36 8.60 4.18 4.42 5.32 5.51 4.03 4.99 5.23 5.37 3.25 3.39 4.13 4.75
Oct 1977 5.39 5.70 8.36 8.60 4.18 4.42 5.32 5.51 4.03 4.99 5.23 5.37 3.25 3.39 4.13 4.75
Jan 1978 6.16 6.51 8.36 8.60 5.28 5.58 5.60 5.80 4.89 4.99 5.23 5.37 3.91 4.08 4.94 5.68
April 1978 6.16 6.51 8.36 8.60 5.28 5.58 5.60 5.80 4.89 4.99 5.23 5.37 3.91 4.08 4.94 5.68
July 1978 6.16 6.51 8.36 8.60 5.72 6.05 5.60 5.80 4.89 4.99 5.23 5.37 3.91 4.08 4.94 5.68
Oct 1978 6.16 6.51 8.36 8.60 5.72 6.05 5.60 5.80 4.89 4.99 5.23 5.37 3.91 4.08 4.94 5.68
Jan 1979 6.38 6.74 8.80 9.05 6.05 6.39 5.88 6.09 4.89 4.99 5.23 5.37 4.13 4.31 5.20 5.98
April 1979 6.38 6.74 8.80 9.05 6.05 6.39 5.88 6.09 4.89 4.99 5.23 5.37 4.13 4.31 5.20 5.98
July 1979 6.38 6.74 8.80 9.05 6.05 6.39 5.88 6.09 4.89 4.99 5.23 5.37 4.13 4.31 5.20 5.98
Oct 1979 6.38 6.74 8.80 9.05 6.05 6.39 5.88 6.09 4.89 4.99 5.23 5.37 4.13 4.31 5.20 5.98
Jan 1980 6.38 6.74 8.80 9.05 6.38 6.74 5.88 6.09 4.89 4.99 5.23 5.37 4.13 4.31 5.20 5.98
April 1980 6.38 6.74 8.80 9.05 6.38 6.74 5.88 6.09 4.89 4.99 5.23 5.37 4.13 4.31 5.20 5.98
July 1980 6.82 7.21 9.46 9.73 6.82 7.21 6.30 6.53 5.18 5.25 5.50 5.65 5.18 5.31 6.44 <--------
Oct 1980 6.82 7.21 9.46 9.73 6.82 7.21 6.30 6.53 5.18 5.25 5.50 5.65 5.18 5.31 6.44
Jan 1981 -------- -----> 9.90 10.18 7.26 7.67 6.72 6.96 5.41 5.51 5.78 5.93 5.46 5.61 6.79
April 1981 9.90 10.18 7.26 7.67 6.72 6.96 5.41 5.51 5.78 5.93 5.46 5.61 6.79
July 1981 9.90 10.18 7.26 7.67 6.72 6.96 7.31 7.50 5.51 5.78 5.93 5.46 5.61 6.79
Oct 1981 9.90 10.18 7.26 7.67 6.72 6.96 7.31 7.50 5.51 5.78 5.93 5.46 5.61 6.79
Jan 1982 10.37 10.58 10.32 10.54 8.51 8.73 8.19 8.40 6.30 6.60 6.78 6.27 6.43 7.63
April 1982 10.37 10.58 10.32 10.54 8.51 8.73 8.19 8.40 6.30 6.60 6.78 6.27 6.43 7.63
July 1982 10.99 11.21 10.92 11.15 9.01 9.24 8.68 8.90 6.77 7.10 7.29 6.73 6.90 8.12
Oct 1982 10.99 11.21 10.92 11.15 9.01 9.24 8.68 8.90 6.77 7.10 7.29 6.73 6.90 8.12
Jan 1983 11.98 12.22 12.48 12.74 9.90 10.15 9.65 9.90 9.00 9.26 9.47 7.82 8.02 9.35
April 1983 11.98 12.22 12.48 12.74 9.90 10.15 9.65 9.90 9.00 9.26 9.47 7.82 8.02 9.35
July 1983 11.98 12.22 12.48 12.74 9.90 10.15 9.65 9.90 9.00 9.26 9.47 7.82 8.02 9.35
Oct 1983 11.98 12.22 12.48 12.74 9.90 10.15 9.65 9.90 9.00 9.26 9.47 7.82 8.02 9.35
Jan 1984 12.66 12.92 13.20 13.48 10.49 10.76 10.24 10.50 9.52 9.79 10.02 8.39 8.71 8.39 8.71 8.98 9.30
April 1984 12.66 12.92 13.20 13.48 10.49 10.76 10.24 10.50 9.52 9.79 10.02 8.39 8.71 8.39 8.71 8.98 9.30
July 1984 12.66 12.92 13.20 13.48 10.49 10.76 10.24 10.50 9.52 9.79 10.02 8.39 8.71 8.39 8.71 8.98 9.30
Oct 1984 12.66 12.92 13.20 13.48 10.49 10.76 10.24 10.50 9.52 9.79 10.02 8.39 8.71 8.39 8.71 8.98 9.30
AMALGAMATION AMALGAMATION
EASTERN CAPE NORTHERN & WESTERN CAPE
UNDERTAKING UNDERTAKING
Jan 1985 11.97 12.21 10.46 10.79 10.50 10.81 11.06 9.18 9.53 9.28 9.64 9.94 10.30
April 1985 11.97 12.21 10.46 10.79 10.50 10.81 11.06 9.18 9.53 9.28 9.64 9.94 10.30
July 1985 11.97 12.21 10.46 10.79 10.50 10.81 11.06 9.18 9.53 9.28 9.64 9.94 10.30
Sept 1985 13.17 13.43 11.50 11.87 11.55 11.89 12.17 10.10 10.48 10.21 10.60 10.94 11.33
Oct 1985 13.17 13.43 11.50 11.87 11.55 11.89 12.17 10.10 10.48 10.21 10.60 10.94 11.33

TABLE 8 - TARIFF A : EFFECTIVE ENERGY RATES IN c/kW.h (AFTER APPLICATION OF THE SURCHARGE/DISCOUNT)
UNDERTAKING CAPE BORDER ORANGE CAPE CAPE NATAL EASTERN RAND R&OFS
EASTERN RIVER WESTERN NORTHERN TVL & OFS EXT
DATE
Jan 1973 0.490 0.404 0.236 0.506 0.234 0.284 0.207 0.294 0.338
April 1973 0.523 0.452 0.253 0.541 0.254 0.304 0.222 0.294 0.338
July 1973 0.523 0.452 0.253 0.541 0.254 0.304 0.222 0.294 0.338
Oct 1973 0.523 0.452 0.253 0.541 0.254 0.304 0.222 0.294 0.338
Jan 1974 0.523 0.670 0.253 0.541 0.254 0.304 0.222 0.294 0.338
April 1974 0.534 0.670 0.270 0.541 0.254 0.311 0.237 0.196 0.225
July 1974 0.534 0.670 0.270 0.541 0.254 0.311 0.153 0.196 0.225
Oct 1974 0.534 0.670 0.270 0.541 0.254 0.311 0.153 0.196 0.225
Jan 1975 0.534 0.670 0.270 0.541 0.254 0.311 0.153 0.196 0.225
April 1975 0.623 0.741 0.315 0.564 0.296 0.338 0.167 0.230 0.264
July 1975 0.623 0.741 0.315 0.564 0.296 0.338 0.167 0.230 0.264
Oct 1975 0.623 0.741 0.315 0.564 0.296 0.338 0.167 0.230 0.264
Jan 1976 0.980 0.923 0.486 0.698 0.427 0.481 0.279 0.385 0.444
April 1976 1.120 1.110 0.606 0.847 0.526 0.570 0.351 0.491 0.564
July 1976 1.120 1.125 0.606 0.847 0.526 0.563 0.351 0.491 0.564
Sept 1976 0.624 0.533 0.480 0.533 0.601 0.480 0.401 0.553 0.637
Oct 1976 0.651 0.554 0.501 0.554 0.640 0.501 0.434 0.600 0.690
Jan 1977 0.826 0.707 0.640 0.707 0.810 0.640 0.543 0.759 0.874
April 1977 0.838 0.716 0.650 0.716 0.831 0.650 0.561 0.784 0.903
July 1977 0.853 0.728 0.661 0.728 0.852 0.661 0.578 0.809 0.931
Oct 1977 0.862 0.735 0.669 0.735 0.866 0.669 0.590 0.825 0.950
Jan 1978 0.991 0.739 0.850 0.778 1.060 0.673 0.717 0.997 1.146
April 1978 1.019 0.758 0.874 0.798 1.103 0.692 0.753 1.047 1.203
July 1978 1.002 0.747 0.931 0.786 1.077 0.680 0.731 1.017 1.169
Oct 1978 1.019 0.758 0.946 0.798 1.103 0.692 0.753 1.047 1.203
Jan 1979 1.059 0.800 1.004 0.840 1.107 0.694 0.799 1.108 1.273
April 1979 1.076 0.812 1.020 0.853 1.133 0.705 0.821 1.139 1.309
July 1979 1.085 0.818 1.029 0.859 1.145 0.711 0.833 1.154 1.326
Oct 1979 1.102 0.830 1.045 0.872 1.171 0.722 0.855 1.186 1.362
Jan 1980 1.117 0.840 1.117 0.882 1.192 0.732 0.874 1.212 1.392
April 1980 1.119 0.842 1.119 0.884 1.196 0.733 0.878 1.217 1.398
July 1980 1.237 0.933 1.237 0.977 1.325 0.798 0.815 0.922 <--------
Oct 1980 1.259 0.948 1.259 0.992 1.357 0.812 0.827 0.935
Jan 1981 --------> 1.017 1.376 1.085 1.464 0.876 0.894 1.010
April 1981 1.035 1.403 1.104 1.502 0.893 0.911 1.027
July 1981 1.055 1.432 1.126 1.001 0.911 0.928 1.047
Oct 1981 1.085 1.475 1.157 1.027 0.939 0.954 1.076
Jan 1982 1.477 1.468 1.270 1.208 1.135 1.154 1.277
April 1982 1.552 1.544 1.346 1.284 1.212 1.231 1.361
July 1982 1.630 1.619 1.410 1.346 1.286 1.305 1.431
Oct 1982 1.626 1.615 1.406 1.341 1.282 1.301 1.428
Jan 1983 1.752 1.820 1.524 1.469 1.259 1.484 1.614
April 1983 1.742 1.811 1.514 1.459 1.247 1.474 1.603
July 1983 1.827 1.896 1.600 1.545 1.333 1.560 1.697
Oct 1983 1.827 1.896 1.600 1.545 1.333 1.560 1.697
Jan 1984 1.928 2.002 1.692 1.636 1.422 1.596 1.651
April 1984 1.904 1.979 1.667 1.612 1.396 1.626 1.626
July 1984 1.900 1.975 1.664 1.608 1.394 1.623 1.623
Oct 1984 1.904 1.979 1.667 1.612 1.398 1.626 1.626
AMALGAMATION AMALGAMATION
EASTERN CAPE NORTHERN & WESTERN CAPE
UNDERTAKING UNDERTAKING
Jan 1985 2.417 2.114 1.580 1.838 1.863
April 1985 2.402 2.098 1.563 1.823 1.847
July 1985 2.440 2.136 1.604 1.860 1.885
Sept 1985 2.683 2.350 1.764 2.046 2.073
Oct 1985 2.691 2.358 1.748 2.055 2.081

TABLE 9 - TARIFF B : BASIC CHARGE IN RANDS NOTIFIED IN THE SCHEDULE OF STANDARD PRICES
(BEFORE APPLICATION OF THE SURCHARGE/DISCOUNT)
UNDERTAKING CAPE BORDER ORANGE CAPE CAPE NATAL EASTERN TVL RAND & OFS
EASTERN RIVER WESTERN NORTHERN
DATE
Jan 1973 1.00 1.00 2.00 0.82 1.25 0.85 1.00 0.00
April 1973 1.00 1.00 2.00 0.82 1.25 0.85 1.00 0.00
July 1973 1.00 1.00 2.00 0.82 1.25 0.85 1.00 0.00
Oct 1973 1.00 1.00 2.00 0.82 1.25 0.85 1.00 0.00
Jan 1974 1.00 1.00 2.00 0.82 1.25 0.85 1.00 0.00
April 1974 1.00 1.00 2.00 0.82 1.25 0.85 1.00 3.00 6.00
July 1974 1.00 1.00 2.00 0.82 1.25 0.85 6.00 3.00 6.00
Oct 1974 1.00 1.00 2.00 0.82 1.25 0.85 6.00 3.00 6.00
Jan 1975 1.00 1.00 2.00 0.82 1.25 0.85 6.00 3.00 6.00
April 1975 1.00 1.00 2.00 0.82 1.25 0.85 6.00 3.00 6.00
July 1975 1.00 1.00 2.00 0.82 1.25 0.85 6.00 3.00 6.00
Oct 1975 1.00 1.00 2.00 0.82 1.25 0.85 6.00 3.00 6.00
Jan 1976 1.00 1.00 2.00 0.82 1.25 0.85 6.00 3.00 6.00
April 1976 1.00 1.00 2.00 0.82 1.25 0.85 6.00 3.00 6.00
July 1976 1.00 1.00 2.00 0.82 1.25 0.85 6.00 3.00 6.00
Sept 1976 1.00 1.00 2.00 0.82 1.25 0.85 6.00 3.00 6.00
Oct 1976 1.00 1.00 2.00 0.82 1.25 0.85 6.00 3.00 6.00
Jan 1977 8.00 8.00 8.00 8.00 1.25 8.00 6.00 3.00 6.00
April 1977 8.00 8.00 8.00 8.00 1.25 8.00 6.00 3.00 6.00
July 1977 8.00 8.00 8.00 8.00 1.25 8.00 6.00 3.00 6.00
Oct 1977 8.00 8.00 8.00 8.00 1.25 8.00 6.00 3.00 6.00
Jan 1978 8.00 8.00 8.00 8.00 1.25 8.00 6.00 3.00 6.00
April 1978 8.00 8.00 8.00 8.00 1.25 8.00 6.00 3.00 6.00
July 1978 8.00 8.00 8.00 8.00 1.25 8.00 6.00 3.00 6.00
Oct 1978 8.00 8.00 8.00 8.00 1.25 8.00 6.00 3.00 6.00
Jan 1979 8.00 8.00 8.00 8.00 1.25 8.00 6.00 3.00 6.00
April 1979 8.00 8.00 8.00 8.00 1.25 8.00 6.00 3.00 6.00
July 1979 8.00 8.00 8.00 8.00 1.25 8.00 6.00 3.00 6.00
Oct 1979 8.00 8.00 8.00 8.00 1.25 8.00 6.00 3.00 6.00
Jan 1980 8.00 8.00 8.00 8.00 1.25 8.00 10.00 12.00 <--------
April 1980 8.00 8.00 8.00 8.00 1.25 8.00 10.00 12.00
July 1980 8.00 8.00 8.00 8.00 1.25 8.00 10.00 12.00
Oct 1980 8.00 8.00 8.00 8.00 1.25 8.00 10.00 12.00
Jan 1981 ------->-------> 8.00 8.00 8.00 1.25 8.00 10.00 12.00
April 1981 8.00 8.00 8.00 1.25 8.00 10.00 12.00
July 1981 8.00 8.00 8.00 12.00 8.00 10.00 12.00
Oct 1981 8.00 8.00 8.00 12.00 8.00 10.00 12.00
Jan 1982 12.00 12.00 12.00 12.00 8.00 10.00 12.00
April 1982 12.00 12.00 12.00 12.00 8.00 10.00 12.00
July 1982 12.00 12.00 12.00 12.00 8.00 10.00 12.00
Oct 1982 12.00 12.00 12.00 12.00 8.00 10.00 12.00
Jan 1983 12.00 12.00 12.00 12.00 12.00 10.00 12.00
April 1983 12.00 12.00 12.00 12.00 12.00 10.00 12.00
July 1983 12.00 12.00 12.00 12.00 12.00 10.00 12.00
Oct 1983 12.00 12.00 12.00 12.00 12.00 10.00 12.00
Jan 1984 12.00 12.00 12.00 12.00 12.00 20.00 20.00
April 1984 12.00 12.00 12.00 12.00 12.00 20.00 20.00
July 1984 12.00 12.00 12.00 12.00 12.00 20.00 20.00
Oct 1984 12.00 12.00 12.00 12.00 12.00 20.00 20.00
AMALGAMATION AMALGAMATION
EASTERN CAPE NORTHERN & WESTERN CAPE
UNDERTAKING UNDERTAKING
Jan 1985 16.00 16.00 12.00 20.00 20.00
April 1985 16.00 16.00 12.00 20.00 20.00
July 1985 16.00 16.00 12.00 20.00 20.00
Sept 1985 16.00 16.00 12.00 20.00 20.00
Oct 1985 16.00 16.00 12.00 20.00 20.00

TABLE 10 - TARIFF B : DEMAND RATES NOTIFIED IN THE SCHEDULE OF STANDARD PRICES
(BEFORE APPLICATION OF THE SURCHARGE/DISCOUNT)
UNDERTAKING CAPE BORDER ORANGE CAPE CAPE NATAL EASTERN TVL RAND & OFS
EASTERN RIVER WESTERN NORTHERN
DATE R/AMP R/AMP R/AMP R/AMP R/AMP R/AMP R/AMP R/kW
Jan 1973 0.20 0.20 0.25 0.26 0.30 0.15 0.125 0.042
April 1973 0.20 0.20 0.25 0.26 0.30 0.15 0.125 0.042
July 1973 0.20 0.20 0.25 0.26 0.30 0.15 0.125 0.042
Oct 1973 0.20 0.20 0.25 0.26 0.30 0.15 0.125 0.042
Jan 1974 0.20 0.20 0.25 0.26 0.30 0.15 0.125 0.042
April 1974 0.20 0.20 0.25 0.26 0.30 0.15 0.125 ---------------------
July 1974 0.20 0.20 0.25 0.26 0.30 0.15 ---------------------
Oct 1974 0.20 0.20 0.25 0.26 0.30 0.15
Jan 1975 0.20 0.20 0.25 0.26 0.30 0.15
April 1975 0.20 0.20 0.25 0.26 0.30 0.15
July 1975 0.20 0.20 0.25 0.26 0.30 0.15
Oct 1975 0.20 0.20 0.25 0.26 0.30 0.15
Jan 1976 0.20 0.20 0.25 0.26 0.30 0.15
April 1976 0.20 0.20 0.25 0.26 0.30 0.15
July 1976 0.20 0.20 0.25 0.26 0.30 0.15
Sept 1976 0.20 0.20 0.25 0.26 0.30 0.15
Oct 1976 0.20 0.20 0.25 0.26 0.30 0.15
Jan 1977 ------------------- ------------------- ------------------- ------------------- 0.30 -------------------
April 1977 0.30
July 1977 0.30
Oct 1977 0.30
Jan 1978 0.30
April 1978 0.30
July 1978 0.30
Oct 1978 0.30
Jan 1979 0.30
April 1979 0.30
July 1979 0.30
Oct 1979 0.30
Jan 1980 0.30
April 1980 0.30
July 1980 0.30
Oct 1980 0.30
Jan 1981 0.30
April 1981 0.30
July 1981 ---------------------

TABLE 11 - TARIFF B : NOTIFIED ENERGY RATES IN c/kW.h TAKING INTO ACCOUNT THE QUARTERLY COAL COST ADJUSTMENT
(NOT ADJUSTED 1973-1975)
ONCE INTRODUCED, THE HIGH ENERGY RATE WAS APPLIED TO THE FIRST 500 kW.h CONSUMPTION
UNDERTAKING CAPE BORDER ORANGE CAPE CAPE NATAL EASTERN RAND & OFS
EASTERN RIVER WESTERN NORTH TVL
COAL COST
QUARTER (c/ton)
Jan 1973 N/A 0.90 0.84 0.75 0.94 0.83 0.76 0.67 0.20
April 1973 N/A 0.90 0.84 0.75 0.94 0.83 0.76 0.67 0.20
July 1973 N/A 0.90 0.84 0.75 0.94 0.83 0.76 0.67 0.20
Oct 1973 N/A 0.90 0.84 0.75 0.94 0.83 0.76 0.67 0.20
Jan 1974 N/A 0.90 1.02 0.75 0.94 0.83 0.76 0.67 0.20
April 1974 N/A 0.90 1.02 0.75 0.94 0.83 0.76 0.67 1.80 0.90
July 1974 N/A 0.90 1.02 0.75 0.94 0.83 0.76 1.80 0.90 1.80 0.90
Oct 1974 N/A 0.90 1.02 0.75 0.94 0.83 0.76 1.80 0.90 1.80 0.90
Jan 1975 N/A 0.90 1.02 0.75 0.94 0.83 0.76 1.80 0.90 1.80 0.90
April 1975 N/A 0.90 1.02 0.75 0.94 0.83 0.76 1.80 0.90 1.80 0.90
July 1975 N/A 0.90 1.02 0.75 0.94 0.83 0.76 1.80 0.90 1.80 0.90
Oct 1975 N/A 0.90 1.02 0.75 0.94 0.83 0.76 1.80 0.90 1.80 0.90
Jan 1976 N/A 1.14 1.16 0.87 1.04 0.95 0.86 1.80 1.02 1.80 1.02
April 1976 N/A 1.14 1.18 0.90 1.08 0.98 0.88 1.80 1.05 1.80 1.05
July 1976 N/A 1.14 1.20 0.90 1.08 0.98 0.88 1.80 1.05 1.80 1.05
Sept 1976 N/A 5.37 2.67 5.37 2.67 5.37 2.67 5.37 2.67 0.98 4.27 2.12 1.80 1.05 1.80 1.05
Oct 1976 N/A 5.40 2.70 5.40 2.70 5.40 2.70 5.40 2.70 1.01 4.30 2.15 1.80 1.08 1.80 1.08
Jan 1977 N/A 5.40 2.70 5.40 2.70 5.40 2.70 5.40 2.70 1.01 4.30 2.15 1.80 1.08 1.80 1.08
April 1977 N/A 5.41 2.71 5.41 2.71 5.41 2.71 5.41 2.71 1.03 4.31 2.16 1.80 1.10 1.80 1.10
July 1977 N/A 5.42 2.72 5.42 2.72 5.42 2.72 5.42 2.72 1.04 4.32 2.17 1.80 1.11 1.80 1.11
Oct 1977 N/A 5.43 2.73 5.43 2.73 5.43 2.73 5.43 2.73 1.05 4.33 2.18 1.80 1.12 1.80 1.12
Jan 1978 N/A 5.43 2.73 5.43 2.73 5.43 2.73 5.43 2.73 1.05 4.33 2.18 1.80 1.12 1.80 1.12
April 1978 N/A 5.45 2.75 5.45 2.75 5.45 2.75 5.45 2.75 1.07 4.35 2.20 1.80 1.14 1.80 1.14
July 1978 N/A 5.44 2.74 5.44 2.74 5.44 2.74 5.44 2.74 1.06 4.34 2.19 1.80 1.13 1.80 1.13
Oct 1978 N/A 5.45 2.75 5.45 2.75 5.45 2.75 5.45 2.75 1.07 4.35 2.20 1.80 1.14 1.80 1.14
Jan 1979 608 5.46 2.76 5.46 2.76 5.46 2.76 5.46 2.76 1.07 4.36 2.21 1.80 1.14 1.80 1.14
April 1979 629 5.47 2.77 5.47 2.77 5.47 2.77 5.47 2.77 1.08 4.37 2.22 1.80 1.15 2.80 1.15
July 1979 639 5.47 2.77 5.47 2.77 5.47 2.77 5.47 2.77 1.09 4.37 2.22 1.80 1.16 1.80 1.16
Oct 1979 661 5.49 2.79 5.49 2.79 5.49 2.79 5.49 2.79 1.10 4.39 2.24 1.80 1.17 1.80 1.17
Jan 1980 677 5.50 2.80 5.50 2.80 5.50 2.80 5.50 2.80 1.11 4.40 2.25 1.80 1.18 1.80 1.18
April 1980 681 5.50 2.80 5.50 2.80 5.50 2.80 5.50 2.80 1.11 4.40 2.25 1.80 1.18 1.80 1.18
July 1980 727 5.52 2.82 5.52 2.82 5.52 2.82 5.52 2.82 1.14 4.42 2.27 4.85 2.85 5.25 2.85
Oct 1980 749 5.54 2.84 5.54 2.84 5.54 2.84 5.54 2.84 1.15 4.44 2.29 4.87 2.87 5.27 2.87
Jan 1981 787 ----------- ----> 5.56 2.86 5.56 2.86 5.56 2.86 1.17 4.46 2.31 4.88 2.88 5.28 2.88
April 1981 815 5.58 2.88 5.58 2.88 5.58 2.88 1.19 4.48 2.33 4.90 2.90 5.30 2.90
July 1981 847 5.59 2.89 5.59 2.89 5.59 2.89 7.02 4.32 4.49 2.34 4.92 2.92 5.32 2.92
Oct 1981 894 5.62 2.92 5.62 2.92 5.62 2.92 7.06 4.36 4.52 2.37 4.95 2.95 5.35 2.95
Jan 1982 1056 8.78 5.48 8.58 5.28 7.73 4.43 7.13 4.43 4.57 2.42 4.97 2.97 5.37 2.97
April 1982 1190 8.86 5.56 8.66 5.36 7.81 4.51 7.21 4.51 4.63 2.48 5.04 3.04 5.44 3.04
July 1982 1175 8.86 5.56 8.65 5.35 7.80 4.50 7.21 4.51 4.62 2.47 5.03 3.03 5.43 3.03
Oct 1982 1170 8.85 5.55 8.64 5.34 7.79 4.49 7.20 4.50 4.61 2.46 5.02 3.02 5.42 3.02
Jan 1983 1150 8.83 5.53 8.62 5.32 7.78 4.48 7.18 4.48 7.83 4.53 5.00 3.00 5.40 3.00
April 1983 1130 8.82 5.52 8.61 5.31 7.77 4.47 7.17 4.47 7.82 4.52 5.00 3.00 5.40 3.00
July 1983 1280 8.91 5.61 8.70 5.40 7.86 4.56 7.26 4.56 7.93 4.63 5.06 3.06 5.46 3.06
Oct 1983 1280 8.91 5.61 8.70 5.40 7.86 4.56 7.26 4.56 7.89 4.63 5.06 3.06 5.46 3.06
Jan 1984 1293 8.90 5.60 8.69 5.39 7.85 4.55 7.25 4.55 7.93 4.63 9.64 5.49 9.64 5.49
April 1984 1249 8.88 5.58 8.67 5.37 7.83 4.53 7.23 4.53 7.91 4.61 9.61 5.46 9.61 5.46
July 1984 1244 8.87 5.57 8.66 5.36 7.82 4.52 7.22 4.52 7.91 4.61 9.61 5.46 9.61 5.46
Oct 1984 1250 8.88 5.58 8.67 5.37 7.83 4.53 7.23 4.53 7.91 4.61 9.61 5.46 9.61 5.46
AMALGAMATION AMALGAMATION
EASTERN CAPE NORTHERN & WESTERN CAPE
UNDERTAKING UNDERTAKING
Jan 1985 1301 11.98 7.83 10.71 6.56 7.95 4.65 9.67 5.52 9.68 5.53
April 1985 1273 11.96 7.81 10.68 6.53 7.93 4.63 9.65 5.50 9.65 5.50
July 1985 1341 12.01 7.86 10.73 6.58 7.97 4.67 9.70 5.55 9.70 5.55
Sept 1985 1341 12.01 7.86 10.73 6.58 7.97 4.67 9.70 5.55 9.70 5.55
Oct 1985 1307 12.01 7.86 10.74 6.59 7.95 4.65 9.70 5.55 9.71 5.56
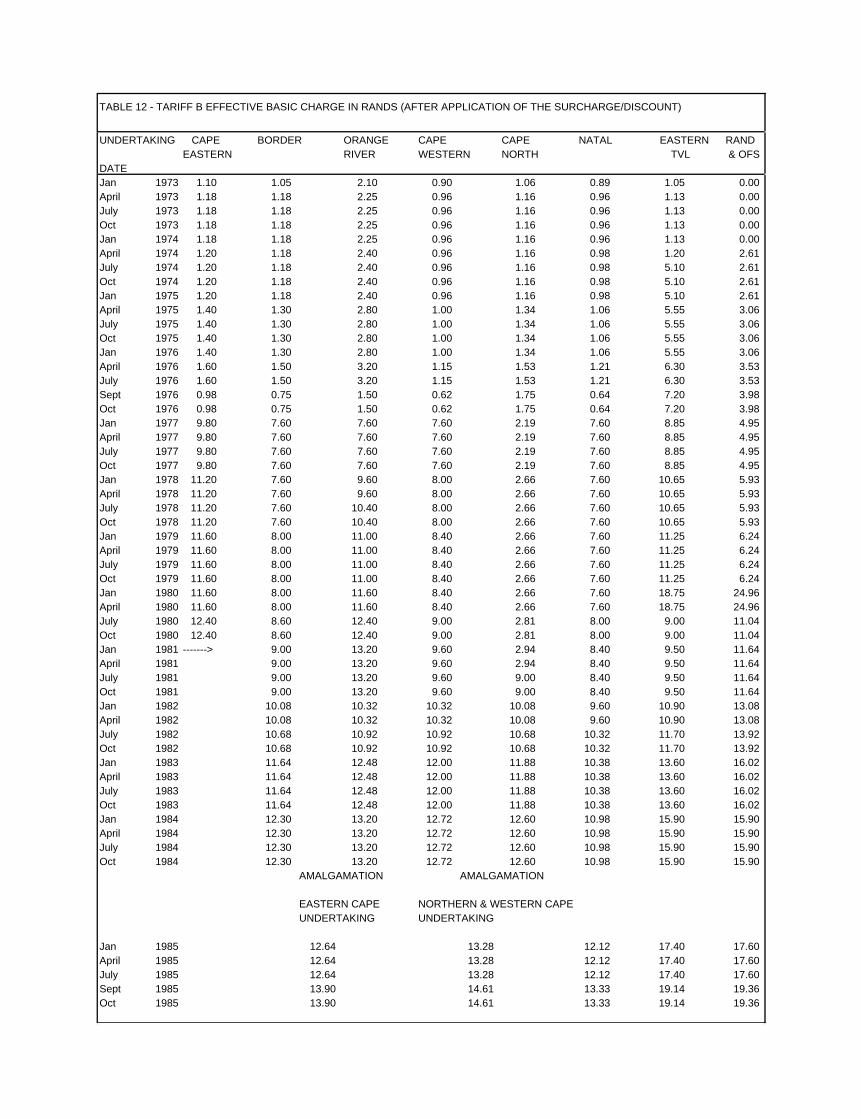
TABLE 12 - TARIFF B EFFECTIVE BASIC CHARGE IN RANDS (AFTER APPLICATION OF THE SURCHARGE/DISCOUNT)
UNDERTAKING CAPE BORDER ORANGE CAPE CAPE NATAL EASTERN RAND
EASTERN RIVER WESTERN NORTH TVL & OFS
DATE
Jan 1973 1.10 1.05 2.10 0.90 1.06 0.89 1.05 0.00
April 1973 1.18 1.18 2.25 0.96 1.16 0.96 1.13 0.00
July 1973 1.18 1.18 2.25 0.96 1.16 0.96 1.13 0.00
Oct 1973 1.18 1.18 2.25 0.96 1.16 0.96 1.13 0.00
Jan 1974 1.18 1.18 2.25 0.96 1.16 0.96 1.13 0.00
April 1974 1.20 1.18 2.40 0.96 1.16 0.98 1.20 2.61
July 1974 1.20 1.18 2.40 0.96 1.16 0.98 5.10 2.61
Oct 1974 1.20 1.18 2.40 0.96 1.16 0.98 5.10 2.61
Jan 1975 1.20 1.18 2.40 0.96 1.16 0.98 5.10 2.61
April 1975 1.40 1.30 2.80 1.00 1.34 1.06 5.55 3.06
July 1975 1.40 1.30 2.80 1.00 1.34 1.06 5.55 3.06
Oct 1975 1.40 1.30 2.80 1.00 1.34 1.06 5.55 3.06
Jan 1976 1.40 1.30 2.80 1.00 1.34 1.06 5.55 3.06
April 1976 1.60 1.50 3.20 1.15 1.53 1.21 6.30 3.53
July 1976 1.60 1.50 3.20 1.15 1.53 1.21 6.30 3.53
Sept 1976 0.98 0.75 1.50 0.62 1.75 0.64 7.20 3.98
Oct 1976 0.98 0.75 1.50 0.62 1.75 0.64 7.20 3.98
Jan 1977 9.80 7.60 7.60 7.60 2.19 7.60 8.85 4.95
April 1977 9.80 7.60 7.60 7.60 2.19 7.60 8.85 4.95
July 1977 9.80 7.60 7.60 7.60 2.19 7.60 8.85 4.95
Oct 1977 9.80 7.60 7.60 7.60 2.19 7.60 8.85 4.95
Jan 1978 11.20 7.60 9.60 8.00 2.66 7.60 10.65 5.93
April 1978 11.20 7.60 9.60 8.00 2.66 7.60 10.65 5.93
July 1978 11.20 7.60 10.40 8.00 2.66 7.60 10.65 5.93
Oct 1978 11.20 7.60 10.40 8.00 2.66 7.60 10.65 5.93
Jan 1979 11.60 8.00 11.00 8.40 2.66 7.60 11.25 6.24
April 1979 11.60 8.00 11.00 8.40 2.66 7.60 11.25 6.24
July 1979 11.60 8.00 11.00 8.40 2.66 7.60 11.25 6.24
Oct 1979 11.60 8.00 11.00 8.40 2.66 7.60 11.25 6.24
Jan 1980 11.60 8.00 11.60 8.40 2.66 7.60 18.75 24.96
April 1980 11.60 8.00 11.60 8.40 2.66 7.60 18.75 24.96
July 1980 12.40 8.60 12.40 9.00 2.81 8.00 9.00 11.04
Oct 1980 12.40 8.60 12.40 9.00 2.81 8.00 9.00 11.04
Jan 1981 -------> 9.00 13.20 9.60 2.94 8.40 9.50 11.64
April 1981 9.00 13.20 9.60 2.94 8.40 9.50 11.64
July 1981 9.00 13.20 9.60 9.00 8.40 9.50 11.64
Oct 1981 9.00 13.20 9.60 9.00 8.40 9.50 11.64
Jan 1982 10.08 10.32 10.32 10.08 9.60 10.90 13.08
April 1982 10.08 10.32 10.32 10.08 9.60 10.90 13.08
July 1982 10.68 10.92 10.92 10.68 10.32 11.70 13.92
Oct 1982 10.68 10.92 10.92 10.68 10.32 11.70 13.92
Jan 1983 11.64 12.48 12.00 11.88 10.38 13.60 16.02
April 1983 11.64 12.48 12.00 11.88 10.38 13.60 16.02
July 1983 11.64 12.48 12.00 11.88 10.38 13.60 16.02
Oct 1983 11.64 12.48 12.00 11.88 10.38 13.60 16.02
Jan 1984 12.30 13.20 12.72 12.60 10.98 15.90 15.90
April 1984 12.30 13.20 12.72 12.60 10.98 15.90 15.90
July 1984 12.30 13.20 12.72 12.60 10.98 15.90 15.90
Oct 1984 12.30 13.20 12.72 12.60 10.98 15.90 15.90
AMALGAMATION AMALGAMATION
EASTERN CAPE NORTHERN & WESTERN CAPE
UNDERTAKING UNDERTAKING
Jan 1985 12.64 13.28 12.12 17.40 17.60
April 1985 12.64 13.28 12.12 17.40 17.60
July 1985 12.64 13.28 12.12 17.40 17.60
Sept 1985 13.90 14.61 13.33 19.14 19.36
Oct 1985 13.90 14.61 13.33 19.14 19.36

TABLE 13 - TARIFF B : EFFECTIVE DEMAND RATES (AFTER APPLICATION OF THE SURCHARGE/DISCOUNT)
UNDERTAKING CAPE BORDER ORANGE CAPE CAPE NATAL EASTERN RAND & OFS
EASTERN RIVER WESTERN NORTHERN TVL
DATE R/AMP R/AMP R/AMP R/AMP R/AMP R/AMP R/AMP R/kW
January 1973 0.220 0.210 0.263 0.286 0.255 0.158 0.131 0.050
April 1973 0.235 0.235 0.281 0.306 0.278 0.169 0.141 0.050
July 1973 0.235 0.235 0.281 0.306 0.278 0.169 0.141 0.050
October 1973 0.235 0.235 0.281 0.306 0.278 0.169 0.141 0.050
January 1974 0.235 0.235 0.281 0.306 0.278 0.169 0.141 0.050
April 1974 0.240 0.235 0.300 0.306 0.278 0.173 0.150 ---------------------
July 1974 0.240 0.235 0.300 0.306 0.278 0.173 ----------------
October 1974 0.240 0.235 0.300 0.306 0.278 0.173
January 1975 0.240 0.235 0.300 0.306 0.278 0.173
April 1975 0.280 0.260 0.350 0.319 0.323 0.188
July 1975 0.280 0.260 0.350 0.319 0.323 0.188
October 1975 0.280 0.260 0.350 0.319 0.323 0.188
January 1976 0.280 0.260 0.350 0.319 0.323 0.188
April 1976 0.320 0.300 0.400 0.364 0.368 0.214
July 1976 0.320 0.300 0.400 0.364 0.368 0.214
Sept 1976 0.195 0.150 0.188 0.195 0.420 0.113
October 1976 0.195 0.150 0.188 0.195 0.420 0.113
January 1977 ---------------- ---------------- ---------------- ---------------- 0.525 ----------------
April 1977 0.525
July 1977 0.525
October 1977 0.525
January 1978 0.638
April 1978 0.638
July 1978 0.638
October 1978 0.638
January 1979 0.638
April 1979 0.638
July 1979 0.638
October 1979 0.638
January 1980 0.638
April 1980 0.638
July 1980 0.675
October 1980 0.675
January 1981 0.705
April 1981 0.705
July 1981 DISCONTINUED DEMAND CHARGES FOR ALL UNDERTAKINGS

TABLE 14 - TARIFF B : EFFECTIVE ENERGY RATES IN c/kW.h (AFTER APPLICATION OF THE SURCHARGE/DISCOUNT)
ONCE INTRODUCED, THE HIGH ENERGY RATE WAS APPLIED TO THE FIRST 500 kW.h CONSUMPTION
DATE CAPE EASTERN BORDER ORANGE RIVER CAPE WESTERN CAPE NORTHERN NATAL EASTERN TVL RAND & OFS
Undertaking Undertaking Undertaking Undertaking Undertaking Undertaking Undertaking Undertaking
Jan 1973 0.990 0.882 0.788 1.034 0.706 0.798 0.704 0.235
April 1973 1.058 0.987 0.844 1.105 0.768 0.855 0.754 0.235
July 1973 1.058 0.987 0.844 1.105 0.768 0.855 0.754 0.235
Oct 1973 1.058 0.987 0.844 1.105 0.768 0.855 0.754 0.235
Jan 1974 1.058 1.199 0.844 1.105 0.768 0.855 0.754 0.235
April 1974 1.080 1.199 0.900 1.105 0.768 0.874 0.804 1.566
July 1974 1.080 1.199 0.900 1.105 0.768 0.874 1.530 0.765 1.566
Oct 1974 1.080 1.199 0.900 1.105 0.768 0.874 1.530 0.765 1.566
Jan 1975 1.080 1.199 0.900 1.105 0.768 0.874 1.530 0.765 1.566
April 1975 1.260 1.326 1.050 1.152 0.892 0.950 1.665 0.833 1.836
July 1975 1.260 1.326 1.050 1.152 0.892 0.950 1.665 0.833 1.836
Oct 1975 1.260 1.326 1.050 1.152 0.892 0.950 1.665 0.833 1.836
Jan 1976 1.596 1.508 1.218 1.274 1.021 1.075 1.665 0.944 1.836
April 1976 1.824 1.770 1.440 1.512 1.201 1.254 1.890 1.103 2.115
July 1976 1.824 1.800 1.440 1.512 1.201 1.254 1.890 1.103 2.115
Sept 1976 5.236 2.603 4.028 2.003 4.028 2.003 4.028 2.003 1.372 3.203 1.590 2.160 1.260 2.385
Oct 1976 5.265 2.633 4.050 2.025 4.050 2.025 4.050 2.025 1.414 3.225 1.613 2.160 1.296 2.385
Jan 1977 6.615 3.308 5.130 2.565 5.130 2.565 5.130 2.565 1.768 4.085 2.043 2.655 1.593 2.970
April 1977 6.627 3.320 5.140 2.575 5.140 2.575 5.140 2.575 1.803 4.095 2.052 2.655 1.623 2.970
July 1977 6.640 3.332 5.149 2.584 5.149 2.584 5.149 2.584 1.820 4.104 2.062 2.655 1.637 2.970
Oct 1977 6.652 3.344 5.159 2.594 5.159 2.594 5.159 2.594 1.838 4.114 2.071 2.655 1.652 2.970
Jan 1978 7.602 3.822 5.159 2.594 6.516 3.276 5.430 2.730 2.231 4.114 2.071 3.195 1.988 3.555
April 1978 7.630 3.850 5.178 2.613 6.540 3.300 5.450 2.750 2.274 4.133 2.090 3.195 2.024 3.555
July 1978 7.616 3.836 5.168 2.603 7.072 3.562 5.440 2.740 2.253 4.123 2.081 3.195 2.006 3.555
Oct 1978 7.630 3.850 5.178 2.613 7.085 3.575 5.450 2.750 2.274 4.133 2.090 3.195 2.024 3.555
Jan 1979 7.917 4.002 5.460 2.760 7.508 3.795 5.733 2.898 2.274 4.142 2.100 3.375 2.138 3.744
April 1979 7.932 4.017 5.470 2.770 7.521 3.809 5.744 2.909 2.295 4.152 2.109 3.375 2.156 5.824
July 1979 7.932 4.017 5.470 2.770 7.521 3.809 5.744 2.909 2.316 4.152 2.109 3.375 2.175 3.744
Oct 1979 7.961 4.046 5.490 2.790 7.549 3.836 5.765 2.930 2.338 4.171 2.128 3.375 2.194 3.744
Jan 1980 7.975 4.060 5.500 2.800 7.975 4.060 5.775 2.940 2.359 4.180 2.138 3.375 2.213 3.744
April 1980 7.975 4.060 5.500 2.800 7.975 4.060 5.775 2.940 2.359 4.180 2.138 3.375 2.213 3.744
July 1980 8.556 4.371 5.934 3.032 8.556 4.371 6.210 3.173 2.565 4.420 2.270 4.365 2.565 4.830
Oct 1980 8.587 4.402 5.956 3.053 8.587 4.402 6.233 3.195 2.588 4.440 2.290 4.383 2.583 4.848
Jan 1981 ---------------- ------> 6.255 3.218 9.174 4.719 6.672 3.432 2.750 4.683 2.426 4.636 2.736 5.122
April 1981 6.278 3.240 9.207 4.752 6.696 3.456 2.797 4.704 2.447 4.655 2.755 5.141
July 1981 6.289 3.251 9.224 4.769 6.708 3.468 5.265 3.240 4.715 2.457 4.674 2.774 5.160
Oct 1981 6.323 3.285 9.273 4.818 6.744 3.504 5.295 3.270 4.746 2.489 4.703 2.803 5.190
Jan 1982 7.375 4.603 7.379 4.541 6.648 3.810 5.989 3.721 5.484 2.904 5.417 3.237 5.853
April 1982 7.442 4.670 7.448 4.610 6.717 3.879 6.056 3.788 5.556 2.976 5.494 3.314 5.930
July 1982 7.885 4.948 7.872 4.869 7.098 4.095 6.417 4.014 5.960 3.186 5.885 3.545 6.299
Oct 1982 7.877 4.940 7.862 4.859 7.089 4.086 6.408 4.005 5.947 3.173 5.873 3.533 6.287
Jan 1983 8.565 5.364 8.965 5.533 7.780 4.480 7.108 4.435 6.773 3.918 6.800 4.080 7.209
April 1983 8.555 5.354 8.954 5.522 7.770 4.470 7.098 4.425 6.764 3.910 6.800 4.080 7.209
July 1983 8.643 5.442 9.048 5.616 7.860 4.560 7.187 4.514 6.859 4.005 6.882 4.162 7.289
Oct 1983 8.643 5.442 9.048 5.616 7.860 4.560 7.187 4.514 6.827 4.005 6.882 4.162 7.289
Jan 1984 9.123 5.740 9.559 5.929 8.321 4.823 7.613 4.778 7.256 4.236 7.664 4.365 7.664
April 1984 9.102 5.720 9.537 5.907 8.300 4.802 7.592 4.757 7.238 4.218 7.640 4.341 7.640
July 1984 9.092 5.709 9.526 5.896 8.289 4.791 7.581 4.746 7.238 4.218 7.640 4.341 7.640
Oct 1984 9.102 5.720 9.537 5.907 8.300 4.802 7.592 4.757 7.238 4.218 7.640 4.341 7.640
AMALGAMATION AMALGAMATION
EASTERN CAPE NORTHERN & WESTERN CAPE
UNDERTAKING UNDERTAKING
Jan 1985 9.464 6.186 8.889 5.445 8.030 4.697 8.413 4.802 8.518
April 1985 9.448 6.170 8.864 5.420 8.009 4.676 8.396 4.785 8.492
July 1985 9.488 6.209 8.906 5.461 8.050 4.717 8.439 4.829 8.536
Sept 1985 10.437 6.830 9.796 6.008 8.855 5.188 9.283 5.311 9.390
Oct 1985 10.437 6.830 9.806 6.017 8.832 5.166 9.283 5.311 9.399

TABLE 15 - TARIFF C:BASIC CHARGE IN RANDS NOTIFIED IN THE SCHEDULE OF STANDARD PRICES
(BEFORE APPLICATION OF THE SURCHARGE/DISCOUNT) (ALTERNATIVE (A) - FLAT RATE TARIFF (SEE NOTES))
UNDERTAKING CAPE BORDER ORANGE CAPE CAPE NATAL EASTERN RAND & OFS
EASTERN RIVER WESTERN NORTHERN TVL
DATE
Jan 1973 0.55 0.55 1.00 0.47 0.55 0.45 0.50 0.00
April 1973 0.55 0.55 1.00 0.47 0.55 0.45 0.50 0.00
July 1973 0.55 0.55 1.00 0.47 0.55 0.45 0.50 0.00
Oct 1973 0.55 0.55 1.00 0.47 0.55 0.45 0.50 0.00
Jan 1974 0.55 0.55 1.00 0.47 0.55 0.45 0.50 0.00
April 1974 0.55 0.55 1.00 0.47 0.55 0.45 0.50 3.00
July 1974 0.55 0.55 1.00 0.47 0.55 0.45 3.00 3.00
Oct 1974 0.55 0.55 1.00 0.47 0.55 0.45 3.00 3.00
Jan 1975 0.55 0.55 1.00 0.47 0.55 0.45 3.00 3.00
April 1975 0.55 0.55 1.00 0.47 0.55 0.45 3.00 3.00
July 1975 0.55 0.55 1.00 0.47 0.55 0.45 3.00 3.00
Oct 1975 0.55 0.55 1.00 0.47 0.55 0.45 3.00 3.00
Jan 1976 0.55 0.55 1.00 0.47 0.55 0.45 3.00 3.00
April 1976 0.55 0.55 1.00 0.47 0.55 0.45 3.00 3.00
July 1976 0.55 0.55 1.00 0.47 0.55 0.45 3.00 3.00
Sept 1976 4.00 4.00 4.00 2.65 0.55 4.00 3.00 3.00
Oct 1976 4.00 4.00 4.00 2.65 0.55 4.00 3.00 3.00
Jan 1977 4.00 4.00 4.00 2.65 0.55 4.00 3.00 3.00
April 1977 4.00 4.00 4.00 2.65 0.55 4.00 3.00 3.00
July 1977 4.00 4.00 4.00 2.65 0.55 4.00 3.00 3.00
Oct 1977 4.00 4.00 4.00 2.65 0.55 4.00 3.00 3.00
Jan 1978 4.00 4.00 4.00 2.65 0.55 4.00 3.00 3.00
April 1978 4.00 4.00 4.00 2.65 0.55 4.00 3.00 3.00
July 1978 4.00 4.00 4.00 2.65 0.55 4.00 3.00 3.00
Oct 1978 4.00 4.00 4.00 2.65 0.55 4.00 3.00 3.00
Jan 1979 4.00 4.00 4.00 2.65 0.55 4.00 3.00 3.00
April 1979 4.00 4.00 4.00 2.65 0.55 4.00 3.00 3.00
July 1979 4.00 4.00 4.00 2.65 0.55 4.00 3.00 3.00
Oct 1979 4.00 4.00 4.00 2.65 0.55 4.00 3.00 3.00
Jan 1980 4.00 4.00 4.00 2.65 0.55 4.00 5.00 6.00
April 1980 4.00 4.00 4.00 2.65 0.55 4.00 5.00 6.00
July 1980 4.00 4.00 4.00 2.65 0.55 4.00 5.00 6.00
Oct 1980 4.00 4.00 4.00 2.65 0.55 4.00 5.00 6.00
Jan 1981 --------> 4.00 4.00 2.65 0.55 4.00 5.00 6.00
April 1981 4.00 4.00 2.65 0.55 4.00 5.00 6.00
July 1981 4.00 4.00 2.65 6.00 4.00 5.00 6.00
Oct 1981 4.00 4.00 2.65 6.00 4.00 5.00 6.00
Jan 1982 6.00 6.00 4.00 6.00 4.00 5.00 6.00
April 1982 6.00 6.00 4.00 6.00 4.00 5.00 6.00
July 1982 6.00 6.00 4.00 6.00 4.00 5.00 6.00
Oct 1982 6.00 6.00 4.00 6.00 4.00 5.00 6.00
Jan 1983 6.00 6.00 4.00 6.00 6.00 5.00 6.00
April 1983 6.00 6.00 4.00 6.00 6.00 5.00 6.00
July 1983 6.00 6.00 4.00 6.00 6.00 5.00 6.00
Oct 1983 6.00 6.00 4.00 6.00 6.00 5.00 6.00
Jan 1984 6.00 6.00 4.00 6.00 6.00 10.00 10.00
April 1984 6.00 6.00 4.00 6.00 6.00 10.00 10.00
July 1984 6.00 6.00 4.00 6.00 6.00 10.00 10.00
Oct 1984 6.00 6.00 4.00 6.00 6.00 10.00 10.00
AMALGAMATION AMALGAMATION
EASTERN CAPE NORTHERN AND WESTERN CAPE
UNDERTAKING UNDERTAKING
Jan 1985 8.00 6.00 6.00 10.00 10.00
April 1985 8.00 6.00 6.00 10.00 10.00
July 1985 8.00 6.00 6.00 10.00 10.00
Sept 1985 8.00 6.00 6.00 10.00 10.00
Oct 1985 8.00 6.00 6.00 10.00 10.00

TABLE 16 - TARIFF C : ENERGY RATES IN c/kW.h NOTIFIED IN THE SCHEDULE OF STANDARD PRICES TAKING INTO ACCOUNT
THE QUARTERLY COST ADJUSTMENT (ONCE INTRODUCED THE HIGH ENERGY RATE WAS APPLIED
TO THE FIRST 300 kW.h OF CONSUMPTION
UNDERTAKING CAPE BORDER ORANGE CAPE CAPE NATAL EASTERN RAND & OFS
COAL COST
QUARTER (c/ton)
Jan 1973 N/A 7.50 7.50 8.00 5.00 10.00 7.00 3.54 5.00 0.68
April 1973 N/A 7.50 7.50 8.00 5.00 10.00 7.00 3.54 5.00 0.68
July 1973 N/A 7.50 7.50 8.00 5.00 10.00 7.00 3.54 5.00 0.68
Oct 1973 N/A 7.50 7.50 8.00 5.00 10.00 7.00 3.54 5.00 0.68
Jan 1974 N/A 7.50 7.50 8.00 5.00 10.00 7.00 3.54 5.00 0.68
April 1974 N/A 7.50 7.50 8.00 5.00 10.00 7.00 3.54 1.80 0.90
July 1974 N/A 7.50 7.50 8.00 5.00 10.00 7.00 0.80 0.90 1.80 0.90
Oct 1974 N/A 7.50 7.50 8.00 5.00 10.00 7.00 0.80 0.90 1.80 0.90
Jan 1975 N/A 7.50 7.50 8.00 5.00 10.00 7.00 1.80 0.90 1.80 0.90
April 1975 N/A 7.50 7.50 8.00 5.00 10.00 7.00 1.80 0.90 1.80 0.90
July 1975 N/A 7.50 7.50 8.00 5.00 10.00 7.00 1.80 0.90 1.80 0.90
Oct 1975 N/A 7.50 7.50 8.00 5.00 10.00 7.00 1.80 0.90 1.80 0.90
Jan 1976 N/A 7.50 7.50 8.00 5.00 10.00 7.00 1.80 1.02 1.80 1.02
April 1976 N/A 7.50 7.50 8.00 5.00 10.00 7.00 1.80 1.05 1.80 1.05
July 1976 N/A 7.50 7.50 8.00 5.00 10.00 7.00 1.80 1.05 1.80 1.05
Sept 1976 N/A 5.37 2.67 5.37 2.67 5.37 2.67 4.62 2.67 10.00 4.27 2.12 1.80 1.05 1.80 1.05
Oct 1976 N/A 5.40 2.70 5.40 2.70 5.40 2.70 4.65 2.70 10.00 4.30 2.15 1.80 1.08 1.80 1.08
Jan 1977 N/A 5.40 2.70 5.40 2.70 5.40 2.70 4.65 2.70 10.00 4.30 2.15 1.80 1.08 1.80 1.08
April 1977 N/A 5.41 2.71 5.41 2.71 5.41 2.71 4.66 2.71 10.00 4.31 2.16 1.80 1.10 1.80 1.10
July 1977 N/A 5.42 2.72 5.42 2.72 5.42 2.72 4.67 2.72 10.00 4.32 2.17 1.80 1.11 1.80 1.11
Oct 1977 N/A 5.43 2.73 5.43 2.73 5.43 2.73 4.68 2.73 10.00 4.33 2.18 1.80 1.12 1.80 1.12
Jan 1978 N/A 5.43 2.73 5.43 2.73 5.43 2.73 4.68 2.73 10.00 4.33 2.18 1.80 1.12 1.80 1.12
April 1978 N/A 5.45 2.75 5.45 2.75 5.45 2.75 4.70 2.75 10.00 4.35 2.20 1.80 1.14 1.80 1.14
July 1978 N/A 5.44 2.74 5.44 2.74 5.44 2.74 4.69 2.74 10.00 4.34 2.19 1.80 1.13 1.80 1.13
Oct 1978 N/A 5.45 2.75 5.45 2.75 5.45 2.75 4.70 2.75 10.00 4.35 2.20 1.80 1.14 1.80 1.14
Jan 1979 608 5.46 2.76 5.46 2.76 5.46 2.76 4.71 2.76 10.00 4.36 2.21 1.80 1.14 1.80 1.14
April 1979 629 5.47 2.77 5.47 2.77 5.47 2.77 4.72 2.77 10.00 4.37 2.22 1.80 1.15 2.80 1.15
July 1979 639 5.47 2.77 5.47 2.77 5.47 2.77 4.72 2.77 10.00 4.37 2.22 1.80 1.16 1.80 1.16
Oct 1979 661 5.49 2.79 5.49 2.79 5.49 2.79 4.74 2.79 10.00 4.39 2.24 1.80 1.17 1.80 1.17
Jan 1980 677 5.50 2.80 5.50 2.80 5.50 2.80 4.75 2.80 10.00 4.40 2.25 1.80 1.18 1.80 1.18
April 1980 681 5.50 2.80 5.50 2.80 5.50 2.80 4.75 2.80 10.00 4.40 2.25 1.80 1.18 1.80 1.18
July 1980 727 5.52 2.82 5.52 2.82 5.52 2.82 4.77 2.82 10.00 4.42 2.27 4.85 2.85 5.25 2.85
Oct 1980 749 5.54 2.84 5.54 2.84 5.54 2.84 4.79 2.84 10.00 4.44 2.29 4.87 2.87 5.27 2.87
Jan 1981 787 ----------- -----> 5.56 2.86 5.56 2.86 4.81 2.86 10.00 4.46 2.31 4.88 2.88 5.28 2.88
April 1981 815 5.58 2.88 5.58 2.88 4.83 2.88 10.00 4.48 2.33 4.90 2.90 5.30 2.90
July 1981 847 5.59 2.89 5.59 2.89 4.84 2.89 7.02 4.32 4.49 2.34 4.92 2.92 5.32 2.92
Oct 1981 894 5.62 2.92 5.62 2.92 4.87 2.92 7.06 4.36 4.52 2.37 4.95 2.95 5.35 2.95
Jan 1982 1056 8.78 5.48 8.58 5.28 7.23 4.43 7.13 4.43 4.57 2.42 4.97 2.97 5.37 2.97
April 1982 1190 8.86 5.56 8.66 5.36 7.31 4.51 7.21 4.51 4.63 2.48 5.04 3.04 5.44 3.04
July 1982 1175 8.86 5.56 8.65 5.35 7.30 4.50 7.21 4.51 4.62 2.47 5.03 3.03 5.43 3.03
Oct 1982 1170 8.85 5.55 8.64 5.34 7.29 4.49 7.20 4.50 4.61 2.46 5.02 3.02 5.42 3.02
Jan 1983 1150 8.83 5.53 8.62 5.32 7.28 4.48 7.18 4.48 7.83 4.53 5.00 3.00 5.40 3.00
April 1983 1130 8.82 5.52 8.61 5.31 7.27 4.47 7.17 4.47 7.82 4.52 5.00 3.00 5.40 3.00
July 1983 1280 8.91 5.61 8.70 5.40 7.36 4.56 7.26 4.56 7.93 4.63 5.06 3.06 5.46 3.06
Oct 1983 1280 8.91 5.61 8.70 5.40 7.36 4.56 7.26 4.56 7.89 4.63 5.06 3.06 5.46 3.06
Jan 1984 1293 8.90 5.60 8.69 5.39 7.35 4.55 7.25 4.55 7.93 4.63 9.64 5.49 9.64 5.49
April 1984 1249 8.88 5.58 8.67 5.37 7.33 4.53 7.23 4.53 7.91 4.61 9.61 5.46 9.61 5.46
July 1984 1244 8.87 5.57 8.66 5.36 7.32 4.52 7.22 4.52 7.91 4.61 9.61 5.46 9.61 5.46
Oct 1984 1250 8.88 5.58 8.67 5.37 7.33 4.53 7.23 4.53 7.91 4.61 9.61 5.46 9.61 5.46
AMALGAMATION AMALGAMATION
EASTERN CAPE NORTHERN & WESTERN CAPE
UNDERTAKING UNDERTAKING
Jan 1985 1301 11.98 7.83 10.71 6.56 7.95 4.65 9.67 5.52 9.68 5.53
April 1985 1273 11.96 7.81 10.68 6.53 7.93 4.63 9.65 5.50 9.65 5.50
July 1985 1341 12.01 7.86 10.73 6.58 7.97 4.67 9.70 5.55 9.70 5.55
Sept 1985 1341 12.01 7.86 10.73 6.58 7.97 4.67 9.70 5.55 9.70 5.55
Oct 1985 1307 12.01 7.86 10.74 6.59 7.95 4.65 9.70 5.55 9.71 5.56

TABLE 17 - TARIFF C : EFFECTIVE BASIC CHARGE IN RANDS (AFTER APPLICATION OF THE SURCHARGE/DISCOUNT)
UNDERTAKING CAPE BORDER ORANGE CAPE CAPE NATAL EASTERN RAND
EASTERN RIVER WESTERN NORTHERN TVL & OFS
DATE
Jan 1973 0.61 0.58 1.05 0.52 0.47 0.47 0.53 0.00
April 1973 0.65 0.65 1.13 0.55 0.51 0.51 0.56 0.00
July 1973 0.65 0.65 1.13 0.55 0.51 0.51 0.56 0.00
Oct 1973 0.65 0.65 1.13 0.55 0.51 0.51 0.56 0.00
Jan 1974 0.65 0.65 1.13 0.55 0.51 0.51 0.56 0.00
April 1974 0.66 0.65 1.20 0.55 0.51 0.52 0.60 2.61
July 1974 0.66 0.65 1.20 0.55 0.51 0.52 2.55 2.61
Oct 1974 0.66 0.65 1.20 0.55 0.51 0.52 2.55 2.61
Jan 1975 0.66 0.65 1.20 0.55 0.51 0.52 2.55 2.61
April 1975 0.77 0.72 1.40 0.58 0.59 0.56 2.78 3.06
July 1975 0.77 0.72 1.40 0.58 0.59 0.56 2.78 3.06
Oct 1975 0.77 0.72 1.40 0.58 0.59 0.56 2.78 3.06
Jan 1976 0.77 0.72 1.40 0.58 0.59 0.56 2.78 3.06
April 1976 0.88 0.83 1.60 0.66 0.67 0.64 3.15 3.53
July 1976 0.88 0.83 1.60 0.66 0.67 0.64 3.15 3.53
Sept 1976 3.90 3.00 3.00 1.99 0.77 3.00 3.60 3.98
Oct 1976 3.90 3.00 3.00 1.99 0.77 3.00 3.60 3.98
Jan 1977 4.90 3.80 3.80 2.52 0.96 3.80 4.43 4.95
April 1977 4.90 3.80 3.80 2.52 0.96 3.80 4.43 4.95
July 1977 4.90 3.80 3.80 2.52 0.96 3.80 4.43 4.95
Oct 1977 4.90 3.80 3.80 2.52 0.96 3.80 4.43 4.95
Jan 1978 5.60 3.80 4.80 2.65 1.17 3.80 5.33 5.93
April 1978 5.60 3.80 4.80 2.65 1.17 3.80 5.33 5.93
July 1978 5.60 3.80 5.20 2.65 1.17 3.80 5.33 5.93
Oct 1978 5.60 3.80 5.20 2.65 1.17 3.80 5.33 5.93
Jan 1979 5.80 4.00 5.50 2.78 1.17 3.80 5.63 6.24
April 1979 5.80 4.00 5.50 2.78 1.17 3.80 5.63 6.24
July 1979 5.80 4.00 5.50 2.78 1.17 3.80 5.63 6.24
Oct 1979 5.80 4.00 5.50 2.78 1.17 3.80 5.63 6.24
Jan 1980 5.80 4.00 5.80 2.78 1.17 3.80 9.38 12.48
April 1980 5.80 4.00 5.80 2.78 1.17 3.80 9.38 12.48
July 1980 6.20 4.30 6.20 2.98 1.24 4.00 4.50 5.52
Oct 1980 6.20 4.30 6.20 2.98 1.24 4.00 4.50 5.52
Jan 1981 --------> 4.50 6.60 3.18 1.29 4.20 4.75 5.82
April 1981 4.50 6.60 3.18 1.29 4.20 4.75 5.82
July 1981 4.50 6.60 3.18 4.50 4.20 4.75 5.82
Oct 1981 4.50 6.60 3.18 4.50 4.20 4.75 5.82
Jan 1982 5.04 5.16 3.44 5.04 4.80 5.45 6.54
April 1982 5.04 5.16 3.44 5.04 4.80 5.45 6.54
July 1982 5.34 5.46 3.64 5.34 5.16 5.85 6.96
Oct 1982 5.34 5.46 3.64 5.34 5.16 5.85 6.96
Jan 1983 5.82 6.24 4.00 5.94 5.19 6.80 8.01
April 1983 5.82 6.24 4.00 5.94 5.19 6.80 8.01
July 1983 5.82 6.24 4.00 5.94 5.19 6.80 8.01
Oct 1983 5.82 6.24 4.00 5.94 5.19 6.80 8.01
Jan 1984 6.15 6.60 4.24 6.30 5.49 7.95 7.95
April 1984 6.15 6.60 4.24 6.30 5.49 7.95 7.95
July 1984 6.15 6.60 4.24 6.30 5.49 7.95 7.95
Oct 1984 6.15 6.60 4.24 6.30 5.49 7.95 7.95
AMALGAMATION AMALGAMATION
EASTERN CAPE NORTHERN & WESTERN CAPE
UNDERTAKING UNDERTAKING
Jan 1985 6.32 4.98 6.06 8.70 8.80
April 1985 6.32 4.98 6.06 8.70 8.80
July 1985 6.32 4.98 6.06 8.70 8.80
Sept 1985 6.95 5.48 6.67 9.57 9.68
Oct 1985 6.95 5.48 6.67 9.57 9.68

TABLE 18 - TARIFF C : EFFECTIVE ENERGY RATES IN c/kW.h (AFTER APPLICATION OF THE SURCHARGE/DISCOUNT)
UNDERTAKING CAPE BORDER ORANGE CAPE CAPE NATAL EASTERN RAND
EASTERN RIVER WESTERN NORTHERN TVL & OFS
DATE
Jan 1973 8.250 7.875 8.400 5.500 8.500 7.350 3.717 5.625
April 1973 8.813 8.813 9.000 5.875 9.250 7.875 3.983 6.000
July 1973 8.813 8.813 9.000 5.875 9.250 7.875 3.983 6.000
Oct 1973 8.813 8.813 9.000 5.875 9.250 7.875 3.983 6.000
Jan 1974 8.813 8.813 9.000 5.875 9.250 7.875 3.983 6.000
April 1974 9.000 8.813 9.600 5.875 9.250 8.050 4.248 1.566
July 1974 9.000 8.813 9.600 5.875 9.250 8.050 0.680 0.765 1.566
Oct 1974 9.000 8.813 9.600 5.875 9.250 8.050 0.680 0.765 1.566
Jan 1975 9.000 8.813 9.600 5.875 9.250 8.050 1.530 0.765 1.566
April 1975 10.500 9.750 11.200 6.125 10.750 8.750 1.665 0.833 1.836
July 1975 10.500 9.750 11.200 6.125 10.750 8.750 1.665 0.833 1.836
Oct 1975 10.500 9.750 11.200 6.125 10.750 8.750 1.665 0.833 1.836
Jan 1976 10.500 9.750 11.200 6.125 10.750 8.750 1.665 0.944 1.836
April 1976 12.000 11.250 12.800 7.000 12.250 9.975 1.890 1.103 2.115
July 1976 12.000 11.250 12.800 7.000 12.250 9.975 1.890 1.103 2.115
Sept 1976 5.236 2.603 4.028 2.003 4.028 2.003 3.465 2.003 14.000 3.203 1.590 2.160 1.260 2.385
Oct 1976 5.265 2.633 4.050 2.025 4.050 2.025 3.488 2.025 14.000 3.225 1.613 2.160 1.296 2.385
Jan 1977 6.615 3.308 5.130 2.565 5.130 2.565 4.418 2.565 17.500 4.085 2.043 2.655 1.593 2.970
April 1977 6.627 3.320 5.140 2.575 5.140 2.575 4.427 2.575 17.500 4.095 2.052 2.655 1.623 2.970
July 1977 6.640 3.332 5.149 2.584 5.149 2.584 4.437 2.584 17.500 4.104 2.062 2.655 1.637 2.970
Oct 1977 6.652 3.344 5.159 2.594 5.159 2.594 4.446 2.594 17.500 4.114 2.071 2.655 1.652 2.970
Jan 1978 7.602 3.822 5.159 2.594 6.516 3.276 4.680 2.730 21.250 4.114 2.071 3.195 1.988 3.555
April 1978 7.630 3.850 5.178 2.613 6.540 3.300 4.700 2.750 21.250 4.133 2.090 3.195 2.024 3.555
July 1978 7.616 3.836 5.168 2.603 7.072 3.562 4.690 2.740 21.250 4.123 2.081 3.195 2.006 3.555
Oct 1978 7.630 3.850 5.178 2.613 7.085 3.575 4.700 2.750 21.250 4.133 2.090 3.195 2.024 3.555
Jan 1979 7.917 4.002 5.460 2.760 7.508 3.795 4.946 2.898 21.250 4.142 2.100 3.375 2.138 3.744
April 1979 7.932 4.017 5.470 2.770 7.521 3.809 4.956 2.909 21.250 4.152 2.109 3.375 2.156 5.824
July 1979 7.932 4.017 5.470 2.770 7.521 3.809 4.956 2.909 21.250 4.152 2.109 3.375 2.175 3.744
Oct 1979 7.961 4.046 5.490 2.790 7.549 3.836 4.977 2.930 21.250 4.171 2.128 3.375 2.194 3.744
Jan 1980 7.975 4.060 5.500 2.800 7.975 4.060 4.988 2.940 21.250 4.180 2.138 3.375 2.213 3.744
April 1980 7.975 4.060 5.500 2.800 7.975 4.060 4.988 2.940 21.250 4.180 2.138 3.375 2.213 3.744
July 1980 8.556 4.371 5.934 3.032 8.556 4.371 5.366 3.173 22.500 4.420 2.270 4.365 2.565 4.830
Oct 1980 8.587 4.402 5.956 3.053 8.587 4.402 5.389 3.195 22.500 4.440 2.290 4.383 2.583 4.848
Jan 1981 ------------ --------> 6.255 3.218 9.174 4.719 5.772 3.432 23.500 4.683 2.426 4.636 2.736 5.122
April 1981 6.278 3.240 9.207 4.752 5.796 3.456 23.500 4.704 2.447 4.655 2.755 5.141
July 1981 6.289 3.251 9.224 4.769 5.808 3.468 5.265 3.240 4.715 2.457 4.674 2.774 5.160
Oct 1981 6.323 3.285 9.273 4.818 5.844 3.504 5.295 3.270 4.746 2.489 4.703 2.803 5.190
Jan 1982 7.375 4.603 7.379 4.541 6.218 3.810 5.989 3.721 5.484 2.904 5.417 3.237 5.853
April 1982 7.442 4.670 7.448 4.610 6.287 3.879 6.056 3.788 5.556 2.976 5.494 3.314 5.930
July 1982 7.885 4.948 7.872 4.869 6.643 4.095 6.417 4.014 5.960 3.186 5.885 3.545 6.299
Oct 1982 7.877 4.940 7.862 4.859 6.634 4.086 6.408 4.005 5.947 3.173 5.873 3.533 6.287
Jan 1983 8.565 5.364 8.965 5.533 7.280 4.480 7.108 4.435 6.773 3.918 6.800 4.080 7.209
April 1983 8.555 5.354 8.954 5.522 7.270 4.470 7.098 4.425 6.764 3.910 6.800 4.080 7.209
July 1983 8.643 5.442 9.048 5.616 7.360 4.560 7.187 4.514 6.859 4.005 6.882 4.162 7.289
Oct 1983 8.643 5.442 9.048 5.616 7.360 4.560 7.187 4.514 6.827 4.005 6.882 4.162 7.289
Jan 1984 9.123 5.740 9.559 5.929 7.791 4.823 7.613 4.778 7.256 4.236 7.664 4.365 7.664
April 1984 9.102 5.720 9.537 5.907 7.770 4.802 7.592 4.757 7.238 4.218 7.640 4.341 7.640
July 1984 9.092 5.709 9.526 5.896 7.759 4.791 7.581 4.746 7.238 4.218 7.640 4.341 7.640
Oct 1984 9.102 5.720 9.537 5.907 7.770 4.802 7.592 4.757 7.238 4.218 7.640 4.341 7.640
AMALGAMATION AMALGAMATION
EASTERN CAPE NORTHERN & WESTERN CAPE
UNDERTAKING UNDERTAKING
Jan 1985 9.464 6.186 8.889 5.445 8.030 4.697 8.413 4.802 8.518
April 1985 9.448 6.170 8.864 5.420 8.009 4.676 8.396 4.785 8.492
July 1985 9.488 6.209 8.906 5.461 8.050 4.717 8.439 4.829 8.536
Sept 1985 10.437 6.830 9.796 6.008 8.855 5.188 9.283 5.311 9.390
Oct 1985 10.437 6.830 9.806 6.017 8.832 5.166 9.283 5.311 9.399

ALTERNATIVE 2 - ROOM RATE TARIFF (SEE NOTES)
TABLE 19 - TARIFF C : ROOM RATE TARIFF (ALTERNATIVE (b) - SEE NOTES) NOTIFIED IN THE SCHEDULE OF STANDARD PRICES TAKING INTO ACCOUNT THE QUARTERLY COAL COST
ADJUSTMENT (BEFORE APPLICATION OF THE SURCHARGE/DISCOUNT, NOT ADJUSTED 1973 TO 1975)
UNDERTAKING CAPE BORDER ORANGE CAPE CAPE NATAL EASTERN RAND & OFS
EASTERN RIVER WESTERN NORTHERN TVL
DATE SERVICE P/ROOM ENERGY SERVICE P/ROOM ENERGY SERVICE P/ROOM ENERGY SERVICE P/ROOM ENERGY SERVICE P/ROOM ENERGY SERVICE P/ROOM ENERGY SERVICE P/ROOM ENERGY P/ROOM ENERGY DEMAND ENERGY
R R c/kW.h R R c/kW.h R R c/kW.h R R c/kW.h R R c/kW.h R R c/kW.h R R c/kW.h R c/kW.h R/kW c/kW.h
Jan 1973 0.55 0.325 0.90 0.55 0.325 0.84 1.00 0.35 0.75 0.47 0.26 0.94 0.55 0.425 0.83 0.45 0.35 0.76 0.50 0.25 0.67 0.50 0.675 0.5 0.675
April 19731973 0.55 0.325 0.90 0.55 0.325 0.84 1.00 0.35 0.75 0.47 0.26 0.94 0.55 0.425 0.83 0.45 0.35 0.76 0.50 0.25 0.67 0.50 0.675 0.5 0.675
July 19731973 0.55 0.325 0.90 0.55 0.325 0.84 1.00 0.35 0.75 0.47 0.26 0.94 0.55 0.425 0.83 0.45 0.35 0.76 0.50 0.25 0.67 0.50 0.675 0.5 0.675
April 19741974 0.55 0.325 0.90 0.55 0.325 1.02 1.00 0.35 0.75 0.47 0.26 0.94 0.55 0.425 0.83 0.45 0.35 0.76 0.50 0.25 0.67 0.50 0.675 0.5 0.675
July 19741974 0.55 0.325 0.90 0.55 0.325 1.02 1.00 0.35 0.75 0.47 0.26 0.94 0.55 0.425 0.83 0.45 0.35 0.76
Oct 1974 0.55 0.325 0.90 0.55 0.325 1.02 1.00 0.35 0.75 0.47 0.26 0.94 0.55 0.425 0.83 0.45 0.35 0.76
Jan 1975 0.55 0.325 0.90 0.55 0.325 1.02 1.00 0.35 0.75 0.47 0.26 0.94 0.55 0.425 0.83 0.45 0.35 0.76
April 19751975 0.55 0.325 0.90 0.55 0.325 1.02 1.00 0.35 0.75 0.47 0.26 0.94 0.55 0.425 0.83 0.45 0.35 0.76
July 19751975 0.55 0.325 0.90 0.55 0.325 1.02 1.00 0.35 0.75 0.47 0.26 0.94 0.55 0.425 0.83 0.45 0.35 0.76
Oct 1975 0.55 0.325 0.90 0.55 0.325 1.02 1.00 0.35 0.75 0.47 0.26 0.94 0.55 0.425 0.83 0.45 0.35 0.76
Jan 1976 0.55 0.325 1.14 0.55 0.325 1.16 1.00 0.35 0.87 0.47 0.26 1.04 0.55 0.425 0.95 0.45 0.35 0.86
April 19761976 0.55 0.325 1.14 0.55 0.325 1.18 1.00 0.35 0.90 0.47 0.26 1.08 0.55 0.425 0.98 0.45 0.35 0.88
July 19761976 0.55 0.325 1.14 0.55 0.325 1.20 1.00 0.35 0.90 0.47 0.26 1.08 0.55 0.425 0.98 0.45 0.35 0.88
Sept 19761976 0.55 0.425 0.98
Oct 1976 0.55 0.425 1.01
Jan 1977 0.55 0.425 1.01
April 19771977 0.55 0.425 1.03
July 19771977 0.55 0.425 1.04
Oct 1977 0.55 0.425 1.05
Jan 1978 0.55 0.425 1.05
April 19781978 0.55 0.425 1.07
July 19781978 0.55 0.425 1.06
Oct 1978 0.55 0.425 1.07
Jan 1979 0.55 0.425 1.07
April 19791979 0.55 0.425 1.08
July 19791979 0.55 0.425 1.09
Oct 1979 0.55 0.425 1.10
Jan 1980 0.55 0.425 1.11
April 19801980 0.55 0.425 1.11
July 19801980 0.55 0.425 1.14
Oct 1980 0.55 0.425 1.15
Jan 1981 0.55 0.425 1.17
April 1981 0.55 0.425 1.19
July 19811981

TABLE 20 - TARIFF C : EFFECTIVE ROOM RATE TARIFF (ALTERNATIVE (b) - SEE NOTES)
(AFTER APPLICATION OF THE SURCHARGE/DISCOUNT)
UNDERTAKING CAPE BORDER ORANGE CAPE CAPE NATAL EASTERN RAND & OFS
EASTERN RIVER WESTERN NORTHERN TVL
DATE SERVICE P/ROOM ENERGY SERVICE P/ROOM ENERGY SERVICE P/ROOM ENERGY SERVICE P/ROOM ENERGY SERVICE P/ROOM ENERGY SERVICE P/ROOM ENERGY SERVICE P/ROOM ENERGY P/ROOM ENERGY DEMAND ENERGY
R R c/kW.h R R c/kW.h R R c/kW.h R R c/kW.h R R c/kW.h R R c/kW.h R R c/kW.h R c/kW.h R/kW c/kW.h
Jan 1973 0.61 0.358 0.9900 0.58 0.341 0.8820 1.05 0.368 0.7875 0.52 0.286 1.0340 0.47 0.361 0.7055 0.47 0.368 0.7980 0.53 0.263 0.7035 0.56 0.76 0.56 0.76
April 19731973 0.65 0.382 1.0575 0.65 0.382 0.9870 1.13 0.350 0.8438 0.55 0.306 1.1045 0.51 0.393 0.7678 0.51 0.394 0.8550 0.56 0.281 0.7538 0.60 0.81 0.60 0.81
July 19731973 0.65 0.382 1.0575 0.65 0.382 0.9870 1.13 0.350 0.8438 0.55 0.306 1.1045 0.51 0.393 0.7678 0.51 0.394 0.8550 0.56 0.281 0.7538 0.60 0.81 0.60 0.81
April 19741974 0.65 0.382 1.0575 0.65 0.382 0.9870 1.13 0.350 0.8438 0.55 0.306 1.1045 0.51 0.393 0.7678 0.51 0.394 0.8550 0.56 0.281 0.7538 0.60 0.81 0.60 0.81
July 19741974 0.65 0.382 1.0575 0.65 0.382 1.1985 1.13 0.350 0.8438 0.55 0.306 1.1045 0.51 0.393 0.7678 0.51 0.394 0.8550 0.56 0.281 0.7538 0.60 0.81 0.60 0.81
Oct 1974 0.66 0.390 1.0800 0.65 0.382 1.1985 1.20 0.350 0.9000 0.55 0.306 1.1045 0.51 0.393 0.7678 0.52 0.403 0.8740 0.60 0.300 0.8040 0.44 0.59 0.44 0.59
Jan 1975 0.66 0.390 1.0800 0.65 0.382 1.1985 1.20 0.350 0.9000 0.55 0.306 1.1045 0.51 0.393 0.7678 0.52 0.403 0.8740
April 19751975 0.66 0.390 1.0800 0.65 0.382 1.1985 1.20 0.350 0.9000 0.55 0.306 1.1045 0.51 0.393 0.7678 0.52 0.403 0.8740
July 19751975 0.66 0.390 1.0800 0.65 0.382 1.1985 1.20 0.350 0.9000 0.55 0.306 1.1045 0.51 0.393 0.7678 0.52 0.403 0.8740
Oct 1975 0.77 0.455 1.2600 0.72 0.423 1.3260 1.40 0.350 1.0500 0.58 0.319 1.1515 0.59 0.457 0.8923 0.56 0.438 0.9500
Jan 1976 0.77 0.455 1.2600 0.72 0.423 1.3260 1.40 0.350 1.0500 0.58 0.319 1.1515 0.59 0.457 0.8923 0.56 0.438 0.9500
April 19761976 0.77 0.455 1.2600 0.72 0.423 1.3260 1.40 0.350 1.0500 0.58 0.319 1.1515 0.59 0.457 0.8923 0.56 0.438 0.9500
July 19761976 0.77 0.455 1.5960 0.72 0.423 1.5080 1.40 0.350 1.2180 0.58 0.319 1.2740 0.59 0.457 1.0213 0.56 0.438 1.0750
Sept 19761976 0.88 0.520 1.8240 0.83 0.488 1.7700 1.60 0.350 1.4400 0.66 0.364 1.5120 0.67 0.521 1.2005 0.64 0.499 1.2540
Oct 1976 0.77 0.595 1.4140
Jan 1977 0.96 0.744 1.7675
April 19771977 0.96 0.744 1.8025
July 19771977 0.96 0.744 1.8200
Oct 1977 0.96 0.744 1.8375
Jan 1978 1.17 0.903 2.2313
April 19781978 1.17 0.903 2.2738
July 19781978 1.17 0.903 2.2525
Oct 1978 1.17 0.903 2.2738
Jan 1979 1.17 0.903 2.2738
April 19791979 1.17 0.903 2.2950
July 19791979 1.17 0.903 2.3163
Oct 1979 1.17 0.903 2.3375
Jan 1980 1.17 0.903 2.3588
April 19801980 1.17 0.903 2.3588
July 19801980 1.24 0.956 2.5650
Oct 1980 1.24 0.956 2.5875
Jan 1981 1.29 0.999 2.7495
April 1981 1.29 0.999 2.7965
July 19811981
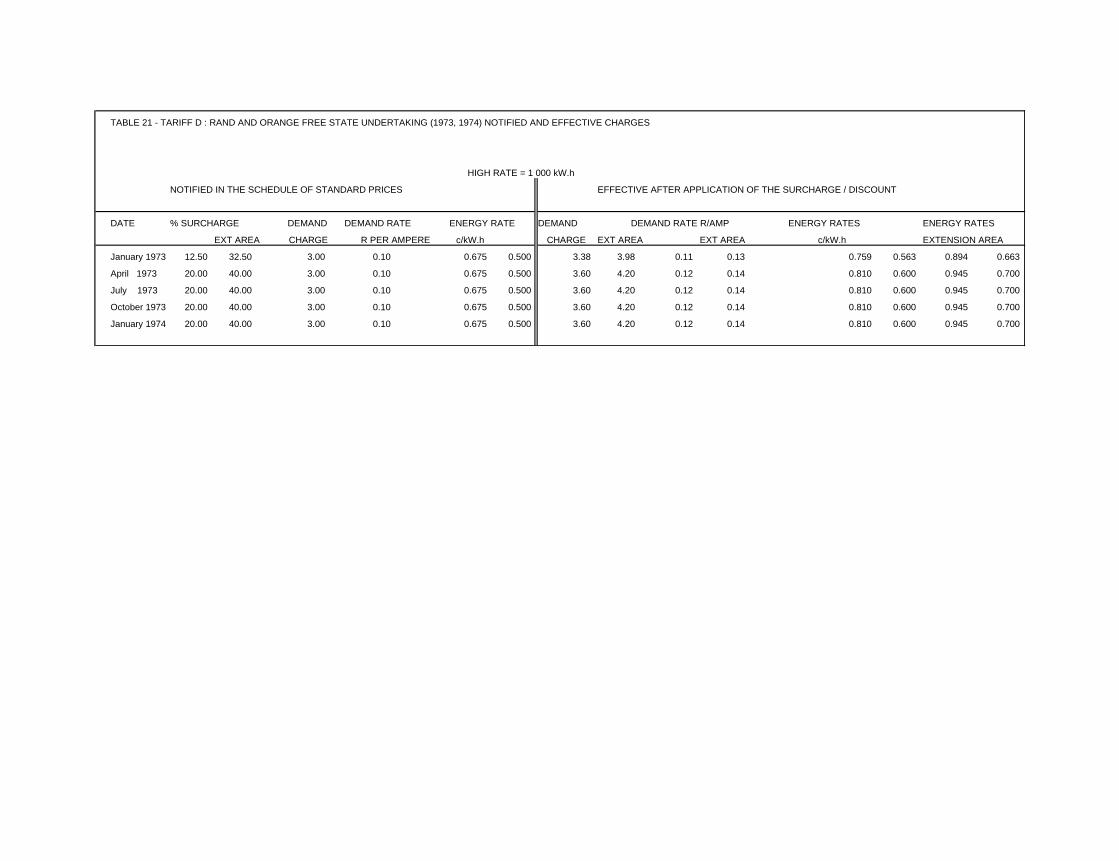
TABLE 21 - TARIFF D : RAND AND ORANGE FREE STATE UNDERTAKING (1973, 1974) NOTIFIED AND EFFECTIVE CHARGES
HIGH RATE = 1 000 kW.h
NOTIFIED IN THE SCHEDULE OF STANDARD PRICES EFFECTIVE AFTER APPLICATION OF THE SURCHARGE / DISCOUNT
DATE % SURCHARGE DEMAND DEMAND RATE ENERGY RATE DEMAND DEMAND RATE R/AMP ENERGY RATES ENERGY RATES
EXT AREA CHARGE R PER AMPERE c/kW.h CHARGE EXT AREA EXT AREA c/kW.h EXTENSION AREA
January 1973 12.50 32.50 3.00 0.10 0.675 0.500 3.38 3.98 0.11 0.13 0.759 0.563 0.894 0.663
April 1973 20.00 40.00 3.00 0.10 0.675 0.500 3.60 4.20 0.12 0.14 0.810 0.600 0.945 0.700
July 1973 20.00 40.00 3.00 0.10 0.675 0.500 3.60 4.20 0.12 0.14 0.810 0.600 0.945 0.700
October 1973 20.00 40.00 3.00 0.10 0.675 0.500 3.60 4.20 0.12 0.14 0.810 0.600 0.945 0.700
January 1974 20.00 40.00 3.00 0.10 0.675 0.500 3.60 4.20 0.12 0.14 0.810 0.600 0.945 0.700

TABLE 22 - TARIFF D : BASIC CHARGE IN RANDS NOTIFIED IN THE SCHEDULE OF STANDARD PRICES (BEFORE APPLICATION OF THE
SURCHARGE/DISCOUNT)
UNDERTAKING BORDER ORANGE RIVER CAPE WESTERN CAPE NORTHERN NATAL EASTERN TVL RAND & OFS
DATE
Jan 1982 12.00 12.00 12.00 12.00 8.00 10.00 12.00
April 1982 12.00 12.00 12.00 12.00 8.00 10.00 12.00
July 1982 12.00 12.00 12.00 12.00 8.00 10.00 12.00
Oct 1982 12.00 12.00 12.00 12.00 8.00 10.00 12.00
Jan 1983 12.00 12.00 12.00 12.00 12.00 10.00 12.00
April 1983 12.00 12.00 12.00 12.00 12.00 10.00 12.00
July 1983 12.00 12.00 12.00 12.00 12.00 10.00 12.00
Oct 1983 12.00 12.00 12.00 12.00 12.00 10.00 12.00
Jan 1984 12.00 12.00 12.00 12.00 12.00 20.00 20.00
April 1984 12.00 12.00 12.00 12.00 12.00 20.00 20.00
July 1984 12.00 12.00 12.00 12.00 12.00 20.00 20.00
Oct 1984 12.00 12.00 12.00 12.00 12.00 20.00 20.00
AMALGAMATION AMALGAMATION
EASTERN CAPE NORTHERN & WESTERN CAPE
UNDERTAKING UNDERTAKING
Jan 1985 16.00 16.00 12.00 20.00 20.00
April 1985 16.00 16.00 12.00 20.00 20.00
July 1985 16.00 16.00 12.00 20.00 20.00
Sept 1985 16.00 16.00 12.00 20.00 20.00
Oct 1985 16.00 16.00 12.00 20.00 20.00
TABLE 23 - TARIFF D : ENERGY RATES IN c/kW.h NOTIFIED IN THE SCHEDULE OF STANDARD PRICES TAKING INTO ACCOUNT THE COAL
COST ADJUSTMENT (BEFORE APPLICATION OF THE SURCHARGE/DISCOUNT)
THE HIGH ENERGY RATE IS APPLIED TO THE FIRST 800 kW.h
UNDERTAKING BORDER ORANGE RIVER CAPE WESTERN CAPE NORTHERN NATAL EASTERN TVL RAND & OFS
QUARTERCOAL COST
(c/ton)
Jan 1982 8.78 5.48 8.58 5.28 7.73 4.43 7.13 4.43 4.57 2.42 4.97 2.97 5.37 2.97
April 1982 8.86 5.56 8.66 5.36 7.81 4.51 7.21 4.51 4.63 2.48 5.04 3.04 5.44 3.04
July 1982 8.86 5.56 8.65 5.35 7.80 4.50 7.21 4.51 4.62 2.47 5.03 3.03 5.43 3.03
Oct 1982 8.85 5.55 8.64 5.34 7.79 4.49 7.20 4.50 4.61 2.46 5.02 3.02 5.42 3.02
Jan 1983 8.83 5.53 8.62 5.32 7.78 4.48 7.18 4.48 7.83 4.53 5.00 3.00 5.40 3.00
April 1983 8.82 5.52 8.61 5.31 7.77 4.47 7.17 4.47 7.82 4.52 5.00 3.00 5.40 3.00
July 1983 8.91 5.61 8.70 5.40 7.86 4.56 7.26 4.56 7.93 4.63 5.06 3.06 5.46 3.06
Oct 1983 8.91 5.61 8.70 5.40 7.86 4.56 7.26 4.56 7.89 4.63 5.06 3.06 5.46 3.06
Jan 1984 8.90 5.60 8.69 5.39 7.85 4.55 7.25 4.55 7.93 4.63 9.64 5.49 9.64 5.49
April 1984 8.88 5.58 8.67 5.37 7.83 4.53 7.23 4.53 7.91 4.61 9.61 5.46 9.61 5.46
July 1984 8.87 5.57 8.66 5.36 7.82 4.52 7.22 4.52 7.91 4.61 9.61 5.46 9.61 5.46
Oct 1984 8.88 5.58 8.67 5.37 7.83 4.53 7.23 4.53 7.91 4.61 9.61 5.46 9.61 5.46
AMALGAMATION AMALGAMATION
EASTERN CAPE NORTHERN & WESTERN CAPE
UNDERTAKING UNDERTAKING
Jan 1985 11.98 7.83 10.71 6.56 7.95 4.65 9.67 5.52 9.68 5.53
April 1985 11.96 7.81 10.68 6.53 7.93 4.63 9.65 5.50 9.65 5.50
July 1985 12.01 7.86 10.73 6.58 7.97 4.67 9.70 5.55 9.70 5.55
Sept 1985 12.01 7.86 10.73 6.58 7.97 4.67 9.70 5.55 9.70 5.55
Oct 1985 12.01 7.86 10.74 6.59 7.95 4.65 9.70 5.55 9.71 5.56

TABLE 24 - TARIFF D : EFFECTIVE BASIC CHARGE IN RANDS (AFTER APPLICATION OF THE SURCHARGE/DISCOUNT)
UNDERTAKING BORDER ORANGE RIVER CAPE WESTERN CAPE NORTHERN NATAL EASTERN TVL RAND & OFS
DATE
Jan 1982 10.08 10.32 10.32 10.08 9.60 10.90 13.08
April 1982 10.08 10.32 10.32 10.08 9.60 10.90 13.08
July 1982 10.68 10.92 10.92 10.68 10.32 11.70 13.92
Oct 1982 10.68 10.92 10.92 10.68 10.32 11.70 13.92
Jan 1983 11.64 12.48 12.00 11.88 10.38 13.60 16.02
April 1983 11.64 12.48 12.00 11.88 10.38 13.60 16.02
July 1983 11.64 12.48 12.00 11.88 10.38 13.60 16.02
Oct 1983 11.64 12.48 12.00 11.88 10.38 13.60 16.02
Jan 1984 12.30 13.20 12.72 12.60 10.98 15.90 15.90
April 1984 12.30 13.20 12.72 12.60 10.98 15.90 15.90
July 1984 12.30 13.20 12.72 12.60 10.98 15.90 15.90
Oct 1984 12.30 13.20 12.72 12.60 10.98 15.90 15.90
AMALGAMATION AMALGAMATION
EASTERN CAPE NORTHERN & WESTERN CAPE
UNDERTAKING UNDERTAKING
Jan 1985 12.64 13.28 12.12 17.40 17.60
April 1985 12.64 13.28 12.12 17.40 17.60
July 1985 12.64 13.28 12.12 17.40 17.60
Sept 1985 13.90 14.61 13.33 19.14 19.36
Oct 1985 13.90 14.61 13.33 19.14 19.36
TABLE 25 - TARIFF D : EFFECTIVE ENERGY RATES IN c/kW.h (AFTER APPLICATION OF THE SURCHARGE/DISCOUNT)
THE HIGH ENERGY RATE IS APPLIED TO THE FIRST 800 kW.h
UNDERTAKING BORDER ORANGE RIVER CAPE WESTERN CAPE NORTHERN NATAL EASTERN TVL RAND & OFS
DATE
Jan 1982 7.375 4.603 7.379 4.541 6.648 3.810 5.989 3.721 5.484 2.904 5.417 3.237 5.853 3.237
April 1982 7.442 4.670 7.448 4.610 6.717 3.879 6.056 3.788 5.556 2.976 5.494 3.314 5.930 3.314
July 1982 7.885 4.948 7.872 4.869 7.098 4.095 6.417 4.014 5.960 3.186 5.885 3.545 6.299 3.515
Oct 1982 7.877 4.940 7.862 4.859 7.089 4.086 6.408 4.005 5.947 3.173 5.873 3.533 6.287 3.503
Jan 1983 8.565 5.364 8.965 5.533 7.780 4.480 7.108 4.435 6.773 3.918 6.800 4.080 7.209 4.005
April 1983 8.555 5.354 8.954 5.522 7.770 4.470 7.098 4.425 6.764 3.910 6.800 4.080 7.209 4.005
July 1983 8.643 5.442 9.048 5.616 7.860 4.560 7.187 4.514 6.859 4.005 6.882 4.162 7.289 4.085
Oct 1983 8.643 5.442 9.048 5.616 7.860 4.560 7.187 4.514 6.827 4.005 6.882 4.162 7.289 4.085
Jan 1984 9.123 5.740 9.559 5.929 8.321 4.823 7.613 4.778 7.256 4.236 7.664 4.365 7.664 4.365
April 1984 9.102 5.720 9.537 5.907 8.300 4.802 7.592 4.757 7.238 4.218 7.640 4.341 7.640 4.341
July 1984 9.092 5.709 9.526 5.896 8.289 4.791 7.581 4.746 7.238 4.218 7.640 4.341 7.640 4.341
Oct 1984 9.102 5.720 9.537 5.907 8.300 4.802 7.592 4.757 7.238 4.218 7.640 4.341 7.640 4.341
AMALGAMATION AMALGAMATION
EASTERN CAPE NORTHERN & WESTERN CAPE
UNDERTAKING UNDERTAKING
Jan 1985 9.464 6.186 8.889 5.445 8.030 4.697 8.413 4.802 8.518 4.866
April 1985 9.448 6.170 8.864 5.420 8.009 4.676 8.396 4.785 8.492 4.840
July 1985 9.488 6.209 8.906 5.461 8.050 4.717 8.439 4.829 8.536 4.884
Sept 1985 10.437 6.830 9.796 6.008 8.855 5.188 9.283 5.311 9.390 5.372
Oct 1985 10.437 6.830 9.806 6.017 8.832 5.166 9.283 5.311 9.399 5.382

SECTION 4
INDIVIDUAL TARIFFS - 1986 TO 1991 This section covers the national tariffs from their introduction in January 1986 until 1991. These tariffs were applied countrywide. Each table represents a different tariff. The figures for all tariffs for January 1986, July 1986 and January 1987 are reflected first as they were published in the Schedule of Standard Prices, and then in effective terms, i.e. after the application of the surcharge or discount applicable at that time. The concept of a surcharge was done away with effect from July 1987 i.e. the tariffs were all published in effective terms. The October 1991 increase reflected is purely as a result of the introduction of Value Added Tax (VAT) of 10 % on electricity. In practice, the customer's account is calculated and then VAT applied to the total.
4.1 LARGE POWER TARIFFS
The Tariffs applicable to Large Power Users are Tariffs A, E and F. 1. Tariff A is defined as follows :
"For electricity supplied to a consumer whose notified maximum demand is 25 kW/kV.A or over, in the form of three-phase alternating current at a frequency of 50 hertz and at an agreed voltage which is available in the vicinity, excepting supplies furnished under Tariffs (E) or (F),..." Most large power customers are charged Tariff A, while some are charged Tariffs E and F, and more lately a few customers have been put on Options T1 and T2.
2. Tariff E was introduced in January 1986, and is defined in the Schedule of Standard Prices as follows : "For electricity supplied to a consumer whose maximum demand is 25 kV.A or over, and who elects to be charged for demand on the basis of the maximum demand measured during peak hours, in the form of three-phase alternating current at a frequency of 50 hertz and at an agreed voltage which is available in the vicinity, ..." This tariff is of benefit to a large power customer whose electricity consumption pattern is such that the peak demand can be moved to occur during Eskom's off-peak hours. The customer only pays for the maximum demand measured during the peak hours, thus that measured during off-peak hours is free of demand charge (see Section 1 paragraph 1.3.4).
3. Tariff F was introduced from July 1987 and is defined in the Schedule of Standard Prices as follows : "For electricity supplied at a nominal phase-to-phase voltage of 22 000 volts or 11 000 volts or lower than 500 volts to a consumer whose notified maximum demand is 25 kV.A or over, excepting supplies furnished under Tariffs (A) or (E), ..."

Tariff F was introduced to benefit low load factor customers, in particular irrigation farmers (see Section 1 paragraph 1.3.4).
4. The total of the account calculated for a Large Power customer in terms of Tariff A, E or F is subject to a transmission percentage surcharge to take account of differences of transmission costs between different areas. The transmission percentage charge is applied as follows : Nil for points of supply situated a linear distance up to and including 300 kilometers from Johannesburg. 1 % for points of supply situated a linear distance exceeding 300 and up to 600 kilometers from Johannesburg. 2 % for points of supply situated a linear distance exceeding 600 and up to 900 kilometers from Johannesburg. 3 % for points of supply situated a linear distance from Johannesburg exceeding 900 kilometers. Notes to Tables :
TABLE 26 - TARIFF A (LARGE POWER USERS) The figures shown are before application of the transmission percentage charge.
TABLE 27 - TARIFF E (LARGE POWER OFF-PEAK USE) The table shows tariff figures from 1986 when the tariff was first introduced. The figures shown are before application of the transmission percentage surcharge.
TABLE 28 - TARIFF F ( LARGE POWER VARIABLE USE) The figures shown are from July 1987 when the tariff was first introduced. The transmission percentage surcharge has not been applied to the figures shown.
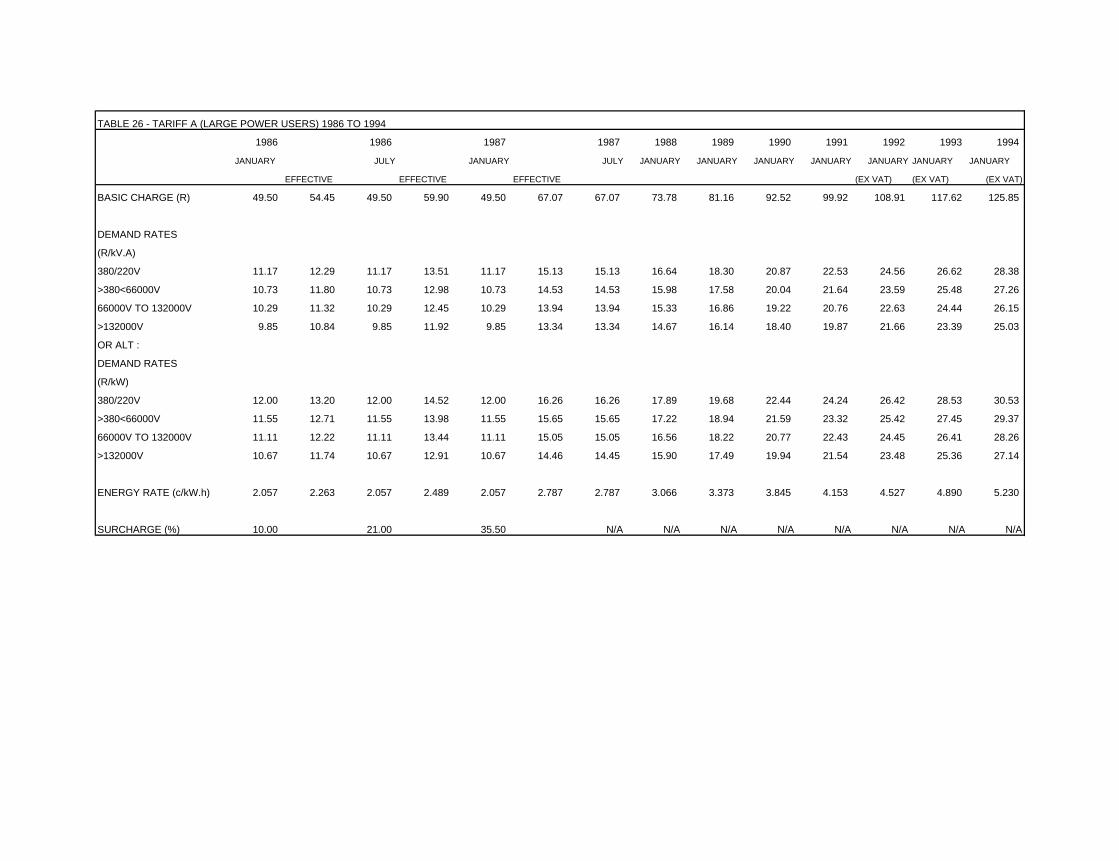
TABLE 26 - TARIFF A (LARGE POWER USERS) 1986 TO 1994
1986 1986 1987 1987 1988 1989 1990 1991 1992 1993 1994
JANUARY JULY JANUARY JULY JANUARY JANUARY JANUARY JANUARY JANUARY JANUARY JANUARY
EFFECTIVE EFFECTIVE EFFECTIVE (EX VAT) (EX VAT) (EX VAT)
BASIC CHARGE (R) 49.50 54.45 49.50 59.90 49.50 67.07 67.07 73.78 81.16 92.52 99.92 108.91 117.62 125.85
DEMAND RATES
(R/kV.A)
380/220V 11.17 12.29 11.17 13.51 11.17 15.13 15.13 16.64 18.30 20.87 22.53 24.56 26.62 28.38
>380<66000V 10.73 11.80 10.73 12.98 10.73 14.53 14.53 15.98 17.58 20.04 21.64 23.59 25.48 27.26
66000V TO 132000V 10.29 11.32 10.29 12.45 10.29 13.94 13.94 15.33 16.86 19.22 20.76 22.63 24.44 26.15
>132000V 9.85 10.84 9.85 11.92 9.85 13.34 13.34 14.67 16.14 18.40 19.87 21.66 23.39 25.03
OR ALT :
DEMAND RATES
(R/kW)
380/220V 12.00 13.20 12.00 14.52 12.00 16.26 16.26 17.89 19.68 22.44 24.24 26.42 28.53 30.53
>380<66000V 11.55 12.71 11.55 13.98 11.55 15.65 15.65 17.22 18.94 21.59 23.32 25.42 27.45 29.37
66000V TO 132000V 11.11 12.22 11.11 13.44 11.11 15.05 15.05 16.56 18.22 20.77 22.43 24.45 26.41 28.26
>132000V 10.67 11.74 10.67 12.91 10.67 14.46 14.45 15.90 17.49 19.94 21.54 23.48 25.36 27.14
ENERGY RATE (c/kW.h) 2.057 2.263 2.057 2.489 2.057 2.787 2.787 3.066 3.373 3.845 4.153 4.527 4.890 5.230
SURCHARGE (%) 10.00 21.00 35.50 N/A N/A N/A N/A N/A N/A N/A N/A

TABLE 27 - TARIFF E (LARGE POWER OFF-PEAK USE)
1986 1986 1987 1987 1988 1989 1990 1991 1991
JANUARY JULY JANUARY JULY JANUARY JANUARY JANUARY JANUARY OCTOBER
EFFECTIVE EFFECTIVE EFFECTIVE (VAT)
BASIC CHARGE (R) 110.00 121.00 110.00 133.10 110.00 149.05 149.05 163.96 180.36 205.61 222.06 244.27
DEMAND RATES (R/kV.A)
380/220V 11.17 12.29 11.17 13.51 11.17 15.13 15.13 16.64 18.30 20.87 22.53 24.78
>380<66000V 10.73 11.80 10.73 12.98 10.73 14.53 14.53 15.98 17.58 20.04 21.64 23.80
66000V TO 132000V 10.29 11.32 10.29 12.45 10.29 13.94 13.94 15.33 16.86 19.22 20.76 22.84
>132000V 9.85 10.84 9.85 11.92 9.85 13.34 13.34 14.67 16.14 18.40 19.87 21.86
OR ALT :
DEMAND RATES (R/kW)
380/220V 12.00 13.20 12.00 14.52 12.00 16.26 16.26 17.89 19.68 22.44 24.24 26.66
>380<66000V 11.55 12.71 11.55 13.98 11.55 15.65 15.65 17.22 18.94 21.59 23.32 25.65
66000V TO 132000V 11.11 12.22 11.11 13.44 11.11 15.05 15.05 16.56 18.22 20.77 22.43 24.67
>132000V 10.67 11.74 10.67 12.91 10.67 14.45 14.45 15.90 17.49 19.94 21.54 23.69
ENERGY RATE (c/kW.h) 2.057 2.263 2.057 2.488 2.057 2.787 2.787 3.066 3.373 3.845 4.153 4.569
MINIMUM RATE (c/kW.h) 3.300 3.630 3.300 3.993 3.300 4.471 4.471 4.918 5.410 6.167 6.660 7.326
SURCHARGE (%) 10.00 21.00 35.50 N/A N/A N/A N/A N/A N/A TABLE 28 - TARIFF F (LARGE POWER VARIABLE USE)
1987 1988 1989 1990 1991 1991
JULY JANUARY JANUARY JANUARY JANUARY OCTOBER
BASIC CHARGE (R) 67.07 73.78 81.16 92.52 99.92 109.91
DEMAND RATES (R/kV.A)
380/220V 15.13 16.64 18.30 20.87 22.53 24.78
11 kV OR 22 kV 14.53 15.98 17.58 20.04 21.64 23.81
ENERGY RATE (c/kW.h) 2.787 3.066 3.373 3.845 4.153 4.568
MAXIMUM OVERALL (c/kW.h) 12.88 14.17 15.59 17.773 19.195 21.115

4.2 SMALL POWER USER TARIFFS The tariffs applicable to Small Power Users from 1986 are Tariffs B, C, D and S1. 1. Tariff B for Small Power Users - Urban is defined in the Schedule of Standard Prices as
follows : "For a supply of electricity for purposes other than domestic to a consumer within a legally constituted township or within an area considered by Eskom to be equivalent thereto, the maximum demand of such supply at no time exceeding 100 kV.A, and being made available at a nominal voltage lower than 500 volts or as otherwise agreed,.." Tariff B is generally applicable to small businesses within urban areas.
2. Tariff C for Domestic Users - Urban is defined as follows : "For a supply of electricity for domestic purposes for a dwelling unit or a group of dwelling units, or for a church, hall, old-age home or the like premises, within a legally constituted township or within an area considered by Eskom to be similar to a legally constituted township, ..." As explained in the definition, Tariff C is applied to domestic supplies within urban areas.
3. Tariff D for Small Power Users - General is defined as follows : "For a supply of electricity to a consumer whose maximum demand at no time exceeds 100 kV.A, made available at a nominal voltage lower than 500 volts or as otherwise agreed, and who does not qualify for tariffs B or C, ..." Tariff D is generally applied to all rural supplies, in particular farming supplies. Most Tariff D supplies are also charged a capital charge ("Monthly Rental") in addition to the standard tariff (see also Section 1 paragraph 1.3.1).
4. Tariff S1 for Small Power Users - Low Use is defined as follows : "For a single-phase supply of electricity to a consumer within areas (as designated by Eskom from time to time) where a prepayment measurement system is in effect, the consumer shall pay in advance for each kW.h supplied at the rate of ..." Tariff S1 is the first of a new range of tariffs to be introduced for small power users (see also Section 1 paragraph 1.3.5). Notes to Tables :
TABLE 29 - SMALL POWER USER TARIFFS 1986 TO 1991 This table reflects the tariffs for Tariff B, Tariff C and Tariff D. A single unit rate was introduced for tariff C as from July 1987.
TABLE 30 - TARIFF S1 (SMALL POWER USERS, LOW-USE)

Tariff S1 was only introduced in September 1989 and was thus not subject to the tariff increase applied in January 1990.
4.3 STREET LIGHTING TARIFF In the Schedule of Standard Prices, the Street Lighting is covered by paragraph 3 which states that "Where Eskom provided a supply for, and maintains, any street lighting or similar public lighting, the charge for such supply and services shall be fixed by special agreement between Eskom and the consumer."

TABLE 29 - SMALL POWER TARIFFS 1986 TO 1991
1986 1986 1987 1987 1988 1989 1990 1991 1991
JANUARY JULY JANUARY JULY JANUARY JANUARY JANUARY JANUARY OCTOBER
EFFECTIVE EFFECTIVE EFFECTIVE (VAT)
TARIFF B
---------
BASIC CHARGE (R)
UP TO 25 kV.A 14.30 15.73 14.30 17.30 14.30 19.37 19.37 21.31 23.44 26.72 28.86 31.75
26 TO 50 kV.A 23.10 25.41 23.10 27.95 23.10 31.30 31.30 34.43 37.87 43.17 46.62 51.28
51 TO 100 kV.A 39.60 43.56 39.60 47.91 39.60 53.65 53.65 59.02 64.92 74.01 79.93 87.92
UNIT RATE (c/kW.h)
UP TO 500 kW.h 9.51 10.46 9.51 11.50 9.51 12.88 12.88 14.17 15.59 17.773 19.195 21.115
REMAINDER 5.50 6.05 5.50 6.65 5.50 7.45 7.45 8.20 9.02 10.283 11.106 12.217
SURCHARGE (%) 10.00 21.00 35.50
TARIFF C
---------
BASIC CHARGE (R) 6.60 7.26 6.60 7.98 6.60 8.94 16.00 17.60 19.36 22.07 23.84 26.22
UNIT RATE (c/kW.h)
UP TO 300 kW.h 9.51 10.46 9.51 11.50 9.51 12.88 8.70 9.57 10.53 12.004 12.964 14.260
REMAINDER 5.50 6.05 5.50 6.65 5.50 7.45 8.70 9.57 10.53 12.004 12.964 14.260
SURCHARGE (%) 10.00 21.00 35.50
TARIFF D
---------
BASIC CHARGE (R)
UP TO 25 kV.A 24.20 26.62 24.20 29.28 24.20 32.79 32.79 36.07 39.68 45.24 48.86 53.75
26 TO 50 kV.A 33.00 36.30 33.00 39.93 33.00 44.71 44.71 49.18 54.10 61.67 66.60 73.26
51 TO 100 kV.A 49.50 54.45 49.50 59.89 49.50 67.07 67.07 73.78 81.16 92.52 99.92 109.91
UNIT RATE (c/kW.h)
UP TO 1000 kW.h 9.51 10.46 9.51 11.50 9.51 12.88 12.88 14.17 15.59 17.773 19.195 21.115
REMAINDER 5.50 6.05 5.50 6.65 5.50 7.45 7.45 8.20 9.02 10.283 11.106 12.217
SURCHARGE (%) 10.00 21.00 35.50
TABLE 30 - TARIFF S1 (SMALL POWER USERS, LOW USE)
SEPT 1989 16 c/kW.h
JAN 1990 16 c/kW.h
JAN 1991 17.28 c/kW.h
OCT (VAT) 1991 19.01 c/kW.h

SECTION 5
TRENDS & GRAPHS
This section contains the graphic representation of average customer payment trends. Also included are tables showing average customer details for Tariffs A to D. The tables show the average account based on certain assumptions, as well as the average c/kW.h paid.
GRAPHS 3 TO 8: AVERAGE c/kW.h GRAPH 3 TARIFF A 4 TARIFF B 5 TARIFF C 6 TARIFF D 7 TARIFF E 8 TARIFF F These graphs illustrate the information contained in Tables 32, 34, 36 and 38, and average c/kW.h information for Tariffs E and F.
TABLE 31 - TARIFF A : EXAMPLE OF AN AVERAGE CUSTOMER ACCOUNT
TABLE 32 - TARIFF A : AVERAGE C/KW.H (GRAPH 3)
TABLE 33 - TARIFF B : EXAMPLE OF AN AVERAGE CUSTOMER ACCOUNT
TABLE 34 - TARIFF B : AVERAGE C/KW.H (GRAPH 4)
TABLE 35 - TARIFF C : EXAMPLE OF AN AVERAGE CUSTOMER ACCOUNT
TABLE 36 - TARIFF C : AVERAGE C/KW.H (GRAPH 5)
TABLE 37 - TARIFF D : AVERAGE CUSTOMER ACCOUNT
TABLE 38 - TARIFF D : AVERAGE C/KW.H (GRAPH 6)
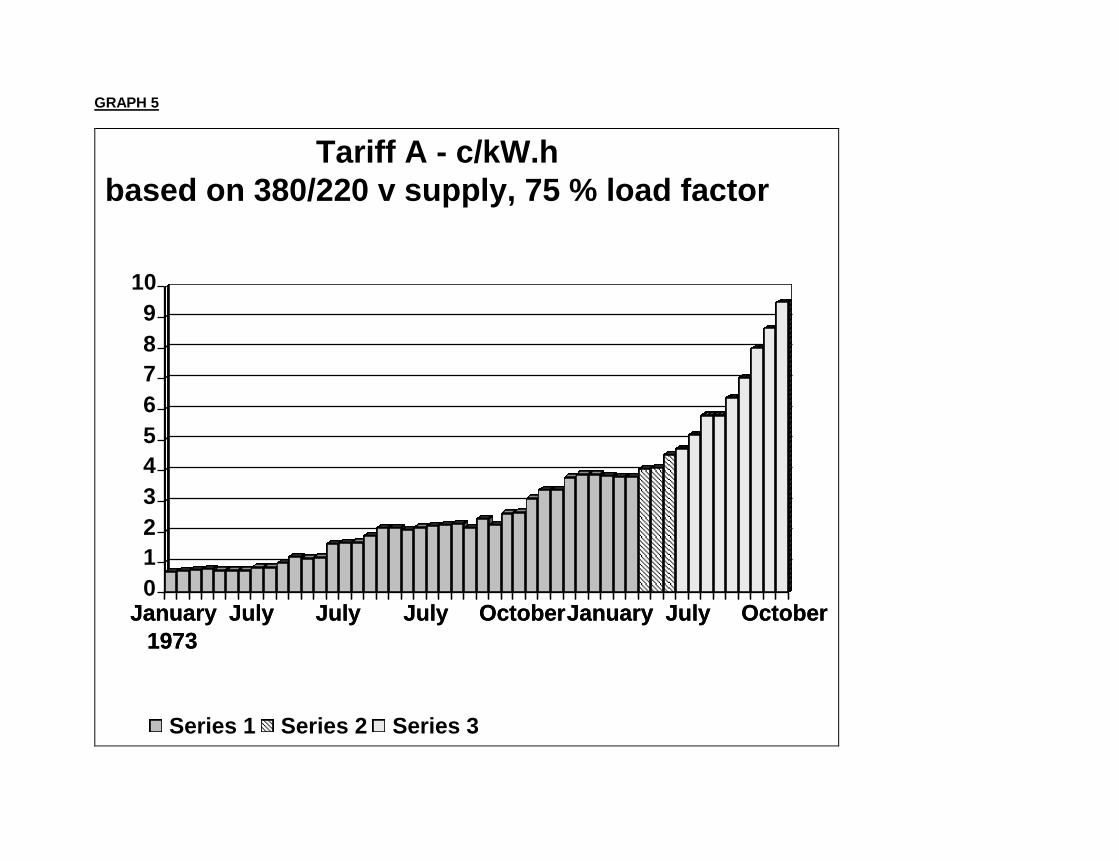
GRAPH 5
January
1973
July
1975
July
1977
July
1979
October
1981
January
1984
July
1986
October
1991
0
1
2
3
4
5
6
7
8
9
10
January
1973
July
1975
July
1977
July
1979
October
1981
January
1984
July
1986
October
1991
Series 1 Series 2 Series 3
Tariff A - c/kW.h
based on 380/220 v supply, 75 % load factor

GRAPH 6

GRAPH 7
J
73
J O J
77
J O J
81
J
82
J O J
86
J O J
90
J02
46
81012
141618
J
73
J O J
77
J O J
81
J
82
J O J
86
J O J
90
J
Series 1 Series 2 Series 3 Series 4 Series 5
Tariff C c/kW.h
based on 400 kW.h until 1985, 750 kW.h 1986 ->

GRAPH 8
J
82
J J
83
J J
84
J J
85
J J
86
J J
87
J J
88
J J
89
J J
90
J J
91
J0
5
10
15
20
25
J
82
J J
83
J J
84
J J
85
J J
86
J J
87
J J
88
J J
89
J J
90
J J
91
J
Series 1 Series 2 Series 3
tariff D c/kW.h
50 kV.A using 1 500 kW.h

GRAPH 9

GRAPH 10

TABLE 31 - TARIFF A : EXAMPLE OF AN AVERAGE CUSTOMER ACCOUNT ASSUMING 200 kV.A; 70% LOAD FACTOR
UNDERTAKINGCAPE BORDER ORANGE CAPE CAPE NATAL EASTERN RAND R&OFS AVERAGE
EASTERN RIVER WESTERN NORTHERN TVL &OFS EXT R
DATE
Jan 1973 958.75 850.78 692.95 909.39 636.10 693.57 428.24 1901.78 2187.04 1028.73
April 1973 1024.12 952.07 742.44 971.40 692.22 743.11 458.83 1901.78 2187.04 1074.78
July 1973 1024.12 952.07 742.44 971.40 692.22 743.11 458.83 1901.78 2187.04 1074.78
Oct 1973 1024.12 952.07 742.44 971.40 692.22 743.11 751.33 1901.78 2187.04 1107.28
Jan 1974 1024.12 1174.22 742.44 971.40 692.22 743.11 751.33 1901.78 2187.04 1131.96
April 1974 1045.91 1174.22 791.94 971.40 692.22 759.62 801.41 1917.31 1156.71 1034.53
July 1974 1045.91 1174.22 791.94 971.40 692.22 759.62 560.12 1917.31 1156.71 1007.72
Oct 1974 1045.91 1174.22 791.94 971.40 692.22 759.62 560.12 1917.31 1156.71 1007.72
Jan 1975 1045.91 1174.22 791.94 971.40 692.22 759.62 560.12 1917.31 1156.71 1007.72
April 1975 1220.23 1299.14 923.93 1012.73 804.48 825.68 609.54 2247.89 1359.13 1144.75
July 1975 1220.23 1299.14 923.93 1012.73 804.48 825.68 609.54 2247.89 1359.13 1144.75
Oct 1975 1220.23 1299.14 923.93 1012.73 804.48 825.68 609.54 2247.89 1359.13 1144.75
Jan 1976 1585.08 1485.15 1098.49 1150.45 938.51 972.59 724.87 2723.49 1379.71 1339.81
April 1976 1811.52 1759.62 1307.74 1364.87 1109.53 1130.60 857.17 3281.05 1750.31 1596.93
July 1976 1811.52 1774.95 1307.74 1364.87 1109.53 1123.31 857.17 3281.05 1750.31 1597.83
Sept 1976 1515.23 1879.22 1165.56 1429.22 1268.03 505.56 979.62 3699.91 1977.20 1602.17
Oct 1976 1543.13 1900.68 1187.02 1450.68 1308.10 527.02 1013.96 3841.70 2140.40 1656.96
Jan 1977 2007.56 2460.85 1556.89 1843.35 1645.85 1746.89 1255.37 4821.85 2710.29 2227.65
April 1977 2020.08 2470.56 1566.60 1853.06 1667.31 1756.60 1273.46 4897.52 2797.43 2255.85
July 1977 2035.11 2482.21 1578.25 1864.71 1688.77 1768.25 1291.55 4973.20 2884.57 2285.18
Oct 1977 2045.12 2489.98 1586.01 1872.48 1703.08 1776.01 1303.61 5023.64 2942.66 2304.73
Jan 1978 2343.01 2493.86 2008.29 1975.12 2076.72 1779.90 1576.00 6043.34 3550.41 2649.63
April 1978 2371.62 2513.28 2032.82 1995.56 2120.15 1799.32 1612.28 4063.61 3723.93 2470.28
July 1978 2354.45 2501.63 2186.28 1983.29 2094.09 1787.66 1590.51 4033.33 3619.82 2461.23
Oct 1978 2371.62 2513.28 2202.22 1995.56 2120.15 1799.32 1612.28 3239.98 3723.93 2397.59
Jan 1979 2459.29 2647.60 2332.08 2097.48 2124.49 1801.26 1706.95 3428.13 3939.06 2504.04
April 1979 2477.07 2659.86 2348.95 2110.36 2150.56 1812.91 1729.94 3523.53 4048.67 2540.20
July 1979 2485.96 2666.00 2357.38 2116.80 2163.59 1818.73 1741.44 3571.23 4103.48 2558.29
Oct 1979 2503.74 2678.26 2374.24 2129.67 2189.65 1830.38 1764.44 3666.62 4213.09 2594.45
Jan 1980 2518.56 2688.48 2518.56 2140.40 2211.36 1840.09 1783.60 3746.12 4304.43 2639.07
April 1980 2521.53 2690.52 2521.53 2142.55 2215.71 1842.03 1787.43 3762.02 4322.70 2645.11
July 1980 2736.61 2920.88 2736.61 2325.48 2405.83 1965.56 1917.47 2837.53 <-------- 2205.11
Oct 1980 2758.79 2936.26 2758.79 2341.58 2438.02 1979.86 1929.70 2878.03 2502.63
Jan 1981 -------->--------> 3098.12 2973.87 2524.67 2594.41 2102.47 2058.85 3106.52 2307.36
April 1981 3116.52 3000.86 2544.29 2632.84 2119.64 2076.23 3160.20 2664.37
July 1981 3137.22 3031.21 2566.36 2541.72 2138.95 2093.61 3220.70 2675.68
Oct 1981 3167.11 3075.05 2598.25 2568.32 2166.85 2120.21 3308.19 2714.86
Jan 1982 3647.01 3628.82 3065.46 2935.49 2540.17 2493.15 3927.75 3176.84
April 1982 3724.27 3706.16 3142.81 3012.76 2618.66 2571.13 4184.37 3280.02
July 1982 3931.40 3906.76 3310.65 3177.53 2797.92 2743.10 4399.89 3466.75
Oct 1982 3926.85 3903.04 3306.93 3172.99 2793.97 2739.51 4389.25 3461.79
Jan 1983 4259.01 4434.04 3612.53 3506.23 3210.89 3155.20 4961.62 3877.07
April 1983 4249.10 4424.47 3602.31 3496.11 3199.40 3145.47 4928.96 3863.69
July 1983 4336.33 4511.63 3690.20 3584.14 3286.92 3233.04 5214.69 3979.56
Oct 1983 4336.33 4511.63 3690.20 3584.14 3286.92 3233.04 5214.69 3979.56
Jan 1984 4579.07 4768.54 3907.28 3798.14 3489.07 3407.49 3464.37 3916.28
April 1984 4554.97 4744.94 3882.36 3773.46 3462.88 3438.37 3438.37 3899.34
July 1984 4550.78 4740.44 3879.11 3769.17 3460.08 3435.93 3435.93 3895.92
Oct 1984 4554.97 4744.94 3882.36 3773.46 3464.75 3438.37 3438.37 3899.60
AMALGAMATION AMALGAMATION
EASTERN CAPE NORTH WESTERN CAPE
UNDERTAKING UNDERTAKING
Jan 1985 4947.23 4355.87 3861.64 3823.20 3870.75 4171.74
April 1985 4931.09 4339.75 3845.13 3807.20 3854.56 4155.54
July 1985 4969.84 4378.77 3886.42 3845.43 3893.23 4194.74
Sept 1985 5466.82 4816.65 4275.06 4229.97 4282.55 4614.21
Oct 1985 5474.82 4825.05 4258.03 4238.78 4290.47 4617.43
ALL REGIONS
Jan 1986 4825.24 4825.24
July 1986 5305.66 5305.66
Jan 1987 5941.38 5941.38
July 1987 5941.38 5941.38
Jan 1988 6535.23 6535.23
Jan 1989 7188.37 7188.37
Jan 1990 8196.11 8196.11
Jan 1991 8850.29 8850.29
Oct (VAT)1991 9735.43 9735.43

TABLE 32 - TARIFF A : AVERAGE CUSTOMER ACCOUNT IN c/kW.h ASSUMING 200 kV.A; 70% LOAD FACTOR
UNDERTAKING CAPE BORDER ORANGE CAPE CAPE NATAL EASTERN RAND R&OFS AVERAGE
EASTERN RIVER WESTERN NORTHERN TVL &OFS EXT c/kW.h
DATE
Jan 1973 0.94 0.83 0.68 0.89 0.62 0.68 0.42 0.62 0.72 0.71
April 1973 1.00 0.93 0.73 0.95 0.68 0.73 0.45 0.62 0.72 0.76
July 1973 1.00 0.93 0.73 0.95 0.68 0.73 0.45 0.62 0.72 0.76
Oct 1973 1.00 0.93 0.73 0.95 0.68 0.73 0.74 0.62 0.72 0.79
Jan 1974 1.00 1.15 0.73 0.95 0.68 0.73 0.74 0.62 0.72 0.81
April 1974 1.02 1.15 0.77 0.95 0.68 0.74 0.78 0.63 0.38 0.79
July 1974 1.02 1.15 0.77 0.95 0.68 0.74 0.55 0.63 0.38 0.76
Oct 1974 1.02 1.15 0.77 0.95 0.68 0.74 0.55 0.63 0.38 0.76
Jan 1975 1.02 1.15 0.77 0.95 0.68 0.74 0.55 0.63 0.38 0.76
April 1975 1.19 1.27 0.90 0.99 0.79 0.81 0.60 0.74 0.44 0.86
July 1975 1.19 1.27 0.90 0.99 0.79 0.81 0.60 0.74 0.44 0.86
Oct 1975 1.19 1.27 0.90 0.99 0.79 0.81 0.60 0.74 0.44 0.86
Jan 1976 1.55 1.45 1.07 1.13 0.92 0.95 0.71 0.89 0.45 1.01
April 1976 1.77 1.72 1.28 1.34 1.09 1.11 0.84 1.07 0.57 1.20
July 1976 1.77 1.74 1.28 1.34 1.09 1.10 0.84 1.07 0.57 1.20
Sept 1976 1.48 1.84 1.14 1.40 1.24 0.49 0.96 1.21 0.65 1.16
Oct 1976 1.51 1.86 1.16 1.42 1.28 0.52 0.99 1.26 0.70 1.19
Jan 1977 1.96 2.41 1.52 1.80 1.61 1.71 1.23 1.58 0.89 1.63
April 1977 1.98 2.42 1.53 1.81 1.63 1.72 1.25 1.60 0.91 1.65
July 1977 1.99 2.43 1.54 1.82 1.65 1.73 1.26 1.63 0.94 1.67
Oct 1977 2.00 2.44 1.55 1.83 1.67 1.74 1.28 1.64 0.96 1.68
Jan 1978 2.29 2.44 1.97 1.93 2.03 1.74 1.54 1.98 1.16 1.90
April 1978 2.32 2.46 1.99 1.95 2.07 1.76 1.58 3.98 1.22 2.15
July 1978 2.30 2.45 2.14 1.94 2.05 1.75 1.56 3.95 1.18 2.15
Oct 1978 2.32 2.46 2.15 1.95 2.07 1.76 1.58 3.17 1.22 2.08
Jan 1979 2.41 2.59 2.28 2.05 2.08 1.76 1.67 3.35 1.29 2.17
April 1979 2.42 2.60 2.30 2.06 2.10 1.77 1.69 3.45 1.32 2.19
July 1979 2.43 2.61 2.31 2.07 2.12 1.78 1.70 3.49 1.34 2.21
Oct 1979 2.45 2.62 2.32 2.08 2.14 1.79 1.73 3.59 1.38 2.23
Jan 1980 2.46 2.63 2.46 2.09 2.16 1.80 1.75 3.67 1.41 2.27
April 1980 2.47 2.63 2.47 2.10 2.17 1.80 1.75 3.68 1.41 2.28
July 1980 2.68 2.86 2.68 2.28 2.35 1.92 1.88 2.78 <-------- 2.16
Oct 1980 2.70 2.87 2.70 2.29 2.39 1.94 1.89 2.82 2.45
Jan 1981 --------> 3.03 2.91 2.47 2.54 2.06 2.01 3.04 2.26
April 1981 3.05 2.94 2.49 2.58 2.07 2.03 3.09 2.61
July 1981 3.07 2.97 2.51 2.49 2.09 2.05 3.15 2.62
Oct 1981 3.10 3.01 2.54 2.51 2.12 2.07 3.24 2.66
Jan 1982 3.57 3.55 3.00 2.87 2.49 2.44 3.84 3.11
April 1982 3.64 3.63 3.08 2.95 2.56 2.52 4.09 3.21
July 1982 3.85 3.82 3.24 3.11 2.74 2.68 4.31 3.39
Oct 1982 3.84 3.82 3.24 3.10 2.73 2.68 4.29 3.39
Jan 1983 4.17 4.34 3.53 3.43 3.14 3.09 4.85 3.79
April 1983 4.16 4.33 3.52 3.42 3.13 3.08 4.82 3.78
July 1983 4.24 4.41 3.61 3.51 3.22 3.16 5.10 3.89
Oct 1983 4.24 4.41 3.61 3.51 3.22 3.16 5.10 3.89
Jan 1984 4.48 4.67 3.82 3.72 3.41 3.33 3.39 3.83
April 1984 4.46 4.64 3.80 3.69 3.39 3.36 3.36 3.82
July 1984 4.45 4.64 3.80 3.69 3.39 3.36 3.36 3.81
Oct 1984 4.46 4.64 3.80 3.69 3.39 3.36 3.36 3.82
AMALGAMATION AMALGAMATION
EASTERN CAPE NORTH WESTERN CAPE
UNDERTAKING UNDERTAKING
Jan 1985 4.84 4.26 3.78 3.74 3.79 4.08
April 1985 4.82 4.25 3.76 3.73 3.77 4.07
July 1985 4.86 4.28 3.80 3.76 3.81 4.10
Sept 1985 5.35 4.71 4.18 4.14 4.19 4.51
Oct 1985 5.36 4.72 4.17 4.15 4.20 4.52
ALL REGIONS
Jan 1986 4.72 4.72
July 1986 5.19 5.19
Jan 1987 5.81 5.81
July 1987 5.81 5.81
Jan 1988 6.39 6.39
Jan 1989 7.03 7.03
Jan 1990 8.02 8.02
Jan 1991 8.66 8.66
Oct (VAT) 1991 9.53 9.53

TABLE 33 - TARIFF B : EXAMPLE OF AN AVERAGE CUSTOMER ACCOUNT (IN RANDS) ASSUMING 55 AMPERE DEMAND,
2500 kW.h CONSUMPTION
UNDERTAKING CAPE BORDER ORANGE CAPE CAPE NATAL EASTERN RAND & OFS
EASTERN RIVER WESTERN NORTHERN TVL
DATEJan 1973 37.95 34.65 36.23 42.48 32.73 29.51 25.86 60.61April 1973 40.54 38.78 38.81 45.38 35.61 31.61 27.70 60.61July 1973 40.54 38.78 38.81 45.38 35.61 31.61 27.70 60.61Oct 1973 40.54 38.78 38.81 45.38 35.61 31.61 27.70 60.61Jan 1974 40.54 44.06 38.81 45.38 35.61 31.61 27.70 60.61April 1974 41.40 44.06 41.40 45.38 35.61 32.32 29.55 26.10July 1974 41.40 44.06 41.40 45.38 35.61 32.32 28.05 26.10Oct 1974 41.40 44.06 41.40 45.38 35.61 32.32 28.05 26.10Jan 1975 41.40 44.06 41.40 45.38 35.61 32.32 28.05 26.10April 1975 48.30 48.75 48.30 47.31 41.39 35.13 30.53 30.60July 1975 48.30 48.75 48.30 47.31 41.39 35.13 30.53 30.60Oct 1975 48.30 48.75 48.30 47.31 41.39 35.13 30.53 30.60Jan 1976 56.70 53.30 52.50 50.37 44.61 38.25 32.75 33.05April 1976 64.80 62.25 61.20 58.97 51.76 44.32 37.80 38.78July 1976 64.80 63.00 61.20 58.97 51.76 44.32 37.80 38.78Sept 1976 89.94 69.19 68.25 71.53 59.15 54.64 43.20 43.73Oct 1976 90.68 69.75 68.81 72.09 60.20 55.20 43.92 44.52Jan 1977 109.03 84.55 84.55 84.55 75.25 68.88 53.99 55.44April 1977 109.33 84.79 84.79 84.79 76.13 69.11 54.58 56.10July 1977 109.64 85.03 85.03 85.03 76.56 69.35 54.87 56.43Oct 1977 109.94 85.26 85.26 85.26 77.00 69.59 55.17 56.76Jan 1978 125.65 85.26 107.70 89.75 93.50 69.59 66.39 67.94April 1978 126.35 85.74 108.30 90.25 94.56 70.06 67.10 68.73July 1978 126.00 85.50 117.00 90.00 94.03 69.83 66.74 68.34Oct 1978 126.35 85.74 117.33 90.25 94.56 70.06 67.10 68.73Jan 1979 131.23 90.50 124.44 95.03 94.56 70.30 70.88 72.38April 1979 131.59 90.75 124.78 95.29 95.09 70.54 71.25 83.20July 1979 131.59 90.75 124.78 95.29 95.63 70.54 71.63 73.22Oct 1979 132.31 91.25 125.47 95.81 96.16 71.01 72.00 73.63Jan 1980 132.68 91.50 132.68 96.08 96.69 71.25 79.88 92.77April 1980 132.68 91.50 132.68 96.08 96.69 71.25 79.88 92.77July 1980 142.60 98.90 142.60 103.50 104.06 75.50 82.13 87.63Oct 1980 143.38 99.44 143.38 104.06 104.63 76.00 82.58 88.09Jan 1981 -------> 104.63 153.45 111.60 110.45 80.33 87.40 93.12April 1981 105.19 154.28 112.20 111.63 80.85 87.88 93.61July 1981 105.47 154.69 112.50 100.13 81.11 88.35 94.09Oct 1981 106.31 155.93 113.40 100.88 81.90 89.06 94.82Jan 1982 139.02 138.03 119.76 114.45 95.10 102.73 107.09April 1982 140.70 139.75 121.48 116.13 96.90 104.64 109.00July 1982 149.08 147.65 128.31 123.04 103.85 112.03 115.71Oct 1982 148.85 147.42 128.08 122.82 103.52 111.74 115.42Jan 1983 161.75 167.96 140.50 136.13 122.61 129.20 132.17April 1983 161.51 167.70 140.25 135.88 122.40 129.20 132.17July 1983 163.69 170.04 142.50 138.11 124.78 131.24 134.17Oct 1983 163.69 170.04 142.50 138.11 124.62 131.24 134.17Jan 1984 172.71 179.58 150.79 146.21 131.99 141.51 141.51April 1984 172.20 179.03 150.26 145.69 131.53 140.91 140.91July 1984 171.94 178.75 149.99 145.43 131.53 140.91 140.91Oct 1984 172.20 179.03 150.26 145.69 131.53 140.91 140.91
AMALGAMATION AMALGAMATIONEASTERN CAPE NORTHERN & WESTERN CAPEUNDERTAKING UNDERTAKING
Jan 1985 183.68 166.62 146.20 155.51 157.52April 1985 183.28 166.00 145.69 155.08 156.86July 1985 184.27 167.04 146.70 156.17 157.96Sept 1985 202.69 183.74 161.37 171.78 173.76Oct 1985 202.69 183.97 160.82 171.78 174.00
ALL REGIONSJan 1986 198.71July 1986 218.45Jan 1987 244.70July 1987 244.70Jan 1988 269.28Jan 1989 296.22Jan 1990 337.70Jan 1991 364.72Oct 1991 401.20

TABLE 34 - TARIFF B EXAMPLE ACCOUNT IN C/KW.H
Date
Cape Eastern
Undertakings
Border
Undertakings
Orange River
Undertakings
Cape Western
Undertakings
Cape Northen
Undertakings
Natal
Undertakings
Eastern TVL
Undertakings
Rand & OFS
Undertakings
Average
c/kWh
Jan 1973 1.52 1.39 1.45 1.70 1.31 1.18 1.03 2.42 1.50
April 1973 1.62 1.55 1.55 1.82 1.42 1.26 1.11 2.42 1.60
July 1973 1.62 1.55 1.55 1.82 1.42 1.26 1.11 2.42 1.60
Oct 1973 1.62 1.55 1.55 1.82 1.42 1.26 1.11 2.42 1.60
Jan 1974 1.62 1.76 1.55 1.82 1.42 1.26 1.11 2.42 1.62
April 1974 1.66 1.76 1.66 1.82 1.42 1.29 1.18 1.04 1.48
July 1974 1.66 1.76 1.66 1.82 1.42 1.29 1.12 1.04 1.47
Oct 1974 1.66 1.76 1.66 1.82 1.42 1.29 1.12 1.04 1.47
Jan 1975 1.66 1.76 1.66 1.82 1.42 1.29 1.12 1.04 1.47
April 1975 1.93 1.95 1.93 1.89 1.66 1.41 1.22 1.22 1.65
July 1975 1.93 1.95 1.93 1.89 1.66 1.41 1.22 1.22 1.65
Oct 1975 1.93 1.95 1.93 1.89 1.66 1.41 1.22 1.22 1.65
Jan 1976 2.27 2.13 2.10 2.01 1.78 1.53 1.31 1.32 1.81
April 1976 2.59 2.49 2.45 2.36 2.07 1.77 1.51 1.55 2.10
July 1976 2.59 2.52 2.45 2.36 2.07 1.77 1.51 1.55 2.10
Sept 1976 3.60 2.77 2.73 2.86 2.37 2.19 1.73 1.75 2.50
Oct 1976 3.63 2.79 2.75 2.88 2.41 2.21 1.76 1.78 2.53
Jan 1977 4.36 3.38 3.38 3.38 3.01 2.76 2.16 2.22 3.08
April 1977 4.37 3.39 3.39 3.39 3.05 2.76 2.18 2.24 3.10
July 1977 4.39 3.40 3.40 3.40 3.06 2.77 2.19 2.26 3.11
Oct 1977 4.40 3.41 3.41 3.41 3.08 2.78 2.21 2.27 3.12
Jan 1978 5.03 3.41 4.31 3.59 3.74 2.78 2.66 2.72 3.53
April 1978 5.05 3.43 4.33 3.61 3.78 2.80 2.68 2.75 3.56
July 1978 5.04 3.42 4.68 3.60 3.76 2.79 2.67 2.73 3.59
Oct 1978 5.05 3.43 4.69 3.61 3.78 2.80 2.68 2.75 3.60
Jan 1979 5.25 3.62 4.98 3.80 3.78 2.81 2.84 2.90 3.75
April 1979 5.26 3.63 4.99 3.81 3.80 2.82 2.85 3.33 3.81
July 1979 5.26 3.63 4.99 3.81 3.83 2.82 2.87 2.93 3.77
Oct 1979 5.29 3.65 5.02 3.83 3.85 2.84 2.88 2.95 3.79
Jan 1980 5.31 3.66 5.31 3.84 3.87 2.85 3.20 3.71 3.97
April 1980 5.31 3.66 5.31 3.84 3.87 2.85 3.20 3.71 3.97
July 1980 5.70 3.96 5.70 4.14 4.16 3.02 3.29 3.51 4.18
Oct 1980 5.74 3.98 5.74 4.16 4.19 3.04 3.30 3.52 4.21
Jan 1981 -------> 4.19 6.14 4.46 4.42 3.21 3.50 3.72 3.70
April 1981 4.21 6.17 4.49 4.47 3.23 3.52 3.74 4.26
July 1981 4.22 6.19 4.50 4.01 3.24 3.53 3.76 4.21
Oct 1981 4.25 6.24 4.54 4.04 3.28 3.56 3.79 4.24
Jan 1982 5.56 5.52 4.79 4.58 3.80 4.11 4.28 4.66
April 1982 5.63 5.59 4.86 4.65 3.88 4.19 4.36 4.73
July 1982 5.96 5.91 5.13 4.92 4.15 4.48 4.63 5.03
Oct 1982 5.95 5.90 5.12 4.91 4.14 4.47 4.62 5.02
Jan 1983 6.47 6.72 5.62 5.45 4.90 5.17 5.29 5.66
April 1983 6.46 6.71 5.61 5.44 4.90 5.17 5.29 5.65
July 1983 6.55 6.80 5.70 5.52 4.99 5.25 5.37 5.74
Oct 1983 6.55 6.80 5.70 5.52 4.98 5.25 5.37 5.74
Jan 1984 6.91 7.18 6.03 5.85 5.28 5.66 5.66 6.08
April 1984 6.89 7.16 6.01 5.83 5.26 5.64 5.64 6.06
July 1984 6.88 7.15 6.00 5.82 5.26 5.64 5.64 6.05
Oct 1984 6.89 7.16 6.01 5.83 5.26 5.64 5.64 6.06
Amalgamation Amalgamation
Cape Eastern
Undertakings
Northen & Western Cape
Undertakings
Jan 1985 7.35 6.66 5.85 6.22 6.30 6.48
April 1985 7.33 6.64 5.83 6.20 6.27 6.46
July 1985 7.37 6.68 5.87 6.25 6.32 6.50
Sept 1985 8.11 7.35 6.45 6.87 6.95 7.15
Oct 1985 8.11 7.36 6.43 6.87 6.96 7.15
ALL REGIONS
Jan 1986 7.95 7.95
July 1986 8.74 8.74
Jan 1987 9.79 9.79
July 1987 9.79 9.79
Jan 1988 10.77 10.77
Jan 1989 11.85 11.85
Jan 1990 13.51 13.51
Jan 1991 14.59 14.59
Oct 1991 16.05 16.05

TABLE 35 - TARIFF C : EXAMPLE OF AN AVERAGE CUSTOMER ACCOUNT
(ALTERNATIVE (a) - FLAT RATE TARIFF (SEE NOTES))
UNDERTAKING CAPE BORDER ORANGE CAPE CAPE NATAL EASTERN RAND & OFS
EASTERN RIVER WESTERN NORTHERN TVL
DATE R R R R R R R R R
Jan 1973 33.61 32.08 34.65 22.52 34.47 29.87 15.39 22.50 28.14
April 1973 35.90 35.90 37.13 24.05 37.51 32.01 16.49 24.00 30.37
July 1973 35.90 35.90 37.13 24.05 37.51 32.01 16.49 24.00 30.37
Oct 1973 35.90 35.90 37.13 24.05 37.51 32.01 16.49 24.00 30.37
Jan 1974 35.90 35.90 37.13 24.05 37.51 32.01 16.49 24.00 30.37
April 1974 36.66 35.90 39.60 24.05 37.51 32.72 17.59 8.09 29.01
July 1974 36.66 35.90 39.60 24.05 37.51 32.72 5.36 8.09 27.49
Oct 1974 36.66 35.90 39.60 24.05 37.51 32.72 5.36 8.09 27.49
Jan 1975 36.66 35.90 39.60 24.05 37.51 32.72 7.91 8.09 27.80
April 1975 42.77 39.72 46.20 25.08 43.59 35.56 8.60 9.49 31.38
July 1975 42.77 39.72 46.20 25.08 43.59 35.56 8.60 9.49 31.38
Oct 1975 42.77 39.72 46.20 25.08 43.59 35.56 8.60 9.49 31.38
Jan 1976 42.77 39.72 46.20 25.08 43.59 35.56 8.71 9.61 31.40
April 1976 48.88 45.83 52.80 28.66 49.67 40.54 9.92 11.10 35.93
July 1976 48.88 45.83 52.80 28.66 49.67 40.54 9.92 11.10 35.93
Sept 1976 22.21 17.09 17.09 14.39 56.77 14.20 11.34 12.52 20.70
Oct 1976 22.33 17.18 17.18 14.48 56.77 14.29 11.38 12.56 20.77
Jan 1977 28.05 21.76 21.76 18.34 70.96 18.10 13.98 15.64 26.07
April 1977 28.10 21.79 21.79 18.37 70.96 18.14 14.01 15.68 26.11
July 1977 28.15 21.83 21.83 18.41 70.96 18.17 14.03 15.69 26.13
Oct 1977 28.20 21.87 21.87 18.45 70.96 18.21 14.04 15.71 26.16
Jan 1978 32.23 21.87 27.62 19.42 86.17 18.21 16.90 18.80 30.15
April 1978 32.34 21.95 27.72 19.50 86.17 18.29 16.93 18.84 30.22
July 1978 32.28 21.91 29.98 19.46 86.17 18.25 16.92 18.82 30.47
Oct 1978 32.34 21.95 30.03 19.50 86.17 18.29 16.93 18.84 30.51
Jan 1979 33.55 23.14 31.82 20.52 86.17 18.33 17.89 19.84 31.41
April 1979 33.61 23.18 31.87 20.56 86.17 18.36 17.91 26.10 32.22
July 1979 33.61 23.18 31.87 20.56 86.17 18.36 17.93 19.88 31.45
Oct 1979 33.73 23.26 31.98 20.64 86.17 18.44 17.94 19.91 31.51
Jan 1980 33.79 23.30 33.79 20.69 86.17 18.48 21.71 26.17 33.01
April 1980 33.79 23.30 33.79 20.69 86.17 18.48 21.71 26.17 33.01
July 1980 36.24 25.13 36.24 22.25 91.24 19.53 20.16 22.63 34.18
Oct 1980 36.36 25.22 36.36 22.34 91.24 19.61 20.23 22.71 34.26
Jan 1981 -------> 26.48 38.84 23.93 95.29 20.67 21.39 23.98 31.32
April 1981 26.57 38.97 24.02 95.29 20.76 21.47 24.06 35.88
July 1981 26.62 39.04 24.07 23.54 20.80 21.55 24.13 25.68
Oct 1981 26.75 39.24 24.22 23.66 20.93 21.66 24.25 25.81
Jan 1982 31.77 31.84 25.90 26.73 24.16 24.94 27.34 27.52
April 1982 32.04 32.11 26.18 27.00 24.44 25.24 27.64 27.81
July 1982 33.94 33.94 27.66 28.60 26.23 27.05 29.37 29.54
Oct 1982 33.91 33.91 27.63 28.57 26.17 27.00 29.32 29.50
Jan 1983 36.88 38.67 30.32 31.70 29.43 31.28 33.64 33.13
April 1983 36.84 38.63 30.28 31.66 29.39 31.28 33.64 33.10
July 1983 37.19 39.00 30.64 32.02 29.77 31.61 33.96 33.46
Oct 1983 37.19 39.00 30.64 32.02 29.68 31.61 33.96 33.44
Jan 1984 39.26 41.21 32.44 33.92 31.49 35.31 35.31 35.56
April 1984 39.18 41.12 32.35 33.83 31.42 35.21 35.21 35.47
July 1984 39.13 41.07 32.31 33.79 31.42 35.21 35.21 35.45
Oct 1984 39.18 41.12 32.35 33.83 31.42 35.21 35.21 35.47
AMALGAMATION AMALGAMATION
EASTERN CAPE NORTHERN & WESTERN CAPE
UNDERTAKING UNDERTAKING
Jan 1985 40.90 37.09 34.85 38.74 39.22 38.16
April 1985 40.84 36.99 34.76 38.67 39.12 38.08
July 1985 40.99 37.16 34.93 38.85 39.29 38.24
Sept 1985 45.09 40.88 38.42 42.73 43.22 42.07
Oct 1985 45.09 40.91 38.33 42.73 43.26 42.06
ALL REGIONS
Jan 1986 65.87 65.87
July 1986 72.41 72.41
Jan 1987 81.11 81.11
July 1987 81.25 81.25
Jan 1988 89.38 89.38
Jan 1989 98.34 98.34
Jan 1990 112.10 112.10
Jan 1991 121.07 121.07
Oct (VAT) 1991 133.17 133.17

TABLE 36 - TARIFF C : EXAMPLE OF AN AVERAGE CUSTOMER ACCOUNT - c/kW.h
(ALTERNATIVE (a) - FLAT RATE TARIFF (SEE NOTES))
UNDERTAKING CAPE BORDER ORANGE CAPE CAPE NATAL EASTERN RAND & OFS AVERAGE
EASTERN RIVER WESTERN NORTHERN TVL
DATE
Jan 1973 8.40 8.02 8.66 5.63 8.62 7.47 3.85 5.63 7.03
April 1973 8.97 8.97 9.28 6.01 9.38 8.00 4.12 6.00 7.59
July 1973 8.97 8.97 9.28 6.01 9.38 8.00 4.12 6.00 7.59
Oct 1973 8.97 8.97 9.28 6.01 9.38 8.00 4.12 6.00 7.59
Jan 1974 8.97 8.97 9.28 6.01 9.38 8.00 4.12 6.00 7.59
April 1974 9.17 8.97 9.90 6.01 9.38 8.18 4.40 2.02 7.25
July 1974 9.17 8.97 9.90 6.01 9.38 8.18 1.34 2.02 6.87
Oct 1974 9.17 8.97 9.90 6.01 9.38 8.18 1.34 2.02 6.87
Jan 1975 9.17 8.97 9.90 6.01 9.38 8.18 1.98 2.02 6.95
April 1975 10.69 9.93 11.55 6.27 10.90 8.89 2.15 2.37 7.84
July 1975 10.69 9.93 11.55 6.27 10.90 8.89 2.15 2.37 7.84
Oct 1975 10.69 9.93 11.55 6.27 10.90 8.89 2.15 2.37 7.84
Jan 1976 10.69 9.93 11.55 6.27 10.90 8.89 2.18 2.40 7.85
April 1976 12.22 11.46 13.20 7.16 12.42 10.14 2.48 2.78 8.98
July 1976 12.22 11.46 13.20 7.16 12.42 10.14 2.48 2.78 8.98
Sept 1976 5.55 4.27 4.27 3.60 14.19 3.55 2.84 3.13 5.17
Oct 1976 5.58 4.29 4.29 3.62 14.19 3.57 2.84 3.14 5.19
Jan 1977 7.01 5.44 5.44 4.58 17.74 4.52 3.50 3.91 6.52
April 1977 7.03 5.45 5.45 4.59 17.74 4.53 3.50 3.92 6.53
July 1977 7.04 5.46 5.46 4.60 17.74 4.54 3.51 3.92 6.53
Oct 1977 7.05 5.47 5.47 4.61 17.74 4.55 3.51 3.93 6.54
Jan 1978 8.06 5.47 6.91 4.86 21.54 4.55 4.22 4.70 7.54
April 1978 8.09 5.49 6.93 4.88 21.54 4.57 4.23 4.71 7.55
July 1978 8.07 5.48 7.49 4.87 21.54 4.56 4.23 4.71 7.62
Oct 1978 8.09 5.49 7.51 4.88 21.54 4.57 4.23 4.71 7.63
Jan 1979 8.39 5.79 7.95 5.13 21.54 4.58 4.47 4.96 7.85
April 1979 8.40 5.80 7.97 5.14 21.54 4.59 4.48 6.53 8.06
July 1979 8.40 5.80 7.97 5.14 21.54 4.59 4.48 4.97 7.86
Oct 1979 8.43 5.82 8.00 5.16 21.54 4.61 4.49 4.98 7.88
Jan 1980 8.45 5.83 8.45 5.17 21.54 4.62 5.43 6.54 8.25
April 1980 8.45 5.83 8.45 5.17 21.54 4.62 5.43 6.54 8.25
July 1980 9.06 6.28 9.06 5.56 22.81 4.88 5.04 5.66 8.54
Oct 1980 9.09 6.30 9.09 5.59 22.81 4.90 5.06 5.68 8.56
Jan 1981 -------> 6.62 9.71 5.98 23.82 5.17 5.35 5.99 7.83
April 1981 6.64 9.74 6.01 23.82 5.19 5.37 6.01 8.97
July 1981 6.65 9.76 6.02 5.88 5.20 5.39 6.03 6.42
Oct 1981 6.69 9.81 6.05 5.91 5.23 5.42 6.06 6.45
Jan 1982 7.94 7.96 6.48 6.68 6.04 6.23 6.83 6.88
April 1982 8.01 8.03 6.54 6.75 6.11 6.31 6.91 6.95
July 1982 8.49 8.49 6.92 7.15 6.56 6.76 7.34 7.39
Oct 1982 8.48 8.48 6.91 7.14 6.54 6.75 7.33 7.38
Jan 1983 9.22 9.67 7.58 7.92 7.36 7.82 8.41 8.28
April 1983 9.21 9.66 7.57 7.92 7.35 7.82 8.41 8.28
July 1983 9.30 9.75 7.66 8.00 7.44 7.90 8.49 8.36
Oct 1983 9.30 9.75 7.66 8.00 7.42 7.90 8.49 8.36
Jan 1984 9.81 10.30 8.11 8.48 7.87 8.83 8.83 8.89
April 1984 9.79 10.28 8.09 8.46 7.86 8.80 8.80 8.87
July 1984 9.78 10.27 8.08 8.45 7.86 8.80 8.80 8.86
Oct 1984 9.79 10.28 8.09 8.46 7.86 8.80 8.80 8.87
AMALGAMATION AMALGAMATION
EASTERN CAPE NORTHERN & WESTERN CAPE
UNDERTAKING UNDERTAKING
Jan 1985 10.22 9.27 8.71 9.69 9.81 9.54
April 1985 10.21 9.25 8.69 9.67 9.78 9.52
July 1985 10.25 9.29 8.73 9.71 9.82 9.56
Sept 1985 11.27 10.22 9.60 10.68 10.81 10.52
Oct 1985 11.27 10.23 9.58 10.68 10.81 10.52
ALL REGIONS
Jan 1986 8.78 8.78
July 1986 9.65 9.65
Jan 1987 10.81 10.81
July 1987 10.83 10.83
Jan 1988 11.92 11.92
Jan 1989 13.11 13.11
Jan 1990 14.95 14.95
Jan 1991 16.14 16.14
Oct (VAT) 1991 17.76 17.76

TABLE 37 - TARIFF D : EXAMPLE OF AN AVERAGE CUSTOMER ACCOUNT USING 1 500 kW.h
UNDERTAKING BORDER ORANGE RIVER CAPE WESTERN CAPE NORTHERN NATAL E ASTERN TVL RAND & OFS AVERAGE
DATE R R R R R R R R
Jan 1982 101.30 101.14 90.17 84.04 73.80 76.90 82.57 87.13
April 1982 102.31 102.17 91.20 85.05 74.88 78.04 83.71 88.20
July 1982 108.40 107.97 96.37 90.11 80.30 83.60 88.91 93.67
Oct 1982 108.27 107.84 96.23 89.98 80.11 83.42 88.74 93.51
Jan 1983 117.71 122.93 105.60 99.79 91.99 96.56 101.73 105.19
April 1983 117.56 122.77 105.45 99.64 91.86 96.56 101.73 105.08
July 1983 118.87 124.18 106.80 100.98 93.29 97.78 102.93 106.40
Oct 1983 118.87 124.18 106.80 100.98 93.03 97.78 102.93 106.37
Jan 1984 125.46 131.18 113.05 106.94 98.68 107.76 107.76 112.98
April 1984 125.15 130.85 112.73 106.63 98.41 107.40 107.40 112.65
July 1984 125.00 130.68 112.57 106.47 98.41 107.40 107.40 112.56
Oct 1984 125.15 130.85 112.73 106.63 98.41 107.40 107.40 112.65
AMALGAMATION AMALGAMATION
EASTERN CAPE NORTHERN & WESTERN CAPE
UNDERTAKING UNDERTAKING
Jan 1985 133.65 124.51 109.23 118.32 119.81 121.11
April 1985 133.42 124.13 108.93 118.06 119.42 120.79
July 1985 134.01 124.76 109.53 118.71 120.08 121.42
Sept 1985 147.21 137.03 120.49 130.58 132.08 133.48
Oct 1985 147.21 137.17 120.15 130.58 132.23 133.47
ALL REGIONS
Jan 1986 171.15 171.15
July 1986 188.18 188.18
Jan 1987 210.76 210.76
July 1987 210.76 210.76
Jan 1988 231.88 231.88
Jan 1989 255.10 255.10
Jan 1990 290.82 290.82
Jan 1991 314.08 314.08
Oct (VAT) 1991 345.50 345.50

SECTION 6
CONCLUSION & REFERENCES
The Eskom tariff structures have undergone far-reaching changes over the past 20 years. The field of pricing policy cannot afford to be static and must be responsive to market needs. Eskom's Pricing Policy Department is striving to address the customers' needs in various ways. As further knowledge about electricity pricing is acquired, and more information becomes available regarding pricing practices of other electricity supply utilities around the world, there will be further refinements to the Eskom tariff structures.
ACKNOWLEDGEMENT Many thanks are extended to Mr R J Baasch for his kind assistance in compiling this Tariff History. Enquiries: Hendrik Barnard 800-4519 Shirley Mc Dougall 800-3058
REFERENCES
Econostat 91
Eskom Annual Reports
Eskom Statistical Yearbook 1990
Eskom Internal Quarterly Publication of Tariffs (1982 - 1987)
Government Gazette annual publications of Eskom Schedule of Standard Prices (1973 to 1989)
Reports written by R J Baasch during 1985 regarding the De Villiers Commission of Inquiry