eskom 2018/19 revenue application - nersa10).pdf · eskom sales declining due to a combination of...
TRANSCRIPT

Eskom 2018/19
Revenue Application
Nersa Public Hearings
30 October 2017

Where we are coming from
• This revenue application is being made for the year 2018/19, after the EnergyRegulator maintained its revenue decision made in 2013 for the 2017/18 year, whereit approved total allowable revenue of R205 billion.
• The allowed revenue resulted in an average increase of 2.2% due to baseadjustments made in preceding years following approved RCA balances for Eskom(12.69% for 2015/16 for MYPD2 and 9.4% for 2016/17 for first year of MYPD3).
• The 2.2% average increase resulted in consumers receiving an effective decrease inelectricity prices, in a situation where costs to produce electricity are increasing.
• Eskom, in this revenue application for the 2018/19 year has applied the NERSA MYPDmethodology of 2016, with a phasing-in of return on assets being applied
• Allowed revenue and price adjustments decisions will be applicable from 1 April 2018
• This revenue application does not include any RCA applications for the MYPD 3period. Eskom understands that NERSA will process RCAs for years 2, 3 and 4 of theMYPD 3 period at a later stage. The adjustments will be applicable from 1 April 2019onwards in a phased manner
1

Eskom’s revenue application is completed within the legislative and NERSA’s regulatory framework
2
Electricity Pricing
Policy (EPP)
Electricity Regulation
Act (ERA)
Municipal Finance
Management Act
(MFMA)
Multi-Year Price
Determination (MYPD)
Methodology
Eskom Retail Tariff &
Structural Adjustment
(ERTSA) Methodology
Provides guidelines to NERSA in approving prices and tariffs for the
electricity supply industry
• Enable an efficient licensee to recover full cost of its licensed activities,
including a reasonable margin
• Avoid undue discrimination between customer categories
• May permit cross subsidy of tariffs
• Only implement tariffs determined by NERSA
• Eskom consults with SALGA & National Treasury prior to submission to
NERSA
• Municipal tariffs tabled in Parliament by 15 Mar for 1 July
implementation
• Determines allowable revenue (AR) for efficient costs and fair return
where 𝐴𝑅 = (𝑅𝐴𝐵×𝑊𝐴𝐶𝐶)+𝐸+𝑃𝐸+𝐷+𝑅&𝐷+𝐼𝐷𝑀±𝑆𝑄𝐼+𝐿&𝑇±𝑅𝐶𝐴• RCA not included in this revenue application
• Allows for NERSA determined allowed revenue to be recovered by the
assumed volume of sales for each year of the revenue period.
• Determines rate adjustments to tariffs applicable to customer groups
and schedule of standard prices applicable to different Eskom tariffs
Notes: Regulatory asset base (RAB); Primary energy (PE); Service Quality incentives (SQI); Expenditure (E); Levies & Taxes (L&T);
Research & Development (R&D); Weighted Average Cost of Capital (WACC); Integrated Demand Management (IDM); Regulatory Clearing
Account (RCA)
Framework Requirements

Electricity Regulation Act is basis of Eskom’s revenue application
In accordance with the Electricity Regulation Act (ERA)
Nersa must:
Enable an efficient licensee to recover the full cost of its licensed activities, including a reasonable margin or return;
Eskom has applied for a revenue that corresponds to
– efficient costs related to it’s licensed activities and
– a phased return that migrates towards a reasonable return
– The phasing-in of the return is in accordance with the previous Nersa decisions
This link between the legislative requirement to Eskom’s revenue application is the Multi-Year Price Determination (MYPD) methodology
3
Depreciation
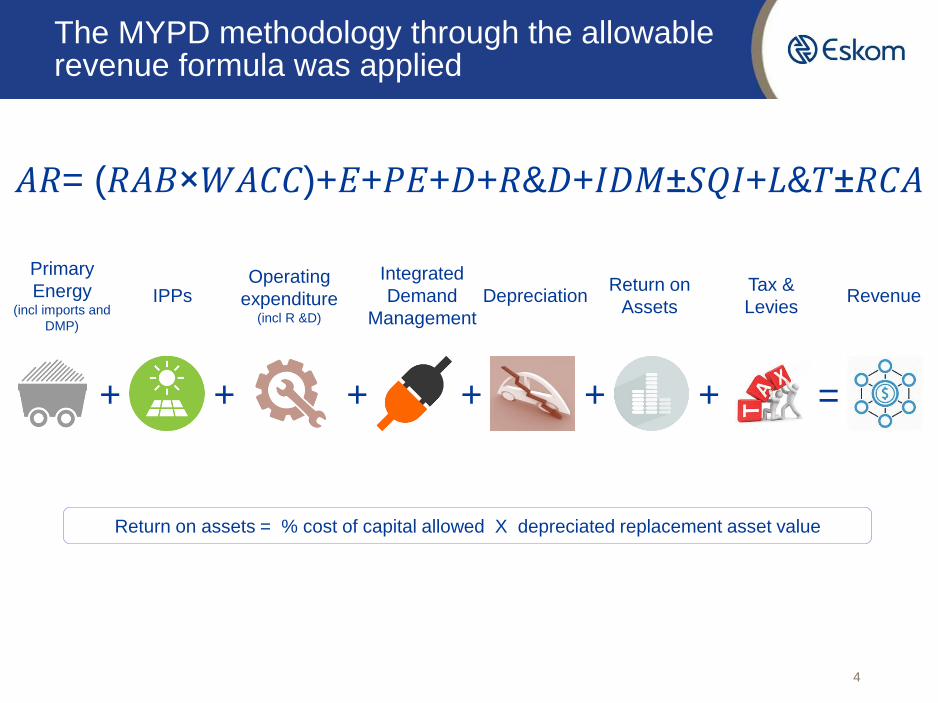
The MYPD methodology through the allowable revenue formula was applied
4
+ + + + + =
Primary
Energy(incl imports and
DMP)
IPPsOperating
expenditure(incl R &D)
Integrated
Demand
Management
Return on
AssetsRevenue
+
Tax &
Levies
Return on assets = % cost of capital allowed X depreciated replacement asset value
𝐴𝑅= (𝑅𝐴𝐵×𝑊𝐴𝐶𝐶)+𝐸+𝑃𝐸+𝐷+𝑅&𝐷+𝐼𝐷𝑀±𝑆𝑄𝐼+𝐿&𝑇±𝑅𝐶𝐴
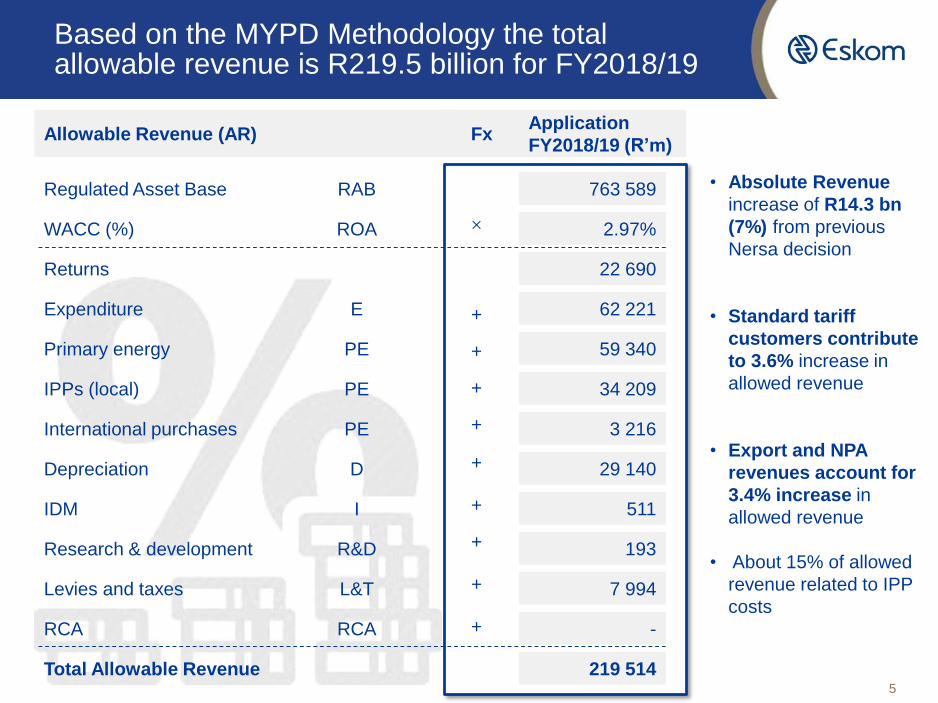
Based on the MYPD Methodology the total allowable revenue is R219.5 billion for FY2018/19
5
• Absolute Revenue
increase of R14.3 bn
(7%) from previous
Nersa decision
• Standard tariff
customers contribute
to 3.6% increase in
allowed revenue
• Export and NPA
revenues account for
3.4% increase in
allowed revenue
• About 15% of allowed
revenue related to IPP
costs
Regulated Asset Base
WACC (%)
Returns
Expenditure
Primary energy
IPPs (local)
International purchases
Depreciation
IDM
Research & development
Levies and taxes
RCA
Total Allowable Revenue
763 589
2.97%
22 690
62 221
59 340
34 209
3 216
29 140
511
193
7 994
-
219 514
×
+
+
+
+
+
+
+
+
+
RAB
ROA
E
PE
PE
PE
D
I
R&D
L&T
RCA
Allowable Revenue (AR) Application
FY2018/19 (R’m)Fx
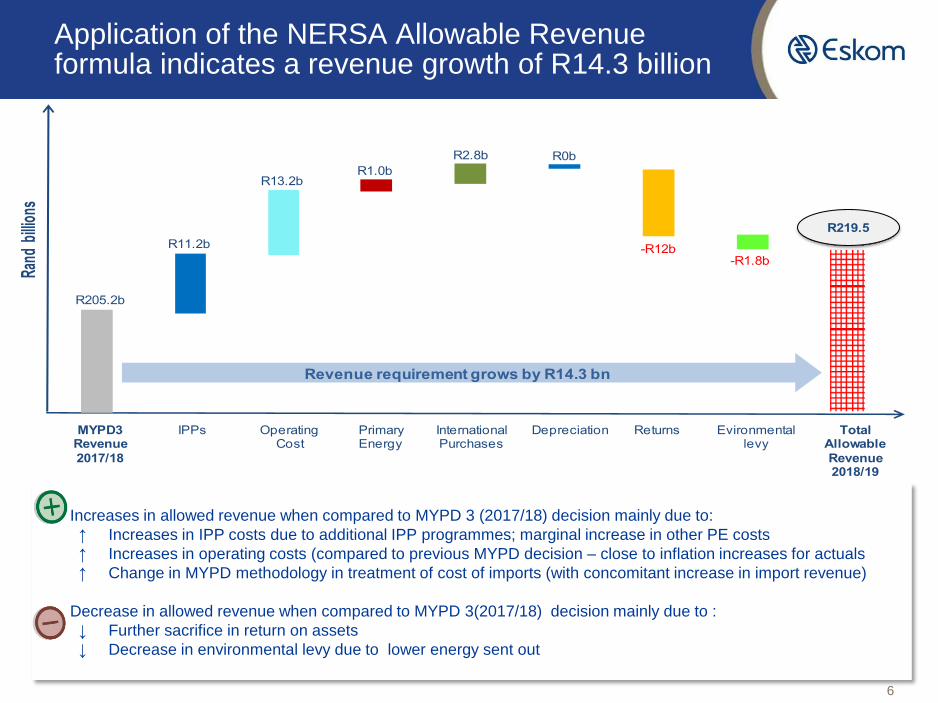
Application of the NERSA Allowable Revenue formula indicates a revenue growth of R14.3 billion
6
Increases in allowed revenue when compared to MYPD 3 (2017/18) decision mainly due to:
↑ Increases in IPP costs due to additional IPP programmes; marginal increase in other PE costs
↑ Increases in operating costs (compared to previous MYPD decision – close to inflation increases for actuals
↑ Change in MYPD methodology in treatment of cost of imports (with concomitant increase in import revenue)
Decrease in allowed revenue when compared to MYPD 3(2017/18) decision mainly due to :
↓ Further sacrifice in return on assets
↓ Decrease in environmental levy due to lower energy sent out
R219.5
MYPD3Revenue
2017/18
IPPs Operating Cost
Primary Energy
InternationalPurchases
R11.2b
Depreciation Returns Total Allowable
Revenue2018/19
Evironmentallevy
Rand
billi
ons
R205.2b
R13.2bR1.0b
R2.8b R0b
-R12b-R1.8b
Revenue requirement grows by R14.3 bn
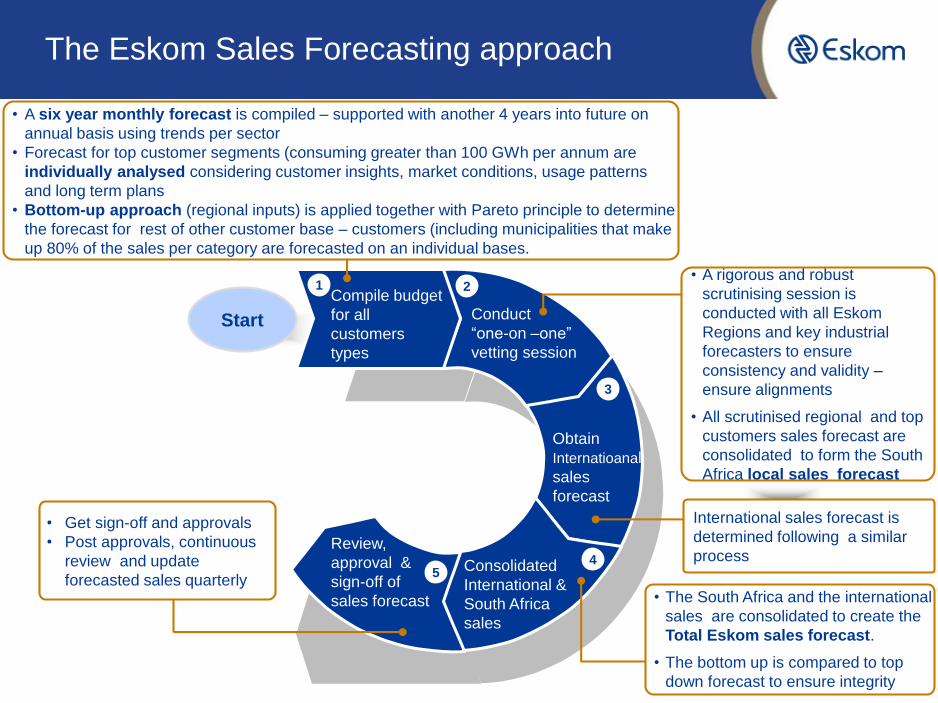
Start
• A six year monthly forecast is compiled – supported with another 4 years into future on
annual basis using trends per sector
• Forecast for top customer segments (consuming greater than 100 GWh per annum are
individually analysed considering customer insights, market conditions, usage patterns
and long term plans
• Bottom-up approach (regional inputs) is applied together with Pareto principle to determine
the forecast for rest of other customer base – customers (including municipalities that make
up 80% of the sales per category are forecasted on an individual bases.
• A rigorous and robust
scrutinising session is
conducted with all Eskom
Regions and key industrial
forecasters to ensure
consistency and validity –
ensure alignments
• All scrutinised regional and top
customers sales forecast are
consolidated to form the South
Africa local sales forecast
International sales forecast is
determined following a similar
process
• The South Africa and the international
sales are consolidated to create the
Total Eskom sales forecast.
• The bottom up is compared to top
down forecast to ensure integrity
1 2
3
45
Compile budget
for all
customers
types
Conduct
“one-on –one”
vetting session
Obtain
Internatioanal
sales
forecast
Consolidated
International &
South Africa
sales
Review,
approval &
sign-off of
sales forecast
The Eskom Sales Forecasting approach
• Get sign-off and approvals
• Post approvals, continuous
review and update
forecasted sales quarterly
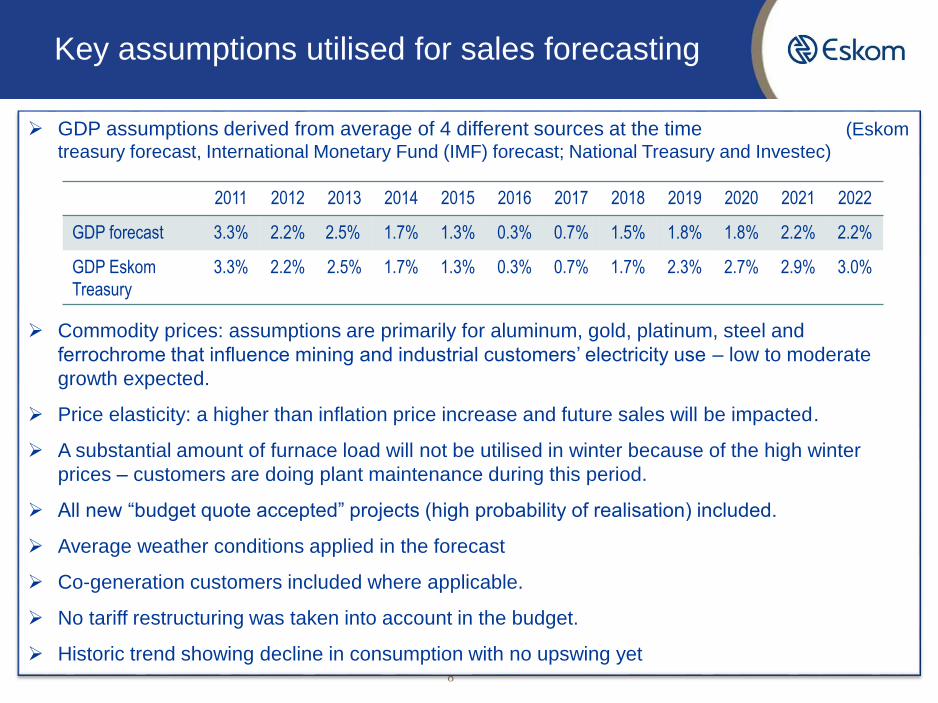
Key assumptions utilised for sales forecasting
8
GDP assumptions derived from average of 4 different sources at the time (Eskom
treasury forecast, International Monetary Fund (IMF) forecast; National Treasury and Investec)
Commodity prices: assumptions are primarily for aluminum, gold, platinum, steel and
ferrochrome that influence mining and industrial customers’ electricity use – low to moderate
growth expected.
Price elasticity: a higher than inflation price increase and future sales will be impacted.
A substantial amount of furnace load will not be utilised in winter because of the high winter
prices – customers are doing plant maintenance during this period.
All new “budget quote accepted” projects (high probability of realisation) included.
Average weather conditions applied in the forecast
Co-generation customers included where applicable.
No tariff restructuring was taken into account in the budget.
Historic trend showing decline in consumption with no upswing yet
2011 2012 2013 2014 2015 2016 2017 2018 2019 2020 2021 2022
GDP forecast 3.3% 2.2% 2.5% 1.7% 1.3% 0.3% 0.7% 1.5% 1.8% 1.8% 2.2% 2.2%
GDP Eskom
Treasury
3.3% 2.2% 2.5% 1.7% 1.3% 0.3% 0.7% 1.7% 2.3% 2.7% 2.9% 3.0%

Declining sales trend over MYPD 3 period indicates requirements to rebase sales (technical correction)
9
MYPD3 Sales Decision
Realistic Forecast

Eskom sales declining due to a combination of reasons
10
Although still on par with average international electricity prices, Eskom lost competitive
electricity price advantage (previously lowest cost producer) with recent high price
increases
With the Eskom load shedding there was huge pressure on customers to increase
electricity efficiency; together with load reduction programmes - leading to a decrease in
reliance on Eskom electricity and permanently lost sales (also co-generation)
World economic markets lead to a drop in commodity prices and hence markets for
products for large users - closure of industrial & manufacturing customers; or
plants/shafts
Energy intensive users are mostly global companies who decide on utilisation of plants
from a global perspective – rather using plants with the lowest production unit cost in
countries with the least uncertainty (total package and not only electricity prices)
• all plant capacities not fully utilized
• consideration given to a combination of various aspects of business value chain including skills,
labour stability and costs, transport, infrastructure, etc
• need to compete with countries where Government provides support in the form of incentives
Low investor confidence in South Africa due to political instability, policy certainty,
Government support, ease of doing business and risk management
SA as a country has internationally lost competitiveness
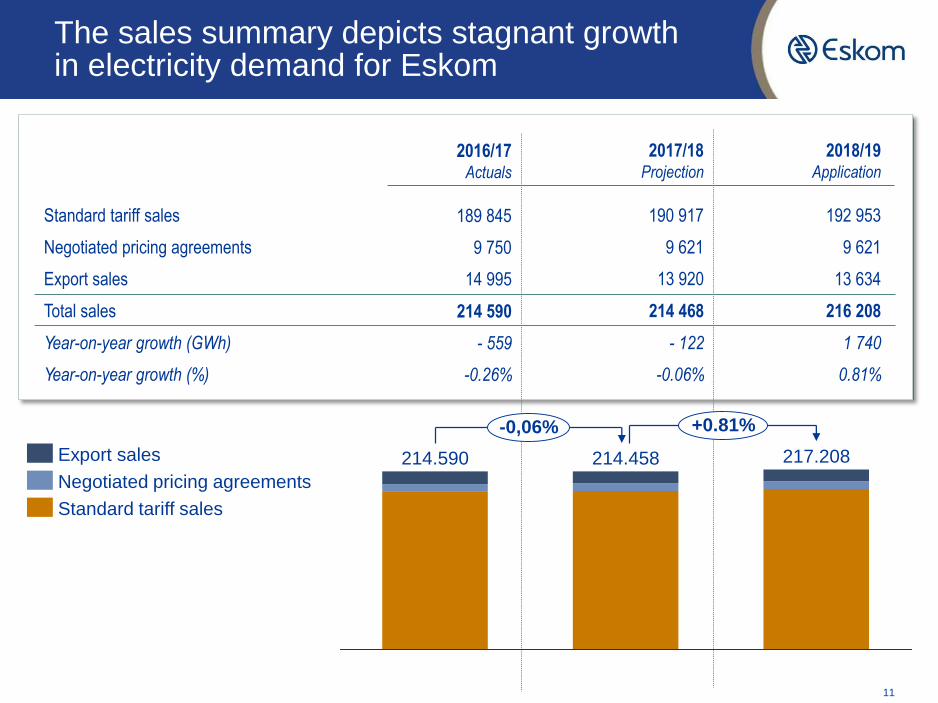
The sales summary depicts stagnant growth in electricity demand for Eskom
11
Standard tariff sales
Negotiated pricing agreements
Export sales
190 917
Total sales 214 468
192 953
9 621
13 634
216 208
2017/18Projection
2018/19Application
9 621
13 920
189 845
214 590
2016/17Actuals
9 750
14 995
Year-on-year growth (GWh) - 122 1 740- 559
Year-on-year growth (%) -0.06% 0.81%-0.26%
214.590
+0.81%-0,06%
214.458 217.208
Standard tariff sales
Negotiated pricing agreements
Export sales

In order to increase sales volumes Eskom has implemented a local demand stimulation strategy
12

Electricity price impact in 2018/19
Standard tariff revenue has increased by R7 251 million which equates to revenue increase of 3.6% from NERSA’s decision for the 2017/18 year.
As the revenue is recouped from a lower sales volume, the overall price increase required is 19.9% for 2018/19.
The 19.9% average increase translates to a 1 July 2018 local-authority tariff increase of 27.5% to municipalities.
– Municipalities continue to pay at the 2017/18 rates for the period 1 April 2018 to 30 June 2018.
– This is due to the Municipal Finance Management Act (MFMA) requiring Municipal tariff changes to be made only from 1 July each year.
13
Standard tariff revenue
Standard tariff sales volumes
Standard tariff price
198 954
Standard tariff price adjustment 2.2%
206 205
192 953
106.87
19.9%
2017/18 2018/19
223 217
89.13
R’m
%
Unit
GWh
c/kWH
Standard tariff

Factors influencing the overall price increase
14
19.9%
30
26
5
GW
hR
26
97
4m R
10
81
2m
Vo
Gro
Sales volumes
rebasing
IPPs International Purchases
9.4%
5.5%
1.4% 16.3%
Price before operating costs
changes
Generationown PE costs
7.0% 0.5% 23.8%
Opex Price after operating
costs
-6.0%
Adjustments Operating costs Depr , Returns , SPAs & Exports
Overall Price
Increase
Pri
ce Im
pact
%
SPAs &Exports
2.1%
Depr &Returns
With average 2.2% increase in 2017/18 and 19.9% proposed average increase in 2018/19
Average for two years is 11%

Even with a 0% increase in Allowable Revenue - rebasing of sales from MYPD 3 results in a 9.4% price increase
15
• The ERTSA methodology does not adjust for volume changes during a MYPD cycle
• It is only at the next cycle that adjustments can be made
• Thus the sales volume gap of about 30TWh would need to be implemented in the 2018/19 decision
• Assuming the same allowed revenue in 2018/19 as was for 2017/18; recovered over lower volume (of
30TWh) results in 9.4% price increase (after primary energy savings) – will not be extreme next time
• MYPD methodology requires recovery of allowed revenue (consisting of fixed and variable costs)
through assumed sales volume
• If sales volume drop the related fixed costs are not recovered (primary energy costs are saved)
• The converse is true if the sales volume is higher than assumed
• Sunk and fixed costs cannot be concomitantly contracted – is nature of electricity industry
22
3.2
19
19
0 9
17
20
6.4
12
20
8.4
42
2015/162013/14 2016/172014/15 2017/18
21
3.5
45
19
4.7
62
19
5.2
58
19
2.0
89
18
9.8
45
21
8.1
94
GWhAct/Proj Std
Tariff sales
MYPD 3
Sales DecisionStandard tariff revenue as at FY18
Savings on PE due to lower sales
Revised standard tariff for FY19
198 954
Standard tariff volumes (GWh) 223 217
Standard tariff ave electricity price
(revenue/sales volumes - c/kWh)
89.13
Price adj for rebasing sales volumes
198 954
-10 812
188 142
192 953
97.50
9.4%
Decision vs actual standard tariff sales Rebasing of sales volumes (R’m)
2017/18 2018/19

Primary energy costs reflects CAGR 8.5% p.a. but the position improves when local IPPs are excluded
16
• Between 2013/14 to 2018/19 , primary energy costs escalate with CAGR of 1.5% p.a.
• Primary energy costs peaked during FY2015 & FY2016 when OCGTs were utilised to
minimise load shedding
• IPPs played vital role during supply challenges – however under the current
environment the growth in IPPs are displacing Eskom power stations
• Total primary energy costs reflects CAGR of 8.7% p.a. once local IPPs are incorporated
𝐴𝑅= (𝑅𝐴𝐵×𝑊𝐴𝐶𝐶)+𝐸+𝑃𝐸+𝐷+𝑅&𝐷+𝐼𝐷𝑀±𝑆𝑄𝐼+𝐿&𝑇±𝑅𝐶𝐴
2014/152013/14
R’’m
2012/13
+8.7%
2018/192017/182015/16 2016/17
IPPs
Gx Primary Energy1.5%

Operating Costs increase by average of 7.3% over the period
17
• Employee benefits- CAGR of 4.9% p.a. from 2013/14 to 2018/19 on back of a
declining staff complement
• O&M costs escalate by CAGR of 7.3% after normalising for once off transactions
• 2019 Opex – Employee benefit of R28.3bn (46%); Maintenance of R17.7bn (29%);
Other opex of R15.8bn (25%)
𝐴𝑅= (𝑅𝐴𝐵×𝑊𝐴𝐶𝐶)+𝐸+𝑃𝐸+𝐷+𝑅&𝐷+𝐼𝐷𝑀±𝑆𝑄𝐼+𝐿&𝑇±𝑅𝐶𝐴
2014/15 2015/16 2016/17 2017/18
7.3%
2018/192012/13
R’m
2013/14
Employee benefits
Operations & Maintenance
4.9%

Conservative assumption have been used for RAB, migration of ROA towards WACC, and depreciation
18
𝐴𝑅= (𝑅𝐴𝐵×𝑊𝐴𝐶𝐶)+𝐸+𝑃𝐸+𝐷+𝑅&𝐷+𝐼𝐷𝑀±𝑆𝑄𝐼+𝐿&𝑇±𝑅𝐶𝐴
• Opening RAB balance for
FY2019 is based on the
MYPD 3 decision which is
then adjusted for the latest
capital expenditure forecasts
for the period FY2014 to
FY2018.
• Eskom will revalue the RAB
for subsequent revenue
application in accordance with
Nersa condonation decision
In accordance with the MYPD
methodology, depreciation is
computed by dividing RAB over
remaining life of respective
assets. Therefore depreciation
amounts have remained
relatively similar to 2017/18 as a
similar RAB value is used for the
FY2018/19 revenue application
• MYPD methodology allows for
ROA as proxy for interest costs,
tax and equity return to the
shareholder
• In accordance with Nersa decision
migration of ROA towards full
WACC is phased over a longer
period.
• NERSA MYPD 3 decision of 4,7%
for FY2017/18 is reduced to
2.97% for FY2018/19 revenue
application.
Assets
Working capital & WUC
Eskom RAB
592 104
171 485
763 589
Regulatory Asset Base (R’m) Return on Assets (R’m) Depreciation (R’m)
Ave RAB
Return on Assets (ROA)
Returns
763 589
8.4%
64 142
Phased in ROA 2.97%
Phased in Returns 22 690
Returns sacrificed -41 452
Generation
Transmission
Distribution
19 062
3 833
6 245
Total Depreciation 29 140Generation
Transmission
Distribution
549 527
109 371
104 691

In conclusion , Eskom will supply electricity which comes at a cost that needs be recovered
• Eskom has delivered R47billion of savings over the first 4 years of MYPD3
• We have continuously been striving to improve operations, commission new capacity assoon as possible and aim to extract cost efficiencies over the period
• Our business contains a substantial element of fixed costs that are not easily reduced in theshort term. This will require a balance of socio economic factors which must be consideredbefore making a final decision
• Eskom’s debt commitments have increased significantly over the last few years with amajor portion that has been guaranteed by Government.
• Our debt maturities reflect a step change in the near term that requires a strong balancesheet to cover these commitments
• Eskom, believes that this revenue application has taking these factors into account in aimingto keep cost escalations close to inflation and phasing in of returns to mitigate impact on thecustomer
19
Thank you