es 202 765-4 - v1.2.1 - speech and multimedia transmission … · 2014-05-19 · etsi 6 etsi es 202...
TRANSCRIPT

ETSI ES 202 765-4 V1.2.1 (2014-05)
Speech and multimedia Transmission Quality (STQ); QoS and network performance metrics
and measurement methods; Part 4: Indicators for supervision of Multiplay services
ETSI Standard

ETSI
ETSI ES 202 765-4 V1.2.1 (2014-05)2
Reference RES/STQ-211
Keywords performance, QoS
ETSI
650 Route des Lucioles F-06921 Sophia Antipolis Cedex - FRANCE
Tel.: +33 4 92 94 42 00 Fax: +33 4 93 65 47 16
Siret N° 348 623 562 00017 - NAF 742 C
Association à but non lucratif enregistrée à la Sous-Préfecture de Grasse (06) N° 7803/88
Important notice
The present document can be downloaded from: http://www.etsi.org
The present document may be made available in electronic versions and/or in print. The content of any electronic and/or print versions of the present document shall not be modified without the prior written authorization of ETSI. In case of any
existing or perceived difference in contents between such versions and/or in print, the only prevailing document is the print of the Portable Document Format (PDF) version kept on a specific network drive within ETSI Secretariat.
Users of the present document should be aware that the document may be subject to revision or change of status. Information on the current status of this and other ETSI documents is available at
http://portal.etsi.org/tb/status/status.asp
If you find errors in the present document, please send your comment to one of the following services: http://portal.etsi.org/chaircor/ETSI_support.asp
Copyright Notification
No part may be reproduced or utilized in any form or by any means, electronic or mechanical, including photocopying and microfilm except as authorized by written permission of ETSI.
The content of the PDF version shall not be modified without the written authorization of ETSI. The copyright and the foregoing restriction extend to reproduction in all media.
© European Telecommunications Standards Institute 2014.
All rights reserved.
DECTTM, PLUGTESTSTM, UMTSTM and the ETSI logo are Trade Marks of ETSI registered for the benefit of its Members. 3GPPTM and LTE™ are Trade Marks of ETSI registered for the benefit of its Members and
of the 3GPP Organizational Partners. GSM® and the GSM logo are Trade Marks registered and owned by the GSM Association.
ETSI
ETSI ES 202 765-4 V1.2.1 (2014-05)3
Contents
Intellectual Property Rights ................................................................................................................................ 5
Foreword ............................................................................................................................................................. 5
1 Scope ........................................................................................................................................................ 6
2 References ................................................................................................................................................ 6
2.1 Normative references ......................................................................................................................................... 6
2.2 Informative references ........................................................................................................................................ 7
3 Symbols and abbreviations ....................................................................................................................... 7
3.1 Symbols .............................................................................................................................................................. 7
3.2 Abbreviations ..................................................................................................................................................... 7
4 General Overview..................................................................................................................................... 8
5 Measurement type .................................................................................................................................... 9
6 List of Internet service indicators ........................................................................................................... 10
6.1 Availability of Internet Access ......................................................................................................................... 10
6.2 Internet Download Bit Rate .............................................................................................................................. 11
6.3 Internet Upload Bit Rate ................................................................................................................................... 12
6.4 Unsuccessful FTP Download session Ratio ..................................................................................................... 13
6.5 Unsuccessful FTP Upload session Ratio .......................................................................................................... 13
6.6 Unsuccessful HTTP session Ratio .................................................................................................................... 14
6.7 Ping Delay ........................................................................................................................................................ 15
6.8 Internet Login Time.......................................................................................................................................... 16
6.9 Web page download Speed .............................................................................................................................. 17
6.10 FTP download Speed........................................................................................................................................ 17
6.11 FTP upload Speed ............................................................................................................................................ 18
7 List of voice service indicators ............................................................................................................... 19
7.1 Voice messaging availability ............................................................................................................................ 19
7.2 Post Dialling Delay .......................................................................................................................................... 20
7.3 Pick Up Delay .................................................................................................................................................. 20
7.4 Message Provisioning Delay ............................................................................................................................ 20
7.5 Voice message quality ...................................................................................................................................... 21
8 List of IPTV indicators ........................................................................................................................... 22
8.1 Channel Availability......................................................................................................................................... 22
8.2 Service Group Channel Availability................................................................................................................. 23
8.3 Video Quality ................................................................................................................................................... 23
8.4 Audio Quality ................................................................................................................................................... 24
8.5 "Black Screen" Occurrences ............................................................................................................................. 24
8.6 Blockiness Occurrences ................................................................................................................................... 25
8.7 Frozen Picture Occurrences .............................................................................................................................. 25
8.8 Lip Desynchronization Occurrences ................................................................................................................ 26
8.9 Zapping Delay .................................................................................................................................................. 26
8.10 Transmission Delay .......................................................................................................................................... 26
8.11 IPTV service boot delay ................................................................................................................................... 27
9 List of VoD indicators ............................................................................................................................ 27
9.1 VoD Service Availability ................................................................................................................................. 27
9.2 Request Conformity ......................................................................................................................................... 28
9.3 VoD failure rate ................................................................................................................................................ 28
9.4 Video Quality ................................................................................................................................................... 28
9.5 Audio Quality ................................................................................................................................................... 29
9.6 "Black Screen" Occurrences ............................................................................................................................. 29
9.7 Blockiness Occurrences ................................................................................................................................... 30
9.8 Frozen Picture Occurrences .............................................................................................................................. 30

ETSI
ETSI ES 202 765-4 V1.2.1 (2014-05)4
10 Measurement frequency ......................................................................................................................... 31
11 Measurement locations and their distribution ........................................................................................ 31
12 Results presentation ................................................................................................................................ 31
Annex A (normative): Principle of artefact detection algorithms ................................................... 33
A.1 Detection principle of frozen picture occurrence ................................................................................... 33
A.2 Detection principle of "black screen" occurrence .................................................................................. 34
A.3 Detection principle of blockiness occurrence ......................................................................................... 35
Annex B (informative): Comparisons of ES 202 765-4 and TS 102 250-2 (V2.2.1) parameters ...... 36
Annex C (informative): Bibliography ................................................................................................... 40
History .............................................................................................................................................................. 41
ETSI
ETSI ES 202 765-4 V1.2.1 (2014-05)5
Intellectual Property Rights IPRs essential or potentially essential to the present document may have been declared to ETSI. The information pertaining to these essential IPRs, if any, is publicly available for ETSI members and non-members, and can be found in ETSI SR 000 314: "Intellectual Property Rights (IPRs); Essential, or potentially Essential, IPRs notified to ETSI in respect of ETSI standards", which is available from the ETSI Secretariat. Latest updates are available on the ETSI Web server (http://ipr.etsi.org).
Pursuant to the ETSI IPR Policy, no investigation, including IPR searches, has been carried out by ETSI. No guarantee can be given as to the existence of other IPRs not referenced in ETSI SR 000 314 (or the updates on the ETSI Web server) which are, or may be, or may become, essential to the present document.
Foreword This ETSI Standard (ES) has been produced by ETSI Technical Committee Speech and multimedia Transmission Quality (STQ).
The present document is part 4 of a multi-part deliverable covering the QoS metrics for telecommunication services and network performance metrics for transport networks, as identified below:
EG 202 765-1: "General considerations";
ES 202 765-2: "Transmission Quality Indicator combining Voice Quality Metrics";
EG 202 765-3: "Network performance metrics and measurement methods in IP networks";
ES 202 765-4: "Indicators for supervision of Multiplay services".

ETSI
ETSI ES 202 765-4 V1.2.1 (2014-05)6
1 Scope The present document aims at identifying and defining indicators and methodologies for a use in a context of end-user quality characterization and supervision of Multiplay services.
In this context the measurements and metric determinations are performed by analysing signals accessible on user-end services and not on the network.
The present document concerns: Internet access, voice messaging service, IPTV and VoD.
The assessment methods are intrusive and non intrusive.
2 References References are either specific (identified by date of publication and/or edition number or version number) or non-specific. For specific references, only the cited version applies. For non-specific references, the latest version of the reference document (including any amendments) applies.
Referenced documents which are not found to be publicly available in the expected location might be found at http://docbox.etsi.org/Reference.
NOTE: While any hyperlinks included in this clause were valid at the time of publication ETSI cannot guarantee their long term validity.
2.1 Normative references The following referenced documents are necessary for the application of the present document.
[1] Void.
[2] Recommendation ITU-T G.1030: "Estimating end-to-end performance in IP networks for data applications".
[3] Recommendation ITU-T G.1010: "End-user multimedia QoS categories".
[4] IETF RFC 792: "Internet Control Message Protocol".
[5] ETSI TS 102 250-2 (V2.2.1): "Speech and multimedia Transmission Quality (STQ); QoS aspects for popular services in mobile networks; Part 2: Definition of Quality of Service parameters and their computation".
[6] Recommendation ITU-T P.800: "Methods for subjective determination of transmission quality".
[7] Recommendation ITU-T P.862: "Perceptual evaluation of speech quality (PESQ): An objective method for end-to-end speech quality assessment of narrow-band telephone networks and speech codecs".
[8] Recommendation ITU-T P.862.1: "Mapping function for transforming P.862 raw result scores to MOS-LQO".
[9] Recommendation ITU-T P.862.3: "Application guide for objective quality measurement based on Recommendations P.862, P.862.1 and P.862.2".
[10] Recommendation ITU-T P.800.1: "Mean Opinion Score (MOS) terminology".
[11] Recommendation ITU-T P.505: "One-view visualization of speech quality measurement results".
[12] ETSI ES 202 765-2: "Speech and multimedia Transmission Quality (STQ); QoS and network performance metrics and measurement methods; Part 2 : Transmission Quality Indicator combining Voice Quality Metrics".

ETSI
ETSI ES 202 765-4 V1.2.1 (2014-05)7
[13] Recommendation ITU-T P.863: "Perceptual objective listening quality assessment".
[14] Recommendation ITU-T P.863.1: "Application Guide for Recommendation ITU-T P.863".
[15] Recommendation ITU-T P.800.2: "Mean opinion score interpretation and reporting".
2.2 Informative references The following referenced documents are not necessary for the application of the present document but they assist the user with regard to a particular subject area.
[i.1] ETSI TR 102 607: "Speech Processing, Transmission and Quality Aspects (STQ); TCP IP Stack Parameter Settings for Microsoft Windows XP and Microsoft Windows Vista; Comparison and Recommendations".
[i.2] ETSI TR 102 505: "Speech and multimedia Transmission Quality (STQ); Development of a Reference Web page".
[i.3] Recommendation ITU-T J.144: "Objective perceptual video quality measurement techniques for digital cable television in the presence of a full reference".
[i.4] Recommendation ITU-T J.247: "Objective perceptual multimedia video quality measurement in the presence of a full reference".
[i.5] ETSI EG 202 057-4: "Speech Processing, Transmission and Quality Aspects (STQ); User related QoS parameter definitions and measurements; Part 4: Internet Access".
3 Symbols and abbreviations
3.1 Symbols For the purposes of the present document, the following symbols apply:
1 kbit/s 1 000 bit/s 1 Mbit/s 1 000 kbit/s kbps kilobit per second
3.2 Abbreviations For the purposes of the present document, the following abbreviations apply:
ATM Asynchronous Transfer Mode BGP Border Gateway Protocol BRAS Broadband Remote Access Server CIF Common Intermediate Format CPE Customer Premises Equipment DHCP Dynamic Host Control Protocol DNS Domain Name System DSLAM Digital Subscriber Line Access Multiplexer ETSI European Telecommunications Standards Institute FQDN Fully Qualified Domain Name FTP File Transfer Protocol GE Gigabit Ethernet GSM Global System for Mobile communications HDMI High Definition Multimedia Interface HGW Home GateWay HTTP Hyper Text Transfer Protocol ICMP Internet Control Message Protocol IP Internet Protocol

ETSI
ETSI ES 202 765-4 V1.2.1 (2014-05)8
IPTV Internet Protocol Television ISP Internet Service Provider ITU-T International Telecommunication Union - Telecommunication standardization sector LNS L2TP Network Server MOS Mean Opinion Score MOS-LQON Mean Opinion Store-Listening Quality Objective Narrow-band MOS-LQOSW Mean Opinion Store-Listening Quality Objective Super Wide band MPEG Moving Picture Experts Group MPEG TS MPEG Transport Stream OLT Optical Line Termination PESQ Perceptual Evaluation of Speech Quality PSTN Public Switched Telephone Network QoS Quality of Service RTP Real Time Protocol RTT Round-Trip Time S/PDIF Sony Philips Digital Interface STB Set Top Box TCP Transmission Control Protocol UDP User Datagram Protocol VoD Video on Demand VoIP Voice over Internet Protocol
4 General Overview The present document aims at identifying and defining indicators and methodologies for a use in a context of end-user quality characterization and supervision of multiplay telephony services such as Internet access, IPTV and VoD. It completes ES 202 765-2 [12] that was dedicated to voice telephony services.
The present document gives practical requirements of use in the context of service verification and benchmark on a large and representative scale from the point of view of the potential stakeholders such as the end-users or of the regulatory authorities. This has been made necessary by the current or recent evolutions of the telecommunication sector:
• a competitive environment for the offers of multiplay services with a multitude of service providers, with a quality guarantee not always assured and where clients can very easily change their service providers;
• the development of time varying quality in telecommunications, first in telephony with mobile offers (due to mobility and irregular network coverage), but now also for multiplay services use in residential context (mostly due to IP transmission);
• the cohabitation, interaction and competition between services based on different technologies.
The deployment of multiplay offers is increasing but quality guarantee is not always assured.
To achieve the goal mentioned beforehand, there are several existing possibilities, not fully satisfying:
• Subjective tests, with a few human testers assessing the quality of services. This method is very long to run and not really cheap if we consider that there are many offers to be assessed. And it is not easily applicable in a context of quality changing over time.
• Objective tests. This is the most reliable way, although it is also based on sampling and can be very costly in the case of a large deployment of probes or robots.

ETSI
ETSI ES 202 765-4 V1.2.1 (2014-05)9
The present document assumes that this last family of methodology answers the needs of a reliable comparison of multiplay services.
IP core network
Audiovisual Service
platforms
VoIP Service
platforms
Internet
Access
and Backhaul networks
Game service
platforms
VoIP service
Internet service
IPTV and VoD services
Game service
Figure 1: Possible configuration of architecture of multiplay services
The analysis of multiplay offers requires the simulation of user behaviour. In this context, robots and analyzers have to use and seek services in a very close way of a customer usage.
What matters the most is the point of view of the end-users. What they perceive is not only the result of the transmission across the network, but also artefacts produce by the service platforms or service servers.
In the present document the following services are considered: Internet access, voice messaging (in complement to telephony services addressed in ES 202 765-2 [12]), IPTV and VoD.
A last important aspect addressed in the present document is the practical organization of measurement campaigns in order to get a realistic and reliable vision of the services as perceived by the end-users. In particular, the questions of the periodicity of measurement and of the geographical coverage (i.e. more generally the sampling approach). These aspects are specified in clause 5.
5 Measurement type Considering the specific perimeter for the characterization of multiplay offer quality 24 hours a day and 7 days a week, analyses should be realized by robots. In this context, subjective evaluations are not adapted. The robot has to simulate the use of services by a user.
Besides, the characterization of the offers is considered from the user point of view. So, analyzers shall be connected on the available accesses of the HGW (Ethernet access, analogical phone access) or/and of the STB (HDMI, S/PDIF). So, analyses are performed on electric signals.
In general care should be taken by comparing results from measurements obtained by using different setups (e.g. protocols, service layers).

ETSI
ETSI ES 202 765-4 V1.2.1 (2014-05)10
6 List of Internet service indicators To determine the indicators of internet service, it is necessary to manage the measurements with a Personal Computer (PC) similar to those currently or mostly used by users. Care should be taken when using a PC which is not sufficiently powerful. On this matter, recommendations are available in TR 102 607 [i.1].
The indicators proposed in the context of end-user quality survey of Internet services are detailed in the following clauses.
6.1 Availability of Internet Access Definition This metric represents the probability for a customer that Internet applications are attainable
from his Internet access. It denotes the probability for a customer that his Internet access is available.
Assessment method This metric provides, for a user, the percentage of time where access to the Internet services are available. Availability of Internet Access = 1 –Unavailability of Internet Access ∑ Unavailability duration ∑ Failure measurement = 1 - ―――――――――――――― = 1 - ―――――――――――――― Duration of period analysis Total time of measurement Internet Access Availability measurement is an attempt since the user access equipment to reach an Internet service like downloading a web page from a server. To determine the metric, it is important to test the whole transmission chain which allows to access to Internet services outside to ISP network. NOTE: Use the access to ISP mail server does not give a correct view of Internet Access
Availability because edge equipments between ISP network and Internet network are not involved.
Guidelines In practical way, this indicator can be measured, from the user access, by contacting different Web sites (national or/and international) hosted on servers outside and within the ISP network. It is necessary to test the accessibility on several servers to avoid a wrong measurement interpretation due to Web server breakdown. The different attempts to reach web servers and measure the successful or unsuccessful rate should be made periodically. The time interval between 2 sequences of attempts to reach servers needs not to be more than 15 minutes. It is better to adjust the periodicity of analysis between 5 minutes and 10 minutes.
Unit % with the resolution of 1 digit after the decimal point Standardization reference
Significant Mandatory Comment This availability excludes provisioning, billing or after sales issues that are part of QoS
parameters of the Customer relationship stages [i.1]. The Internet access availability metric takes into account the availability and the correct functioning of each network element allowing the access to the service. Network elements to consider in this context are:
• Access node (DSLAM, OLT). • Aggregation nodes and links (ATM and/or GE). • Access server (BRAS, LNS). • Transmission nodes and links. • Service Platform (DHCP server, DNS).
A target value for this indicator should be more than 99,95 %. Warning: When the Internet Access Availability is determined by reaching Web servers outside the ISP network, this indicator needs to be handled with care. Indeed there are a lot of factors on which the ISP has little or no control: faults in networks of transit providers, faults at interconnection points, BGP routing errors in peer networks, etc.

ETSI
ETSI ES 202 765-4 V1.2.1 (2014-05)11
6.2 Internet Download Bit Rate Definition This metric represents Internet download bit rate available to the user. The indicator
evaluates the capacity to use the Internet services. Assessment method There are several reasons so that Internet download bit rate supplied to the user is lower
than this expected: too long distance between the user and first network access equipment, bad equipment configuration, degraded link between the user and the network, etc. The Internet download bit rate is evaluated by measuring the bit rate during data transfer from network to user access equipment. It is important to verify that the server used for the measurement has a sufficient output bit rate to make this type of measure. It shall send and receive data flow with bit rates higher than those available on the user access equipment.
Guidelines In practical way, this indicator can be measured as follows: • Data transfers shall be long enough to ensure that results are significant.
10 seconds seem to be a sufficient time period. This means that the file for downloading test should have a correct size: smaller file for a low-capacity connection, bigger file for high-capacity connections.
• During this analysis duration (10 seconds), we proceed to the counting of received bytes (on user side).
• We stop the counting when the analysis duration is over. • Concerning the reporting, 2 values can be determined: the maximum bit rate during
the faster second and the average bit rate during the analysis period of 10 seconds. • Preliminary tests can be performed to calibrate the volume of data to be transferred.
The file type for downloading test could be a jpg image because such files can easily be generate to different file sizes. The used protocol for this downloading test should be HTTP. NOTE: For this measurement, incompressible files should be used for the data transfer.
Unit bit/s, kbit/s or Mbit/s Standardization reference
Significant Mandatory Comment 2 types of measurement should be perform:
• Internet Download bit rate measurement in presence of other services (VoIP, IPTV or VoD); and
• Internet Download bit rate measurement without other services. For measurement with other services, Internet Download bit rate measurement should be made from a server located within the ISP network. The 95 quantile can be determined. This indicator value gives information about the lowest download bit rate measured during a given period of time (a day, a week or a month). In a practical way, this indicator is determined by taking into account all measurement results obtained for the metric "Internet Download Bit Rate" and by determining the bit rate threshold corresponding to 95 % of the measurements. NOTE: Care should be taken in the evaluation of the measurement results of this
indicator. Measurements with low (or no) bitrates evidently caused by the measurement system or other external factors should be excluded from the statistics.
ETSI
ETSI ES 202 765-4 V1.2.1 (2014-05)12
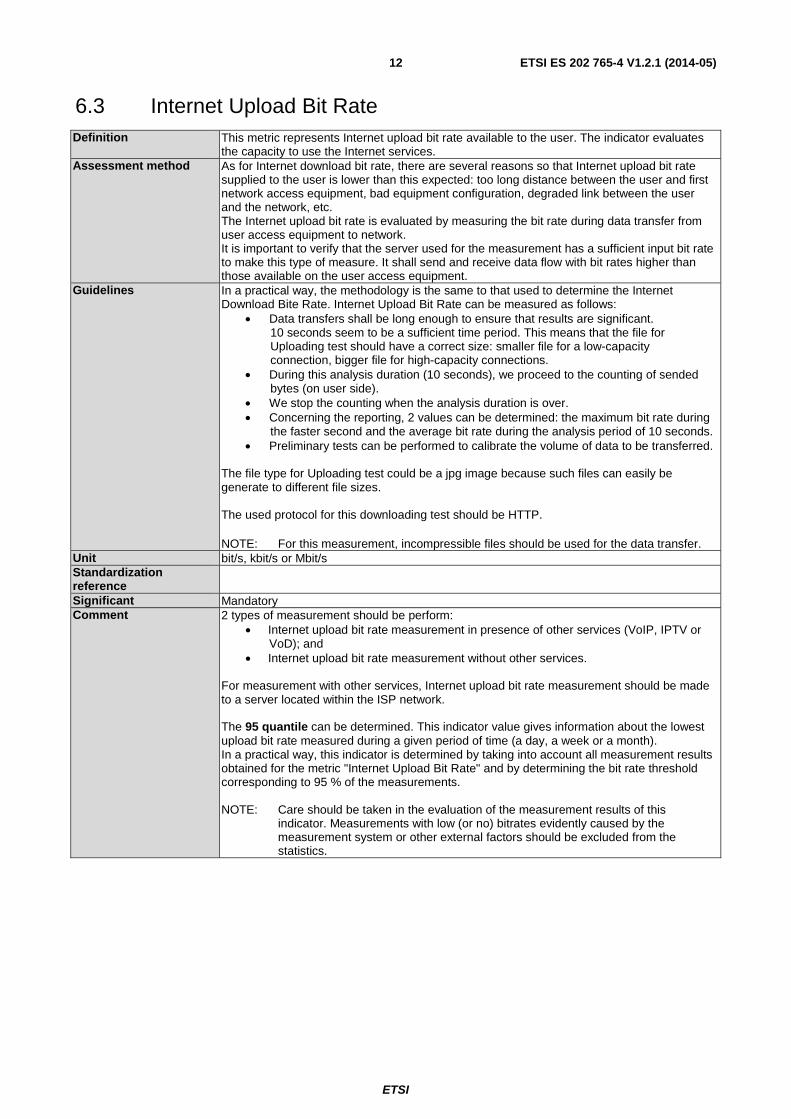
6.3 Internet Upload Bit Rate Definition This metric represents Internet upload bit rate available to the user. The indicator evaluates
the capacity to use the Internet services. Assessment method As for Internet download bit rate, there are several reasons so that Internet upload bit rate
supplied to the user is lower than this expected: too long distance between the user and first network access equipment, bad equipment configuration, degraded link between the user and the network, etc. The Internet upload bit rate is evaluated by measuring the bit rate during data transfer from user access equipment to network. It is important to verify that the server used for the measurement has a sufficient input bit rate to make this type of measure. It shall send and receive data flow with bit rates higher than those available on the user access equipment.
Guidelines In a practical way, the methodology is the same to that used to determine the Internet Download Bite Rate. Internet Upload Bit Rate can be measured as follows:
• Data transfers shall be long enough to ensure that results are significant. 10 seconds seem to be a sufficient time period. This means that the file for Uploading test should have a correct size: smaller file for a low-capacity connection, bigger file for high-capacity connections.
• During this analysis duration (10 seconds), we proceed to the counting of sended bytes (on user side).
• We stop the counting when the analysis duration is over. • Concerning the reporting, 2 values can be determined: the maximum bit rate during
the faster second and the average bit rate during the analysis period of 10 seconds. • Preliminary tests can be performed to calibrate the volume of data to be transferred.
The file type for Uploading test could be a jpg image because such files can easily be generate to different file sizes. The used protocol for this downloading test should be HTTP. NOTE: For this measurement, incompressible files should be used for the data transfer.
Unit bit/s, kbit/s or Mbit/s Standardization reference
Significant Mandatory Comment 2 types of measurement should be perform:
• Internet upload bit rate measurement in presence of other services (VoIP, IPTV or VoD); and
• Internet upload bit rate measurement without other services. For measurement with other services, Internet upload bit rate measurement should be made to a server located within the ISP network. The 95 quantile can be determined. This indicator value gives information about the lowest upload bit rate measured during a given period of time (a day, a week or a month). In a practical way, this indicator is determined by taking into account all measurement results obtained for the metric "Internet Upload Bit Rate" and by determining the bit rate threshold corresponding to 95 % of the measurements. NOTE: Care should be taken in the evaluation of the measurement results of this
indicator. Measurements with low (or no) bitrates evidently caused by the measurement system or other external factors should be excluded from the statistics.
ETSI
ETSI ES 202 765-4 V1.2.1 (2014-05)13
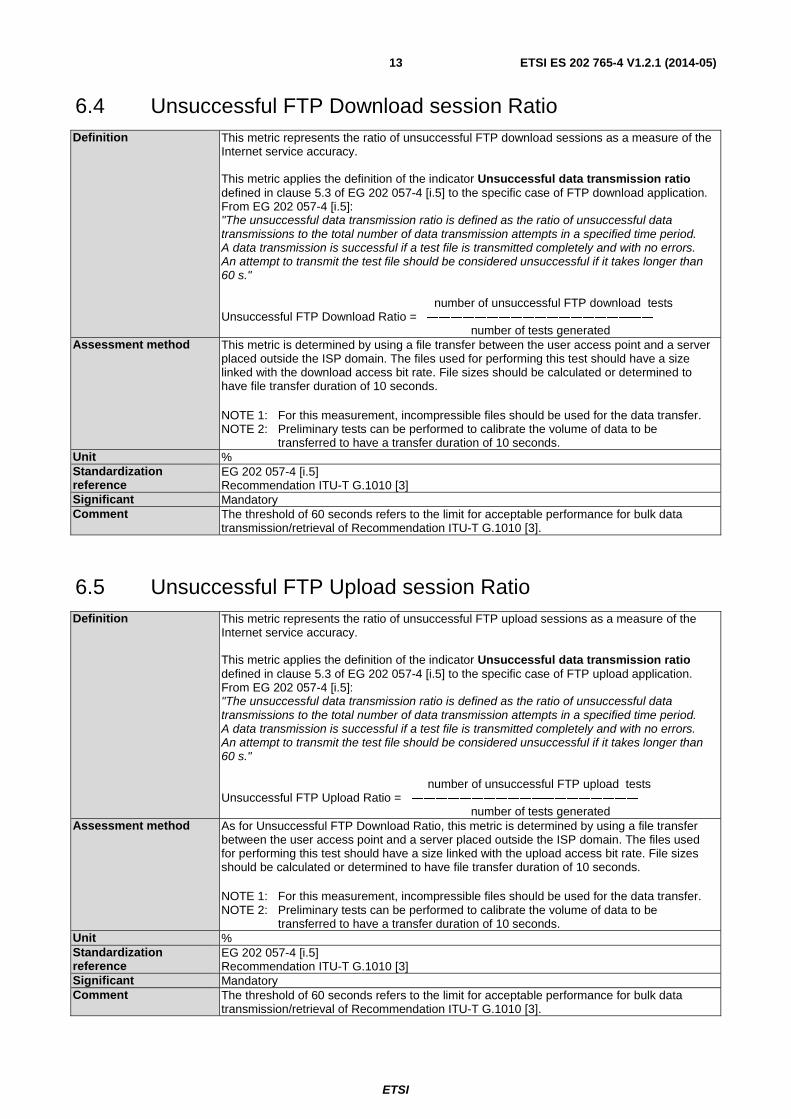
6.4 Unsuccessful FTP Download session Ratio Definition This metric represents the ratio of unsuccessful FTP download sessions as a measure of the
Internet service accuracy. This metric applies the definition of the indicator Unsuccessful data transmission ratio defined in clause 5.3 of EG 202 057-4 [i.5] to the specific case of FTP download application. From EG 202 057-4 [i.5]: "The unsuccessful data transmission ratio is defined as the ratio of unsuccessful data transmissions to the total number of data transmission attempts in a specified time period. A data transmission is successful if a test file is transmitted completely and with no errors. An attempt to transmit the test file should be considered unsuccessful if it takes longer than 60 s." number of unsuccessful FTP download tests Unsuccessful FTP Download Ratio = ――――――――――――――――――― number of tests generated
Assessment method This metric is determined by using a file transfer between the user access point and a server placed outside the ISP domain. The files used for performing this test should have a size linked with the download access bit rate. File sizes should be calculated or determined to have file transfer duration of 10 seconds. NOTE 1: For this measurement, incompressible files should be used for the data transfer. NOTE 2: Preliminary tests can be performed to calibrate the volume of data to be
transferred to have a transfer duration of 10 seconds. Unit % Standardization reference
EG 202 057-4 [i.5] Recommendation ITU-T G.1010 [3]
Significant Mandatory Comment The threshold of 60 seconds refers to the limit for acceptable performance for bulk data
transmission/retrieval of Recommendation ITU-T G.1010 [3].
6.5 Unsuccessful FTP Upload session Ratio Definition This metric represents the ratio of unsuccessful FTP upload sessions as a measure of the
Internet service accuracy. This metric applies the definition of the indicator Unsuccessful data transmission ratio defined in clause 5.3 of EG 202 057-4 [i.5] to the specific case of FTP upload application. From EG 202 057-4 [i.5]: "The unsuccessful data transmission ratio is defined as the ratio of unsuccessful data transmissions to the total number of data transmission attempts in a specified time period. A data transmission is successful if a test file is transmitted completely and with no errors. An attempt to transmit the test file should be considered unsuccessful if it takes longer than 60 s." number of unsuccessful FTP upload tests Unsuccessful FTP Upload Ratio = ――――――――――――――――――― number of tests generated
Assessment method As for Unsuccessful FTP Download Ratio, this metric is determined by using a file transfer between the user access point and a server placed outside the ISP domain. The files used for performing this test should have a size linked with the upload access bit rate. File sizes should be calculated or determined to have file transfer duration of 10 seconds. NOTE 1: For this measurement, incompressible files should be used for the data transfer. NOTE 2: Preliminary tests can be performed to calibrate the volume of data to be
transferred to have a transfer duration of 10 seconds. Unit % Standardization reference
EG 202 057-4 [i.5] Recommendation ITU-T G.1010 [3]
Significant Mandatory Comment The threshold of 60 seconds refers to the limit for acceptable performance for bulk data
transmission/retrieval of Recommendation ITU-T G.1010 [3].

ETSI
ETSI ES 202 765-4 V1.2.1 (2014-05)14
6.6 Unsuccessful HTTP session Ratio Definition This metric represents the ratio of unsuccessful web browsing attempts as a measure of the
Internet service accuracy. This metric applies the definition of the indicator Unsuccessful data transmission ratio defined in clause 5.3 of EG 202 057-4 [i.5] to the specific case of web browsing application. From EG 202 057-4 [i.5]: "The unsuccessful data transmission ratio is defined as the ratio of unsuccessful data transmissions to the total number of data transmission attempts in a specified time period. A data transmission is successful if a test file is transmitted completely and with no errors." A web browsing session is considered unsuccessful if it takes longer than 10 s, indicated as the limit for the loss of users' attention in the Recommendation ITU-T G.1030 [2]. number of unsuccessful HTTP tests Unsuccessful HTTP Ratio = ――――――――――――――――――― number of tests generated
Assessment method In practical way, this metric could be determined by downloading web pages from different servers placed outside the ISP domain. The Webpage defined in TR 102 505 [i.2] should be in the panel of web pages used for this test. A counter is started when the download request of the Webpage is sent to the server. This counter is stopped when the page is fully loaded. The test is considered unsuccessful if the downloading time is upper than 10 seconds. NOTE: Care should be taken when using Web pages where contents vary. In this
scenario download times vary and measurements are not performed consistently. Unit % Standardization reference
EG 202 057-4 [i.5] Recommendation ITU-T G.1030 [2] TR 102 505 [i.2]
Significant Mandatory Comment The Web pages that should be downloaded by the Test-analyzer could be:
• ETSI portal web page (http://portal.etsi.org/stq/WebReferencePage.asp). • ad-hoc web page one (small size). • ad-hoc web page two (medium size). • ad-hoc web page three (big size).
It is important that the Web server contact for this test is outside the ISP domain; In this condition, the complete link allowing the access to Web server is tested.
ETSI
ETSI ES 202 765-4 V1.2.1 (2014-05)15
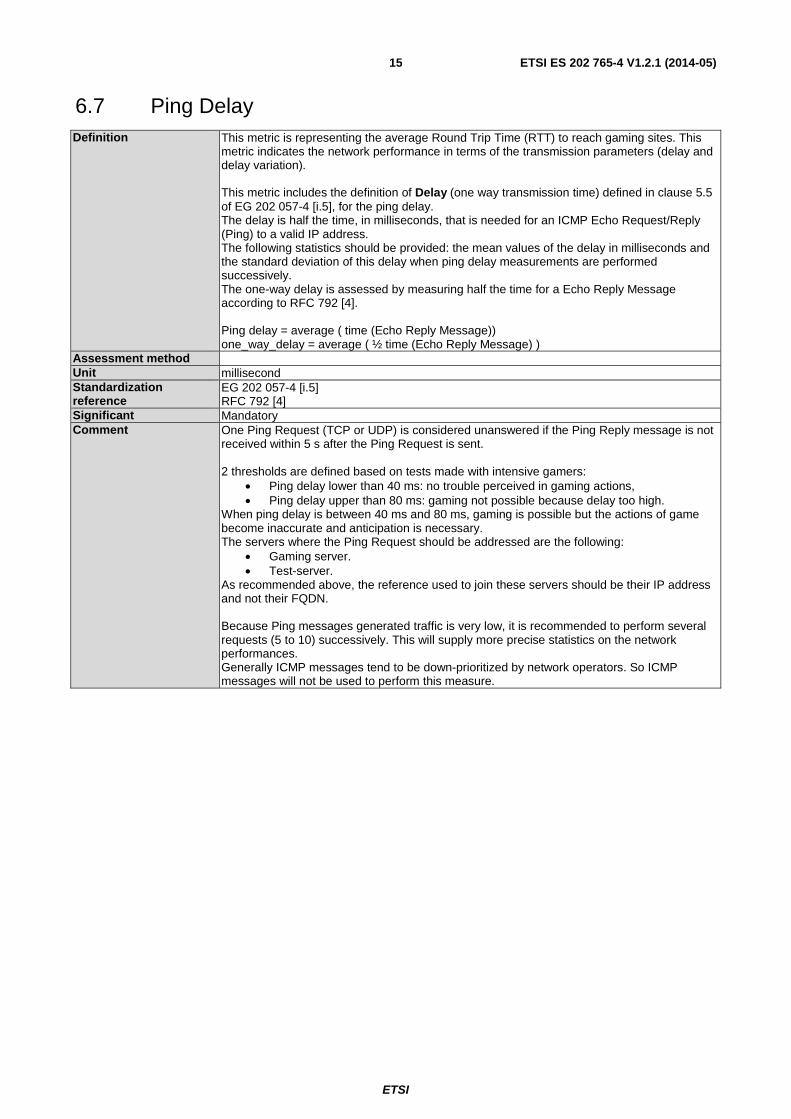
6.7 Ping Delay Definition This metric is representing the average Round Trip Time (RTT) to reach gaming sites. This
metric indicates the network performance in terms of the transmission parameters (delay and delay variation). This metric includes the definition of Delay (one way transmission time) defined in clause 5.5 of EG 202 057-4 [i.5], for the ping delay. The delay is half the time, in milliseconds, that is needed for an ICMP Echo Request/Reply (Ping) to a valid IP address. The following statistics should be provided: the mean values of the delay in milliseconds and the standard deviation of this delay when ping delay measurements are performed successively. The one-way delay is assessed by measuring half the time for a Echo Reply Message according to RFC 792 [4]. Ping delay = average ( time (Echo Reply Message)) one_way_delay = average ( ½ time (Echo Reply Message) )
Assessment method Unit millisecond Standardization reference
EG 202 057-4 [i.5] RFC 792 [4]
Significant Mandatory Comment One Ping Request (TCP or UDP) is considered unanswered if the Ping Reply message is not
received within 5 s after the Ping Request is sent. 2 thresholds are defined based on tests made with intensive gamers:
• Ping delay lower than 40 ms: no trouble perceived in gaming actions, • Ping delay upper than 80 ms: gaming not possible because delay too high.
When ping delay is between 40 ms and 80 ms, gaming is possible but the actions of game become inaccurate and anticipation is necessary. The servers where the Ping Request should be addressed are the following:
• Gaming server. • Test-server.
As recommended above, the reference used to join these servers should be their IP address and not their FQDN. Because Ping messages generated traffic is very low, it is recommended to perform several requests (5 to 10) successively. This will supply more precise statistics on the network performances. Generally ICMP messages tend to be down-prioritized by network operators. So ICMP messages will not be used to perform this measure.
ETSI
ETSI ES 202 765-4 V1.2.1 (2014-05)16
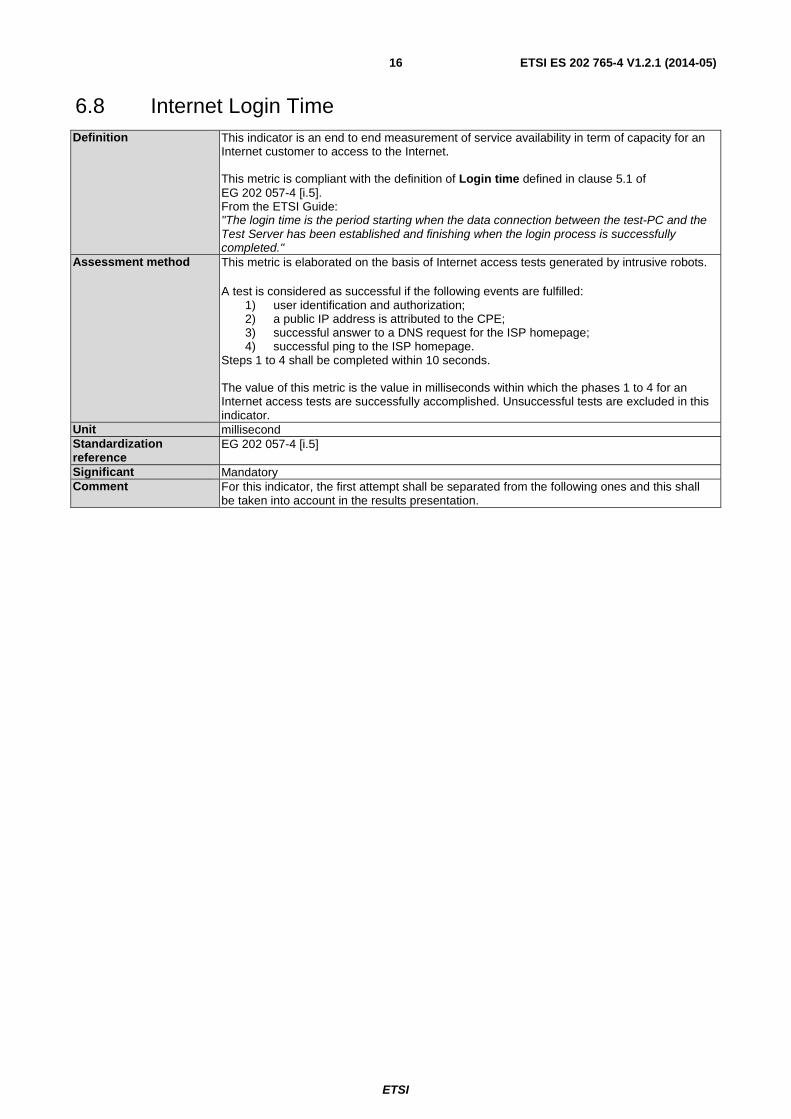
6.8 Internet Login Time Definition This indicator is an end to end measurement of service availability in term of capacity for an
Internet customer to access to the Internet. This metric is compliant with the definition of Login time defined in clause 5.1 of EG 202 057-4 [i.5]. From the ETSI Guide: "The login time is the period starting when the data connection between the test-PC and the Test Server has been established and finishing when the login process is successfully completed."
Assessment method This metric is elaborated on the basis of Internet access tests generated by intrusive robots. A test is considered as successful if the following events are fulfilled:
1) user identification and authorization; 2) a public IP address is attributed to the CPE; 3) successful answer to a DNS request for the ISP homepage; 4) successful ping to the ISP homepage.
Steps 1 to 4 shall be completed within 10 seconds. The value of this metric is the value in milliseconds within which the phases 1 to 4 for an Internet access tests are successfully accomplished. Unsuccessful tests are excluded in this indicator.
Unit millisecond Standardization reference
EG 202 057-4 [i.5]
Significant Mandatory Comment For this indicator, the first attempt shall be separated from the following ones and this shall
be taken into account in the results presentation.

ETSI
ETSI ES 202 765-4 V1.2.1 (2014-05)17
6.9 Web page download Speed Definition This indicator evaluates the average download performance when the customer is surfing on
the Internet. This metric is compliant with the definition of Data transmission speed achieved, defined in clause 5.2 of EG 202 057-4 [i.5]. From EG 202 057-4 [i.5]: "The data transmission speed is defined as the data transmission rate that is achieved separately for downloading and uploading specified test files between a remote web site and a user's computer. The following statistics should be provided separately for download and upload direction:
a) the highest 95 % of the data transmission rate in kbit/s achieved;
b) the lowest 5 % of the data transmission rate in kbit/s achieved;
c) the mean value and standard deviation of the data transmission rate in kbit/s."
Failed attempts have to be excluded by the statistics above. A web browsing session is considered unsuccessful if it takes longer than 10 s, indicated as the limit for the loss of users' attention in the Recommendation ITU-T G.1030 [2].
Assessment method As for Unsuccessful HTTP Ratio, this metric could be determined by downloading web pages from different servers placed outside the ISP domain. The Webpage defined in TR 102 505 [i.2] should be in the set of web pages used for this test. It is important to use a reference web page to allow result comparisons. A counter is started when the download request of the Webpage is sent to the server. The counter is stopped when the page download is completed. NOTE: Care should be taken when using Web pages where contents vary. In this
scenario download times vary and measurements are not performed consistently. Unit millisecond Standardization reference
EG 202 057-4 [i.5] Recommendation ITU-T G.1010 [3] Recommendation ITU-T G.1030 [2] TR 102 505 [i.2]
Significant Optional Comment The ETSI portal web page (http://portal.etsi.org/stq/WebReferencePage.asp) can be used for
this test. Recommendation ITU-T G.1010 [3] indicates the values of 2 seconds and 4 seconds as the preferred and acceptable value to download one page.
6.10 FTP download Speed Definition This indicator evaluates the average download performance when the customer is
downloading a file via FTP. This metric is compliant with the definition of Data transmission speed achieved, defined in clause 5.2 of EG 202 057-4 [i.5]. From EG 202 057-4 [i.5]: "The data transmission speed is defined as the data transmission rate that is achieved separately for downloading and uploading specified test files between a remote web site and a user's computer. The following statistics should be provided separately for download and upload direction:
a) the highest 95 % of the data transmission rate in kbit/s achieved;
b) the lowest 5 % of the data transmission rate in kbit/s achieved;
c) the mean value and standard deviation of the data transmission rate in kibt/s".
Failed attempts have to be excluded by the statistics above.
ETSI
ETSI ES 202 765-4 V1.2.1 (2014-05)18
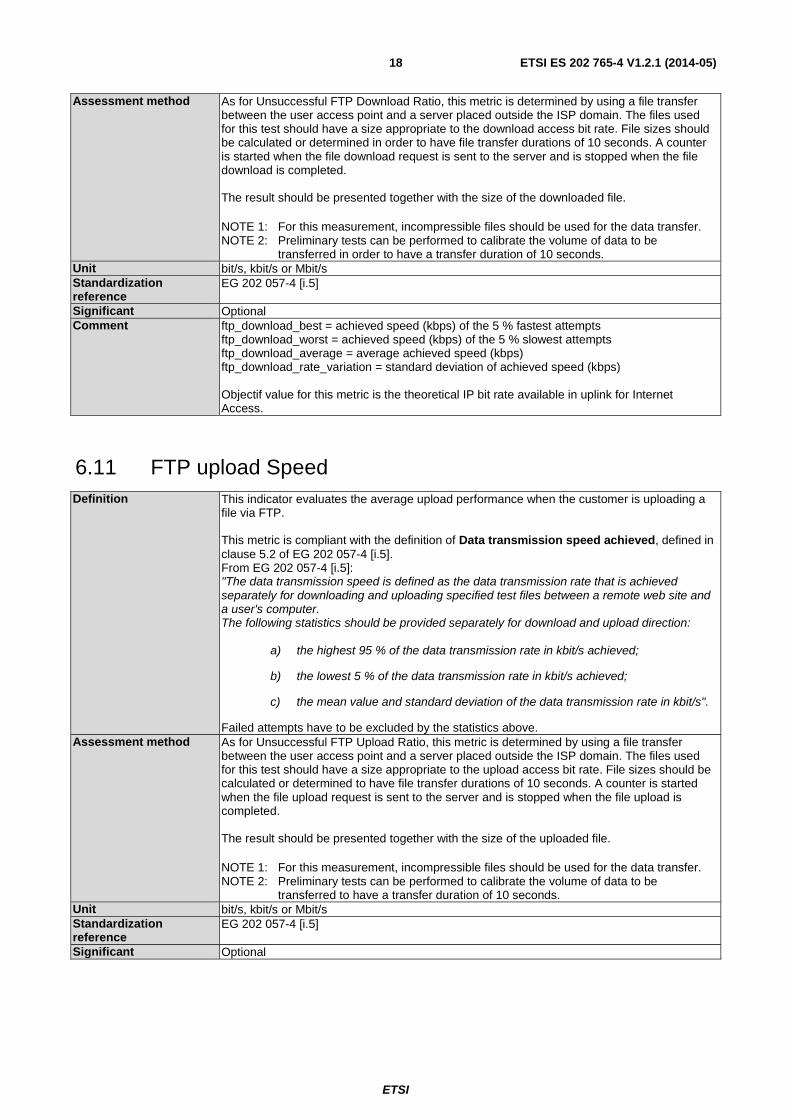
Assessment method As for Unsuccessful FTP Download Ratio, this metric is determined by using a file transfer between the user access point and a server placed outside the ISP domain. The files used for this test should have a size appropriate to the download access bit rate. File sizes should be calculated or determined in order to have file transfer durations of 10 seconds. A counter is started when the file download request is sent to the server and is stopped when the file download is completed. The result should be presented together with the size of the downloaded file. NOTE 1: For this measurement, incompressible files should be used for the data transfer. NOTE 2: Preliminary tests can be performed to calibrate the volume of data to be
transferred in order to have a transfer duration of 10 seconds. Unit bit/s, kbit/s or Mbit/s Standardization reference
EG 202 057-4 [i.5]
Significant Optional Comment ftp_download_best = achieved speed (kbps) of the 5 % fastest attempts
ftp_download_worst = achieved speed (kbps) of the 5 % slowest attempts ftp_download_average = average achieved speed (kbps) ftp_download_rate_variation = standard deviation of achieved speed (kbps) Objectif value for this metric is the theoretical IP bit rate available in uplink for Internet Access.
6.11 FTP upload Speed Definition This indicator evaluates the average upload performance when the customer is uploading a
file via FTP. This metric is compliant with the definition of Data transmission speed achieved, defined in clause 5.2 of EG 202 057-4 [i.5]. From EG 202 057-4 [i.5]: "The data transmission speed is defined as the data transmission rate that is achieved separately for downloading and uploading specified test files between a remote web site and a user's computer. The following statistics should be provided separately for download and upload direction:
a) the highest 95 % of the data transmission rate in kbit/s achieved;
b) the lowest 5 % of the data transmission rate in kbit/s achieved;
c) the mean value and standard deviation of the data transmission rate in kbit/s".
Failed attempts have to be excluded by the statistics above. Assessment method As for Unsuccessful FTP Upload Ratio, this metric is determined by using a file transfer
between the user access point and a server placed outside the ISP domain. The files used for this test should have a size appropriate to the upload access bit rate. File sizes should be calculated or determined to have file transfer durations of 10 seconds. A counter is started when the file upload request is sent to the server and is stopped when the file upload is completed. The result should be presented together with the size of the uploaded file. NOTE 1: For this measurement, incompressible files should be used for the data transfer. NOTE 2: Preliminary tests can be performed to calibrate the volume of data to be
transferred to have a transfer duration of 10 seconds. Unit bit/s, kbit/s or Mbit/s Standardization reference
EG 202 057-4 [i.5]
Significant Optional

ETSI
ETSI ES 202 765-4 V1.2.1 (2014-05)19
Comment ftp_upload_best = achieved speed (kbps) of the 5 % fastest attempts ftp_upload_worst = achieved speed (kbps) of the 5 % slowest attempts ftp_upload_average = average achieved speed (kbps) ftp_upload_rate_variation = standard deviation of achieved speed (kbps) Objectif value for this metric is the theoretical IP bit rate available in uplink for Internet Access.
7 List of voice service indicators Indicators presented in this clause are to be considered in complement to metrics and analysis methodologies described in ES 202 765-2 [12] which identifies and defines indicators and methodologies for characterization and supervision of voice telephony services.
In this clause, the indicators concern only the applications associated to telephony service. For the time being, only metrics characterizing the voice messaging system are described.
7.1 Voice messaging availability Definition This metric defines the probability that voice messaging application is attainable when the
customer calls it. Successful access to voice messaging is performed when a call attempt to this service is correctly set up and release. This indicator is the number of success calls to the number of call attempts.
Assessment method This metric provides, for a user, the percentage of time where access to Voice messaging is available. Voice messaging availability = 1 - Voice messaging unavailability Number of Failure access = 1 - ―――――――――――――― Total number of access Voice messaging availability measurement is an attempt since a user access (PTSN, mobile or IP terminal) to reach the voice messaging server. The different attempts to reach voice messaging platform and measure the successful or unsuccessful rate should be made periodically. The time interval between 2 attempts to reach the server needs not to be more than 15 minutes. It is better to adjust the periodicity of analysis between 5 minutes and 10 minutes.
Unit % Standardization reference
Significant Optional Comment To determine this indicator, it is not necessary to have message on the voice server.

ETSI
ETSI ES 202 765-4 V1.2.1 (2014-05)20
7.2 Post Dialling Delay Definition The indicator evaluates service availability to set up calls in an acceptable delay. It is linked
to the service architecture complexity, and to the performance of the constituting network elements. Post Dialling Delay is the time interval between the end of dialling by the caller and the reception back of the appropriate ringing tone. In this specific case, Post Dialling Delay characterizes the delay to contact (from a given access) the voice messaging platform.
Assessment method This indicator is determined from a given access such as PSTN, mobile or IP terminal. Post Dialling Delay characterizes only the caller part of the call configuration.
Unit Millisecond with an integer value Standardization reference
Significant Optional Comment NOTE: For information, the target set up time for universal telephony service has been
set up to 2 900 ms in the French regulator recommendation.
7.3 Pick Up Delay Definition The indicator evaluates service availability to voice messaging connection in an acceptable
delay. This delay corresponds to the Post Dialling Delay increased by time interval between the beginning of ringing tone and the call establishment.
Assessment method As the Post Dialling Delay, Pick Up Delay characterizes only the caller part of the call configuration. In a practical way, this indicator is determined by starting a counter at the end of dialling and stopping this counter when voice messaging announce is receive on the caller part.
Unit Millisecond with an integer value. Standardization reference
Significant Optional Comment
7.4 Message Provisioning Delay Definition The indicator evaluates service availability to deliver voice messages. This delay
corresponds to the time interval between the end of message deposal on the server and the provisioning of this message to the customer.
Assessment method This indicator is the number of successive call attempts to voice messaging (immediately after voice message deposit) necessities to obtain voice message diffusion.
Unit Number of voice messaging attempts (in integer) Standardization reference
Significant Optional Comment

ETSI
ETSI ES 202 765-4 V1.2.1 (2014-05)21
7.5 Voice message quality Definition This indicator characterizes quality of voice messages. This quality takes into account the
degradation due to network transmission during the deposal period on messaging platform, the degradation due to saving process on the server and the degradation due to network transmission during message restoration period.
Assessment method Two models are available for voice quality evaluation:
• Recommendation ITU-T P.862 [7] with the mapping functions according to Recommendation ITU-T P.862.1 [8], adapted to assess narrow-band communications.
• Recommendation ITU-T P.863 [13], adapted to assess narrow-band, wide band and super wide band communications.
Both models determine a Mean Opinion Score - Listening Quality Objective (MOS-LQO) which is an objective view on the quality of the voice signal as it may be perceived by the customer.
The MOS-LQO score is obtained by comparing speech samples:
• the original signal sent by the far end of the connection; • the degraded signal received at the local end, where the measurement is applied.
Since during a call, speech quality can vary, several MOS-LQO scores should be determined in series during the same call. So for a given transmission way, listening speech quality performance during the call is defined by the mean value of MOS-LQO measurements (in the same direction). The use of the Recommendation ITU-T P.862 [7] has some limitations. Recommendation ITU-T P.862.3 [9] provides some important remarks that should be taken into account in the objective quality evaluation of speech conforming to Recommendations ITU-T P.862 [7] and P.862.1 [8]. The use of the Recommendation ITU-T P.863 [13] has also limitations. Recommendation ITU-T P.863.1 [14] provides important explanations that should be taken into account in the objective quality evaluation of speech. Users of Recommendation ITU-T P.862 [7] and users of Recommendation ITU-T P.863 [13] should understand and follow the respective guidance given with these Recommendations.
Unit Rating between 1 (= very bad) and 5 (= excellent) determines on MOS-LQO scale with a resolution of one digit after the decimal point.
Standardization reference
Recommendations ITU-T P.800.1 [10], ITU-T P.800.2 [15], ITU-T P.862 [7], ITU-T P.862.1 [8], ITU-T P.862.3 [9], ITU-T P.863 [13] and ITU-T P.863.1 [14].
Significant Optional Comment General comments:
The value of this indicator depends on the used codec, but also on impairments like IP packet loss or low signal to noise ratio.
To make easier result comparisons, it is recommended to use the same speech samples and quality scales in all test configurations.
MOS-LQO scales: The implementation of Recommendation ITU-T P.862 [7] with the mapping functions according to Recommendation ITU-T P.862.1 [8] involves the determination of a MOS-LQO indicator on a narrowband scale (MOS-LQON).This implementation applies only on narrow-band conditions.
The implementation of Recommendation ITU-T P.863 [13] in the super-wideband mode involves the determination of a MOS-LQO indicator on a super-wideband scale (MOS-LQOSW). This implementation applies on narrow-band, wide-band and super wide-band conditions.
Because Recommendation ITU-T P.862 [7] and Recommendation ITU-T P.863 [13] are two different models, MOS-LQO indicator produced by these Recommendations on a narrowband scale are not the same and shall not be compared.
Choice of model: Recommendation ITU-T P.863 [13] should be preferred.
But if Recommendation ITU-T P.862 [7] is already being used for characterization in a purely narrowband context, and if this context is not likely to be concerned by modification of the time scale of received signals (e.g. by the application of time warping mechanisms), then this Recommendation can still be used.

ETSI
ETSI ES 202 765-4 V1.2.1 (2014-05)22
Reference signal: Particular attention should be paid to the choice of the test signal (reference signal).
The reference signal used with the Recommendation P.863 [14] should comply with different constraints (transparency, duration, active speech level, noise floor, etc.).
The full list of tests required to validate the reference signal is described in the Application Guide, Recommendation ITU-T P.863.1 [14].
Settings: To characterize a given configuration, it is recommended to perform at least 25 to 30 measurements before calculating a mean value of the MOS-LQO.
Recommendation ITU-T P.863 [13] has the ability to assess the voice quality by taking account of speech level modification. Nevertheless, it is highly recommended to enable the level alignment option.
8 List of IPTV indicators The indicators proposed in the context of end-user quality survey of IPTV services are:
8.1 Channel Availability Definition This metric measures IPTV service accessibility in terms of capacity to provide channel
content to customer. Successful access to a channel is performed when the customer sends a zapping order. This metric is expressed in term of ratio with the following information:
• Number of successful channel accesses with both video and audio available • Number of attempts
Number of successful channel accesses Service Channel Availability = ――――――――――――――――――― Number of attempts An incident is detected on a channel as soon as video is not moving (black screen or frozen picture) and\or as soon as the audio is absent.
Assessment method In practical way, this indicator can be measured, from the user access, by connecting to the channel. The channel is considered as available if the IPTV service provides audio and video. The different attempts to channel access should be made periodically. The time interval between 2 attempts to channel access needs not to be more than 15 minutes.
Unit % Standardization reference
Significant Mandatory Comment When delivering a set of TV channels to the end-user, the audio and video content might be
missing even so a MPEG TS stream is detected by passive monitoring systems. The video artefact is usually called "black screen" and can be considered as one of the major troubles experienced by IPTV customers. It can be associated with a complete lack of audio. These two artefacts when appearing are really annoying for an IPTV end-user. To avoid generation of wrong alarm, the analysis period should be at least 8 seconds or 10 seconds, because e.g. there are between advertising sequences "black screen" or "frozen pictures" that are not intended to be seen or perceived by the users as artefacts.

ETSI
ETSI ES 202 765-4 V1.2.1 (2014-05)23
8.2 Service Group Channel Availability Definition This metric measures IPTV service accessibility in terms of capacity to provide content of all
channels into a group of channel. This metric is expressed in term of ratio with the following information:
• Number of successful channel accesses with both video and audio available. • Number of attempts.
Service Group Channel Availability = (∑ on all channel in the IPTV offer) Number of successful channel accesses = ――――――――――――――――――――――――――――――――― (∑ on all channel in the IPTV offer) Number of attempts An incident is detected on a channel as soon as video is not moving (black screen or frozen picture) and\or as soon as the audio is absent.
Assessment method In practical way, this indicator can be measured, from the user access, by connecting to all channel contained in the group. A group channel is considered as available if the IPTV services provide audio and video on all channels. The different attempts to channel access should be made periodically. The time interval between 2 attempts to channel access needs not to be more than 15 minutes.
Unit % Standardization reference
Significant Mandatory Comment To avoid generation of wrong alarm, the analysis period should be at least 8 or 10 seconds,
because e.g. there are between advertising sequences "black screen" or "frozen pictures" that are not intended to be seen or perceived by the users as artefacts. This metric does not take into account the access control aspect. The evaluation of this indicator should be performed by making sure that all channels of the offer are accessible and are not blocked by a lack of access control.
8.3 Video Quality Definition The indicator evaluates the quality of video stream delivered to the user. The indicator
characterizes the perception of the IPTV end-users in term of video quality. The Mean Opinion Score (MOS) is intended to represent the subjective perception described by a score (from 1 to 5) that an end-user of the IPTV service would have given if he or she has watched the considered video sequence. MOS score defining this parameter comes from objective quality measurement, either determined by a quality measurement algorithm which tries to derive a score from the analysis of the output video signal, or from a parametric model computed through the monitoring of a video stream.
Assessment method To take into account the end user context, only objective measurements models based on No Reference approach correspond to the need. The current issue is that there is no standardized algorithm in that area. Recommendation ITU-T J.247 [i.4] is not applicable in this context because J.247 is a model functioning with reference. Recommendation ITU-T J.144 [i.3] is also not applicable in this context due to these restrictions (synchronization issues, not applicable to MPEG4).
Unit Standardization reference
Significant Comment Even if there is a need for models without reference there is no available standardized model
for the time being; there is no standardized algorithm sufficiently reliable for performing such measurements on a large scale. For the time being, it is proposed to qualify video quality by the occurrence of particular degradations like "black screen", blockiness and frozen picture. These parameters will be replaced when available by an indicator provided by a validated video quality model functioning without reference.

ETSI
ETSI ES 202 765-4 V1.2.1 (2014-05)24
8.4 Audio Quality Definition When delivering the video flow to the end-user, it may appear that the audio part of the
stream is damaged or missing. This may originate from the source of the encoding chain, but it has a strong impact on the user-experience as it will have the image displayed on the TV set associated to a very bad (or not) sound. The indicator evaluates the quality of audio stream within IPTV service.
Assessment method In the context of end user evaluation without access to provider network, the assessment method should perform a methodology "without reference". Because access to RTP flow is not possible a parametric model is not applicable in this context. Speech evaluation methodologies or speech quality assessment models are not appropriate to evaluate audio quality. These methodologies or these models can not be performed for audio quality evaluation.
Unit Standardization reference
Significant Mandatory Comment Currently, there is no standardized model "without reference" for audio quality evaluation. In
this context the most suitable approach is to determine the occurrence of audio interruption and low audio level sequence in the audio stream. This analysis should be performed on the left and right channels. This indicator could be presented as the number of degradation or in ratio (number of degradation by time unit). These parameters will be replaced when available by a standardized indicator provided by a validated audio quality model functioning without reference.
8.5 "Black Screen" Occurrences Definition Currently, a major trouble of IPTV service is the display on the TV set of a "black screen".
Black screen can outcome from: • encoder/decoder implementation when no video stream is present; • a major loss of video packet during a long period of time.
This metric corresponds to the number of black screen sequences during a time period (24 hours, 1 week, etc.). "Black screen" is one of the cases of "isochrominance".
Assessment method This default is detected mainly by using robots or probes implementing objective video signal measurement algorithms that are able to detect an image fully coloured in black. Currently, this is the most suitable approach so as to perform a consistent signal-based analysis.
Unit Number or Ratio (number of occurrence by time unit) Standardization reference
Significant Mandatory Comment The duration of the measurement should be greater than the "inter –advertisements"
duration, because sometimes the broadcasters insert "black screen" sequences not visible by the users between advertising.
ETSI
ETSI ES 202 765-4 V1.2.1 (2014-05)25
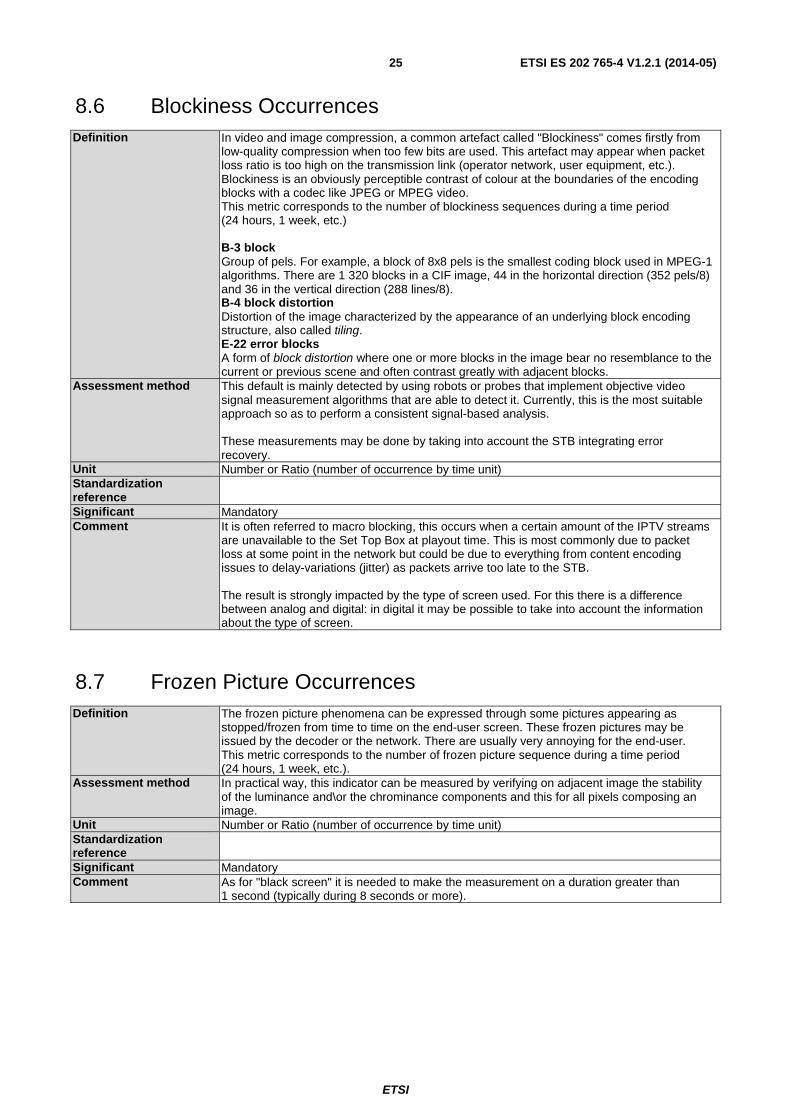
8.6 Blockiness Occurrences Definition In video and image compression, a common artefact called "Blockiness" comes firstly from
low-quality compression when too few bits are used. This artefact may appear when packet loss ratio is too high on the transmission link (operator network, user equipment, etc.). Blockiness is an obviously perceptible contrast of colour at the boundaries of the encoding blocks with a codec like JPEG or MPEG video. This metric corresponds to the number of blockiness sequences during a time period (24 hours, 1 week, etc.) B-3 block Group of pels. For example, a block of 8x8 pels is the smallest coding block used in MPEG-1 algorithms. There are 1 320 blocks in a CIF image, 44 in the horizontal direction (352 pels/8) and 36 in the vertical direction (288 lines/8). B-4 block distortion Distortion of the image characterized by the appearance of an underlying block encoding structure, also called tiling. E-22 error blocks A form of block distortion where one or more blocks in the image bear no resemblance to the current or previous scene and often contrast greatly with adjacent blocks.
Assessment method This default is mainly detected by using robots or probes that implement objective video signal measurement algorithms that are able to detect it. Currently, this is the most suitable approach so as to perform a consistent signal-based analysis. These measurements may be done by taking into account the STB integrating error recovery.
Unit Number or Ratio (number of occurrence by time unit) Standardization reference
Significant Mandatory Comment It is often referred to macro blocking, this occurs when a certain amount of the IPTV streams
are unavailable to the Set Top Box at playout time. This is most commonly due to packet loss at some point in the network but could be due to everything from content encoding issues to delay-variations (jitter) as packets arrive too late to the STB. The result is strongly impacted by the type of screen used. For this there is a difference between analog and digital: in digital it may be possible to take into account the information about the type of screen.
8.7 Frozen Picture Occurrences Definition The frozen picture phenomena can be expressed through some pictures appearing as
stopped/frozen from time to time on the end-user screen. These frozen pictures may be issued by the decoder or the network. There are usually very annoying for the end-user. This metric corresponds to the number of frozen picture sequence during a time period (24 hours, 1 week, etc.).
Assessment method In practical way, this indicator can be measured by verifying on adjacent image the stability of the luminance and\or the chrominance components and this for all pixels composing an image.
Unit Number or Ratio (number of occurrence by time unit) Standardization reference
Significant Mandatory Comment As for "black screen" it is needed to make the measurement on a duration greater than
1 second (typically during 8 seconds or more).
ETSI
ETSI ES 202 765-4 V1.2.1 (2014-05)26
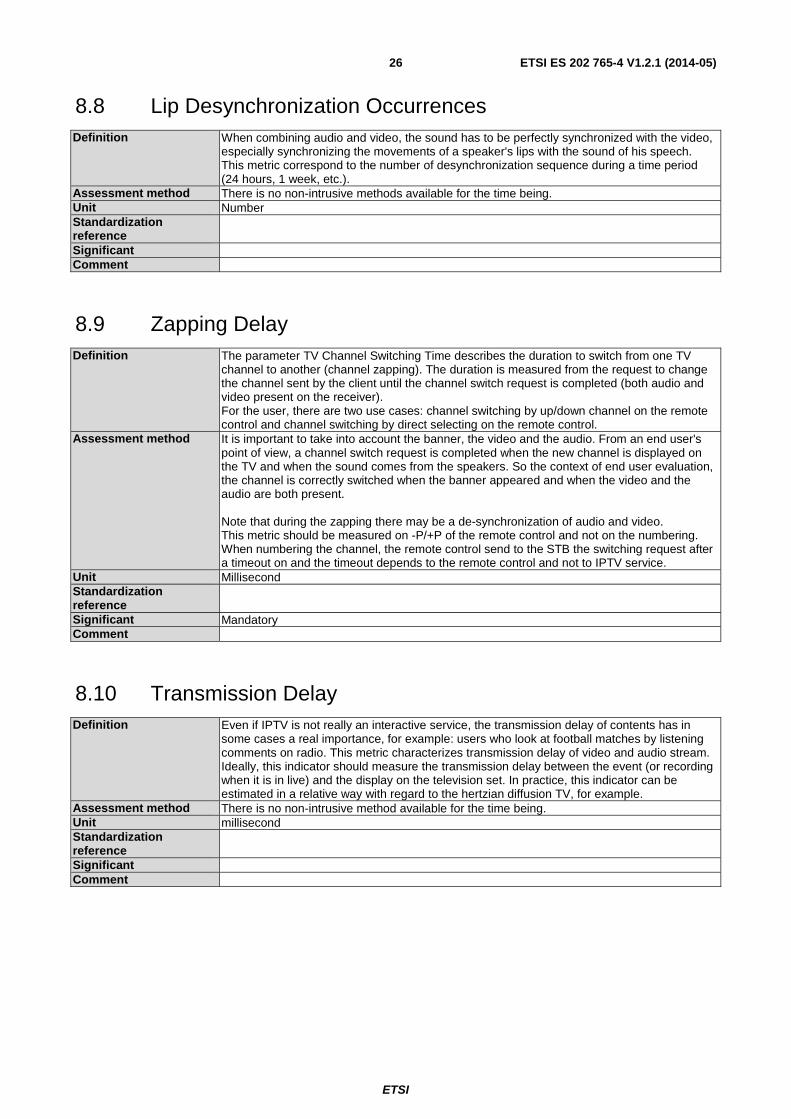
8.8 Lip Desynchronization Occurrences Definition When combining audio and video, the sound has to be perfectly synchronized with the video,
especially synchronizing the movements of a speaker's lips with the sound of his speech. This metric correspond to the number of desynchronization sequence during a time period (24 hours, 1 week, etc.).
Assessment method There is no non-intrusive methods available for the time being. Unit Number Standardization reference
Significant Comment
8.9 Zapping Delay Definition The parameter TV Channel Switching Time describes the duration to switch from one TV
channel to another (channel zapping). The duration is measured from the request to change the channel sent by the client until the channel switch request is completed (both audio and video present on the receiver). For the user, there are two use cases: channel switching by up/down channel on the remote control and channel switching by direct selecting on the remote control.
Assessment method It is important to take into account the banner, the video and the audio. From an end user's point of view, a channel switch request is completed when the new channel is displayed on the TV and when the sound comes from the speakers. So the context of end user evaluation, the channel is correctly switched when the banner appeared and when the video and the audio are both present. Note that during the zapping there may be a de-synchronization of audio and video. This metric should be measured on -P/+P of the remote control and not on the numbering. When numbering the channel, the remote control send to the STB the switching request after a timeout on and the timeout depends to the remote control and not to IPTV service.
Unit Millisecond Standardization reference
Significant Mandatory Comment
8.10 Transmission Delay Definition Even if IPTV is not really an interactive service, the transmission delay of contents has in
some cases a real importance, for example: users who look at football matches by listening comments on radio. This metric characterizes transmission delay of video and audio stream. Ideally, this indicator should measure the transmission delay between the event (or recording when it is in live) and the display on the television set. In practice, this indicator can be estimated in a relative way with regard to the hertzian diffusion TV, for example.
Assessment method There is no non-intrusive method available for the time being. Unit millisecond Standardization reference
Significant Comment

ETSI
ETSI ES 202 765-4 V1.2.1 (2014-05)27
8.11 IPTV service boot delay Definition This indicator measures the delay of service provision between a user command on STB and
the display of the first image associated with audio. 2 types of boot delay may be discerned: the starting up after a command supply switching and the starting up after a command of standby exit.
Assessment method In practical way, this metric could be determined by measuring the time between the user command on STB (command supply switching or command of standby exit) and the display of the first image associated with audio.
Unit Millisecond or second Standardization reference
Significant Optional Comment
9 List of VoD indicators The indicators proposed in the context of end-user quality survey of VoD services are:
9.1 VoD Service Availability Definition Measurement of service accessibility in terms of capacity to provide VoD content to
customer. This ratio is based on the Number of VoD successfully accessed compared with Number of VoD Commands. This metric is expressed in term of ratio with the following information:
• Number of successful channel accesses with both video and audio available. • Number of attempts.
Number of successful channel accesses Service Channel Availability = ――――――――――――――――――― Number of attempts An incident is detected on a channel as soon as video is not moving (black screen or frozen picture) and\or as soon as the audio is absent.
Assessment method In practical way, this indicator can be measured, from the user access, by connecting to the VoD service. VoD service is considered as available if the VoD service provides both audio and video. The different attempts to VoD service should be made periodically. The time interval between 2 attempts to VoD service needs not to be more than 15 minutes.
Unit % Standardization reference
Significant Mandatory Comment It is important to change regularly the titles of the purchased movies via the service of VoD.
It is proposed to test the availability on a panel of 5 movies and it is also proposed to change the contents of this panel every month to take into account the new titles proposed in the catalogue.
ETSI
ETSI ES 202 765-4 V1.2.1 (2014-05)28
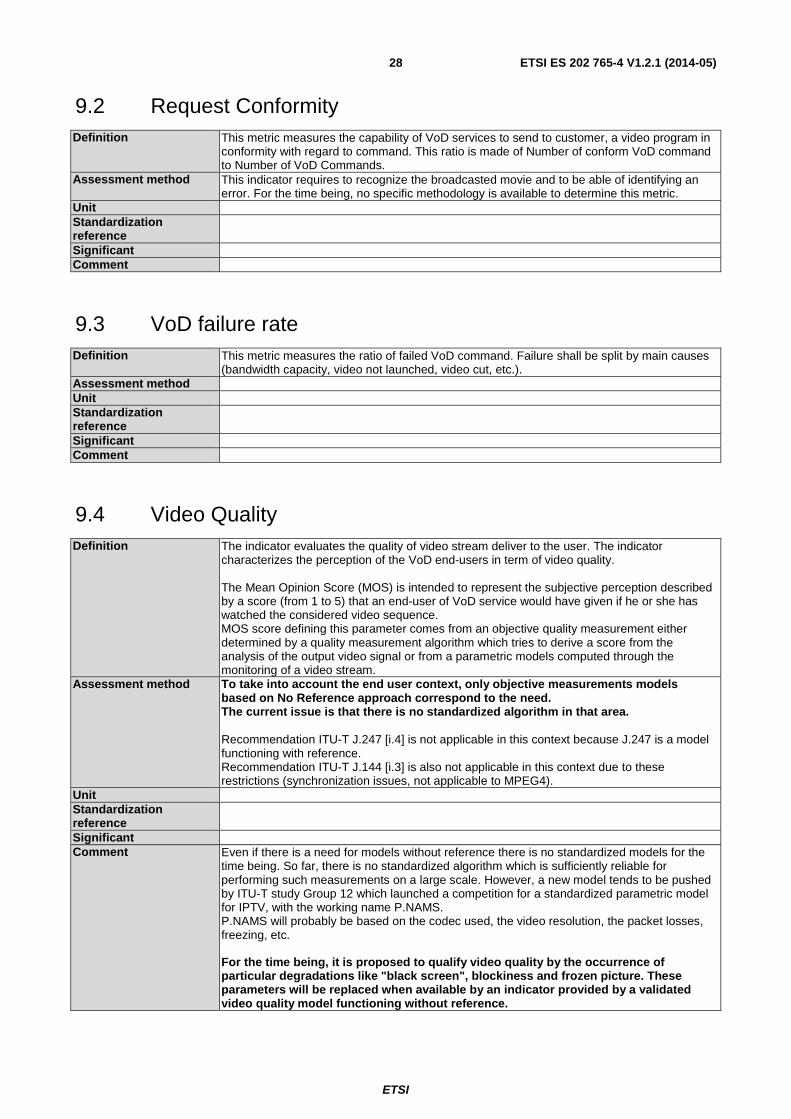
9.2 Request Conformity Definition This metric measures the capability of VoD services to send to customer, a video program in
conformity with regard to command. This ratio is made of Number of conform VoD command to Number of VoD Commands.
Assessment method This indicator requires to recognize the broadcasted movie and to be able of identifying an error. For the time being, no specific methodology is available to determine this metric.
Unit Standardization reference
Significant Comment
9.3 VoD failure rate Definition This metric measures the ratio of failed VoD command. Failure shall be split by main causes
(bandwidth capacity, video not launched, video cut, etc.). Assessment method Unit Standardization reference
Significant Comment
9.4 Video Quality Definition The indicator evaluates the quality of video stream deliver to the user. The indicator
characterizes the perception of the VoD end-users in term of video quality. The Mean Opinion Score (MOS) is intended to represent the subjective perception described by a score (from 1 to 5) that an end-user of VoD service would have given if he or she has watched the considered video sequence. MOS score defining this parameter comes from an objective quality measurement either determined by a quality measurement algorithm which tries to derive a score from the analysis of the output video signal or from a parametric models computed through the monitoring of a video stream.
Assessment method To take into account the end user context, only objective measurements models based on No Reference approach correspond to the need. The current issue is that there is no standardized algorithm in that area. Recommendation ITU-T J.247 [i.4] is not applicable in this context because J.247 is a model functioning with reference. Recommendation ITU-T J.144 [i.3] is also not applicable in this context due to these restrictions (synchronization issues, not applicable to MPEG4).
Unit Standardization reference
Significant Comment Even if there is a need for models without reference there is no standardized models for the
time being. So far, there is no standardized algorithm which is sufficiently reliable for performing such measurements on a large scale. However, a new model tends to be pushed by ITU-T study Group 12 which launched a competition for a standardized parametric model for IPTV, with the working name P.NAMS. P.NAMS will probably be based on the codec used, the video resolution, the packet losses, freezing, etc. For the time being, it is proposed to qualify video quality by the occurrence of particular degradations like "black screen", blockiness and frozen picture. These parameters will be replaced when available by an indicator provided by a validated video quality model functioning without reference.

ETSI
ETSI ES 202 765-4 V1.2.1 (2014-05)29
9.5 Audio Quality Definition Because audio stream is integral part of the VoD (as video flow), it is necessary to estimate
its quality. The indicator evaluates the quality of audio stream within VoD service. Assessment method In the context of end user evaluation without access to provider network, the assessment
method should perform a methodology "without reference". Because access to RTP flow is not possible a parametric model is not applicable in this context. Speech evaluation methodologies or speech quality assessment models are not appropriate to evaluate audio quality. These methodologies or these models can not be performed for audio quality evaluation.
Unit Standardization reference
Significant Mandatory Comment Currently, there is no standardized model "without reference" for audio quality
evaluation. In this context the most suitable approach is to determine "audio cut" (or "audio lack") occurrence and low audio level sequence in the audio stream. These analysis should be performed on the left and right side channels. This indicator could be presented as the number of degradation or in ratio (number of degradation by time unit). These parameters will be replaced when available by a standardize indicator provided by a validated audio quality model functioning without reference.
9.6 "Black Screen" Occurrences Definition This metric corresponds to the number of black screen sequence during a time period.
Currently, a major trouble of VoD service is the display on the TV set of a "black screen". Black screen can outcome from:
• encoder/decoder implementation when no video stream is present; • a major loss of video packet during a long period of time.
This metric corresponds to the number of black screen sequence during a time period (24 hours, 1 week, etc.). "Black screen" is one of the cases of "isochrominance".
Assessment method This default is detected mainly by using robots or probes implementing objective video signal measurement algorithms that are able to detect an image fully coloured in black. Currently, this is the most suitable approach so as to perform a consistent signal-based analysis.
Unit Number or Ratio (number of occurrence by time unit) Standardization reference
Significant Mandatory Comment The duration of the measurement should be greater than the "inter-advertisements" duration,
because sometimes the broadcartors insert sequences e.g. black screen" not visible by the users between advertising.

ETSI
ETSI ES 202 765-4 V1.2.1 (2014-05)30
9.7 Blockiness Occurrences Definition This metric corresponds to the number of blockiness sequence during a time period.
In video and image compression, a common artefact called "Blockiness" comes firstly from low-quality compression when too few bits are used. This artefact may appear when packet loss ratio is too high on the transmission link (operator network, user equipment, etc.). Blockiness is an obviously perceptible contrast of colour at the boundaries of the encoding blocks with a codec like JPEG or MPEG video. This metric correspond to the number of blockiness sequence during a time period (24 hours, 1 week, etc.). B-3 block Group of pels. For example, a block of 8x8 pels is the smallest coding block used in MPEG-1 algorithms. There are 1 320 blocks in a CIF image, 44 in the horizontal direction (352 pels/8) and 36 in the vertical direction (288 lines/8). B-4 block distortion Distortion of the image characterized by the appearance of an underlying block encoding structure, also called tiling. E-22 error blocks A form of block distortion where one or more blocks in the image bear no resemblance to the current or previous scene and often contrast greatly with adjacent blocks.
Assessment method This default is mainly detected by using robots or probes that implement objective video signal measurement algorithms that are able to detect it. Currently, this is the most suitable approach so as to perform a consistent signal-based analysis. These measurements may be done by taking into account the STB integrating error recovery.
Unit Number or Ratio (number of occurrence by time unit) Standardization reference
Significant Mandatory Comment It is often referred to macro blocking, this occurs when a certain amount of the VoD streams
are unavailable to the Set Top Box at playout time. This is most commonly due to packet loss at some point in the network but could be due to everything from content encoding issues to delay-variations (jitter) as packets arrive too late to the STB. The result is strongly impacted by the type of screen used. For this there is a difference between analog and digital: in digital it may be possible to take into account the information about the type of screen.
9.8 Frozen Picture Occurrences Definition This metric corresponds to the number of frozen picture sequence during a time period.
The frozen picture phenomena can be expressed through some pictures appearing as stopped/frozen from time to time on the end-user screen. These freezes may be issued by the decoder or the network. There are usually very annoying for the end-user. This metric correspond to the number of frozen picture sequence during a time period (24 hours, 1 week, etc.).
Assessment method In practical way, this indicator can be measured by verifying on adjacent image the stability of the luminance and\or the chrominance components and this for all pixels composing an image.
Unit Number or Ratio (number of occurrence by time unit) Standardization reference
Significant Mandatory Comment As for "black screen" it is needed to make the measurement on a duration greater than
1 second (typically during 8 seconds or more).

ETSI
ETSI ES 202 765-4 V1.2.1 (2014-05)31
10 Measurement frequency Measurements need to take into account the possible variations of quality versus time. In this context, it is important to adapt the measurement frequency with the possible variations of quality. So it does not seem reasonable to go beyond 10 minutes to 15 minutes between two consecutive analyses. A measurement frequency of 4 or 5 analysis by hour is adapted to end-user quality survey of multiplay services. This recommended measurement frequency applies for all indicators defined in clauses 6 to 9.
11 Measurement locations and their distribution One measurement point is not enough to obtain a macroscopic view of the service quality offered to the users. Ideally it should be necessary to deploy an analysis point per configuration (network architecture, equipment version and so on) but economic costs associated to probes (to buy, to install and to monitor) are not realistic.
If only one analysis point and one analysis point per configuration are not satisfactory solutions for the supervision of the quality of multiplay services, it is clear that more important the point number is better the service supervision will be. It is also important that the measurement points be located over the whole areas covered by the multiplay offer but also that these measurement points be spread according to the size of "area".
As described in ES 202 765-2 [12], for multiplay offers deployed in a perimeter of potential users greater or equal to 10 000 000, at least 10 analysis points should to be distributed over the perimeter. For multiplay offers deployed in a perimeter of potential users lower than 10 000 000, at least 5 analysis points should to be distributed over the perimeter.
The analysis points should be distributed over the 5 types of geographic areas:
• "Areas" with more than 1 000 000 inhabitants.
• "Areas" from 500 000 to 1 000 000 inhabitants.
• "Areas" from 250 000 to 500 000 inhabitants.
• "Areas" from 25 000 to 250 000 inhabitants.
• "Areas" with less than 25 000 inhabitants.
12 Results presentation For reporting, the presentation of each metric shall be made separately. Each metric shall be presented on its own scale.
For each indicator, presentation results shall consist at least of presenting metric value, number of measurements to determine the metric value and measurement standard deviation.
But in order to give a quick overview of all quality parameters, a specific representation (overview visualization defined in Recommendation ITU-T P.505 [11]) of the metric value will be used. This representation reveals at one glance the strengths and weaknesses of each services (Internet, Voice messaging, IPTV and VoD) by reference to non-compliant limits.
The one-view visualization is based on a circular presentation of indicators ("pie diagram") where each metric value represents a circle segment of the diagram.
Figures 2 and 3 present 2 examples of "pie diagram" presentation.

ETSI
ETSI ES 202 765-4 V1.2.1 (2014-05)32
Access Availability
98
95
88
91
94
97
100
DownlaodBit Rate
5972
5000
0
2000
4000
6000
8000
UploadBit Rate
612
500
-200
100
400
700
1000
99Unsuccessful FTP
Download Ratio
9588 91 94 97 100
98Unsuccessful FTP
Upload Ratio
95
88
91
94
97
100
96Unsuccessful
HTTP Ratio
95
88
91
94
97
100
65Ping Delay
40
81
54
27
0
4125Login Time
4000
8001
5334
2667
0
2862Webpage
Download Speed
2000
533239992666
13330
FTP DownloadSpeed5670
5000
0
2000
4000
6000
8000
FTP UploadSpeed
527
500
-200
100
400
700
1000
Figure 2: Example of "pie diagram" representing results of Internet service indicators
Channel 1Availability
98.2
98
95
96
97
98
99
100Channel 2Availability
100
98
95
96
97
98
99
100
Channel 3Availability
99.2
98
9596
9798
99100
96.7Channel 4Availability
98
9596
9798
99100
2Audio Quality
10
21
14
7
0
13.7Blockiness
Occurrences
10
21
14
7
0
0.2Black ScreenOccurrences
10
21
14
7
0
2.8Frozen PictureOccurrences
10
2114
70
Zapping delay
4225
3000
80006000
40002000
0
Boot delay
7893
10000
20001
13334
6667
0
Figure 3: Example of "pie diagram" presenting results of IPTV indicators

ETSI
ETSI ES 202 765-4 V1.2.1 (2014-05)33
Annex A (normative): Principle of artefact detection algorithms To test artefact detection algorithms, specific video sequences are available on the ETSI server http://docbox.etsi.org/STQ/Open/Video-Sequences_STQ%2333/.
These video sequences present degradations like frozen picture, monochromatic screen and block effect and it is possible to use them to test performances of the detection algorithms.
A.1 Detection principle of frozen picture occurrence The method to detect frozen picture occurrence perceived by users requires the implementation of 2 modules:
• first module for frozen picture occurrence detection on video sequence; and
• the second module of decision to discriminate between frozen picture occurrence perceived by users from those not perceived.
Video stream
Module of frozen picture
effect detection
Decision module for
discrimination of perceive
frozen picture effect
Frozen picture occurrence
Figure A.1
The detection of frozen picture in a video sequence consists in:
• Verifying on adjacent image the stability of the luminance and\or the chrominance components and this for all pixels composing an image. The stability means that for pixels forming an image the luminance and\or the chrominance components are identical (with a tolerance range) for two (or more) successive pictures.

ETSI
ETSI ES 202 765-4 V1.2.1 (2014-05)34
The module of discrimination consists in deciding on the perception (or not) of frozen picture occurrences. For a given sequence of analysis (10 seconds of video sequence), the module of discrimination decides from the results obtained by the detection on one hand and from a psycho visual criterion on the other hand, of the visibility (or user perception) of the frozen picture. The psycho visual criterion is a temporal criterion. In order to avoid false detection, it is allowed that a frozen picture sequence is annoying if the duration of this artefact is more than one second.
A.2 Detection principle of "black screen" occurrence The method to detect "black screen" occurrence perceived by users requires the implementation of 2 modules:
• first module for "black screen" occurrence detection on picture and video sequence; and
• the second module of decision to discriminate between "black screen" occurrence perceived by users from those not perceived.
Video stream
Module of "black screen" effect detection
Decision module for
discrimination of perceive
"black screen" effect
Black screen occurrence
Figure A.2
The detection of "black screen" occurrence in an image consists in:
• verifying for the totality of pixels of an image the stability of the luminance and\or the chrominance components. The stability means that the luminance and\or the chrominance components are identical (with a tolerance range) for all the pixels composing an image.
The module of discrimination consists in deciding on the perception (or not) of "black screen" occurrences. For a given sequence of analysis (10 seconds of video sequence), the module of discrimination decides from the results obtained by the detection on one hand and from a psycho visual criterion on the other hand, of the visibility (or user perception) of monochrome screens. The psycho visual criterion is a temporal criterion. In order to avoid false detection, it is allowed that a monochrome screen is annoying for the user if the duration of this artefact is more than one second.

ETSI
ETSI ES 202 765-4 V1.2.1 (2014-05)35
A.3 Detection principle of blockiness occurrence The method to detect blockiness effects perceived by users requires the implementation of 2 modules:
• first module for potential blockiness effects detection on picture and video sequence; and
• the second module of decision to discriminate between real and perceived blockiness effects detected by users from those not perceived.
Video stream
Module of blockiness
effect detection
Decision module for
discrimination of perceive blockiness
effect
Blockinessoccurrence
Figure A.3
The detection of the blockiness artefact in an image consists in:
• Calculating in at least a given direction (line or column) for pixels of a picture, the absolute value of the difference of the luminance and\or the chrominance components between adjacent pixels to generate a "delta image".
• Generating a binary image from the "delta image". The binary value 1 is attributed if the absolute value of the difference of the luminance and\or the chrominance components is superior to absolute values of the difference of luminance and\or chrominance of a number h of adjacent pixels in a given direction (line or column). The binary value 0 is attributed in the opposite occur. The binary image is representative of the existence (or not) of blockiness artefact.
• Eliminating the false "edge" detection by using a spatial statistical analysis according to the encoding video scheme.
The module of discrimination consists in deciding on the perception (or not) of detected blockiness occurrences. For a given sequence of analysis (10 seconds of video sequence), the module of discrimination decides from the results obtained by the detection on one hand and from the psycho visual criteria on the other hand, of the visibility (or user perception) of blockinness artefacts. The psycho visual criteria are criteria of temporal spatial types. It is assumed that a blockiness effect is perceptible if this represents more than 4 % of the image on duration of one second or more.

ETSI
ETSI ES 202 765-4 V1.2.1 (2014-05)36
Annex B (informative): Comparisons of ES 202 765-4 and TS 102 250-2 (V2.2.1) parameters
ES 202 765-4 TS 102 250-2 N° Title Definition N° Title definition 6 List of Internet access indicators
6.1 Availability of Internet Access This metric represents the probability for a customer that Internet applications are attainable from his Internet access. It denotes the probability for a customer that his Internet access is available.
6.2 Internet Download Bit Rate 6.3 Internet Upload Bit Rate 6.4 Unsuccessful FTP Download
session Ratio This metric represents the ratio of unsuccessful FTP download sessions as a measure of the Internet service accuracy.
6.1.5 or 6.1.8
FTP {Download|Upload} Session Failure Ratio [%] or FTP {Download|Upload} Data Transfer Cut-off Ratio [%]
The session failure ratio is the proportion of uncompleted sessions and sessions that were started successfully. The data transfer cut-off ratio is the proportion of incomplete data transfers and data transfers that were started successfully.
6.5 Unsuccessful FTP Upload session Ratio
This metric represents the ratio of unsuccessful FTP upload sessions as a measure of the Internet service accuracy.
6.1.5 or 6.1.8
FTP {Download|Upload} Session Failure Ratio [%] or FTP {Download|Upload} Data Transfer Cut-off Ratio [%]
The session failure ratio is the proportion of uncompleted sessions and sessions that were started successfully. The data transfer cut off ratio is the proportion of incomplete data transfers and data transfers that were started successfully.
6.6 Unsuccessful HTTP session Ratio
This metric represents the ratio of unsuccessful web browsing attempts as a measure of the Internet service accuracy.
6.8.5 HTTP Session Failure Ratio [%] or HTTP Data Transfer Cut-off Ratio [%]
The completed session ratio is the proportion of uncompleted sessions and sessions that were started successfully. The data transfer cut-off ratio is the proportion of incomplete data transfers and data transfers that were started successfully.
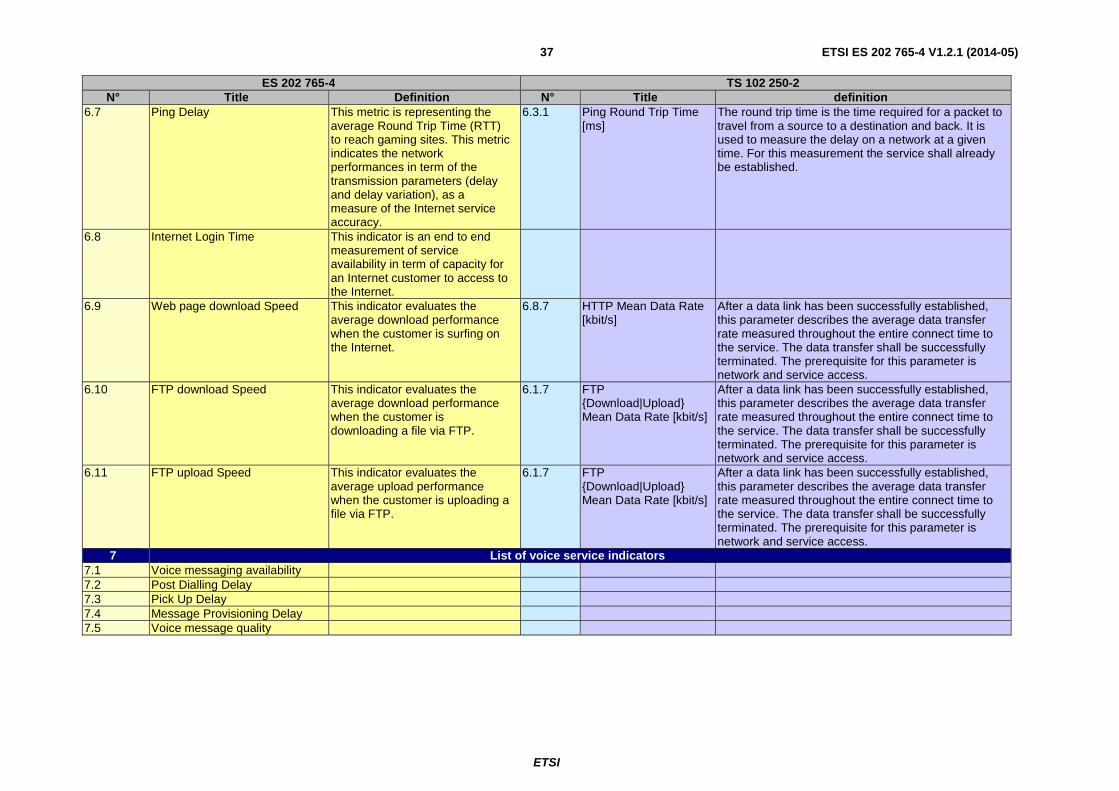
ETSI
ETSI ES 202 765-4 V1.2.1 (2014-05)37
ES 202 765-4 TS 102 250-2 N° Title Definition N° Title definition
6.7 Ping Delay This metric is representing the average Round Trip Time (RTT) to reach gaming sites. This metric indicates the network performances in term of the transmission parameters (delay and delay variation), as a measure of the Internet service accuracy.
6.3.1 Ping Round Trip Time [ms]
The round trip time is the time required for a packet to travel from a source to a destination and back. It is used to measure the delay on a network at a given time. For this measurement the service shall already be established.
6.8 Internet Login Time This indicator is an end to end measurement of service availability in term of capacity for an Internet customer to access to the Internet.
6.9 Web page download Speed This indicator evaluates the average download performance when the customer is surfing on the Internet.
6.8.7 HTTP Mean Data Rate [kbit/s]
After a data link has been successfully established, this parameter describes the average data transfer rate measured throughout the entire connect time to the service. The data transfer shall be successfully terminated. The prerequisite for this parameter is network and service access.
6.10 FTP download Speed This indicator evaluates the average download performance when the customer is downloading a file via FTP.
6.1.7 FTP {Download|Upload} Mean Data Rate [kbit/s]
After a data link has been successfully established, this parameter describes the average data transfer rate measured throughout the entire connect time to the service. The data transfer shall be successfully terminated. The prerequisite for this parameter is network and service access.
6.11 FTP upload Speed This indicator evaluates the average upload performance when the customer is uploading a file via FTP.
6.1.7 FTP {Download|Upload} Mean Data Rate [kbit/s]
After a data link has been successfully established, this parameter describes the average data transfer rate measured throughout the entire connect time to the service. The data transfer shall be successfully terminated. The prerequisite for this parameter is network and service access.
7 List of voice service indicators 7.1 Voice messaging availability 7.2 Post Dialling Delay 7.3 Pick Up Delay 7.4 Message Provisioning Delay 7.5 Voice message quality

ETSI
ETSI ES 202 765-4 V1.2.1 (2014-05)38
ES 202 765-4 TS 102 250-2 N° Title Definition N° Title definition 8 List of IPTV indicators
8.1 Service Channel Availability This metric measures IPTV service accessibility in terms of capacity to provide channel content to customer. Successful access to a channel is performed when the customer sends a zapping order.
6.2.4 Mobile Broadcast Channel Non-Accessibility {Broadcast Bearer}
Probability that the requested Mobile Broadcast channel is not started to be delivered to the user. This parameter applies also to zapping situations in which the customer changes the offered streaming content frequently in short intervals.
8.2 Service Group Channel Availability
This metric measures IPTV service accessibility in terms of capacity to provide content of all channels into a group to customer.
6.2.2 Mobile Broadcast Program Menu Non-Accessibility {Bootstrapping Bearer, ESG Retrieval Bearer}
This parameter describes the probability that the Mobile Broadcast Program Menu is successfully accessible by the user when requested. Remark: This parameter depends on the actual implementation of the service discovery procedures (e.g. use of cached bootstrapping and/or ESG information).
8.3 Video Quality The indicator evaluates the quality of video stream delivered to the user. The indicator characterizes the perception of the IPTV end-users in term of video quality.
6.2.13 Mobile Broadcast Video Quality {Broadcast Bearer}
Mobile Broadcast Video Quality describes the video quality as perceived by the end-user.
8.4 Audio Quality When delivering the video flow to the end-user, it may appear that the audio part of the stream is damage or missing. This may originate from the source of the encoding chain, but it has a strong impact on the user-experience as it will have the image displayed on his TV and very bad (or not) sound associated to it. The indicator evaluates the quality of audio stream within IPTV service.
6.2.12 Mobile Broadcast Audio Quality {Broadcast Bearer}
Mobile Broadcast Audio Quality describes the audio quality as perceived by the end-user. Since the streams can contain but not only speech information, an algorithm like Recommendation ITU-T P.862 [7] is not suitable for all scenarios and should not be used.
8.5 "Black" Screen Occurrences (signal monochrome)
8.6 Blockiness Occurrences 8.7 Frozen Picture Occurrences

ETSI
ETSI ES 202 765-4 V1.2.1 (2014-05)39
ES 202 765-4 TS 102 250-2 N° Title Definition N° Title definition
8.8 Lip Desynchronization Occurrences
When combining audio and video, the sound has to be perfectly synchronized with the action, especially synchronizing the movements of a speaker's lips with the sound of his speech. This metric corresponds to the number of desynchronization sequence during a time period (24 hours, 1 week, etc.).
6.5.9 Streaming Audio/Video De-Synchronization
The parameter Streaming Audio/Video De-Synchronization describes the percentage of times that time difference of the audio and video signal at the user side exceeds a predefined threshold.
8.9 Zapping Delay 8.10 Transmission Delay 8.11 TV receiver (or STB) boot delay
9 List of VoD indicators 9.1 Service VoD Availability Measurement of service
accessibility in terms of capacity to provide VoD content to customer. This ratio is made of Number of VoD successfully accessed to Number of VoD Commands.
6.5.4 Streaming Service Non-Accessibility [%]
The parameter Streaming Service Non-Accessibility describes the probability that the first data packet of the stream cannot be received by the UE when requested by the user. The "packet reception" is completed by appearance of the "buffering" message on the player at user side. The first data packet refers to RTP protocol.
9.2 Request Conformity 9.3 VoD failure rate 6.5.6 Streaming
Reproduction Cut-off Ratio [%]
The parameter Streaming Reproduction Cut-off Ratio describes the probability that a successfully started stream reproduction is ended by a cause other than the intentional termination by the user.
9.4 Video Quality The indicator evaluates the quality of video stream delivered to the user. The indicator characterizes the perception of the VoD end-users in term of video quality.
6.5.8 Streaming Video Quality
The parameter Streaming Video Quality measures the quality of the video stream. NOTE : Although evaluation algorithms exist, there
are no standardized solutions yet.
9.5 Audio Quality Because audio stream is integral part of the VoD (as video flow), it is necessary to estimate its quality. The indicator evaluates the quality of audio stream within VoD service.
6.5.7 Streaming Audio Quality
The parameter Streaming Audio Quality describes the audio quality as perceived by the end-user. Since the streams can contain and not only speech information, an algorithm like P.862 is not suitable for all scenarios. ITU-R has defined an algorithm defined for audio information. It can be found in [6].
9.6 Black Screen Occurrences 9.7 Blockiness Occurrences 9.8 Frozen Picture Occurrences

ETSI
ETSI ES 202 765-4 V1.2.1 (2014-05)40
Annex C (informative): Bibliography
• Recommendation ITU-T E.800: "Terms and definitions related to quality of service and network performance including dependability".
• ETSI EG 202 843: "User Group; Quality of ICT Services; Definitions and Methods for Assessing the QoS parameters of the Customer Relationship Stages other than utilization".

ETSI
ETSI ES 202 765-4 V1.2.1 (2014-05)41
History
Document history
V1.1.1 October 2010 Publication
V1.2.1 March 2014 Membership Approval Procedure MV 20140511: 2014-03-12 to 2014-05-12
V1.2.1 May 2014 Publication