ertms/gsm-r quality of service test specification
TRANSCRIPT

REFERENCE O-2475 3.0
Company / organisation UIC ERTMS/GSM-R Operators Group GSM-R Industry Group
ERTMS/GSM-R Quality of Service Test Specification
ACCESS : Public Restricted Confidential
NAME DATE VISA
Author QoS Working Group 30th October 2006 L.Poutas
Review ERTMS/GSM-R Operators Group 22nd November 2006 C.Spaans/J.Nooijen
Approval ERTMS/GSM-R ERIG February 2007 R.Sarfati
Doc N°: O-2475 3.0 Page 1 of 1 Originated by QoS Working Group

EVOLUTION SHEET Version Date Author Modification
0.1 3 June 2003 QoS Working Group First draft version, based on a QoS Working document created by GSM-R/UNISIG.
0.2 13 June 2003 QoS Working Group Updated after GSM-R internal review.
0.3 21 July 2003 QoS Working Group Update after comments from UNISIG.
0.4 25 July 2003 QoS Working Group Update after comments of Unisig and GSM-R internal review.
1.0 11 September 2003 QoS Working Group Final approved version.
1.1 16th September 2005
GSM-R QoS Working GroupUpdate after new release of Subset093 and new definition of transmission interference metric.
1.2 7th July 2006 GSM-R QoS Working Group
Update after terrain feedback about the transmission interference and the network registration metrics. Addition of an appendix proposing a sample size for KPI validation.
2.0 30th October 2006 GSM-R QoS Working Group
Generic improvement of QoS parameter definitions, prerequisites, algortihms and statistics through interim document versions 1.2a to 1.2i.
2.01 22nd November 2006
OG meeting #26 Comments of OG meeting included.
3.0 19th February 2007 ERIG/IG/UNISIG/EEIG Specification update approved issue
Doc N°: O-2475 3.0 Page 2 of 2 Originated by QoS Working Group

Table of Contents
1 Introduction..........................................................................................................5 1.1 Purpose...........................................................................................................5 1.2 References......................................................................................................5 1.3 Abbreviations and definitions ........................................................................5
2 Interfaces and other aspects................................................................................7 2.1 System and Measurement Architecture .........................................................7 2.2 Prerequisites and clarifications ......................................................................8
2.2.1 General ..................................................................................................8 2.2.2 Mobile equipment...................................................................................8 2.2.3 GSM-R and ISDN network.....................................................................9 2.2.4 Fixed network interface .........................................................................9
2.3 Test plan.........................................................................................................9 2.3.1 Typical testing phases ............................................................................9
3 Acceptance Test Specification of Mobile Originated calls .............................11 3.1 Connection establishment delay ..................................................................11
3.1.1 Definition: ............................................................................................11 3.1.2 Pre-conditions for measurement: ........................................................11 3.1.3 For measurement:................................................................................11 3.1.4 Recommended tools: ............................................................................11
3.2 Connection establishment error ratio ...........................................................11 3.2.1 Definition: ............................................................................................11 3.2.2 Pre-conditions for measurement: ........................................................11 3.2.3 Recommended tools: ............................................................................12
3.3 Connection loss rate.....................................................................................12 3.3.1 Definition: ............................................................................................12 3.3.2 Pre-conditions for measurement: ........................................................12 3.3.3 For measurement:................................................................................12 3.3.4 Recommended tools: ............................................................................13
3.4 Transfer delay of user data frame ................................................................13 3.4.1 Definition: ............................................................................................13 3.4.2 Pre-conditions for measurement: ........................................................13 3.4.3 For measurement:................................................................................13 3.4.4 Recommended tools: ............................................................................13
3.5 Data transmission interference.....................................................................14 3.5.1 Definition: ............................................................................................14 3.5.2 Pre-conditions for measurement: ........................................................14 3.5.3 For measurement:................................................................................14 3.5.4 Recommended tools: ............................................................................16
3.6 GSM-R network registration delay..............................................................16 3.6.1 Definition: ............................................................................................16 3.6.2 Pre-conditions for measurement: ........................................................16 3.6.3 For measurement:................................................................................16 3.6.4 Recommended tools: ............................................................................17
4 Acceptance Test Specification of Mobile Terminated calls............................18
5 Monitoring of Quality of Service during Operation.......................................19
6 Appendixes .........................................................................................................20 6.1 Appendix A, Clarification on Statistics .......................................................20
Doc N°: O-2475 3.0 Page 3 of 3 Originated by QoS Working Group

6.1.1 Quantiles:.............................................................................................20 6.1.2 Standard deviation:..............................................................................21 6.1.3 Confidence Intervals:...........................................................................21
6.2 Appendix B, Algorithm for Transmission Interference calculation (informative) ............................................................................................................23
6.2.1 Sending side .........................................................................................23 6.2.2 Receiving side ......................................................................................24 6.2.3 Validation of Transmission Interference parameters ..........................26
6.3 Appendix C, Command script for GSM-R network registration delay measurement (informative)......................................................................................27
6.3.1 Command script for inbound border crossing.....................................27 6.3.2 Command script for outbound border crossing...................................27
6.4 Appendix D, Recommendation of minimum sample sizes for ETCS QoS parameter validation (informative) ..........................................................................28
6.4.1 Introduction..........................................................................................28 6.4.2 Summary ..............................................................................................28 6.4.3 Connection Establishment Delay (CED), Transfer Delay (TD), Network Registration Delay (NRD).....................................................................29 6.4.4 Connection Loss Rate (CLR) ...............................................................30 6.4.5 Transmission Interference ...................................................................33 6.4.6 Connection Establishment Error Ratio................................................35
Doc N°: O-2475 3.0 Page 4 of 4 Originated by QoS Working Group

1 INTRODUCTION
1.1 Purpose This document is a test specification for the Quality of Service requirements based on [SUBSET-093] and proposes a standardized set of acceptance tests to allow comparable QoS behaviour of GSM-R communication networks. It contains:
- Detailed definitions of the QoS parameters for the bearer service. - The interfaces on which the bearer service and the QoS parameters are
applicable. - The methods of measuring and verification of QoS parameter values.
Remark: it is intended to include in a future release of this document the methods of monitoring QoS parameters in operational situations. When complying with the tests in this document it will be possible:
- To demonstrate that the end-to-end communication system for ETCS complies with -requirements.
1.2 References [SUBSET-093] UNISIG Subset-093, v 2.3.0 [EUR FFFIS] Radio Transmission FFFIS for EuroRadio,
A 11 T 6001 12 [EIRENE FRS] EIRENE Functional Requirement Specification, v15 [EIRENE SRS] EIRENE System Requirement Specification, v7 [ISO/IEC 13239:2002] Information technology — Telecommunications and information
exchange between systems — High-level data link control (HDLC) procedures, Third edition 2002-07-15
1.3 Abbreviations and definitions Abbreviations ASCII American Standard Code for Information Interchange. ASCII
code is the numerical representation of a character such as 'a' or '@' etc.
ERTMS European Rail Traffic Management System ETCS European Train Control System KPI Key Performance Indicator IMSI International Mobile Subscriber Identity LUP Location Update (GSM term). MT performs LUP when
switched on and off, periodically and when entering into a new Location Area defined by the network.
MT Mobile Termination NT Network Termination OBU On-Board Unit PLMN Public Land Mobile Network QoS Quality of Service
Doc N°: O-2475 3.0 Page 5 of 5 Originated by QoS Working Group

Doc N°: O-2475 3.0 Page 6 of 6 Originated by QoS Working Group
RBC Radio Block Center TI Transmission Interference Definitions Byte 1 start bit + 8 data bits + 1 stop bit Call Refers to GSM-R network only Connection Refers to end-to-end data call Confidence Confidence level is the confidence in the measurement result,
please see Appendix A, Clarification on Statistics
Data frame A frame is defined as 30 consecutive bytes. IFIX The interface between ETCS and GSM-R on fixed side, refer
to [EUR FFFIS] IGSM The interface between ETCS and GSM-R on mobile side, refer
to [EUR FFFIS] IUm The GSM-R radio interface, Octet 8 data bits Probability Unitless, e.g. percentage Rate Value per time unit, e.g. per hour Bearer Service User ETCS (the service is the bearer service provided by GSM-R). User In this document, User means test operator
2 INTERFACES AND OTHER ASPECTS
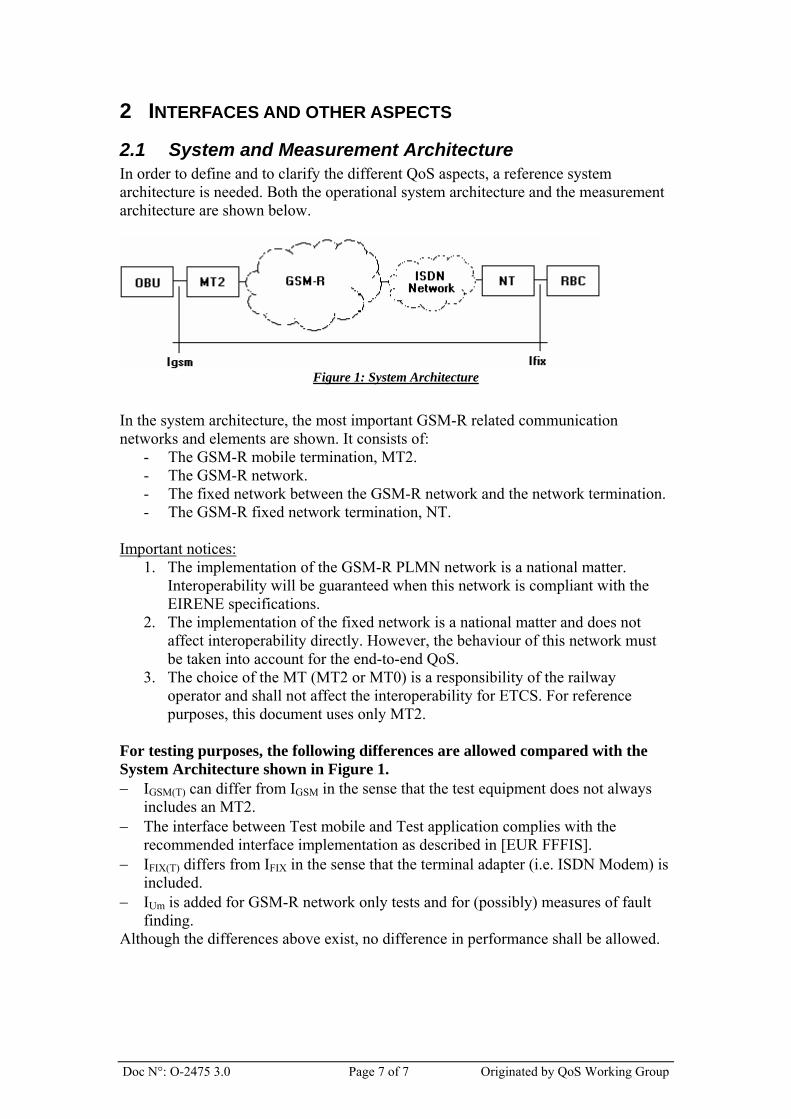
2.1 System and Measurement Architecture In order to define and to clarify the different QoS aspects, a reference system architecture is needed. Both the operational system architecture and the measurement architecture are shown below.
Figure 1: System Architecture
In the system architecture, the most important GSM-R related communication networks and elements are shown. It consists of:
- The GSM-R mobile termination, MT2. - The GSM-R network. - The fixed network between the GSM-R network and the network termination. - The GSM-R fixed network termination, NT.
Important notices:
1. The implementation of the GSM-R PLMN network is a national matter. Interoperability will be guaranteed when this network is compliant with the EIRENE specifications.
2. The implementation of the fixed network is a national matter and does not affect interoperability directly. However, the behaviour of this network must be taken into account for the end-to-end QoS.
3. The choice of the MT (MT2 or MT0) is a responsibility of the railway operator and shall not affect the interoperability for ETCS. For reference purposes, this document uses only MT2.
For testing purposes, the following differences are allowed compared with the System Architecture shown in Figure 1. − IGSM(T) can differ from IGSM in the sense that the test equipment does not always
includes an MT2. − The interface between Test mobile and Test application complies with the
recommended interface implementation as described in [EUR FFFIS]. − IFIX(T) differs from IFIX in the sense that the terminal adapter (i.e. ISDN Modem) is
included. − IUm is added for GSM-R network only tests and for (possibly) measures of fault
finding. Although the differences above exist, no difference in performance shall be allowed.
Doc N°: O-2475 3.0 Page 7 of 7 Originated by QoS Working Group

Figure 2: Measurement Architecture
2.2 Prerequisites and clarifications
2.2.1 General The purpose of these tests is to test the correct behaviour of the GSM-R subsystem. EuroRadio protocol stacks according to [subset 037] are not used during testing. Measurement applications are used to collect the QoS result. The tests shall be performed using the same bearer service(s) as the ETCS operational system. Although a data frame in the operational system consists of octets, all test descriptions use bytes, since test tools are more likely to handle bytes and ASCII characters. For some QoS tests, 30 bytes long data frames shall be used. These frames are providing a model for HDLC protocol which is using data frames consisting of 30 octets. The test area is defined as the area with ETCS service. ETCS service boundaries are usually marked by a ETCS “announcement” balise. The test shall be performed under conditions similar to nominal operational conditions. Tests shall be done using the highest commercial available train speed (according to the line status: new line, on-going upgrades,). All equipment is in normal operational use. Non-availability due to technical defects is excluded, unless stated otherwise. Measuring for a higher data transfer rate also qualifies the test area for the lower rates (e.g. measuring at 9.6 kbps also qualifies 4.8 and 2.4) Requirements are normally specified with a Confidence Level. This allows calculation of the number of samples needed before a test can be considered as completed. If feasible, all parameters shall be verified up to the Confidence Level specified on a national or operator basis. See Appendix D, Recommendation of minimum sample sizes for ETCS QoS parameter validation (informative) and Appendix A, Clarification on Statistics. Tests are fulfilling data bearer requirements, as specified in [SUBSET-093]. The network configuration and the parameters shall be described within test cases and logged during test execution.
2.2.2 Mobile equipment The mobile shall be registered to the GSM-R network, if not stated otherwise in testing conditions.
Doc N°: O-2475 3.0 Page 8 of 8 Originated by QoS Working Group

The test mobile performance shall be equal to an MT2 on the relevant parameters in the different test cases. ETCS data communication is tested using only 8W mobiles. The MT2 test mobile must be compliant with the EIRENE specifications. The mobile must report classmark 2 information element, with a SIM Card not configured for subscription to VBS/VGCS services, as described in [EUR FFFIS], to avoid disturbance of ASCI notification.
2.2.3 GSM-R and ISDN network The GSM-R network shall be well designed, e.g. in terms of handover interval, and in accordance with EIRENE requirements. Requirements and values are considered for a network without congestion/overload. Overload shall be prevented with good initial design and preventive measures such as capacity enhancements. The configuration of network specific parameters is a national matter, but it is recommended to have Authentication activated on Location Update (LUP) only. Additionally, ETCS has its own end-to-end authentication and encryption.
2.2.4 Fixed network interface ISDN connections compliant with [EUR FFFIS] shall be used. On the fixed side, the ISDN network may or may not consist of other network/transmission elements. In either case, it must be compliant with [EIRENE SRS] (which states a maximum delay 250 ms for fixed networks). ISDN network can be designed according to national requirements as long as it complies with EIRENE.
2.3 Test plan Testing and tuning the network is usually part of larger and partially national project efforts. One can use QoS testing for a step-by-step or layer-by-layer integration of ETCS. Basic testing of QoS for ETCS will be necessary or at least helpful for tuning and optimising the network that will operate ETCS. QoS test equipment will here be used as "test application", integration of which will show possible network or mobile deficiencies and lead to an optimised transmission system. Fundamental as well as local problems can be disclosed. After this it should be easier to integrate the real ETCS application consisting of EURORADIO equipment, RBC, OBU into the GSM-R system. Nevertheless, it can be necessary to perform additional QoS testing in this phase, e.g. to raise the confidence level in view of forthcoming railway operation. Therefore the extent of testing, and for what purpose, is a decision of the national projects.
2.3.1 Typical testing phases Here are the typical testing phases foreseen for an ETCS project:
− Phase 0 – RF tuning, ensuring that the sole air interface is performing well. GSM-R only parameters are measured. This phase is meant to be performed prior to start the QoS tests specified within this document.
− Phase 1 – End-to-end testing and optimisation.
Doc N°: O-2475 3.0 Page 9 of 9 Originated by QoS Working Group

Doc N°: O-2475 3.0 Page 10 of 10 Originated by QoS Working Group
− Phase 2 – ETCS integration tests using real components like RBC, OBU and EuroRadio protocol stack.
− Phase 3 – In-service continuous monitoring of the performances (not covered by this document).
Figure 3, Testing phases
QoS acceptance (GSM-R sub system)
Phase 0: RF tuning
Phase1: E2E testing
Phase3: In service monitoring
Phase 2: ETCS integration
QoS acceptance (Entire system)

3 ACCEPTANCE TEST SPECIFICATION OF MOBILE ORIGINATED CALLS
3.1 Connection establishment delay
3.1.1 Definition: This is the value of the elapsed time between the connection establishment request and the indication of successful connection establishment on the requesting side.
3.1.2 Pre-conditions for measurement: Measurement interfaces are IGSM(T) and IFIX(T), measurement point is IGSM(T). Only MSISDN numbers shall be used, and not Functional Numbers (FN). Only successfully established connections, refer to 3.2, shall be evaluated in order to avoid double counting. Terminal is registered to the GSM-R network, is in Idle mode, and is located in its Home-PLMN. A delta delay for Visited-PLMN calls shall be measured by laboratory tests. Automatic answering for B-party shall be as fast as possible. Call re-establishment as defined by ETSI shall not be considered.
3.1.3 For measurement: At IGSM(T), the elapsed time between the delivery of the command ATD xxx to the MT2/MT and the later of the two following events is measured at IGSM(T):
• Indication of successful connection establishment by CONNECT yyy • Transition of circuit 109 (DCD) to ON
To ensure proper cell reselection, a sufficient time between each attempt shall be used, typically 30 seconds.
3.1.4 Recommended tools: Test application for control of terminal and automation (scripting). Test terminal for tracking possible failure in automated test, and/or Abis protocol analyser for tracking possible failure. GPS for position information.
3.2 Connection establishment error ratio
3.2.1 Definition: This is the ratio of the number of unsuccessful attempts for connection establishment to the total number of connection establishment attempts.
3.2.2 Pre-conditions for measurement: Measurement interfaces are IGSM(T) and IFIX(T), measurement point is IGSM(T). Terminal is registered to the GSM-R network and is in Idle mode. The B-party is reachable. For Call set-up a valid phone number is used. The user must not release the connection establishment before a successful connection is indicated or within the period specified as maximum delay. For measurement:
Doc N°: O-2475 3.0 Page 11 of 11 Originated by QoS Working Group

At IGSM(T) test is initiated by issuing ATD xxx As soon as the connection establishment indication (CONNECT or DCD) is received, small data units have to be transmitted in both directions (uplink/downlink) to confirm the successful establishment of the connection. In case no data is received on IGSM or IFIX the connection establishment is considered as failed. All connection establishment requests (ATD xxx) and all unsuccessful connection establishment attempts are counted. Unsuccessful cases are:
- All responses except CONNECT yyy, if the connection establishment error is not caused by the service user.
- If successful connection establishment is not signalised within the period specified as maximum delay.
- If neither a connection establishment indication nor an error indication is received up to the maximum time of connection establishment, the attempt is counted as unsuccessful.
The failure probability is calculated as the ratio between ‘number of failed attempts’ and ‘total number of attempts’
3.2.3 Recommended tools: Test application for control of terminal and automation (scripting). Test terminal for tracking possible failure in automated test, and/or Abis protocol analyser for tracking possible failure. GPS for position information.
3.3 Connection loss rate
3.3.1 Definition: The number of connections released unintentionally per total accumulated connection time.
3.3.2 Pre-conditions for measurement: Measurement interfaces are IGSM(T) and IFIX(T), measurement point is IGSM(T) The connection is successfully established and data is transmitted in both directions end-to-end. Connection duration refers to the end-to-end data transmission phase of a connection and consequently the connection establishment delay shall be withdrawn from the measured time (delay to be withdrawn is between CONNECT & ATH). A minimum connection duration shall be defined (5 min). Connection losses caused by the service user are not counted. The test results are only concerning number of losses per time unit, it is therefore independent of the number of connections made and connection duration. The only thing of importance is the total measured time to reach sufficient confidence in the measurements.
3.3.3 For measurement: At IGSM(T), if one of the following events is detected, a connection loss is assumed and counted:
- Indication of ERROR - Transition of circuit 109 (DCD) to OFF - Indication of NO CARRIER
Doc N°: O-2475 3.0 Page 12 of 12 Originated by QoS Working Group

- When the continuous end-to-end data transmission in either direction is unintentionally interrupted. Transmission interruption is considered if the duration of the interruption exceeds a threshold (typical example: 10 s).
Notes
1. The first occurrence of such event whichever comes first is sufficient to assume a connection loss.
2. A combination of these events occurring in sequence before starting connection re-establishment is counted as only one connection loss.
The single connection duration for this connection established is accumulated to the total connection duration.
3.3.4 Recommended tools: Test application for control of terminal and automation (scripting). Test terminal for tracking possible failure in automated test, and/or Abis protocol analyser for tracking possible failure. GPS for position information.
3.4 Transfer delay of user data frame
3.4.1 Definition: This is the value of the elapsed time between the request for transfer of a data frame and the indication of successfully transferred end-to-end data frame.
3.4.2 Pre-conditions for measurement: Measurement interfaces are IGSM(T) and IFIX(T), measurement point is IGSM(T) Only successfully received user data frames (ie data frames received with a correct CRC check sum) are evaluated. The length of data frame shall be 30 bytes. The fixed side responding application is a test application responsible for echoing all incoming data frames back to the sender. The response time of the test application shall be very small and negligible.
3.4.3 For measurement: Round trip delay is an allowed measurement procedure. The test is performed by sending and receiving bytes and in the test application represented by ASCII characters. At IGSM(T), value of the half of elapsed time between start of transmission of a user data frame and end of reception of the same frame echoed back from B-subscriber terminal application is evaluated as transfer delay. The term 'user' refers to the user of the GSM-R bearer service.
3.4.4 Recommended tools: Test application for control of terminal and automation (scripting). Test terminal for tracking possible failure in automated test, and/or Abis protocol analyser for tracking possible failure. GPS for position information.
Doc N°: O-2475 3.0 Page 13 of 13 Originated by QoS Working Group

3.5 Data transmission interference
3.5.1 Definition: The purpose of this KPI is to test the correct sending of data frames across the GSM-R subsystem. The statistical distributions of transmission interferences and error-free periods will be then built and finally assessed against [Subset093] targets using separately uplink and downlink distributions. Transmission recovery period TREC • TREC starts with the first error-free data frame. • TREC ends before the first erroneous data frame. Transmission interference period TTI: • TTI starts with the first erroneous data frame. An erroneous data frame is a 30
bytes frame bearing at least one bit in the received data stream that does not comply with the associated bits of the transmitted data frame.
• TTI ends before the first error-free data frame. An error-free data frame is a 30 bytes data frame bearing no bit in the received data frame that does not comply with the associated bits of the transmitted data frame.
In case a connection loss (see chapter 3.3.3 page 12), the last continuous interference period prior to the connection loss shall not be taken in account for TTI cumulated distribution function, since such an event is already counted within the connection loss rate. In case of a TREC period equal or less than 4 consecutive error-free data frames, this short error free period shall be counted as one error period and shall be merged with the adjacent Transmission interference period TTI. A TREC period always starts with 5 or more consecutive error-free data frames. KPI assessment: • The statistical events defining the QoS targets for transmission interference
specified in [Subset093] are the transmission recovery periods and transmission interference periods.
3.5.2 Pre-conditions for measurement: Measurement interfaces are IGSM(T) and IFIX(T), measurement points are both IGSM(T) and IFIX(T). The connection is successfully established.
3.5.3 For measurement: The parameter Transmission interference is measured without use of HDLC. However, the parameter and its requirements are derived from the characteristics of HDLC. The test is performed by sending and receiving a data stream in the test application represented by ASCII characters. To collect as many sample as possible within a limited number of train test runs, data frames shall be sent only separated by a small delay (up to10 ms) between 2 consecutive frames.
Doc N°: O-2475 3.0 Page 14 of 14 Originated by QoS Working Group

The data frame pattern is set at the sending side, with the following pattern: [7E] [random data payload] [sequence number] [CRC-16] (= 30 octets in total) where:
− [7E] is the octet flagging the start of the frame, as in HDLC − [random data payload] is a 25 octet random payload − [16 bits sequence nbr] is a 2 octets sequence number marking the frame − [CRC-16] is a 2 octets CRC-16 check sum to detect valid data frames on the
receiving application (CRC Hamming distance is very good for a 30 octets data frame)
The receiving side shall synchronise with sent frames. The time reference for interference duration and recovery measurement shall be on the receiving application only (Channel latency is measured independently). The measurement results are updated following verification of the data frame sequence number. The data streams must be stored to files on both sending and receiving sides (at both IGSM(T) and IFIX(T)). The result is either calculated by comparison and analysis of the differences in these files or detecting CRC errors in the received data. The transmission interference test shall be performed using separate applications for uplink and downlink (no round-trip data). The uplink and downlink may be tested simultaneously depending on test application capabilities. Cumulated distribution functions for both TREC and TTI shall be built over the measured area. Some typical examples are shown below:
Frame number
Error-free
Errored
Channel state
TREC= 8 frames
TREC= 2 frames
TREC= .. frames
TTI = 2+3+1 = 6 frames
C
FTREC
= 6 frames
TTI= 2 frames
A
B
E
D
1 2 3 4 5 6 7 8 9 10 11 12 13 14 15 16 17 18 19 20 21 22 23 24 25 26 27 28Frame number
Error-free
Errored
Channel state
TREC= 8 frames
TREC= 2 frames
TREC= .. frames
TTI = 2+3+1 = 6 frames
C
FTREC
= 6 frames
TTI= 2 frames
A
B
E
D
1 2 3 4 5 6 7 8 9 10 11 12 13 14 15 16 17 18 19 20 21 22 23 24 25 26 27 281 2 3 4 5 6 7 8 9 10 11 12 13 14 15 16 17 18 19 20 21 22 23 24 25 26 27 28
Figure 4, Example of transmission interference
A. An interference, 2 frames from first to last erroneous frame. B. An error-free series of frames longer than or equal to 5 frames, TTI = 2 frames
and TREC = 6 frames C. An interference, 2 frames from first to last erroneous frame D. An error-free series of frames shorter than 5 frames, consider D as an
interfered period and merged it with C and E E. An isolated interference of 1 frame. F. Back to a series of error-free frames longer than or equal to 5 frames, TTI is
incremented with the sum of C+D+E, considered as a single interfered period. TTI = 6 frames. TREC is incremented until the next erroneous frame.
Doc N°: O-2475 3.0 Page 15 of 15 Originated by QoS Working Group

An algorithm for Transmission Interference calculation is proposed in Appendix B, Algorithm for Transmission Interference calculation (informative). The algorithm itself is for information, but the calculation methodology and the definition of the parameters shall be adhered to. Note that from a practical point of view (i.e. in life networks where handovers occur) there is a natural balance between Transmission Interference and Recovery. Very short interferences (<0.8 sec.) contribute to a better performance on Transmission Interference, but typically decreases performance on Recovery. Extremely long Recovery periods (which typically decreases Recovery performance) do not exist since the occurrence of handovers prevents this.
3.5.4 Recommended tools: Test application for control of terminal and automation (scripting). Test application capable of transmitting and receiving a data stream. Test terminal for tracking possible failure in automated test, and/or Abis protocol analyser for tracking possible failure. GPS for position information.
3.6 GSM-R network registration delay
3.6.1 Definition: The elapsed time between the registration request “+COPS=1,2,” network2select” and the indication of successful registration onto GSM-R network “+CREG: 1” or “+CREG: 5”.
3.6.2 Pre-conditions for measurement: Measurement interface is IGSM(T) and measurement point is IGSM(T).
3.6.3 For measurement: The scenario is registration in manual mode from a registration in manual mode on a forbidden network Perform manual registration onto a forbidden network, i.e. a network to which no roaming exists. At IGSM(T), the elapsed time between the delivery of the command AT+COPS=1,2,”network2select” and the result "+CREG=1" or “+CREG=5”. (Note that the result +CREG=1 is only applicable on home PLMN and +CREG=5 for roaming PLMNs). This parameter shall be tested on certain locations (static test) to confirm the nominal value. No “drive-test” necessary. For border crossing scenarios both directions shall be verified, i.e. using the sequence described above with: - For outbound border crossing, “network2select” = Visited PLMN.
Test location: In coverage from Visited PLMN. - For inbound border crossing, “network2select” = Home PLMN.
Test location: In coverage from Home PLMN. A command script is proposed in Appendix C, Command script for GSM-R network registration delay measurement (informative)
Doc N°: O-2475 3.0 Page 16 of 16 Originated by QoS Working Group

3.6.4 Recommended tools: Test application for control of terminal and automation (scripting). Test terminal for tracking possible failure in automated test, and/or Abis protocol analyser for tracking possible failure. GPS for position information.
Doc N°: O-2475 3.0 Page 17 of 17 Originated by QoS Working Group

4 ACCEPTANCE TEST SPECIFICATION OF MOBILE TERMINATED CALLS
Mobile Terminated connections are currently not used by the ETCS application, thus no test specification exists. This is to be defined when needed.
Doc N°: O-2475 3.0 Page 18 of 18 Originated by QoS Working Group

5 MONITORING OF QUALITY OF SERVICE DURING OPERATION When an ERTMS system is in operation, there will still be a need to monitor the performance of the network part. Possible performance degradation can be identified and corrected before there is any impact on the signalling application. This can be done by repetition of the Acceptance test procedure, but even better is to have continuous feedback of performance. Continuous monitoring of network performance is to be done with statistical call-related counters available in the GSM-R network. Next level of details can be achieved with the commonly available IMSI Trace, which is a way to collect call details on specific calls, i.e. on subscribers identified by their IMSI number. Details of parameters to be continuously monitored are to be agreed on a national or contract basis as required.
Doc N°: O-2475 3.0 Page 19 of 19 Originated by QoS Working Group

Doc N°: O-2475 3.0 Page 20 of 20 Originated by QoS Working Group
6 APPENDIXES
6.1 Appendix A, Clarification on Statistics The QoS requirements available in [SUBSET-093] shall be completed together with Confidence Level at national or contractual level. This term is further explained below. For ease of understanding, illustrations and explanations are based on the following example:
“t<5sec (95%) with a confidence level of 90%” This example is based on a continuous set of values. Similar illustrations can be drawn on discrete set of values.
6.1.1 Quantiles: A statement t<5sec (95%) means that for the KPI to evaluate, the following is valid: 95% of all values are smaller than 5s.
probability distribution function
KPImean 5s
probability distribution function
KPImean 5s Equivalent to the above statement is that the area under the distribution function is enclosed in the interval [0s;5s].
The cumulated statistic is often used to visualise whether the KPI target is met:
95%
cumulateddistribution function
KPImean
100%
50%
5s
95%
cumulateddistribution function
KPImean
100%
50%
5s
Area representing the cumulated probability of
KPI < 5s
Doc N°: O-2475 3.0 Page 21 of 21 Originated by QoS Working Group
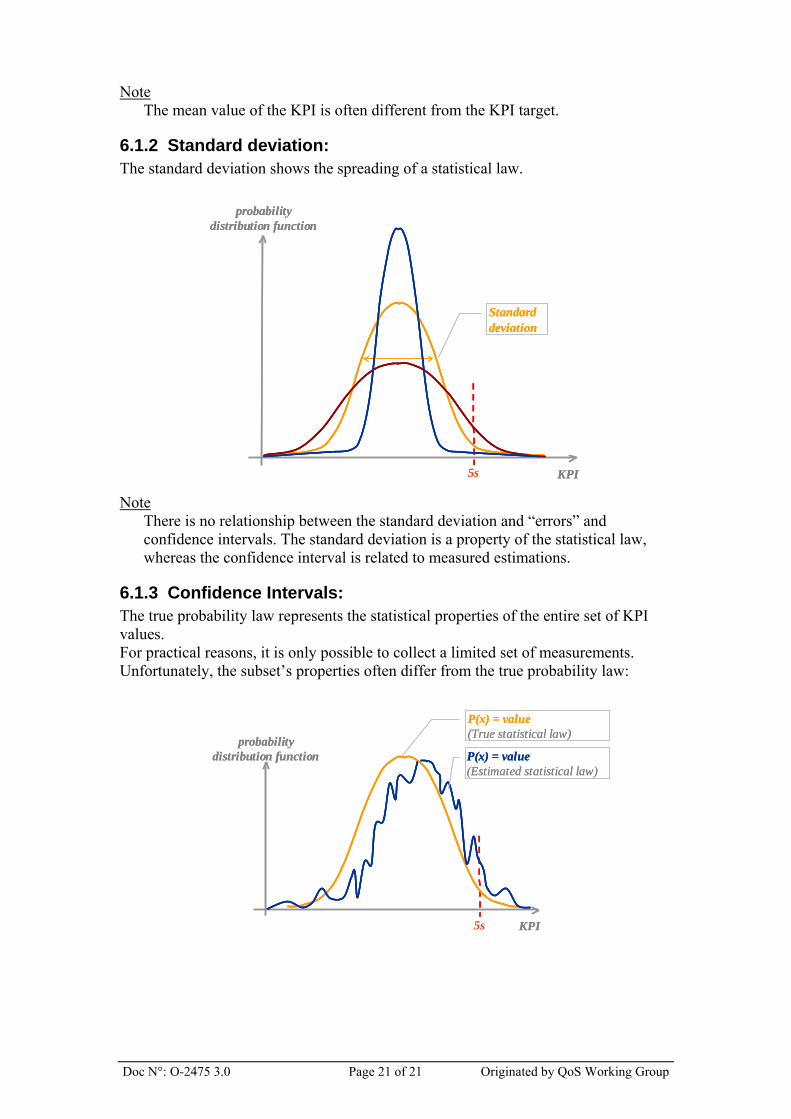
Note The mean value of the KPI is often different from the KPI target.
6.1.2 Standard deviation: The standard deviation shows the spreading of a statistical law.
probability distribution function
KPI5s
Standard deviation
probability distribution function
KPI5s
Standard deviation
Note
There is no relationship between the standard deviation and “errors” and confidence intervals. The standard deviation is a property of the statistical law, whereas the confidence interval is related to measured estimations.
6.1.3 Confidence Intervals: The true probability law represents the statistical properties of the entire set of KPI values. For practical reasons, it is only possible to collect a limited set of measurements. Unfortunately, the subset’s properties often differ from the true probability law:
probability distribution function
KPI5s
P(x) = value(Estimated statistical law)
P(x) = value (True statistical law)probability
distribution function
KPI5s
P(x) = value(Estimated statistical law)
P(x) = value (True statistical law)

Doc N°: O-2475 3.0 Page 22 of 22 Originated by QoS Working Group
95%
cumulateddistribution function
KPImean
100%
50%
5s
93%95%
cumulateddistribution function
KPImean
100%
50%
5s
93%
Although it is impossible to determine precisely this difference*, estimation of the probability that the subset is within x% of the true statistical can be made: it is called the confidence interval. * If it would be known, we could compute the true statistical law! Note
The larger the number of samples within the subset, the smaller the confidence interval. For a Gaussian law, as an approximation, the size of the confidence
interval decreases with 1(number of samples)²
.
This means to increase the confidence from 90% to 99% keeping the same interval, 100 times more samples are needed! The knowledge of the confidence interval and the type of statistical law allow computing the number of samples needed. A confidence level of 90% means that there is 10% of chance to fall out of the interval [0, measured KPI for t<5s]. It does NOT mean that the “error” on the measurement is 10%.

6.2 Appendix B, Algorithm for Transmission Interference calculation (informative)
6.2.1 Sending side
/frame formatting procedure/ 1. insert 7E flag 2. append 25 bytes of random data 3. append sequence number (2 bytes); update Snr 4. calculate and append CRC (2 bytes) 5. send data frame 6. wait for xx ms /xx: value of delay between 2 consecutive frames, up to 10 ms/
Doc N°: O-2475 3.0 Page 23 of 23 Originated by QoS Working Group

6.2.2 Receiving side The purpose of the Transmission Interference algorithm is to receive and evaluate frames in order to build a table where each record has the following fields and contents (example):
ChannelState Startime Endtime FramesErroneous FramesErrorfree FramesLost EF 01:00:00.234 01:10:00.834 0 1525 0 TI 01:10:00.934 01:11:08.555 13 5 3 … EF 01:30:30.523 01:50:10.523 0 30127 0
ChannelState indicates the type of interval. The interval is either Error Free (EF) or Transmission Interfered (TI). Startime and Endtime indicate the beginning respectively the end of an EF- or TI-interval (format: hour:minute:second.milisecond). FramesErroneous indicates the number of frames received in error during the interval, FramesErrorfree indicates the number of correctly received frames during the interval. FramesLost indicates the number of lost frames during the interval. Lost frames occur when two consecutively received error free frames do not have consecutive sequence numbers. The algorithm uses the following variables:
Parameter Description FrameRxTime_Actual Time of reception of the actual or current frame. This time is derived from the operating system of
the receiver (receiver local time). FrameRxTime_Previous Time of reception of the previous frame. FrameSNR_Actual Sequence number of the actual or current frame. If the actual frame is not error free
FrameSNR_Actual = -1. FrameSNR_Previous Sequence number of the frame received just before the actual or current frame. If the previous frame
is not error free FrameSNR_Previous = -1. #Frames_ConsEF Number of consecutive received error free frames since the last erroneous or lost frame. EF_Threshold EF_Threshold indicates how many consecutive error free frames should have been received before
the channel state changes from TI to EF. Its default value is 5. ChannelState_Actual The actual or current state of the transmission channel. The channel resides either in TI- or EF-state.
If a lost frame is detected or an erroneous frame is received, the channel state changes to TI. If EF_Threshold consecutive error free frames have been received, the channel state changes to EF.
ChannelState_Previous The state of the transmission channel just before the reception of the actual frame (i.e. the channel state at reception of the previous frame).
Diff_SNR Contains the difference between the sequence numbers of the actual and previous frame. #FramesLost Contains the total number of lost frames in a certain TI-interval. The value of the parameter is
incremented with Diff_SNR –1 if two consecutive error free frames are received which sequence numbers differ more than 1. Its value is reset every time ChannelState changes.
#FramesERR Contains the total number of erroneous frames in a certain TI-interval. Its value is reset every time ChannelState changes.
#FramesEF Contains the total number of error free frames in a certain TI- or EF-interval. Its value is reset every time ChannelState changes.
Doc N°: O-2475 3.0 Page 24 of 24 Originated by QoS Working Group

Doc N°: O-2475 3.0 Page 25 of 25 Originated by QoS Working Group
Receive next frame (30 bytes) and evaluate CRC
CRC is correct(frame error
free)?
FrameSNR_Actual = -1#Frames_ConsEF = 0
#FramesERR = #FramesERR + 1No
Yes
ChannelState_Previous = TIChannelState_Actual = TIFrameSNR_Actual = -1
FrameSNR_Previous = -1EF_Threshold = 5
All other parameter values = 0Create first record
ChannelState = ChannelState_ActualStarttime = (local) system time of receiver
Determine FrameSNR_Actual (read SNR from frame)Diff_SNR = FrameSNR_Actual - FrameSNR_Previous
#FramesEF = #FramesEF + 1
Diff_SNR <=FrameSNR_Actual?
No
Yes
Diff_SNR = 1?
Yes
No
#FramesLost = #FramesLost + Diff_SNR - 1
#Frames_ConsEF = #Frames_ConsEF + 1
#Frames_ConsEF>= EF_Threshold
Yes
No
ChannelState_Actual = EF
#Frames_ConsEF = 1
FrameRxTime_Actual = (local) system time of receiver
ChannelState_Previous = EF?AND
ChannelState_Actual = TI?
ChannelState_Previous = TI?AND
ChannelState_Actual = EF?
Yes
Update and close actual recordFramesErroneous = #FramesERR - 1
FramesErrorfree = #FramesEFFramesLost = #FramesLost
Endtime = FrameRxTime_Previous
No
Create next/new recordChannelState = ChannelState_Actual
Starttime = FrameRxTime_Actual
Yes
Update and close actual recordFramesErroneous = #FramesERR
FramesErrorfree = #FramesEF - EF_ThresholdFramesLost = #FramesLost
Endtime = EndtimeTI
Create next/new recordChannelState = ChannelState_Actual
Starttime = StarttimeEF
No
#FramesERR = 0#FramesEF = EF_Threshold
#FramesLost = 0
FrameSNR_Previous = FrameSNR_ActualChannelState_Previous = ChannelState_Actual
FrameRxTime_Previous = FrameRxTime_Actual
Start
#Frames_ConsEF = 1?
StarttimeEF = FrameRxTime_ActualEndtimeTI = FrameRxTime_Previous
FrameSNR_Actual = -1?
Yes
Update and close actual recordFramesErroneous = #FramesERRFramesErrorfree = #FramesEF - 1
FramesLost = #FramesLost - (Diff_SNR - 1)Endtime = FrameRxTime_Previous
No
#FramesERR = 1#FramesEF = 0
#FramesLost = 0
#FramesERR = 0#FramesEF = 1
#FramesLost = Diff_SNR - 1
No
Yes
Receive and processframesDetermine channel state (TIor EF)Determine number oferroneous, errorfree andmissing frames for certainchannel state
Update actual record if thechannelstate changes(close previous state)Create new record ifchannelstate changes(enter new state)Receive next frame ifchannelstate does notchange
ChannelState_Actual = TI

6.2.3 Validation of Transmission Interference parameters From the table in par. 6.2.2 (Receiving side), TREC & TTI are obtained by subtracting Starttime from Endtime for each interval. The Transmission Interference parameters shall then be calculated using the formulas below. The parameters are applicable (and shall be calculated) for both up- and downlink separately.
%100*sec8.0
8.0_ IntervalsrOfTotalNumbeIntervalsNumberOf
TTPercentage
TI
TITI
<==
%100*sec1
1_ IntervalsrOfTotalNumbeIntervalsNumberOf
TTPercentage
TI
TITI
<==
%100*sec7
7_ IntervalsrOfTotalNumbeIntervalsNumberOf
TTPercentage
REC
RECREC
>==
%100*sec20
20_ IntervalsrOfTotalNumbeIntervalsNumberOf
TTPercentage
REC
RECREC
>==
Successful validation is achieved if all percentage PERC values exceed the corresponding 95%- and 99% percentages of subset-093.
Doc N°: O-2475 3.0 Page 26 of 26 Originated by QoS Working Group

6.3 Appendix C, Command script for GSM-R network registration delay measurement (informative)
6.3.1 Command script for inbound border crossing
// select a forbidden network AT+COPS=1,2,"ForbiddenNetwork" // wait for +CREG: 3 // select “network2select” = Home PLMN AT+COPS=1,2," network2select" // measurement [1] begins // wait for +CREG: 1 // measurement [1] ends.
6.3.2 Command script for outbound border crossing
// select a forbidden network AT+COPS=1,2,"ForbiddenNetwork" // wait for +CREG: 3 // select “network2select” = Visited PLMN AT+COPS=1,2," network2select" // measurement [2] begins // wait for +CREG: 5 // measurement [2] ends.
Doc N°: O-2475 3.0 Page 27 of 27 Originated by QoS Working Group

6.4 Appendix D, Recommendation of minimum sample sizes for ETCS QoS parameter validation (informative)
6.4.1 Introduction This annex recommends sample sizes and validation procedures for performance tests to validate ETCS QoS parameters. Since ETCS QoS parameters differ on statistical characteristics and target values, sample sizes for individual parameters also differ. Furthermore, the choice for a particular sample size is to a large extent arbitrary. It is a compromise between costs (time and effort to perform validation tests), precision (reproducibility) and confidence level. ETCS QoS parameters can be subdivided into four categories. Each category requires a particular statistical approach to determine a suitable sample size. The categories as discussed in the next paragraphs are:
1. Connection Establishment Delay (CED), Transfer Delay (TD), Network Registration Delay (NRD)
2. Connection Loss Rate (CLR) 3. Transmission Interference (TI) 4. Connection Establishment Error Ratio (CER)
6.4.2 Summary The table below provides an overview of ETCS QoS parameters. It lists minimum required sample sizes and validation procedures as derived in the following paragraphs.
ETCS QoS parameter Requirement (Subset-093)
Minimum recommended sample size (95% confidence level)
Validation procedure
Connection Establishment Delay (CED)
<8.5s (95%) ≤10s (100%) 100 samples Parameter successfully validated if the 95th-percentile is less
than 8.5s
Trasnfer Delay (TD) ≤0.5s (99%) 100 samples Parameter successfully validated if the 99th-percentile is less than 0.5s
Network Registration Delay (NRD)
≤30s (95%) ≤35s (99%) ≤40s (100%)
100 samples (inbound border
crossing)
100 samples (outbound border
crossing)
Parameter successfully validated if the 95th-percentile is less than 30s and if the 99th-percentile is less than 35s
Connection Loss Rate (CLR) <10-2/h 300 hours Parameter successfully validated if no connection loss occurs within 300 hours
Transmission Interference (TI)
TI period: <0.8s (95%) <1s (99%) EF period: >20s (95%) >7s (99%)
1500 samples per kilometer (uplink)
1500 samples per
kilometer (downlink)
Refer to Annex B, par. 6.2.3
Connection Establishment Error Ratio (CER) <10-2 1078 samples Parameter successfully validated if the number of
Connection Establishment Errors is less than or equals 16
Note 1: For CED and CER a sample or event is defined as a call set up (attempt). For TD and TI a sample or event is defined as the transmission/reception of a data frame. For NRD a sample or event is defined as a network registration session as described in par. 6.3 (Appendix C, Command script for GSM-R network registration delay measurement (informative).
Doc N°: O-2475 3.0 Page 28 of 28 Originated by QoS Working Group

For CLR, the sample size is expressed as the duration of the measurement. A connection loss should typically not occur. Note 2: For Transmission Interference the parameters of interest are TREC and TTI rather than the immediate result of transmission/reception of data frames. With a sample size of 1500 frame transmissions per kilometre however, adequate reproducibility of the average probability of a frame transmitted in error is achieved (see par. 6.4.5). The assumption is that this sample size also implies adequate reproducibility of TREC and TTI. These parameters are validated over a substantial ETCS area (covered by at least 5 GSM-R cells) by 1 up to 3 round-trip test runs depending on the speed of the measurement train (see par. 6.4.5). Note 3: In this annex, sample sizes are calculated for a confidence level of 95%. Decreasing the confidence level while maintaining the same confidence interval, typically results in a decreased sample size (and hence in a reduction of measurement time and costs). The choice for a particular confidence level and sample size is a national matter.
6.4.3 Connection Establishment Delay (CED), Transfer Delay (TD), Network Registration Delay (NRD)
Sample size (theoretical background) From a statistical perspective, the parameters CED, TD and NRD can be described by a mean delay μ, a standard deviation σ and some kind of statistical distribution (not necessarily a normal distribution). Since the true standard deviation σ is not known and the sample size may be small (n<30), the Student t distribution is used to statistically model these QoS parameters. The standard deviation σ is then replaced by the standard deviation of the sample s. One of the properties of the t distribution is the degree of freedom (df). The degree of freedom corresponds with the sample size (i.e. df = n – 1). The t distribution approaches the standard normal distribution with increasing df. The confidence interval is denoted as:
nsx .* t + (1)
Where: x = is the sample mean (best estimate of the population mean μ) s = standard deviation of the sample n = sample size t* = t-parameter (df = n – 1) Note that t* depends on n. For a two-sided interval with a confidence level of 95%, t* = 2 (n=60), for a two-sided interval with a confidence level of 90% t* = 1.67 (n=60).
Doc N°: O-2475 3.0 Page 29 of 29 Originated by QoS Working Group

Sample size proposal Rather good reproducibility is achieved if we choose n such that x does not deviate more than a small percentage from one measurement campaign to another with a high confidence level. Using (1) and making a choice for a deviation of x of 10% results in:
nsx .* t 1.0 = (2)
Solving for n yields: 2
1.0*⎟⎠⎞
⎜⎝⎛=
xstn (3)
Measurements in the Netherlands have shown that s/ x is much smaller than 0.5 for all parameters (i.e. CED, TD and NRD). Taking a worst case value of s/ x = 0.5, a confidence level of 95% (two sided confidence interval) and applying equation (3) results in n = 100. Consequences for measurement in practice If for validating CED and TD a single round-trip drive-test is performed, a sample size of n = 100 is easily achieved. NRD is defined under standstill conditions. A validation test with a sample size of n = 100 can be performed in less than 2 hours. Validation of parameters CED, TD and NRD Compliancy with the requirements is demonstrated by taking the 95th-percentile from the measurement data set for CED, taking the 99th-percentile from the measurement data set for TD and the 95th and 99th percentiles from the measurement data set for NRD. The k-th percentile is defined as that value of the measurement data set which corresponds to a cumulative frequency of n.k/100. With n=100, the 95th/99th-percentile is simply the 95th/99th value of the measurement data set (when sorted in ascending order).If a percentile of a particular parameter is less than the corresponding value as specified in Subset-093, the parameter is successfully validated.
6.4.4 Connection Loss Rate (CLR) Sample size (theoretical background) Assuming that the Connection Loss Rate is characterized by:
1. The number of connection losses is proportional to the measurement time 2. The probability of a connection loss is almost zero over a short period of time 3. Connection losses are independent events
then the CLR is reasonably modeled by a Poisson distribution. Note that it is not sensible to speak about a sample size here, but rather of a certain measurement time interval in which a connection loss may (or may not) appear. For a Poisson distribution the following formula applies:
( )!
.)(k
eRtkPRt
k−
= (4)
Doc N°: O-2475 3.0 Page 30 of 30 Originated by QoS Working Group

Where: P(k) = The probability that k failures occur within a measurement time interval t if the Connection Loss Rate is R. k = Number of connection losses in measurement time interval t R = Connection Loss Rate (connection losses per hour) t = Measurement time interval (hours) Note that for a Poisson distribution both the mean and the variance are equal to Rt. Measurement time interval proposal The question is then how to choose the size of the measurement time interval t. If we choose a confidence level of 95% and define that as the probability that 1 or more connection losses occur in a measurement time interval t under the pre-condition that the Connection Loss Rate is truly R=0.01/hour (i.e. as specified in Subset-093), the measurement time interval t can be calculated. The probability of having 1 or more connection losses in a measurement time interval t is:
95.01)0(1)1( 01.0 =−==−=>= − tekPkP (5) Solving (5) results in: t = 300 hours. Or alternatively stated: if the Connection Loss Rate is truly R=0.01/h and is measured for a period of 300 hours then the probability of experiencing no connection loss at all is 5%. This situation is shown in the figure below.
0,00
0,05
0,10
0,15
0,20
0,25
0 1 2 3 4 5 6 7 8 9 10
--> k (# Connection Losses)
P( #
Con
nect
ion
Loss
es =
k)
0,0
0,2
0,4
0,6
0,8
1,0P
(# C
onne
ctio
n Lo
sses
<=
k)
R = 0.01/hMeasurement time interval = 300 hours
There is a trade off between confidence level and measurement time interval. Two examples demonstrating this trade off are given below. In both cases the starting point is that the true CLR = 0,01/h. If the measurement time interval is 70 hours, the probability of no connection loss is about 50%.
Doc N°: O-2475 3.0 Page 31 of 31 Originated by QoS Working Group

0,00
0,10
0,20
0,30
0,40
0,50
0,60
0 1 2 3 4 5 6 7 8 9 10
--> k (# Connection Losses)
P( #
Con
nect
ion
Loss
es =
k)
0,0
0,2
0,4
0,6
0,8
1,0
P (#
Con
nect
ion
Loss
es <
= k)
R = 0.01/hMeasurement time interval = 70 hours
Finally if the measurement time interval is 5 hours, the probability of one or more connection losses is only about 5%.
0,00
0,10
0,20
0,30
0,40
0,50
0,60
0,70
0,80
0,90
1,00
0 1 2 3 4 5 6 7 8 9 10
--> k (# Connection Losses)
P( #
Con
nect
ion
Loss
es =
k)
0,8
1,0
P (#
Con
nect
ion
Loss
es <
= k)
R = 0.01/hMeasurement time interval = 5 hours
Consequences for measurement in practice The parameter CLR obviously requires several test runs. Measurement time is decreased by using multiple mobile measurement sets per test run. The number of test runs may be further decreased by performing measurements as part of commercial train operation.
Doc N°: O-2475 3.0 Page 32 of 32 Originated by QoS Working Group

Validation of parameter CLR CLR is successfully validated if no connection losses occur in a measurement time interval of 300 hours. If one or more connection losses occur, validation has failed.
6.4.5 Transmission Interference Sample size (theoretical background) Let’s assume that successful/erroneous transfer of frames follows a binomial statistical law. This is the case if individual frame transfer events are mutually independent and the a-priori probability of a successful transfer is the same for every frame transfer. The probability of an erroneous frame transfer is denoted as p. The probability of a successful transfer of a frame is denoted as 1-p. The sample size is denoted as n. Then:
- the mean number of erroneous transfers is: npMean = ; - and the standard deviation is: -p)np(SD 1= .
If the sample size is large (i.e. np >= 5 and n(1-p) > 9) p follows a normal distribution with mean x/n p =) (x is the number of erroneous frame transfers and n is the sample size, where p) is the best estimate of p). The standard deviation of p) is
n)p-(p SDp
~1~~ =
The confidence interval for p is p z*SD p ~
~ + (where z* is the standardised- or z-value of the normal distribution). For a two-sided interval with a confidence level of 95%, z* = 1.96, for a two-sided interval with a confidence level of 90% z* = 1.65.
The error margin of is denoted as p~n
)p-(pzm~1~
*=
If we choose then solving for n yields: pm ~5.0=
( )p
pzppmzn ~
~1*4)~1(~* 22 −
=−⎟⎠⎞
⎜⎝⎛= (6)
Sample size proposal Analysis of data obtained during performance tests for the HSL line in the Netherlands shows that is of the order of 1% (on average 1% of the frames are transferred in error). If we choose a confidence level of 95% then (6) results in:
p~
( ) 152101.0
01.0196.14 2 =−
=n (7)
This means that if we perform the same test with a sample size of n = 1521 over and over again, we find a value of in the range of 0.5% to 1.5% in 95% of all tests carried out. This seems to be quite a reasonable approach with rather good reproducibility.
p~
The sample size should be constrained to a certain geographical- or (measurement) time unit in order to discriminate between ETCS lines of different length. It is proposed to (at least) take 1500 samples (1521 rounded down) over 1 km of track (750 samples in each direction of travel).
Doc N°: O-2475 3.0 Page 33 of 33 Originated by QoS Working Group

Since the behaviour of downlink frame transfer and uplink frame transfer is quite different, a sample size of 1500 is applicable to both uplink- and downlink measurement. Note that the assumption that the transfer of frames follows a binomial statistical law may not be true since the a-priori probability of transferring a frame in error may not be the same for every frame transfer (it is probably dependent on train speed and location). During a GSM-R hand over for example, the data transfer may be disturbed over several consecutive frames. Therefore the area over which the 1500 samples are taken is limited to 1 km. In any case, the results of real-live performance tests are needed to evaluate the strength of the analysis and the underlying assumptions. Consequences for measurement in practice The analysis of the measurement data of the HSL line in the Netherlands also shows that after completion of the transfer of a frame in the uplink direction, the average time it takes before the next frame is starting to transmit is about 10 msec. It takes (1+8+1)*30/9600*1000 = 31.25 msec. to transfer a single 30-byte frame (including start- and stop-bit) with 9600 bps. So the average frame transfer rate is 25 per second (i.e. actually 1/(31.25+10)*1000 = 24.24). For the downlink the frame transfer rate is higher (it takes only 1 msec. on average in between two frame transfers). The rate on the downlink is 1/(31.25+1)*1000 = 31 frames per second. The table below shows the practical consequences in terms of the number of recommended test runs:
Average speed of test train
along the track
Duration to travel 1000 meter (seconds)
Number of samples obtained during 1000 meter with frame transfer rate
= 25 per second
Number of test runs recommended with sample size 1500
(with 2 measurement sets per train (1 set for uplink, 1 set for downlink)
56 km/hr (15 m/s) 66.66 1666.50 2 (0.9) * 108 km/hr (30 m/s) 33.33 833.25 2 (1.8) 216 km/hr (60 m/s) 16.67 416.75 4 (3.6) 324 km/hr (90 m/s) 11.11 277.78 6 (5.4)
* 2 runs (1 return trip) is the minimum number of runs that is needed. This is due to the GSM mobility management mechanisms that have hysteresis and therefore it is required to travel at least once both ways to check the correct sending of data frames Note The test for validation of Transmission Interference shall comprise a substantial ETCS test area including at least 5 GSM-R cells. Example: If you have a 100 km ETCS line with an average operational train speed of 216 km/h, it is recommended to use a measurement train equipped with 2 measurement sets (1 for uplink- and 1 for downlink measurements) and to perform 2 round trip test runs.
Doc N°: O-2475 3.0 Page 34 of 34 Originated by QoS Working Group

Validation of TI parameters For a description of the validation procedure and the definition of TI parameters refer to par. 6.2.3.
6.4.6 Connection Establishment Error Ratio Sample size (theoretical background) The theoretical background is described in section 6.4.2. Sample size proposal With CER = 0.01 (as specified in Subset-093) and with formula (6 and 7) a sample size of n=1521 is required (with a (two-sided) confidence level = 95%). The 95% confidence interval then ranges from 0.5% to 1.5%. With a one-sided interval with confidence level = 95% however, formula (6) results in n=1078 (note that z*=1.65 in this case). Since the requirement is CER < 0.01 and not CER = 0.01, a one-sided confidence interval is most appropriate. Consequences for measurement in practice Assuming that a call can be set up every 30 seconds on average, about 9 hours of test time is required (n=1078). Validation of parameter CER If the number of connection establishment failures is less than or equals 16, the maximum measured CER = 16/1078 = 1.48%, just results in a successful validation of CER. If the number of connection establishment failures equals or exceeds 17, the minimum measured CER = 17/1078 = 1.58% and validation of CER fails (i.e. the measured CER is outside the one-sided confidence interval).
0,00
0,02
0,04
0,06
0,08
0,10
0,12
0,14
0 2 4 6 8 10 12 14 16 18 20 22 24 26 28 30 32 34
--> k (Number of Connection Establishment Failures)
P (N
umbe
r of C
onne
ctio
n Es
tabl
ishm
ent
Failu
res
= k)
0,0
0,2
0,4
0,6
0,8
1,0
P (N
umbe
r of C
onne
ctio
n Es
tabl
ism
ent
Failu
res
<= k
)
CER = 0.01 Sample size (n) = 1078
The figure above illustrates the binomial distribution for CER=0.01 and n=1078. The red area at the tail corresponds with a cumulative probability of about 5%, which is the probability that the number of connection establishment failures is 17 or more.
Doc N°: O-2475 3.0 Page 35 of 35 Originated by QoS Working Group

END OF DOCUMENT.
Doc N°: O-2475 3.0 Page 36 of 36 Originated by QoS Working Group