erste group investor presentation q2 2016 results...5 august 2016 erste group investor presentation...
TRANSCRIPT

Page
Erste Group powers ahead: capital generation at historic high, asset quality improvement continues Andreas Treichl, CEO Erste Group Gernot Mittendorfer, CFO Erste Group Andreas Gottschling, CRO Erste Group
5 August 2016
Erste Group investor presentation Q2 2016 results

Page
Disclaimer – Cautionary note regarding forward-looking statements
2
• THE INFORMATION CONTAINED IN THIS DOCUMENT HAS NOT BEEN INDEPENDENTLY VERIFIED AND NO REPRESENTATION OR WARRANTY EXPRESSED OR IMPLIED IS MADE AS TO, AND NO RELIANCE SHOULD BE PLACED ON, THE FAIRNESS, ACCURACY, COMPLETENESS OR CORRECTNESS OF THIS INFORMATION OR OPINIONS CONTAINED HEREIN.
• CERTAIN STATEMENTS CONTAINED IN THIS DOCUMENT MAY BE STATEMENTS OF FUTURE EXPECTATIONS AND OTHER FORWARD-LOOKING STATEMENTS THAT ARE BASED ON MANAGEMENT’S CURRENT VIEWS AND ASSUMPTIONS AND INVOLVE KNOWN AND UNKNOWN RISKS AND UNCERTAINTIES THAT COULD CAUSE ACTUAL RESULTS, PERFORMANCE OR EVENTS TO DIFFER MATERIALLY FROM THOSE EXPRESSED OR IMPLIED IN SUCH STATEMENTS.
• NONE OF ERSTE GROUP OR ANY OF ITS AFFILIATES, ADVISORS OR REPRESENTATIVES SHALL HAVE ANY LIABILITY WHATSOEVER (IN NEGLIGENCE OR OTHERWISE) FOR ANY LOSS HOWSOEVER ARISING FROM ANY USE OF THIS DOCUMENT OR ITS CONTENT OR OTHERWISE ARISING IN CONNECTION WITH THIS DOCUMENT.
• THIS DOCUMENT DOES NOT CONSTITUTE AN OFFER OR INVITATION TO PURCHASE OR SUBSCRIBE FOR ANY SHARES AND NEITHER IT NOR ANY PART OF IT SHALL FORM THE BASIS OF OR BE RELIED UPON IN CONNECTION WITH ANY CONTRACT OR COMMITMENT WHATSOEVER.

Page
Presentation topics
3
• Executive summary • Business environment • Business performance • Assets and liabilities • Outlook • Additional information
Page
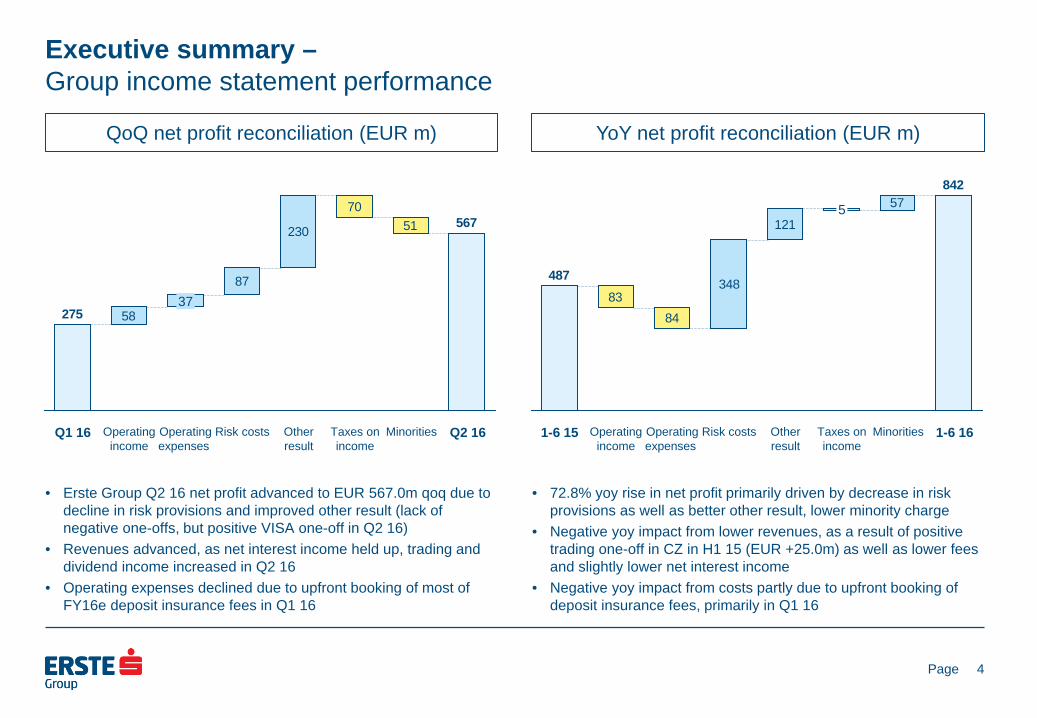
Executive summary – Group income statement performance
QoQ net profit reconciliation (EUR m)
YoY net profit reconciliation (EUR m)
4
• Erste Group Q2 16 net profit advanced to EUR 567.0m qoq due to decline in risk provisions and improved other result (lack of negative one-offs, but positive VISA one-off in Q2 16)
• Revenues advanced, as net interest income held up, trading and dividend income increased in Q2 16
• Operating expenses declined due to upfront booking of most of FY16e deposit insurance fees in Q1 16
• 72.8% yoy rise in net profit primarily driven by decrease in risk provisions as well as better other result, lower minority charge
• Negative yoy impact from lower revenues, as a result of positive trading one-off in CZ in H1 15 (EUR +25.0m) as well as lower fees and slightly lower net interest income
• Negative yoy impact from costs partly due to upfront booking of deposit insurance fees, primarily in Q1 16
58
87
230
7051 567
275
Q2 16 Minorities Taxes on income
Other result
Risk costs Operating expenses
37
Operating income
Q1 16
8384
348
121
57842
487
Minorities 1-6 16 Other result
Taxes on income
Risk costs
5
1-6 15 Operating expenses
Operating income

Page
Executive summary – Key income statement data
Net interest income & margin
5
Operating result & cost/income ratio Cost of risk
Banking levies
Reported EPS & ROE
Return on tangible equity
1,503
-11.1%
1-6 16
1,336
1-6 15
-31
56
Q2 16
-0.09%
Q1 16
0.17%
26
-93.1%
1-6 16 1-6 15
374
716620
Q2 16
57.6%
Q1 16
61.9%
1,102
2.57%
Q1 16
1,092
2.51%
Q2 16
45
63
Q2 16 Q1 16
108
137
1-6 16 1-6 15 1-6 16
1.96
14.9%
1-6 15
1.14
9.6%
Q2 16
1.32
19.7%
Q1 16
0.64
9.8%
1-6 16
2,194
2.54%
1-6 15
2,212
2.58% in EUR m
in EUR m
in EUR m in EUR m
in EUR
1-6 16
17.0%
1-6 15
11.2%
Q2 16
22.6%
Q1 16
11.3%

Page
Executive summary – Group balance sheet performance
YTD total asset reconciliation (EUR m)
YTD equity & total liability reconciliation (EUR m)
6
• Balance sheet total rises by 2.4% in H1 16, driven by increase in net customer loans and investment in trading and financial assets
• Net customer loans rise by 1.2% ytd, supported mainly by continued strong demand in Czech Republic (+3.5% ytd) and Slovakia (+2.5% ytd), as Romania, Hungary and Croatia lag behind
• 1.9% increase in customer deposits outpaced customer loan development in H1 16
• Significant 7.9% rise in total equity due to better profitability; and inclusion of AT1 instrument (EUR 500m) in equity as of Q2 16
• Seasonal increase in bank deposits reflects general expansion of interbank business in H1 16; mirrors asset side
821
632
30/06/16
204,505
Other assets
84
Intangibles
28
Net loans
1,511
Loans to banks
Trading, financial assets
1,910
Cash 31/12/15
199,743
30/06/16
204,505
Equity
1,169
Other liabilities
327
Debt securities
1,640
Customer deposits
2,471
Bank deposits
2,155
Trading liabilities
279
31/12/15
199,743

Page
Executive summary – Key balance sheet data
Loan/deposit & loan/TA ratio
7
Net loans & credit RWA NPL coverage ratio & NPL ratio
B3FL capital ratios
B3FL capital & tangible equity*
Liquidity coverage & leverage ratio**
+1.2%
Credit RWA
83.4 84.7
Net loans
127.4 125.9
30/06/16 31/12/15
NPL ratio
5.8% 7.1%
NPL coverage
65.6% 64.5%
Loans/total assets
62.3% 63.0%
Loan/deposit ratio
97.7% 98.4%
Tangible equity
10.1 9.5
CET 1
13.1 12.0
CET 1
12.7% 12.0%
Total capital
18.3% 17.2%
* Based on shareholders’ equity, not total equity LR (B3FL)
6.2% 5.7%
LCR
115.4%
111.0%
in EUR bn
in EUR bn
** Pursuant to Delegated Act

Page
Presentation topics
8
• Executive summary • Business environment • Business performance • Assets and liabilities • Outlook • Additional information

Page
Business environment – Solid CEE GDP growth expectations for 2016
Real GDP growth (in %)
9
Dom. demand contribution* (in %) Net export contribution* (in %)
Unemployment rate (eop, in %)
Current account balance (% of GDP)
Gen gov balance (% of GDP)
Consumer price inflation (ave, in %)
Public debt (% of GDP)
• Erste Group’s core CEE markets expected to grow by 2-4% in 2016, with continued positive outlook for 2017 • Domestic demand is expected to be main driver of economic growth in 2016 and 2017 • Consumption is supported by improving labour markets, wage increases and very low inflation rates across the region
• Solid public finances across Erste Group‘s core CEE markets: almost all countries fulfill Maastricht criteria • Sustainable current account balances, supported by competitive economies with decreasing unemployment rates
HR
1.6 1.7
HU
2.9 2.0
RO
5.0 5.7
SK
2.4 2.7
CZ
2.1 1.7
AT
1.3 1.4
2017 2016
HR
2.0 1.8
HU
2.8 2.0
RO
3.6 4.1
SK
3.1 3.1
CZ
2.5 2.2
AT
1.6 1.4
HR
1.0
-0.9
HU
2.0
0.6
RO
1.4
-1.4
SK
1.2
-0.3
CZ
1.3 0.6
AT
1.7 1.1
HR
15.3 15.8
HU
5.2 5.5
RO
6.7 6.7
SK
9.3 10.0
CZ
4.2 4.1
AT
6.2 6.1
HR
2.9 3.3
HU
4.7 4.9
RO
-2.5 -2.2
SK
0.7 0.0
CZ
0.9 0.9
AT
3.2 2.7
-2.2
RO
-3.5 -2.9
SK
-2.0 -2.5
CZ
-1.0 -1.1
AT
-1.5 -1.6
HR
-2.4 -2.8
HU
-2.7
8775
4153
40
84 8674
4253
39
83
HR HU RO SK CZ AT
* Contribution to real GDP growth. Domestic demand contribution includes inventory change. Source: Erste Group Research
SK
0.5
RO
-1.6
-0.1
HR AT
0.3
CZ
0.4 0.7
HU
0.1 0.1
-1.4
0.4
-0.2
0.3
Page
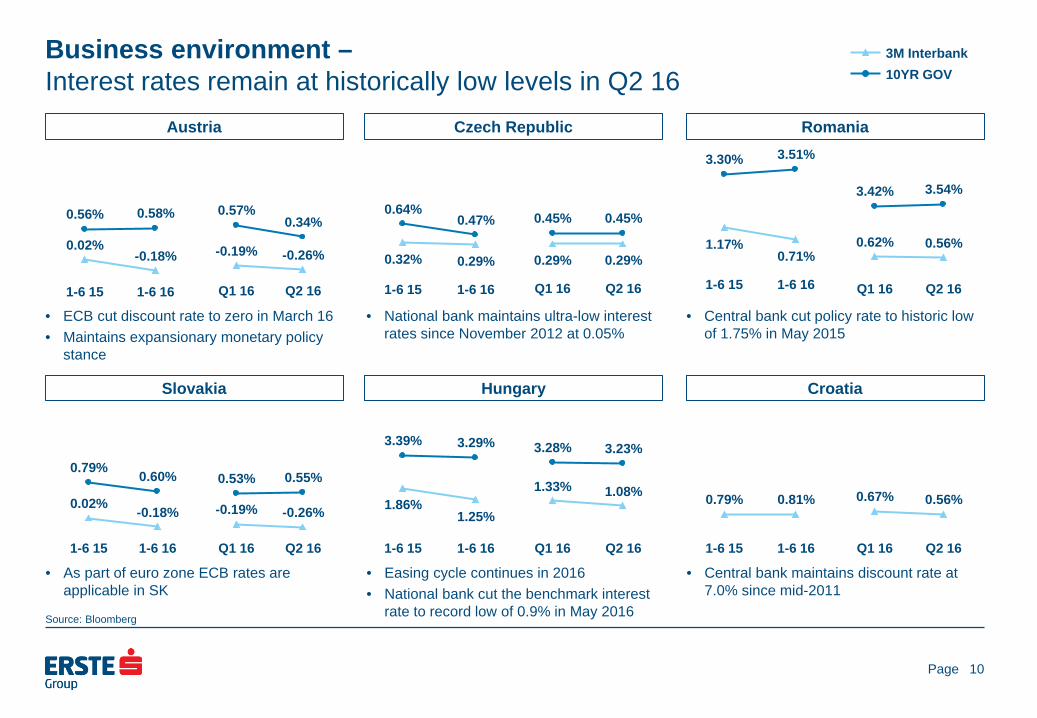
Business environment – Interest rates remain at historically low levels in Q2 16
Austria
10
Czech Republic Romania
Slovakia
Hungary
Croatia
• ECB cut discount rate to zero in March 16 • Maintains expansionary monetary policy
stance
• National bank maintains ultra-low interest rates since November 2012 at 0.05%
• Central bank cut policy rate to historic low of 1.75% in May 2015
• As part of euro zone ECB rates are applicable in SK
• Easing cycle continues in 2016 • National bank cut the benchmark interest
rate to record low of 0.9% in May 2016
• Central bank maintains discount rate at 7.0% since mid-2011
1-6 16
0.58%
-0.18%
1-6 15
0.56%
0.02%
10YR GOV 3M Interbank
1-6 16
0.47%
0.29%
1-6 15
0.64%
0.32%
1-6 16
3.51%
0.71%
1-6 15
3.30%
1.17%
1-6 16
0.60%
-0.18%
1-6 15
0.79%
0.02%
1-6 16
3.29%
1.25%
1-6 15
3.39%
1.86%
1-6 16
0.81%
1-6 15
0.79%
Q2 16
0.34%
-0.26%
Q1 16
0.57%
-0.19%
Q2 16
0.45%
0.29%
Q1 16
0.45%
0.29%
Q2 16
3.54%
0.56%
Q1 16
3.42%
0.62%
Q2 16
0.55%
-0.26%
Q1 16
0.53%
-0.19%
Q2 16
3.23%
1.08%
Q1 16
3.28%
1.33%
Q2 16
0.56%
Q1 16
0.67%
Source: Bloomberg

Page
Business environment – Limited currency volatility in CEE
EUR/CZK
11
EUR/RON
EUR/HUF
EUR/HRK
• Czech National Bank maintains exchange rate stability; discount rate also stable at 0.05% in Q2 16
• RON movements marked by limited volatility, despite decreasing interest rates: policy rate cut to 1.75% in Q2 15
• Stable currency development, despite expansionary monetary stance of the national bank
• Strong grip of national bank on HRK is reflected in lack of volatility
-1.7%
1-6 16
27.0
1-6 15
27.5
0.0%
Q2 16
27.0
Q1 16
27.0
+0.1%
30/06/16
27.1
31/12/15
27.0
+0.8%
1-6 16
4.48
1-6 15
4.45
+0.1%
Q2 16
4.50
Q1 16
4.49 4.52
31/12/15
4.52
0.0%
30/06/16
+1.7%
1-6 16
312.7
1-6 15
307.4
+0.4%
Q2 16
313.4
Q1 16
312.0
-0.3%
30/06/16
315.1
31/12/15
316.0
-0.6%
1-6 16
7.58
1-6 15
7.63
-1.5%
Q2 16
7.50
Q1 16
7.62
31/12/15
7.64
-1.4%
30/06/16
7.53
Source: Bloomberg
Page
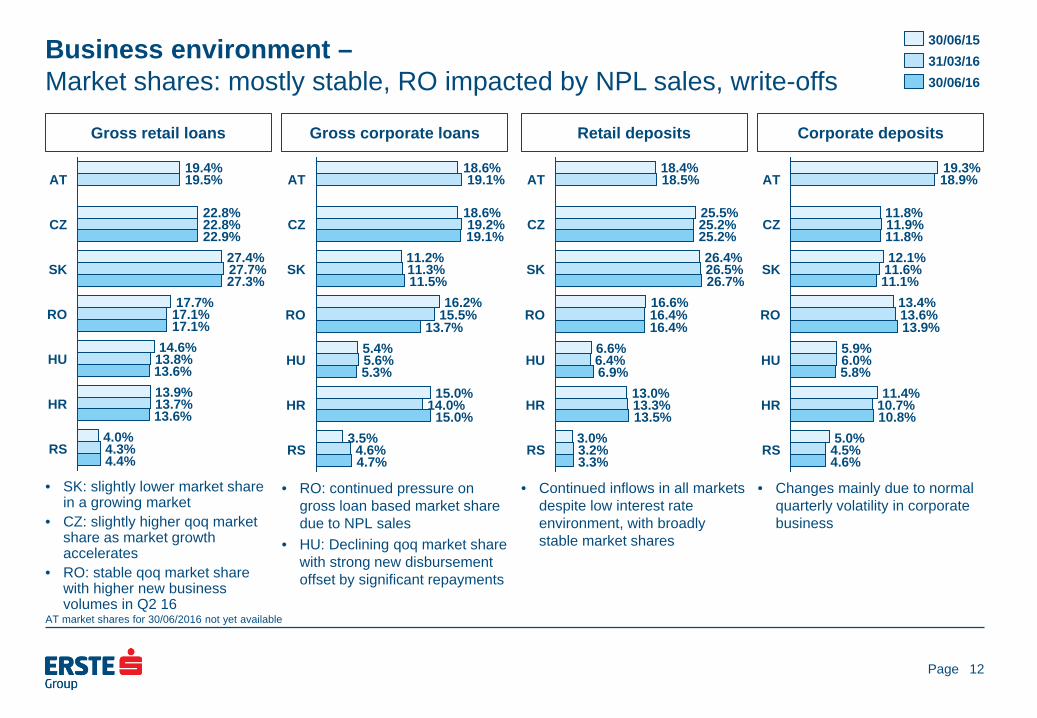
Business environment – Market shares: mostly stable, RO impacted by NPL sales, write-offs
Gross retail loans
12
• SK: slightly lower market share in a growing market
• CZ: slightly higher qoq market share as market growth accelerates
• RO: stable qoq market share with higher new business volumes in Q2 16
Gross corporate loans
• RO: continued pressure on gross loan based market share due to NPL sales
• HU: Declining qoq market share with strong new disbursement offset by significant repayments
Retail deposits
• Continued inflows in all markets despite low interest rate environment, with broadly stable market shares
Corporate deposits
• Changes mainly due to normal quarterly volatility in corporate business
RS 4.4% 4.3% 4.0%
HR 13.6% 13.7% 13.9%
HU 13.6% 13.8% 14.6%
RO 17.1% 17.1% 17.7%
SK 27.3% 27.7% 27.4%
CZ 22.9% 22.8% 22.8%
AT 19.5% 19.4%
30/06/16 31/03/16 30/06/15
RS 4.7% 4.6%
3.5%
HR 15.0%
14.0% 15.0%
HU 5.3% 5.6% 5.4%
RO 13.7%
15.5% 16.2%
SK 11.5% 11.3% 11.2%
CZ 19.1% 19.2%
18.6%
AT 19.1% 18.6%
RS 3.3% 3.2% 3.0%
HR 13.5% 13.3% 13.0%
HU 6.9% 6.4% 6.6%
RO 16.4% 16.4% 16.6%
SK 26.7% 26.5% 26.4%
CZ 25.2% 25.2% 25.5%
AT 18.5% 18.4%
4.5% 4.6%
RS 5.0%
5.8%
HR 10.8% 10.7% 11.4%
HU 6.0% 5.9%
SK
RO 13.9% 13.6% 13.4%
11.1% 11.6% 12.1%
CZ 11.8% 11.9% 11.8%
AT 18.9% 19.3%
AT market shares for 30/06/2016 not yet available

Page
Presentation topics
13
• Executive summary • Business environment • Business performance • Assets and liabilities • Outlook • Additional information

Page
Business performance: performing loan stock & growth – Performing loan volume increases by 1.8% ytd
• Rising performing loan volume trend continues in Q2 16 across most geographies, most pronounced in AT and CZ; yoy growth driven by AT, CZ and SK
• Yoy growth driven by Corporates business lines and to a lesser extent by Retail
• Qoq growth mainly attributable to Retail • Year-on-year segment trends:
• SK: continued Retail growth, substantial growth in SME • CZ: unchanged growth in Retail, accompanied by increases in
SME and Local Large Corporates • AT/EBOe: strong performance in Corporates business lines
• Quarter-on-quarter segment trends:
• AT/OA: decline driven by Group Large Corporates and Commercial Real Estate
• CZ: growth equally distributed between Retail and Corporates business lines
• AT/EBOe: balanced increase in Corporates and Retail portfolio
14
Other 0.1 0.1 0.3
RS 0.7 0.7 0.5
HR 5.5 5.6 5.6
HU 2.9 2.8 3.0
SK 9.4 9.2 8.6
RO 6.8 6.8 7.0
CZ 20.2 19.9 18.6
AT/OA 11.6 11.9 11.4
AT/SB 37.8 37.5 36.7
AT/EBOe 29.7 29.4 28.6
Group 124.7 123.8
120.3
-6.6% -65.6%
5.2% 28.5%
-2.6% -2.8%
3.4% -1.3%
2.1% 9.2%
0.6% -1.8%
1.7% 8.7%
-2.4% 2.1%
1.0% 3.0%
1.2% 3.8%
0.8% 3.7%
QoQ YoY
30/06/16
30/06/15 31/03/16
in EUR bn

Page
Business performance: customer deposit stock & growth – Deposits grow by 1.9% ytd
• Continued inflow in customer deposits, mainly driven by CZ, RO and EBOe
• Yoy growth predominantly due to Retail business line • Qoq increase mainly driven by Retail and to a lesser extent
by Corporates business lines
• Year-on-year segment trends: • CZ: growth mainly in Retail and Corporates in line with loan
development, additional growth in Group Markets • RO: equally balanced growth in Retail and Corporates • SK: deposit inflow exclusively in Retail, minor outflows in
Corporates • AT/EBOe: growth in Retail and SME business
• Quarter-on-quarter segment trends: • CZ: growth in Retail and across Corporates business lines • RO: increase in Retail and Group Large Corporates
15
0.1 -0.4 -0.1
RS 0.6 0.6 0.6
HR 5.4 5.4 5.2
HU 4.0 3.9 3.9
SK 10.9 10.7 10.4
RO 9.7 9.3 8.8
CZ 28.1 26.9 25.3
AT/OA 3.0 4.0 4.0
Other
37.8 37.7 36.6
AT/EBOe 30.8
AT/SB
29.9
Group 130.4 128.6
124.5
30.5
1.4% 0.7%
0.0% 4.6%
3.0% 2.2%
2.3% 5.4%
3.7% 10.3%
4.7% 11.0%
-26.3% -25.7%
0.3% 3.2%
0.8% 3.0%
1.4% 4.7%
QoQ YoY
in EUR bn
30/06/16
30/06/15 31/03/16

Page
Business performance: NII and NIM – Low interest rate environment results in NIM pressure, improved qoq
• Yoy relatively stable as increase in Other segment (due to higher benefit from free capital) and AT/SB (driven by higher loan volumes and deposit repricing) was offset by decline in HU, RO and AT/OA
• Qoq increase mainly in AT/SB (due to derivatives valuations and deposit repricing) and also in CZ, RO
• Year-on-year segment trends: • AT/SB: increase driven by higher loan volumes and deposit
repricing (see above) • RO: decrease mainly due to mortgage refinancing campaign
and lower market rates • AT/OA: decline in NII primarily due to the non-recurrence of
one-off income in the real estate business • HU: decrease driven by fair interest rate settlement combined
with lower performing loan volumes
• Quarter-on-quarter segment trends: • AT/SB: increase in NII driven by derivatives valuations and
deposit repricing (see above) • RO: increase driven by derivatives valuation • HU: decline resulting from lower Group Markets business
16
114
68
159
97
113
67
113
66
30
10
57
111
229
107
228
160
44
11
46
97
227
232
45
11
42
100
229
99
240
156
Other
RS
HR
HU
SK
RO
CZ
AT/OA
AT/SB
AT/EBOe
Group 1,102
1,092 1,113
Q2 16 Q1 16 Q2 15
5.14% 5.36%
5.81% 3.39% 3.38% 3.37%
3.00% 3.24%
3.99% 3.43% 3.45% 3.73%
3.49% 3.42%
3.80% 2.99% 3.00% 3.15%
1.43% 1.37% 1.38%
1.93% 1.80% 1.83% 1.83% 1.80% 1.87%
2.57% 2.51% 2.59%
in EUR m Not meaningful

Page
Business performance: operating income – Operating income up qoq due to better trading and dividend income
• Yoy down in HU, RO and AT/OA primarily on NII and fees • Qoq increase driven by dividend income as well as net
trading and FV result (AT/EBOe, AT/SB)
• Year-on-year segment trends: • HU: decline due to significantly lower NII (lower performing loan
volumes and fair interest rate settlement), only partially offset by stronger trading and FV result
• RO: primarily driven by lower NII • AT/OA: decline in NII in Commercial Real Estate and lower fee
income in Group Large Corporates • HR: down on NII and rental income
• Quarter-on-quarter segment trends:
• AT/SB: increase in net trading and FV result mainly driven by securities valuations, while NII improved on deposit repricing, partially offset by lower fee income (driven by insurance and securities business)
• AT/EBOe: strong net trading and FV result (valuation of derivatives), partially offset by lower NII and lower fee income
• AT/OA: improvements in net trading and FV result (Commercial Real Estate), NII (Group Large Corporates) and fee income
17
258
184
104
14
151
83
101
15
100
29
93
152
167
343
366
35
159
340
155
345
246
33
15
82
152
158
345
173
367
261
Other
RS
HR
HU
SK
RO
CZ
AT/OA
AT/SB
AT/EBOe
Group 1,687
1,629 1,710
Q2 16 Q1 16 Q2 15
in EUR m -5.8% 15.9%
1.2% 4.4%
-1.1% -3.5%
-0.2% -11.7%
0.9% -0.1%
-0.3% -5.0%
1.6% 0.6%
11.4% -5.8%
6.5% 0.4%
6.0% 0.8%
3.6% -1.3%
QoQ YoY

Page
Business performance: operating expenses – Qoq decline due to upfront booking of deposit insurance fees
• Yoy costs increase primarily driven by regular adjustment of salaries at constant FTE level and parallel operation of buildings after move to the new headquarters Erste Campus, partially offset by lower payment into deposit insurance fund due to upfront booking in Q1 16
• Qoq down due to upfront booking of deposit insurance contributions in Q1 16, partially offset by higher personnel expenses
• Year-on-year segment trends: • AT/SB: rise mainly driven by IT due to lower capitalisation of
project expenditures and increase personnel costs due to regular adjustment of salaries
• CZ: down on lower contribution to deposit insurance fund • Other: driven by growing number of group-wide regulatory
projects
• Quarter-on-quarter segment trends: • AT/EBOe: decline due to deposit insurance contributions,
partially offset by higher IT driven by lower capitalisation of project expenses
• HU, RO: cost reduction due to deposit insurance contributions fully booked in Q1 16
• AT/OA: increase in the Holding on higher volume of projects related to Corporates and Markets and higher office space cost due to parallel building costs after move to the new headquarters Erste Campus
18
152
65
47
84
50
46
81
49
50
10
44
82
170
88
240
69
10
68
90
162
258
173
62
10
43
67
163
88
253
155
Other
RS
HR
HU
SK
RO
CZ
AT/OA
AT/SB
AT/EBOe
Group 972
1,009 949
Q2 16 Q1 16 Q2 15
in EUR m -9.7% 24.5%
4.9% 4.3%
4.9% 3.8%
-13.1% -1.0%
-0.1% 3.2%
-10.7% -1.7%
1.0% -4.1%
4.4% -1.0%
-1.6% 5.4%
-10.5% 2.0%
-3.7% 2.4%
QoQ YoY

Page
Business performance: operating result and CIR – Operating result recovers in Q2 16, still down yoy
Operating result
YoY & QoQ change
19
Cost/income ratio
55
5
57
50
87
85
95
5
33
83
68
72
5
52
39
84
78
86
Other -29 -34 -22
RS
HR
HU
SK
RO
CZ 182 178 173
AT/OA
AT/SB 114 87 126
AT/EBOe 106 73 107
Group 716 620
762
68.0% 65.5% 68.0%
48.5% 45.7% 45.0%
52.6% 60.4%
46.9% 44.4% 44.9% 43.0%
50.9% 56.9%
49.2% 47.3% 47.6% 49.6% 50.6% 54.0%
48.1% 68.9%
74.7% 65.7%
59.4% 70.3%
58.7% 57.6% 61.9%
55.5%
in EUR m Not meaningful
-5.9% 4.6%
-6.2% -9.5%
19.3% -21.2%
1.8% -2.7%
13.5% -8.2%
2.1% 5.3%
19.6% -10.3%
30.6% -9.2%
44.9% -0.8%
15.4% -6.0%
QoQ YoY
Q2 16 Q1 16 Q2 15

Page
Business performance: risk costs (abs/rel*) – Releases in HU and AT drive risk costs
• Continued strong risk performance in Q2 16 across the board and further improvements in Retail
• Year-on-year segment trends: • HU: releases in Retail portfolio (which also explains qoq trend)
as parameters reset after FX conversion • HR: improvements mainly in Corporates, to a lower extent in
Retail • CZ: further improvements of portfolio quality in Retail and
Corporates
• Quarter-on-quarter segment trends: • RO: low risk costs across all major business lines following
releases in Q1 16 • AT/SB: releases in several savings banks • AT/EBOe: releases mainly in Corporates, positive development
in AT supported by parameter calibrations • HR: improvements in Corporates partially offset by slightly
higher risk costs in Retail
20
19
61
41
41
9
24
4
9
3
9
15
6
5
-8
23
1
11
11
17
-8
0
6
10
11
-8
-6
Other
RS
HR
HU -58
-14
SK
RO 14
-29
CZ
AT/OA
AT/SB
AT/EBOe
Group -31
56 191
-0.09% 0.63%
1.77% 0.35% 0.64%
2.35% -6.63%
-1.60% 6.13%
0.40% 0.47% 0.41% 0.68%
-1.39% 0.66%
0.17% 0.33% 0.40% 0.34% 0.12% 0.16%
-0.08% 0.24% 0.05%
-0.08% 0.12%
-0.11% -0.09%
0.17% 0.58%
Q2 16
Q2 15 Q1 16
in EUR m * Relative risk costs are defined as annualised quarterly risk costs over average gross customer loans.
Not meaningful

Page
Business performance: non-performing loans and NPL ratio – NPL ratio improves to 5.8%, lowest since June 2009
• Continued decline of group NPL volume in Q2 16 mainly due to low NPL inflows and continued NPL sales
• NPL sales of EUR 864.1m in Q2 16 (Q1 16: EUR 126.6m) • Retail: EUR 103.5m (Q1 16: EUR 28.5m ) • Corporate: EUR 760.6m (Q1 16: EUR 98.1m)
• NPL sales mainly in RO (578.4m), HR (152.1m), Other Austria (79.6m) and further sales in HU, SK, CZ and RS
21
35
81
39
68
34
62
Other
RS
HR 820 1,002 1,303
HU 495 570 821
SK 530 536 413
RO 1,112
1,651 1,860
CZ 765 816 806
AT/OA 1,035 1,196 1,460
AT/SB 2,064 2,142 2,380
AT/EBOe 829 836 942
Group 7,746
8,856 10,102
25.4% 26.7%
10.7% 8.1% 9.3%
13.0% 13.0%
15.1% 18.8%
14.5% 16.8%
21.7% 5.3% 5.5%
4.6% 14.0%
19.6% 21.1%
3.7% 3.9% 4.2%
8.2% 9.1%
11.4% 5.2% 5.4% 6.1%
2.7% 2.8% 3.2%
5.8% 6.7% 7.7%
30/06/16 31/03/16 30/06/15
in EUR m

Page
Business performance: allowances for loans and NPL coverage – NPL coverage at comfortable 65.6%
• NPL coverage at 65.6%, slight decline due to NPL sales and higher collateralisation
• HU: coverage stabilises above 60% after significant decline resulting from the CHF conversion in 2015
• SK: coverage ratio stable at comfortable level following temporary decline at year-end (due to adoption of EBA default definition)
• AT/OA: decline of coverage as a result of NPL sales, partly compensated by higher collateral
• RO: coverage improved despite sizeable NPL sales
22
49
67
40
59
36
57RS
HR 554 682 820
HU 315 355 404
SK 349 358 353
RO 899
1,294 1,570
CZ 582 596 650
AT/OA 565 705 928
AT/SB 1,222
Other
1,461
AT/EBOe 502 531
1,270
Group 5,083
5,891 6,887
583
103.1% 140.4%
91.6% 87.3%
82.5% 67.6% 68.1%
62.9% 63.7% 62.2%
49.2% 65.9% 66.8%
85.6% 80.9% 78.4% 84.4%
76.1% 73.1% 80.7%
54.6% 58.9% 63.6%
59.2%
106.9%
59.3% 61.4% 60.6% 63.5% 61.9% 65.6% 66.5% 68.2%
30/06/16
30/06/15 31/03/16
in EUR m

Page
Business performance: other result – Other result improves yoy and qoq on VISA gain in Q2 16
• Yoy development due to sale of VISA Europe shares totalling EUR 138.7m
• Qoq improvement also driven by non-recurrence of regulatory costs (HU banking tax, contributions to recovery and resolution fund)
• Year-on-year segment trends: • CZ, SK, AT/EBOe, HR, RO: improvement mainly due to VISA
sale • AT/SB: decrease driven by valuation of investment funds
• Quarter-on-quarter segment trends:
• CZ, SK, AT/EBOe, HR, RO: improvement driven by VISA sale and non-recurrence of contributions into recovery and resolution fund and in AT/EBOe also by real estate selling gains
• HU: driven by VISA sale and non-recurrence of contributions to recovery and resolution fund as well as banking levy (full amount for 2016 booked in Q1 16)
23
3
7
26
38
14
0
-1
-4
-9
-3
-24
17
-15
-35
0
-3
-44
-12
-15
-10
-6
-71
0
12
7
18
47
23
-6
Other
RS
HR
HU
SK
RO -18
CZ
AT/OA
AT/SB
AT/EBOe
Group 93
-137 -22
in EUR m
Q2 16 Q1 16 Q2 15

Page
Business performance: net result – Q2 16 net result up yoy and qoq on risk costs, VISA sale and other result
• Yoy and qoq rise in profitability driven by net releases of risk provisions, significantly improved other result (VISA sale one-off) and also qoq better operating performance
• Year-on-year segment trends: • HU: mainly driven by release of risk provisions and VISA sale • CZ: strong increase predominantly due to VISA sale, to a lesser
extent due to lower risk costs • AT/OA: higher net result mainly due to real estate business and
lower off-balance sheet risk provisions • HR: significantly lower risk costs and VISA sale
• Quarter-on-quarter segment trends:
• HU, CZ: same drivers as yoy development (see above) • AT/EBOe: releases of risk provisions, VISA sale and one-off
gains in subsidiaries • SK: higher net result due to VISA sale and lower risk costs • AT/OA: driven by Commercial Real Estate and Group Large
Corporates • Return on equity at 19.7% in Q2 16, following 9.8% in Q1 16,
and 10.2% in Q2 15 • Cash return on equity at 19.8% in Q2 16, following 9.9 % in
Q1 16, and 10.2% in Q2 15
24
15
45
42
62
567
17
63
30
-96
2
8
-19
52
54
126
75
261
-77
3
23
0
45
116
54
7
275
-72
4
101
88
172
70
94
RS
HR
HU
SK
RO
CZ
AT/OA
AT/SB
AT/EBOe
Group
Other in EUR m
Q2 16
Q2 15 Q1 16

Page
Presentation topics
25
• Executive summary • Business environment • Business performance • Assets and liabilities • Outlook • Additional information

Page
Assets and liabilities: YTD overview – Loan/deposit ratio stable at 97.7% (Dec 15: 98.4%)
Assets (EUR bn)
26
Assets (in %)
Liabilities & equity (EUR bn)
Liabilities & equity (in %)
30/06/16
204.5
7.6 1.4
127.4
5.6
49.5
13.0
31/12/15
199.7
7.7 1.5
125.9
4.8
47.5
12.4
Other assets Intangibles Net loans Loans to banks Trading, financial assets Cash
30/06/16
204.5
16.0 7.6 28.0
130.4
16.4 6.1
31/12/15
199.7
14.8 7.3
29.7
127.9
14.2 5.9
Equity Other liabilities Debt securities Customer deposits Bank deposits Trading liabilities
100%
30/06/16
3.7% 0.7%
62.3%
2.8%
24.2%
6.3%
31/12/15
3.8% 0.7%
63.0%
2.4%
23.8%
6.2%
30/06/16
100%
7.8% 3.7% 13.7%
63.8%
8.0% 3.0%
31/12/15
7.4% 3.6% 14.8%
64.1%
7.1% 2.9%

Page
Assets and liabilities: customer loans by country of risk – Performing loans up 3.7% yoy, NPLs down 23.3%
Net customer loans (EUR bn)
Performing loans (EUR bn)
27
Non-performing loans (EUR bn)
• Performing loan growth driven by Austria, Slovakia and Czech Republic: • Main contributing business lines: Retail and Corporates • Broadly stable loan volumes in RO, HU and HR
• 23.3% yoy decline in NPL stock mainly driven by NPL sales and positive migration trends across most geographies
+3.2%
30/06/16
127.4
68.4
20.9
10.2 7.7
3.7 6.1 0.8 6.2
3.3
31/03/16
126.7
67.8
20.7
10.0 7.9
3.8 6.3 0.8 6.1
3.3
30/06/15
123.5
66.0
19.6
9.3 7.9
4.1 6.6 0.6 6.0 3.3
AT CZ SK RO HU HR RS Other EU Other
+3.7%
30/06/16
124.7
67.4
20.6
10.0 7.5
3.5 5.8 0.8 5.9
3.3
31/03/16
123.8
9.8 7.5
3.5 6.0 0.8 5.8
3.3
66.8
30/06/15
120.3
65.0
19.3
9.2 7.6
3.7 5.9 0.6 5.7 3.3
20.3
-23.3%
30/06/16
7.7
2.4
0.9 0.7
1.2 0.6
0.9 0.1 0.5 0.4
31/03/16
8.9
2.6
1.0 0.7
1.8
0.7 1.1
0.2 0.6 0.4
30/06/15
10.1
2.8
1.0 0.5
2.0
0.9
1.6 0.2
0.6 0.5

Page
Assets and liabilities: allowances for customer loans – Decrease in allowances mainly due to continued NPL reduction in Q2 16
Quarterly development (EUR m)
28
Highlights • Substantially increased use of allowances
because of higher sales and write-offs • Higher releases partly due to NPL sales
above carrying amount • P&L unwinding impact = interest income
from impaired loans = EUR 26m in Q2 16 (Q1 16: EUR 35m, Q2 15: EUR 47m)
417
597400
538
39
572
571483
818
803
182
908305
30/06/16
5,086 26
9
31/03/16
5,891 35 15
31/12/15
6,010 37
12
30/09/15
6,721
23
30/06/15
6,886
Exchange-rate and other changes (+/-) Interest income from impaired loans
Releases Use Allocations
• Erste Group does not accrue interest on NPLs • When a loan turns NPL Erste Group estimates
the recoverable amount and the time frame of recovery
• The recoverable amount is discounted to present (at the effective interest rate of the underlying contract) and a provision reflecting the time value of money is created, ie a higher provision than without discounting
• The time value is released through NII until recovery realisation
Unwinding impact explained

Page
Assets and liabilities: financial and trading assets * – LCR at comfortable 115.4%
By geography in EUR bn
By debtor type
29
Liquidity buffer in EUR bn
• Liquidity buffer is defined as unencumbered collateral plus cash
• Total liabilities are defined as total on balance sheet liabilities excluding total equity
+0.1%
30/06/16
43.4
11.4
8.6
5.8
4.4 1.9 1.2
10.0
31/03/16
42.7
11.4
8.3
5.6
4.8 2.0 1.3
9.3
30/06/15
43.4
11.8
8.6
6.3
4.8 1.4 1.3
9.1
AT CZ SK
RO HU DE Other
100%
30/06/16
82.9%
7.8% 9.4%
31/03/16
82.4%
7.8% 9.8%
30/06/15
79.9%
9.0% 11.1%
Sovereign Banks Other
31/12/15
46.1
24.9%
31/12/14
45.4
24.8%
31/12/13
39.8
21.5%
47.7
25.3%
30/06/16
Liquidity buffer as % of total liabilities Liquidity buffer
* Excludes derivatives held for trading.

Page
Assets and liabilities: customer deposit funding – Customer deposits grow by 1.4% qoq, up 4.7% yoy
By customer type in EUR bn
By product type
30
in EUR bn
Highlights • Continued deposit inflows driven by Retail
segment with highest demand for overnight deposits amid low interest rate environment
• Limited volatility in corporate and public sector deposits
• Increasing share of overnight deposits with significantly longer behavioural maturity provides a cost effective funding source
30/06/16
130.4
77.7
52.0
0.6 0.1
31/03/16
128.6
75.0
53.2
0.4 0.1
30/06/15
124.5
68.9
54.9
0.6 0.2
Overnight deposits Term deposits Repurchase agreements FV deposits
+4.7%
30/06/16
130.4
94.2
22.0
8.1 6.0 0.1
31/03/16
128.6
92.2
22.0
8.2 6.1 0.1
30/06/15
124.5
89.7
21.0
7.3 6.2 0.2
Households Non-financial corporations Other financial corporations General governments FV deposits

Page
Assets and liabilities: debt vs interbank funding – Stable wholesale funding base
Debt securities issued in EUR bn
Interbank deposits in EUR bn
31
• Overall reduction in wholesale funding reliance led by decline in outstanding senior unsecured debt, which was only partly offset by increased subordinated debt
• Qoq decline in interbank deposits mainly due to balance sheet contraction
30/06/16
28.0
0.2 1.5
7.6
1.0 0.1
11.0
0.4 0.4
5.8
31/03/16
30.1
0.3 1.5
8.7
1.0 0.1
11.9
0.4 0.4
5.7
30/06/15
-6.4%
0.2 1.8
7.8
0.7
29.9
12.8
0.4 1.0 4.8
0.4 Other Public sector CBs Mortgage CBs Other CDs, name cert’s Certificates of deposit Senior unsec. bonds Hybrid issues Suppl. capital Sub debt
+4.2%
30/06/16
16.4
1.3
9.7
5.3
31/03/16
17.3
1.2
10.8
5.3
30/06/15
15.7
1.5
10.3
3.9 Repurchase agreements Term deposits Overnight deposits
Page
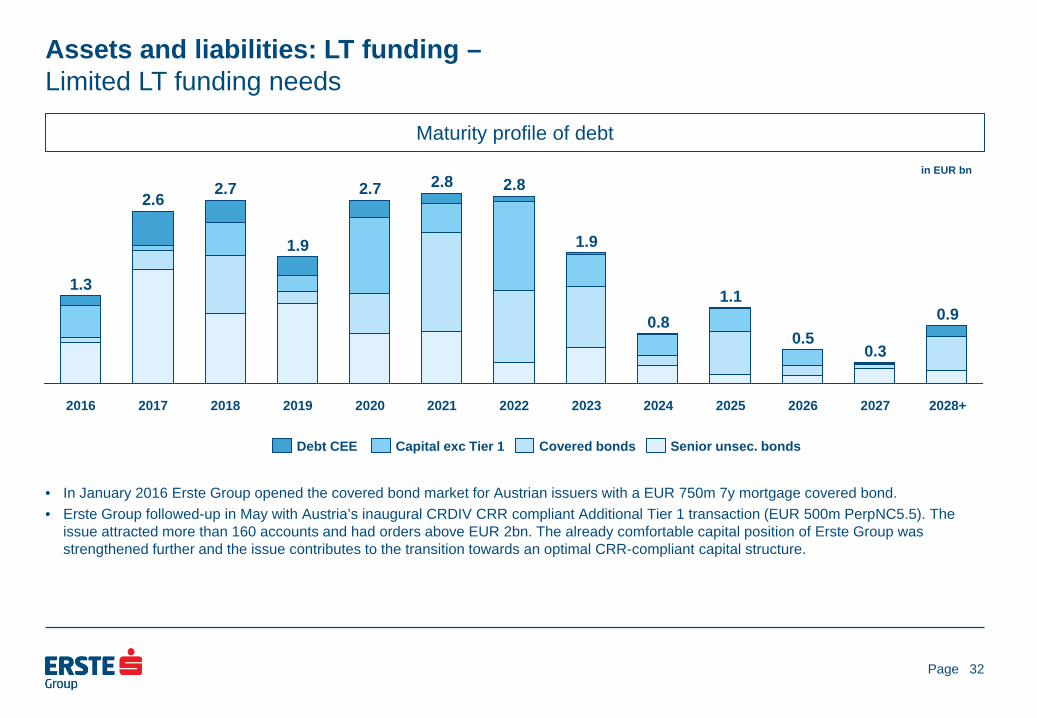
Assets and liabilities: LT funding – Limited LT funding needs
Maturity profile of debt
32
• In January 2016 Erste Group opened the covered bond market for Austrian issuers with a EUR 750m 7y mortgage covered bond. • Erste Group followed-up in May with Austria’s inaugural CRDIV CRR compliant Additional Tier 1 transaction (EUR 500m PerpNC5.5). The
issue attracted more than 160 accounts and had orders above EUR 2bn. The already comfortable capital position of Erste Group was strengthened further and the issue contributes to the transition towards an optimal CRR-compliant capital structure.
2028+
0.9
2027
0.3
2026
0.5
2025
1.1
2024
0.8
2023
1.9
2022
2.8
2021
2.8
2020
2.7
2019
1.9
2018
2.7
2017
2.6
2016
1.3
Senior unsec. bonds Covered bonds Debt CEE Capital exc Tier 1
in EUR bn

Page
Basel 3 capital (phased-in) in EUR bn
Risk-weighted assets (phased-in)
33
in EUR bn
Basel 3 capital ratios (phased-in)
• Strong rise in CET1 capital • Inclusion of ytd interim profit • VISA gain was already included at year-end
2015 • Strong rise in available distributable items
(ADIs) to EUR 1.7bn (pre dividend and AT1 coupon for 2016)
• Lower credit RWA offset increased operational risk RWA in Q2 16 • Credit RWA driven lower by across-the-
board improved portfolio quality • Inclusion of politically driven historical events
as operational risk (Romania, Hungary) led to up-drift in operational RWA in Q1 & Q2 16
• B3FL RWA increased to EUR 102.7bn
• B3FL CET1 ratio at 12.7% at 30 June 2016 (YE 2015: 12.0%)
• B3FL total capital ratio at 18.3% including AT1 issued in Q2 16 (YE15: 17.2%)
• SREP requirement for 2016: 9.5% + 0.25% systemic risk buffer; currently expected B3FL SREP ratio as of 1 Jan 2019: 9.5% +2.0% = 11.5%
31/03/16
17.7
12.2
0.0
5.5
31/12/15
17.6
12.1
0.0
5.4
30/09/15
16.9
11.6
0.0
5.3
30/06/15
16.8
11.6
0.0 5.2
30/06/16
18.9
13.4
0.1
5.4
CET1 AT1 Tier 2
31/03/16
100.5
84.9
12.7 2.8
31/12/15
98.3
84.7
10.8 2.8
30/09/15
100.4
85.8
11.5 3.0
30/06/15
100.3
85.7
10.9 3.6
30/06/16
101.0
83.4
14.2 3.4
Credit RWA Op risk Market risk
31/03/16
17.6
%
12.1
%
12.1
%
31/12/15
17.9
%
12.3
%
12.3
%
30/09/15
16.8
%
11.5
%
11.5
%
30/06/15
16.8
%
11.6
%
11.6
%
30/06/16
13.3
%
13.4
% 18
.7%
Total capital Tier 1 CET1
Assets and liabilities: capital position – B3FL CET1 ratio increases to 12.7%, ADIs triple to EUR 1.7bn

Page
Presentation topics
34
• Executive summary • Business environment • Business performance • Assets and liabilities • Outlook • Additional information
Page
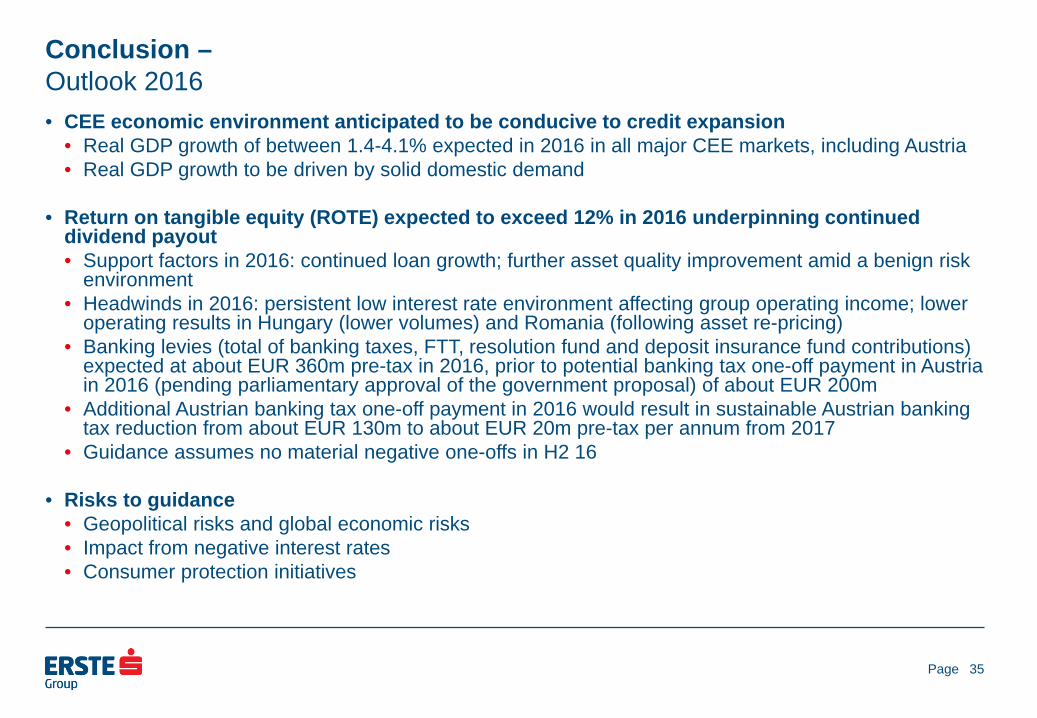
Conclusion – Outlook 2016 • CEE economic environment anticipated to be conducive to credit expansion
• Real GDP growth of between 1.4-4.1% expected in 2016 in all major CEE markets, including Austria • Real GDP growth to be driven by solid domestic demand
• Return on tangible equity (ROTE) expected to exceed 12% in 2016 underpinning continued
dividend payout • Support factors in 2016: continued loan growth; further asset quality improvement amid a benign risk
environment • Headwinds in 2016: persistent low interest rate environment affecting group operating income; lower
operating results in Hungary (lower volumes) and Romania (following asset re-pricing) • Banking levies (total of banking taxes, FTT, resolution fund and deposit insurance fund contributions)
expected at about EUR 360m pre-tax in 2016, prior to potential banking tax one-off payment in Austria in 2016 (pending parliamentary approval of the government proposal) of about EUR 200m
• Additional Austrian banking tax one-off payment in 2016 would result in sustainable Austrian banking tax reduction from about EUR 130m to about EUR 20m pre-tax per annum from 2017
• Guidance assumes no material negative one-offs in H2 16
• Risks to guidance • Geopolitical risks and global economic risks • Impact from negative interest rates • Consumer protection initiatives
35

Page
Presentation topics
36
• Executive summary • Business environment • Business performance • Assets and liabilities • Outlook • Additional information

Page
Additional information: new segmentation – Business line and geographic view
Retail
Erste Group – Business segments
Corporates Savings Banks
Group Markets
Group Corporate
Center
Intragroup Elimination
Erste Group – Geographical segmentation
Austria Central and Eastern Europe Other
EBOe & Subsidiaries (AT/EBOe)
Savings Banks (AT/SB)
Other Austria (AT/OA)
Czech Republic
(CZ)
Romania (RO)
Slovakia (SK)
Hungary (HU)
Croatia (HR)
Serbia (RS)
• Holding Business • Erste Group Immorent • Erste Asset Management
• Asset/Liability Management • Local Corporate Center
• SME • Local Large Corporate • Group Large Corporate • Commercial Real Estate • Public Sector
• Other Subsidiaries • Group bookings • Holding Corporate Center • Free Capital
• Holding ALM • Holding CC • Other Subsidiaries • Group bookings and
IC elimination • Free Capital
37
ALM & Local CC
(ALM&LCC)

Page
Additional information: income statement – Year-to-date and quarterly view
38
in EUR million 1-6 15 1-6 16 YOY-Δ Q2 15 Q1 16 Q2 16 YOY-Δ QOQ-ΔNet interest income 2,211.9 2,194.1 -0.8% 1,113.4 1,092.2 1,101.9 -1.0% 0.9%Net fee and commission income 917.4 884.9 -3.5% 456.3 443.1 441.8 -3.2% -0.3%Dividend income 32.1 31.5 -2.0% 24.8 2.6 28.8 16.5% >100.0%Net trading and fair value result 136.5 107.5 -21.2% 64.1 43.5 64.0 -0.2% 47.0%Net result from equity method investments 9.7 5.7 -41.1% 5.0 1.9 3.7 -25.2% 92.2%Rental income from investment properties & other operating leases 91.7 92.9 1.3% 46.6 45.9 47.1 1.0% 2.7%Personnel expenses -1,113.9 -1,152.7 3.5% -559.9 -565.4 -587.2 4.9% 3.9%Other administrative expenses -559.6 -610.1 9.0% -278.5 -333.5 -276.6 -0.7% -17.1%Depreciation and amortisation -223.3 -217.6 -2.6% -110.4 -109.8 -107.7 -2.4% -1.9%Gains/losses from financial assets and liabilities not measured at fair value through profit or loss, net 36.0 148.4 >100.0% 25.2 2.4 146.0 >100.0% >100.0%Net impairment loss on financial assets not measured at fair value through profit or loss -373.9 -25.8 -93.1% -190.8 -56.4 30.6 n/a n/aOther operating result -200.6 -192.2 -4.2% -47.1 -139.5 -52.6 11.8% -62.3%
Levies on banking activities -137.2 -107.6 -21.6% -45.4 -62.8 -44.9 -1.2% -28.5%Pre-tax result from continuing operations 964.1 1,266.7 31.4% 548.8 427.0 839.7 53.0% 96.6%Taxes on income -273.4 -278.8 2.0% -154.8 -104.5 -174.3 12.6% 66.9%Net result for the period 690.7 987.9 43.0% 394.0 322.6 665.3 68.9% >100.0%
Net result attributable to non-controlling interests 203.4 146.2 -28.1% 132.6 47.8 98.4 -25.8% >100.0%Net result attributable to owners of the parent 487.2 841.7 72.8% 261.4 274.7 567.0 >100.0% >100.0%
Operating income 3,399.4 3,316.6 -2.4% 1,710.3 1,629.3 1,687.3 -1.3% 3.6%Operating expenses -1,896.8 -1,980.3 4.4% -948.7 -1,008.8 -971.5 2.4% -3.7%Operating result 1,502.6 1,336.3 -11.1% 761.6 620.5 715.8 -6.0% 15.4%
Year-to-date view Quarterly view

Page
Additional information: group balance sheet – Assets
39
in EUR million Jun 15 Sep 15 Dec 15 Mar 16 Jun 16 YOY-Δ YTD-Δ QOQ-ΔCash and cash balances 7,011 11,097 12,350 14,641 12,982 85.2% 5.1% -11.3%Financial assets - held for trading 9,022 8,805 8,719 9,960 10,373 15.0% 19.0% 4.1%
Derivatives 5,613 5,633 5,303 5,668 5,610 -0.1% 5.8% -1.0%Other trading assets 3,409 3,172 3,416 4,292 4,763 39.7% 39.4% 11.0%
Financial assets - at fair value through profit or loss 269 332 359 404 433 60.9% 20.7% 7.3%Financial assets - available for sale 21,804 21,187 20,763 20,743 20,822 -4.5% 0.3% 0.4%Financial assets - held to maturity 17,949 17,585 17,701 17,573 17,823 -0.7% 0.7% 1.4%Loans and receivables to credit institutions 8,775 8,384 4,805 6,680 5,626 -35.9% 17.1% -15.8%Loans and receivables to customers 123,504 124,521 125,897 126,740 127,407 3.2% 1.2% 0.5%Derivatives - hedge accounting 2,181 2,284 2,191 2,347 2,253 3.3% 2.8% -4.0%Changes in fair value of portfolio hedged items 0 0 0 0 0 n/a n/a n/aProperty and equipment 2,330 2,368 2,402 2,370 2,334 0.2% -2.8% -1.5%Investment properties 805 751 753 744 753 -6.5% -0.1% 1.2%Intangible assets 1,395 1,393 1,465 1,447 1,437 3.0% -1.9% -0.7%Investments in associates and joint ventures 194 164 167 169 190 -1.8% 14.4% 12.8%Current tax assets 150 166 119 142 132 -12.2% 11.2% -7.1%Deferred tax assets 255 234 310 308 253 -0.8% -18.4% -17.7%Assets held for sale 429 487 526 456 294 -31.4% -44.1% -35.5%Other assets 1,457 1,411 1,217 1,646 1,391 -4.5% 14.3% -15.5%Total assets 197,532 201,171 199,743 206,369 204,505 3.5% 2.4% -0.9%
Quarterly data Change

Page
Additional information: group balance sheet – Liabilities and equity
40
in EUR million Jun 15 Sep 15 Dec 15 Mar 16 Jun 16 YOY-Δ YTD-Δ QOQ-ΔFinancial liabilities - held for trading 6,632 6,364 5,867 6,612 6,146 -7.3% 4.8% -7.0%
Derivatives 5,875 5,654 5,434 5,782 5,341 -9.1% -1.7% -7.6%Other trading liabilities 758 711 434 830 805 6.3% 85.8% -2.9%
Financial liabilities - at fair value through profit or loss 1,881 1,907 1,907 1,918 1,765 -6.1% -7.4% -8.0%Deposits from banks 0 0 0 0 0 n/a n/a n/aDeposits from customers 237 197 149 122 113 -52.2% -23.7% -7.0%Debt securities issued 1,644 1,710 1,758 1,796 1,652 0.5% -6.0% -8.0%Other financial liabilities 0 0 0 0 0 n/a n/a n/a
Financial liabilities measured at amortised cost 168,769 172,186 170,787 175,026 173,943 3.1% 1.8% -0.6%Deposits from banks 15,704 17,414 14,212 17,330 16,367 4.2% 15.2% -5.6%Deposits from customers 124,296 125,242 127,797 128,518 130,304 4.8% 2.0% 1.4%Debt securities issued 28,270 28,910 27,896 28,263 26,362 -6.8% -5.5% -6.7%Other financial liabilities 497 620 882 914 911 83.2% 3.4% -0.3%
Derivatives - hedge accounting 639 621 593 650 666 4.3% 12.4% 2.4%Changes in fair value of portfolio hedged items 962 1,013 966 1,089 1,148 19.4% 18.9% 5.4%Provisions 1,608 1,752 1,736 1,801 1,715 6.6% -1.3% -4.8%Current tax liabilities 121 120 90 101 98 -19.2% 9.1% -2.4%Deferred tax liabilities 85 92 96 119 133 56.1% 38.5% 11.1%Liabilities associated with assets held for sale 33 33 578 451 0 -100.0% -100.0% -100.0%Other liabilities 2,786 2,647 2,317 3,383 2,913 4.5% 25.8% -13.9%Total equity 14,015 14,437 14,807 15,218 15,977 14.0% 7.9% 5.0%
Equity attributable to non-controlling interests 3,701 3,746 3,802 3,889 3,948 6.7% 3.8% 1.5%Equity attributable to owners of the parent 10,314 10,691 11,005 11,329 12,029 16.6% 9.3% 6.2%
Total liabilities and equity 197,532 201,171 199,743 206,369 204,505 3.5% 2.4% -0.9%
Quarterly data Change

Page
Additional information: gross customer loans – By risk category, by currency, by industry
Gross cust. loans by risk category (EUR bn)
41
Gross customer loans by currency (EUR bn) Gross customer loans by industry (EUR bn)
Gross customer loans by risk category (in %)
Gross customer loans by currency (in %)
31/03/16
132.6
106.7
15.0 2.1 8.9
31/12/15
131.9
105.4
15.1 2.1 9.3
30/09/15
131.2
103.6
15.2 15.5 2.8 10.1
30/06/16
132.5
108.2
14.6 1.9 7.7
2.7
30/06/15
130.4
102.0
9.7
Low risk
Management attention
Substandard
Non-performing
100%
31/03/16
80.4%
11.3% 1.6% 6.7%
31/12/15
79.9%
11.4% 1.6% 7.1%
30/09/15
79.0%
11.6% 2.0% 11.0% 1.5%
5.8% 7.4%
78.2%
11.9% 2.1% 7.7%
30/06/16
81.7%
30/06/15
6.8 1.6 2.7
30/09/15
131.2
93.6
26.5 7.1
1.6 2.4
30/06/15
130.4
1.7 26.1 7.8
1.7 2.4
30/06/16
132.5
95.5
26.8 5.7
1.8 2.7
31/03/16
132.6
95.4
26.9 6.0
92.5
2.7
31/12/15
131.9
94.2
26.6
EUR CEE-LCY CHF Other USD
2.0%
30/09/15
71.3%
20.2% 5.4%
1.2% 1.8%
30/06/15
70.9%
1.3% 6.0%
1.3% 1.8%
30/06/16
72.1%
20.2% 4.3%
1.3% 2.0%
31/03/16
71.9%
20.3% 4.5% 2.0%
20.0%
31/12/15
71.4%
20.2% 5.1% 1.2%
6.2 5.3 5.8 3.6
3.5 8.7
31/12/15
131.9
53.2
21.1
9.6
7.9 6.3 6.8 5.2 5.7 3.7
3.6 8.8
30/09/15
131.2
53.7
20.8
9.5
8.0
6.6 6.2 5.5 5.1
3.7 3.6
8.7
30/06/15
130.4
53.2
20.6
9.5
8.0 6.5 6.1 5.8 5.0
3.7 3.4 8.5
30/06/16 31/03/16
54.8
21.2
9.4
7.8 6.2 6.0 5.0 6.1
132.5
3.7 8.6
132.6
54.3
21.3
9.6
7.9 6.4
3.7
Trade
Construction
Public admin
Financial inst.
Services
Tourism
Transport & comms
Other
Real estate
Households
Manufacturing

Page
• Leading retail and corporate bank in 7 geographically connected countries
• Favourable mix of mature & emerging markets with low penetration rates
• Potential for cross selling and organic growth in CEE
Additional information: footprint – Customer banking in Austria and the eastern part of the EU
Erste Group footprint Highlights
42
Direct presence
Indirect presence
Customers: 0.8m
Hungary
Employees: 2,912
Branches: 128
Customers: 2.9m
Romania
Employees: 7,125
Branches: 511
Customers: 0.4m
Serbia
Employees: 994
Branches: 77
Customers : 1.1m
Croatia
Employees : 2,928
Branches: 158
Customers: 4.7m
Czech Republic
Employees: 10,429
Branches: 606
Customers: 2.3m
Slovakia
Employees: 4,260
Branches: 291
Customers: 3.5m
Austria
Employees: 15,626
Branches: 933
AT
CZ
SK
HU
RO HR
RS

Page
Additional information: strategy – A real customer need is the reason for all business
Retail banking
Corporate banking
Capital markets
Public sector
Interbank business
Customer banking in Central and Eastern Europe
Eastern part of EU Focus on CEE, limited exposure to other Europe
Focus on local currency mortgage and consumer loans funded by local deposits FX loans only in EUR for clients with EUR income (or equivalent) and where funded by local FX deposits (HR & RS) Savings products, asset management and pension products
Focus on customer business, incl. customer-based trading activities In addition to core markets, presences in Poland, Turkey, Germany and London with institutional client focus and selected product mix Building debt and equity capital markets in CEE
Financing sovereigns and municipalities with focus on infrastructure development in core markets Any sovereign holdings are only held for market-making, liquidity or balance sheet management reasons
Large, local corporate and SME banking Advisory services, with focus on providing access to capital markets and corporate finance Real estate business that goes beyond financing
Focus on banks that operate in the core markets Any bank exposure is only held for liquidity or balance sheet management reasons or to support client business
43

Page
Additional information: shareholder structure – Total number of shares: 429,800,000
By investor By region
44
* Including voting rights of Erste Foundation, savings banks, savings banks foundations and Wiener Städtische Wechselseitige Versicherungsverein
Unidentified
15.0%
Harbor International Fund 4.6%
Institutional
45.1%
Retail 5.0%
Employees 0.9%
Caixa 9.9%
Erste Stiftung indirect * 9.6%
Erste Stiftung direct
9.9% Unidentified
15.0%
Other 2.6%
Continental Europe 24.0%
UK & Ireland
9.9% North America
20.1%
Austria 28.4%

Page
Investor relations details
• Erste Group Bank AG, Am Belvedere 1, 1100 Vienna E-mail: [email protected] Internet: http://www.erstegroup.com/investorrelations
http://twitter.com/ErsteGroupIR http://www.slideshare.net/Erste_Group Erste Group IR App for iPad, iPhone and Android http://www.erstegroup.com/de/Investoren/IR_App
Reuters: ERST.VI Bloomberg: EBS AV Datastream: O:ERS ISIN: AT0000652011
• Contacts Thomas Sommerauer Tel: +43 (0)5 0100 17326 e-mail: [email protected] Peter Makray Tel: +43 (0)5 0100 16878 e-mail: [email protected] Simone Pilz Tel: +43 (0)5 0100 13036 e-mail: [email protected] Gerald Krames Tel: +43 (0)5 0100 12751 e-mail: [email protected]
45