erp consolidation accounting serial exerciseclcloud.com/dynaa2013/papers/p006dy.pdf · erp...
TRANSCRIPT

Proceedings of DYNAA 2013 Vol. 4, No.1
10
ERP CONSOLIDATION ACCOUNTING SERIAL EXERCISE
Zane Swanson
University of Central Oklahoma [email protected]
Siegfried Chan
University of Central Oklahoma [email protected]
Abstract: This project looks at an Enterprise Resource Planning (ERP) system from a pedagogy academic accounting point of view. For the purposes of this paper, a Microsoft ERP system, Great Plains Dynamics (GP), is used in a serial consolidation exercise/homework problem. Access to ERP was done using Cloud computing. The ERP information is entered in journal form in GP and then aggregated with Management Reporter.
Keywords: Enterprise Resource Planning (ERP) system, Cloud computing, Great Plains Dynamics (GP)
1. INTRODUCTION Accounting information systems are a necessary component of learning consolidation accounting because of the full financial statement nature of the issues. Specific textbook problems typically utilize a spreadsheet approach, generally with EXCEL. While spreadsheets are useful for learning purposes, the “real world” uses Enterprise Resource Planning (ERP) systems to do the accounting cycle of an investor company and its subsidiary as contrasted with the Pacioli double-entry bookkeeping which used for university instruction purposes. An argument can be made that students should learn what is utilized in the work place in order to secure employment. Practically all Fortune 500 companies and many mid-level firms use a type of ERP (e.g. General Motors Mitchell 2006). Therefore, an educational need exists to show students how to process accounting cycle information in multiple entities and “roll up” the information into ERP consolidated reports which have applicable consolidation elimination entries. In summary, this consolidation serial exercise addresses a set of educational needs both in accounting and accounting information systems. The following section gives a review of serial multi-chapter accounting textbooks. Then section three covers the development of the serial exercise. Then section four addresses the ERP GP processing. Lastly, section five gives the summary and conclusions. 2. BACKGROUND REVIEW As of this writing, the consolidation texts with one known exception (Hoyle, et al 2011) have not incorporated multi-chapter problems in ERP systems as presented in the current paper’s project. There are other examples of consolidation serial exercise problems already available but this project focuses on how to work a problem using current software. Notwithstanding push-down accounting, there are three different consolidation approaches: cost, partial equity, and equity. All of these approaches do result in the same consolidated statements; however, the teaching challenges are pronounced. This serial exercise follows the equity method. 3. SERIAL EXERCISE AND REPORTS This section overviews the serial exercise. The initial purchase features of a combination are described in Appendix I. Every attempt is made to create a fairly straight-forward combination. One firm TopDrawer buys 100 percent ownership of another (BottomShelf) at the beginning of period XXX1. The firms remain separate legal entities. As discussed previously, each period includes more complex features of business activities which require appropriate reporting. The next event that occurs in period XXX2 is a purchase of 10 percent of the subsidiary BottomShelf by outside parties (i.e., non-controlling interests [NCI]). In period XXX3, TopDrawer sells equipment to BottomShelf and inventory is sold between the affiliates. Period XXX4 has an interaffiliate debt transaction. As the semester project moves forward, specific transactions are taken from Appendix I and shown how to put into GP. Everyday entries do

Proceedings of DYNAA 2013 Vol. 4, No.1
11
not vary much from each other; hitting upon characteristics critically different from EXCEL seemed better than working the entire problem. The spreadsheet version of this report and subsequent periods’ reports can be available upon request. 4. ERP GP PROCESS Appendix II has an ERP walkthrough for the acquisition. There is also a setup process for each company, but it is not shown because it is not the main theme of this serial exercise. Also, this project utilized a cloud computing company’s ERP site which provides some advantages. Students (and faculty) do not have to set up the company … only the accounts. Also, students do not have to come to school to work on their project or buy GP. There can be one school provided server with the software which students can log onto through the internet and then work from basically anywhere.
In keeping with the idea to provide students with a competitive edge upon graduating, this project used Microsoft’s Great Plains ERP software because of its focus on small and medium-sized companies. There are two components. One is the module which has the data which was entered in journal form. Students are familiar with journal entries which are utilized to keep it simple. The other component is a reporting program. Appendix III has examples of transaction journal entries and elimination entries for the acquisition. There are journal entries establishing the books for TopDrawer and BottomShelf. There is an elimination entry.
Account identification is necessary in ERP computer programs. This project used a nine digit scheme XXX-YYYY-ZZ where XXX is a company identifier (e.g., 000 is TopDrawer and 001 is BottomShelf) YYY is a four digit line item (e.g. 1100 for cash) account specification. ZZ is a category identifier of 00 for account, 09 for elimination entry and 08 for non-controlling interest. For teaching purposes, XXX is also used to specify student groups (e.g. 700 and 701 for group 7). There are reasons for using groups. One is that students can interact with each other, and college evaluations reward the use of group activity. A second reason is that every individual student company will require a separate set-up which is time consuming.
This project generally followed Hoyle, et al (2011) and that is the reason for the specific non-controlling interest column. Other texts (e.g., Baker 2011) utilize debit and credit fields for eliminations that include the non-controlling interest effects.
There are pedagogy issues because the software has a fairly complex ERP closing process in practice. In this ERP example, closing journal entries are employed at the beginning of a subsequent period similar to textbook approaches. Thus, the ERP example tries to keep it simple. The ERP software project utilized “months” periods representative of a year. For example, Year XXX1 is January, Year XXX2 is February and so forth. Appendix III only shows a walkthrough of the journal entries and report for the acquisition of BottomShelf by TopDrawer. The full four years’ GP reports are available from the authors by request. This information is sufficient to start the process, but not to publicly disclose all information to potential students.
5. SUMMARY AND CONCLUSIONS This project shows how to formulate a serial exercise for consolidation accounting utilizing ERP GP systems. The exercise works through consolidations from the initial purchase to progressively more difficult inter-affiliate situations such as sales of depreciable equipment between entities. The ERP GP processes include entity journal entries and Management Reporter reports of consolidations. A major strength of this serial exercise is that students are able to work their way up the learning curve of increasingly more difficult problems while being able to keep in perspective the big picture of the entities’ financials. From a teaching point of view this project demonstrates how “real world” ERP can be utilized in the classroom with consolidation accounting in a manner heretofore unutilized.
REFERENCE Baker, Christensen and Cottrel, Advanced Accounting: Ninth Edition. McGraw- Hill. 2011. Hoyle J., T. Schaefer, and T. Doupnik, Advanced Accounting, Tenth Edition. McGraw Hill. 2011. Mitchell, Robert L. November 13, 2006. “How GM is driving economies of scale in ICT.” COMPUTER- WORLD The voice of the ICT community. Retrieved from http://computerworld.co.nz/news.nsf/mgmt/71C5318115C76205CC25 72220013C083

Proceedings of DYNAA 2013 Vol. 4, No.1
12
APPENDIX I SERIAL EXERCISE FACT SITUATION Initial Statement: At the beginning of Year XXX1, TopDrawer acquired 100 percent of the outstanding common stock of BottomShelf Company. To acquire these shares, TopDrawer issued $400,000 in long-term liabilities and 20,000 shares of common stock having a par value of $1, but a fair value of $31.50 per share. TopDrawer paid $60,000 to accountants, lawyers, and brokers for assistance in the acquisition and another $24,000 in connection with stock issuance costs. In TopDrawer’s appraisal of BottomShelf, it deemed two accounts to be undervalued on the subsidiary’s books: Land by $40,000 and Buildings by $60,000. The Buildings have an expected 10 year life. Year XXX1 Transactions:
TopDrawer – (1) Inventory was sold on account for $500,000 which cost $232,000. (2) Cash of $200,000 was collected from accounts receivables. (3) Other operating expenses of $60,000 were recognized with $12,000 being paid in cash, $32,000 being recognized for depreciation for Buildings (net), and $16,000 being recognized for Equipment (net). (4) TopDrawer declared and paid dividends of $60,000 to its shareholders. (5) TopDrawer recognized its portion of BottomShelf’s net income equal to $24,000 for the equity method. (6B) TopDrawer recognized its portion of BottomShelf’s dividends equal to $36,000 for the equity method.
BottomShelf – (1) Inventory was sold on account for $140,000 which cost $90,000. (2) Cash of $56,000 was collected from accounts receivables. (3) Other operating expenses of $20,000 were recognized with $10,000 being paid in cash, $4,000 being recognized for depreciation for Buildings (net), and $6,000 being recognized for Equipment (net). (6A) BottomShelf declared and paid dividends of $36,000 to its shareholders.
Year XXX2 Transactions: TopDrawer – (1) Inventory was sold on account for $550,000 which cost $254,000. (2) Cash of $240,000 was collected from accounts receivables. (3) Other operating expenses of $66,000 were recognized with $18,000 being paid in cash, $32,000 being recognized for depreciation for Buildings (net), and $16,000 being recognized for Equipment (net). (4) TopDrawer sold 10% of its investment in BottomShelf for cash of $101,800 to a 3rd party, NCI. (5) TopDrawer declared and paid dividends of $60,000 to its shareholders. (6) TopDrawer recognized its portion of BottomShelf’s net income equal to $23,400 for the equity method. (7B) TopDrawer recognized its portion of BottomShelf’s dividends equal to $36,000 for the equity method. BottomShelf – (1) Inventory was sold on account for $154,000 which cost $98,000. (2) Cash of $62,000 was collected from accounts receivables. (3) Other operating expenses of $24,000 were recognized with $14,000 being paid in cash, $4,000 being recognized for depreciation for Buildings (net), and $6,000 being recognized for Equipment (net). (7A) BottomShelf declared and paid dividends of $40,000 to its shareholders. Year XXX3 Transactions: TopDrawer – (1) Inventory was sold on account for $600,000 which cost $280,000. (2) Cash of $264,000 was collected from accounts receivables. (3) Other operating expenses of $96,000 were recognized with $50,000 being paid in cash, $32,000 being recognized for depreciation for Buildings (net), and $14,000 being recognized for Equipment (net). (4) TopDrawer paid $400,000 cash for additional inventory. (5) TopDrawer declared and paid dividends of $100,000 to its shareholders. (7A) At the beginning of the year, TopDrawer made an intercompany downstream sale of some of its equipment to BottomShelf. The cash received from BottomShelf was $60,000 and the carrying value of the equipment was $38,000 which resulted in a gain of $22,000. (8) TopDrawer recognized its portion of BottomShelf’s net income equal to $41,000 for the equity method. (9B) TopDrawer recognized its portion of BottomShelf’s dividends equal to $36,000 for the equity method. (10A) TopDrawer deferred the full amount of the gain equal to $22,000 on the intercompany downstream sale for the equity method. (10B) TopDrawer amortized the downstream sale gain of $2,200 for the equity method. Straight-line depreciation was used based on a 10 years useful life. BottomShelf – (1) Inventory was sold on account for $210,000 which cost $108,000. (2) Cash of $190,000 was collected from accounts receivables. (3) Other operating expenses of $32,000 were recognized with $16,000 being paid in cash, $4,000 being recognized for depreciation for Buildings (net), and $12,000 being recognized for Equipment (net). (3B) BottomShelf recognized an extra $6,000 depreciation expense because of the purchase of equipment from its parent (see journal entry #7B). (4) BottomShelf paid $100,000 cash for additional inventory. (6) BottomShelf made an intercompany upstream sale of inventory to its parent company, TopDrawer. Sales on account were $40,000 which cost $24,000. At the end of the year, TopDrawer still had

Proceedings of DYNAA 2013 Vol. 4, No.1
13
intercompany profits of $10,000 from the upstream sale. (7B) BottomShelf bought some of TopDrawer’s equipment for $60,000 cash. (9A) BottomShelf declared and paid dividends of $40,000 to its shareholders. Year XXX4 Transactions: TopDrawer – (1) Inventory was sold on account for $620,000 which cost $290,000. (2) Cash of $282,000 was collected from accounts receivables. (3) Other operating expenses of $102,000 were recognized with $56,000 being paid in cash, $32,000 being recognized for depreciation for Buildings (net), and $14,000 being recognized for Equipment (net). (4) TopDrawer paid $300,000 cash for additional inventory. (5) TopDrawer declared and paid dividends of $100,000 to its shareholders. 10. (9, 10 and 11) Rates almost immediately rapidly fall after BottomShelf’s bond issue and BottomShelf decides to retire the debt and refinance. To do the deal, TopDrawer buys the bonds for 106,710 based on an 8 annual percent yield. (12B) TopDrawer recognized its portion of BottomShelf’s net income equal to $41,000 for the equity method. (12B) TopDrawer recognized its portion of BottomShelf’s dividends equal to $36,000 for the equity method. (13) TopDrawer recognized its portion of BottomShelf’s net income equal to $54,553 for the equity method. (14) TopDrawer continues to amortize the downstream sale gain of $2,200 for the equity method. BottomShelf – 1. Inventory was sold on account for $222,000 which cost $118,000. 2. Cash of $198,000 was collected from accounts receivables. 3. Other operating expenses of $38,000 were recognized with $22,000 being paid in cash, $4,000 being recognized for depreciation for Buildings (net), and $12,000 being recognized for Equipment (net). 4. BottomShelf paid $114,000 cash for additional inventory. (6, 7 and 8) In an exchange of debt on 1/1/XXX4, BottomShelf issued 100,000 in 10 year bonds with 9% cash interest. Because of market conditions BottomShelf sold the debt for 93,854 for a 10% effective yield. (12A) BottomShelf declared and paid dividends of $40,000 to its shareholders. APPENDIX II EXCEL SPREADSHEET WORK THROUGH This appendix contains a walkthrough of the serial problem which was set up above. The transactions for each year after the acquisition are given in the spreadsheet.

Proceedings of DYNAA 2013 Vol. 4, No.1
14
Beg Year XXX1 TopDrawer TopDrawer BottomShelf
Consolidation Entries Consolidated
Accounts Company Company* Company Debit Credit Totals Assets
Cash 120,000 36,000 40,000 76,000
Receivables 540,000 540,000 180,000 720,000
Inventory 720,000 720,000 280,000 1,000,000
Land 400,000 400,000 360,000 40,000 800,000
Buildings (net) 840,000 840,000 440,000 60,000 1,340,000
Equipment (net) 320,000 320,000 100,000 420,000
Investment in BottomShelf 0 1,030,000 0 920,000 0
110,000
Goodwill 10,000 10,000
Total Assets 2,940,000 3,886,000 1,400,000 4,366,000
Liabilities & Equity
Accounts payable 300,000 300,000 80,000 380,000
Long-term liabilities 860,000 1,260,000 400,000 1,660,000
Common stock 220,000 240,000 240,000 240,000 240,000
Additional paid-in capital 720,000 1,306,000 0 1,306,000
Retained earnings, 840,000 780,000 680,000 680,000 780,000
Total Liabilities & Equity 2,940,000 3,886,000 1,400,000 1,030,000 1,030,000 4,366,000

Proceedings of DYNAA 2013 Vol. 4, No.1
15
Year XXX1 Transactions TopDrawer BottomShelf
Debit Credit Debit Credit 1A. Accounts Receivables 500000 140000
Revenues 500000 140000
1B. COGS 232000 90000
Inventory 232000 90000
2. Cash 200000 56000
Accounts Receivables 200000 56000
3. Other operation expenses 60000 20000
Cash 12000 10000
Buildings (net) 32000 4000
Equipment (net) 16000 6000
4. Dividend 60000
Cash 60000
5. Investment in BottomShelf 24000
Equity Income BottomShelf 24000
6A. Dividend 18000
Cash 18000
6B. Cash 18000
Investment in BottomShelf 18000

Proceedings of DYNAA 2013 Vol. 4, No.1
16
Year XXX1 Financials TopDrawer BottomShelf Consolidation Entries Consolidated Accounts Company Company Debit Credit Totals Revenues 500,000 140,000 0 0 640,000
Cost of goods sold 232,000 90,000 0 0 322,000
Other operation expenses 60,000 20,000 6000 0 86,000
Equity income BottomShelf 24,000 24000 0 0
Net income 232,000 30,000 0 0 232,000
0 0 0
Retained earnings (beg) 780,000 680,000 680000 0 780,000
Net income (above) 232,000 30,000 0 0 232,000
Dividends distributed 60,000 18,000 0 18000 60,000
Retained earnings (end) 952,000 692,000 0 0 952,000
Assets
Cash 182,000 68,000 0 0 250,000
Accounts Receivables 840,000 264,000 0 0 1,104,000
Inventory 488,000 190,000 0 0 678,000
Land 400,000 360,000 40000 800,000
Buildings (net) 808,000 436,000 60000 6000 1,298,000
Equipment (net) 304,000 94,000 0 0 398,000
Investment in BottomShelf 1,036,000 0 18000 920000 0
110000
24000
Goodwill 10000 10,000
Total assets 4,058,000 1,394,000 0 0 4,538,000
Liabilities & Equity 0 0 0
Accounts Payable 300,000 80,000 0 0 380,000
Long-term Liabilities 1,260,000 400,000 0 0 1,660,000
Common stock 240,000 240,000 240000 0 240,000
Additional paid-in capital 1,306,000 0 0 0 1,306,000
Retained earnings (above) 952,000 692,000 0 0 952,000
Total liabilities & equity 4,058,000 1,412,000 1078000 1078000 4,538,000

Proceedings of DYNAA 2013 Vol. 4, No.1
17
Elimination Entries XXX1 Debit Credit BottomShelf Common 240000
BottomShelf Retained Earnings (Beg) 680000
Investment BottomShelf 92000
Land 40000
Buildings 60000
Goodwill 10000
Investment BottomShelf 110000
Equity Income BottomShelf 24000
Investment BottomShelf 24000
Investment BottomShelf 18000
Dividends 18000
Other operation expenses 6000
Buildings (net) 6000
Year XXX2 Transactions TopDrawer BottomShelf
Debit Credit Debit Credit 1A. Accounts Receivables 550000 154000
Revenues 550000 154000
1B. COGS 254000 98000
Inventory 254000 98000
2. Cash 240000 62000
Accounts Receivables 240000 62000
3. Other operation expenses 66000 24000
Cash 18000 14000
Buildings (net) 32000 4000
Equipment (net) 16000 6000
4. Cash 103600 Investment in BottomShelf 103600 10% sale to NCI
5. Dividend 60000
Cash 60000
6. Investment in BottomShelf 23400
Equity Income BottomShelf 23400
7A. Dividend 40000
Cash 40000
7B. Cash 36000

Proceedings of DYNAA 2013 Vol. 4, No.1
18
Investment in BottomShelf 36000

Proceedings of DYNAA 2013 Vol. 4, No.1
19
Year XXX2 Financials TopDrawer BottomShelf Consolidation Entries NCI Consolidated Accounts Company Company Debit Credit Totals Revenues 550,000 154,000 0 0 704,000
Cost of goods sold 254,000 98,000 0 0 352,000
Other operation expenses 66,000 24,000 6000 0 96,000
Equity income BottomShelf 23,400 23,400 0 0
Consolidated Net income 253,400 32,000 0 0 256,000
NCI income 0 0 2600 2,600
Net income to controlling interest 253,400
Retained earnings (beg) 952,000 692,000 692,000 0 952,000
Net income (above) 253,400 32,000 0 0 253,400
Dividends distributed 60,000 40,000 0 36,000 4000 60,000
Retained earnings (end) 1,145,400 684,000 0 0 1,145,400
Assets
Cash 483,600 76,000 0 0 559,600
Receivables 1,150,000 356,000 0 0 1,506,000
Inventory 234,000 92,000 0 0 326,000
Land 400,000 360,000 40000 800,000
Buildings 776,000 432,000 54000 6000 1,256,000
Equipment (net) 288,000 88,000 0 0 376,000
Investment in BottomShelf 919,800 0 36000 838800 0
93600
23400
Goodwill 10000 10,000
Total assets 4,251,400 1,404,000 0 0 4,833,600
Liabilities & Equity 0 0 0
Accounts Payable 300,000 80,000 0 0 380,000
Long-term Liabilities 1,260,000 400,000 0 0 1,660,000
Common stock 240,000 240,000 240000 0 240,000
Additional paid-in capital 1,306,000 0 0 0 1,306,000
NCI (Beg) 93200 93200
10400 10400
NCI (End) 102200 102,400
Retained earnings (above) 1,145,400 684,000 0 0 1,145,400
Total liabilities & equity 4,251,400 1,404,000 1101400 1101400 4,833,600
Proceedings of DYNAA 2013 Vol. 4, No.1
20
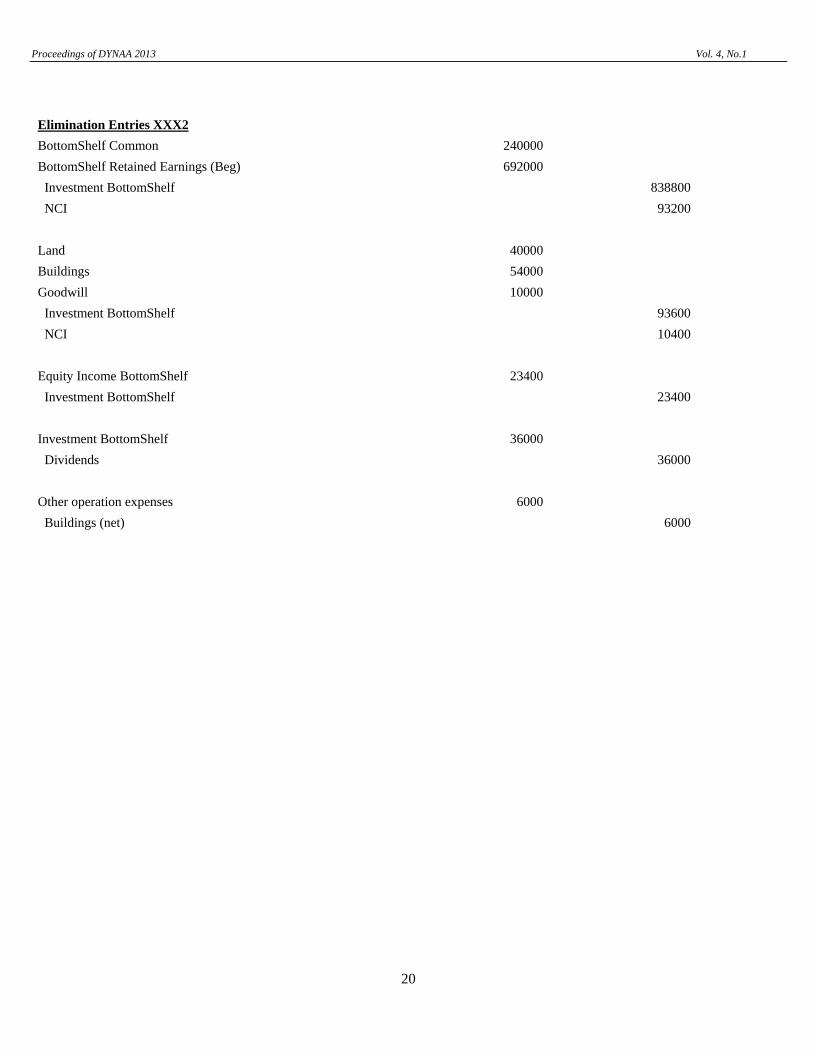
Elimination Entries XXX2
BottomShelf Common 240000
BottomShelf Retained Earnings (Beg) 692000
Investment BottomShelf 838800
NCI 93200
Land 40000
Buildings 54000
Goodwill 10000
Investment BottomShelf 93600
NCI 10400
Equity Income BottomShelf 23400
Investment BottomShelf 23400
Investment BottomShelf 36000
Dividends 36000
Other operation expenses 6000
Buildings (net) 6000

Proceedings of DYNAA 2013 Vol. 4, No.1
21
Year XXX3 Transactions TopDrawer BottomShelf
Debit Credit Debit Credit
1A. Accounts Receivables 600000 210000
Revenues 600000 210000
1B. COGS 280000 108000
Inventory 280000 108000
2. Cash 264000 190000
Accounts Receivables 264000 190000
3. Other operation expenses 96000 26000
Cash 50000 16000
Buildings (net) 32000 4000
Equipment (net) 14000 6000
3B. Other operation expenses 6000
Equipment (net) 6000
4. Inventory 400000 100000
Cash 400000 100000
5. Dividend 100000
Cash 100000
6. Cash 40000
Revenue 40000
6. COGS 24000
Inventory 24000
In XXX3, BottomShelf sold goods for 40,000 to TopDrawer which cost 24,000.
10,000 of gross profit remains at year end.
7A. Cash 60000
Equipment (net) 38000
Gain on Equip Sale 22000
7B. Equipment (net) 60000
Cash 60000
TopDrawer sold equipment (net) of 38,000 for 60,000 to BottomShelf at 1/1/XXX3.
Equipment had a 19 years life at 1/1/XXX3. BottomShelf sets the equipment life to be 10 years
8. Investment in BottomShelf 41000
Equity Income BottomShelf 41000
9A. Dividend 40000
Cash 40000
9B. Cash 36000
Investment in BottomShelf 36000
Defer unrealized gain
10A Equity Income BottomShelf 22000
Investment in BottomShelf 22000
Reverse year xxx3 deferred gain
10B Investment in BottomShelf 2200
Equity Income BottomShelf 2200
Proceedings of DYNAA 2013 Vol. 4, No.1
22
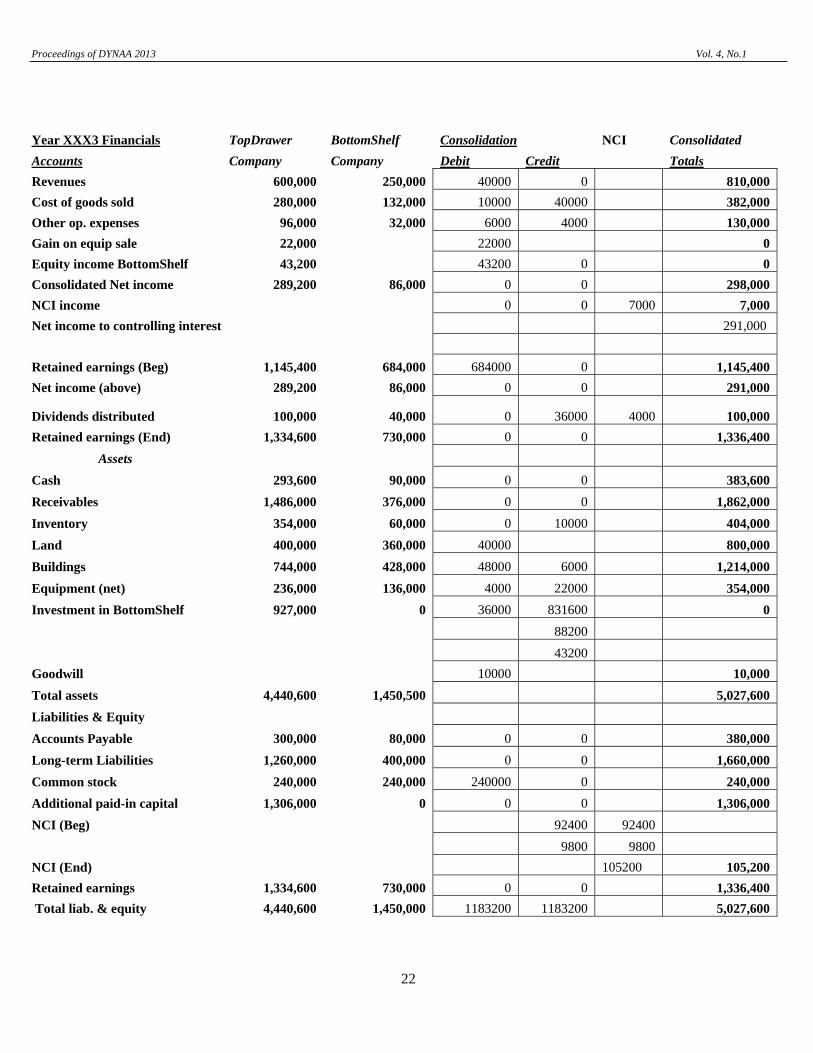
Year XXX3 Financials TopDrawer BottomShelf Consolidation NCI Consolidated Accounts Company Company Debit Credit Totals Revenues 600,000 250,000 40000 0 810,000
Cost of goods sold 280,000 132,000 10000 40000 382,000
Other op. expenses 96,000 32,000 6000 4000 130,000
Gain on equip sale 22,000 22000 0
Equity income BottomShelf 43,200 43200 0 0
Consolidated Net income 289,200 86,000 0 0 298,000
NCI income 0 0 7000 7,000
Net income to controlling interest 291,000
Retained earnings (Beg) 1,145,400 684,000 684000 0 1,145,400
Net income (above) 289,200 86,000 0 0 291,000
Dividends distributed 100,000 40,000 0 36000 4000 100,000
Retained earnings (End) 1,334,600 730,000 0 0 1,336,400
Assets
Cash 293,600 90,000 0 0 383,600
Receivables 1,486,000 376,000 0 0 1,862,000
Inventory 354,000 60,000 0 10000 404,000
Land 400,000 360,000 40000 800,000
Buildings 744,000 428,000 48000 6000 1,214,000
Equipment (net) 236,000 136,000 4000 22000 354,000
Investment in BottomShelf 927,000 0 36000 831600 0
88200
43200
Goodwill 10000 10,000
Total assets 4,440,600 1,450,500 5,027,600
Liabilities & Equity
Accounts Payable 300,000 80,000 0 0 380,000
Long-term Liabilities 1,260,000 400,000 0 0 1,660,000
Common stock 240,000 240,000 240000 0 240,000
Additional paid-in capital 1,306,000 0 0 0 1,306,000
NCI (Beg) 92400 92400
9800 9800
NCI (End) 105200 105,200
Retained earnings 1,334,600 730,000 0 0 1,336,400
Total liab. & equity 4,440,600 1,450,000 1183200 1183200 5,027,600
Proceedings of DYNAA 2013 Vol. 4, No.1
23
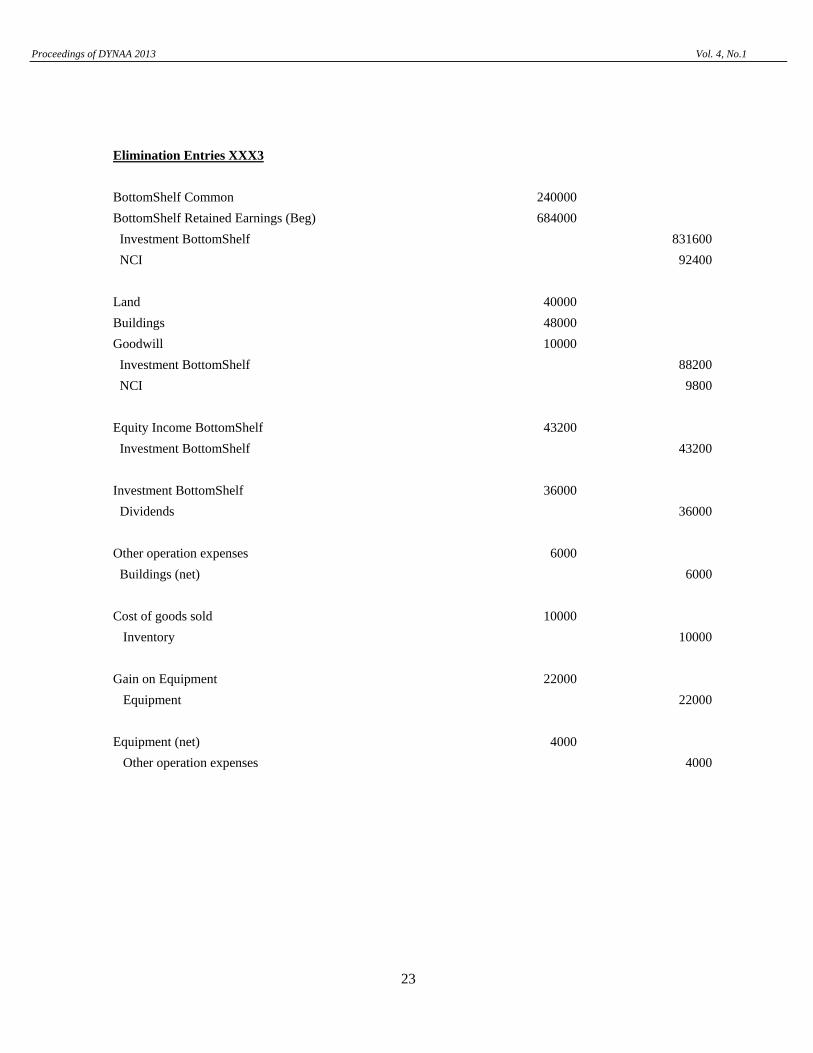
Elimination Entries XXX3
BottomShelf Common 240000
BottomShelf Retained Earnings (Beg) 684000
Investment BottomShelf 831600
NCI 92400
Land 40000
Buildings 48000
Goodwill 10000
Investment BottomShelf 88200
NCI 9800
Equity Income BottomShelf 43200
Investment BottomShelf 43200
Investment BottomShelf 36000
Dividends 36000
Other operation expenses 6000
Buildings (net) 6000
Cost of goods sold 10000
Inventory 10000
Gain on Equipment 22000
Equipment 22000
Equipment (net) 4000
Other operation expenses 4000

Proceedings of DYNAA 2013 Vol. 4, No.1
24
Year XXX4 Transactions TopDrawer BottomShelf
Debit Credit Debit Credit
1A. Accounts Receivables 620000 222000
Revenues 620000 222000
1B. COGS 290000 118000
Inventory 290000 118000
2. Cash 282000 198000
Accounts Receivables 282000 198000
3. Other operation expenses 102000 38000
Cash 56000 22000
Buildings (net) 32000 4000
Equipment (net) 14000 12000
4. Inventory 300000 114000
Cash 300000 114000
5. Dividend 100000
Cash 100000
In an exchange of debt on 1/1/XXX4, BottomShelf issued 100000 in 10 year bonds with 9% cash interest.
Because of market conditions BottomShelf sold the debt for 93854 for a 10% effective yield.
Rates almost immediately rapidly fall and BottomShelf decides to retire the debt and refinance.
To do the deal, TopDrawer buys the bonds for 106710 based on an 8 annual percent yield.
6. Cash 1/1/XXX4 93854
BottomShelf Bonds 93854
7. Other operation expenses/Interest expense at BottomShelf 12/31/XXX4 9000
Cash 9000
8. Other operation expenses/Interest expense at BottomShelf 12/31 386
BottomShelf Bonds 386
9. Invest in BottomShelf Bonds 7/1/XXX4 106710
Cash 106710
10. Cash 12/31/XXX4 9000
Interest income 9000
11. Interest income 12/31/XXX4 464
Investment in BottomShelf Bonds 464
12A. Dividend 40000
Cash 40000
12B. Cash 36000
Investment in BottomShelf 36000

Proceedings of DYNAA 2013 Vol. 4, No.1
25
BottomShelf Bonds 94240
Interest income 8536
Loss on retirement of bond 12856
Investment in BottomShelf bonds 106246
Interest Expense 9386
Consolidation Memo
Book beg Eff. Int Cash Amort Book end
Investment 106710 8536 9000 464 106246
Bond 93854 9386 9000 386 94240
TopDrawer sells Inventory from BottomShelf of Year XXX3 end to outsider purchaser.
At the end of Year XXX4, TopDrawer still owes BottomShelf 13,000 from interfiliate sales that occurred in Year XXX3.
13. Investment in BottomShelf 54553
Equity Income BottomShelf 54553
Reverse year xxx4 deferred gain
14. Investment in BottomShelf 2200
Equity Income BottomShelf 2200

Proceedings of DYNAA 2013 Vol. 4, No.1
26
Year XXX4 Financials
TopDrawer BottomShelf Consolidation Entries NCI Consolidated Accounts Company Company Debit Credit Totals Revenues 620,000 222,000 0 0 842,000 Cost of goods sold 290,000 118,000 0 10000 398,000 Other operation expense (revenue) 93,464 47,386 6000 4000 142,000 8536 9386 Equity income BottomShelf 56,753 56753 0 0 Bond extinguishment 12856 12,856 Consolidated Net income 293,289 56,614 0 0 289,144 NCI income 0 0 6061 6,061 Net income to controlling interest 283,083 Retained earnings (Beg) 1,334,600 730,000 720000 0 1,334,600 10000 Net income (above) 293,289 56,614 0 0 283,083 Dividends distributed 100,000 40,000 0 36000 4000 100,000 Retained earnings (End) 1,527,889 746,614 0 0 1,517,683
Assets Cash 57,890 196,854 0 0 254,744 Receivables 1,824,000 400,000 0 13000 2,211,000 Inventory 364,000 56,000 0 0 420,000 Land 400,000 360,000 40000 800,000 Buildings (net) 712,000 424,000 42000 6000 1,172,000 Equipment (net) 222,000 124,000 4000 19800 330,200 Bond investment BottomShelf 106,246 106246 Investment in BottomShelf 947,753 0 36000 864000 0 19800 82800 56753 Goodwill 10000 10,000 Total assets 4,633,889 1,560,854 0 0 5,197,944
Liabilities & Equity 0 0 0 Accounts Payable 300,000 80,000 13000 0 367,000 Long-term Liabilities 1,260,000 400,000 0 0 1,660,000 BottomShelf Bonds 94,240 94240 Common stock 240,000 240,000 240000 0 240,000 Additional paid-in capital 1,306,000 0 0 0 1,306,000 NCI (Beg) 96000 96000 9200 9200 NCI (End) 107261 107,261 Retained earnings (above) 1,527,889 746,614 0 0 1,517,683 Total liabilities & equity 4,633,889 1,560,854 1313185 1313185 5,197,944

Proceedings of DYNAA 2013 Vol. 4, No.1
27
Elimination Entries XXX4
BottomShelf Retained Earnings (Beg) 10000
COGS 10000
BottomShelf Common 240000
BottomShelf Retained Earnings (Beg) 720000
Investment BottomShelf 864000
NCI 96000
Land 40000
Buildings 42000
Goodwill 10000
Investment BottomShelf 82800
NCI 9200
Investment BottomShelf 19800
Equipment (net) 19800
Equity income BottomShelf 56753
Investment BottomShelf 56753
Investment BottomShelf 36000
Dividends 36000
Other operation expenses 6000
Buildings (net) 6000
Equipment (net) 4000
Other operation expenses 4000
Other operation expenses 8536
Bond extinguishment 12856
BottomShelf Bonds 94240
Other operation expenses 9386
Bond Investment BottomShelf 106246
Accounts Payable 13000
Accounts Receivable 13000

Proceedings of DYNAA 2013 Vol. 4, No.1
28
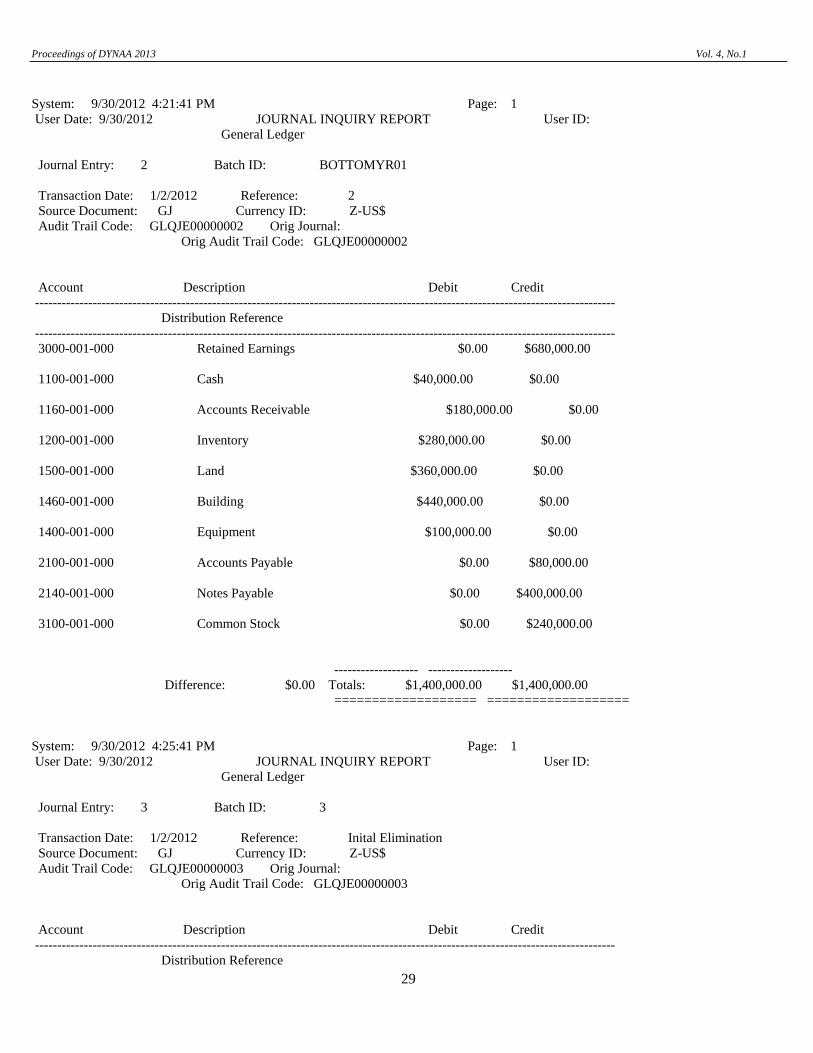
Appendix III ERP Management Reporter Reports System: 9/30/2012 4:10:46 PM Page: 1 User Date: 9/30/2012 JOURNAL INQUIRY REPORT User ID: General Ledger Journal Entry: 1 Batch ID: YR0TOP Transaction Date: 1/2/2012 Reference: YR0Top Source Document: GJ Currency ID: Z-US$ Audit Trail Code: GLQJE00000001 Orig Journal: Orig Audit Trail Code: GLQJE00000001 Account Description Debit Credit ----------------------------------------------------------------------------------------------------------------------------------- Distribution Reference ----------------------------------------------------------------------------------------------------------------------------------- 1100-000-000 Cash-Checking $36,000.00 $0.00 1160-000-000 Accounts Receivable $540,000.00 $0.00 1270-000-000 Investments $1,030,000.00 $0.00 1400-000-000 Equipment $320,000.00 $0.00 1460-000-000 Buildings $840,000.00 $0.00 1500-000-000 Land $400,000.00 $0.00 2100-000-000 Accounts Payable $0.00 $300,000.00 2140-000-000 Notes Payable $0.00 $1,260,000.00 3000-000-000 Retained Earnings $0.00 $780,000.00 3100-000-000 Common Stock $0.00 $240,000.00 3110-000-000 Additional Paid in Capital - Common $0.00 $1,306,000.00 1200-000-000 Inventory $720,000.00 $0.00 ------------------- ------------------- Difference: $0.00 Totals: $3,886,000.00 $3,886,000.00 =================== ===================
Proceedings of DYNAA 2013 Vol. 4, No.1
29
System: 9/30/2012 4:21:41 PM Page: 1 User Date: 9/30/2012 JOURNAL INQUIRY REPORT User ID: General Ledger Journal Entry: 2 Batch ID: BOTTOMYR01 Transaction Date: 1/2/2012 Reference: 2 Source Document: GJ Currency ID: Z-US$ Audit Trail Code: GLQJE00000002 Orig Journal: Orig Audit Trail Code: GLQJE00000002 Account Description Debit Credit ----------------------------------------------------------------------------------------------------------------------------------- Distribution Reference ----------------------------------------------------------------------------------------------------------------------------------- 3000-001-000 Retained Earnings $0.00 $680,000.00 1100-001-000 Cash $40,000.00 $0.00 1160-001-000 Accounts Receivable $180,000.00 $0.00 1200-001-000 Inventory $280,000.00 $0.00 1500-001-000 Land $360,000.00 $0.00 1460-001-000 Building $440,000.00 $0.00 1400-001-000 Equipment $100,000.00 $0.00 2100-001-000 Accounts Payable $0.00 $80,000.00 2140-001-000 Notes Payable $0.00 $400,000.00 3100-001-000 Common Stock $0.00 $240,000.00 ------------------- ------------------- Difference: $0.00 Totals: $1,400,000.00 $1,400,000.00 =================== =================== System: 9/30/2012 4:25:41 PM Page: 1 User Date: 9/30/2012 JOURNAL INQUIRY REPORT User ID: General Ledger Journal Entry: 3 Batch ID: 3 Transaction Date: 1/2/2012 Reference: Inital Elimination Source Document: GJ Currency ID: Z-US$ Audit Trail Code: GLQJE00000003 Orig Journal: Orig Audit Trail Code: GLQJE00000003 Account Description Debit Credit ----------------------------------------------------------------------------------------------------------------------------------- Distribution Reference

Proceedings of DYNAA 2013 Vol. 4, No.1
30
----------------------------------------------------------------------------------------------------------------------------------- 1500-000-009 Land $40,000.00 $0.00 1460-000-009 Buildings $60,000.00 $0.00 1730-000-009 Goodwill $10,000.00 $0.00 1270-000-009 Investments $0.00 $1,030,000.00 3100-000-009 Common Stock $240,000.00 $0.00 3000-000-009 Retained Earnings $680,000.00 $0.00 ------------------- ------------------- Difference: $0.00 Totals: $1,030,000.00 $1,030,000.00 =================== ===================

Proceedings of DYNAA 2013 Vol. 4, No.1
31
Management Reporter Row Definition
Management Reporter Column Definition
Proceedings of DYNAA 2013 Vol. 4, No.1
32
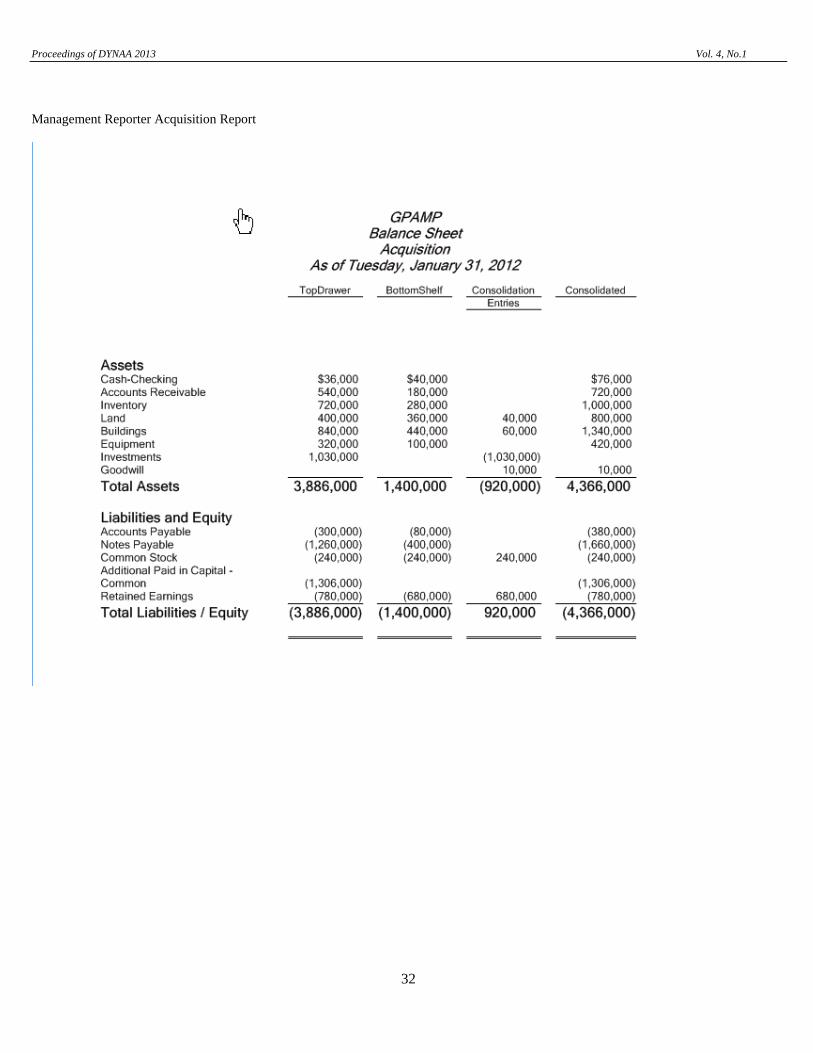
Management Reporter Acquisition Report

Proceedings of DYNAA 2013 Vol. 4, No.1
33
System: 10/21/2012 4:57:38 PM Page: 1 User Date: 10/21/2012 JOURNAL INQUIRY REPORT General Ledger Journal Entry: 7 Batch ID: TOPXXX1 Transaction Date: 1/31/2012 Reference: TOPXXX1 Source Document: GJ Currency ID: Z-US$ Audit Trail Code: GLQJE00000006 Orig Journal: Orig Audit Trail Code: GLQJE00000006 Account Description Debit Credit ----------------------------------------------------------------------------------------------------------------------------------- Distribution Reference ----------------------------------------------------------------------------------------------------------------------------------- 1100-000-000 Cash-Checking $146,000.00 $0.00 1160-000-000 Accounts Receivable $500,000.00 $0.00 1160-000-000 Accounts Receivable $0.00 $200,000.00 1270-000-000 Investments $0.00 $18,000.00 1270-000-000 Investments $24,000.00 $0.00 1400-000-000 Equipment $0.00 $16,000.00 1460-000-000 Buildings $0.00 $32,000.00 3120-000-000 Common Dividends Declared $60,000.00 $0.00 1200-000-000 Inventory $0.00 $232,000.00 4101-000-000 Revenues $0.00 $500,000.00 4500-000-000 COGS $232,000.00 $0.00 5101-000-000 Other Operation Expenses $60,000.00 $0.00 7041-000-000 Equity Income from sub $0.00 $24,000.00 ------------------- ------------------- Difference: $0.00 Totals: $1,022,000.00 $1,022,000.00 =================== =================== System: 10/21/2012 5:00:34 PM Page: 1 User Date: 10/21/2012 JOURNAL INQUIRY REPORT General Ledger Journal Entry: 8 Batch ID: BOTXXX1 Transaction Date: 1/31/2012 Reference: BOTXXX1 Source Document: GJ Currency ID: Z-US$ Audit Trail Code: GLQJE00000007 Orig Journal: Orig Audit Trail Code: GLQJE00000007

Proceedings of DYNAA 2013 Vol. 4, No.1
34
Account Description Debit Credit ----------------------------------------------------------------------------------------------------------------------------------- Distribution Reference ----------------------------------------------------------------------------------------------------------------------------------- 1100-001-000 Cash $38,000.00 $0.00 1160-001-000 Accounts Receivable $140,000.00 $0.00 1160-001-000 Accounts Receivable $0.00 $56,000.00 1200-001-000 Inventory $0.00 $90,000.00 1460-001-000 Building $0.00 $4,000.00 1400-001-000 Equipment $0.00 $6,000.00 4101-001-000 Revenues $0.00 $140,000.00 4500-001-000 COGS $90,000.00 $0.00 5101-001-000 Other Operation Expenses $20,000.00 $0.00 3120-001-000 Dividend $18,000.00 $0.00 ------------------- ------------------- Difference: $0.00 Totals: $296,000.00 $296,000.00 =================== ===================
Proceedings of DYNAA 2013 Vol. 4, No.1
35
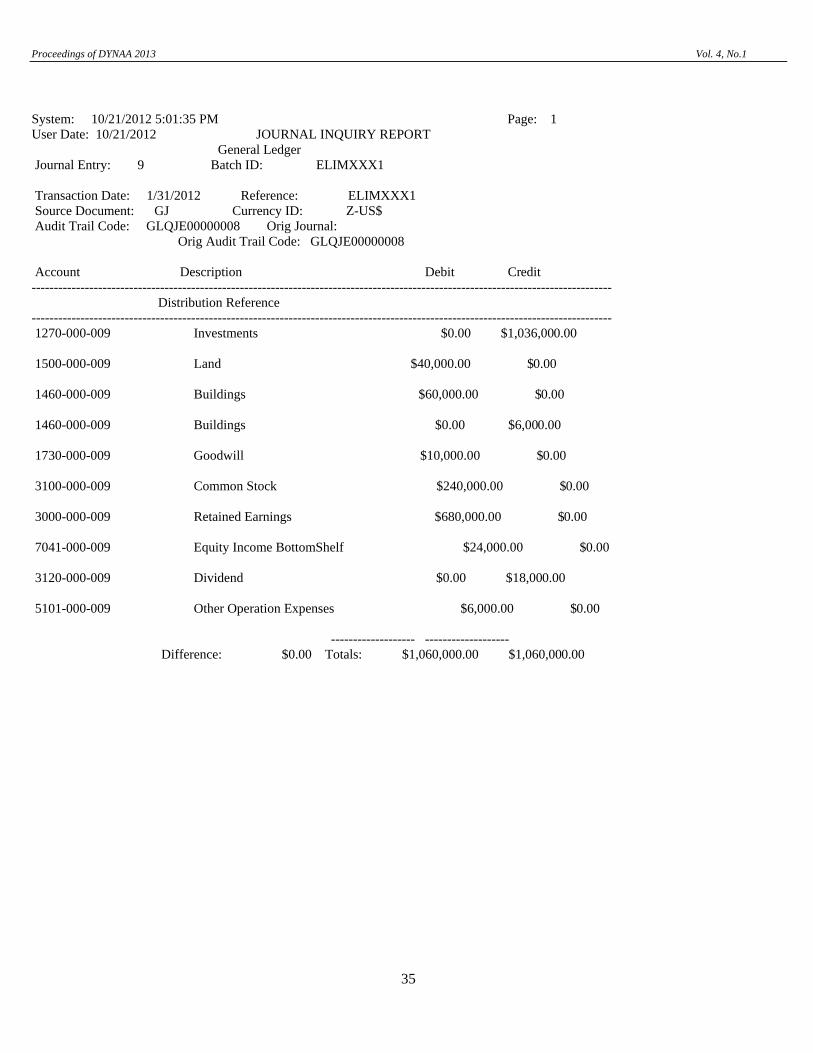
System: 10/21/2012 5:01:35 PM Page: 1 User Date: 10/21/2012 JOURNAL INQUIRY REPORT General Ledger Journal Entry: 9 Batch ID: ELIMXXX1 Transaction Date: 1/31/2012 Reference: ELIMXXX1 Source Document: GJ Currency ID: Z-US$ Audit Trail Code: GLQJE00000008 Orig Journal: Orig Audit Trail Code: GLQJE00000008 Account Description Debit Credit ----------------------------------------------------------------------------------------------------------------------------------- Distribution Reference ----------------------------------------------------------------------------------------------------------------------------------- 1270-000-009 Investments $0.00 $1,036,000.00 1500-000-009 Land $40,000.00 $0.00 1460-000-009 Buildings $60,000.00 $0.00 1460-000-009 Buildings $0.00 $6,000.00 1730-000-009 Goodwill $10,000.00 $0.00 3100-000-009 Common Stock $240,000.00 $0.00 3000-000-009 Retained Earnings $680,000.00 $0.00 7041-000-009 Equity Income BottomShelf $24,000.00 $0.00 3120-000-009 Dividend $0.00 $18,000.00 5101-000-009 Other Operation Expenses $6,000.00 $0.00 ------------------- ------------------- Difference: $0.00 Totals: $1,060,000.00 $1,060,000.00

Proceedings of DYNAA 2013 Vol. 4, No.1
36
Management Reporter YRXXX1
This project benefited from class usage at Emporia State University and University of Central Oklahoma.