eros international plc reports second quarter fy 2019 results
TRANSCRIPT

1
Eros International Plc Reports Second Quarter FY 2019 Results Reports strong Adjusted EBITDA(1) growth of 44.2%
Eros Now paying subscribers grew 28.7% to 13.0 million
Release of highly successful Eros Now originals – Smoke and Side Hero
Isle of Man – November 15th, 2018: Eros International Plc (NYSE: EROS) (“Eros” or “the Company”), a leading global Indian film and digital studio, today announced unaudited financial results for the three and six months ended September 30, 2018. Financial Highlights:
Q2 FY 2019 Highlights • Gross revenue(1) of $72.2 million, compared to $65.4 million in Q2 FY2018, which represents a year-over-year
increase of 10.4%. • Adjusted EBITDA(1) of $24.8 million, compared to $17.2 million in Q2 FY2018, a 44.2% increase year-over-year. • Adjusted EBITDA margin expanded to 39.1%, compared to 27.2% in Q2 FY2018. • Reported net debt of $162.1 million at September 30, 2018, compared to $189.2 million at March 31, 2018 and net
leverage ratio of 1.58x.
(1) A reconciliation of the non-GAAP financial measures discussed within this release to our IFRS revenue
and net income is included at the end of this release. See also “Non-GAAP Financial Measures”. Key Business Highlights: • Eros Now worldwide paying subscribers reached 13.0 million, an increase of 251.4% year-over-year and 28.7% since
last quarter. The Company is reiterating its previous guidance of 16 million paying subscribers by fiscal year end 2019. • As of September 30, 2018, Eros Now has exceeded 128 million registered users worldwide across APP, WAP and Web. • Eros Now premiered 16 films in Q2 FY2019 as well as 380 original short-form content pieces, including critically
acclaimed short films. • Eros Now premiered two original series, Side Hero and Smoke, to critical and commercial success. • Eros Now announced a ground-breaking partnership with iQiyi, the largest Chinese online video streaming service.
With this partnership, Eros Now becomes the first South Asian OTT player to penetrate the Chinese digital space. • Eros Now reinforced its mission of non-stop entertainment, anytime, anywhere, with one-of-a-kind brand campaign
‘Bolo Kya Dekhogey.’ The campaign, which rolled out three television commercials across 86 channels worldwide, reiterates Eros Now’s leadership position in the premium entertainment category, offering an extensive multi language movie library.

2
• Eros released 17 films in Q2 FY2019 (four medium budget and 13 low budget films) as compared to seven films in Q2 FY2018 (two medium budget and five low budget films). This is consistent with Eros’ strategy of developing its own intellectual property and concentrating on content-driven films rather than high budget star-driven films.
• Revenues for the quarter were driven by releases of: Side Hero (Hindi), Happy Phirr Bhag Jayegi (Hindi), Manmarziyan (Hindi), Patakha (Hindi), Saakshyam (Telugu), Tc.Gn - Take Care Good Night (Marathi), Batti Gul Meter Chalu (Hindi) Blackmail and Nawabzaade (Hindi).
Kishore Lulla, Eros’ Group Executive Chairman and Chief Executive Officer, stated: “We are pleased to announce another strong performance this quarter, highlighted by sequential revenue growth, improving margins and a solid capital structure. We also delivered strong growth at Eros Now, crossing 13 million paying subscribers, a sequential increase of 28.7%, and now have over 128 million registered users as of September 30, 2018. The media market in India is robust and growing, driven by rapid technological and socio-economic changes. We benefit from all areas of this growth, from ticket sales, digital downloads and advertising to pay television. While digital continues to be the main driver of our future growth, it’s important to remember that the television market in India is still growing at a strong pace – forecasted at c. 15% for the next few years, which provides strong tailwinds to our TV syndication business. Being part of the largest independent Indian film studio with the biggest content library, we are well positioned to establish and maintain our role as a leader in the Indian OTT space given our brand-name, know-how and long-term relationships. As the most established Indian film studio, we also have one the deepest and richest content libraries. Over the last 10 years, Eros has been responsible for 36 out of the top 110 highest grossing Indian films at the box office. We are fortunate to have complete control over the content we create and benefit from the fact that our in-house content gives us the ability to create strong franchises, support and nurture new talent and ultimately give consumers the best possible entertainment choices. Eros Now pioneered online video streaming in India and we believe there is significant opportunity ahead as consumers continue to discover and consume entertainment they enjoy and we want to be there to help them on their journey.”
Rishika Lulla, Chief Executive Officer, Eros Digital, commented: “Our latest results are a reflection of the Eros promise to deliver viewers a premium entertainment offering at the right price around the world. The recent launch of Eros Now originals, Smoke and Side Hero, is a testament to our strategy of delivering quality cinematic narratives to audiences on digital. We are humbled and excited by the audience appreciation and adoption of the originals, which have received several accolades and important “firsts.” Of note, Side Hero was the first Indian original series to generate 10 million views of a trailer and has the highest IMDB ratings of any original in India, while Smoke was the only original from India to be screened at Mipcom 2018 in Cannes earlier this year. We remain focused on the OTT consumer and have an exciting pipeline of cutting edge original content lined-up for the rest of the year. This is in line with the Eros strategy of developing its own intellectual property and concentrating on content-driven films rather than high budget star-driven films. According to our proprietary data, overall platform engagement continues to increase. Long form content continues to deliver the highest levels of engagement with the majority of Eros Now films being viewed in less than two sessions. An “engaged” viewer also returns at least three times a week, spending a minimum of 40 minutes on the platform. During the second quarter alone, we’ve seen a 25% increase in the number of sessions per subscriber. Our registered user base of over 128 million people gives us a unique opportunity to both monitor and learn from viewing habits as well as the ability to convert a portion of this base into monthly paying subscribers. Our large registered user base also represents a new revenue opportunity for us in the form of online advertising. We look forward to rolling out over 100 originals over the next 18 months in multiple languages, further bringing the Indian entertainment ecosystem together.” Prem Parameswaran, Group Chief Financial Officer and President of North America, also commented:

3
“I am pleased with our second quarter performance as the business delivered strong EBITDA growth and margin expansion, continued balance sheet strength and exceptional Eros Now paying subscriber additions, outperforming market expectations. Our strong operating performance this quarter, as well as the previously announced investment from Reliance Industries, has helped reduce our net debt position to $162.1 million. This represents a comfortable net debt leverage ratio of 1.58x. In addition, our trade accounts receivable balance has reduced by $26.9 million and now stands at $198.0 million. Our strong operating performance coupled with our conservative balance sheet has us poised for growth in the coming fiscal years. As our business evolves the majority of our future EBITDA will come from Eros Now. We therefore expect our adjusted EBITDA margins to continue to improve and target 35-40% margins for fiscal year 2020. Having reached over 13.0 million paying subscribers in Eros Now through the end of the second quarter, we are confident we can continue to grow our subscriber base over the next few years, especially given our premium content offering coupled with the large Indian and global market opportunities. To that end we have planned approximately $750 million in content investments over the next three years, which we expect to generate a meaningful ROI for our business. On the strategic front we continue to look to identify ways to simplify our corporate and operating structure, with a view towards providing a clear and accessible investment proposition for investors. To that end, our internal senior management team has formed an internal committee to explore all potential options. We look forward to giving an update on our progress over the coming quarters.” Eros Now Partnerships & Distribution: • This quarter Eros Now continued its focus on large screen distribution deals in India with many leading television,
ISP/Broadband and Android/Hybrid box partners. The Company also sharpened its focus on international distribution with several partnerships announced across Southeast Asia, South Asia and the Middle East. In total, Eros Now has 23 live distribution partners outside of India, 10 of which were signed in the quarter ended September 30, 2018. Expect to see more international distribution partnerships announced in the coming quarters, with a particular emphasis on UK, U.S., Middle East and Africa.
• Eros Now has expanded its footprint into the fast-growing Chinese market through a content partnership with Chinese online video-streaming service, iQiyi. iQiyi is one of the largest online video sites in the world, with nearly 6 billion hours spent on its service each month and over 500 million active monthly users. Eros Now has entered into a content licensing agreement with iQiyi to license its vast catalogue of Bollywood content with Eros Now branding that will be showcased on iQiyi. With this partnership, Eros Now becomes the first South Asian OTT player to make inroads into the Chinese digital space.
• Eros Now has extended its presence in the Malaysian market by partnering with leading Malaysian telecom player, Celcom Axiata Berhad, for their subscribed data plan “Video Walla.” Eros Now and Celcom’s partnership will further enhance the entertainment experience by providing Malaysian customers access to Eros Now’s vast library of original shows, music videos and more.
• Eros Now has entered the Indonesia market through a strategic distribution partnership with Xiaomi, a global technology leader. As previously announced in July of this year, Eros Now entered a strategic tie-up with Xiaomi’s Mi TV to offer an immersive content experience to consumers in India. With this new stage in the partnership, Eros Now will strengthen its presence and connectivity with Xiaomi’s users in key international markets like Indonesia.
• Eros Now partnered with FreeCharge, one of India's leading digital marketplaces for financial services and products. Through this association, Eros Now will facilitate a free month of access to its vast library of movies, original shows, music videos and more for FreeCharge customers recharging pre-paid packages via the FreeCharge app.
• Eros Now entered into a strategic partnership with E-Vision, a fully-owned subsidiary of Etisalat, for its SVOD offering “eLife Video Packs.” This partnership further strengthens Eros Now’s existing presence in MENA region (Middle East and North Africa).With an ardent fan-base of Indian content including films, music and TV series, MENA countries

4
have always been positively receptive towards Indian content. Bollywood content is also popular with the local Middle Eastern population in dubbed and subtitled formats – both of which are offered on Eros Now.
• Eros Now has entered into a partnership with leading fashion and lifestyle channel, FashionTV (“FTV”). With this association, Eros Now will be the first OTT player to venture into the fashion and lifestyle segment by providing consumers access to FTV’s 12+ live TV Channels and 145+ hours of VOD content.
• Eros Now has entered into a partnership with Grofers, a leading Indian online supermarket. As part of the association, Grofers’ Smart Bachat Club (SBC) Annual Plan will now have access to Eros Now’s rich library of over 11,000 film titles, original shows and music videos. The offer is available to both existing and new customers of Grofers SBC annual pack subscribers, which is currently priced at 449 Rupees per year.
• Eros Now reinforced its mission of non-stop entertainment, anytime, anywhere with one-of-a-kind brand campaign ‘Bolo Kya Dekhogey.’ The campaign, which rolled out three television commercials, reiterated Eros Now’s leadership position in the movie category, offering its extensive movie library across languages.
Content: This quarter Eros Now successfully premiered 16 movies across seven Indian languages: Hindi, Marathi, Tamil, Telegu, Bengali, Kannada and Gujarati. Eros continues to invest in a diverse range of content to fulfil penetration across 100 cities in India.
Eros Now Q2 FY19 Premieres Film Title Language Aav Taru Kari Nakhu Guajarati Madura Veeran Tamil Gavthi Marathi Oru Kidayin Karunai Manu Tamil Conditions Apply Marathi Band Baaja Babuchak Guajarati Aavuj Reshe Guajarati Karaar Marathi Asehi Ekada Vhave Marathi Baranda Bengali Tamburo Guajarati Commrade Bengali Dr. Tatya Lahane - Angaar..Power is within Marathi Alifa Bengali Kulfi Kannada Dharasnan Bengali
Eros Now successfully premiered two cutting-edge originals recently, Side Hero and Smoke.
• Side Hero is a fictionalized take on actor Kunaal Roy Kapur’s life in Bollywood as a perennially neglected side-actor. The eight episode series received much praise for its humorous take on Kunaal’s life, as his ambition to grab the leading role is constantly thwarted and he ends up being the sidekick. The leading digital portal Web Hash recently gave Side Hero the Best Web Series Award, and also gave Kunal Roy Kapoor the Best Actor award. The teaser trailer for Side Hero generated over 10 million views in less than one week, making it the most watched trailer of any Indian original.
• Smoke is a gritty crime drama in the spirit of Netflix’s Narcos. The crime drama is directed by Neel Guha and stars an eclectic ensemble cast of Kalki Koechlin, Mandira Bedi, Jim Sarbh, Amit Sial, Gulshan Devaiah, Satyadeep Mishra, Neal Bhoopalam, Prakash Belawadi, and others. The 11 episode series centers around a

5
double-murder in the idyllic setting of Goa and pits an aggressive police chief against an underworld crime boss. Smoke premiered at MIPCOM in Cannes, and is the first Indian OTT original to be featured at the industry event. Smoke has since gone on to garner a 9.4 IMDB rating in just a few weeks of its release
Given the recent launches of Smoke and Side Hero, as well as increased marketing efforts and distribution partnerships, Eros Now believes the next quarter will be a good point to measure the effectiveness of the launch of its originals. In the meantime, there are many interesting and exciting things to look forward to in Q3 FY2019 including:
- Launch of 12 Fashion TV Channels and Original English Programming onto the Network - Pakistani humor and television content will be introduced and promoted to audiences in India - Launch of the cross genre series with Operation Cobra in Dec 2018 - Screening of three Eros Now short films at the Berlin Film Festival, and the screening of the award winning
The Monsoon Date at MAMI 2018 Over the coming months, Eros Now will launch a stable of feature films, made-for-digital originals films and over 20 original episodic programs, all of which will be available exclusively on Eros Now to paying subscribers. Global concepts that will entertain audiences are being produced internally. A selection of upcoming Eros Now original titles include:
• Dashavatar with Anirudh Pathak: When mankind became corrupt and greedy, Vishnu, the protector of the realms, is incarnated to vanquish evil and save the world. Dashavatar tells this fascinating story of Vishnu’s reincarnations. (Target release December 2018/January 2019)
• Ponnyin Selvin with Krish Jagarlamudi: A multi-seasonal, multi-lingual show based on the famous Tamil novels. Written in five volumes, Ponniyin Selvan narrates the story of Arulmozhivarman – later crowned as Rajaraja Chola I - one of the kings of the Chola Dynasty, during the 10th and 11th centuries. (Target release March 2019)
• Flesh with Siddharth Anand: An eight-year-old girl goes missing and her NRI parents are forced to seek the help of a suspended female cop in their search for her. An ex-human trafficker is blackmailed to join the search or risk his sinful past catching with him. (Target release March 2019)
• Mrityulok with Zeishan Qadri: A story that shows a mirror to the ruthless, selfish face of the society and how we all are culprits in a system that offers no incentive to “be good.” (Target release March 2019)
• Bhumi with Pavan Kripilani: A survival thriller set in a dystopian version of Delhi which begs the question, how far is our reality from this supposedly fictional dystopia? (Target release April 2019)
• Crisis with Nikhil Advani and Gaurav Chawla: On the day of his 50th birthday, Dr Gopichand Wadhwani – one of India’s top cardiologists – decides to follow his childhood dream and become a rapper. Crisis is a story of two generations coming together to help each other get from life what they want. (Target release May 2019)
• Sanyasi Raja with Prakash Jha: A fictional depiction of the infamous Bhawal case of West Bengal, in which a possible imposter claimed to be the prince of Bhawal, who was at that point presumed dead for over a decade. (Target release June 2019)
• Kurukshetra: The tribals thought they were Gods. The army thought they were militants. What they turn out to be, are five children with ‘superpowers’ emerging from a genetic mutation. And with destinies that, almost uncannily, resemble the trajectory of the Mahabharata. (Target release TBD)
• Blue Oak Academy: A teen-drama thriller that follows one young boy’s quest to exact revenge with the most prestigious academic institution of the nation. (Target release June 2019)
Apart from this, Eros also has a selection of upcoming short form content and short film anthologies to accompany this slate.
Technology: As a brand, Eros Now remains committed to continuously improving the user experience through best-in-class technology and also adding several new and innovative features to the consumer viewing experience. This quarter Eros Now is undergoing an overhaul of the entire technology ecosystem and a new interface will be launched for large screen

6
consumer devices. The Eros Now development team is devoting large resources to data sciences and analytics with the goal of being able to deepen insights from structured analysis of 1st party, 2nd party and 3rd party data to develop business intelligence across key business functions of content, marketing and subscriber monetization. This quarter Eros Now rolled out a significant refresh of the handheld device user-experience to the next major upgrade, based on data science’s learnings on customer journey and behavior patterns. Eros Now also launched a refreshed Apple TV interface with new functionality as well as an overhaul of the experience across mobile handsets. Eros International Theatrical Release Slate Eros has a solid stable of upcoming theatrical releases covering many genres and regional languages. Selected key titles include:
Film Name Star Cast/(Director/Producer) Language Tentative Release
Ottakkoru Kamukan Jojo, Shine Tom Chacko and others (Dazzling Movie Land) Malayalam FY2019
Kaptan Saif Ali Khan, Zoya and others (Navdeep Singh / ColourYellow Productions) Hindi FY2019
Mumbai Pune Mumbai 3 Swapnil Joshi, Mukta Barve Marathi FY2019
Cobra Gautam Ghulati, Tarun Khanna, Nyra Banerjee, Ruhi Singh, Director - Munesh Rawal
Hindi FY2019
Kaamiyab Drishyam Films Hindi FY2019
Amar Akbar Anthony Ravi Teja, Illeana D'Cruz Telegu FY2019
Ticket to Bollywood Amyra Dastoor, Diganth Manchale / (Eros) Hindi FY2019
Haathi Mere Saathi Rana Dugabatti (Prabhu Soloman) Hindi / Tamil / Telugu FY2020
Guru Tegh Bahadur (Harry Baweja) Punjabi FY2020
Jaita Harman Baweja (Harry Baweja) Hindi FY2020
Untitled Ravi Vasudevan Malayalam FY2020
Untitled Vijith Nambiar Malayalam FY2020
Untitled (Homi Adajania / Maddock Films) Hindi FY2020
Ankhen 2 Amitabh Bachchan & Others Hindi FY2020
Nervazhi Nayanthara (Bharath Krishna) Tamil FY2020

7
Shubh Mangal Savdhan - 2 (Colour Yellow Productions) Hindi FY2020
Panda (Indo-China) (Kabir Khan) Hindi FY2020
Tannu Weds Manu 3 Anand L Rai Hindi FY2020
Roam Rom Mein Nawazuddin Siddiqui & others (Tanishtha Chatterjee / Rising Star Entertainment) Hindi FY2020
The Body Emraan Hashmi, Rishi Kapoor (Viacom18 Motion) Hindi FY2020
Time to Dance Sooraj Pancholi, Isabelle Kaif (Super Cassettes Industries) Hindi FY2020
Raw John Abraham (Viacom18 Motion) Hindi FY2020
Untitled Kartik Aaryan (Anees Bazmee) (Next Gen Films) Hindi FY2020
Untitled- (Hindi remake of Kirik Party)
Kartik Aaryan / Jacqueline Fernandez (Kyta Productions) Hindi FY2020
Chandamama Door Ke Sushant Singh Rajput, Nawazuddin Siddiqui (Sanjay Puran Singh) Hindi FY2020
Pitch White (Vipul Shah) Hindi FY2020
Untitled (Rahul Dholakia / Next Gen Films) Hindi FY2020
Heer (Colour Yellow Productions) Hindi FY2020
Fake (Raj & DK) Hindi FY2020
Re-Union (Sujoy Ghosh) Hindi FY2020
Hera Pheri -3 Suniel Shetty and others Hindi FY2020
Phobia 2 (Next Gen Films - Pawan Kriplani) Hindi FY2020
2 Guns (Krishna Jagarlamudi) Hindi FY2020
R. Rajkumar 2 (PrabhuDeva / Next Gen Films) Hindi FY2020
Khalifey Sanjay Dutt, SaifAli Khan, Arshad Warsi (Prakash Jha) Hindi FY2020
Make in India (Next Gen Films) Hindi FY2020

8
Jugaadu Harman Baweja Hindi FY2020
1234 (Part 2) SunielShetty, Paresh Rawal (Ashwni Dhir) Hindi FY2020
The above list is indicative and subject to change and does not include all projected releases Eros International’s Catalogue Includes Largest Box Office Hits Eros’ catalogue includes many of the most popular and commercially successful films released in India. Over the last 10 years, Eros has been responsible for 36 out of the top 110 highest grossing Indian films at the box office. These include:
Film Name Release Year IMDB Rank
Bajrangi Bhaijaan 2015 8.1
Bajirao Mastani 2015 7.2
Tanu Weds Manu Returns 2015 7.7
Ra.One 2011 4.8
Goliyon Ki Raasleela Ram - Leela 2013 6.4
Housefull 3 2016 5.2
Housefull 2 2012 5.4
Jai Ho 2014 5.3
Ready 2011 4.7
Welcome Back 2015 4.2
Zindagi Na Milegi Dobara 2011 8.1
Om Shanti Om 2007 6.7
Son of Sardaar 2012 3.9
Grand Masti 2013 4.3
Cocktail 2012 6.2
Love Aaj Kal 2009 6.8

9
Dishoom 2016 5.1
Housefull 2010 5.4
Rockstar 2011 7.6
Partner 2007 5.7
R... Rajkumar 2013 5.2
Ki & Ka 2016 5.8
Raanjhanaa 2013 7.6
Kambakkht Ishq 2009 4
Heyy Babyy 2007 6.1
Bhool Bhulaiyaa 2007 7.3
De Dana Dan 2009 5.2
Desi Boyz 2011 5.9
Badlapur 2015 7.5
English Vinglish 2012 7.9
Namastey London 2007 7.3
Vicky Donor 2012 7.8
Happy Bhaag Jayegi 2016 6.5
Cheeni Kum 2007 6.8
Newton 2017 7.8
Chalo Dilli 2011 6.8

10
Eros International Plc Financial Highlights :
Three Months Ended
September 30 Six Months Ended
September 30
(dollars in millions) 2018 2017 % change 2018 2017 % change
Revenue $ 63.4 $ 63.3 0.2 $ 123.6 $ 124.1 (0.4 ) Gross profit 25.3 28.2 (10.3 ) 49 54 (9.3 ) Operating profit 8.4 11.4 (26.3 ) 18.8 23.1 (18.6 ) Gross Revenue (1) 72.2 65.4 10.4 138.8 126.2 10.0 Adjusted EBITDA(1) $ 24.8 $ 17.2 44.2 $ 50.4 $ 33.1 52.3 Adjusted Gross EBITDA(1) $ 56.7 $ 45.9 23.5 $ 110.7 $ 93.8 18.01 (1) A reconciliation of the non-GAAP financial measures discussed within this release to our IFRS revenue and
net income is included at the end of this release. See also “Non-GAAP Financial Measures”. Financial Results for the Three and Six Months Ended September 30, 2018 Revenue In the three months ended September 30, 2018, the Eros film slate was comprised of 17 films of which four were medium budget and 13 were low budget as compared to seven films in the three months ended September 30, 2017, of which two were medium budget and five were low budget. In addition Eros Now released one original series titled Side Hero during the three months ended September 30, 2018. In the three months ended September 30, 2018, the Company’s slate of 17 films comprised of five Hindi film,11 regional films and one Tamil/Telugu as compared to the same period last year where its slate of seven films comprised four Hindi films and three regional films. In the six months ended September 30, 2018, the Eros film slate was comprised of 31 films of which five were medium budget and 26 were low budget films as compared to 12 films in the six months ended September 30, 2017, of which one film was high budget, three were medium budget and eight were low budget. In addition Eros Now released one original series titled Side Hero during the six months ended September 30, 2018 In the six months ended September 30, 2018, the Company’s slate of 31 films comprised of eight Hindi films, two Tamil/Telugu film and 21 regional films as compared to the same period last year where its slate of 12 films comprised of five Hindi films, one Tamil/Telugu films and six regional films.

11
Three months ended High Medium Low Total September 30, 2018 0 4 13 17 September 30, 2017 0 2 5 7 Six months ended High Medium Low Total September 30, 2018 0 5 26 31 September 30, 2017 1 3 8 12 Gross revenue for three months and six months ended September 30, 2018, respectively are $72.2 million and $138.8 million compared to $65.4 million and $126.2 million for the three and six months ended September 30, 2017, respectively. Gross revenue for the three months and six months ended September 30, 2018, respectively have been adjusted towards significant financing component on account of adoption of new accounting pronouncements (refer note 12 of the accompanying unaudited interim consolidated financial statements). Accordingly, our reported revenue for three months and six months ended September 30, 2018 are $63.4 million and $123.6 million, respectively compared to $63.3 million and $124.1 million for the three and six months ended September 30, 2017, respectively. Adjustment to reported revenues upon adoption of new accounting pronouncements for three months and six months ended September 30, 2018 is as below. Three months ended September 30, Six months ended September 30, 2018 2017 2018 2017 (in millions) Revenue (GAAP) $ 63.4 $ 63.3 $ 123.6 $ 124.1 Adjustment towards significant financing component 8.8 2.1 15.2 2.1 Gross Revenue (Non-GAAP) $ 72.2 $ 65.4 $ 138.8 $ 126.2 For the three months ended September 30, 2018, aggregate theatrical revenues decreased by 3.1% to $18.8 million from $19.4 million for the three months ended September 30, 2017 and in the six months ended September 30, 2018, revenue decreased by 21.6% to $33.7 million, compared to $43.0 million for the six months ended September 30, 2017. The decrease in theatrical revenue is primarily due to mix of films. For the three months ended September 30, 2018, aggregate revenues from television syndication decreased by 24.6% to $17.5 million from $23.2 million for the three months ended September 30, 2017 and in the six months ended September 30, 2018, revenue decreased by 11.3% to $36.1 million, compared to $40.7 million for the six months ended September 30, 2017. The decrease is mainly due to lower catalogue sales during the period. For the three months ended September 30, 2018, the aggregate revenues from digital and ancillary increased by 31.6% to $27.1 million from $20.6 million for the three months ended September 30, 2017 and in the six months ended September 30, 2018, revenue increased by 32.8% to $53.8 million, compared to $40.5 million for the six months ended September 30, 2017. The increase in revenue is primarily on account of contribution from catalogue revenues and digital business. Revenue from India increased by 0.4% to $25.5 million in the three months ended September 30, 2018, compared to $25.4 million in the three months ended September 30, 2017 and in the six months ended September 30, 2018, revenue from India decreased by 6.7% to $47.4 million, compared to $50.8 million for the six months ended September 30, 2017. The decrease in revenue for six months ended September 30, 2018, is primarily due to mix of films.

12
Revenue from Europe increased by 205.9% to $15.6 million in the three months ended September 30, 2018, compared to $5.1 million in the three months ended September 30, 2017 and in the six months ended September 30, 2018, revenue from Europe increased by 111.6% to $30.9 million, compared to $14.6 million for the six months ended September 30, 2017. This was due to higher contribution from the monetization of catalogue films. Revenue from North America was $0.4 million in the three months ended September 30, 2018, compared to $0.4 million in the three months ended September 30, 2017and in the six months ended September 30, 2018, revenue from North America increased by 16.7% to $0.7 million, compared to $0.6 million for the six months ended September 30, 2017. Revenue from the rest of the world decreased by 32.4% to $21.9 million in the three months ended September 30, 2018, compared to $32.4 million in the three months ended September 30, 2017and in the six months ended September 30, 2018, revenue from rest of world decreased by 23.4% to $44.6 million, compared to $58.2 million for the six months ended September 30, 2017. This was due to lower catalogue sales and partially offset by theatrical revenue from mix of films. Cost of sales For the three months ended September 30, 2018, cost of sales increased by 8.2% to $38.1 million compared to $35.2 million in the three months ended September 30, 2017 and in the six months ended September 30, 2018, cost of sales increased by 6.6% to $74.7 million, compared to $70.1 million for the six months ended September 30, 2017. The increase was mainly due to higher marketing, advertising and distribution costs. Gross profit For the three months ended September 30, 2018, gross profit decreased by 10.3% to $25.3 million, compared to $28.2 million in the three months ended September 30, 2017. The decrease was mainly due to increase in amortization, marketing, advertising and distribution costs which was partially offset by additional adjustment on account of adoption of new accounting standards for three months ended September 30, 2018. In the six months ended September 30, 2018, gross profit decreased by 9.3% to $49 million, compared to $54 million for the six months ended September 30, 2017. The decrease was mainly due to increase in marketing, advertising and distribution costs which was partially offset by additional adjustment on account of adoption of new accounting standards for six months ended September 30, 2018 Adjusted EBITDA (Non- GAAP) For the three months ended September 30, 2018, Adjusted EBITDA increased by 44.2% to $24.8 million compared to $17.2 million in the three months ended September 30, 2017. The increase in Adjusted EBITDA is on account of additional adjustment arising upon adoption of new accounting standards for three months ended September 30, 2018, which is partially offset by increase in share based payments adjustment. In the six months ended September 30, 2018, adjusted EBITDA increased by 52.3% to $50.4 million, compared to $33.1 million for the six months ended September 30, 2017. The increase in Adjusted EBITDA is on account of additional adjustment arising upon adoption of new accounting standards for six months ended September 30, 2018 which is partially offset by increase in share based payments adjustment. Net finance costs

13
For the three months ended September 30, 2018, net finance costs decreased by 105.8% to $(0.3) million, compared to $5.2 million in the three months ended September 30, 2017 mainly due to unwinding of credit impairment loss reserve by $4 million and reduction in borrowing costs. In the six months ended September 30, 2018, net finance costs decreased by 80.2% to $2.1 million, compared to $10.6 million for the six months ended September 30, 2017 mainly due to unwinding of credit impairment loss reserve by $6.1 million and reduction in borrowing costs. Income tax expense For the six months ended September 30, 2018, income tax expenses increased by 21.1% to $4.6 million, compared to $3.8 million in the six months ended September 30, 2017. Effective income tax rates were 11.6% and 20.0% for September 30, 2018 and September 30, 2017, respectively excluding non-deductible share-based payment charges and gain/loss on fair valuation of derivative liabilities. The change in effective rate principally reflects a change in the mix of the profits earned from taxable and non- taxable jurisdictions. Trade Receivables As of September 30, 2018, Trade Receivables decreased to $198.0 million from $225.0 million as of March 31, 2018 after considering expected credit loss reserve upon adoption of new accounting standards during the period. Net Debt As of September 30, 2018, net debt decreased by 14.3% to $162.1 million from $189.2 million as of March 31, 2018 primarily on account of additional equity infusion during the period. Conference Call: The Company will host a conference call on Thursday, November 15th, 2018, at 8:30 AM Eastern Standard Time. To access the call please dial 323-794-2094 or 800-263-0877 from the United States, or +44 (0)330 336 9125 or (0)800 358 6377 from outside the U.S. The conference call I.D. number is 6142911. Participants should dial in 5 to 10 minutes before the scheduled time. A replay of the call can be accessed through November 22, 2018 by dealing 719-457-0820 or 888-203-1112 from the U.S., or +44 (0) 207 660 0134 or 0 808 101 1153 from outside the U.S. The conference call I.D. number is 6142911. The call will be available as a live webcast, which can be accessed at Eros’ Investor Relations website. About Eros International Plc Eros International Plc (NYSE: EROS) is a leading global company in the Indian film entertainment industry that acquires, co-produces and distributes Indian films across all available formats such as cinema, television and digital new media. Eros International Plc became the first Indian media company to list on the New York Stock Exchange. Eros International has experience of over three decades in establishing a global platform for Indian cinema. The Company has an extensive and growing movie library comprising of over 3,000 films, which include Hindi, Tamil, and other regional language films. The Company also owns the rapidly growing OTT platform Eros Now which has rights to over 11,000 films across Hindi and regional languages. For further information, please visit: www.erosplc.com. Contact: Mark Carbeck Erica Bartsch

14
Chief Corporate and Strategy Officer Sloane & Company Eros International PLC 212-446-1875 [email protected] [email protected] +44 207 258 9909

15
EROS INTERNATIONAL PLC
UNAUDITED CONDENSED CONSOLIDATED STATEMENTS OF FINANCIAL POSITION (Amounts in thousands, except share and per share data)
Note September 30,
2018 March 31,
2018
ASSETS Non-current assets Property and equipment $ 9,229 $ 10,013 Goodwill 3,800 3,800 Intangible assets — trade name 14,000 14,000 Intangible assets — content 5 1,038,040 998,543 Intangible assets — others 4,448 5,280 Investments 27,337 27,257 Trade and other receivables 1 7,850 9,144 Income tax receivable 1,114 1,269 Restricted deposits 1,712 1,100 Deferred tax 64 351 Total non-current assets $ 1,107,594 $ 1,070,757 Current assets Inventories $ 346 $ 353 Trade and other receivables 1 213,681 245,079 Cash and cash equivalents 88,254 87,762 Investments 1,000 — Restricted deposits 53,341 6,368 Total current assets 356,622 339,562 Total assets $ 1,464,216 $ 1,410,319 LIABILITIES Current liabilities Trade and other payables $ 59,220 $ 72,142 Acceptances 3 7,039 8,898 Short-term borrowings 2 200,538 151,963 Current income tax payable 9,456 6,324 Total current liabilities $ 276,253 $ 239,327 Non-current liabilities Long-term borrowings 2 $ 96,489 $ 124,983 Other long-term liabilities 2,746 3,073 Deferred income tax liabilities 32,870 39,519 Total non-current liabilities $ 132,105 $ 167,575 Total liabilities $ 408,358 $ 406,902 EQUITY Share capital 4 $ 37,943 $ 35,334 Share premium 546,136 453,997 Reserves 415,672 422,992 Other components of equity (63,126 ) (48,649 ) JSOP reserve (15,985 ) (15,985 ) Share application pending allotment 4,980 18,000 Equity attributable to equity holders of Eros International Plc $ 925,620 $ 865,689 Non-controlling interest 130,238 137,728

16
Total equity $ 1,055,858 $ 1,003,417 Total liabilities and shareholder’s equity $ 1,464,216 $ 1,410,319

17
EROS INTERNATIONAL PLC UNAUDITED CONDENSED CONSOLIDATED STATEMENTS OF INCOME
(Amounts in thousands, except share and per share data)
Three Months Ended
September 30, Six Months Ended
September 30,
Note 2018 2017 2018 2017
Revenue 8 $ 63,425 $ 63,308 $ 123,637 $ 124,140 Cost of sales (38,114 ) (35,155 ) (74,685 ) (70,110 ) Gross profit 25,311 28,153 48,952 54,030 Administrative cost (16,894 ) (16,715 ) (30,113 ) (30,901 ) Operating profit 8,417 11,438 18,839 23,129 Financing costs (4,395 ) (5,715 ) (9,322 ) (11,533 ) Finance income 4,679 546 7,258 980 Net finance costs 284 (5,169 ) (2,064 ) (10,553 ) Other gains/(losses) 9 6,426 (3,222 ) (8,259 ) (4,745 ) Profit before tax 15,127 3,047 8,516 7,831 Income tax (1,711 ) (831 ) (4,590 ) (3,817 ) Profit for the period $ 13,416 $ 2,216 $ 3,926 $ 4,014 Attributable to: Equity holders of Eros International Plc $ 12,569 $ (1,404 ) $ (1,022 ) $ (2,731 ) Non-controlling interest 847 3,620 4,948 6,745
Earning/(loss) per share(cents) Basic earning/(loss) per share 7 17.7 (2.3 ) (1.5 ) (4.5 ) Diluted earning/(loss) per share 7 17.0 (2.5 ) (1.6 ) (4.8 )

18
EROS INTERNATIONAL PLC UNAUDITED CONDENSED CONSOLIDATED STATEMENTS OF COMPREHENSIVE INCOME
(Amounts in thousands, except share and per share data)
Three Months Ended September 30,
Six Months Ended September 30,
2018 2017 2018 2017
Profit for the period $ 13,416 $ 2,216 $ 3,926 $ 4,014 Other comprehensive loss: Items that will be subsequently reclassified to profit or loss Exchange differences on translating foreign operations (12,803 ) (1,393 ) (23,950 ) (1,791 ) Reclassification of the cash flow hedge to the statement of operations, net of tax — — — 187 Total other comprehensive income/(loss) for the period $ (12,803 ) $ (1,393 ) $ (23,950 ) $ (1,604 ) Total comprehensive income for the period, net of tax $ 613 $ 823 $ (20,024 ) $ 2,410
Attributable to: Equity holders of Eros International Plc $ 4,776 $ (2,318 ) $ (15,465 ) $ (3,607 ) Non-controlling interest (4,163 ) 3,141 (4,559 ) 6,017

19
EROS INTERNATIONAL PLC UNAUDITED CONDENSED CONSOLIDATED STATEMENTS OF CASH FLOWS
(Amounts in thousands, except share and per share data)
Six Months Ended
September 30,
Note 2018 2017
Cash flows from operating activities: Profit before tax $ 8,516 $ 7,831 Adjustments for: Depreciation 527 533 Share based payments 6 11,116 7,471 Amortization of intangible film and content rights 60,323 60,716 Amortization of other intangibles assets 759 725 Other non-cash items 10 22,460 9,673 Net finance costs 8,175 10,553 Loss on sale of property and equipment — 4 Movement in trade and other receivables (75,829 ) (49,776 ) Movement in inventories (25 ) 11 Movement in trade and other payables (11,818 ) (13,520 ) Cash generated from operations 24,204 34,221 Interest paid (4,248 ) (11,155 ) Income taxes paid (3,131 ) 429 Net cash generated from operating activities $ 16,825 $ 23,495 Cash flows from investing activities: Purchases of property and equipment (400 ) (125 ) Investment in restricted deposits held with banks (48,367 ) (8,185 ) Purchase of intangible film rights and content rights (54,060 ) (43,004 ) Investments (1,000 ) — Purchase of other intangible assets (171 ) (9 ) Interest received 1,815 2,006 Net cash (used in) investing activities $ (102,183 ) $ (49,317 ) Cash flows from financing activities: Proceeds from issue of shares by subsidiary 20 466 Proceeds from issue of share capital, net of transaction costs 54,782 78 Proceeds from sale of shares of a subsidiary — 40,221 Proceeds from short-term debt 65,920 23,200 Repayment of short-term debt (27,294 ) (17,513 ) Proceeds from long-term debt 176 10,708 Repayment of long-term debt (6,362 ) (5,503 ) (Repayment of)/ proceeds from/ short term debt with maturity less than three months (net) 1,224 (28,062 ) Net cash generated from financing activities $ 88,466 $ 23,595 Net decrease in cash and cash equivalents 3,108 (2,227 ) Effect of exchange rate changes on cash and cash equivalents (2,616 ) 3,276 Cash and cash equivalents at beginning of period 87,762 112,267 Cash and cash equivalents at end of period $ 88,254 $ 113,316 The cash outflow towards intangible film and content right includes, interest paid and capitalized $6,418 (September 30, 2017: $5,239).

20
Reconciliation of Liabilities arising from Financing activities:
Long term debt(*)
Short term debt Total
As at March 31, 2018 $ 188,909 $ 87,755 $ 276,664 Considered in cash flow (net) (6,186 ) 39,850 33,664 Finance cost in relation to convertible notes 5,689 — 5,689 Movement in derivative financial instruments 282 — 282 Borrowing for purchase of property and equipment 91 — 91 Shares issued in lieu of convertible note (19,391 ) — (19,391 ) Shares to be issued in lieu of convertible note (4,980 ) (4,980 ) Change in fair value of convertible notes measured at fair value through profit and loss 19,743 — 19,743 Amortization of debt issuance cost 253 — 253 Exchange adjustment (8,138 ) (6,850 ) (14,988 ) As at September 30, 2018 $ 176,272 $ 120,755 $ 297,027 (*) including current portion and derivative financial instruments

21
EROS INTERNATIONAL PLC UNAUDITED CONDENSED CONSOLIDATED STATEMENTS OF CHANGES IN EQUITY
(Amounts in thousands, except share and per share data)
Other components of equity Reserves
Share capital
Share premium account
Currency translation
reserve
Available for sale
fair value
reserves Revaluation
reserve Hedging reserve
Reverse acquisition
reserve Merger reserve
Retained earnings
JSOP reserve
Share Application
Reserve
Equity Attributable to Shareholders
of EROS International
PLC
Non- controlling
interest Total equity
(in thousands) Balance as at March 31, 2018 $ 35,334 $ 453,997 $ (56,722 ) $ 6,238 $ 1,835 $ — $ (22,752 ) $ 70,484 $ 375,260 $ (15,985 ) $ 18,000 $ 865,689 $ 137,728 $ 1,003,417 Adoption of IFRS 9/15 (Refer Note 12) — — (34 ) — — — — — (14,270 ) — — (14,304 ) (3,520 ) (17,824 )
Balance as at April 1, 2018 $ 35,334 $ 453,997 $ (56,756 ) $ 6,238 $ 1,835 $ — $ (22,752 ) $ 70,484 $ 360,990 $ (15,985 ) $ 18,000 $ 851,385 $ 134,208 $ 985,593 (Loss)/Profit for the period — — — — — — — — (1,022 ) — — (1,022 ) 4,948 3,926 Other comprehensive income/(loss) for the period — — (14,443 ) — — — — — — — — (14,443 ) (9,507 ) (23,950 )
Total comprehensive income/(loss) for the period — — (14,443 ) — — — — — (1,022 ) — — (15,465 ) (4,559 ) (20,024 ) Shares to be issued in lieu of convertible notes — — — — — — — — — — 4,980 4,980 — 4,980
Issue of shares 1,948 70,718 — — — — — — — — (18,000 ) 54,666 — 54,666 Shares issued on exercise of employee stock options and awards 82 2,609 — — — — — — (2,575 ) — — 116 — 116 Share based Compensation — — — — — — — — 10,806 — — 10,806 310 11,116 Changes in ownership interests in subsidiaries that do not result in a loss of control — — — — — — — (259 ) — — — (259 ) 279 20 Shares issued in lieu of convertible notes 579 18,812 — — — — — — — — — 19,391 — 19,391 Balance as at September30, 2018 $ 37,943 546,136 (71,199 ) 6,238 1,835 — (22,752 ) 70,225 368,199 (15,985 ) 4,980 925,620 130,238 1,055,858

22
EROS INTERNATIONAL PLC UNAUDITED CONDENSED CONSOLIDATED STATEMENTS OF CHANGES IN EQUITY
(Amounts in thousands, except share and per share data)
Other components of equity Reserves
Share capital
Share premium account
Currency translation
reserve
Available for sale
fair value reserves
Revaluation reserve
Hedging reserve
Reverse acquisition
reserve Merger reserve
Retained earnings
JSOP reserve
Equity Attributable to Shareholders
of EROS International
PLC
Non- controlling
interest Total equity
(in thousands) Balance as at April 1, 2017 $ 31,877 $ 399,686 $ (55,810 ) $ 6,238 $ 1,829 $ (375 ) $ (22,752 ) $ 70,275 $ 389,474 $ (15,985 ) $ 804,457 $ 79,091 $ 883,548 (Loss)/)Profit for the period — — — — — — — — (2,731 ) — (2,731 ) 6,745 4,014 Other comprehensive income/(loss) for the period — — (1,072 ) — 9 187 — — — — (876 ) (728 ) (1,604 )
Total comprehensive income/(loss) for the period — — (1,072 ) — 9 187 — — (2,731 ) — (3,607 ) 6,017 2,410 Share based compensation — — — — — — — — 7,208 — 7,208 263 7,471 Shares issued on exercise of employee stock options and awards 119 3,920 — — — — — (3,961 ) — 78 — 78 Changes in ownership interests in subsidiaries that do not result in a loss of control — — — — — — — 1,055 — — 1,055 39,632 40,687 Balance as at September30, 2017 $ 31,996 403,606 (56,882 ) 6,238 1,838 (188 ) (22,752 ) 71,330 389,990 (15,985 ) 809,191 125,003 934,194
23
EROS INTERNATIONAL PLC NOTES TO UNAUDITED CONDENSED CONSOLIDATED INTERIM FINANCIAL STATEMENTS
(Amounts in thousands, except share and per share data)
1. TRADE AND OTHER RECEIVABLES As at
September 30,
2018 March 31,
2018
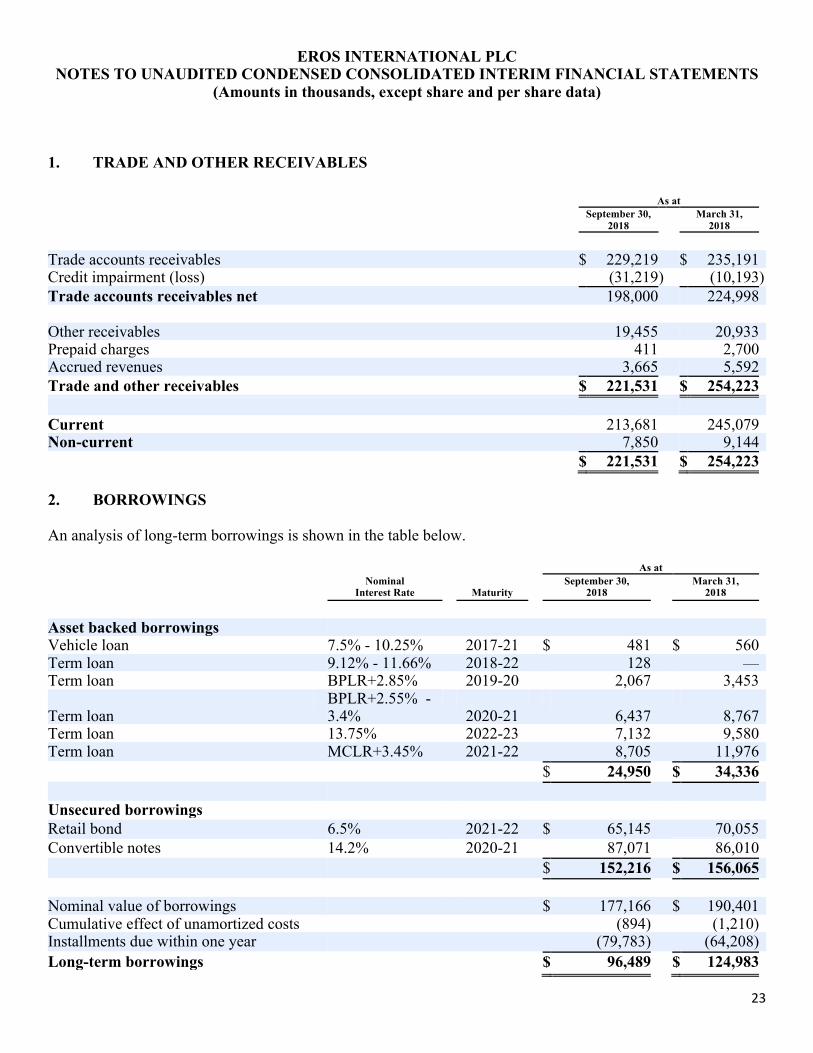
Trade accounts receivables $ 229,219 $ 235,191 Credit impairment (loss) (31,219 ) (10,193 ) Trade accounts receivables net 198,000 224,998 Other receivables 19,455 20,933 Prepaid charges 411 2,700 Accrued revenues 3,665 5,592 Trade and other receivables $ 221,531 $ 254,223 Current 213,681 245,079 Non-current 7,850 9,144 $ 221,531 $ 254,223
2. BORROWINGS An analysis of long-term borrowings is shown in the table below. As at
Nominal Interest Rate Maturity
September 30, 2018
March 31, 2018
Asset backed borrowings Vehicle loan 7.5% - 10.25% 2017-21 $ 481 $ 560 Term loan 9.12% - 11.66% 2018-22 128 — Term loan BPLR+2.85% 2019-20 2,067 3,453
Term loan BPLR+2.55% - 3.4% 2020-21 6,437 8,767
Term loan 13.75% 2022-23 7,132 9,580 Term loan MCLR+3.45% 2021-22 8,705 11,976 $ 24,950 $ 34,336
Unsecured borrowings Retail bond 6.5% 2021-22 $ 65,145 70,055 Convertible notes 14.2% 2020-21 87,071 86,010 $ 152,216 $ 156,065 Nominal value of borrowings $ 177,166 $ 190,401 Cumulative effect of unamortized costs (894) (1,210) Installments due within one year (79,783) (64,208) Long-term borrowings $ 96,489 $ 124,983

24
Bank prime lending rate (“BPLR”) and Marginal Cost based lending rate (“MCLR”) is the Indian equivalent to LIBOR. Asset backed borrowings are secured by fixed and floating charges over certain Group assets. Analysis of short-term borrowings As at Nominal
interest rate (%) September 30, 2018 March 31,
2018 Asset backed borrowings
Export credit bill discounting and overdraft BPLR+1-3.5% $ 52,308 $ 43,518
Export credit and overdraft LIBOR+4.5% 20,249 21,226 Foreign currency loan 0.59% 36,822 — Short term loan 13-14.25% 11,376 11,537 Other short term loan 10.20% — 11,474 $ 120,755 $ 87,755 Unsecured borrowings Installments due within one year on long-term borrowings 79,783 64,208 Short-term borrowings $ 200,538 $ 151,963
3. ACCEPTANCES
September 30, 2018
March 31, 2018
(in thousands) Payable under the film financing arrangements $ 7,039 $ 8,898 $ 7,039 $ 8,898 Acceptances comprise of credit availed from financial institutions for payment to film producers for film co-production arrangement entered by the group. The carrying value of acceptances are considered a reasonable approximation of fair value.
4. ISSUED SHARE CAPITAL Number of
Shares GBP Authorized Ordinary shares of 30p each at March 31, 2018 100,000,000 30,000 Ordinary shares of 30p each at September 30, 2018(*) 100,000,000 30,000 (*) The Company increased authorized number of shares to 150,000,000 on October 25, 2018. Number of Shares USD
Allotted, called up and fully paid A Ordinary 30p Shares(*)
B Ordinary 30p Shares(*) (in thousands)
As at March 31, 2017 41,312,202 19,379,382 $ 31,877

25
Issue of shares in the quarter ended June 30, 2017 12,000 — 5 Issue of shares in the quarter ended September 30, 2017 288,291 — 114 Issue of shares in the quarter ended December 31, 2017 1,681,520 — 657 Transfer of B Ordinary to A Ordinary share 9,666,667 (9,666,667 ) — Issue of shares in the quarter ended Mar 31, 2018 2,757,743 — 2,681 As at March 31, 2018 55,718,423 9,712,715 $ 35,334 Issue of shares in the quarter ended June 30, 2018 2,747,645 — $ 1,138 Issue of shares in the quarter ended September 30, 2018 3,773,385 — $ 1,471 As at September 30, 2018 62,239,453 9,712,715 37,943 The Company issued A Ordinary shares as follows: Number of Shares
September 30, March 31,
2018 2017 2018
Issuance to Founders Group (**) 1,769,911 — 1,421,520 Issuance towards settlement of Convertible notes 1,436,369 — 2,624,668 Exercise against Restricted Share Unit/ Management scheme(*****) 194,079 300,291 683,158 Issuance towards Reliance Industries Limited (***) 3,111,088 — — 2015 Share Plan (****) 9,583 — 10,208 Total 6,521,030 300,291 4,739,554
(*) Each A ordinary shares is entitled to one vote on all matters and each B shares is entitled to ten votes. (**) Average exercise price of $14.69 (September 2017 Nil and March 2018 $11.6) (***) Average exercise price of $15 (September 2017 Nil and March 2018 $Nil) (****) Average exercise price of $7.93 (September 2017 Nil and March 2018 $8.71) (*****) Certain shares exercised price at $ 0.39 (September 2017 Nil and March 2018 Nil) The Company issued 402,249 ‘A’ ordinary shares on October 3, 2018 towards settlement of Convertible notes. 5. INTANGIBLE ASSETS – CONTENT
Gross Content Assets
Accumulated Amortization
Content Assets
As at September 30, 2018 Film and content rights $ 1,532,417 $ (861,841 ) $ 670,576 Content advances 357,164 — 357,164 Film productions 10,300 — 10,300 Non-current content assets $ 1,899,881 $ (861,841 ) $ 1,038,040 As at March 31, 2018 Film and content rights $ 1,493,099 $ (854,991 ) $ 638,108 Content advances 349,568 — 349,568 Film productions 10,867 — 10,867 Non-current content assets $ 1,853,534 $ (854,991 ) $ 998,543 6. SHARE BASED COMPENSATION PLANS
26
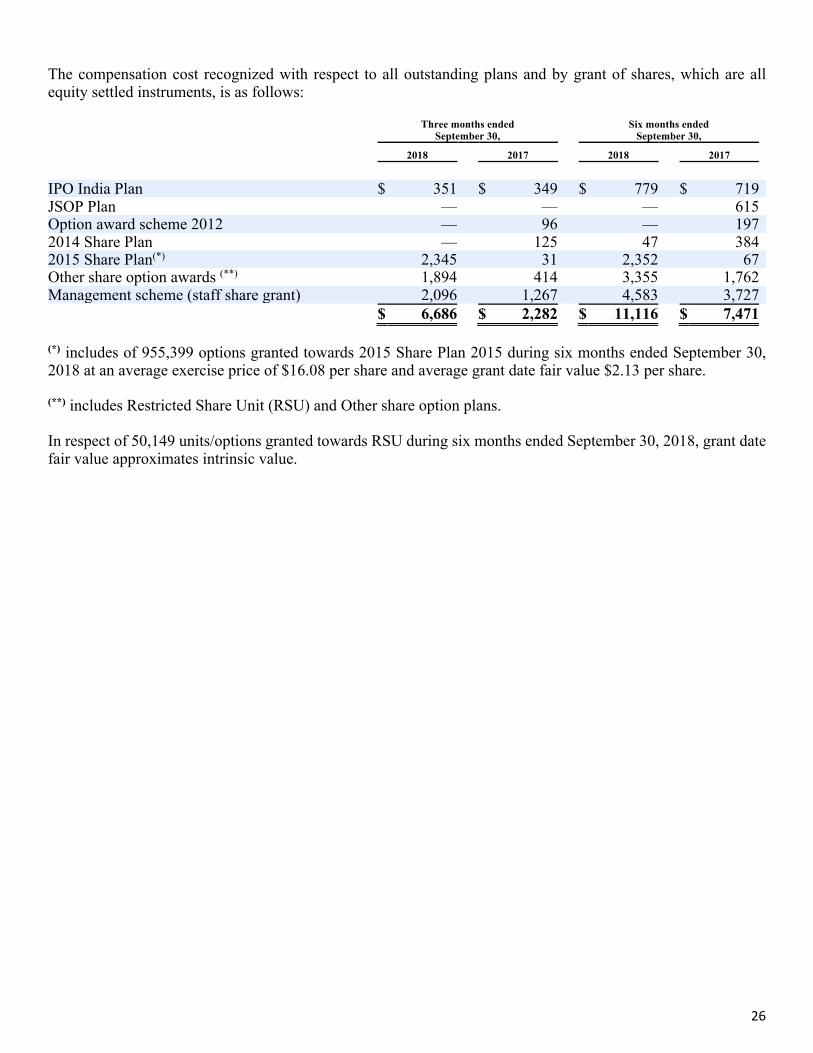
The compensation cost recognized with respect to all outstanding plans and by grant of shares, which are all equity settled instruments, is as follows:
Three months ended September 30,
Six months ended September 30,
2018 2017 2018 2017
IPO India Plan $ 351 $ 349 $ 779 $ 719 JSOP Plan — — — 615 Option award scheme 2012 — 96 — 197 2014 Share Plan — 125 47 384 2015 Share Plan(*) 2,345 31 2,352 67 Other share option awards (**) 1,894 414 3,355 1,762 Management scheme (staff share grant) 2,096 1,267 4,583 3,727
$ 6,686 $ 2,282 $ 11,116 $ 7,471 (*) includes of 955,399 options granted towards 2015 Share Plan 2015 during six months ended September 30, 2018 at an average exercise price of $16.08 per share and average grant date fair value $2.13 per share.
(**) includes Restricted Share Unit (RSU) and Other share option plans. In respect of 50,149 units/options granted towards RSU during six months ended September 30, 2018, grant date fair value approximates intrinsic value.

27
7. EARNINGS/(LOSS) PER SHARE
Three months ended September 30, Six months ended September 30, 2018 2017 2018 2017 Basic Diluted Basic Diluted Basic Diluted Basic Diluted
Earnings/(loss) attributable to the equity holders of the parent $ 12,569 12,569 $ (1,404 ) (1,404 ) $ (1,022 ) (1,022 ) $ (2,731 ) (2,731 ) Potential dilutive effect of senior convertible bonds — 1,109 — — — — — — Potential dilutive effect related to share based compensation scheme in subsidiary undertaking — (36 ) — (120 ) — (142 ) — (237 ) Adjusted earnings/(loss) attributable to equity holders of the parent $ 12,569 13,642 $ (1,404 ) (1,524 ) $ (1,022 ) (1,164 ) $ (2,731 ) (2,968 ) Number of shares Weighted average number of shares 71,000,987 71,000,987 60,698,517 60,698,517 69,174,427 69,174,427 60,839,680 60,839,680 Potential dilutive effect related to share based compensation scheme — 9,457,270 — 1,178,111 — 2,034,547 — 1,140,748 Adjusted weighted average number of shares 71,000,987 80,458,257 60,698,517 61,876,628 69,174,427 71,208,974 60,839,680 61,980,428 Earnings per share Earning attributable to the equity holders of the parent per share (cents) 17.7 17.0 (2.3 ) (2.5 ) (1.5 ) (1.6 ) (4.5 ) (4.8 )
The above table does not split the earnings per share separately for the ‘A’ ordinary 30p shares and the ‘B’ ordinary 30p shares as there is no variation in their entitlement to participate in undistributed earnings.
28
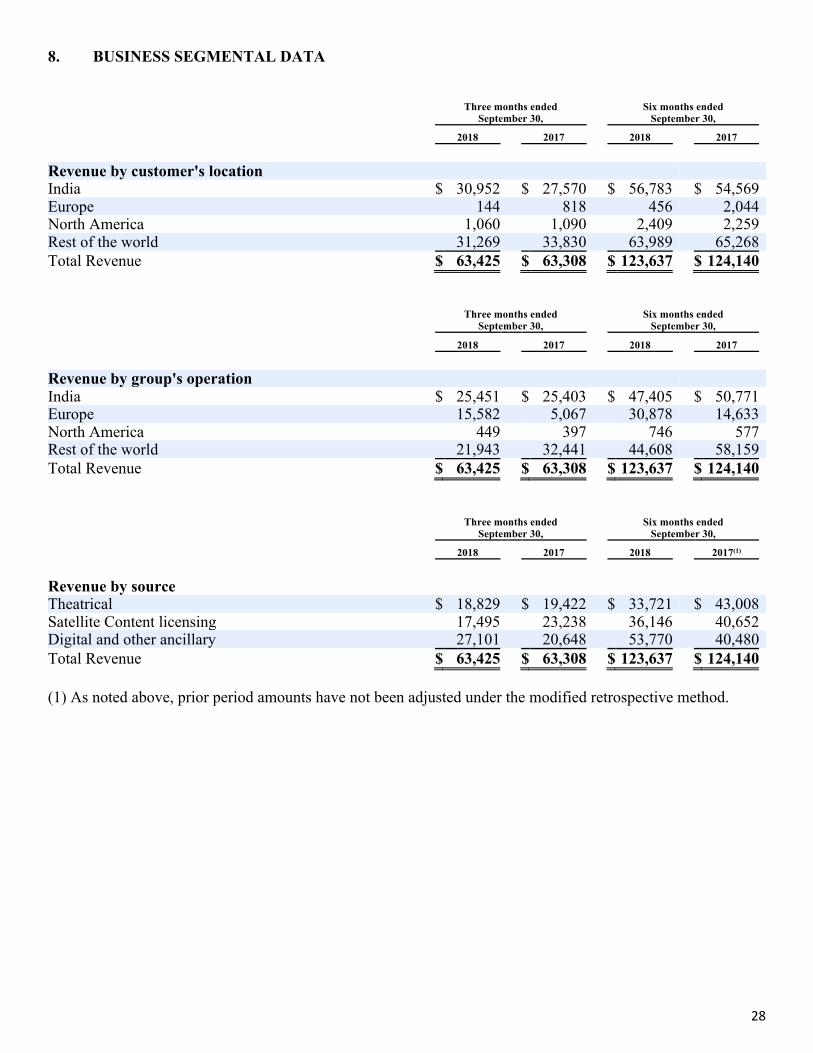
8. BUSINESS SEGMENTAL DATA
Three months ended September 30,
Six months ended September 30,
2018 2017 2018 2017
Revenue by customer's location India $ 30,952 $ 27,570 $ 56,783 $ 54,569 Europe 144 818 456 2,044 North America 1,060 1,090 2,409 2,259 Rest of the world 31,269 33,830 63,989 65,268 Total Revenue $ 63,425 $ 63,308 $ 123,637 $ 124,140
Three months ended September 30,
Six months ended September 30,
2018 2017 2018 2017
Revenue by group's operation India $ 25,451 $ 25,403 $ 47,405 $ 50,771 Europe 15,582 5,067 30,878 14,633 North America 449 397 746 577 Rest of the world 21,943 32,441 44,608 58,159 Total Revenue $ 63,425 $ 63,308 $ 123,637 $ 124,140
Three months ended September 30,
Six months ended September 30,
2018 2017 2018 2017(1)
Revenue by source Theatrical $ 18,829 $ 19,422 $ 33,721 $ 43,008 Satellite Content licensing 17,495 23,238 36,146 40,652 Digital and other ancillary 27,101 20,648 53,770 40,480 Total Revenue $ 63,425 $ 63,308 $ 123,637 $ 124,140 (1) As noted above, prior period amounts have not been adjusted under the modified retrospective method.

29
9. OTHER GAINS/(LOSSES)
Three months ended September 30,
Six months ended September 30,
2018 2017 2018 2017
Foreign exchange (loss)/gain,net $ 328 $ (2,230 ) $ 3,689 $ (3,932 ) (Loss) on sale of property and equipment — — — (4 ) Reversal of expected credit (loss) 5,982 — 10,563 — Net losses on derecognition of financial assets measured
at amortized cost, net(*) (1,464 ) (1,778 ) (2,768 ) (1,778 )
(Loss)/Gain on financial liability (convertible notes) measured at fair value through profit and loss 1,580 — (19,743 ) —
Net Gain on held for trading financial liabilities — 786 — 969 $ 6,426 $ (3,222 ) $ (8,259 ) $ (4,745 ) (*) arising on assignment and novation of trade receivables and trade payables with no-recourse. Derecognition of aforesaid financial assets/liabilities measured at amortized cost is to mitigate both credit risk and liquidity risk 10. NON-CASH EXPENSE/(INCOME) Significant non-cash expenses except loss on sale of assets, share based compensation, depreciation, derivative interest and amortization were as follows:
Six months ended September 30,
2018 2017
(in thousands) Net gains on held for trading financial liabilities $ — $ (969 ) Provisions for trade and other receivables — 1,795 Credit impairment losses, net 3,571 3,007 Loss on financial liability (convertible notes) measured at fair value through profit
and loss 19,743 — Net Losses on derecognition of financial assets measured at amortized cost,net 2,768 1,778 Unrealized foreign exchange loss/(gain) (3,776 ) 4,062 Others 154 — $ 22,460 $ 9,673

30
EROS INTERNATIONAL PLC NOTES TO UNAUDITED CONDENSED CONSOLIDATED INTERIM FINANCIAL STATEMENTS
(Amounts in thousands, except share and per share data)
11. NON GAAP FINANCIAL MEASURES Gross Revenue (Non-GAAP) Three months ended September 30, Six months ended September 30, 2018 2017 2018 2017 (in millions) Revenue (GAAP) $ 63.4 $ 63.3 $ 123.6 $ 124.1 Adjustment towards significant financing component 8.8 2.1 15.2 2.1 Gross Revenue (Non -GAAP) $ 72.2 $ 65.4 $ 138.8 $ 126.2 Adjusted EBITDA (Non-GAAP) Three months ended September 30, Six months ended September 30,
2018 2017 2018 2017
(in thousand) Net income (GAAP) $ 13,416 $ 2,216 $ 3,926 $ 4,014 Income tax expense 1,711 831 4,590 3,817 Net finance costs (284 ) 5,169 2,064 10,553 Depreciation 279 270 527 533 Amortization(1) 288 356 759 725 EBITDA 15,410 8,842 11,866 19,642 Share based payments(2) 6,686 2,282 11,116 7,471 Credit impairment losses/(gains)(3) (5,982 ) 3,007 (10,563 ) 3,007 Adjustment towards arisen significant discounting, component (3) 8,837 2,118 15,247 2,118 Net losses on de-recognition of financial assets measured at amortized cost, net 1,464 1,778 2,768 1,778 Loss/(Gain) on financial liability (convertible notes) measured at fair value through profit and loss (1,580 ) — 19,743 — Closure of derivative asset — — 249 — Loss on sale of property and equipment — — — 4 Net losses/(gains) on held for trading financial liabilities — (786 ) — (969 ) Adjusted EBITDA (Non-GAAP) $ 24,835 $ 17,241 $ 50,426 $ 33,051 Amortizaton of intangible and content rights 31,828 28,704 60,323 60,716 Gross Adjusted EBITDA $ 56,663 $ 45,945 $ 110,749 $ 93,767 (1) Includes only amortization of intangible assets other than intangible content assets. (2) Consists of compensation costs recognized with respect to all outstanding plans and all other equity settled instruments. (3) Comparatives number have been reclassified on account of adoption of IFRS 15.

31
NOTES TO UNAUDITED CONDENSED CONSOLIDATED INTERIM FINANCIAL STATEMENTS
(Amounts in thousands, except share and per share data)
12. NEW STANDARDS ADOPTED AS AT APRIL1, 2018 Adoption of IFRS 15, "Revenue from Contracts with Customers" On April 1, 2018, the Group adopted IFRS 15, “Revenue from Contracts with Customers” (‘IFRS 15’), using the modified retrospective method applied to all contracts as of April 1, 2018. Results for reporting periods beginning after April 1, 2018 are presented under IFRS 15, while prior period amounts are not adjusted and continue to be reported in accordance with our historic accounting under IAS 18, Revenue (‘IAS 18’). Revenue arises mainly from production and distribution of media content, television syndication or satellite rights and digital and ancillary rights. The Group determines revenue recognition through the following steps: 1. Identification of the contract, or contracts, with a customer 2. Identification of the performance obligations in the contract 3. Determination of the transaction price 4. Allocation of the transaction price to the performance obligations in the contract 5. Recognition of revenue when, or as, a performance obligation/s are satisfied. In all cases, the total transaction price for a contract is allocated amongst the various performance obligations based on their relative stand-alone selling prices. The transaction price for a contract, excludes any amounts collected on behalf of third parties.

32
EROS INTERNATIONAL PLC NOTES TO UNAUDITED CONDENSED CONSOLIDATED INTERIM FINANCIAL STATEMENTS
(Amounts in thousands, except share and per share data)
Revenue is recognised either at a point in time or over time, when (or as) the Group satisfies performance obligations by transferring the promised goods or services to its customers in an amount that reflects the consideration that it expects to receive in exchange for those services. At contract inception, the Group assesses the services promised in the contracts with customers and identifies a performance obligation for each promise to transfer to the customer a service (or bundle of services) that is distinct. To identify the performance obligations, the Group considers all of the services promised in the contract regardless of whether they are explicitly stated or are implied by customary business practices. The Group recognises contract liabilities for consideration received in respect of unsatisfied performance obligations and reports these amounts within ‘Trade and other payables’ in the Statement of Financial Position. Similarly, if the Group satisfies a performance obligation before it receives the consideration, the Group recognises either a contract asset or accrued receivable within ‘Trade and other receivables’ in the Statement of Financial Position, depending on whether something other than the passage of time is required before the consideration is due. For certain content licensing arrangements, the Group’s collection period range between 2 – 3 years from contract inception date. Under IFRS 15, an entity needs to adjust the promised amount of consideration for the effects of the time value of money if the timing of payments agreed to by the parties to the contract (either explicitly or implicitly) provides the customer or the entity with a significant benefit. As such, for arrangements where the implied collection period (or normal credit term) is considered to be more than 1 year, revenue is recognised after adjusting the promised amount of consideration for a significant financing component, using the discount rate that would be reflected in a separate financing transaction between the entity and its customer at contract inception. The effects of financing, i.e. unwinding of the financing component, is recognised separately from revenue from contracts with customers in the Statement of Income, within ‘Finance income’. Any subsequent change in collection date from the anticipated collection date considered on the contract inception date has been recognised separately in the Statement of Income, within ‘Other gains/(losses), net. For the six months ended September 30, 2018, revenue amounting $7,258 included in the contract liability balance at the beginning of the period. In case of television syndication rights, as on September 30, 2018, there were certain films in respect of which rights have not been transferred either because the delivery of the content has not been made or effective date mentioned in the contract has not arrived as on the reporting date. The aggregate amount of license fees allocated to the above movies for the six months ended September 30, 2018 is $5,317 As such, the Group has performance obligations associated with fixed commitments in customer contracts for future services that have not yet been recognized in our condensed interim consolidated financial statements is $3,397 as of September 30, 2018. The Company expects to recognize revenue on approximately 80% of these remaining performance obligations by 12 months with the balance recognition thereafter. Practical Expedients and Exemptions We generally expense sales commissions when incurred because the amortization period would have been one year or less. These costs are recorded within sales and marketing expenses.

33
Adoption of IFRS 9, "Financial Instruments" On April 1, 2018, the Company adopted IFRS 9, “Financial Instruments” (‘IFRS 9’), using the modified retrospective method applied as of April 1, 2018. IFRS 9 Financial Instruments replaces IAS 39 ‘Financial Instruments: Recognition and Measurement’ requirements with effect from April 1, 2018. When adopting IFRS 9, the Group elected not to restate prior periods. Rather, differences arising from the adoption of IFRS 9 in relation to classification, measurement, and impairment are recognized in opening retained earnings as of 1 April 2018. Major changes in IFRS 9 as compared to IAS 39 is on account of introduction of the expected credit loss model and the changes in categories of financial assets and financial liabilities. The adoption of IFRS 9 has mostly impacted the following areas: The classification and measurement of the Group’s financial assets. Management holds most financial assets to hold and collect the associated cash flows. The impairment of financial assets applying the expected credit loss model. This applies now to the Group’s trade and other receivables. For contract assets arising from IFRS 15 and trade receivables, the Group applies a simplified model of recognising lifetime expected credit losses as these items do not have a significant financing component. For all other financial assets, expected credit losses are measured at an amount equal to the twenty-four month ECL, unless there has been a significant increase in credit risk from initial recognition in which case those are measured at lifetime ECL. The measurement of available for sale equity investments at cost less impairment. This investment is now measured at fair value with changes in fair value presented in other comprehensive income. The recognition of gains and losses arising from the Group’s from own credit risk. The Group continues to elect the fair value option for certain financial liabilities which means that fair value movements from changes in the Group’s own credit risk are now presented in other comprehensive income rather than profit or loss. Details showing the Classification and measurement of the Company’s financial instruments on adoption of IFRS 9 as of 1 April 2018. IAS 39 Category IFRS 9 Category Total
carrying value Total fair value
Financial Assets Cash and cash
equivalents Loans and Receivables
At amortized cost 87,762 87,762 Restricted deposits Loans and Receivables At amortized cost 7,468 7,468 Investment in equity
instruments Available for sale financial assets
Financial assets at FVTOCI* 27,257 27,257
Trade and other receivables
Loans and Receivables At amortized cost 235,726 235,726
Total 358,213 358,213 IAS 39 Category IFRS 9 Category Total
carrying value Total fair value
Financial Liabilities Total borrowings
(excluding convertible notes) At amortized cost At amortized cost 190,936 174,533
Convertible notes Financial liabilities at FVTPL
Financial liabilities at FVTPL** 86,010 86,010
Trade and other payables At amortized cost At amortized cost 72,142 72,142

34
Acceptances At amortized cost At amortized cost 8,898 8,898 Total 357,986 341,583
* FVTOCI – Fair value through other comprehensive income. ** FVTPL - Fair value through profit and loss. The cumulative effect of the changes made to the consolidated interim Statement of Financial Position as of April 1, 2018 in respect of the adoption of IFRS 15 and IFRS 9 were as follows:
Assets
As of March 31,
2018 (Reported) IFRS 9/15
As of April 1,
2018
Trade and other receivables $ 254,223 $ (18,497 ) $ 235,726 Liabilities and Shareholders' Equity
Currency translation reserve (56,722 ) (34 ) (56,756 ) Retained earnings 375,260 (14,270 ) 360,990 Deferred income tax liabilities 39,519 (673 ) 38,846 Non-controlling interests 137,728 (3,520 ) 134,208

35
EROS INTERNATIONAL PLC NOTES TO UNAUDITED CONDENSED CONSOLIDATED INTERIM FINANCIAL STATEMENTS
(Amounts in thousands, except share and per share data)
The Impact adoption of IFRS 15 and IFRS 9 on our consolidated statement of financial position as at September 30, 2018 were as follows:
Assets
Balance at September 30, 2018
(without adoption of IFRS 9/15) IFRS/ 9/15
Balance at September 30,
2018 (Reported)
Trade and other receivables $ 222,585 $ (24,585 ) $ 198,000 Liabilities and Shareholders' Equity
Currency translation reserve (71,808 ) 609 (71,199 ) Retained earnings 389,861 (21,662 ) 368,199 Deferred income tax liabilities 33,543 (673 ) 32,870 Non-controlling interests 133,097 (2,859 ) 130,238
The impact of adoption of IFRS 15 and IFRS 9 on the consolidated interim statement of income for three month ended September 30, 2018 was as follow.
September 30, 2018
(reported) IFRS 9/15
September 30, 2018
(without adoption
of IFRS 15/ 9)
Revenue 63,425 $ 6,549 69,974 Cost of sales (38,114 ) — (38,114 ) Gross profit 25,311 6,549 31,860 Administrative cost (16,894 )) 3,318 (13,576 ) Operating profit 8,417 9,867 18,284 Financing costs (4,395 ) — (4,395 ) Finance income 4,679 (1,344 ) 3,335 Net finance costs 284 (1,344 ) (1,060 ) Other gains/ (losses) 6,426 (5,982 ) 444 (Loss)/Profit before tax 15,127 2,541 17,668 Income tax (1,711 ) — (1,711 ) (Loss)/ Profit for the period 13,416 2,541 15,957 Attributable to: Equity holders of Eros International Plc 12,569 2,701 15,270 Non-controlling interest 847 (160) 687

36
EROS INTERNATIONAL PLC NOTES TO UNAUDITED CONDENSED CONSOLIDATED INTERIM FINANCIAL STATEMENTS
(Amounts in thousands, except share and per share data)
The impact of adoption of IFRS 15 and IFRS 9 on the consolidated interim statement of income for the six month ended September 30, 2018 was as follow.
September 30, 2018
(reported) IFRS 9/15
September 30, 2018
(without adoption
of IFRS 15/ 9)
Revenue 123,637 10,679 134,316 Cost of sales (74,685 ) — (74,685 ) Gross profit 48,952 10,679 59,631 Administrative cost (30,113 ) 4,998 (25,115 ) Operating profit 18,839 15,677 34,516 Financing costs (9,322 ) — (9,322 ) Finance income 7,258 1,616 8,874 Net finance costs (2,064 ) 1,616 (448 ) Other gains/ (losses) (8,259 ) (10,562 ) (18,821 ) (Loss)/Profit before tax 8,516 6,731 15,247 Income tax (4,590 ) — (4,590 ) (Loss)/ Profit for the period 3,926 6,731 10,657 Attributable to: Equity holders of Eros International Plc (1,022 ) 7,287 6,265 Non-controlling interest 4,948 (556) 4,392