erie indemnity company
TRANSCRIPT

2011ERIE INDEMNITY COMPANY
ANNUAL REPORT

“If you do give your Policyholders the proper service that they
have a right to expect, you will grow and you will prosper.”
– H.O. HirtCo-founder, Erie Insurance
1
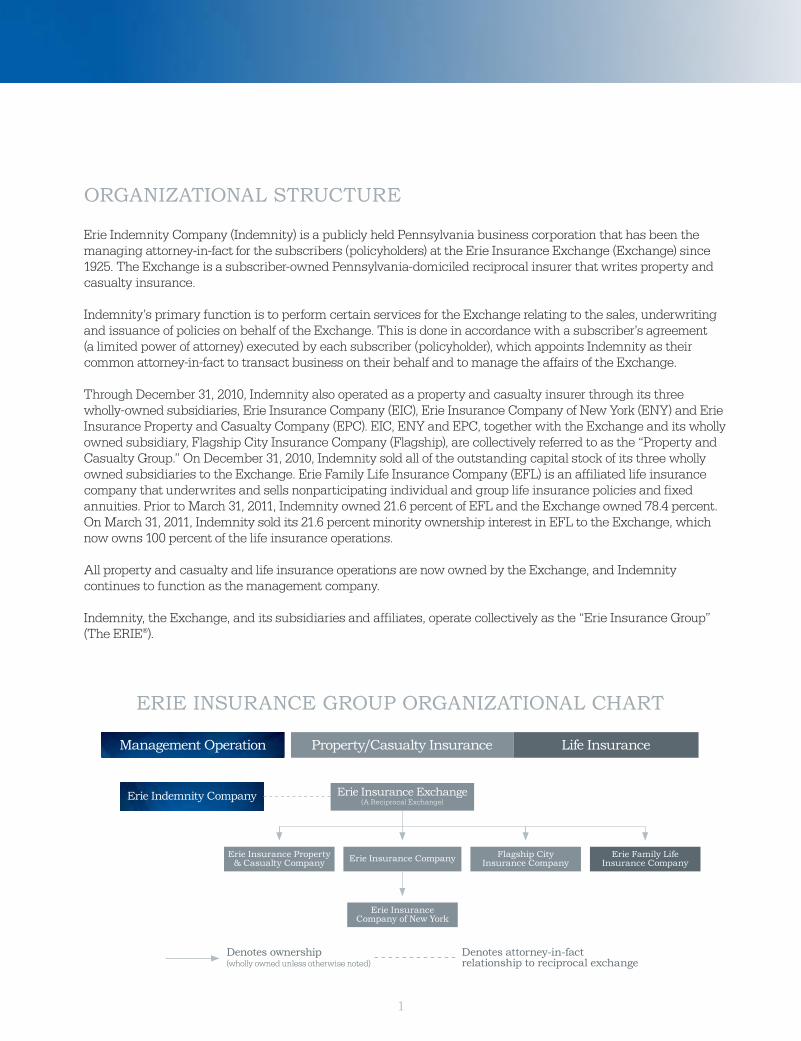
ErIE InsuranCE GrOuP OrGanIzatIOnal CHart
Management Operation Property/Casualty Insurance life Insurance
Erie Indemnity Company
Erie Insurance Company
Erie Insurance Exchange(A Reciprocal Exchange)
Erie InsuranceCompany of new York
Erie Insurance Property& Casualty Company
Flagship CityInsurance Company
Denotes attorney-in-fact relationship to reciprocal exchange
Denotes ownership(wholly owned unless otherwise noted)
Erie Family lifeInsurance Company
OrGanIzatIOnal struCturE
Erie Indemnity Company (Indemnity) is a publicly held Pennsylvania business corporation that has been the managing attorney-in-fact for the subscribers (policyholders) at the Erie Insurance Exchange (Exchange) since 1925. The Exchange is a subscriber-owned Pennsylvania-domiciled reciprocal insurer that writes property and casualty insurance.
Indemnity’s primary function is to perform certain services for the Exchange relating to the sales, underwriting and issuance of policies on behalf of the Exchange. This is done in accordance with a subscriber’s agreement (a limited power of attorney) executed by each subscriber (policyholder), which appoints Indemnity as their common attorney-in-fact to transact business on their behalf and to manage the affairs of the Exchange.
Through December 31, 2010, Indemnity also operated as a property and casualty insurer through its three wholly-owned subsidiaries, Erie Insurance Company (EIC), Erie Insurance Company of New York (ENY) and Erie Insurance Property and Casualty Company (EPC). EIC, ENY and EPC, together with the Exchange and its wholly owned subsidiary, Flagship City Insurance Company (Flagship), are collectively referred to as the “Property and Casualty Group.” On December 31, 2010, Indemnity sold all of the outstanding capital stock of its three wholly owned subsidiaries to the Exchange. Erie Family Life Insurance Company (EFL) is an affiliated life insurance company that underwrites and sells nonparticipating individual and group life insurance policies and fixed annuities. Prior to March 31, 2011, Indemnity owned 21.6 percent of EFL and the Exchange owned 78.4 percent. On March 31, 2011, Indemnity sold its 21.6 percent minority ownership interest in EFL to the Exchange, which now owns 100 percent of the life insurance operations.
All property and casualty and life insurance operations are now owned by the Exchange, and Indemnity continues to function as the management company.
Indemnity, the Exchange, and its subsidiaries and affiliates, operate collectively as the “Erie Insurance Group” (The ERIE®).

2
annual report 2011
sHarEHOlDErs’ lEttEr
Dear Shareholders:
There’s a small plaque in my office that used to sit on our Founder H. O. Hirt’s desk. Think. That’s what it says. One simple word and yet so powerful. It reminds me daily—just as it reminded H. O.—that in order to thrive, to succeed and sustain that success, you have to be deliberate and make conscious and disciplined choices.
ERIE entered its 86th year as a thriving company. Despite global economic challenges and an intensely competitive environment, we ended 2011 with added vigor. We looked for business opportunities and positioned the company for even greater success, beginning with the change in our organization structure that we announced in late 2010.
This new structure aligns our insurance operations and supporting capital under the Exchange, creating liquidity for Erie Indemnity. It also removes underwriting volatility from Indemnity. With this thoughtful and simplified structure, we’re gaining flexibility, improved accountability and an increased focus on the marketplace.
Additionally, the capital infusion from the sale of Indemnity’s insurance operations and minority interest in our life company to the Exchange is allowing for greater capital return to our Shareholders through share buybacks and increased dividends. In 2011, Indemnity achieved a 152 percent payout ratio, based on dividends and share repurchases, and a total shareholder return of 23 percent based on dividends and increased share price.
Our rEsultsToday, Erie Indemnity is a pure management company that operates in two segments—management operations and investment operations. Indemnity’s primary source of revenue is the fee we earn from the Exchange for delivering management services. In 2011, the fee rate was 25 percent of the Exchange’s direct written premium. It remains 25 percent for 2012.
Continued strong customer retention—at 90.7 percent for 2011—and reasonable rate increases fueled a 5.9 percent growth in the 2011 direct written premium, consequently pushing Indemnity’s management fee revenue up by 5.7 percent. We continue to attract new Customers as well, but at a slower rate than the strong numbers we experienced in 2010.
We’re generating revenue growth in all lines of business, led by commercial with premium growth of 8.5 percent. This is the fourth consecutive year the Exchange has seen premiums rise. The Exchange’s 2011 result outperforms the property and casualty industry’s premium growth estimate of 2.6 percent.*
*Conning Research & Consulting

3
2011 FInanCIal HIGHlIGHts
Erie Indemnity CompanyErie Insurance Exchange
Operating income per Class a share - diluted*$3.04$2.88
$1.91
Direct Written Premium(dollars in billions)
$4.3
2011 2011
20112011
2010 2010
20102010
2009 2009
20092009
$3.9 $4.0
statutory Combined ratio
108.096.9 99.0
return on Equity
20.0%17.9%
12.8%
2011 a.M. Best ratings:
Property & Casualty Group a+ (superior)
Erie Family life a (Excellent)
201120102009
total shareholder return 8%
Book Value/share $15.74
73%
$16.24
23%
$14.48
Strategic investments in the business, coupled with careful cost management practices, produced a gross margin of 18.9 percent in Indemnity’s management operations, resulting in management income before taxes of $208 million. When combined with positive results in our investment operations Indemnity finished the year with net income per share of $3.08, up 8.0 percent over the 2010 result.
During the fourth quarter 2011, based on the continued strength of our balance sheet and strong financial performance, our Board of Directors continued our share repurchase program by approving an additional $150 million of share repurchase authority and increased the regular quarterly cash dividend from $0.515 to $0.5525 on each Class A share and from $77.25 to $82.875 on each Class B share, a 7.3 percent increase.
The health of the Exchange is essential to Indemnity’s success. In 2011, the Exchange continued to build a strong balance sheet, growing surplus despite a year of incredible and devastating catastrophes that drove the
* For a definition of the non-GAAP financial measure, operating income, and a reconciliation to the most directly comparable GAAP financial measure, net income, please see Item 7. “Management’s Discussion and Analysis of Financial Condition and Results of Operations” of our Form 10-K or our quarterly earnings news release, both of which are available on the Investors page of our website at www.erieinsurance.com.

Exchange’s statutory combined ratio to 108.0. In recognition of our continued strong financial performance and management effectiveness, we were again named one of the Ward Group’s Top 50 Performing Insurance Companies out of 3,000 property/casualty insurers. A. M. Best also renewed its A+ Superior rating of the Erie Insurance Exchange and its property and casualty subsidiaries—a rating earned by only 8 percent of all insurance groups rated by A. M. Best. Erie Family Life retained its A Excellent rating.
strOnG ExECutIOn: a CatalYst FOr GrOWtHI credit our strong performance to the men and women behind the company—ERIE Employees and Agents. Their continued strong focus on successfully executing our strategy and doing what’s right by our Customers is a distinct advantage for us.
ERIE’s strategy is consistent, simple and focused. Our people get it and live it every day. There are four key elements—people, protection, customer service and our agency distribution system. Within each, we strive to build on our accomplishments, learn from our mistakes, create change where it’s needed and then achieve even more. It’s a process that leads to
success and has historically produced favorable results. We are well positioned to achieve the same moving forward.
In 2011, our people designed new rating platforms, launched new, innovative products and released new operating systems. Every line of business—personal, commercial and life—has benefitted greatly from their talent, perseverance and resilience.
ERIE Rate Lock,SM a product we piloted in 2010 and rolled out last year to most of our states, including our largest, Pennsylvania, is a prime example of ERIE innovation. Unique in its category, ERIE Rate Lock is a patent pending private passenger auto insurance product that locks in a Customer’s rate until they make one of three changes to their policy—add or remove a vehicle or driver or change their primary residence. We’re finding that the stability offered by the product is appealing to consumers, especially in today’s stressed economy. It’s creating opportunities for
our Agents to tell ERIE’s story and convert new ERIE Customers, which they do at an average rate of 34 percent. That’s one of the highest auto conversion rates in the industry.
4
ErIE’s strategy is consistent, simple and
focused. Our people get it and live it every day.
5
5
One of our most important system enhancements in 2011 happened within our commercial business with the initial rollout of a new Web-based commercial system. The system provides a single, online source to quote, bind, issue and endorse commercial policies in real time. We rolled the system out with a new business owners policy package—Ultrapack PlusSM—that includes new coverages, higher limits and greater pricing flexibility. With the new commercial system in place, we now have the foundation to launch even more new and enhanced coverages.
For our life business, the greatest opportunity to grow exists with our current property and casualty Customers. Making it easy for Agents to quote and apply for life policies is key to accessing this book. In 2011, Erie Family Life made significant strides in this regard with a new Web-based eApplication with eSignature. The expectation was 15–20 percent Agent adoption rate in 2011; by year-end, more than 35 percent of Agents were using the new tool instead of the paper option.
On the marketing front, we’re working with our Agents on a new campaign to give them greater reach in the marketplace and begin to build ERIE’s brand awareness among key consumer segments. The program is designed to be targeted and cost-efficient—important tenets of our approach—and very local. It builds upon the intrinsic value of the local agents’ reputation and relationships. We’re learning from our initial effort and seeing positive results. The program is continuing in 2012.
I view this marketing program, and many of our initiatives, as strategic investments in our Agent relationships. ERIE sells its products only through independent Agents. Our agency distribution system stands at more than 2,100 agencies with over 9,700 licensed Agents. We’re continuing to build out our agency force in targeted geographic areas, and we’re positioning ourselves to expand ERIE’s footprint in the future.
Even with today’s Internet-savvy consumers, I strongly believe that insurance is a product not easily reduced to an online transaction. Most consumers want and need a dialogue with an insurance professional about coverages, security issues, risks, costs and more before they’re confident they have the protection they need. An agent that leverages technology and has a strong Internet presence creates multiple access points and powerful connections with their customers and prospects.
That’s precisely what we’re doing to support our Agents through the ERIE Agents Online program. We’re supporting our agencies’ digital presence by providing customizable Web sites that include the same self-service functionality available on our corporate Web site, erieinsurance.com. Customers can file a claim, pay a bill and view their policies among other options. Quoting functionality is also available. Through the program, Agents have access to Web analytics and other digital marketing tools. It’s just one way we’re working with Agents to address consumers’ demands for online information while meeting their need for professional insurance advice.
We now have the
foundation to launch even more new and enhanced coverages.

6
BEInG aBOVE all In sErVICEsM
ERIE Agents are at the top of their profession. There’s no question that they understand the insurance business and the intricacies of insurance products and protections, but to be an ERIE Agent you need to be more than an insurance expert. You need to share in ERIE’s commitment of superior service. In 2011, a record-setting catastrophe year for the industry, that commitment to be Above all in SERvICE was called upon again and again, and our Agents and Employees were unwavering.
In spring 2011 and again in late summer, a number of ERIE’s territories were hit with tornadoes, wind, hail storms and flooding. We saw catastrophe claims at unprecedented levels. The devastation people experienced was incredible. One of our commercial Customers in Richmond, va., described his experience…
“…Both buildings were torn to pieces. My aunt’s home was completely destroyed. We had already found out she had passed away. The lot was strewn with debris from other places. Most of the stuff came off of our business. I have no idea where most of it went. Peoples’ lives completely in rubble.”
We heard hundreds of stories like this. Many of our Agents’ homes and businesses were also affected. Yet, they were there, on the ground, side-by-side with ERIE claims Employees helping people recover. After the event, one of our Agents who was in the thick of it shared a common sentiment:
“You won’t believe how many people have come in to my office and said, ‘Hey, we want to switch companies. Our neighbor had ERIE and ERIE came in and handled the claim in a
timely fashion, and we want you as our new company.”
As the CEO of this great company, I am both proud and humbled to hear people in great need recognize our responsiveness, commitment and care. For us, it’s truly about delivering on the promise. Whether it’s a catastrophic situation or an everyday customer service question, I’m confident that the ERIE team of Agents and Employees will deliver.
Because of ERIE’s value proposition and this differentiating commitment to do what’s right by our Customers, ERIE’s retention is among the highest in the industry. Nearly 91 percent of our Customers stay with us year after year—a huge advantage for us and the Agents who represent us. ERIE agencies are not experiencing the churn they might with other companies. They’re growing with us and building on a solid base of loyal Customers.
For us, it’s truly about delivering
on the promise.
7

7
ERIE and our Agents have been recognized repeatedly for our promise to deliver superior service to our Customers. In 2011, ERIE was named a J. D. Power and Associates Customer Service Champion, one of 40 companies recognized. We were selected out of 800 companies across 12 industries based on five dimensions—people, presentation, process, product and price. Others on the list included well-known service brands such as Southwest Airlines, Ritz-Carlton, Mercedes-Benz and Wegmans.
Being Above all in SERvICE is part of ERIE’s DNA. It’s not meant to be boastful, but rather a recognition of what we’re striving for every day. Distinctions such as Customer Service Champion help to confirm that we’re doing our best, but we always believe that we can do more. Erie Insurance people deliver great service not because we ask them to, but because they’re built that way; the effect of which is felt well beyond Erie Insurance. Our Employees and Agents are helping to make people’s lives better in communities across our footprint, across America and even globally. Through the ERIE Giving Network, we provide a platform to support their efforts with funding and programs—whether stocking a food pantry in Indianapolis or building Habitat for Humanity homes in Raleigh. But make no mistake, the selflessness of our people is what makes it all work.
MOVInG FOrWarD
Think. Asking why, how and what if. It shapes our vision, inspires change and spurs action. That’s what you’ve charged us with and that is what drives our achievement.
We have a solid plan in place, enabled by strong financials, experienced leadership, intelligent and dedicated Employees and a high performing agency force. We’re relying on our strengths to fuel our continued success in support of all ERIE®constituents—Customers, Agents, Employees, communities and Shareholders.
We have ample momentum and a relentlessly competitive spirit.
Thank you for your continued confidence and support.
Terrence W. Cavanaugh President and Chief Executive Officer

8
COrPOratE DIrECtOrY (as OF FEBruarY 27, 2012)
Board of Directors
J. ralPH BOrnEMan Jr.,CIC, CPIa5, 7C, 8
President, Chief Executive Officer andChairman of the Board, Body-BornemanInsurance & Financial Services, LLC
tErrEnCE W. CaVanauGH5, 6, 7
President and CEO, Erie Insurance Group
JOnatHan HIrt HaGEn2, 3, 4C, 7, 8
vice Chairman, Custom Group Industries
susan HIrt HaGEn1, 4, 5, 8C
Co-Trustee, H.O. Hirt Trusts
tHOMas B. HaGEn1C, 9
Chairman of the Board of Erie Indemnity Company, Chairman/Owner, Custom Group Industries
C. sCOtt Hartz, CPa6C, 7
Chief Executive Officer, Hartz Group;Former CEO, PwC Consulting
ClauDE C. lIllY III,Ph.D., CPCu, Clu 2C, 6, 7, 8
Dean, College of Business & Behavioral Science, Clemson University
luCIan l. MOrrIsOn, Esq.2, 3, 6, 8
Independent trustee and consultant in trust,estate probate and qualified plan matters
tHOMas W. PalMEr, Esq.1, 2, 3, 4, 7
A member and a managing partner of thelaw firm of Marshall & Melhorn, LLC
MartIn P. sHEFFIElD, CPCu2, 7, 8
Owner, Sheffield Consulting, LLC
rICHarD l. stOVEr1, 2, 6
Managing Principal, Birchmere Capital, L.P.
ElIzaBEtH HIrt VOrsHECk1, 4, 5C, 7, 8
Co-Trustee, H.O. Hirt Trusts
rOBErt C. WIlBurn, Ph.D.3C, 5, 6
Distinguished Service Professor and Director, Heinz College, Washington, DC, CarnegieMellon University, since 2009
1Member of the Executive Committee2Member of the Audit Committee3 Member of the Executive Compensation and Development Committee4Member of the Nominating and Governance Committee5Member of the Charitable Giving Committee6Member of the Investment Committee7Member of the Strategy Committee8Member of the Exchange Relationship Committee9 Ex-officio non-voting member of Audit Committee and Executive Compensation and Development Committee and voting member of all other committeesCDenotes Committee Chairperson

8 9
Executive Officers
tErrEnCE W. CaVanauGHPresident and Chief Executive Officer
MarCIa a. Dall, CPa Executive vice President and Chief Financial Officer
GEOrGE D. “CHIP” DuFala, CPCu Executive vice President, Services
JOHn F. kEarns, FCII Executive vice President, Sales and Marketing
JaMEs J. tanOus, Esq. Executive vice President, Secretary and General Counsel
MICHaEl s. zaVaskY, CPCu, are Executive vice President, Insurance Operations
senior Officers
JEFFrEY W. BrInlInG, CIC, lutCF, aIs Senior vice President, Corporate Training & Development
rICHarD F. Burt, Jr. Senior vice President, Actuarial & Chief Actuary
lOuIs F. COlaIzzO, CIC Senior vice President, Sales and Agency
lOrIannE FEltz-uPPErMan, CPCu, CIC, CPIW Senior vice President, Customer Service
CHErYl a. FErrIE, CPM, aPP Senior vice President, Corporate Services
GrEGOrY J. GuttInG, FlMI, aIaF Senior vice President and Controller
JaYasHrEE IsHWar Senior vice President, Enterprise Risk Management
CHrIstIna M. MarsH, CPa Senior vice President, Human Resources
ErIC a. MIllEr, CPa, CFP Senior vice President, Information Technology
MattHEW W. MYErs, CPCu, CIC, sCla, aaM, aIC Senior vice President, Claims
tIMOtHY G. nECastrO, CPa Senior vice President and Regional Officer, West Region
ranDall t. PEtErMan Senior vice President, Financial Planning & Analysis
MICHaEl a. PlazOnY, FlMI Senior vice President, Erie Family Life Insurance Company
ErIC D. rOOt, CIC, CPIa, aIs Senior vice President, Commercial Lines
sHErrI a. sIlVEr Senior vice President, Strategic Marketing
DOuGlas E. sMItH, FCas, Maaa Senior vice President, Personal Lines
GarY D. VEsHECCO, Esq. Senior vice President and Deputy General Counsel, Law
ann H. zaPraznY Senior vice President and Regional Officer, East Region
CHrIstOPHEr J. zIMMEr, CIC, lutCF Senior vice President, Field Claims

10
The F. W. Hirt Quality Agency Award is the highest honor bestowed on an ERIE agency. It recognizes long-term profitability and growth, thorough and responsible
underwriting practices, and continuing commitment to education.
Parkersburg branch2011 United Security Agency2010 Assure America Corporation2009 Garlow Insurance Agency, Inc.2007 Paree Insurance Centers
Pittsburgh branch2011 Madia Insurance Agency, Inc.2010 William S. Eber Insurance Agency2009 Pasquinelli Insurance Agency2008 Walker MacCartney Insurance Services2007 Anthony M. Zuback Sr.2007 John Seback Agency (Murrysville)
raleigh branch2009 Carl A. Walker Insurance Agency, Inc.2008 Schultze Insurance Agency2007 Bowen Insurance Agency
richmond branch2010 Lewis Insurance Associates2009 Foundation Insurance Group, Inc.2008 Downs & Associates2007 Colony Insurance Agency
roanoke branch2008 Banks Insurance Agency2007 Castle-Rock Insurance Agency
silver sPring branch2011 Browning-Reagle Insurance Agency2010 Olde Towne Insurance Agency, Inc.2009 Insurance First, Inc.2008 Lindquist Insurance Associates2007 Joseph W. McCartin Insurance
tennessee branch2007 Burnette & Associates
Wisconsin branch2009 TLLA Insurance Agency, LLC2008 Wayne Syring Insurance
Allentown BrAnch2011 Paciotti Insurance Agency2010 Cellucci-Foran Insurance Agency2009 Peterson Insurance Services, Inc.2008 Walton-Ebert Agency2007 D. E. Cressman Insurance Agency
cAnton BrAnch2009 Vaughan-Mumaw Insurance Agency, Inc.2008 DiSalvatore Insurance Agency
chArlotte BrAnch2010 Enloe Insurance Agency, Inc.2008 Abee Insurance Agency2007 Deal Insurance Group
columBus BrAnch2008 Dwyer Family Insurance Agency
erie BrAnch2011 Milliren-Hoak Agency2010 Historic Square Agency2009 Nesmith Insurance Agency, LLC2008 Mantsch-Lafaro Insurance Agency2007 Pratt Insurance Agency
hArrisBurg BrAnch2011 Fischer Insurance Agency2010 S.M. Smith & Company2009 Unruh Insurance Agency, Inc.2008 The Hess Agency2007 Shiner Insurance Agency
illinois BrAnch2011 Yaekel & Associates Insurance Services2008 Woodman Cison & Associates
indiAnA BrAnch2011 Martin Insurance Agency2010 Nichols Insurance Agency2009 VanVleet Insurance Agency2007 Johnson Insurance Agency
new York BrAnch2011 John J. Petruzzi Agency2010 Long Agency, Inc.2009 Lighthouse Insurance Agency, LLC2008 J. B. True Agency2007 Insurance Consultants of Rochester
F. W. HIrt qualItY aGEnCY aWarD WInnErs 2007–2011

11
ErIE InDEMnItY COMPanYFInanCIal HIGHlIGHts(dollars in millions, except share data)
Property & Casualty Group: Direct written premium $ 3,861 $ 4,035 $ 4,271
Statutory combined ratio 96.9 99.0 108.0
Indemnity shareholder Interest:Operating data:
Management fee revenue, net $ 965 $ 1,009 $ 1,067
Income from management operations (1) 187 202 208
Income from property and casualty insurance operations (1) (2) 1 0 -
Income from life insurance operations (1) (3) 2 11 3
Income from investment operations (1) (2) (36) 56 45
Net income 108 162 169
Indemnity Financial ratios:
Management fee rate 25% 25% 25%
Gross margin from management operations 18.7% 19.4% 18.9%
Per share data:
Net income per Class A share - diluted $ 1.89 $ 2.85 $ 3.08
Book value per share - Class A common and equivalent B shares 15.74 16.24 14.48
Dividends declared per Class A share 1.83 1.955 2.0975
Dividends declared per Class B share 274.50 293.25 314.625
Financial position data:
Total assets $ 2,667 $ 1,312 $ 1,237
Total equity 902 912 781
Weighted average Class A common and equivalent B shares outstanding - diluted 57,428,999 56,884,894 55,057,437
2009 2010 2011
(1) Before income taxes
(2) Prior to and through December 31, 2010, the underwriting results retained by EIC and ENY and the investment results of EIC, ENY and EPC accrued to Indemnity. Due to the sale of Indemnity’s subsidiaries to the Exchange on December 31, 2010, all underwriting and investment results for these companies accrue to the Exchange.
(3) Prior to and through March 31, 2011, Indemnity retained a 21.6% ownership interest in EFL and the Exchange retained a 78.4% ownership interest in EFL. Due to the sale of Indemnity’s ownership interest in EFL to the Exchange on March 31, 2011, 100% of EFL’s life insurance results accrue to the Exchange.
net income per Class a share–diluted
Dividends declared per Class a share
2009 $1.83
2010 $1.955
2011 $2.0975
2010 $2.85
2009 $1.89
2011 $3.08
Operating income per Class a share - diluted*
return on Equity
2009 12.8%
2010 17.9%
2011 20.0%
2010 $2.88
2009 $1.91
2011 $3.04
* For a definition of the non-GAAP financial measure, operating income, and a reconciliation to the most directly comparable GAAP financial measure, net income, please see Item 7. “Management’s Discussion and Analysis of Financial Condition and Results of Operations” of our Form 10-K or our quarterly earnings news release, both of which are available on the Investors page of our website at www.erieinsurance.com.

COrPOratE InFOrMatIOn FOr ErIE InDEMnItY COMPanY

ERIE INDEMNITY COMPANY
EXCERPTS FROM FORM 10-K This Annual Report includes the Company’s Audited Financial Statements and excerpts from the Company’s full Form 10-K
report as filed with the Securities and Exchange Commission (“SEC”) on February 27, 2012.
The complete Form 10-K can be found on the SEC Web site at www.sec.gov.
[X] ANNUAL REPORT PURSUANT TO SECTION 13 OR 15(d) OF THE SECURITIES EXCHANGE ACT OF 1934
For the fiscal year ended December 31, 2011 OR
[ ] TRANSITION REPORT PURSUANT TO SECTION 13 OR 15(d) OF THE SECURITIES EXCHANGE ACT OF 1934
Commission File Number 0-24000
ERIE INDEMNITY COMPANY (Exact name of registrant as specified in its charter)
Pennsylvania 25-0466020 (State or other jurisdiction (I.R.S. Employer of incorporation or organization) Identification No.)
100 Erie Insurance Place, Erie, Pennsylvania 16530 (Address of principal executive offices) (Zip code)
(814) 870-2000 (Registrant's telephone number, including area code)
Securities registered pursuant to Section 12(b) of the Act:
Class A common stock, stated value $0.0292 per share, listed on the NASDAQ Stock Market, LLC (Title of each class) (Name of each exchange on which registered)
Securities registered pursuant to Section 12(g) of the Act: None
Indicate by check mark if the registrant is a well-known seasoned issuer, as defined in Rule 405 of the Securities Act. Yes X No
Indicate by check mark if the registrant is not required to file reports pursuant to Section 13 or Section 15(d) of the Act. Yes No X
Indicate by check mark whether the registrant (1) has filed all reports required to be filed by Section 13 or 15(d) of the Securities Exchange Act of 1934 during the preceding 12 months (or for such shorter period that the registrant was required to file such reports), and (2) has been subject to such filing requirements for the past 90 days. Yes X No
Indicate by check mark whether the registrant has submitted electronically and posted on its corporate Web site, if any, every Interactive Data File required to be submitted and posted pursuant to Rule 405 of Regulation S-T during the preceding 12 months (or for such shorter period that the registrant was required to submit and post such files). Yes X No ___
Indicate by check mark if disclosure of delinquent filers pursuant to Item 405 of Regulation S-K is not contained herein, and will not be contained, to the best of registrant's knowledge, in definitive proxy or information statements incorporated by reference in Part III of this Form 10-K or any amendment to this Form 10-K. [ ]
Indicate by check mark whether the registrant is a large accelerated filer, an accelerated filer, a non-accelerated filer, or a smaller reporting company. See the definitions of “large accelerated filer,” “accelerated filer” and “smaller reporting company” in Rule 12b-2 of the Exchange Act. (Check one): Large Accelerated Filer X Accelerated Filer _____ Non-Accelerated Filer _____ Smaller Reporting Company
(Do not check if a smaller reporting company)
Indicate by check mark whether the registrant is a shell company (as defined in Rule 12b-2 of the Exchange Act). Yes No X
Aggregate market value of voting and non-voting common stock held by non-affiliates as of the last business day of the registrant’s most recently completed second fiscal quarter: $1.9 billion of Class A non-voting common stock as of June 30, 2011. There is no active market for the Class B voting common stock. The Class B common stock is closely held by few shareholders.
Indicate the number of shares outstanding of each of the registrant's classes of common stock, as of the latest practicable date: 47,741,429 shares of Class A common stock and 2,545 shares of Class B common stock outstanding on February 17, 2012.
DOCUMENTS INCORPORATED BY REFERENCE
Portions of Part III of this Form 10-K (Items 10, 11, 12, 13, and 14) are incorporated by reference to the information statement on Form 14(C) to be filed with the Securities and Exchange Commission no later than 120 days after December 31, 2011.
2
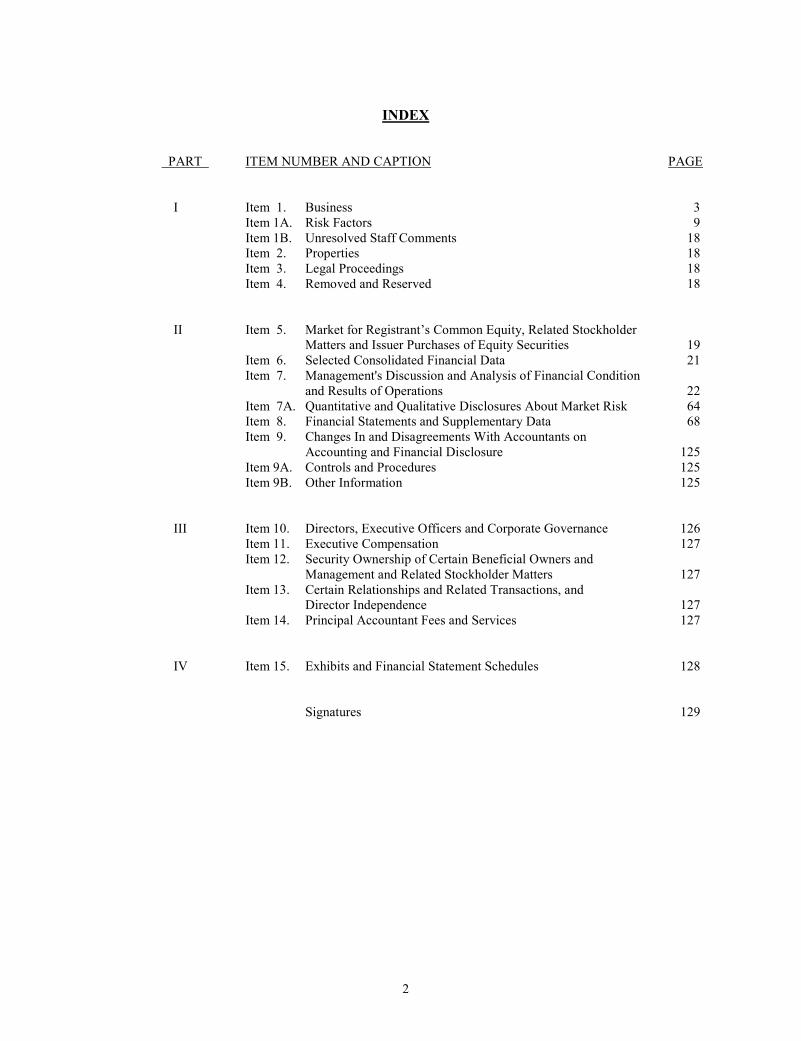
INDEX PART ITEM NUMBER AND CAPTION PAGE I Item 1. Business 3 Item 1A. Risk Factors 9 Item 1B. Unresolved Staff Comments 18 Item 2. Properties 18 Item 3. Legal Proceedings 18 Item 4. Removed and Reserved 18 II Item 5. Market for Registrant’s Common Equity, Related Stockholder Matters and Issuer Purchases of Equity Securities 19 Item 6. Selected Consolidated Financial Data 21 Item 7. Management's Discussion and Analysis of Financial Condition and Results of Operations 22 Item 7A. Quantitative and Qualitative Disclosures About Market Risk 64 Item 8. Financial Statements and Supplementary Data 68 Item 9. Changes In and Disagreements With Accountants on Accounting and Financial Disclosure 125 Item 9A. Controls and Procedures 125 Item 9B. Other Information 125 III Item 10. Directors, Executive Officers and Corporate Governance 126 Item 11. Executive Compensation 127 Item 12. Security Ownership of Certain Beneficial Owners and Management and Related Stockholder Matters 127 Item 13. Certain Relationships and Related Transactions, and Director Independence 127 Item 14. Principal Accountant Fees and Services 127 IV Item 15. Exhibits and Financial Statement Schedules 128 Signatures 129

3
PART I
ITEM 1. BUSINESS
General Erie Indemnity Company (“Indemnity”) is a publicly held Pennsylvania business corporation that has been the managing attorney-in-fact for the subscribers (policyholders) at the Erie Insurance Exchange (“Exchange”) since 1925. The Exchange is a subscriber owned, Pennsylvania-domiciled reciprocal insurer that writes property and casualty insurance. Indemnity’s primary function is to perform certain services for the Exchange relating to the sales, underwriting and issuance of policies on behalf of the Exchange. This is done in accordance with a subscriber’s agreement (a limited power of attorney) executed by each subscriber (policyholder), which appoints Indemnity as their common attorney-in-fact to transact business on their behalf and to manage the affairs of the Exchange. Pursuant to the subscriber’s agreement and for its services as attorney-in-fact, Indemnity earns a management fee calculated as a percentage of the direct premiums written by the Exchange and the other members of the Property and Casualty Group (defined below), which are assumed by the Exchange under an intercompany pooling arrangement. Indemnity has the power to direct the activities of the Exchange that most significantly impact the Exchange’s economic performance by acting as the common attorney-in-fact and decision maker for the subscribers (policyholders) at the Exchange. Through December 31, 2010, Indemnity also operated as a property and casualty insurer through its wholly owned subsidiaries, Erie Insurance Company (“EIC”), Erie Insurance Company of New York (“ENY”) and Erie Insurance Property and Casualty Company (“EPC”). EIC, ENY and EPC, together with the Exchange and its wholly owned subsidiary, Flagship City Insurance Company (“Flagship”), are collectively referred to as the “Property and Casualty Group”. The Property and Casualty Group operates in 11 Midwestern, Mid-Atlantic and Southeastern states and the District of Columbia and writes primarily private passenger automobile, homeowners, commercial multi-peril, commercial automobile and workers compensation lines of insurance. On December 31, 2010, Indemnity sold all of the outstanding capital stock of its wholly owned property and casualty insurance subsidiaries to the Exchange. Erie Family Life Insurance Company (“EFL”) is an affiliated life insurance company that underwrites and sells individual and group life insurance policies and fixed annuities. On March 31, 2011, Indemnity sold its 21.6% ownership interest in EFL to the Exchange. There was no gain or loss resulting from this sale as Indemnity is the primary decision maker for the Exchange. All property and casualty and life insurance operations are owned by the Exchange, and Indemnity functions solely as the management company. The consolidated financial statements of Erie Indemnity Company reflect the results of Indemnity and its variable interest entity, the Exchange, which we refer to collectively as “Erie Insurance Group” (“we,” “us,” “our”). “Indemnity shareholder interest” refers to the interest in Erie Indemnity Company owned by the Class A and Class B shareholders. “Noncontrolling interest” refers to the interest in the Erie Insurance Exchange held for the subscribers (policyholders).
Business Segments
We operate our business as four reportable segments – management operations, property and casualty insurance operations, life insurance operations and investment operations. Financial information about these segments is set forth in and referenced to Item 8. “Financial Statements and Supplementary Data - Note 5, Segment Information, of Notes to Consolidated Financial Statements” contained within this report. Further discussion of financial results by operating segment is provided in and referenced to Item 7. “Management’s Discussion and Analysis of Financial Condition and Results of Operations” contained within this report.

4
Management operations – We generate internal management fee revenue, which accrues to the Indemnity shareholder interest, as Indemnity provides services to the Exchange relating to the sales, underwriting and issuance of policies. The Exchange is the sole customer of our management operations. Indemnity charges the Exchange a management fee, determined by our Board of Directors, not to exceed 25% of all premiums written or assumed by the Exchange for its services as attorney-in-fact. Management fee revenue is eliminated upon consolidation. Property and casualty insurance operations – The Property and Casualty Group generates revenue by insuring preferred and standard risks, with personal lines comprising 73% of the 2011 direct written premiums and commercial lines comprising the remaining 27%. The principal personal lines products based upon 2011 direct written premiums were private passenger automobile (47%) and homeowners (22%). The principal commercial lines products based upon 2011 direct written premiums were commercial multi-peril (12%), commercial automobile (7%) and workers compensation (7%). The members of the Property and Casualty Group pool their underwriting results under an intercompany pooling agreement. Under the pooling agreement, the Exchange retains a 94.5% interest in the net underwriting results of the Property and Casualty Group, while EIC retains a 5.0% interest and ENY retains a 0.5% interest. Prior to December 31, 2010, the underwriting results retained by EIC and ENY accrued to the Indemnity shareholder interest. Due to the sale of Indemnity’s property and casualty insurance subsidiaries to the Exchange on December 31, 2010, all property and casualty underwriting results accrue to the interest of the subscribers (policyholders) of the Exchange, or noncontrolling interest, after December 31, 2010. Historically, due to policy renewal and sales patterns, the Property and Casualty Group’s direct written premiums are greater in the second and third quarters than in the first and fourth quarters of the calendar year. Property and casualty insurance premiums earned accounted for approximately 86% of our total consolidated revenue in 2011, 81% in 2010 and 90% in 2009. The Property and Casualty Group is represented by over 2,100 independent agencies comprising almost 9,500 licensed property and casualty representatives, which is our sole distribution channel. In addition to their principal role as salespersons, the independent agents play a significant role as underwriting and service providers and are fundamental to the Property and Casualty Group’s success. The Property and Casualty Group writes business in Illinois, Indiana, Maryland, New York, North Carolina, Ohio, Pennsylvania, Tennessee, Virginia, West Virginia, Wisconsin and the District of Columbia. The states of Pennsylvania, Maryland and Virginia made up 63% of the Property and Casualty Group’s direct written premium in 2011. While sales, underwriting and policy issuance services are centralized at our home office, the Property and Casualty Group maintains 24 field offices throughout its operating region to provide claims services to policyholders and marketing support for the independent agencies that represent us. The Property and Casualty Group ranked as the 12th largest automobile insurer in the United States based upon 2010 direct premiums written and as the 20th largest property and casualty insurer in the United States based upon 2010 total lines net premiums written according to AM Best Company. Life insurance operations – Our life insurance operations generate revenue from the sale of individual and group life insurance policies and fixed annuities. These products are offered through our property and casualty insurance agency force to provide an opportunity to cross-sell both personal and commercial accounts. EFL writes business in 10 states including Illinois, Indiana, Maryland, North Carolina, Ohio, Pennsylvania, Tennessee, Virginia, West Virginia, and Wisconsin and the District of Columbia. The state of Pennsylvania made up 48% of EFL’s 2011 premium and annuity considerations, with Virginia, Maryland and Ohio making up approximately 10% each. Prior to and through March 31, 2011, Indemnity retained a 21.6% ownership interest in EFL, which accrued to the Indemnity shareholder interest, and the Exchange retained a 78.4% ownership interest in EFL, which accrued to the interest of the subscribers (policyholders) of the Exchange, or noncontrolling interest. Due to the sale of Indemnity’s 21.6% ownership interest in EFL to the Exchange on March 31, 2011, 100% of EFL’s life insurance results accrue to the interest of the subscribers (policyholders) of the Exchange, or noncontrolling interest, after March 31, 2011.

5
Investment operations – Our investment operations generate revenue from our fixed maturity, equity security and alternative investment portfolios. The portfolios are managed with the objective of maximizing after-tax returns on a risk-adjusted basis. Revenues and losses included in investment operations consist of net investment income, net realized gains and losses, net impairment losses recognized in earnings for our fixed maturity and preferred equity portfolios, and equity in earnings and losses from our alternative investments, which include private equity, mezzanine debt, and real estate limited partnerships. The volatility inherent in the financial markets has the potential to impact our investment portfolio from time-to-time. Net revenues from our investment operations accounted for approximately 12% of our total consolidated revenue in 2011, 17% in 2010, and 8% in 2009.
Competition
Property and casualty insurers generally compete on the basis of customer service, price, consumer recognition, coverages offered, claims handling, financial stability and geographic coverage. Vigorous competition, particularly in the personal lines automobile and homeowners lines of business, is provided by large, well-capitalized national companies, some of which have broad distribution networks of employed or captive agents, by smaller regional insurers, and by large companies who market and sell personal lines products directly to consumers. In addition, because the insurance products of the Property and Casualty Group are marketed exclusively through independent insurance agents, the Property and Casualty Group faces competition within its appointed agencies based upon ease of doing business, product, price and service relationships. Market competition bears directly on the price charged for insurance products and services subject to regulatory limitations. Growth is driven by a company’s ability to provide insurance services and competitive prices while maintaining target profit margins. Industry capital levels can also significantly affect prices charged for coverage. Growth is a product of a company’s ability to retain existing customers and to attract new customers, as well as movement in the average premium per policy. The Erie Insurance Group has a strategic focus that we believe will result in long-term underwriting performance. First, we employ an underwriting philosophy and product mix targeted to produce a Property and Casualty Group underwriting profit on a long-term basis through careful risk selection and rational pricing. The careful selection of risk allows for lower claims frequency and loss severity, thereby enabling insurance to be offered at favorable prices. The Property and Casualty Group has continued to refine its risk measurement and price sophistication models used in the underwriting and pricing processes. Second, the Property and Casualty Group focuses on consistently providing superior service to policyholders and agents. Third, the Property and Casualty Group’s business model is designed to provide the advantages of localized marketing and claims servicing with the economies of scale and low cost of operations from centralized accounting, administrative, underwriting, investment, information management and other support services. Finally, we carefully select the independent agencies that represent the Property and Casualty Group. The Property and Casualty Group seeks to be the lead insurer with its agents in order to enhance the agency relationship and the likelihood of receiving the most desirable underwriting opportunities from its agents. We have ongoing, direct communications with our agency force. Agents have access to a number of venues we sponsor designed to promote the sharing of ideas, concerns and suggestions with the senior management of the Property and Casualty Group, with the goal of improving communications and service. We continually evaluate new ways to support our agents’ efforts, from marketing programs to identifying potential customer leads, to grow the business of the Property and Casualty Group and sustain our long-term agency relationships. High agency penetration and long-term relationships allow for greater efficiency in providing agency support and training. EFL, our life insurer, is subject to many of the same structural advantages and environmental challenges as the Property and Casualty Group. Term life business accounts for the majority of policies issued by EFL, and this product line is extremely competitive and increasingly transparent due in part to the proliferation of on-line quoting services. Besides price, ease of application and processing improvements represent areas where companies are finding ways to differentiate themselves among independent producers. EFL continues to progress in these areas using state-of-the-art technology and third-party vendors. Historically, sound underwriting and disciplined approaches to pricing and investing have contributed to favorable operating results. While EFL will be challenged to maintain these trends in the face of intensified competition going forward, we continually shape our strategy and core processes to respond more effectively to the needs of our policyholders and independent agents.

6
Employees
We employed approximately 4,300 full-time people at December 31, 2011.
Reserves for Property and Casualty Losses and Loss Expenses
Loss reserves are established to account for the estimated ultimate costs of loss and loss expenses for claims that have been reported but not yet settled and claims that have been incurred but not reported. While we exercise professional diligence to establish reserves at the end of each period that are fully reflective of the ultimate value of all claims incurred, these reserves are, by their nature, only estimates and cannot be established with absolute certainty. The factors which may potentially cause the greatest variation between current reserve estimates and the actual future paid amounts are: unforeseen changes in statutory or case law altering the amounts to be paid on existing claim obligations, new medical procedures and/or drugs with costs significantly different from those seen in the past, and claims patterns on current business that differ significantly from historical claims patterns. A discussion of our property and casualty loss reserve methodology can be found in and is referenced to Item 7. “Management’s Discussion and Analysis of Financial Condition and Results of Operations – Critical Accounting Estimates” contained within this report. Loss and loss expense reserves are presented on our Consolidated Statements of Financial Position on a gross basis. The table that follows provides a reconciliation of our loss and loss expense reserve beginning and ending balances established for the Property and Casualty Group for the years ended December 31:
Property and Casualty Group
(in millions) 2011 2010 2009
Losses and loss expense reserves at January 1, – Gross $3,584 $3,598 $3,586 Less: reinsurance recoverable 188 200 187
Losses and loss expense reserves at January 1, – Net 3,396 3,398 3,399
Incurred losses and loss expenses related to:
Current accident year 3,616 3,053 2,732 Prior accident years (272) (244) (93)
Total incurred losses and loss expenses 3,344 2,809 2,639
Paid losses and loss expenses related to:
Current accident year 2,360 1,855 1,608 Prior accident years 1,032 956 1,032
Total paid losses and loss expenses 3,392 2,811 2,640
Losses and loss expense reserves at December 31, – Net 3,348 3,396 3,398 Add: reinsurance recoverable 151 188 200
Losses and loss expense reserves at December 31, – Gross $3,499 $3,584 $3,598
The Property and Casualty Group estimates loss reserves at full expected cost except for workers compensation loss reserves, which are discounted on a nontabular basis as prescribed by the Insurance Department of the Commonwealth of Pennsylvania. An interest rate of 2.5% is used to discount these reserves based upon the Property and Casualty Group’s historical workers compensation payout patterns. Loss and loss expense reserves were reduced by $84 million, $127 million and $136 million at December 31, 2011, 2010 and 2009, respectively, as a result of this discounting. The Property and Casualty Group’s reserves for losses and loss expenses are reported net of receivables for salvage and subrogation which totaled $145 million, $141 million and $133 million at December 31, 2011, 2010 and 2009, respectively. Additional discussions of our property and casualty loss reserve activity can be found in and is referenced to Item 7. “Management’s Discussion and Analysis of Financial Condition and Results of Operations – Results of Operations, Property and Casualty Insurance Operations” and “Financial Condition” sections contained within this report.

7
The following table illustrates the change over time of our loss and loss expense reserve estimates established for the Property and Casualty Group at the end of the last ten calendar years:
Property and Casualty Group
Reserves for Unpaid Losses and Loss Expenses
(in millions) At December 31,
2002 2003 2004 2005 2006 2007 2008 2009 2010 2011 Gross liability for unpaid losses and loss
expenses (LAE) $2,940 $3,401 $3,629 $3,779 $3,830 $3,684 $3,586 $3,598 $3,584 $3,499
Gross liability re-estimated as of:
One year later 2,986 3,360 3,592 3,651 3,559 3,487 3,502 3,336 3,282
Two years later 3,021 3,423 3,583 3,508 3,467 3,409 3,320 3,068
Three years later 3,117 3,482 3,558 3,464 3,412 3,307 3,101
Four years later 3,190 3,497 3,516 3,437 3,358 3,111
Five years later 3,223 3,466 3,494 3,404 3,174
Six years later 3,173 3,440 3,485 3,224
Seven years later 3,186 3,430 3,313
Eight years later 3,189 3,275
Nine years later 3,036
Cumulative (deficiency) redundancy $ (96) $ 126 $ 316 $ 555 $ 656 $ 573 $ 485 $ 530 $ 302 N/A
Gross liability for unpaid losses and LAE $2,940 $3,401 $3,629 $3,779 $3,830 $3,684 $3,586 $3,598 $3,584 $3,499
Reinsurance recoverable on unpaid losses(1) 119 124 133 155 183 190 187 200 188 151
Net liability for unpaid losses and LAE $2,821 $3,277 $3,496 $3,624 $3,647 $3,494 $3,399 $3,398 $3,396 $3,348
Cumulative amount of gross liability paid
through:
One year later $ 933 $1,055 $1,066 $1,067 $1,019 $1,042 $1,033 $ 955 $1,042
Two years later 1,477 1,638 1,699 1,630 1,621 1,573 1,538 1,474
Three years later 1,819 2,034 2,056 2,016 1,962 1,889 1,862
Four years later 2,044 2,245 2,294 2,235 2,147 2,079
Five years later 2,161 2,394 2,431 2,342 2,270
Six years later 2,256 2,484 2,509 2,427
Seven years later 2,316 2,541 2,573
Eight years later 2,357 2,588
Nine years later 2,397
(1) Reinsurance recoverable on unpaid losses represents the related ceded amounts.
Government Regulation
Property and casualty insurers are subject to supervision and regulation in the states in which they transact business. The extent of such regulation varies, but generally derives from state statutes that delegate regulatory, supervisory and administrative authority to state insurance departments. Accordingly, the authority of the state insurance departments includes the establishment of standards of solvency that must be met and maintained by insurers, the licensing to do business of insurers and agents, the nature of the limitations on investments, the approval of premium rates for property and casualty insurance, the provisions that insurers must make for current losses and future liabilities, the deposit of securities for the benefit of policyholders, the approval of policy forms, notice requirements for the cancellation of policies and the approval of certain changes in control. In addition, many states have enacted variations of competitive rate-making laws that allow insurers to set certain premium rates for certain classes of insurance without having to obtain the prior approval of the state insurance department. State insurance departments also conduct periodic examinations of the affairs of insurance companies and require the filing of quarterly and annual reports relating to the financial condition of insurance companies. The Property and Casualty Group is also required to participate in various involuntary insurance programs for automobile insurance, as well as other property and casualty lines, in states in which these companies operate. These involuntary programs provide various insurance coverages to individuals or other entities that are otherwise unable to purchase such coverages in the voluntary market. These programs include joint underwriting associations, assigned risk plans, fair access to insurance requirements (“FAIR”) plans, reinsurance facilities and windstorm plans.

8
Legislation establishing these programs generally provides for participation in proportion to voluntary writings of related lines of business in that state. The loss ratio on insurance written under involuntary programs has traditionally been greater than the loss ratio on insurance in the voluntary market. Although currently the federal government does not directly regulate the insurance industry, federal programs, such as federal terrorism backstop legislation and the Federal Insurance Office established under the Dodd-Frank Act can also impact the insurance industry. Our life insurer, EFL, is subject to similar state regulations as the Property and Casualty Group, although specific laws and statutes applicable to life insurance and annuity carriers govern its activities. Valuation laws require statutory reserves to be held at conservative levels, which can have a substantial impact on the amount of free surplus that is available for financing new business and other growth opportunities. Most states have enacted legislation that regulates insurance holding company systems such as the Erie Insurance Group. Each insurance company in the holding company system is required to register with the insurance supervisory authority of its state of domicile and furnish information regarding the operations of companies within the holding company system that may materially affect the operations, management or financial condition of the insurers within the system. Pursuant to these laws, the respective insurance departments may examine Indemnity, as the management company, the Property and Casualty Group and EFL at any time, and may require disclosure and/or prior approval of certain transactions with the insurers and Indemnity, as an insurance holding company. All transactions within the holding company system affecting the insurers Indemnity manages are filed with the applicable insurance departments and must be fair and reasonable. Approval of the applicable insurance commissioner is required prior to the consummation of transactions affecting the control of an insurer. In some states, the acquisition of 10% or more of the outstanding common stock of an insurer or its holding company is presumed to be a change in control. The sale of Indemnity’s wholly owned property and casualty insurance subsidiaries, EIC, ENY and EPC, and the sale of Indemnity’s 21.6% ownership interest in EFL have both been approved by the appropriate regulatory agencies. Approval of the applicable insurance commissioner is also required in order to declare extraordinary dividends. See Item 8, “Financial Statements and Supplementary Data – Note 22, Statutory Information, of Notes to Consolidated Financial Statements” contained within this report.
Website Access
Our annual reports on Form 10-K, quarterly reports on Form 10-Q, current reports on Form 8-K, and any amendments to those reports are available free of charge on our website at www.erieinsurance.com as soon as reasonably practicable after such material is filed electronically with the Securities Exchange Commission. Additionally, copies of our annual report on Form 10-K are available free of charge, upon written request, by contacting Investor Relations, Erie Indemnity Company, 100 Erie Insurance Place, Erie, PA 16530, or calling 1-800-458-0811. Our Code of Conduct is also available on our website and in printed form upon request, and our information statement on Form 14(C) is available free of charge on our website at www.erieinsurance.com.

9
ITEM 1A. RISK FACTORS
Our business involves various risks and uncertainties, including, but not limited to those discussed in this section. The events described in the risk factors below, or any additional risk outside of those discussed below, could have a material adverse effect on our business, financial condition, operating results or liquidity if they were to actually occur. This information should be considered carefully together with the other information contained in this report, including Item 7. “Management’s Discussion and Analysis of Financial Condition and Results of Operations” and Item 8. “Financial Statements and Supplementary Data”, which includes the Notes to Consolidated Financial Statements, contained within this report.
Risk Factors Related to the Indemnity Shareholder Interest
If the management fee rate paid by the Exchange is reduced or if there is a significant decrease in the amount of
premiums written or assumed by the Exchange, revenues and profitability could be materially adversely affected.
Indemnity is dependent upon management fees paid by the Exchange, which represent its principal source of revenue. Pursuant to the subscriber’s agreements with the policyholders at the Exchange, Indemnity may retain up to 25% of all premiums written or assumed by the Exchange. Therefore, management fee revenue from the Exchange is calculated by multiplying the management fee rate by the direct premiums written by the Exchange and the other members of the Property and Casualty Group, which are assumed by the Exchange under an intercompany pooling arrangement. Accordingly, any reduction in direct premiums written by the Property and Casualty Group would have a proportional negative effect on Indemnity’s revenues and net income. See “Risk Factors Relating to the Non-Controlling Interest Owned by the Exchange”, which includes the Property and Casualty Group and EFL, within this section for a discussion of risks impacting direct written premium. The management fee rate is determined by our Board of Directors and may not exceed 25% of the premiums written or assumed by the Exchange. The Board of Directors sets the management fee rate each December for the following year. At their discretion, the rate can be changed at any time. The factors considered by the Board of Directors in setting the management fee rate include Indemnity’s financial position in relation to the Exchange and the long-term needs of the Exchange for capital and surplus to support its continued growth and competitiveness. If the Exchange’s surplus were significantly reduced, the management fee rate could be reduced and Indemnity’s revenues and profitability could be materially adversely affected. If the costs of providing services to the Exchange are not controlled, Indemnity’s revenues and profitability could be
materially adversely affected.
Pursuant to the subscriber’s agreements with the policyholders at the Exchange, Indemnity is appointed to perform certain services, regardless of the cost of providing those services. These services relate to the sales, underwriting and issuance of policies on behalf of the Exchange. Indemnity incurs significant costs related to commissions, employees, and technology in order to provide these services. Inflation could negatively impact many of these costs. Commissions to independent agents are the largest component of Indemnity’s cost of operations. Commissions include scheduled commissions to agents based upon premiums written as well as additional commissions and bonuses to agents, which are earned by achieving certain targeted measures. Changes to commission rates or bonus programs may result in increased future costs and lower profitability. Employees are an essential part of the operating costs related to providing services for the Exchange. As a result, Indemnity’s profitability is affected by employee costs, including salaries and medical, pension and other benefit costs. Recent regulatory developments, provider relationships, and economic factors that are beyond our control indicate that employee healthcare costs will continue to increase. Although Indemnity actively manages these cost increases, there can be no assurance that future cost increases will not occur and reduce its profitability. Technological development is necessary to reduce Indemnity’s costs, to reduce the Property and Casualty Group’s operating costs, and to facilitate agents’ and policyholders’ ability to do business with the Property and Casualty Group. If we are unable to keep pace with the advancements in technology, our ability to compete with other insurance companies who have advanced technological capabilities will be negatively affected. This could result in additional costs as we invest in new technology and systems.

10
Our ability to attract, develop and retain talented executives, key managers and employees is critical to our success.
Our future performance is substantially dependent upon our ability to attract, motivate and retain executives and other key management. The loss of the services and leadership of certain key officers and the failure to attract, motivate and develop talented new executives and managers could prevent us from successfully communicating, implementing and executing business strategies, and therefore have a material adverse effect on our financial condition and results of operations. Our success also depends on our ability to attract, develop and retain a talented employee base. The inability to staff all functions of our business with employees possessing the appropriate technical expertise could have an adverse effect on our business performance. Staffing appropriately skilled employees for the deployment and maintenance of information technology systems, the appropriate handling of claims, and rendering of disciplined underwriting is critical to the success of our business. If we are unable to keep pace with technological advancements in the insurance industry or are unable to ensure
system availability or to secure system information, the ability of the Erie Insurance Group to compete effectively
could be impaired.
Indemnity is responsible for providing the technological resources necessary to support the operations of the Erie Insurance Group. Our business is highly dependent upon the effective operations of our technology and information systems. We rely upon these systems to assist in key functions of core business operations including processing claims, applications, and premium payments, providing customer support, performing actuarial and financial analysis, and maintaining key data. We have an established business continuity plan to ensure the continuation of core business operations in the event that normal business operations could not be performed due to a catastrophic event. While we continue to test and assess our business continuity plan to ensure it meets the needs of our core business operations and addresses multiple business interruption events, there is no assurance that core business operations could be performed upon the occurrence of such an event. Our information technology systems interface with and rely upon third-party systems. The failure of our information systems for any reason could result in a material adverse effect on our business, financial condition, or results of operations. Advancements in technology continue to make it easier to store, share and transport information. While we have tools in place to monitor the flow of information and address identity, threat, vulnerability and trust management, a security breach of our computer systems could interrupt or damage our operations or harm our reputation if confidential company or customer information were to be misappropriated from our systems. Cases where sensitive data is exposed or lost may lead to a loss in competitive advantage or lawsuits. The performance of Indemnity’s investment portfolio is subject to a variety of investment risks, which may in turn have
a material adverse effect on its results of operations or financial condition.
Indemnity’s investment portfolio is comprised principally of fixed-income maturities and limited partnerships. At December 31, 2011, Indemnity’s investment portfolio consisted of approximately 68% fixed income securities, 26% limited partnerships, and 6% equity securities. All of Indemnity’s marketable securities are subject to market volatility. To the extent that future market volatility negatively impacts Indemnity’s investments, its financial condition will be negatively impacted. We review the investment portfolio on a continuous basis to evaluate positions that might have incurred other-than-temporary declines in value. The primary factors considered in our review of investment valuation include the extent and duration to which fair value is less than cost, historical operating performance and financial condition of the issuer, short- and long-term prospects of the issuer and its industry, specific events that occurred affecting the issuer, including rating downgrades and, depending on the type of security, our intent to sell or our ability and intent to retain the investment for a period of time sufficient to allow for a recovery in value. As the process for determining impairments is highly subjective, changes in our assessments may have a material effect on Indemnity’s operating results and financial condition. See also Item 7A. “Quantitative and Qualitative Disclosures about Market Risk”. If the fixed-income, equity, or limited partnership portfolios were to suffer a substantial decrease in value, Indemnity’s financial position could be materially adversely affected through increased unrealized losses or impairments. Currently, 40% of the fixed-income portfolio is invested in municipal securities. The performance of the fixed-income portfolio is subject to a number of risks including:

11
• Interest rate risk – the risk of adverse changes in the value of fixed-income securities as a result of increases in market interest rates.
• Investment credit risk – the risk that the value of certain investments may decrease due to the deterioration in financial condition of, or the liquidity available to, one or more issuers of those securities or, in the case of asset-backed securities, due to the deterioration of the loans or other assets that underlie the securities, which, in each case, also includes the risk of permanent loss.
• Concentration risk – the risk that the portfolio may be too heavily concentrated in the securities of one or more issuers, sectors, or industries, which could result in a significant decrease in the value of the portfolio in the event of a deterioration of the financial condition, performance, or outlook of those issuers, sectors, or industries.
• Liquidity risk – the risk that Indemnity will not be able to convert investment securities into cash on favorable terms and on a timely basis, or that Indemnity will not be able to sell them at all, when desired. Disruptions in the financial markets, or a lack of buyers for the specific securities that Indemnity is trying to sell, could prevent it from liquidating securities or cause a reduction in prices to levels that are not acceptable to Indemnity.
In addition to the fixed-income securities, a significant portion of Indemnity’s portfolio is invested in limited partnerships. At December 31, 2011, Indemnity had investments in limited partnerships of $208 million, or 17% of total assets. In addition, Indemnity is obligated to invest up to an additional $40 million in limited partnerships, including private equity, mezzanine debt, and real estate partnership investments. Limited partnerships are significantly less liquid and generally involve higher degrees of price risk, the risk of potential loss in estimated fair value resulting from an adverse change in prices, than publicly traded securities. Limited partnerships, like publicly traded securities, have exposure to market volatility; but unlike fixed-income securities, cash flows and return expectations are less predictable. The primary basis for the valuation of limited partnership interests are financial statements prepared by the general partner. Because of the timing of the preparation and delivery of these financial statements, the use of the most recently available financial statements provided by the general partners result in a quarter delay in the inclusion of the limited partnership results in our Consolidated Statements of Operations. Due to this delay, Indemnity’s financial statements at December 31, 2011, do not reflect market conditions experienced in the fourth quarter of 2011. Indemnity’s equity securities have exposure to price risk. Indemnity does not hedge its exposure to equity price risk inherent in its equity investments. Equity markets, sectors, industries, and individual securities may also be subject to some of the same risks that affect Indemnity’s fixed-income portfolio, as discussed above. Indemnity is subject to credit risk from the Exchange because the management fees from the Exchange are not paid
immediately when premiums are written.
Indemnity recognizes management fees due from the Exchange as income when the premiums are written because at that time Indemnity has performed substantially all of the services it is required to perform, including sales, underwriting and policy issuance activities. However, such fees are not paid to Indemnity by the Exchange until the Exchange collects the premiums from policyholders. As a result, Indemnity holds receivables for management fees since such fees are based upon premiums that have been written and assumed. Indemnity also holds receivables from the Exchange for costs it pays on the Exchange’s behalf. The receivable from the Exchange totaled $254 million or 21% of our total assets at December 31, 2011. Deteriorating capital and credit market conditions may significantly affect Indemnity’s ability to meet liquidity needs
and access capital.
Sufficient liquidity and capital levels are required to pay operating expenses, income taxes, and to provide the necessary resources to fund future growth opportunities, pay dividends, and repurchase stock. Management estimates the appropriate level of capital necessary based upon current and projected results, which include a factor for potential exposures based upon these Risk Factors. Failure to accurately estimate Indemnity’s capital needs may have a material adverse effect on its financial condition until additional sources of capital can be located. Further, a deteriorating financial condition may create a negative perception of Indemnity by third parties, including rating agencies, investors, agents, and customers which could impact Indemnity’s ability to access additional capital in the debt or equity markets.

12
The primary sources of liquidity for Indemnity are management fees and cash flows generated from its investment portfolio. In the event Indemnity’s current sources do not satisfy its liquidity needs, Indemnity has the ability to access its $100 million bank revolving line of credit, from which there were no borrowings as of December 31, 2011, or sell assets in its investment portfolio. Volatility in the financial markets could impair Indemnity’s ability to sell certain of its fixed income securities or, to a greater extent, its significantly less liquid limited partnership investments, or cause such investments to sell at deep discounts. In the event these traditional sources of liquidity are not available, Indemnity may have to seek additional financing. Indemnity’s access to funds will depend upon a number of factors including current market conditions, the availability of credit to the financial services industry, market liquidity, and credit ratings. In deteriorating market conditions, Indemnity may not be able to obtain additional financing on favorable terms, or at all. Indemnity is subject to applicable insurance laws and regulations, as well as claims and legal proceedings, which, if
determined unfavorably, could have a material adverse effect on Indemnity’s business, results of operations or
financial condition.
Indemnity faces a significant risk of litigation and regulatory investigations and actions in the ordinary course of operating its businesses including the risk of class action lawsuits. Indemnity’s pending legal and regulatory actions include proceedings specific to Indemnity and others generally applicable to business practices in the industries in which it operates. In Indemnity’s management operations, we are, have been, or may become subject to class actions and individual suits alleging, among other things, issues relating to sales or underwriting practices, payment of contingent or other sales commissions, product design, product disclosure, policy issuance and administration, additional premium charges for premiums paid on a periodic basis, charging excessive or impermissible fees on products, recommending unsuitable products to customers, and breaching alleged fiduciary or other duties to customers. Indemnity is also subject to litigation arising out of its general business activities such as its contractual and employment relationships. Plaintiffs in class action and other lawsuits against Indemnity may seek very large or indeterminate amounts, including punitive and treble damages, which may remain unknown for substantial periods of time. Indemnity is also subject to various regulatory inquiries, such as information requests, subpoenas and books and record examinations from state and federal regulators and authorities. Changes in the way regulators administer those laws or regulations could adversely impact Indemnity’s business, results of operations or financial condition. See “Risk Factors Related to the Non-Controlling Interest Owned by the Exchange, which Includes the Property and Casualty Group and EFL,” that follows for additional discussion of litigation risks.
Risk Factors Relating to the Non-Controlling Interest Owned by the Exchange, which Includes the Property
and Casualty Group and EFL
Deteriorating general economic conditions may have an adverse effect on the non-controlling interest’s operating
results and financial condition.
Unfavorable changes in economic conditions, including declining consumer confidence, inflation, high unemployment and the threat of recession, among others, may lead the Property and Casualty Group’s customers to modify coverage, not renew policies, or even cancel policies, which could adversely affect the premium revenue of the Property and Casualty Group, and consequently Indemnity’s management fee. These conditions could also impair the ability of customers to pay premiums when due, and as a result, the Property and Casualty Group’s bad debt write-offs could increase. In addition, downward economic trends also may have an adverse effect on both Indemnity’s and the Property and Casualty Group’s investment results by negatively impacting the business conditions and impairing credit for the issuers of securities held in their respective investment portfolios. This could reduce fair values of investments and generate significant unrealized losses or impairment charges which may adversely affect their respective financial results. The Property and Casualty Group depends on independent insurance agents, which exposes the Property and
Casualty Group to risks not applicable to companies with exclusive agents or other forms of distribution.
The Property and Casualty Group markets and sells its insurance products through independent, non-exclusive agencies. These agencies are not obligated to sell only the Property and Casualty Group’s insurance products, and generally they also sell competitors’ insurance products. As a result, the Property and Casualty Group’s business depends in large part on the marketing and sales efforts of these agencies. To the extent these agencies’ marketing

13
efforts cannot be maintained at their current levels of volume or they bind the Property and Casualty Group to unacceptable insurance risks, fail to comply with established underwriting guidelines or otherwise improperly market the Property and Casualty Group’s products, the results of operations and business of the Property and Casualty Group could be adversely affected. Also, to the extent these agencies place business with competing insurers due to compensation arrangements, product differences, price differences, ease of doing business or other reasons, the results of operations of the Property and Casualty Group could be adversely affected. If the Property and Casualty Group is unsuccessful in maintaining and/or increasing the number of agencies in its independent agent distribution system, the results of operations of the Property and Casualty Group could be adversely affected. To the extent that consumer preferences cause the insurance industry to migrate to a delivery system other than independent agencies, the business of the Property and Casualty Group could be adversely affected. Also, to the extent the agencies choose to place significant portions or all of their business with competing insurance companies, the results of operations and business of the Property and Casualty Group could be adversely affected. Our ability to maintain our reputation is a key factor to the Property and Casualty Group’s success.
The Property and Casualty Group maintains a brand recognized for customer service. Incidents such as a failure to protect sensitive customer data, errors in processing a claim, long customer wait times, systems failures, agency disputes, unfavorable litigation or inappropriate social media communications, among others, may result in reputational harm to the Property and Casualty Group’s brand and the potential for a reduction in business. Further, if an extreme catastrophic event were to occur in a heavily concentrated area of policyholders, and extraordinarily high number of claims could have the potential to strain claims processing and affect our ability to satisfy our customers. The degree of control we have over these events varies significantly based upon the type of event. While we maintain and execute processes to minimize these events, we cannot completely eliminate this risk. The Property and Casualty Group faces significant competition from other regional and national insurance
companies. Failure to keep pace with competitors may result in lower market share and revenues, which may have a
material adverse affect on the Property and Casualty Group’s financial condition.
The Property and Casualty Group competes with regional and national property and casualty insurers including direct writers of insurance coverage. Many of these competitors are larger and many have greater financial, technical and operating resources. In addition, there is competition within each independent insurance agency that represents other carriers as well as the Property and Casualty Group. If we are unable to perform at industry best practice levels in terms of quality, cost containment, and speed-to-market due to inferior operating resources and/or problems with external relationships, the Property and Casualty Group’s business performance may suffer. As the business environment changes, if we are unable to adapt timely to emerging industry changes, or if our people do not conform to the changes, the Property and Casualty Group’s business could be materially impacted. The property and casualty insurance industry is highly competitive on the basis of product, price and service. If competitors offer property and casualty products with more coverage and/or better service or offer lower rates, and we are unable to implement product or service improvements quickly enough to keep pace, the Property and Casualty Group’s ability to grow and renew its business may be adversely impacted. The internet continues to grow as a method of product distribution, and as a preferred method of product and price comparison. We compete against established ‘direct to consumer’ insurers as well as insurers that use a combination of agent and online distribution. We expect the competitors in this channel to grow. Failure to position our distribution technology effectively in light of these trends and changing demographics could inhibit the Property and Casualty Group’s ability to grow and maintain its customer base. The Property and Casualty Group’s growth could also be adversely impacted by an inability to accommodate prospective customers based upon lack of geographic agency presence. Changes in applicable insurance laws, regulations or changes in the way regulators administer those laws or
regulations could adversely change the Property and Casualty Group’s operating environment and increase its
exposure to loss or put it at a competitive disadvantage.
Property and casualty insurers are subject to extensive supervision in the states in which they do business. This regulatory oversight includes, by way of example, matters relating to licensing examination, rate setting, market conduct, policy forms, limitations on the nature and amount of certain investments, claims practices, mandated

14
participation in involuntary markets and guaranty funds, reserve adequacy, insurer solvency, restrictions on underwriting standards, and transactions between affiliates. Such regulation and supervision are primarily for the benefit and protection of policyholders and not for the benefit of shareholders. For instance, members of the Property and Casualty Group are subject to involuntary participation in specified markets in various states in which they operate, and the rate levels the Property and Casualty Group is permitted to charge do not always correspond with the underlying costs associated with the coverage issued. Additionally, material transactions and agreements between Indemnity and the Exchange must be approved by the appropriate state insurance department(s). Although currently the federal government does not directly regulate the insurance industry, federal programs, such as federal terrorism backstop legislation and the Federal Insurance Office established under the Dodd-Frank Act can also impact the insurance industry. In addition to specific insurance regulation, the Property and Casualty Group must also comply with other regulatory, legal and ethical requirements relating to the general operation of a business.
Premium rates and reserves must be established for members of the Property and Casualty Group from forecasts of
the ultimate costs expected to arise from risks underwritten during the policy period. The Property and Casualty
Group’s underwriting profitability could be adversely affected to the extent such premium rates or reserves are too
low or by the effects of inflation.
One of the distinguishing features of the property and casualty insurance industry in general is that its products are priced before its costs are known, as premium rates are generally determined before losses are reported. Consequently, in establishing premium rates, we attempt to anticipate the potential impact of inflation, including medical cost inflation, construction and auto repair cost inflation and tort issues. Medical costs are a broad element of inflation that impact personal and commercial auto, general liability, workers compensation and commercial multi-peril lines of insurance written by the Property and Casualty Group. Accordingly, premium rates must be established from forecasts of the ultimate costs expected to arise from risks underwritten during the policy period. These premium rates may prove to be inadequate if future inflation is significantly higher than the inflation anticipated in pricing.
Further, property and casualty insurers establish reserves for losses and loss expenses that will not be paid and settled for many years. Numerous factors affect both the current estimates and final settlement value of these losses and loss expenses. It is possible that the ultimate liability for these losses and loss expenses will exceed these reserves because of unanticipated changes in the future development of known losses, the unanticipated emergence of losses that have occurred but are currently unreported, and larger than expected settlements on pending and unreported claims. The process of estimating reserves is inherently judgmental and can be influenced by factors that are subject to variation. If pricing or reserves of the Property and Casualty Group are not sufficient, the Property and Casualty Group’s underwriting profitability may be adversely impacted.
The property and casualty insurance industry has historically been cyclical with periods of intense price competition. The Property and Casualty Group seeks an appropriate balance between profitability and premium growth. Periods of intense price competition in the cycle could adversely affect the Property and Casualty Group’s financial condition, profitability, or cash flows.
Emerging claims and coverage issues in the insurance industry are unpredictable and could cause an adverse effect
on the Property and Casualty Group’s results of operations or financial condition.
As industry practices and legal, judicial, social and other environmental conditions change, unexpected and unintended issues related to claims and coverage may emerge. These issues may adversely affect the Property and Casualty Group’s business by either extending coverage beyond its underwriting intent or by increasing the number or size of claims. In some instances, these emerging issues may not become apparent for some time after the Property and Casualty Group has issued the affected insurance policies. As a result, the full extent of liability under the Property and Casualty Group’s insurance policies may not be known for many years after the policies are issued.
Changes in reserve estimates may adversely affect EFL’s operating results.
Reserves for life-contingent contract benefits are computed on the basis of long-term actuarial assumptions of future investment yields, mortality, morbidity, persistency and expenses. We periodically review the adequacy of these reserves on an aggregate basis and, if future experience differs significantly from assumptions, adjustments to reserves and amortization of deferred policy acquisition costs may be required, which could have a material adverse effect on EFL’s operating results.

15
The financial performance of members of the Property and Casualty Group could be adversely affected by severe
weather conditions or other catastrophic losses, including terrorism.
The Property and Casualty Group conducts business in 11 states and the District of Columbia, primarily in the Mid-Atlantic, Midwestern and Southeastern portions of the United States. A substantial portion of this business is private passenger and commercial automobile, homeowners and workers compensation insurance in Ohio, North Carolina, Maryland, Virginia and particularly, Pennsylvania. As a result, a single catastrophic occurrence, destructive weather pattern, change in climate condition, general economic trend, terrorist attack, regulatory development or other condition disproportionately affecting one or more of the states in which the Property and Casualty Group conducts substantial business could adversely affect the results of operations of members of the Property and Casualty Group. Common natural catastrophic events include hurricanes, earthquakes, tornadoes, hail storms and severe winter weather. The frequency and severity of these catastrophes is inherently unpredictable. The extent of losses from a catastrophe is a function of both the total amount of insured exposures in the area affected by the event and the severity of the event. Terrorist attacks could also cause losses from insurance claims related to the property and casualty insurance operations, as well as a decrease in our equity, net income or revenue. The federal Terrorism Risk Insurance Program Reauthorization and Extension Act of 2007 requires that some coverage for terrorist losses be offered by primary commercial property insurers and provides federal assistance for recovery of claims through 2014. While the Property and Casualty Group is exposed to terrorism losses in commercial lines and workers compensation, these lines are afforded a limited backstop above insurer deductibles for acts of terrorism under this federal program. The Property and Casualty Group has no personal lines terrorist coverage in place. The Property and Casualty Group could incur large net losses if terrorist attacks were to occur. The Property and Casualty Group maintains several property catastrophe reinsurance treaties that were renewed effective January 1, 2012, with a first treaty providing coverage of up to 90% of a loss of $500 million in excess of the Property and Casualty Group’s loss retention of $350 million per occurrence, and a second treaty providing coverage of up to 70% of a loss of $275 million in excess of $850 million. In addition, a third treaty was entered into with a nonaffiliated reinsurer providing coverage of up to 70% of a loss of $25 million in excess of $1.125 billion. These treaties exclude losses from acts of terrorism. Catastrophe reinsurance may prove inadequate if a major catastrophic loss exceeds the reinsurance limit which could adversely affect the Property and Casualty Group’s underwriting profitability and financial position. The inability to acquire reinsurance coverage at reasonable rates or collect amounts due from reinsurers could have
an adverse effect on the Property and Casualty Group.
The availability and cost of reinsurance are subject to prevailing market conditions, both in terms of price and available capacity. The availability of reinsurance capacity can be impacted by general economic conditions and conditions in the reinsurance market, such as the occurrence of significant reinsured events. The availability and cost of reinsurance could affect the Property and Casualty Group’s business volume and profitability. Although the reinsurer is liable to the Property and Casualty Group to the extent of the ceded reinsurance, the Property and Casualty Group remains liable as the direct insurer on all risks reinsured. Reinsurance contracts do not relieve the Property and Casualty Group from its primary obligations to policyholders. As a result, ceded reinsurance arrangements do not eliminate the Property and Casualty Group’s obligation to pay claims. Accordingly, the Property and Casualty Group is subject to credit risk with respect to its ability to recover amounts due from reinsurers. The Property and Casualty Group’s inability to collect a material recovery from a reinsurer could have an adverse effect on its underwriting profitability and financial condition. The performance of the Exchange’s investment portfolio is subject to a variety of investment risks, which may in turn
have a material adverse effect on its results of operations or financial condition.
The Exchange’s investment portfolio is comprised principally of fixed-income maturities, common stocks, and limited partnerships. At December 31, 2011, the Exchange’s investment portfolio consisted of approximately 65% fixed income securities, 20% common stocks, 10% limited partnerships, and 5% preferred equity securities. All of the Exchange’s marketable securities are subject to market volatility. To the extent that future market volatility negatively impacts the Exchange’s investments, its financial condition will be negatively impacted. We review the investment portfolio on a continuous basis to evaluate positions that might have incurred other-than-temporary

16
declines in value. The primary factors considered in our review of investment valuation include the extent and duration to which fair value is less than cost, historical operating performance and financial condition of the issuer, short- and long-term prospects of the issuer and its industry, specific events that occurred affecting the issuer including rating downgrades and, depending on the type of security, our intent to sell or our ability and intent to retain the investment for a period of time sufficient to allow for a recovery in value. As the process for determining impairments is highly subjective, changes in our assessments may have a material effect on the Exchange’s operating results and financial condition. See also Item 7A. “Quantitative and Qualitative Disclosures about Market Risk”. If the fixed-income, equity, or limited partnership portfolios were to suffer a substantial decrease in value, the Exchange’s financial position could be materially adversely affected through increased unrealized losses or impairments. A significant decrease in the Exchange’s portfolio could also put it, or its subsidiaries, at risk of failing to satisfy regulatory minimum capital requirements. Currently, 32% of the Exchange’s fixed-income portfolio is invested in financial sector securities and 19% is invested in municipal securities and results may vary depending on the market environment. The performance of the fixed-income portfolio is subject to a number of risks including:
• Interest rate risk – the risk of adverse changes in the value of fixed-income securities as a result of increases in market interest rates.
• Investment credit risk – the risk that the value of certain investments may decrease due to the deterioration in financial condition of, or the liquidity available to, one or more issuers of those securities or, in the case of asset-backed securities, due to the deterioration of the loans or other assets that underlie the securities, which, in each case, also includes the risk of permanent loss.
• Concentration risk – the risk that the portfolio may be too heavily concentrated in the securities of one or more issuers, sectors, or industries, which could result in a significant decrease in the value of the portfolio in the event of a deterioration of the financial condition, performance, or outlook of those issuers, sectors, or industries.
• Liquidity risk – the risk that the Exchange will not be able to convert investment securities into cash on favorable terms and on a timely basis, or that the Exchange will not be able to sell them at all, when desired. Disruptions in the financial markets, or a lack of buyers for the specific securities that the Exchange is trying to sell, could prevent it from liquidating securities or cause a reduction in prices to levels that are not acceptable to the Exchange.
The Exchange’s common and preferred equity securities have exposure to price risk, the risk of potential loss in estimated fair value resulting from an adverse change in prices. The Exchange does not hedge its exposure to equity price risk inherent in its equity investments. The Exchange’s common and preferred equity securities may also be subject to some of the same risks that affect the Exchange’s fixed-income portfolio, as discussed above. In addition, a portion of the Exchange’s portfolio is invested in limited partnerships. At December 31, 2011, the Exchange had investments in limited partnerships of $1.1 billion, or 8% of total assets. In addition, the Exchange is obligated to invest up to an additional $384 million in limited partnerships, including private equity, mezzanine debt, and real estate partnership investments. Limited partnerships are significantly less liquid and generally involve higher degrees of price risk than publicly traded securities. Limited partnerships, like publicly traded securities, have exposure to market volatility; but unlike fixed income securities, cash flows and return expectations are less predictable. The primary basis for the valuation of limited partnership interests are financial statements prepared by the general partner. Because of the timing of the preparation and delivery of these financial statements, the use of the most recently available financial statements provided by the general partners result in a quarter delay in the inclusion of the limited partnership results in our Consolidated Statements of Operations. Due to this delay, the Exchange’s financial statements at December 31, 2011, do not reflect market conditions experienced in the fourth quarter of 2011. Deteriorating capital and credit market conditions may significantly affect the Exchange’s ability to meet liquidity
needs and access capital.
Sufficient liquidity and capital levels are required to pay claims, claims-related expenses and income taxes as well as to build the Exchange’s investment portfolio, provide for additional protection against possible large, unexpected losses and maintain adequate surplus amounts. Management estimates the appropriate level of capital necessary based upon current and projected results, which include a factor for potential exposures based upon these Risk Factors.

17
Failure to accurately estimate the Exchange’s capital needs may have a material adverse effect on the Exchange’s financial condition until additional sources of capital can be located. Further, a deteriorating financial condition may create a negative perception of the Exchange by third parties, including rating agencies, investors, agents, and customers which could impact the Exchange’s ability to access additional capital in the debt or equity markets. The primary sources of liquidity for the Exchange are insurance premiums and cash flow generated from its investment portfolio. In the event the Exchange’s current sources do not satisfy its liquidity needs, the Exchange has the ability to access its $300 million bank revolving line of credit, from which there were no borrowings as of December 31, 2011, or sell assets in its investment portfolio. Volatility in the financial markets could impair the Exchange’s ability to sell certain of its fixed income securities or, to a greater extent, its significantly less liquid limited partnership investments, or cause such investments to sell at deep discounts. In the event these traditional sources of liquidity are not available, the Exchange may have to seek additional financing. The Exchange’s access to funds will depend upon a number of factors including current market conditions, the availability of credit to the financial services industry, market liquidity, and credit ratings. In deteriorating market conditions, the Exchange may not be able to obtain additional financing on favorable terms, or at all. If there were a failure to maintain a commercially acceptable financial strength rating, the Property and Casualty
Group’s competitive position in the insurance industry would be adversely affected.
Financial strength ratings are an important factor in establishing the competitive position of insurance companies and may be expected to have an effect on an insurance company’s sales. Higher ratings generally indicate greater financial stability and a stronger ability to meet ongoing obligations to policyholders. Ratings are assigned by rating agencies to insurers based upon factors that the rating agencies believe are relevant to policyholders. Currently the Property and Casualty Group’s pooled AM Best rating is an A+ (“superior”). A significant downgrade in this or other ratings would reduce the competitive position of the Property and Casualty Group making it more difficult to attract profitable business in the highly competitive property and casualty insurance market. The Property and Casualty Group is subject to claims and legal proceedings, which, if determined unfavorably to the
Property and Casualty Group, could have a material adverse effect on our business, results of operations or financial
condition.
The Property and Casualty Group faces a significant risk of litigation and regulatory investigations and actions in the ordinary course of operating its businesses including the risk of class action lawsuits. The Property and Casualty Group’s pending legal and regulatory actions include proceedings specific to the Property and Casualty Group and others generally applicable to business practices in the industries in which it operates. In the Property and Casualty Group’s insurance operations, we are, have been, or may become subject to class actions and individual suits alleging, among other things, issues relating to claims payments and procedures, denial or delay of benefits, charging excessive or impermissible fees on products, and breaching fiduciary or other duties to customers. The Property and Casualty Group is also subject to litigation arising out of its general business activities such as its contractual relationships. Plaintiffs in class action and other lawsuits against the Property and Casualty Group may seek very large or indeterminate amounts, including punitive and treble damages, which may remain unknown for substantial periods of time. The Property and Casualty Group is also subject to various regulatory inquiries, such as information requests, subpoenas and books and record examinations from state and federal regulators and authorities. See “Risk Factors Related to the Indemnity Shareholder Interest,” within this section for additional discussion of litigation risks. The Exchange is dependent upon Indemnity to perform certain services, including sales, underwriting, and the
issuance of policies. Failure to perform these services effectively may have a material adverse effect on the financial
condition of the Exchange.
Pursuant to the attorney-in-fact agreements with the policyholders at the Exchange, Indemnity is responsible for performing key functions for the Exchange including management and operational services, including the related technology systems. The Exchange has no employees, as Indemnity employs all personnel related to performing operating functions for the Exchange. In addition, the Board of Directors for Indemnity has the responsibility for such Exchange-related activities as setting the management fee paid by the Exchange to Indemnity. As a result, the business and financial condition of the Exchange would be materially adversely affected if Indemnity was not able to provide the necessary operating and management services required by the Exchange.
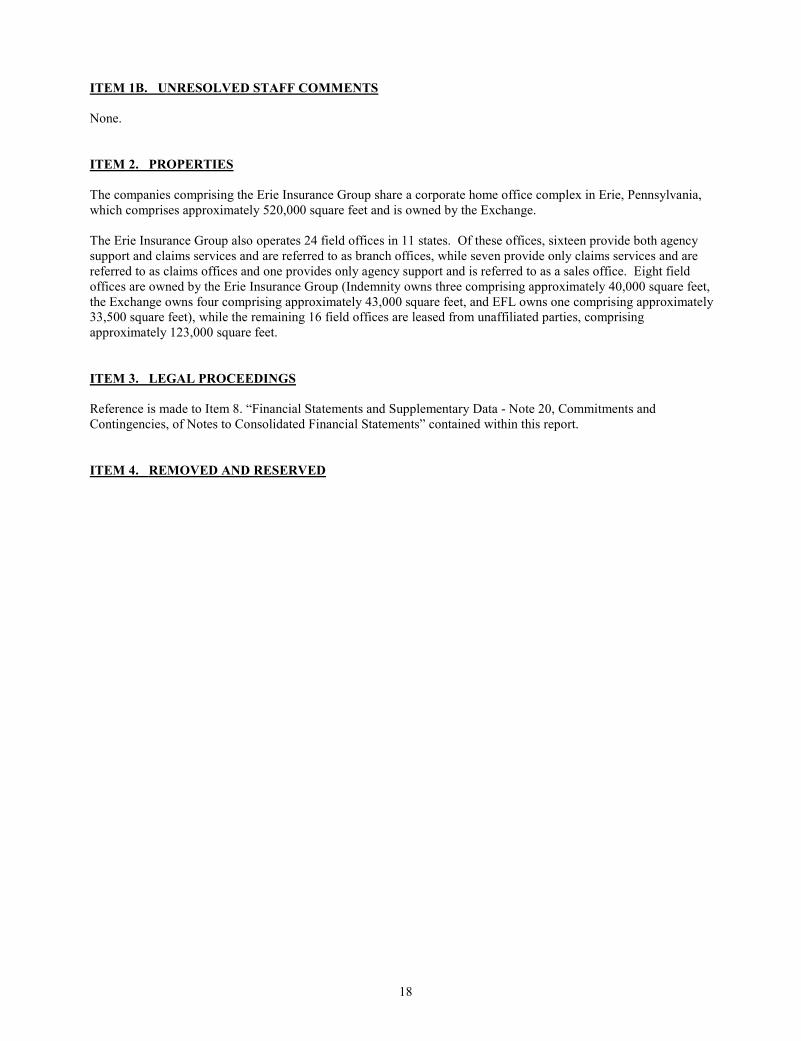
18
ITEM 1B. UNRESOLVED STAFF COMMENTS
None.
ITEM 2. PROPERTIES
The companies comprising the Erie Insurance Group share a corporate home office complex in Erie, Pennsylvania, which comprises approximately 520,000 square feet and is owned by the Exchange. The Erie Insurance Group also operates 24 field offices in 11 states. Of these offices, sixteen provide both agency support and claims services and are referred to as branch offices, while seven provide only claims services and are referred to as claims offices and one provides only agency support and is referred to as a sales office. Eight field offices are owned by the Erie Insurance Group (Indemnity owns three comprising approximately 40,000 square feet, the Exchange owns four comprising approximately 43,000 square feet, and EFL owns one comprising approximately 33,500 square feet), while the remaining 16 field offices are leased from unaffiliated parties, comprising approximately 123,000 square feet.
ITEM 3. LEGAL PROCEEDINGS
Reference is made to Item 8. “Financial Statements and Supplementary Data - Note 20, Commitments and Contingencies, of Notes to Consolidated Financial Statements” contained within this report.
ITEM 4. REMOVED AND RESERVED

19
PART II
ITEM 5. MARKET FOR REGISTRANT’S COMMON EQUITY, RELATED STOCKHOLDER MATTERS
AND ISSUER PURCHASES OF EQUITY SECURITIES
Common Stock Market Prices and Dividends
Indemnity’s Class A, non-voting common stock trades on The NASDAQ Stock MarketSM LLC under the symbol “ERIE.” No established trading market exists for the Class B voting common stock. American Stock Transfer & Trust Company serves as Indemnity’s transfer agent and registrar. As of February 17, 2012, there were approximately 841 beneficial shareholders of record for the Class A non-voting common stock and 11 beneficial shareholders of record for the Class B voting common stock. Historically, Indemnity has declared and paid cash dividends on a quarterly basis at the discretion of its Board of Directors. The payment and amount of future dividends on the common stock will be determined by the Board of Directors and will depend upon, among other things, Indemnity’s operating results, financial condition, cash requirements and general business conditions at the time such payment is considered. Indemnity’s common stock high and low sales prices and cash dividends declared for each full quarter of the last two years were as follows:
Indemnity Shareholder Interest
2011 2010
Cash dividend Cash dividend Sales price declared Sales price declared
Quarter ended High Low Class A Class B High Low Class A Class B
March 31 $71.11 $64.95 $0.5150 $ 77.250 $43.13 $38.03 $0.480 $ 72.00 June 30 72.44 67.14 0.5150 77.250 46.89 42.59 0.480 72.00 September 30 74.73 63.02 0.5150 77.250 56.20 44.38 0.480 72.00 December 31 80.30 69.36 0.5525 82.875 65.47 55.41 0.515 77.25
Total $2.0975 $314.625 $1.955 $293.25
Stock Performance The following graph depicts the cumulative total shareholder return (assuming reinvestment of dividends) for the periods indicated for Indemnity’s Class A common stock compared to the Standard & Poor’s 500 Stock Index, the Standard & Poor’s Property-Casualty Insurance Index, and the Standard & Poor’s Supercomposite Insurance Brokers Sub Industry Index. The comparison to the Standard & Poor’s Supercomposite Insurance Brokers Sub Industry Index was added in 2011 due to the sale of Indemnity’s property and casualty insurance subsidiaries to the Exchange, which occurred on December 31, 2010. After December 31, 2010, all property and casualty underwriting results accrue to the interest of the subscribers (policyholders) of the Exchange, or noncontrolling interest, and Indemnity functions solely as the management company.
2006 2007 2008 2009 2010 2011
Erie Indemnity Company Class A common stock $100 (1) $ 92 $71 $77 $132 $162
Standard & Poor's 500 Stock Index 100 (1) 105 67 84 97 99
Standard & Poor's Property-Casualty Insurance Index 100 (1) 87 62 69 75 75
Standard & Poor's Supercomposite Insurance Broker Sub Industry Index 100 (1) 94 44 49 57 53
(1) Assumes $100 invested at the close of trading, on the last trading day preceding the first day of the fifth preceding fiscal year, in
Indemnity’s Class A common stock, the Standard & Poor’s 500 Stock Index, the Standard & Poor’s Property-Casualty Insurance
Index, and the Standard & Poor’s Supercomposite Insurance Brokers Sub Industry Index.
2006
Dol
lars
2007 2008 2009 2010 2011
25
50
75
100
125
150
175 Erie Indemnity Company Class A common stock
Standard & Poor’s 500 Stock Index
Standard & Poor’s Property-Casualty InsuranceIndex
Standard & Poor’s Supercomposite InsuranceBrokers Sub Industry Index

20
Issuer Purchases of Equity Securities
A stock repurchase program was authorized by our Board of Directors on January 1, 2004, allowing the repurchase of up to $250 million of Indemnity’s outstanding Class A nonvoting common stock through December 31, 2006. Our Board of Directors approved continuations of this stock repurchase program for an additional $250 million in February 2006, $100 million in September 2007, and $100 million in April 2008. Subsequent continuations were approved for amounts that included and were not in addition to any unspent amounts under the current program of $100 million in May 2009, $100 million in April 2010, $150 million in December 2010, and most recently for $150 million in October 2011, which was authorized with no time limitation. As of February 17, 2012, we have approximately $128 million of repurchase authority remaining under this program. Indemnity may purchase shares, from time-to-time, in the open market or through privately negotiated transactions, depending upon prevailing market conditions and alternative uses of capital, and at times and in a manner that is deemed appropriate. During 2011, shares repurchased totaled 2.2 million at a total cost of $155 million. See Item 8. “Financial Statements and Supplementary Data – Note 18, Capital Stock, of Notes to Consolidated Financial Statements” contained within this report for discussion of additional shares repurchased outside of this program. The following table summarizes Indemnity’s Class A common stock repurchased each month, based upon trade date, during the quarter ended December 31, 2011:
(dollars in millions, except per
share data)
Period
Total Number of Shares
Purchased
Average Price Paid Per Share
Total Number of Shares Purchased as Part of Publicly
Announced Program
Approximate Dollar Value of Shares that May
Yet be Purchased Under the Program
October 1 – 31, 2011 156,465 $74.55 156,465 $149 November 1 – 30, 2011 75,773 74.83 75,773 143 December 1 – 31, 2011 73,467 76.58 73,467 138
Total 305,705 305,705

21
ITEM 6. SELECTED CONSOLIDATED FINANCIAL DATA ERIE INDEMNITY COMPANY
(dollars in millions, except share data) Years Ended December 31,
2011 2010 2009 2008 2007
Operating Data:
Premiums earned $ 4,214 $ 3,987 $ 3,869 $ 3,834 $ 3,832
Net investment income 433 433 433 438 451
Realized (losses) gains on investments (6) 307 286 (1,597) (5)
Equity in earnings (losses) of limited partnerships 149 128 (369) (58) 352
Other income 34 35 36 34 31
Total revenues 4,824 4,890 4,255 2,651 4,661
Net income (loss) 268 660 446 (616) 919 Less: Net income (loss) attributable to noncontrolling interest in consolidated entity – Exchange 99 498 338 (685) 706
Net income attributable to Indemnity 169 162 108 69 213
Per Share Data Attributable to Indemnity:
Net income per Class A share – diluted $ 3.08 $ 2.85 $ 1.89 $ 1.19 $ 3.43 Book value per share – Class A common and equivalent B shares 14.48 16.24 15.74 13.79 17.68
Dividends declared per Class A share 2.0975 1.955 1.83 1.77 1.64
Dividends declared per Class B share 314.625 293.25 274.50 265.50 246.00
Financial Position Data:
Total assets $14,348 $14,344 $13,287 $12,505 $14,104
Total equity 6,293 6,334 5,725 (1) 4,759 6,024
Less: Noncontrolling interest in consolidated entity – Exchange 5,512 5,422 4,823 (1) 3,967 4,973
Total equity attributable to Indemnity 781 912 902 (1) 792 (2) 1,051
(1) On April 1, 2009, we adopted the accounting guidance related to non-credit other-than-temporary impairments for our debt security
portfolio. The net impact of the cumulative effect adjustment on April 1, 2009 increased retained earnings and reduced other comprehensive income by $6 million, net of tax, related to the Indemnity shareholder interest and by $95 million, net of tax, related to the Exchange, or
noncontrolling interest, resulting in no effect on shareholders’ equity.
(2) On January 1, 2008, we adopted the fair value option for our common stock portfolio. The net impact of the cumulative effect adjustment
increased retained earnings and reduced other comprehensive income by $11 million, net of tax, related to the Indemnity shareholder interest resulting in no effect on shareholders’ equity.
Due to the sale of Indemnity’s property and casualty insurance subsidiaries to the Exchange on December 31, 2010, all property and casualty underwriting results and all investment results for these companies accrue to the interest of the subscribers (policyholders) of the Exchange, or noncontrolling interest, after December 31, 2010. Prior to and through December 31, 2010, the underwriting results retained by EIC and ENY and the investment results of EIC, ENY and EPC accrued to the Indemnity shareholder interest.

22
ITEM 7. MANAGEMENT’S DISCUSSION AND ANALYSIS OF FINANCIAL CONDITION AND RESULTS OF OPERATIONS
The following discussion of financial condition and results of operations highlights significant factors influencing the Erie Insurance Group (“we,” “us,” “our”). This discussion should be read in conjunction with the audited financial statements and related notes and all other items contained within this Annual Report on Form 10-K as they contain important information helpful in evaluating our financial condition and results of operations.
INDEX
Page Number
Cautionary Statement Regarding Forward-Looking Information 22
Recent Accounting Pronouncements 23
Operating Overview 24
Critical Accounting Estimates 29
Results of Operations 38
Management Operations 38
Property and Casualty Insurance Operations 40
Life Insurance Operations 46
Investment Operations 47
Financial Condition 50
Investments 50
Liabilities 54
Shareholders’ Equity 55
Impact of Inflation 55
Liquidity and Capital Resources 55
Transactions/Agreements Between Indemnity and Noncontrolling Interest (Exchange) 62
CAUTIONARY STATEMENT REGARDING FORWARD-LOOKING INFORMATION
"Safe Harbor" Statement under the Private Securities Litigation Reform Act of 1995:
Statements contained herein that are not historical fact are forward-looking statements and, as such, are subject to risks and uncertainties that could cause actual events and results to differ, perhaps materially, from those discussed herein. Forward-looking statements relate to future trends, events or results and include, without limitation, statements and assumptions on which such statements are based that are related to our plans, strategies, objectives, expectations, intentions and adequacy of resources. Examples of forward-looking statements are discussions relating to premium and investment income, expenses, operating results, agency relationships, and compliance with contractual and regulatory requirements. Forward-looking statements are not guarantees of future performance and involve risks and uncertainties that are difficult to predict. Therefore, actual outcomes and results may differ materially from what is expressed or forecasted in such forward-looking statements. Among the risks and uncertainties, in addition to those set forth in our filings with the Securities and Exchange Commission, that could cause actual results and future events to differ from those set forth or contemplated in the forward-looking statements include the following: Risk factors related to the Erie Indemnity Company (“Indemnity”) shareholder interest:
• dependence upon Indemnity’s relationship with the Exchange and the management fee under the agreement with the subscribers at the Exchange;
• costs of providing services to the Exchange under the subscriber’s agreement; • ability to attract and retain talented management and employees; • ability to maintain uninterrupted business operations, including information technology systems; • factors affecting the quality and liquidity of Indemnity’s investment portfolio; • credit risk from the Exchange; • Indemnity’s ability to meet liquidity needs and access capital; and • outcome of pending and potential litigation against Indemnity.
23
Risk factors related to the non-controlling interest owned by the Erie Insurance Exchange (“Exchange”), which includes the Property and Casualty Group and EFL:
• general business and economic conditions; • dependence upon the independent agency system; • ability to maintain our reputation for customer service; • factors affecting insurance industry competition; • changes in government regulation of the insurance industry; • premium rates and reserves must be established from forecasts of ultimate costs; • emerging claims, coverage issues in the industry, and changes in reserve estimates related to the property and
casualty business; • changes in reserve estimates related to the life business; • severe weather conditions or other catastrophic losses, including terrorism; • the Exchange’s ability to acquire reinsurance coverage and collectability from reinsurers; • factors affecting the quality and liquidity of the Exchange’s investment portfolio; • the Exchange’s ability to meet liquidity needs and access capital; • the Exchange’s ability to maintain an acceptable financial strength rating; • outcome of pending and potential litigation against the Exchange; and • dependency upon the service provided by Indemnity.
A forward-looking statement speaks only as of the date on which it is made and reflects Indemnity’s analysis only as of that date. Indemnity undertakes no obligation to publicly update or revise any forward-looking statement, whether as a result of new information, future events, changes in assumptions, or otherwise.
RECENT ACCOUNTING PRONOUNCEMENTS See Item 8. “Financial Statements and Supplementary Data - Note 2, Significant Accounting Policies, of Notes to Consolidated Financial Statements” contained within this report for a discussion of recently issued accounting pronouncements, none of which are expected to have a material impact on our future financial condition, results of operations or cash flows.
24
OPERATING OVERVIEW
Overview
The Erie Insurance Group represents the consolidated results of Indemnity and the results of its variable interest entity, the Exchange. The Erie Insurance Group operates predominantly as a property and casualty insurer through its regional insurance carriers that write a broad range of personal and commercial coverages. Our property and casualty insurance companies include the Exchange and its wholly owned subsidiaries, Erie Insurance Company (“EIC”), Erie Insurance Company of New York (“ENY”), Erie Insurance Property and Casualty Company (“EPC”) and Flagship City Insurance Company (“Flagship”) (1). These entities operate collectively as the “Property and Casualty Group.” The Erie Insurance Group also operates as a life insurer through the Exchange’s wholly owned subsidiary, Erie Family Life Insurance Company (“EFL”), which underwrites and sells individual and group life insurance policies and fixed annuities (2).
The Exchange is a reciprocal insurance exchange, which is an unincorporated association of individuals, partnerships and corporations that agree to insure one another. Each applicant for insurance to the Exchange signs a subscriber’s agreement, which contains an appointment of Indemnity as their attorney-in-fact to transact the business of the Exchange on their behalf.
Pursuant to the subscriber’s agreement and for its services as attorney-in-fact, Indemnity earns a management fee calculated as a percentage of the direct premiums written by the Exchange and the other members of the Property and Casualty Group, which are assumed by the Exchange under an intercompany pooling arrangement.
The Indemnity shareholder interest includes Indemnity’s equity and income, but not the equity or income of the Exchange. The Exchange’s equity, which is comprised of its retained earnings and accumulated other comprehensive income, is held for the interest of its subscribers (policyholders) and meets the definition of a noncontrolling interest, which is reflected as such in our consolidated financial statements.
“Indemnity shareholder interest” refers to the interest in Erie Indemnity Company owned by the Class A and Class B shareholders. “Noncontrolling interest” refers to the interest in the Erie Insurance Exchange held for the interest of the subscribers (policyholders).
Indemnity shareholder interest in income generally comprises:
• a management fee of up to 25% of all property and casualty insurance premiums written or assumed by the Exchange, less the costs associated with the sales, underwriting and issuance of these policies;
• a 0% interest in the net underwriting results of the property and casualty insurance operations after December 31, 2010 (the interest was 5.5% prior to December 31, 2010) (1);
• a 0% equity interest in the net earnings of EFL after March 31, 2011 (the interest was 21.6% prior to March 31, 2011) (2);
• net investment income and results on investments that belong to Indemnity (1); and • other income and expenses, including income taxes, that are the responsibility of Indemnity.
The Exchange’s or the noncontrolling interest in income generally comprises:
• a 100% interest in the net underwriting results of the property and casualty insurance operations after December 31, 2010 (the interest was 94.5% prior to December 31, 2010) (1);
• a 100% equity interest in the net earnings of EFL after March 31, 2011 (the interest was 78.4% prior to March 31, 2011) (2);
• net investment income and results on investments that belong to the Exchange and its subsidiaries, including EFL (1); and
• other income and expenses, including income taxes, that are the responsibility of the Exchange and its subsidiaries.
(1) Prior to and through December 31, 2010, the underwriting results retained by EIC and ENY and the investment results of EIC, ENY and EPC
accrued to the Indemnity shareholder interest. Due to the sale of Indemnity’s property and casualty insurance subsidiaries to the Exchange on
December 31, 2010, all property and casualty underwriting results and all investment results for these companies accrue to the interest of the subscribers (policyholders) of the Exchange, or noncontrolling interest, after December 31, 2010.
(2) Prior to and through March 31, 2011, Indemnity retained a 21.6% ownership interest in EFL, which accrued to the Indemnity shareholder
interest, and the Exchange retained a 78.4% ownership interest in EFL, which accrued to the interest of the subscribers (policyholders) of the
Exchange, or noncontrolling interest. Due to the sale of Indemnity’s 21.6% ownership interest in EFL to the Exchange on March 31, 2011, 100% of EFL’s life insurance results accrue to the interest of the subscribers (policyholders) of the Exchange, or noncontrolling interest, after
March 31, 2011.
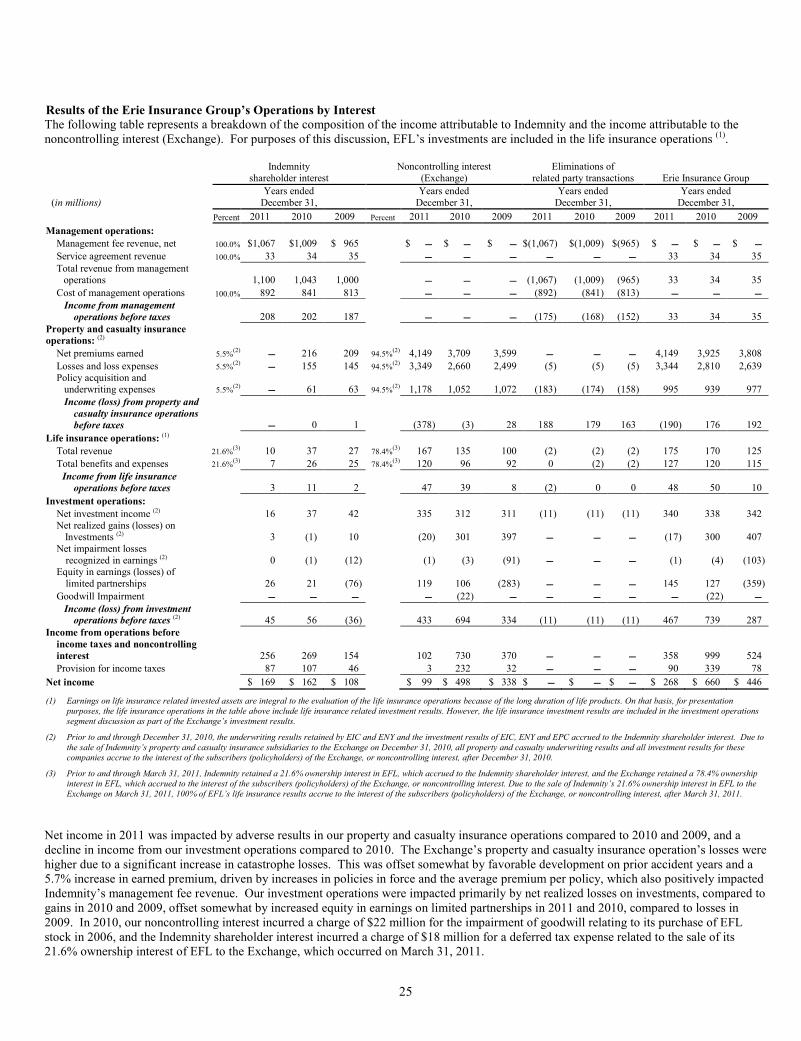
25
Results of the Erie Insurance Group’s Operations by Interest
The following table represents a breakdown of the composition of the income attributable to Indemnity and the income attributable to the noncontrolling interest (Exchange). For purposes of this discussion, EFL’s investments are included in the life insurance operations (1).
Indemnity shareholder interest
Noncontrolling interest (Exchange)
Eliminations of related party transactions Erie Insurance Group
(in millions) Years ended
December 31, Years ended
December 31, Years ended
December 31, Years ended
December 31,
Percent 2011 2010 2009 Percent 2011 2010 2009 2011 2010 2009 2011 2010 2009
Management operations:
Management fee revenue, net 100.0% $1,067 $1,009 $ 965 $ U $ U $ U $(1,067) $(1,009) $(965) $ U $ U $ U
Service agreement revenue 100.0% 33 34 35 U U U U U U 33 34 35
Total revenue from management operations 1,100 1,043 1,000 U U U (1,067) (1,009) (965) 33 34 35
Cost of management operations 100.0% 892 841 813 U U U (892) (841) (813) U U U
Income from management
operations before taxes 208 202 187 U U U (175) (168) (152) 33 34 35
Property and casualty insurance
operations: (2)
Net premiums earned 5.5%(2)
U 216 209 94.5%(2)
4,149 3,709 3,599 U U U 4,149 3,925 3,808
Losses and loss expenses 5.5%(2)
U 155 145 94.5%(2)
3,349 2,660 2,499 (5) (5) (5) 3,344 2,810 2,639 Policy acquisition and underwriting expenses 5.5%
(2) U 61 63 94.5%
(2) 1,178 1,052 1,072 (183) (174) (158) 995 939 977
Income (loss) from property and
casualty insurance operations
before taxes U 0 1 (378) (3) 28 188 179 163 (190) 176 192
Life insurance operations: (1)
Total revenue 21.6%(3)
10 37 27 78.4%(3)
167 135 100 (2) (2) (2) 175 170 125
Total benefits and expenses 21.6%(3)
7 26 25 78.4%(3)
120 96 92 0 (2) (2) 127 120 115
Income from life insurance
operations before taxes 3 11 2 47 39 8 (2) 0 0 48 50 10
Investment operations:
Net investment income (2) 16 37 42 335 312 311 (11) (11) (11) 340 338 342 Net realized gains (losses) on
Investments (2) 3 (1) 10 (20) 301 397 U U U (17) 300 407 Net impairment losses
recognized in earnings (2) 0 (1) (12) (1) (3) (91) U U U (1) (4) (103) Equity in earnings (losses) of
limited partnerships 26 21 (76) 119 106 (283) U U U 145 127 (359)
Goodwill Impairment U U U U (22) U U U U U (22) U
Income (loss) from investment
operations before taxes (2) 45 56 (36) 433 694 334 (11) (11) (11) 467 739 287
Income from operations before
income taxes and noncontrolling
interest 256 269 154 102 730 370 U U U 358 999 524
Provision for income taxes 87 107 46 3 232 32 U U U 90 339 78
Net income $ 169 $ 162 $ 108 $ 99 $ 498 $ 338 $ U $ U $ U $ 268 $ 660 $ 446
(1) Earnings on life insurance related invested assets are integral to the evaluation of the life insurance operations because of the long duration of life products. On that basis, for presentation
purposes, the life insurance operations in the table above include life insurance related investment results. However, the life insurance investment results are included in the investment operations
segment discussion as part of the Exchange’s investment results.
(2) Prior to and through December 31, 2010, the underwriting results retained by EIC and ENY and the investment results of EIC, ENY and EPC accrued to the Indemnity shareholder interest. Due to
the sale of Indemnity’s property and casualty insurance subsidiaries to the Exchange on December 31, 2010, all property and casualty underwriting results and all investment results for these
companies accrue to the interest of the subscribers (policyholders) of the Exchange, or noncontrolling interest, after December 31, 2010.
(3) Prior to and through March 31, 2011, Indemnity retained a 21.6% ownership interest in EFL, which accrued to the Indemnity shareholder interest, and the Exchange retained a 78.4% ownership
interest in EFL, which accrued to the interest of the subscribers (policyholders) of the Exchange, or noncontrolling interest. Due to the sale of Indemnity’s 21.6% ownership interest in EFL to the
Exchange on March 31, 2011, 100% of EFL’s life insurance results accrue to the interest of the subscribers (policyholders) of the Exchange, or noncontrolling interest, after March 31, 2011.
Net income in 2011 was impacted by adverse results in our property and casualty insurance operations compared to 2010 and 2009, and a decline in income from our investment operations compared to 2010. The Exchange’s property and casualty insurance operation’s losses were higher due to a significant increase in catastrophe losses. This was offset somewhat by favorable development on prior accident years and a 5.7% increase in earned premium, driven by increases in policies in force and the average premium per policy, which also positively impacted Indemnity’s management fee revenue. Our investment operations were impacted primarily by net realized losses on investments, compared to gains in 2010 and 2009, offset somewhat by increased equity in earnings on limited partnerships in 2011 and 2010, compared to losses in 2009. In 2010, our noncontrolling interest incurred a charge of $22 million for the impairment of goodwill relating to its purchase of EFL stock in 2006, and the Indemnity shareholder interest incurred a charge of $18 million for a deferred tax expense related to the sale of its 21.6% ownership interest of EFL to the Exchange, which occurred on March 31, 2011.
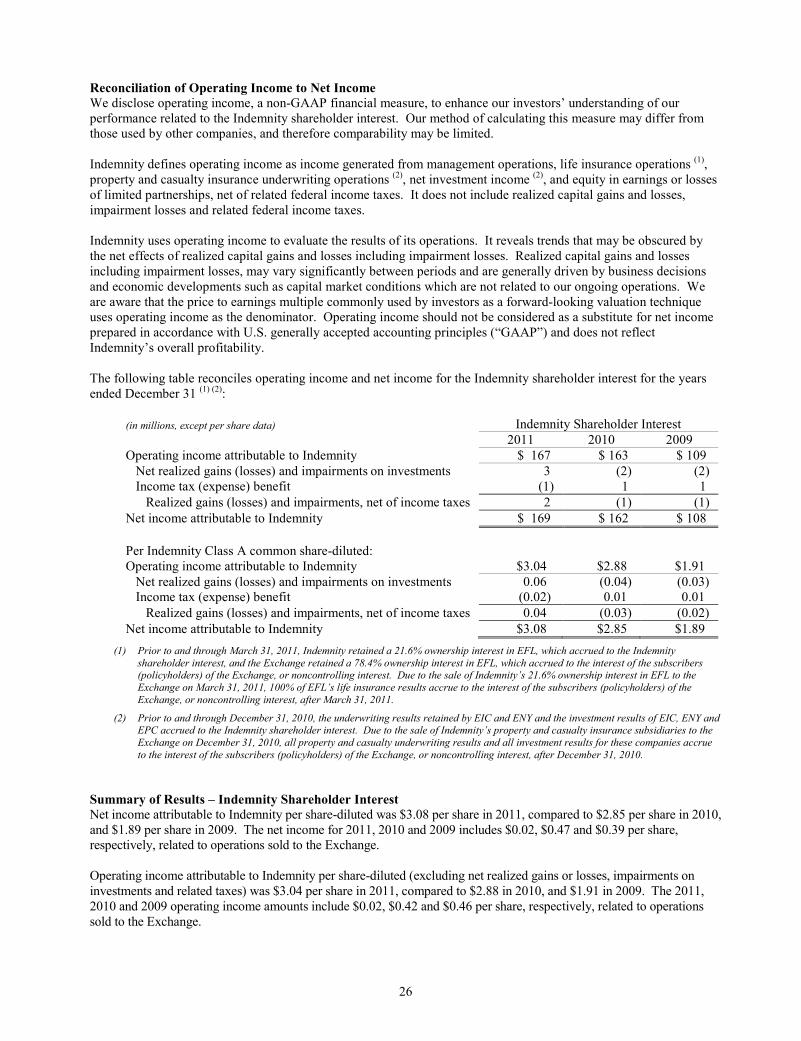
26
Reconciliation of Operating Income to Net Income We disclose operating income, a non-GAAP financial measure, to enhance our investors’ understanding of our performance related to the Indemnity shareholder interest. Our method of calculating this measure may differ from those used by other companies, and therefore comparability may be limited. Indemnity defines operating income as income generated from management operations, life insurance operations (1), property and casualty insurance underwriting operations (2), net investment income (2), and equity in earnings or losses of limited partnerships, net of related federal income taxes. It does not include realized capital gains and losses, impairment losses and related federal income taxes. Indemnity uses operating income to evaluate the results of its operations. It reveals trends that may be obscured by the net effects of realized capital gains and losses including impairment losses. Realized capital gains and losses including impairment losses, may vary significantly between periods and are generally driven by business decisions and economic developments such as capital market conditions which are not related to our ongoing operations. We are aware that the price to earnings multiple commonly used by investors as a forward-looking valuation technique uses operating income as the denominator. Operating income should not be considered as a substitute for net income prepared in accordance with U.S. generally accepted accounting principles (“GAAP”) and does not reflect Indemnity’s overall profitability. The following table reconciles operating income and net income for the Indemnity shareholder interest for the years ended December 31 (1) (2):
(in millions, except per share data) Indemnity Shareholder Interest
2011 2010 2009
Operating income attributable to Indemnity $ 167 $ 163 $ 109
Net realized gains (losses) and impairments on investments 3 (2) (2) Income tax (expense) benefit (1) 1 1
Realized gains (losses) and impairments, net of income taxes 2 (1) (1)
Net income attributable to Indemnity $ 169 $ 162 $ 108
Per Indemnity Class A common share-diluted: Operating income attributable to Indemnity $3.04 $2.88 $1.91
Net realized gains (losses) and impairments on investments 0.06 (0.04) (0.03) Income tax (expense) benefit (0.02) 0.01 0.01
Realized gains (losses) and impairments, net of income taxes 0.04 (0.03) (0.02)
Net income attributable to Indemnity $3.08 $2.85 $1.89
(1) Prior to and through March 31, 2011, Indemnity retained a 21.6% ownership interest in EFL, which accrued to the Indemnity
shareholder interest, and the Exchange retained a 78.4% ownership interest in EFL, which accrued to the interest of the subscribers (policyholders) of the Exchange, or noncontrolling interest. Due to the sale of Indemnity’s 21.6% ownership interest in EFL to the
Exchange on March 31, 2011, 100% of EFL’s life insurance results accrue to the interest of the subscribers (policyholders) of the
Exchange, or noncontrolling interest, after March 31, 2011.
(2) Prior to and through December 31, 2010, the underwriting results retained by EIC and ENY and the investment results of EIC, ENY and EPC accrued to the Indemnity shareholder interest. Due to the sale of Indemnity’s property and casualty insurance subsidiaries to the
Exchange on December 31, 2010, all property and casualty underwriting results and all investment results for these companies accrue
to the interest of the subscribers (policyholders) of the Exchange, or noncontrolling interest, after December 31, 2010.
Summary of Results – Indemnity Shareholder Interest
Net income attributable to Indemnity per share-diluted was $3.08 per share in 2011, compared to $2.85 per share in 2010, and $1.89 per share in 2009. The net income for 2011, 2010 and 2009 includes $0.02, $0.47 and $0.39 per share, respectively, related to operations sold to the Exchange. Operating income attributable to Indemnity per share-diluted (excluding net realized gains or losses, impairments on investments and related taxes) was $3.04 per share in 2011, compared to $2.88 in 2010, and $1.91 in 2009. The 2011, 2010 and 2009 operating income amounts include $0.02, $0.42 and $0.46 per share, respectively, related to operations sold to the Exchange.

27
Operating Segments
Our reportable segments include management operations, property and casualty insurance operations, life insurance operations and investment operations. Management operations Management operations generate internal management fee revenue, which accrues to the Indemnity shareholder interest, as Indemnity provides services relating to the sales, underwriting and issuance of policies on behalf of the Exchange. Management fee revenue is based upon all premiums written or assumed by the Exchange and the management fee rate, which is not to exceed 25%. Our Board of Directors establishes the management fee rate at least annually, generally in December for the following year, and considers factors such as the relative financial strength of Indemnity and the Exchange and projected revenue streams. The management fee rate was set at 25% for 2011, 2010 and 2009. Our Board of Directors set the 2012 management fee rate again at 25%, its maximum level. Management fee revenue is eliminated upon consolidation. Property and casualty insurance operations The property and casualty insurance business is driven by premium growth, the combined ratio and investment returns. The property and casualty insurance industry is cyclical, with periods of rising premium rates and shortages of underwriting capacity followed by periods of substantial price competition and excess capacity. The cyclical nature of the insurance industry has a direct impact on the direct written premiums of the Property and Casualty Group. The property and casualty operation’s premium growth strategy focuses on growth by expansion of existing operations including a careful agency selection process and increased market penetration in existing operating territories. Expanding the size of our existing agency force of over 2,100 independent agencies, with nearly 9,500 licensed property and casualty representatives, will contribute to future growth as new agents build their books of business with the Property and Casualty Group. The property and casualty insurance operations insure preferred and standard risks while maintaining a disciplined underwriting approach. The Property and Casualty Group’s principal personal lines products based upon 2011 direct written premiums were private passenger automobile (47%) and homeowners (22%), and the principal commercial lines products were commercial multi-peril (12%), commercial automobile (7%) and workers compensation (7%). Pennsylvania, Maryland and Virginia made up 63% of the property and casualty lines insurance business direct written premium in 2011. Members of the Property and Casualty Group pool their underwriting results under an intercompany pooling agreement. Under the pooling agreement, the Exchange retains a 94.5% interest in the net underwriting results of the Property and Casualty Group, while EIC retains a 5.0% interest and ENY retains a 0.5% interest. Prior to and through December 31, 2010, the underwriting results retained by EIC and ENY accrued to the Indemnity shareholder interest. Due to the sale of Indemnity’s property and casualty insurance subsidiaries to the Exchange on December 31, 2010, all property and casualty underwriting results accrue to the interest of the subscribers (policyholders) of the Exchange, or noncontrolling interest, after December 31, 2010. The combined ratio, expressed as a percentage, is the key measure of underwriting profitability traditionally used in the property and casualty insurance industry. It is the sum of the ratio of losses and loss expenses to premiums earned (loss ratio) plus the ratio of policy acquisition and other underwriting expenses to premiums earned (expense ratio). When the combined ratio is less than 100%, underwriting results are generally considered profitable; when the combined ratio is greater than 100%, underwriting results are generally considered unprofitable. Factors affecting loss and loss expenses include the frequency and severity of losses, the nature and severity of catastrophic losses, the quality of risks underwritten and underlying claims and settlement expenses. Investments held by the Property and Casualty Group are reported in the investment operations segment, separate from the underwriting business. Life insurance operations EFL generates revenues through the sale of its individual and group life insurance policies and fixed annuities. These products provide our property and casualty agency force an opportunity to cross-sell both personal and commercial accounts. EFL’s profitability depends principally on the ability to develop, price and distribute insurance products, attract and retain deposit funds, generate investment returns and manage expenses. Other drivers include mortality

28
and morbidity experience, persistency experience to enable the recovery of acquisition costs, maintenance of interest spreads over the amounts credited to deposit funds and the maintenance of strong ratings from rating agencies. Earnings on life insurance related invested assets are integral to the evaluation of the life insurance operations because of the long duration of life products. On that basis, for presentation purposes in the Management’s Discussion and Analysis, the life insurance operations include life insurance related investment results. However, for presentation purposes, in the segment footnote the life insurance investment results are included in the investment operations segment discussion as part of the Exchange’s investment results. Prior to and through March 31, 2011, Indemnity retained a 21.6% ownership interest in EFL, which accrued to the Indemnity shareholder interest, and the Exchange retained a 78.4% ownership interest in EFL, which accrued to the interest of the subscribers (policyholders) of the Exchange, or noncontrolling interest. Due to the sale of Indemnity’s 21.6% ownership interest in EFL to the Exchange on March 31, 2011, 100% of EFL’s life insurance results accrue to the interest of the subscribers (policyholders) of the Exchange, or noncontrolling interest, after March 31, 2011. Investment operations We generate revenues from our fixed maturity, equity security and limited partnership investment portfolios to support our underwriting business. The portfolios are managed with the objective of maximizing after-tax returns on a risk-adjusted basis. Management actively evaluates the portfolios for impairments. We record impairment writedowns on investments in instances where the fair value of the investment is substantially below cost, and we conclude that the decline in fair value is other-than-temporary. Our investment operations produced positive results despite periods of volatility in the financial markets during 2011. Net investment income of $433 million in 2011 was unchanged from 2010. During 2011, we incurred $2 million of impairment charges compared to $6 million in 2010. Net realized losses were $4 million in 2011, compared to net gains of $313 million in 2010, primarily reflecting the significant valuation gains on our common stock portfolio in 2010. Equity in earnings of limited partnerships was $149 million in 2011, compared to $128 million in 2010, as market conditions for these investments have generally remained favorable. The results from our limited partnerships are based upon financial statements received from our general partners, which are generally received on a quarter lag. As a result, our 2011 partnerships earnings do not reflect the market conditions experienced in the fourth quarter of 2011.
General Conditions and Trends Affecting Our Business
Economic conditions Unfavorable changes in economic conditions, including declining consumer confidence, inflation, high unemployment and the threat of recession, among others, may lead the Property and Casualty Group’s customers to modify coverage, not renew policies, or even cancel policies, which could adversely affect the premium revenue of the Property and Casualty Group, and consequently Indemnity’s management fee. These conditions could also impair the ability of customers to pay premiums when due, and as a result, the Property and Casualty Group’s bad debt write-offs could increase. Our key challenge is to generate profitable revenue growth in a highly competitive market that continues to experience the effects of uncertain economic conditions. Financial market volatility Our portfolio of fixed income, preferred and common stocks and limited partnerships are subject to market volatility especially in periods of instability in the worldwide financial markets. Depending upon market conditions, which are unpredictable and remain uncertain, considerable fluctuation could occur in our reported total investment income, which could have an adverse impact on our financial condition, results of operations and cash flows.

29
CRITICAL ACCOUNTING ESTIMATES
The consolidated financial statements include amounts based upon estimates and assumptions that have a significant effect on reported amounts of assets and liabilities at the date of the financial statements and the reported amounts of revenues and expenses during the reporting period and related disclosures. Management considers an accounting estimate to be critical if (1) it requires assumptions to be made that were uncertain at the time the estimate was made, and (2) different estimates that could have been used, or changes in the estimate that are likely to occur from period-to-period, could have a material impact on our Consolidated Statements of Operations or Financial Position. The following presents a discussion of those accounting policies surrounding estimates that we believe are the most critical to our reported amounts and require the most subjective and complex judgment. If actual events differ significantly from the underlying assumptions, there could be material adjustments to prior estimates that could potentially adversely affect our results of operations, financial condition and cash flows. The estimates and the estimating methods used are reviewed continually, and any adjustments considered necessary are reflected in current earnings.
Property and Casualty Insurance Loss and Loss Expense Reserves
Property and casualty insurance loss and loss expense reserves are established to provide for the estimated costs of paying claims under insurance policies written by us. These reserves include estimates for both claims that have been reported (case) and those that have been incurred but not reported (IBNR) and include estimates of all future payments associated with processing and settling these claims. The process of establishing loss reserves is complex and involves a variety of actuarial techniques. The loss reserve estimation process is based largely on the assumption that past development trends are an appropriate indicator of future events. Reserve estimates are based upon our assessment of known facts and circumstances, review of historical settlement patterns, estimates of trends in claims frequency and severity, legal theories of liability and other factors. Variables in the reserve estimation process can be affected by 1) internal factors, including changes in claims handling procedures and changes in the quality of risk selection in the underwriting process, and 2) external events, such as economic inflation and regulatory and legislative changes. Due to the inherent complexity of the assumptions used, final loss settlements may vary significantly from the current estimates, particularly when those settlements may not occur until well into the future. How reserves are established Case reserves are established by a claims handler on each individual claim and are adjusted as new information becomes known during the course of handling the claims. IBNR reserves represent the difference between the case reserves for actual reported loss and loss expenses and the estimated ultimate cost of all claims. Our loss and loss expense reserves include amounts related to short-tail and long-tail lines of business. Tail refers to the time period between the occurrence of a loss and the final settlement of the claim. The longer the time span between the incidence of a loss and the settlement of the claim, the more the ultimate settlement amount can vary. Most of our loss and loss expense reserves relate to long-tail liability lines of business including workers compensation, bodily injury and other liability coverages, such as commercial liability. Short-tail lines of business, which represent a smaller percentage of our loss reserves, include personal auto physical damage and personal property. Our actuaries review all direct reserve estimates on a quarterly basis for both current and prior accident years using the most current claim data. Reserves for massive injury lifetime medical claims, including auto no-fault and workers compensation claims, are reviewed at a more detailed level semi-annually. These massive injury claim reserves are relatively few in number and are very long-tail liabilities. In intervening quarters, development on massive injury reserves is monitored to confirm that the estimate of ultimate losses should not change. If an unusual development is observed, a detailed review is conducted to determine whether the reserve estimate should change. Significant changes to the factors discussed above, which are either known or reasonably projected through analysis of internal and external data, are quantified in the reserve estimates each quarter. The quarterly reserve reviews incorporate a variety of actuarial methods and judgments and involve rigorous analysis. A comprehensive review is performed of the various estimation methods and reserve levels produced by each. The various methods generate different estimates of ultimate losses by product line and product coverage combination. Thus, reserves are comprised of a set of point estimates of the ultimate losses developed from the various methods. These multiple reserve point estimates are reviewed by our reserving actuaries and reserve best estimates are selected. The selected reserve estimates are discussed with management.

30
Numerous factors are considered in setting reserve levels, including, but not limited to, the assessed reliability of key loss trends and assumptions that may significantly influence the current actuarial indications, the maturity of the accident year, pertinent claims frequency and severity trends observed over recent years, the level of volatility within a particular line of business and the improvement or deterioration of actuarial rate indications in the current period as compared to prior periods. Certain methods are considered more credible for each product/coverage combination depending on the maturity of the accident quarter, the mix of business and the particular internal and external influences impacting the claims experience or the method. The following is a discussion of the most common methods used: Paid development – Paid loss development patterns are generated from historical data organized by accident quarter and calendar quarter and applied to current paid losses by accident quarter to generate estimated ultimate losses. Paid development techniques do not use information about case reserves and therefore are not affected by changes in case reserving practices. These techniques are generally most useful for short-tailed lines since a high percentage of ultimate losses are paid in early periods of development. Incurred development – Incurred loss development patterns (reflecting cumulative paid losses plus current case reserves) are generated from historical data organized by accident quarter and calendar quarter. The patterns are applied to current incurred losses by accident quarter to generated estimated ultimate losses. Incurred methods and/or combinations of the paid and incurred methods are used in developing estimated ultimate losses for short-tail coverages, such as personal auto physical damage and personal property claims, and more mature accident quarters of long-tail coverages, such as personal auto liability claims and commercial liability claims, including workers compensation. Weather event paid and reported development – The historical patterns utilized in paid and reported development methods for weather events are derived from historical data for the same type of weather event. Initial weather event ultimate loss estimates are reviewed with claims management. Bornhuetter-Ferguson – Bornhuetter-Ferguson is a method of combining the expected-loss-ratio ultimate losses and the paid-or-incurred development ultimate losses. It places more weight on the paid-or-incurred development ultimate losses as an accident quarter matures. The Bornhuetter-Ferguson method is generally used on the first four to eight accident quarters on long-tail coverages because a low percentage of losses are paid in the early period of development. An expected loss ratio is developed through a review of historical loss ratios by accident quarter, adjusted for changes to earned premium, mix of business and other factors that are expected to impact the loss ratio for the accident quarter being evaluated. A preliminary estimate of ultimate losses is calculated by multiplying this expected loss ratio by earned premium. Survival ratio – This method measures the ratio of the average loss and loss expense amount paid annually to the total reserve for the product line or product coverage. The survival ratio represents the number of years of payments that the current level of reserves will cover. The reserve is established so that a particular ratio, representing the time to closing of all claims, is achieved. This method is also used as a reasonability check of reserve adequacy. Individual claim – This method estimates the ultimate losses on a claim-by-claim basis. An annual payment assumption is made for each claimant and then projected into the future based upon a particular assumption of the future inflation rate and life expectancy of the claimant. This method is used for unusual, large claims. Line of business methods For each product line and product/coverage combination, certain methods are given more influence than other methods. The discussion below gives a general indication of which methods are preferred for each line of business. As circumstances change, the methods that are given greater weight can change.
Massive injury lifetime medical claims (such as certain auto no-fault and workers compensation claims) –
These claims develop over a long period of time and are relatively few in number. We utilize the individual claim method to evaluate each claim’s ultimate losses.
Personal auto physical damage and homeowners – These lines are fast-developing, and paid and incurred development techniques are used. We rely primarily on incurred development techniques for the most recent accident months.
31
Personal auto liability (such as bodily injury and uninsured/underinsured motorist) – For auto liability, and bodily injury in particular, we review the results of a greater number of techniques than for physical damage. We use the Bornhuetter-Ferguson method for the first four to eight accident quarters and paid and incurred development methods for the older accident periods.
Workers compensation and long-tailed liability (such as commercial liability) – We generally rely upon the expected loss ratio, Bornhuetter-Ferguson and incurred development techniques. These techniques are generally weighted together, relying more heavily on the Bornhuetter-Ferguson method at early ages of development and more on the incurred development method as the accident periods mature.
The methods used for estimating loss expenses are as follows:
Defense and cost containment expenses (D&CC) – D&CC is analyzed using paid development techniques and an analysis of the relationship between D&CC payments and loss payments.
Adjusting and other expenses (A&O) – A&O reserves are projected based upon an expected cost per claim year, the anticipated claim closure pattern, and the ratio of paid A&O to paid loss.
Key assumptions for loss reserving The accuracy of the various methods used to estimate reserves is a function of the degree to which underlying assumptions are satisfied. The most significant key assumptions are:
Development patterns – Historical paid and incurred amounts contain patterns which indicate how unpaid and IBNR amounts will emerge in future periods. Unless reasons or factors are identified that invalidate the extension of historical patterns into the future, these patterns can be used to make projections necessary for estimating loss and loss adjustment expense reserves. This is the most significant assumption and it applies to all methods.
Impact of inflation – Property and casualty insurance reserves are established before the extent to which inflation may impact such reserves is known. Consequently, in establishing reserves, we attempt to anticipate the potential impact of inflation, including medical cost inflation, construction and auto repair cost inflation and tort issues. Medical costs are a broad element of inflation that impacts personal and commercial auto, general liability, workers compensation and commercial multi-peril lines of insurance written by the Property and Casualty Group. Inflation assumptions take the form of explicit numerical values in the survival ratio, individual claim, and massive injury lifetime medical reserving methods. Inflation assumptions are implicitly derived through the selection of applicable loss development patterns for all other reserving methods. Occasionally, unusual aberrations in loss development patterns are caused by external and internal factors such as changes in claim reporting and/or settlement patterns, unusually large losses, process changes, legal or regulatory changes, and other influences. In these instances, analyses of alternate development factor selections are performed to evaluate the effect of these factors and actuarial judgment is applied to make appropriate assumptions needed to develop a best estimate of ultimate losses.
Claims with atypical emergence patterns – Characteristics of certain subsets of claims, such as those with high severity, have the potential to distort patterns contained in historical paid loss and reported loss data. When testing indicates this to be the case for a particular subset of claims, our actuaries segregate these claims from the data and analyze them separately.
Future cost increases and claimant mortality – Future cost increase assumptions are derived from a review of historical cost increases and are assumed to persist into the future. Future medical cost increases and claimant mortality assumptions utilized in the reserve estimates for massive injury lifetime medical claims are obtained from industry studies adjusted for our own experience. Reserve levels are sensitive to these assumptions because they represent projections over 30 to 40 years into the future.
Changes in loss ratio trends – Prior loss ratio assumptions utilized in the Bornhuetter-Ferguson method are derived from projections of historical loss ratios based upon actual experience from more mature accident periods adjusted for assumed changes in average premiums, frequency and severity. These assumptions influence only the most recent accident periods, but the majority of reserves originate with the most recent accident periods. Reserve levels are highly sensitive to these assumptions.
Relationship of loss expense to losses – D&CC-to-loss ratio assumptions utilized in the Bornhuetter-Ferguson method are initially derived from historical relationships. These historical ratios are adjusted according to the impact of changing internal and external factors. The A&O-to-loss ratio assumption is similarly derived from historical relationships and adjusted as required for identified internal or external changes.

32
Reserve estimate variability The property and casualty reserves with the greatest potential for variation are the massive injury lifetime medical reserves. The automobile no-fault law in Pennsylvania before 1986 and workers compensation policies provide for unlimited medical benefits. The estimate of ultimate liabilities for these claims is subject to significant judgment due to variations in claimant health, mortality over time and health care cost trends. Workers compensation massive injury claims have been segregated from the total population of claims. Ultimate losses for these claims are estimated on a claim-by-claim basis. An annual payment assumption is made for each of the claimants who have sustained massive injuries. We are currently reserving for about 285 claimants requiring lifetime medical care, of which 110 involve massive injuries. The annual payment is projected into the future based upon particular assumptions of the future inflation rate and life expectancy of the claimant. The most significant variable in estimating this liability is medical cost inflation. The life expectancy (mortality rate) assumption underlying the estimate reflects experience to date. Actual experience, however, may emerge in a manner that is different relative to the original assumptions, which could have a significant impact on our reserve estimates.
Loss reserves are set at full expected cost, except for workers compensation loss reserves, which are discounted on a nontabular basis using an interest rate of 2.5% and our historical workers compensation payout patterns. In 2009, we changed our workers compensation discounting method to segregate the workers compensation massive injury claims that have longer payout patterns from the non-massive injury workers compensation claims, and continue to use this methodology in 2011.
Auto no-fault (massive injury lifetime medical claims) – The automobile massive injury reserve carried by the Property and Casualty Group totaled $356 million at December 31, 2011, compared to $440 million at December 31, 2010. The decrease in the pre-1986 automobile massive injury reserves in 2011, compared to 2010, was primarily due to improved annual claims cost expectations and the closing of four massive injury lifetime medical claims. A 100-basis point increase in the medical cost inflation assumption would result in an increase in the Property and Casualty Group’s liability of $61 million.
Workers compensation (massive injury lifetime medical claims) – The workers compensation massive injury reserve carried by the Property and Casualty Group totaled $99 million at December 31, 2011, compared to $154 million at December 31, 2010. The decrease in the workers compensation massive injury reserves in 2011, compared to 2010, was primarily due to the closing of seven massive injury lifetime medical claims. The discount on these reserves was $37 million at December 31, 2011. A 100-basis point increase in the medical cost inflation assumption would result in an increase in the Property and Casualty Group’s liability of $26 million and an increase in the discount of $19 million at December 31, 2011.
Workers compensation reserves, excluding massive injury lifetime medical claims, are also subject to discounting. The discount on these reserves was $46 million at December 31, 2011. A 100-basis point increase in the discount rate would decrease these reserves by $16 million.
We also perform analyses to evaluate the adequacy of past total reserve levels for the Property and Casualty Group. Using subsequent information, we perform retrospective reserve analyses to test whether previously established estimates for reserves were reasonable. Our 2011 retrospective reserve analysis for the loss reserve balance at December 31, 2010 indicated that direct reserves, including salvage and subrogation recoveries, were over-estimated by approximately $276 million, or 7.7% of the reserve estimate at December 31, 2010. In 2010, our retrospective reserve analysis indicated that direct reserves, including salvage and subrogation recoveries, were over-estimated by approximately $188 million, or 5.2% of the reserve estimate at December 31, 2009; and in 2009, our retrospective reserve analysis indicated that direct reserves, including salvage and subrogation recoveries, were over-estimated by approximately $30 million, or 0.8% of the reserve estimate at December 31, 2008. See an additional discussion of our reserve development in the “Prior year loss reserve development” section.
Due to the sale of Indemnity’s property and casualty insurance subsidiaries to the Exchange on December 31, 2010, all property and casualty loss and loss expense reserves accrue to the interest of the subscribers (policyholders) of the Exchange, or noncontrolling interest, after December 31, 2010.
Life Insurance and Annuity Policy Reserves
Reserves for traditional life insurance future policy benefits are computed primarily by the net level premium method. Generally, benefits are payable over an extended period of time and related reserves are calculated as the present value of future expected benefits to be paid reduced by the present value of future expected net premiums. Such reserves are established based upon methods and underlying assumptions in accordance with generally accepted accounting principles and applicable actuarial standards. Principal assumptions used in the establishment of policy reserves are

33
mortality, lapses, expenses and investment yields. Mortality assumptions are based upon tables typically used in the industry, modified to reflect actual experience and to include a provision for the risk of adverse deviation where appropriate. Lapse, expense and investment yield assumptions are based upon actual company experience and may include a provision for the risk of adverse deviation. Assumptions on these policies are locked in at the time of issue and are not subject to change unless a premium deficiency exists. A premium deficiency exists if, based upon revised assumptions, the existing contract liabilities together with the present value of future gross premiums are not sufficient to cover the present value of future expected benefits and maintenance costs and to recover unamortized acquisition costs. Historically, our reserves plus expected gross premiums have been demonstrated to be sufficient. There were no premium deficiencies in 2011, 2010 or 2009.
Reserves for income-paying annuity future policy benefits are computed as the present value of future expected benefits. Principal assumptions used in the establishment of policy reserves are mortality and investment yields. Interest rates used to discount future expected benefits are set at the policy level and range from 2.25% to 9.0%. The equivalent aggregate interest rate is 5.65%. If the aggregate interest rate was reduced by 100 basis points, the present value of future expected benefits would increase by $19 million at December 31, 2011.
Reserves for universal life and deferred annuity plans are based upon the contract account balance without reduction for surrender charges.
Investment Valuation
We make estimates concerning the valuation of all investments. Valuation techniques are used to derive the fair value of the available-for-sale and trading securities we hold. Fair value is the price that would be received to sell an asset in an orderly transaction between willing market participants at the measurement date.
Fair value measurements are based upon observable and unobservable inputs. Observable inputs reflect market data obtained from independent sources, while unobservable inputs reflect our view of market assumptions in the absence of observable market information. We utilize valuation techniques that maximize the use of observable inputs and minimize the use of unobservable inputs.
For purposes of determining whether the market is active or inactive, the classification of a financial instrument was based upon the following definitions:
• An active market is one in which transactions for the assets being valued occur with sufficient frequency and volume to provide reliable pricing information.
• An inactive (illiquid) market is one in which there are few and infrequent transactions, where the prices are not current, price quotations vary substantially, and/or there is little information publicly available for the asset being valued.
We continually assess whether or not an active market exists for all of our investments and as of each reporting date re-evaluate the classification in the fair value hierarchy. All assets carried at fair value are classified and disclosed in one of the following three categories:
• Level 1 – Quoted prices for identical instruments in active markets not subject to adjustments or discounts.
• Level 2 – Quoted prices for similar instruments in active markets; quoted prices for identical or similar instruments in markets that are not active; and model-derived valuations whose inputs are observable or whose significant value drivers are observable.
• Level 3 – Instruments whose significant value drivers are unobservable and reflect management’s estimate of fair value based upon assumptions used by market participants in an orderly transaction as of the valuation date.
Level 1 primarily consists of publicly traded common stock, nonredeemable preferred stock and Treasury securities and reflects market data obtained from independent sources, such as prices obtained from an exchange or a nationally recognized pricing service for identical instruments in active markets.
Level 2 includes those financial instruments that are valued using industry-standard models that consider various inputs, such as the interest rate and credit spread for the underlying financial instruments. All significant inputs are observable, or derived from observable information in the marketplace, or are supported by observable levels at which transactions are executed in the marketplace. Financial instruments in this category primarily include municipal securities, asset backed securities, collateralized-mortgage obligations, foreign and domestic corporate bonds and redeemable preferred stock and certain nonredeemable preferred stock.

34
Level 3 securities are valued based upon unobservable inputs, reflecting our estimates of value based upon assumptions used by market participants. Securities are assigned to Level 3 in cases where non-binding broker quotes are significant to the valuation and there is a lack of transparency as to whether these quotes are based upon information that is observable in the marketplace. Fair value estimates for securities valued using unobservable inputs require significant judgment due to the illiquid nature of the market for these securities and represent the best estimate of the fair value that would occur in an orderly transaction between willing market participants at the measurement date under current market conditions. Fair value for these securities are generally determined using comparable securities or non-binding broker quotes received from outside broker dealers based upon security type and market conditions. Remaining un-priced securities are valued using an estimate of fair value based upon indicative market prices that include significant unobservable inputs not based upon, nor corroborated by, market information, including the utilization of discounted cash flow analyses which have been risk-adjusted to take into account illiquidity and other market factors. This category primarily consists of certain private preferred stock and bond securities as well as collateralized debt and loan obligations.
As of each reporting period, financial instruments recorded at fair value are classified based upon the lowest level of input that is significant to the fair value measurement. The presence of at least one unobservable input would result in classification as a Level 3 instrument. Our assessment of the significance of a particular input to the fair value measurement requires judgment, and considers factors specific to the asset, such as the relative impact on the fair value as a result of including a particular input and market conditions. We did not make any other significant judgments except as described above.
Estimates of fair values for our investment portfolio are obtained primarily from a nationally recognized pricing service. Our Level 1 category includes those securities valued using an exchange traded price provided by the pricing service. The methodologies used by the pricing service that support a Level 2 classification of a financial instrument include multiple verifiable, observable inputs including benchmark yields, reported trades, broker/dealer quotes, issuer spreads, two-sided markets, benchmark securities, bids, offers and reference data. Pricing service valuations for Level 3 securities are based upon proprietary models and are used when observable inputs are not available in illiquid markets. In limited circumstances we adjust the price received from the pricing service when in our judgment a better reflection of fair value is available based upon corroborating information and our knowledge and monitoring of market conditions such as a disparity in price of comparable securities and/or non-binding broker quotes.
We perform continuous reviews of the prices obtained from the pricing service. This includes evaluating the methodology and inputs used by the pricing service to ensure we determine the proper classification level of the financial instrument. Price variances, including large periodic changes, are investigated and corroborated by market data. We have reviewed the pricing methodologies of our pricing service as well as other observable inputs, such as benchmark yields, reported trades, issuer spreads, two-sided markets, benchmark securities, bids, offers, reference data, and transaction volumes and believe that their prices adequately consider market activity in determining fair value. Our review process continues to evolve based upon accounting guidance and requirements.
In cases in which a price from the pricing service is not available, values are determined by obtaining non-binding broker quotes and/or market comparables. When available, we obtain multiple quotes for the same security. The ultimate value for these securities is determined based upon our best estimate of fair value using corroborating market information. Our evaluation includes the consideration of benchmark yields, reported trades, issuer spreads, two-sided markets, benchmark securities, bids, offers and reference data.
Investments are evaluated monthly for other-than-temporary impairment loss. Some factors considered in evaluating whether or not a decline in fair value is other-than-temporary include:
• the extent and duration for which fair value is less than cost; • historical operating performance and financial condition of the issuer; • short- and long-term prospects of the issuer and its industry based upon analysts’ recommendations; • specific events that occurred affecting the issuer, including rating downgrades; • our intent to sell or more likely than not be required to sell (debt securities); and • our ability and intent to retain the investment for a period of time sufficient to allow for a recovery in value
(equity securities).
For debt securities in which we do not expect full recovery of amortized cost, the security is deemed to be credit-impaired. Credit-related impairments and impairments on securities we intend to sell or more likely than not will be required to sell are recorded in the Consolidated Statements of Operations. It is our intention to sell all debt securities

35
with credit impairments. For available-for-sale equity securities, a charge is recorded in the Consolidated Statements of Operations for positions that have experienced other-than-temporary impairments due to credit quality or other factors.
The primary basis for the valuation of limited partnership interests is financial statements prepared by the general partner. Because of the timing of the preparation and delivery of these financial statements, the use of the most recently available financial statements provided by the general partners generally result in a quarter delay in the inclusion of the limited partnership results in our Consolidated Statements of Operations. Due to this delay, these financial statements do not reflect the market conditions experienced in the fourth quarter of 2011. Nearly all of the underlying investments in our limited partnerships are valued using a source other than quoted prices in active markets. Our limited partnership holdings are considered investment companies where the general partners record assets at fair value. Several factors are to be considered in determining whether an entity is an investment company. Among these factors are a large number of investors, low level of individual ownership and passive ownership that indicate the entity is an investment company.
We have three types of limited partnership investments: private equity, mezzanine debt, and real estate. Our private equity and mezzanine debt partnerships are diversified among numerous industries and geographies to minimize potential loss exposure. The fair value amounts for our private equity and mezzanine debt partnerships are based upon the financial statements prepared by the general partners, who use various methods to estimate fair value including the market approach, income approach and the cost approach. The market approach uses prices and other pertinent information from market-generated transactions involving identical or comparable assets or liabilities. Such valuation techniques often use market multiples derived from a set of comparables. The income approach uses valuation techniques to convert future cash flows or earnings to a single discounted present value amount. The measurement is based upon the value indicated by current market expectations about those future amounts. The cost approach is derived from the amount that is currently required to replace the service capacity of an asset. If information becomes available that would impair the cost of investments owned by the partnerships, then the general partner would generally adjust to the net realizable value.
Real estate limited partnerships are recorded by the general partner at fair value based upon independent appraisals and/or internal valuations. Real estate projects under development are generally valued at cost and impairment tested by the general partner. We minimize the risk of market decline by avoiding concentration in a particular geographic area and are diversified across residential, commercial, industrial and retail real estate investments.
We perform various procedures in review of the general partners’ valuations, and while we rely on the general partners’ financial statements as the best available information to record our share of the partnership unrealized gains and losses resulting from valuation changes, we adjust our financial statements for impairments of the partnership investments where appropriate. As there is a limited market for these investments, they have the greatest potential for variability. We survey each of the general partners quarterly about expected significant changes (plus or minus 10% compared to previous quarter) to valuations prior to the release of the fund’s quarterly and annual financial statements. Based upon that information from the general partner, we consider whether additional disclosure is warranted.
Deferred Acquisition Costs Related to Life Insurance and Investment-Type Contracts
Deferred acquisition costs (DAC) on life insurance and investment-type contracts are amortized in proportion to gross premiums, gross margins or gross profits, depending on the type of contract. DAC related to traditional life insurance products is amortized in proportion to premium revenues over the premium-paying period of related policies using assumptions consistent with those used in computing policy liability reserves. These assumptions are not revised after policy issuance unless the DAC balance is deemed to be unrecoverable from future expected profits. In any period where the actual policy terminations are higher (lower) than anticipated policy terminations, DAC amortization will be accelerated (decelerated) in that period. DAC related to universal life products and deferred annuities is amortized over the estimated lives of the contracts in proportion to actual and expected future gross profits, which include investment, mortality and expense margins and surrender charges. Both historical and anticipated investment returns, including realized gains and losses, are considered in determining the amortization of DAC. When the actual gross profits change from previously estimated gross profits, the cumulative DAC amortization is re-estimated and adjusted by a cumulative charge or credit to current operations. When actual gross profits exceed those previously estimated, DAC amortization will increase, resulting in a current period charge to earnings. The opposite result occurs when the actual gross profits are below the previously estimated gross profits. DAC is also adjusted for the impact of unrealized gains or losses on investments as if these gains or losses had been realized, with corresponding credits or charges, net of income taxes, included in EFL’s accumulated other comprehensive income, which is presented in the “Noncontrolling interest in consolidated entity – Exchange,” amount in the Consolidated Statements of Financial Position.

36
As a result of new accounting guidance issued in 2011, the types of costs incurred by insurance entities that can be capitalized in the acquisition of new and renewal insurance contracts will change for 2012 and thereafter. These costs will be limited to incremental direct costs that result directly from successful contract transactions and would not have been incurred by the insurance entity had the contract transactions not occurred. These costs must be directly related to underwriting, policy issuance and processing, medical and inspection reports and sales force contract selling. Advertising costs should only be included as deferred acquisition costs if direct-response advertising criteria are met. We have elected to prospectively adopt this guidance, the impact of which is immaterial to our consolidated financial statements as this guidance has no impact on the Indemnity shareholder interest.
The actuarial assumptions used to determine investment, mortality and expense margins and surrender charges are reviewed periodically, are based upon best estimates and do not include any provision for the risk of adverse deviation. If actuarial analysis indicates that expectations have changed, the actuarial assumptions are updated and the investment, mortality and expense margins and surrender charges are unlocked. If this unlocking results in a decrease in the present value of future expected gross profits, DAC amortization for the period will increase. If this unlocking results in an increase in the present value of future expected gross profits, DAC amortization for the current period will decrease.
DAC is periodically reviewed for recoverability. For traditional life products, if the benefit reserves plus anticipated future premiums and interest earnings for a line of business are less than the current estimate of future benefits and expenses (including any unamortized DAC), a charge to income is recorded for additional DAC amortization or for increased benefit reserves. For universal life products and deferred annuities, if the current present value of future expected gross profits is less than the unamortized DAC, a charge to income is recorded for additional DAC amortization. There were no impairments to DAC in 2011, 2010 or 2009.
Deferred Taxes
Deferred tax assets represent the tax benefit of future deductible temporary differences and operating loss and tax credit carry-forwards. Deferred tax assets are measured using the enacted tax rates expected to be in effect when such benefits are realized. We perform an analysis of our deferred tax assets to determine recoverability on a quarterly basis for each legal entity, by character of the income (ordinary or capital). Deferred tax assets are reduced by a valuation allowance, if based upon the weight of available evidence, it is more likely than not that some portion, or all, of the deferred tax assets will not be realized. In determining the need for a valuation allowance, we consider carry-back capacity, reversal of existing temporary differences, future taxable income and tax planning strategies. The determination of the valuation allowance for our deferred tax assets requires management to make certain judgments and assumptions regarding future operations that are based upon our historical experience and our expectations of future performance. Our judgments and assumptions are subject to change given the inherent uncertainty in predicting future performance, which is impacted by such things as financial market conditions, policyholder behavior, competitor pricing, new product introductions, and specific industry and economic conditions.
Indemnity had a net deferred tax asset of $19 million at December 31, 2011, compared to a net deferred tax liability of $26 million at December 31, 2010. There was no valuation allowance recorded on Indemnity at December 31, 2011 or 2010. In the fourth quarter of 2010, Indemnity recorded a deferred tax provision of $18 million related to its equity interest in EFL. This deferred tax charge was required due to Indemnity’s decision to sell its 21.6% ownership interest in EFL, which occurred on March 31, 2011, rather than receiving its share of EFL’s earnings in the form of future dividends, which would have been eligible for an 80% dividends received deduction.
The Exchange had net deferred tax liability of $147 million and $257 million at December 31, 2011 and 2010, respectively. There was no valuation allowance recorded on the Exchange at December 31, 2011 or 2010.
Retirement Benefit Plans
Our pension plan for employees is the largest and only funded benefit plan we offer. Our pension and other retirement benefit obligations are developed from actuarial estimates. Several statistical and other factors, which attempt to anticipate future events, are used in calculating the expense and liability related to the plans. Key factors include assumptions about the discount rates and expected rates of return on plan assets. We review these assumptions annually and modify them considering historical experience, current market conditions, including changes in investment returns and interest rates, and expected future trends.
Accumulated and projected benefit obligations are expressed as the present value of future cash payments. We discount those cash payments based upon a yield curve developed from corporate bond yield information with maturities that correspond to the payment of benefits. Lower discount rates increase present values and subsequent year pension expense; higher discount rates decrease present values and subsequent year pension expense. The discount rate
37
assumption used to determine the benefit obligation for 2011 was determined based upon a yield curve developed from corporate bond yield information. The construction of these yield curves is based upon yields of corporate bonds rated Aa quality. Target yields are developed from bonds at various maturity points and a curve is fitted to those targets. Spot rates (zero coupon bond yields) are developed from the yield curve and used to discount benefit payment amounts associated with each future year. The present value of plan benefits is calculated by applying the spot/discount rates to projected benefit cash flows. A single discount rate is then developed to produce the same present value. This represents the suggested discount rate. The cash flows from the yield curve were matched against our projected benefit payments in the pension plan, which have a duration of about 18 years. This yield curve supported the selection of a 4.99% discount rate for the projected benefit obligation at December 31, 2011 and for the 2012 pension expense. The same methodology was used to develop the 5.69% discount rate used to determine the projected benefit obligation for 2010 and for the 2011 pension expense. A change of 25 basis points in the discount rate assumption, with other assumptions held constant, would have an estimated $2 million impact on net pension and other retirement benefit costs in 2012.
The discount rate assumption used to determine the benefit obligation for 2009 was based upon a bond-matching study that compared projected pension plan benefit flows to the cash flows from a comparable portfolio of non-callable bonds rated AA- or higher. These bonds had maturities primarily between zero and 26 years. For years beyond year 27, there were no appropriate bonds maturing. In these instances, the study estimated the appropriate bond by assuming that there would be bonds available with the same characteristics as the available bond maturing in the immediately preceding year. Outlier bonds were excluded from the study.
Unrecognized actuarial gains and losses are being recognized over a 14-year period, which represents the expected remaining service period of the employee group. Unrecognized actuarial gains and losses arise from several factors, including experience and assumption changes in the obligations and from the difference between expected returns and actual returns on plan assets. These unrecognized gains and losses are recorded in the pension plan obligation on the Consolidated Statements of Financial Position and Accumulated Other Comprehensive Income. These amounts are systematically recognized to net periodic pension expense in future periods, with gains decreasing and losses increasing future pension expense.
The expected long-term rate of return for the pension plan represents the average rate of return to be earned on plan assets over the period the benefits included in the benefit obligation are to be paid. The expected long-term rate of return is less susceptible to annual revisions, as there are typically no significant changes in the asset mix. The long-term rate of return is derived from expected future returns for each asset category based upon applicable indices and their historical relationships under various market conditions. These expected future returns are then weighted based upon our target asset allocation percentages for each asset category to produce a best estimate range of asset return results within which our long-term rate of return assumption falls. A reasonably possible change of 25 basis points in the expected long-term rate of return assumption, with other assumptions held constant, would have an estimated $1 million impact on net pension benefit cost.
We use a four year averaging method to determine the market-related value of plan assets, which is used to determine the expected return component of pension expense. Under this methodology, asset gains or losses that result from returns that differ from our long-term rate of return assumption are recognized in the market-related value of assets on a level basis over a four year period. The component of the net actuarial loss generated during 2011 that related to the actual investment return being different from that assumed during the prior year was a loss of $15 million. Recognition of this loss will be deferred over a four year period, consistent with the market-related asset value methodology. Once factored into the market-related asset value, these experience gains and losses will be amortized over a period of 14 years, which is the remaining service period of the employee group.
Estimates of fair values of the pension plan assets are obtained primarily from our trustee and custodian of our pension plan. Our Level 1 category includes a money market fund that is a mutual fund for which the fair value is determined using an exchange traded price provided by the trustee and custodian. Our Level 2 category includes commingled pools. Estimates of fair values for securities held by our commingled pools are obtained primarily from the trustee and custodian. The methodologies used by the trustee and custodian that support a Level 2 classification of a financial instrument include multiple verifiable, observable inputs including benchmark yields, reported trades, broker/dealer quotes, issuers spreads, two-sided markets, benchmark securities, bids, offers and reference data. There were no Level 3 investments during 2011.
The actuarial assumptions we used in determining our pension and retirement benefits may differ materially from actual results due to changing market and economic conditions, higher or lower withdrawal rates, or longer or shorter life spans of participants. While we believe that the assumptions used are appropriate, differences in actual experience or changes in assumptions may materially affect our financial position, results of operations or cash flows.
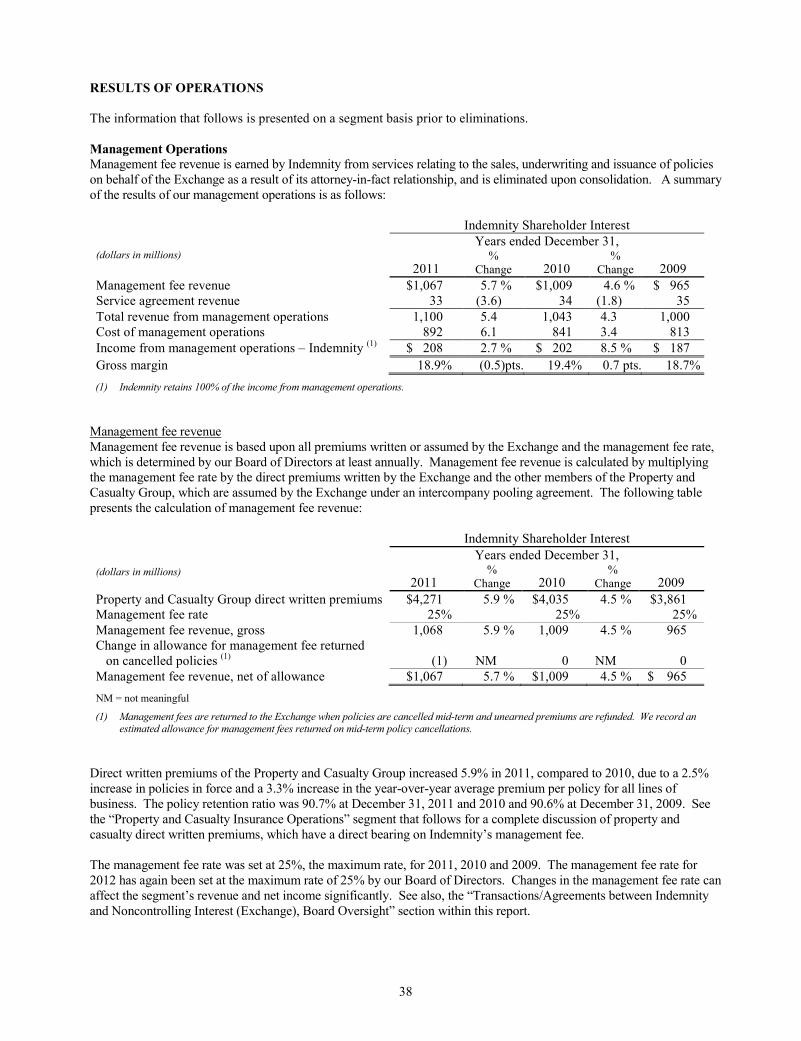
38
RESULTS OF OPERATIONS
The information that follows is presented on a segment basis prior to eliminations.
Management Operations
Management fee revenue is earned by Indemnity from services relating to the sales, underwriting and issuance of policies on behalf of the Exchange as a result of its attorney-in-fact relationship, and is eliminated upon consolidation. A summary of the results of our management operations is as follows:
Indemnity Shareholder Interest
Years ended December 31, (dollars in millions)
2011 %
Change 2010 %
Change 2009
Management fee revenue $1,067 5.7 % $1,009 4.6 % $ 965 Service agreement revenue 33 (3.6) 34 (1.8) 35
Total revenue from management operations 1,100 5.4 1,043 4.3 1,000 Cost of management operations 892 6.1 841 3.4 813
Income from management operations – Indemnity (1) $ 208 2.7 % $ 202 8.5 % $ 187
Gross margin 18.9% (0.5)pts. 19.4% 0.7 pts. 18.7%
(1) Indemnity retains 100% of the income from management operations.
Management fee revenue Management fee revenue is based upon all premiums written or assumed by the Exchange and the management fee rate, which is determined by our Board of Directors at least annually. Management fee revenue is calculated by multiplying the management fee rate by the direct premiums written by the Exchange and the other members of the Property and Casualty Group, which are assumed by the Exchange under an intercompany pooling agreement. The following table presents the calculation of management fee revenue: Indemnity Shareholder Interest
Years ended December 31,
(dollars in millions)
2011 %
Change 2010 %
Change 2009
Property and Casualty Group direct written premiums $4,271 5.9 % $4,035 4.5 % $3,861 Management fee rate 25% 25% 25%
Management fee revenue, gross 1,068 5.9 % 1,009 4.5 % 965 Change in allowance for management fee returned
on cancelled policies (1) (1) NM 0 NM 0
Management fee revenue, net of allowance $1,067 5.7 % $1,009 4.5 % $ 965
NM = not meaningful
(1) Management fees are returned to the Exchange when policies are cancelled mid-term and unearned premiums are refunded. We record an estimated allowance for management fees returned on mid-term policy cancellations.
Direct written premiums of the Property and Casualty Group increased 5.9% in 2011, compared to 2010, due to a 2.5% increase in policies in force and a 3.3% increase in the year-over-year average premium per policy for all lines of business. The policy retention ratio was 90.7% at December 31, 2011 and 2010 and 90.6% at December 31, 2009. See the “Property and Casualty Insurance Operations” segment that follows for a complete discussion of property and casualty direct written premiums, which have a direct bearing on Indemnity’s management fee. The management fee rate was set at 25%, the maximum rate, for 2011, 2010 and 2009. The management fee rate for 2012 has again been set at the maximum rate of 25% by our Board of Directors. Changes in the management fee rate can affect the segment’s revenue and net income significantly. See also, the “Transactions/Agreements between Indemnity and Noncontrolling Interest (Exchange), Board Oversight” section within this report.

39
Service agreement revenue Service agreement revenue includes service charges Indemnity collects from policyholders for providing extended payment terms on policies written by the Property and Casualty Group and late payment and policy reinstatement fees. The service charges are fixed dollar amounts per billed installment. Service agreement revenue totaled $33 million, $34 million and $35 million in 2011, 2010 and 2009, respectively. The decrease in service agreement revenue in 2011 and 2010 resulted from a slight decline in late payment and policy reinstatement fees and a continued shift in policies to the monthly direct debit payment plan, which does not incur service charges, and the no-fee single payment plan, which offers a premium discount. The shift to these plans is driven by the consumers’ desire to avoid paying services charges and to take advantage of the discount in pricing offered for paid-in-full policies. Cost of management operations
Indemnity Shareholder Interest
Years ended December 31, (in millions)
2011 %
Change 2010 %
Change 2009
Commissions $586 3.9 % $564 2.1 % $552 Non-commission expense 306 10.6 277 6.0 261
Total cost of management operations $892 6.1 % $841 3.4 % $813
Commissions – Commissions increased $22 million in 2011 compared 2010, and increased $12 million in 2010 compared to 2009, primarily as a result of the 5.9% and 4.5% increase, respectively, in direct written premiums of the Property and Casualty Group. Included in these increases in both years were decreases in agent bonuses, due to a reduction in the profitability component of the bonus as a result of factoring in the most recent year’s underwriting data. Non-commission expense – Non-commission expense increased $29 million in 2011, compared to 2010. Personnel costs, the second largest component in the cost of management operations, increased $8 million primarily as a result of increases in salaries and benefits. Professional fees and software costs each increased $7 million related to our technology initiatives, sales and policy issuance costs increased $2 million, while the 2010 expenses included a $5 million reduction for a favorable court ruling. In 2010, non-commission expense increased $16 million, compared to 2009. Personnel costs increased $12 million, primarily as a result of increases in salaries and benefits, while all other operating costs increased $9 million related primarily to our technology initiatives, offset by a $5 million reduction for a favorable court ruling. The gross margin of 19.4% in 2010 was positively impacted by a $5 million reduction for a favorable court ruling. Excluding this adjustment, the gross margin would have been 18.9% in 2010, compared to 18.9% in 2011 and 18.7% in 2009. The improved gross margin in 2010, compared to 2009, resulted from revenue growth slightly outpacing expense growth.

40
Property and Casualty Insurance Operations
The Property and Casualty Group operates in 11 Midwestern, Mid-Atlantic and Southeastern states and the District of Columbia and primarily writes personal auto, homeowners, commercial multi-peril, commercial automobile, and workers compensation lines of insurance. A summary of the results of our property and casualty insurance operations is as follows:
Property and Casualty Group
Years ended December 31,
(dollars in millions)
2011 %
Change 2010 %
Change 2009
Direct written premium $4,271 5.9 % $4,035 4.5 % $3,861 Reinsurance – assumed and ceded (16) (6.0) (16) NM 0
Net written premium 4,255 5.9 4,019 4.1 3,861 Change in unearned premium 106 12.2 94 78.1 53
Net premiums earned 4,149 5.7 3,925 3.1 3,808
Losses and loss expenses 3,349 19.0 2,815 6.4 2,644 Policy acquisition and other underwriting expenses 1,178 5.8 1,113 (1.7) 1,135
Total losses and expenses 4,527 15.2 3,928 4.0 3,779
Underwriting (loss) income – Erie Insurance Group $ (378) NM $ (3) NM $ 29
Underwriting income – Indemnity (1) $ U $ 0 $ 1
Underwriting (loss) income – Exchange (1) $ (378) $ (3) $ 28
Loss and loss expense ratio 80.7% 9.0 pts. 71.7% 2.3 pts. 69.4% Policy acquisition and other underwriting expense ratio 28.4 0.0 28.4 (1.4) 29.8
Combined ratio 109.1% 9.0 pts. 100.1% 0.9 pts. 99.2%
NM = not meaningful
(1) Prior to and through December 31, 2010, the underwriting results retained by EIC and ENY accrued to the Indemnity shareholder
interest. Due to the sale of Indemnity’s property and casualty insurance subsidiaries to the Exchange on December 31, 2010, all
property and casualty underwriting results accrue to the interest of the subscribers (policyholders) of the Exchange, or noncontrolling interest, after December 31, 2010.
We measure profit or loss for our property and casualty insurance segment based upon underwriting results, which represents net premiums earned less losses and loss expenses and policy acquisition and other underwriting expenses on a pre-tax basis. Loss and combined ratios are key performance indicators that we use to assess business trends and to make comparisons to industry results. The investment results related to our property and casualty operations are included in our investment operations segment. Direct written premiums Direct written premiums of the Property and Casualty Group increased 5.9% to $4.3 billion in 2011, from $4.0 billion in 2010, driven by an increase in policies in force and increases in average premium per policy. Year-over-year policies in force for all lines of business increased by 2.5% in 2011 as the result of continuing strong policyholder retention, compared to an increase of 3.3% in 2010. The year-over-year average premium per policy for all lines of business increased 3.3% at December 31, 2011, compared to 1.1% at December 31, 2010. The combined impact of these increases was seen primarily in our renewal business premiums.
Premiums generated from new business increased 1.9% to $465 million in 2011, compared to 5.2%, or $456 million, in 2010. Underlying the trend in new business premiums was a decrease in new business policies in force of 3.9% in 2011, compared to an increase of 1.3% in 2010, while the year-over-year average premium per policy on new business increased 5.9% at December 31, 2011, compared to 3.8% at December 31, 2010.
Premiums generated from renewal business increased 6.4% to $3.8 billion in 2011, compared to 4.4%, or $3.6 billion, in 2010. Underlying the trend in renewal business premiums was an increase in renewal business policies in force of 3.4% in 2011, compared to 3.6% in 2010, and an increase in the renewal business year-over-year average premium per policy of 2.9% at December 31, 2011, compared to 0.8% at December 31, 2010. The Property and Casualty Group’s year-over-year policy retention ratio was 90.7% at December 31, 2011 and 2010, and 90.6% at December 31, 2009.

41
The Property and Casualty Group implemented rate increases in 2011, 2010 and 2009 in order to meet loss cost expectations. Our rate increases in 2010 and 2009 were offset by the Property and Casualty Group’s economically sensitive lines, predominantly workers compensation and commercial auto, which, as a result of unfavorable economic conditions, experienced reduced exposures and changes in the mix of business that reduced the average premium per policy for these lines. In 2009, these reductions resulted in a slight decrease to the all lines of business average premium per policy.
The Property and Casualty Group primarily writes only one-year policies. Consequently, rate actions take 12 months to be fully recognized in written premium and 24 months to be recognized fully in earned premiums. Since rate changes are realized at renewal, it takes 12 months to implement a rate change to all policyholders and another 12 months to earn the decreased or increased premiums in full. As a result, certain rate actions approved in 2010 were reflected in 2011, and recent rate actions in 2011 will be reflected in 2012.
Personal lines – Total personal lines premiums written increased 4.9% to $3.1 billion in 2011, from $3.0 billion in 2010, driven by an increase of 2.3% in total personal lines policies in force and an increase of 2.5% in the total personal lines year-over-year average premium per policy.
New business premiums written on personal lines decreased 0.7% in 2011, compared to an increase of 2.1% in 2010. Personal lines new business policies in force decreased 4.8% in 2011, compared to 0.1% in 2010, while the year-over-year average premium per policy on personal lines new business increased 4.2% at December 31, 2011, compared to 2.2% at December 31, 2010.
• Private passenger auto new business premiums written decreased 1.4% in 2011, compared to an increase of 1.8% in 2010. New business policies in force for private passenger auto decreased 3.3% in 2011, compared to 0.9% in 2010, while the new business year-over-year average premium per policy for private passenger auto increased 2.0% at December 31, 2011, compared to an increase of 2.7% at December 31, 2010.
• Homeowners new business premiums written decreased 0.9% in 2011, compared to an increase of 1.9% in 2010. New business policies in force for homeowners decreased 7.0% in 2011, compared to 0.1% in 2010. The new business year-over-year average premium per policy for homeowners increased 6.5% at December 31, 2011, compared to 2.0% at December 31, 2010.
Renewal premiums written on personal lines increased 5.5% in 2011, compared to 6.1% in 2010, driven by an increase in average premium per policy and steady policy retention trends. The year-over-year average premium per policy on personal lines renewal business increased 2.2% at December 31, 2011, compared to 2.4% at December 31, 2010. The personal lines year-over-year policy retention ratio was 91.5% at December 31, 2011, 2010 and 2009.
• Private passenger auto renewal premiums written increased 2.8% in 2011, compared to 5.0% in 2010. The year-over-year average premium per policy on private passenger auto renewal business increased 0.7% at December 31, 2011, compared to 2.2% at December 31, 2010. The private passenger auto year-over-year policy retention ratio was 91.6% at December 31, 2011, 91.8% at December 31, 2010 and 91.9% at December 31, 2009.
• Homeowners renewal premiums written increased 11.1% in 2011, compared to 8.4% in 2010. The year-over-year average premium per policy on homeowners renewal business increased 7.7% at December 31, 2011, compared to 4.5% in 2010. The homeowners year-over-year policyholder retention ratio was 91.2% at December 31, 2011, 2010 and 2009.
Commercial lines – Total commercial lines premiums written increased 8.5%, to $1.2 billion in 2011, from $1.1 billion in 2010, driven by a 3.5% increase in total commercial lines policies in force and a 4.9% increase in the total commercial lines year-over-year average premium per policy.
New business premiums written on commercial lines increased 6.7% in 2011, compared to 11.6% in 2010. Commercial lines new business policies in force remained flat in 2011, compared to an increase of 7.8% in 2010, while the year-over-year average premium per policy on commercial lines new business increased 6.7% at December 31, 2011, compared to 3.5% at December 31, 2010.
Renewal premiums for commercial lines increased 8.8% in 2011, compared to a decrease of 0.2% in 2010. The improvement seen in the commercial lines renewal premiums was driven by increases in the average premium per policy combined with steady policy retention trends, the combined impact of which was seen primarily in the commercial multi-peril and workers compensation lines of business. The year-over-year average premium per policy on commercial lines renewal business increased 4.4% in 2011, compared to a decrease of 3.3% in 2010. The commercial multi-peril and

42
workers compensation year-over-year average premium per policy on renewal business increased 4.7% and 9.5%, respectively, at December 31, 2011, compared to decreases of 0.7% and 9.2%, respectively, at December 31, 2010. Contributing to the lower average premium per policy in 2010 were shifts in the mix of our book of business and lower exposures for the commercial multi-peril and workers compensation lines of business, but to a lesser extent than in 2009. The year-over-year policy retention ratio for commercial lines was 85.5% at December 31, 2011, 85.3% at December 31, 2010 and 84.9% at December 31, 2009.
Future trends—premium revenue – We plan to continue our efforts to grow Property and Casualty Group premiums and improve our competitive position in the marketplace. Expanding the size of our agency force through a careful agency selection process and increased market penetration in our existing operating territories will contribute to future growth as existing and new agents build their book of business with the Property and Casualty Group. At December 31, 2011, we had over 2,100 agencies with nearly 9,500 licensed property and casualty representatives.
Changes in premium levels attributable to growth in policies in force directly affect the profitability of the Property and Casualty Group and have a direct bearing on Indemnity’s management fee. Our continued focus on underwriting discipline and the maturing of our pricing sophistication models has contributed to the Property and Casualty Group’s growth in new policies in force and steady policy retention ratios. The continued growth of our policy base is dependent upon the Property and Casualty Group’s ability to retain existing policyholders and attract new policyholders. A lack of new policy growth or the inability to retain existing customers could have an adverse effect on the Property and Casualty Group’s premium level growth, and consequently Indemnity’s management fee.
Changes in premium levels attributable to rate changes also directly affect the profitability of the Property and Casualty Group and have a direct bearing on Indemnity’s management fee. Pricing actions contemplated or taken by the Property and Casualty Group are subject to various regulatory requirements of the states in which our insurers operate. The pricing actions already implemented, or to be implemented, have an effect on the market competitiveness of our insurance products. Such pricing actions, and those of competitors, could affect the ability of our agents to retain and attract new business. We expect the Property and Casualty Group’s pricing actions to result in a net increase in direct written premium in 2012, however, exposure reductions and/or changes in our mix of business as a result of economic conditions could impact the average premium written by the Property and Casualty Group, as customers may reduce coverages.
Current year losses and loss expenses The current accident year loss and loss expense ratio, excluding catastrophe losses, was 68.6% in 2011, compared to 70.6% in 2010 and 68.4% in 2009.
The personal lines loss and loss expense ratio related to the current accident year, excluding catastrophe losses, was 69.4% in 2011, compared to 70.4% in 2010 and 69.1% in 2009. Excluding catastrophe losses, the current accident year loss and loss expense ratio for personal auto increased to 73.7% in 2011 from 73.4% in 2010, while the homeowners loss and loss expense ratio decreased to 62.6% from 64.5% for the same periods, respectively.
The commercial lines loss and loss expense ratio related to the current accident year, excluding catastrophe losses, was 66.6% in 2011, compared to 71.3% in 2010 and 66.9% in 2009. Excluding catastrophe losses, the current accident year loss and loss expense ratios for 2011 and 2010, respectively, were 73.3% and 82.9% for the workers compensation line of business, 63.5% and 71.0% for the commercial multi-peril line of business, and 72.1% and 68.7% for the commercial auto line of business. The workers compensation and commercial multi-peril lines of business experienced a decrease in severity in 2011, compared to 2010.
Catastrophe losses Catastrophic events, destructive weather patterns, or changes in climate conditions are an inherent risk of the property and casualty insurance business and can have a material impact on our property and casualty insurance underwriting results. The Property and Casualty Group conducts business primarily in the Mid-Atlantic, Midwestern and Southeastern portions of the United States. A substantial portion of our business is in the personal and commercial automobile, homeowners and workers compensation insurance lines in the states of Ohio, Maryland, Virginia and, predominantly, in Pennsylvania. Common catastrophic events include severe winter storms, hurricanes, earthquakes, tornadoes, and wind and hail storms, among others. In addressing this risk, we employ what we believe are reasonable underwriting standards and monitor our exposure by geographic region.
The Property and Casualty Group’s definition of catastrophes includes those weather-related or other loss events that we consider significant to our geographic footprint which, individually or in the aggregate, may not reach the level of a national catastrophe as defined by the Property Claim Service (PCS). The Property and Casualty Group maintains

43
property catastrophe reinsurance coverage from unaffiliated reinsurers to mitigate future potential catastrophe loss exposures and no longer participates in the voluntary assumed reinsurance business, which lowers the variability of the Property and Casualty Group’s underwriting results. The property catastrophe reinsurance coverage for 2011 included a first property catastrophe reinsurance treaty that provided coverage of up to 90% of a loss of $500 million in excess of the Property and Casualty Group’s loss retention of $350 million per occurrence, and a second treaty that provided coverage of up to 90% of a loss of $25 million in excess of $850 million. These treaties were renewed effective January 1, 2012, with the first property catastrophe reinsurance treaty providing coverage of up to 90% of a loss of $500 million in excess of the Property and Casualty Group’s loss retention of $350 million per occurrence, and the second treaty providing coverage of up to 70% of a loss of $275 million in excess of $850 million. In addition, a third property catastrophe reinsurance treaty was entered into with a nonaffiliated reinsurer providing coverage of up to 70% of a loss of $25 million in excess of $1.125 billion. The treaties exclude losses from acts of terrorism.
While the Property and Casualty Group is exposed to terrorism losses in commercial lines, including workers compensation, these lines are afforded a limited backstop above insurer deductibles for foreign acts of terrorism under the federal Terrorism Risk Insurance Program Reauthorization and Extension Act of 2007 that continues through December 31, 2014. The Property and Casualty Group has no personal lines terrorism coverage in place. Although current models suggest the most likely occurrences would not have a material impact on the Property and Casualty Group, there is a chance that if future terrorism attacks occur, the Property and Casualty Group could incur large losses.
Catastrophe losses, as defined by the Property and Casualty Group, totaled $773 million in 2011, $288 million in 2010 and $129 million in 2009, and contributed 18.6 points, 7.3 points and 3.4 points to the respective loss ratios. Catastrophe losses in 2011 were impacted by flooding, hurricane, tornado, hail and wind storms primarily in the states of Pennsylvania, North Carolina, Tennessee and Ohio. In 2010, catastrophe losses were impacted by ice, snow, wind, flooding, hail and tornadoes primarily in the states of Pennsylvania, Maryland and Ohio, where 2009 catastrophe losses resulted primarily from flooding, hail, tornado and wind storms primarily in Pennsylvania, Ohio and Indiana.
Prior year loss reserve development The following table provides a breakout of our property and casualty insurance operation’s prior year loss reserve development by type of business:
Property and Casualty Group
(in millions) Years ended December 31,
2011 2010 2009
Direct business including salvage and subrogation $(276) $(188) $(30) Assumed reinsurance business (22) (51) (38) Ceded reinsurance business 26 (5) (25)
Total prior year loss development $(272) $(244) $(93)
Negative amounts represent a redundancy (decrease in reserves), while positive amounts represent a deficiency (increase in reserves).
Direct business including salvage and subrogation – The following table presents the overall prior year loss development of direct reserves, including the effects of salvage and subrogation recoveries, for our personal and commercial lines operations by accident year:
Property and Casualty Group
(in millions) Years ended December 31,
2011 2010 2009
2010 $ (26) $ � $ � 2009 (31) (60) � 2008 (14) (47) 4 2007 (7) (39) (11) 2006 (8) (17) (18) 2005 (5) (17) (4) 2004 (11) 0 10 2003 (4) (9) (60) 2002 (14) 15 16 2001 and prior (156) (14) 33
Total $(276) $(188) $(30)
Negative amounts represent a redundancy (decrease in reserves), while positive amounts represent a deficiency (increase in reserves).

44
The 2011 direct business favorable development, including salvage and subrogation recoveries, totaled $276 million, improved the combined ratio by 6.7 points and represented 7.7% of the net loss reserves at December 31, 2010. The most significant factors contributing to the 2011 favorable development were:
• Favorable development of $125 million related to the personal auto line of business, primarily resulting from better than expected severity trends on automobile bodily injury and uninsured/underinsured motorist bodily injury improved annual claims cost expectations, which impacted the more recent accident years, and the closing of four pre-1986 automobile massive injury lifetime medical claims.
• Favorable development of $95 million related to the workers compensation line of business primarily resulting from the closing of seven massive injury lifetime medical claims and better than expected severity trends, which primarily impacted accident years related to 2001 and prior.
• Favorable development of $24 million related to the commercial multi-peril line of business primarily resulting from better than expected severity trends, which impacted the 2009 and 2010 accident years.
• Favorable development of $12 million related to the homeowners line of business primarily resulting from better than expected severity trends, which impacted the more recent accident years.
The 2010 direct business favorable development, including salvage and subrogation recoveries, totaled $188 million, improved the combined ratio by 4.8 points and represented 5.2% of the net loss reserves at December 31, 2009. The most significant factors contributing to the 2010 favorable development were:
• Favorable development of $64 million related to the commercial multi-peril line of business and resulted primarily from improvements in severity trends on both property and liability lines, which impacted various recent accident years.
• Favorable development of $60 million related to the personal auto line of business and primarily resulted from better than expected severity trends on automobile bodily injury and uninsured/underinsured motorist bodily injury, which impacted the more recent accident years. An additional $8 million of favorable development stems from the settlement of three pre-1986 automobile massive injury lifetime medical claims.
• Favorable development of $45 million related to the workers compensation line of business and resulted primarily from improvements in severity trends and the settlement of four workers compensation massive injury lifetime medical claims, which impacted the more recent accident years.
• Adverse development of $39 million was experienced in 2010 as a result of reserve strengthening on commercial liability claims that impacted the 2002 accident year. Of this amount, $9 million related to the commercial multi-peril line of business and $30 million related to other commercial lines.
The 2009 direct business favorable development, including salvage and subrogation recoveries, totaled $30 million, improved the combined ratio by 0.8 points and represented 0.8% of the net loss reserves at December 31, 2008. The most significant factors contributing to the 2009 favorable development were:
• Favorable development of $138 million related to the workers compensation line of business. This favorable development was a function of 1) the settlement of several massive injury lifetime medical workers compensation claims of $56 million, 2) changes to mortality assumptions of $14 million and 3) a change in the payout patterns used in the calculation to discount workers compensation reserves of $45 million. The settlement of the massive injury workers compensation claims impacted several accident years. The changes in assumptions and the discount calculation impacted all accident years.
• Adverse development of $77 million related to the personal auto line of business, primarily in the pre-1986 automobile massive injury lifetime medical claims. The mortality assumptions used for these claims were changed to a 100% weighting of the disabled pensioner mortality table and gender specific mortality tables were used, resulting in an increase in reserves of $44 million. The remaining adverse development resulted primarily from personal auto bodily injury claims as greater than expected frequency and severity trends were experienced related to accident years 2007 and 2008.
• Adverse development of $67 million related to the commercial multi-peril lines of business which impacted various accident years. The majority of the adverse development stems from liability claims on accident years 2007 and 2008 as greater than expected severity trends were experienced. Adverse development on accident years prior to 2007 resulted mainly from the outcome of certain court decisions.

45
Additional information on direct loss reserve development is provided in Item 1. “Business, Reserves for losses and loss expenses.” The variability in reserve development over the ten year period illustrates the uncertainty of the loss reserving process. Conditions and trends that have affected reserve development in the past will not necessarily recur in the future. It is not appropriate to extrapolate future favorable or unfavorable reserve development based upon amounts experienced in prior years. Assumed reinsurance – The Property and Casualty Group experienced favorable development of prior accident year loss reserves on its assumed reinsurance business totaling $22 million in 2011, compared to $51 million in 2010 and $38 million in 2009. The favorable development in 2011 and 2010 was due to less than anticipated growth in involuntary reinsurance. In 2009, the favorable development was due to less than anticipated growth in involuntary reinsurance and, to a lesser extent, reductions in reserve levels related to World Trade Center losses. Ceded reinsurance – During 2011, ceded reinsurance reserves decreased $26 million for the Property and Casualty Group, which is reflected as adverse development of reserves, compared to an increase of $5 million in 2010 and $25 million in 2009, which is reflected as favorable development of reserves. Ceded reinsurance reserves primarily relate to the pre-1986 automobile massive injury claims. The adverse development in 2011 was primarily the result of the closing of four massive injury lifetime medical claims. The favorable development in 2010 was primarily the result of a $9 million increase related to the business catastrophe liability line, offset by a $4 million reduction in ceded recoveries related to the pre-1986 automobile massive injury reserves. In 2009, the favorable development was primarily due to assumption changes and frequency trends in the pre-1986 automobile massive injury direct business, which drove the corresponding increase in the receivable from the ceded reinsurer. Policy acquisition and other underwriting expenses Our policy acquisition and other underwriting expense ratio remained flat at 28.4% in 2011 compared to 2010, and decreased 1.4 points in 2010 from 29.8% in 2009. The management fee rate was 25% in 2011, 2010 and 2009. The year ended December 31, 2009 included a charge of $62 million related to the write-off of assumed involuntary reinsurance premium related to the North Carolina Beach and Coastal Plans deemed uncollectible as a result of state legislation, which contributed 1.6 points to the 2009 policy acquisition and other underwriting expense ratio.
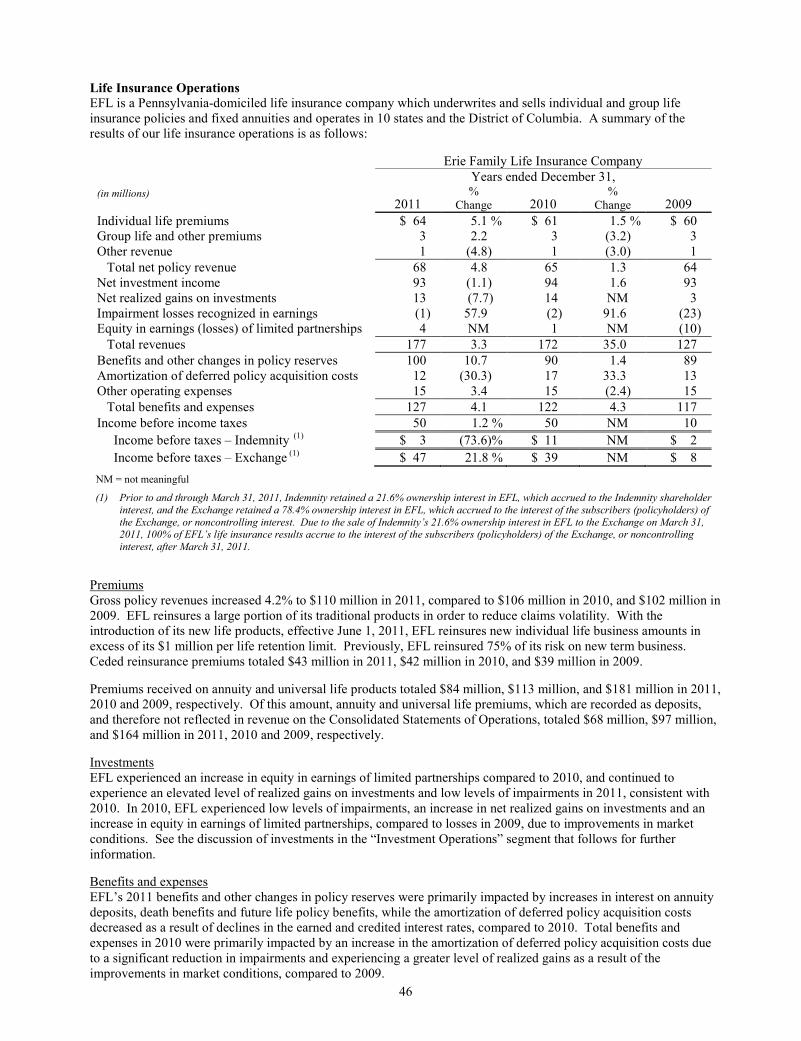
46
Life Insurance Operations
EFL is a Pennsylvania-domiciled life insurance company which underwrites and sells individual and group life insurance policies and fixed annuities and operates in 10 states and the District of Columbia. A summary of the results of our life insurance operations is as follows:
Erie Family Life Insurance Company
Years ended December 31,
(in millions)
2011 %
Change 2010 %
Change 2009
Individual life premiums $ 64 5.1 % $ 61 1.5 % $ 60 Group life and other premiums 3 2.2 3 (3.2) 3 Other revenue 1 (4.8) 1 (3.0) 1
Total net policy revenue 68 4.8 65 1.3 64 Net investment income 93 (1.1) 94 1.6 93 Net realized gains on investments 13 (7.7) 14 NM 3 Impairment losses recognized in earnings (1) 57.9 (2) 91.6 (23) Equity in earnings (losses) of limited partnerships 4 NM 1 NM (10)
Total revenues 177 3.3 172 35.0 127
Benefits and other changes in policy reserves 100 10.7 90 1.4 89 Amortization of deferred policy acquisition costs 12 (30.3) 17 33.3 13 Other operating expenses 15 3.4 15 (2.4) 15
Total benefits and expenses 127 4.1 122 4.3 117
Income before income taxes 50 1.2 % 50 NM 10
Income before taxes – Indemnity (1) $ 3 (73.6)% $ 11 NM $ 2
Income before taxes – Exchange (1) $ 47 21.8 % $ 39 NM $ 8
NM = not meaningful
(1) Prior to and through March 31, 2011, Indemnity retained a 21.6% ownership interest in EFL, which accrued to the Indemnity shareholder
interest, and the Exchange retained a 78.4% ownership interest in EFL, which accrued to the interest of the subscribers (policyholders) of
the Exchange, or noncontrolling interest. Due to the sale of Indemnity’s 21.6% ownership interest in EFL to the Exchange on March 31, 2011, 100% of EFL’s life insurance results accrue to the interest of the subscribers (policyholders) of the Exchange, or noncontrolling
interest, after March 31, 2011.
Premiums Gross policy revenues increased 4.2% to $110 million in 2011, compared to $106 million in 2010, and $102 million in 2009. EFL reinsures a large portion of its traditional products in order to reduce claims volatility. With the introduction of its new life products, effective June 1, 2011, EFL reinsures new individual life business amounts in excess of its $1 million per life retention limit. Previously, EFL reinsured 75% of its risk on new term business. Ceded reinsurance premiums totaled $43 million in 2011, $42 million in 2010, and $39 million in 2009.
Premiums received on annuity and universal life products totaled $84 million, $113 million, and $181 million in 2011, 2010 and 2009, respectively. Of this amount, annuity and universal life premiums, which are recorded as deposits, and therefore not reflected in revenue on the Consolidated Statements of Operations, totaled $68 million, $97 million, and $164 million in 2011, 2010 and 2009, respectively.
Investments EFL experienced an increase in equity in earnings of limited partnerships compared to 2010, and continued to experience an elevated level of realized gains on investments and low levels of impairments in 2011, consistent with 2010. In 2010, EFL experienced low levels of impairments, an increase in net realized gains on investments and an increase in equity in earnings of limited partnerships, compared to losses in 2009, due to improvements in market conditions. See the discussion of investments in the “Investment Operations” segment that follows for further information.
Benefits and expenses EFL’s 2011 benefits and other changes in policy reserves were primarily impacted by increases in interest on annuity deposits, death benefits and future life policy benefits, while the amortization of deferred policy acquisition costs decreased as a result of declines in the earned and credited interest rates, compared to 2010. Total benefits and expenses in 2010 were primarily impacted by an increase in the amortization of deferred policy acquisition costs due to a significant reduction in impairments and experiencing a greater level of realized gains as a result of the improvements in market conditions, compared to 2009.
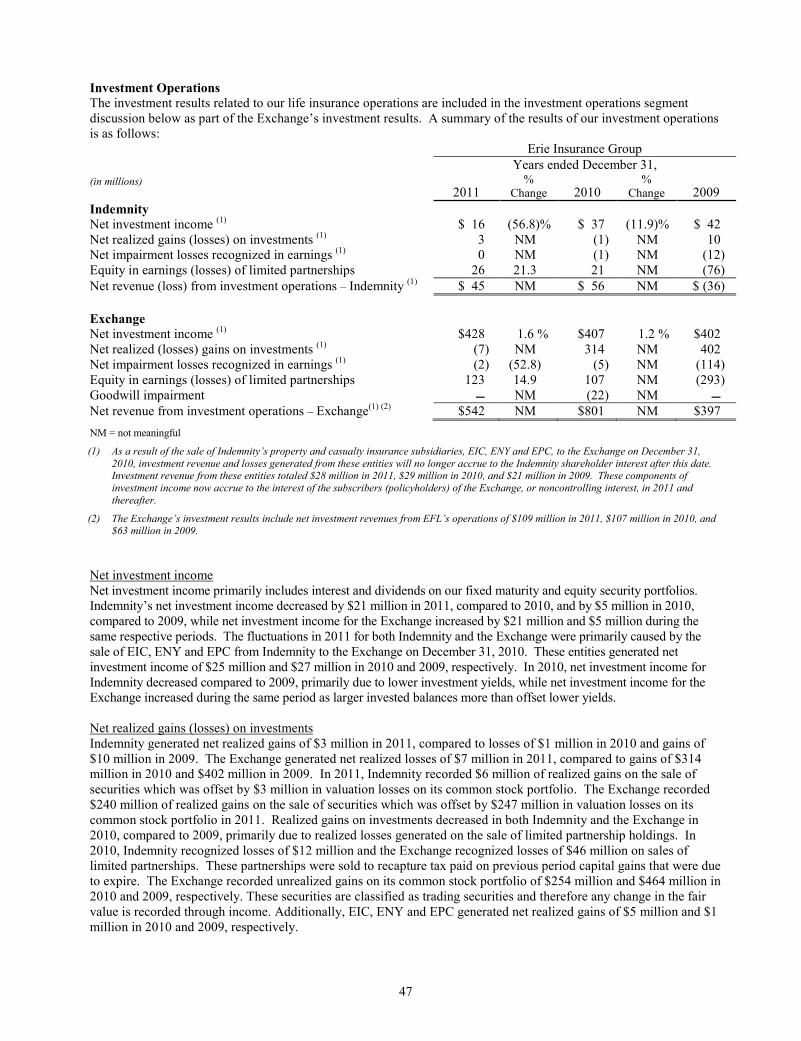
47
Investment Operations
The investment results related to our life insurance operations are included in the investment operations segment discussion below as part of the Exchange’s investment results. A summary of the results of our investment operations is as follows: Erie Insurance Group
Years ended December 31,
(in millions)
2011 %
Change 2010 %
Change 2009
Indemnity
Net investment income (1) $ 16 (56.8)% $ 37 (11.9)% $ 42 Net realized gains (losses) on investments (1) 3 NM (1) NM 10 Net impairment losses recognized in earnings (1) 0 NM (1) NM (12) Equity in earnings (losses) of limited partnerships 26 21.3 21 NM (76)
Net revenue (loss) from investment operations – Indemnity (1) $ 45 NM $ 56 NM $ (36)
Exchange Net investment income (1) $428 1.6 % $407 1.2 % $402 Net realized (losses) gains on investments (1) (7) NM 314 NM 402 Net impairment losses recognized in earnings (1) (2) (52.8) (5) NM (114) Equity in earnings (losses) of limited partnerships 123 14.9 107 NM (293) Goodwill impairment � NM (22) NM �
Net revenue from investment operations – Exchange(1) (2) $542 NM $801 NM $397
NM = not meaningful
(1) As a result of the sale of Indemnity’s property and casualty insurance subsidiaries, EIC, ENY and EPC, to the Exchange on December 31,
2010, investment revenue and losses generated from these entities will no longer accrue to the Indemnity shareholder interest after this date. Investment revenue from these entities totaled $28 million in 2011, $29 million in 2010, and $21 million in 2009. These components of
investment income now accrue to the interest of the subscribers (policyholders) of the Exchange, or noncontrolling interest, in 2011 and
thereafter.
(2) The Exchange’s investment results include net investment revenues from EFL’s operations of $109 million in 2011, $107 million in 2010, and $63 million in 2009.
Net investment income Net investment income primarily includes interest and dividends on our fixed maturity and equity security portfolios. Indemnity’s net investment income decreased by $21 million in 2011, compared to 2010, and by $5 million in 2010, compared to 2009, while net investment income for the Exchange increased by $21 million and $5 million during the same respective periods. The fluctuations in 2011 for both Indemnity and the Exchange were primarily caused by the sale of EIC, ENY and EPC from Indemnity to the Exchange on December 31, 2010. These entities generated net investment income of $25 million and $27 million in 2010 and 2009, respectively. In 2010, net investment income for Indemnity decreased compared to 2009, primarily due to lower investment yields, while net investment income for the Exchange increased during the same period as larger invested balances more than offset lower yields. Net realized gains (losses) on investments Indemnity generated net realized gains of $3 million in 2011, compared to losses of $1 million in 2010 and gains of $10 million in 2009. The Exchange generated net realized losses of $7 million in 2011, compared to gains of $314 million in 2010 and $402 million in 2009. In 2011, Indemnity recorded $6 million of realized gains on the sale of securities which was offset by $3 million in valuation losses on its common stock portfolio. The Exchange recorded $240 million of realized gains on the sale of securities which was offset by $247 million in valuation losses on its common stock portfolio in 2011. Realized gains on investments decreased in both Indemnity and the Exchange in 2010, compared to 2009, primarily due to realized losses generated on the sale of limited partnership holdings. In 2010, Indemnity recognized losses of $12 million and the Exchange recognized losses of $46 million on sales of limited partnerships. These partnerships were sold to recapture tax paid on previous period capital gains that were due to expire. The Exchange recorded unrealized gains on its common stock portfolio of $254 million and $464 million in 2010 and 2009, respectively. These securities are classified as trading securities and therefore any change in the fair value is recorded through income. Additionally, EIC, ENY and EPC generated net realized gains of $5 million and $1 million in 2010 and 2009, respectively.

48
Net impairment losses recognized in earnings Net impairment losses recognized in earnings for Indemnity decreased by $1 million in 2011, compared to 2010, and by $11 million in 2010, compared to 2009, while impairment losses for the Exchange decreased by $3 million and $109 million during the same respective periods. Lower levels of impairment losses are due to improved market conditions for fixed maturity and preferred stock securities in 2011 and 2010, compared to 2009. EIC, ENY and EPC generated net impairment losses of $1 million and $7 million in 2010 and 2009, respectively.
Equity in earnings (losses) of limited partnerships Indemnity’s equity in earnings of limited partnerships totaled $26 million and $21 million in 2011 and 2010, respectively, compared to losses of $76 million in 2009. The Exchange’s equity in earnings of limited partnerships totaled $123 million and $107 million in 2011 and 2010, respectively, compared to losses of $293 million in 2009. The results in 2011 and 2010 reflect the improved market conditions across all limited partnership sectors compared to 2009. Goodwill impairment Goodwill is reviewed for impairment at least annually or more frequently if events occur or circumstances change that would indicate that a triggering event has occurred. Goodwill impairment testing follows a two step process. In the first step, the fair value of a reporting unit is compared to its carrying value. If the carrying value of a reporting unit exceeds its fair value, the second step of the impairment test is performed for purposes of measuring the impairment. Prior to December 31, 2010, the Exchange had $22 million of goodwill attributable to its purchase of EFL stock in 2006. In the fourth quarter of 2010, the Exchange entered into an agreement to purchase Indemnity’s 21.6% ownership interest in EFL, and a valuation of EFL was performed by an external independent third party in preparation for the sale, which occurred on March 31, 2011. The valuation resulted in a purchase price determination of 95% of book value. In response to the valuation and sale price, management concluded that the possibility for impairment existed and step two of the goodwill impairment test was completed to determine the impairment amount. Step two of the impairment test compared the value of new business for EFL to the current goodwill balance. The analysis determined that the value of EFL’s new business did not support the $22 million goodwill, and an impairment entry was made to write down the entire balance at December 31, 2010. The charge of $22 million decreased the net income attributable to the Exchange in 2010. The breakdown of our net realized gains (losses) on investments is as follows: Erie Insurance Group
(in millions) Years ended December 31,
2011 2010 2009
Indemnity Securities sold:
Fixed maturities $ 2 $ 5 $ 1 Preferred stock equity securities 3 1 1 Common stock equity securities 1 5 (3)
Common stock valuation adjustments (3) 0 11 Limited partnerships 0 (12) 0
Total net realized gains (losses) – Indemnity (1) $ 3 $ (1) $ 10
Exchange Securities sold:
Fixed maturities $ 48 $ 25 $ (15) Preferred stock equity securities 27 11 13 Common stock equity securities 165 70 (60)
Common stock valuation adjustments (247) 254 464 Limited partnerships 0 (46) 0
Total net realized (losses) gains – Exchange (1) (2) $ (7) $314 $402
(1) See Item 8. “Financial Statements and Supplementary Data – Note 7, Investments, of Notes to Consolidated Financial Statements”
contained within this report for additional disclosures regarding net realized gains (losses) on investments.
(2) The Exchange’s results include net realized gains from EFL’s operations of $13 million in 2011, $14 million in 2010, and $3 million in 2009.

49
No impairment charges were incurred by the Indemnity in 2011. Exchange impairment charges of $2 million in 2011 were attributable to preferred stock holdings. Overall, impairment charges declined in 2011 and 2010, compared to 2009, as market conditions have improved. The components of equity in earnings (losses) of limited partnerships are as follows:
Erie Insurance Group
(in millions) Years ended December 31,
2011 2010 2009
Indemnity Private equity $ 10 $ 14 $ (12) Mezzanine debt 7 7 (6) Real estate 9 0 (58)
Total equity in earnings (losses) of limited partnerships – Indemnity $ 26 $ 21 $ (76)
Exchange Private equity $ 54 $ 77 $ (34) Mezzanine debt 24 27 (2) Real estate 45 3 (257)
Total equity in earnings (losses) of limited partnerships – Exchange (1) $123 $107 $(293)
(1) The Exchange’s results include equity in earnings of limited partnerships from EFL’s operations of $4 million in 2011, $0.5 million in 2010,
and losses of $10 million in 2009.
Limited partnership earnings pertain to investments in U.S. and foreign private equity, mezzanine debt, and real estate partnerships. Valuation adjustments are recorded to reflect the fair value of limited partnerships. These adjustments are recorded as a component of equity in earnings of limited partnerships in the Consolidated Statements of Operations.
We experienced an increase in earnings as a result of asset value increases recognized in 2011 due to generally favorable market conditions. Limited partnership earnings tend to be cyclical based upon market conditions, the age of the partnership and the nature of the investments. Generally, limited partnership earnings are recorded on a quarter lag from financial statements we receive from our general partners. As a consequence, earnings from limited partnerships reported at December 31, 2011 reflect investment valuation changes resulting from the financial markets and the economy through September 30, 2011.
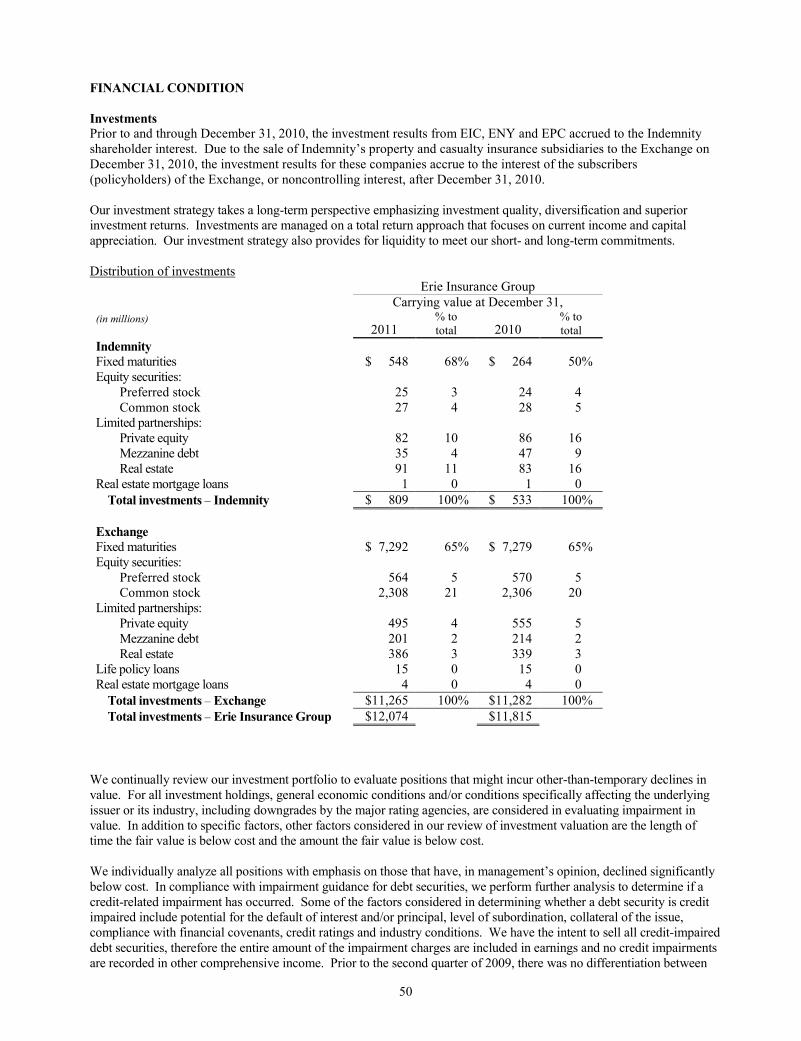
50
FINANCIAL CONDITION
Investments
Prior to and through December 31, 2010, the investment results from EIC, ENY and EPC accrued to the Indemnity shareholder interest. Due to the sale of Indemnity’s property and casualty insurance subsidiaries to the Exchange on December 31, 2010, the investment results for these companies accrue to the interest of the subscribers (policyholders) of the Exchange, or noncontrolling interest, after December 31, 2010. Our investment strategy takes a long-term perspective emphasizing investment quality, diversification and superior investment returns. Investments are managed on a total return approach that focuses on current income and capital appreciation. Our investment strategy also provides for liquidity to meet our short- and long-term commitments. Distribution of investments
Erie Insurance Group
Carrying value at December 31,
(in millions) 2011
% to total 2010
% to total
Indemnity Fixed maturities $ 548 68% $ 264 50% Equity securities:
Preferred stock 25 3 24 4 Common stock 27 4 28 5
Limited partnerships: Private equity 82 10 86 16 Mezzanine debt 35 4 47 9 Real estate 91 11 83 16
Real estate mortgage loans 1 0 1 0
Total investments – Indemnity $ 809 100% $ 533 100%
Exchange Fixed maturities $ 7,292 65% $ 7,279 65% Equity securities:
Preferred stock 564 5 570 5 Common stock 2,308 21 2,306 20
Limited partnerships: Private equity 495 4 555 5 Mezzanine debt 201 2 214 2 Real estate 386 3 339 3
Life policy loans 15 0 15 0 Real estate mortgage loans 4 0 4 0
Total investments – Exchange $11,265 100% $11,282 100%
Total investments – Erie Insurance Group $12,074 $11,815
We continually review our investment portfolio to evaluate positions that might incur other-than-temporary declines in value. For all investment holdings, general economic conditions and/or conditions specifically affecting the underlying issuer or its industry, including downgrades by the major rating agencies, are considered in evaluating impairment in value. In addition to specific factors, other factors considered in our review of investment valuation are the length of time the fair value is below cost and the amount the fair value is below cost. We individually analyze all positions with emphasis on those that have, in management’s opinion, declined significantly below cost. In compliance with impairment guidance for debt securities, we perform further analysis to determine if a credit-related impairment has occurred. Some of the factors considered in determining whether a debt security is credit impaired include potential for the default of interest and/or principal, level of subordination, collateral of the issue, compliance with financial covenants, credit ratings and industry conditions. We have the intent to sell all credit-impaired debt securities, therefore the entire amount of the impairment charges are included in earnings and no credit impairments are recorded in other comprehensive income. Prior to the second quarter of 2009, there was no differentiation between

51
impairments related to credit loss and those related to other factors and declines in fair value of debt securities were deemed other-than-temporary if we did not have the intent and ability to hold a security to recovery. For available-for-sale equity securities, a charge is recorded in the Consolidated Statements of Operations for positions that have experienced other-than-temporary impairments due to credit quality or other factors. (See the “Investment Operations” section herein for further information.) Management believes its investment valuation philosophy and accounting practices result in appropriate and timely measurement of value and recognition of impairment. Fixed maturities Under our investment strategy, we maintain a fixed maturity portfolio that is of high quality and well diversified within each market sector. This investment strategy also achieves a balanced maturity schedule. Our fixed maturity portfolio is managed with the goal of achieving reasonable returns while limiting exposure to risk. Our municipal bond portfolio accounts for $221 million, or 40%, of the total fixed maturity portfolio for Indemnity and $1.4 billion, or 19%, of the fixed maturity portfolio for the Exchange at December 31, 2011. The overall credit rating of the municipal portfolio without consideration of the underlying insurance is AA. Although some of our municipal holdings are insured, the underlying insurance does not improve the overall credit rating. Fixed maturities classified as available-for-sale are carried at fair value with unrealized gains and losses, net of deferred taxes, included in shareholders’ equity. Indemnity’s net unrealized gains on fixed maturities, net of deferred taxes, amounted to $8 million at December 31, 2011, compared to $5 million at December 31, 2010. At December 31, 2011, the Exchange had net unrealized gains on fixed maturities of $301 million, compared to $270 million at December 31, 2010. The following table presents a breakdown of the fair value of our fixed maturity portfolio by sector and rating for Indemnity and the Exchange, respectively, as of December 31, 2011:
Erie Insurance Group (1)
(in millions) At December 31, 2011
Indemnity Non-investment Fair Industry Sector AAA AA A BBB grade value
Communications $ 0 $ 0 $ 23 $ 7 $0 $ 30 Consumer 0 0 8 20 0 28 Energy 0 0 11 18 0 29 Financial 0 43 58 36 0 137 Government-municipal 95 95 22 9 0 221 Industrial 0 4 7 5 0 16 Structured securities (2) 20 0 0 4 0 24 Technology 0 0 8 15 0 23 Utilities 0 0 0 40 0 40
Total – Indemnity $115 $142 $137 $154 $0 $548
(1) Ratings are supplied by S&P, Moody’s, and Fitch. The table is based upon the lowest rating for each security.
(2) Structured securities include asset-backed securities, collateral, lease and debt obligations, commercial mortgage-backed securities and
residential mortgage-backed securities.

52
Erie Insurance Group (1)
(in millions) At December 31, 2011
Exchange Non-investment Fair Industry Sector AAA AA A BBB grade value
Basic materials $ 0 $ 0 $ 58 $ 179 $ 6 $ 243 Communications 0 0 215 294 12 521 Consumer 0 31 243 403 69 746 Diversified 0 0 22 0 0 22 Energy 16 12 116 373 37 554 Financial 7 304 1,098 810 136 2,355 Foreign government 0 0 15 0 0 15 Funds 0 0 0 6 0 6 Government-municipal 408 775 165 30 1 1,379 Government sponsored entity 0 9 2 0 0 11 Industrial 0 6 80 195 26 307 Structured securities (2) 66 266 24 23 2 381 Technology 0 0 38 105 0 143 U.S. Treasury 0 6 0 0 0 6 Utilities 0 0 101 460 42 603
Total – Exchange $497 $1,409 $2,177 $2,878 $331 $7,292
(1) Ratings are supplied by S&P, Moody’s, and Fitch. The table is based upon the lowest rating for each security.
(2) Structured securities include asset-backed securities, collateral, lease and debt obligations, commercial mortgage-backed securities and
residential mortgage-backed securities.
Equity securities Our equity securities consist of common stock and non-redeemable preferred stock. Investment characteristics of common stock and non-redeemable preferred stock differ substantially from one another. Our non-redeemable preferred stock portfolio provides a source of current income that is competitive with investment-grade bonds. The following table presents an analysis of the fair value of our preferred and common stock securities by sector for Indemnity and the Exchange, respectively:
Erie Insurance Group
(in millions) Fair value at December 31, 2011 December 31, 2010
Indemnity Industry sector
Preferred stock
Common stock
Preferred stock
Common stock
Communications $ 1 $ 2 $ 1 $ 2 Consumer 0 15 0 14 Diversified 0 1 0 0 Energy 0 1 0 2 Financial 11 4 11 6 Industrial 0 3 2 3 Technology 3 1 3 1 Utilities 10 0 7 0
Total – Indemnity $25 $27 $24 $28

53
Erie Insurance Group
(in millions) Fair value at December 31, 2011 December 31, 2010
Exchange Industry sector
Preferred stock
Common stock
Preferred stock
Common stock
Basic materials $ 0 $ 72 $ 0 $ 124 Communications 9 168 9 174 Consumer 5 763 5 564 Diversified 0 18 0 12 Energy 0 203 0 185 Financial 408 340 428 292 Funds 0 105 0 309 Government 0 0 0 0 Industrial 0 350 5 324 Technology 15 246 14 295 Utilities 127 43 109 27
Total – Exchange $564 $2,308 $570 $2,306
Our preferred stock equity securities are classified as available-for-sale and are carried at fair value on the Consolidated Statements of Financial Position with all changes in unrealized gains and losses reflected in other comprehensive income. At December 31, 2011, the unrealized gain on preferred stock classified as available-for-sale securities, net of deferred taxes amounted to $1 million for Indemnity and $21 million for the Exchange, compared to an unrealized gain, net of deferred taxes, of $3 million for Indemnity and $44 million for the Exchange at December 31, 2010. Our common stock portfolio is classified as a trading portfolio and is measured at fair value with all changes in unrealized gains and losses reflected in our Consolidated Statements of Operations.
Limited partnerships In 2011, investments in limited partnerships decreased modestly from the investment levels at December 31, 2010 primarily due to net distributions from the partnerships. Changes in partnership values are a function of contributions and distributions, adjusted for market value changes in the underlying investments. Due to favorable market conditions during 2011, limited partnership market values and earnings were generally positive. The components of limited partnership investments are as follows:
Erie Insurance Group
(in millions) At December 31,
2011 2010
Indemnity Private equity $ 82 $ 86 Mezzanine debt 35 47 Real estate 91 83
Total limited partnerships – Indemnity $ 208 $ 216
Exchange Private equity $ 495 $ 555 Mezzanine debt 201 214 Real estate 386 339
Total limited partnerships – Exchange $1,082 $1,108

54
Liabilities
Property and casualty loss and loss expense reserves Loss reserves are established to account for the estimated ultimate costs of loss and loss expenses for claims that have been reported but not yet settled and claims that have been incurred but not reported. While we exercise professional diligence to establish reserves at the end of each period that are fully reflective of the ultimate value of all claims incurred, these reserves are, by their nature, only estimates and cannot be established with absolute certainty. The factors which may potentially cause the greatest variation between current reserve estimates and the actual future paid amounts are: unforeseen changes in statutory or case law altering the amounts to be paid on existing claim obligations, new medical procedures and/or drugs with costs significantly different from those seen in the past, and claims patterns on current business that differ significantly from historical claims patterns. Loss and loss expense reserves are presented on our Consolidated Statements of Financial Position on a gross basis. The following table represents the direct and assumed loss and loss expense reserves by major line of business for our property and casualty insurance operations. The reinsurance recoverable amount represents the related ceded amounts which results in the net liability attributable to the Property and Casualty Group.
Property and Casualty Group
(in millions) At December 31,
2011 2010
Gross reserve liability (1): Personal auto $1,093 $1,105 Automobile massive injury 356 440 Homeowners 313 240 Workers compensation 461 481 Workers compensation massive injury 99 154 Commercial auto 303 286 Commercial multi-peril 565 566 All other lines of business 309 312
Total 3,499 3,584 Less: reinsurance recoverable 151 188
Net reserve liability $3,348 $3,396
(1) Loss reserves are set at full expected cost, except for workers compensation loss reserves which have been
discounted using an interest rate of 2.5%. This discounting reduced unpaid losses and loss expenses by $84 million and $127 million at December 31, 2011 and 2010, respectively.
The reserves that have the greatest potential for variation are the massive injury lifetime medical claim reserves. The Property and Casualty Group is currently reserving for about 285 claimants requiring lifetime medical care, of which 110 involve massive injuries. The reserve carried by the Property and Casualty Group for the massive injury claimants, which includes automobile and workers compensation massive injury reserves, totaled $315 million at December 31, 2011, which is net of $140 million of anticipated reinsurance recoverables, compared to $428 million at December 31, 2010, which was net of $166 million of anticipated reinsurance recoverables. The decrease in the pre-1986 automobile massive injury gross reserves at December 31, 2011, compared to December 31, 2010, was primarily due to improved annual claims cost expectations and the closing of four massive injury lifetime medical claims, while the decrease in the workers compensation massive injury reserves at December 31, 2011, compared to December 31, 2010, was primarily due to the closing of seven massive injury lifetime medical claims. The estimation of ultimate liabilities for these claims is subject to significant judgment due to variations in medical cost inflation, claimant health and mortality over time. It is anticipated that these massive injury lifetime medical claims will require payments over the next 30 to 40 years. Actual experience, however, may emerge in a manner that is different relative to the original assumptions, which could have a significant impact on our reserve estimates. A 100-basis point change in the medical cost inflation assumption would result in a change in the combined automobile and workers compensation massive injury reserves of $81 million. Massive injury claims payments totaled $15 million, $21 million, and $16 million in 2011, 2010 and 2009, respectively. Life insurance reserves EFL’s primary commitment is its obligation to pay future policy benefits under the terms of its life insurance and annuity contracts. To meet these future obligations, EFL establishes life insurance reserves based upon the type of policy, the

55
age, gender and risk class of the insured and the number of years the policy has been in force. EFL also establishes annuity and universal life reserves based upon the amount of policyholder deposits (less applicable insurance and expense charges) plus interest earned on those deposits. Life insurance and annuity reserves are supported primarily by EFL’s long-term, fixed income investments, as the underlying policy reserves are generally also of a long-term nature.
Shareholders’ Equity
Pension plan The funded status of our postretirement benefit plans is recognized in the statement of financial position, with a corresponding adjustment to accumulated other comprehensive income, net of tax. At December 31, 2011, shareholders’ equity decreased by $41 million, net of tax, of which $5 million represents amortization of the prior service cost and net actuarial loss and $46 million represents the current period actuarial loss. The 2011 actuarial loss was primarily due to the change in the discount rate assumption used to measure the future benefit obligations to 4.99% in 2011, from 5.69% in 2010. At December 31, 2010, shareholders’ equity decreased by $4 million, net of tax, of which $3 million represents amortization of the prior service cost and net actuarial loss and $7 million represents the current period actuarial loss. The 2010 actuarial loss was primarily due to the change in the discount rate assumption used to measure the future benefit obligations to 5.69% in 2010, from 6.11% in 2009. Although Indemnity is the sponsor of these postretirement plans and records the funded status of these plans, generally the Exchange and EFL reimburse Indemnity for approximately 57% of the annual benefit expense of these plans.
IMPACT OF INFLATION
Property and casualty insurance premiums are established before losses occur and before loss expenses are incurred, and therefore, before the extent to which inflation may impact such costs is known. Consequently, in establishing premium rates, we attempt to anticipate the potential impact of inflation, including medical cost inflation, construction and auto repair cost inflation and tort issues. Medical costs are a broad element of inflation that impacts personal and commercial auto, general liability, workers compensation and commercial multi-peril lines of insurance written by the Property and Casualty Group. Inflation assumptions take the form of explicit numerical values in the survival ratio, individual claim, and massive injury lifetime medical reserving methods. Inflation assumptions are implicitly derived through the selection of applicable loss development patterns for all other reserving methods. Occasionally, unusual aberrations in loss development patterns are caused by external and internal factors such as changes in claim reporting, settlement patterns, unusually large losses, process changes, legal or regulatory changes, and other influences. In these instances, analyses of alternate development factor selections are performed to evaluate the effect of these factors and actuarial judgment is applied to make appropriate assumptions needed to develop a best estimate of ultimate losses.
LIQUIDITY AND CAPITAL RESOURCES
Sources and Uses of Cash
Liquidity is a measure of a company’s ability to generate sufficient cash flows to meet the short- and long-term cash requirements of its business operations and growth needs. Our liquidity requirements have been met primarily by funds generated from premiums collected and income from investments. The insurance operations provide liquidity in that premiums are collected in advance of paying losses under the policies purchased with those premiums. Cash outflows for the property and casualty insurance business are generally variable since settlement dates for liabilities for unpaid losses and the potential for large losses, whether individual or in the aggregate, cannot be predicted with absolute certainty. Accordingly, after satisfying our operating cash requirements, excess cash flows are used to build our investment portfolio in order to increase future investment income, which then may be used as a source of liquidity if cash from our insurance operations would not be sufficient to meet our obligations. Cash provided from these sources is used primarily to fund losses and policyholder benefits, fund the costs of operations including commissions, salaries and wages, pension plans, share repurchases, dividends to shareholders and the purchase and development of information technology. We expect that our operating cash needs will be met by funds generated from operations.
Volatility in the financial markets presents challenges to us as we do occasionally access our investment portfolio as a source of cash. Some of our fixed income investments, despite being publicly traded, are illiquid. Volatility in these markets could impair our ability to sell certain of our fixed income securities or cause such securities to sell at deep discounts. Additionally, our limited partnership investments are significantly less liquid. We believe we have sufficient liquidity to meet our needs from other sources even if market volatility persists throughout 2012.

56
Cash flow activities – Erie Insurance Group The following table provides condensed consolidated cash flow information for the years ended December 31:
(in millions) Erie Insurance Group
2011 2010 2009
Net cash provided by operating activities $ 360 $ 721 $ 889 Net cash used in investing activities (375) (405) (890) Net cash used in financing activities (230) (120) (42)
Net (decrease) increase in cash $(245) $ 196 $ (43)
Net cash provided by operating activities totaled $360 million in 2011, $721 million in 2010, and $889 million in 2009. Decreased cash from operating activities in 2011 was primarily driven by increased losses paid to policyholders related to catastrophic events and commissions paid to agents as compared to 2010. Offsetting this decrease in 2011 were increases in premiums collected by the Exchange and limited partnership distributions received as compared to 2010. The decrease in 2010, compared to 2009, was primarily driven by the payment of federal income taxes of $69 million, compared to the recovery of federal income taxes of $121 million in 2009. At December 31, 2011, we recorded a net deferred tax asset of $19 million related to Indemnity and a net deferred tax liability of $147 million related to the Exchange. There was no valuation allowance at December 31, 2011. In the fourth quarter of 2011 we received a tax refund of $8 million related to the carry-back of 2010 capital losses and a refund of $1 million related to the 2010 return. Net cash used in investing activities totaled $375 million in 2011, $405 million in 2010, and $890 million in 2009. In 2011, cash used in investing activities decreased compared to 2010 as we generated more proceeds from the sale of certain common stocks offset somewhat by an increase in cash used to purchase other common stock investments. At December 31, 2011, we had contractual commitments to invest up to $424 million related to our limited partnership investments to be funded as required by the partnerships’ agreements. Of this amount, the total remaining commitment to fund limited partnerships that invest in private equity securities was $179 million, mezzanine debt securities was $129 million, and real estate activities was $116 million. In 2010, cash used in investing activities decreased compared to 2009 as we generated more proceeds from limited partnerships and certain fixed maturities while using less cash for the purchase of other fixed maturities. For a discussion of net cash used in financing activities, see the following “Cash flow activities – Indemnity,” for the primary drivers of financing cash flows related to Indemnity. Cash flow activities – Indemnity The following table is a summary of cash flows for Indemnity for the years ended December 31:
(in millions) Indemnity Shareholder Interest
2011 2010 2009
Net cash provided by operating activities $ 169 $ 193 $180 Net cash (used in) provided by investing activities (211) 196 (69) Net cash used in financing activities (257) (155) (96)
Net (decrease) increase in cash $(299) $ 234 $ 15
See Item 8. “Financial Statements and Supplementary Data - Note 23, Indemnity Supplemental Information, of Notes to Consolidated Financial Statements” contained within this report for more detail on Indemnity’s cash flows.
Net cash provided by Indemnity’s operating activities decreased to $169 million in 2011, compared to $193 million in 2010, and $180 million in 2009. Decreased cash from operating activities in 2011 was primarily due to increases in commissions paid to agents, salaries and benefits paid to employees and income taxes paid, combined with less net investment income received. This decrease was offset somewhat by an increase in management fee revenue received as compared to 2010. Management fee revenues were higher reflecting the increase in premiums written or assumed by the Exchange. Cash paid for agent commissions and bonuses increased to $583 million in 2011, compared to $532 million in 2010, as a result of the increase in premiums collected by the Exchange. Indemnity made a contribution to its pension plan of $15 million in 2011, compared to $13 million in 2010. Additionally, Indemnity made a contribution to its pension plan for $16 million in January 2012. Indemnity’s policy for funding its pension plan is generally to contribute an amount equal to the greater of the IRS minimum required contribution or the target normal cost for the year plus

57
interest to the date the contribution is made. Indemnity is generally reimbursed about 57% of the net periodic benefit cost of the pension plan from its affiliates. In 2010, increased cash from operating activities, compared to 2009, was primarily due to an increase in management fee revenues received offset by a decrease in reimbursements collected from affiliates.
At December 31, 2011, Indemnity recorded a net deferred tax asset of $19 million. There was no valuation allowance at December 31, 2011. Indemnity’s capital gain and loss strategies take into consideration its ability to offset gains and losses in future periods, carry-back of capital loss opportunities to the three preceding years, and capital loss carry-forward opportunities to apply against future capital gains over the next five years.
Net cash used in Indemnity’s investing activities totaled $211 million in 2011, compared to cash provided of $196 million in 2010, and cash used of $69 million in 2009. In the first quarter of 2011, Indemnity received cash consideration from the Exchange of $82 million as a result of the sale of Indemnity’s 21.6% ownership interest in EFL to the Exchange on March 31, 2011, which was based upon an estimated purchase price. Final settlement of this transaction was made on April 25, 2011 for a final purchase price of $82 million. Net after-tax cash proceeds to Indemnity from this sale were $58 million. Also in the first quarter of 2011, on March 18, Indemnity paid $8 million to the Exchange as final settlement of the sale of Indemnity’s wholly owned property and casualty insurance subsidiaries, EIC, ENY and EPC, to the Exchange on December 31, 2010, which was based upon the final purchase price. In the fourth quarter of 2010, Indemnity received cash consideration from the Exchange of $281 million, net of $12 million cash disposed, as a result of the sale of EIC, ENY and EPC, to the Exchange on December 31, 2010, which was based upon an estimated purchase price. At this time, Indemnity recorded an $8 million liability to the Exchange for the difference between the GAAP book value and the deferred tax asset, which was payable to the Exchange by March 31, 2011. Net after-tax cash proceeds to Indemnity from this sale were $285 million.
Indemnity’s 2011 investing activities also included increased cash used to purchase certain fixed maturities, offset somewhat by increased cash from the sale of other fixed maturities and common stocks as compared to 2010. Also impacting Indemnity future investing activities are limited partnership commitments, which totaled $40 million at December 31, 2011, and will be funded as required by the partnerships’ agreements. Of this amount, the total remaining commitment to fund limited partnerships that invest in private equity securities was $17 million, mezzanine debt securities was $11 million, and real estate activities was $12 million. Indemnity’s investing activities in 2010 also included increased cash used to purchase certain fixed maturities, offset somewhat by increased cash from the sale of other fixed maturities and limited partnerships compared to 2009. In the second quarter of 2009, Indemnity made a capital contribution to EFL in the amount of $12 million to support EFL’s life insurance and annuity business and strengthen its surplus.
Net cash used in Indemnity’s financing activities totaled $257 million in 2011, $155 million in 2010, and $96 million in 2009. The increase in cash used in financing activities in 2011 was primarily driven by an increase in the cash outlay for the purchase of treasury stock. Indemnity repurchased 2.2 million shares of its Class A nonvoting common stock in conjunction with its stock repurchase program at a total cost of $155 million in 2011. In 2010, shares repurchased under this program totaled 1.1 million at a total cost of $57 million, compared to 0.1 million shares at a total cost of $3 million in 2009. In October 2011, our Board of Directors approved a continuation of the current stock repurchase program for a total of $150 million, with no time limitation. This repurchase authority includes, and is not in addition to, any unspent amounts remaining under the prior authorization. Indemnity had approximately $138 million of repurchase authority remaining under this program at December 31, 2011.
In July 2011, Indemnity also repurchased 64,095 shares of its outstanding Class A nonvoting common stock outside of its publicly announced share repurchase program at a total cost of $4.8 million. Of this amount, 57,695 shares were purchased for $4.3 million, or $73.72 per share, in conjunction with our long-term incentive plan, and 6,400 shares were purchased for $0.5 million, or $73.74 per share, for the vesting of stock-based awards for executive management. These shares were delivered to plan participants and executive management, respectively, in July 2011. In 2010, Indemnity also repurchased 44,206 shares of its outstanding Class A nonvoting common stock outside of its publicly announced share repurchase program at a total cost of $2 million. Of this amount, 39,406 shares were purchased in June 2010 for $1.8 million, or $45.92 per share, in conjunction with our long-term incentive plan, and 4,800 shares were purchased in July 2010 for $0.2 million, or $48.75 per share, for the vesting of stock-based awards for executive management. These shares were delivered to plan participants and executive management, respectively, in July 2010.
Dividends paid to shareholders totaled $102 million, $98 million and $93 million in 2011, 2010 and 2009, respectively. Indemnity increased both its Class A and Class B shareholder quarterly dividends for 2011 and 2010. There are no regulatory restrictions on the payment of dividends to Indemnity’s shareholders. Dividends have been approved at a 7.3% increase for 2012.

58
Capital Outlook
We regularly prepare forecasts evaluating the current and future cash requirements of Indemnity and the Exchange for both normal and extreme risk events. Should an extreme risk event result in a cash requirement exceeding normal cash flows, we have the ability to meet our future funding requirements through various alternatives available to us. Indemnity – Outside of Indemnity’s normal operating and investing cash activities, future funding requirements could be met through 1) Indemnity’s cash and cash equivalents, which total approximately $11 million at December 31, 2011, 2) a $100 million bank revolving line of credit held by Indemnity, and 3) liquidation of assets held in Indemnity’s investment portfolio, including common stock, preferred stock and investment grade bonds which totaled approximately $600 million at December 31, 2011. Volatility in the financial markets could impair Indemnity’s ability to sell certain of its fixed income securities or cause such securities to sell at deep discounts. Additionally, Indemnity has the ability to curtail or modify discretionary cash outlays such as those related to shareholder dividends and share repurchase activities.
Indemnity had no borrowings under its line of credit at December 31, 2011. At December 31, 2011, bonds with fair values of $112 million were pledged as collateral. These securities have no trading restrictions. The bank requires compliance with certain covenants, which include minimum net worth and leverage ratios. Indemnity was in compliance with its bank covenants at December 31, 2011. Prior to and through December 31, 2010, the underwriting results retained by EIC and ENY and the investment results of EIC, ENY and EPC accrued to the Indemnity shareholder interest. Due to the sale of Indemnity’s property and casualty insurance subsidiaries to the Exchange on December 31, 2010, all property and casualty underwriting results and all investment results for these companies accrue to the interest of the subscribers (policyholders) of the Exchange, or noncontrolling interest, after December 31, 2010. The net cash provided from these entities by operating activities totaled $30 million in 2010 and $33 million in 2009. These operating cash flows accrue to the interest of the subscribers (policyholders) of the Exchange, or noncontrolling interest, in 2011 and thereafter. Exchange – Outside of the Exchange’s normal operating and investing cash activities, future funding requirements could be met through 1) the Exchange’s cash and cash equivalents, which total approximately $174 million at December 31, 2011, 2) a $300 million bank revolving line of credit held by the Exchange, and 3) liquidation of assets held in the Exchange’s investment portfolio, including common stock, preferred stock and investment grade bonds which totaled approximately $9.8 billion at December 31, 2011. Volatility in the financial markets could impair the Exchange’s ability to sell certain of its fixed income securities or cause such securities to sell at deep discounts. The Exchange had no borrowings under its line of credit at December 31, 2011. At December 31, 2011, bonds with fair values of $333 million were pledged as collateral. These securities have no trading restrictions. The bank requires compliance with certain covenants, which include statutory surplus and risk based capital ratios. The Exchange was in compliance with its bank covenants at December 31, 2011. Indemnity has no rights to the assets, capital, or line of credit of the Exchange and, conversely, the Exchange has no rights to the assets, capital, or line of credit of Indemnity. We believe we have the funding sources available to us to support our cash flow requirements in 2012.
Contractual Obligations
Cash outflows for the Property and Casualty Group are variable because the fluctuations in settlement dates for claims payments vary and cannot be predicted with absolute certainty. While volatility in claims payments could be significant for the Property and Casualty Group, the cash flow requirements for claims have not historically had a significant effect on our liquidity. Based upon a historical 15 year average, approximately 30% of losses and loss expenses included in reserves for the Property and Casualty Group are paid out within the first 12 months, and approximately 70% are paid out within the first five years. Amounts that are paid out after the first five years reflect long-tail lines such as workers compensation and auto bodily injury.

59
We have certain obligations and commitments to make future payments under various contracts. As of December 31, 2011, the aggregate obligations were as follows:
Erie Insurance Group
Payments due by period
(in millions) 2017 and
Total 2012 2013-2014 2015-2016 thereafter
Fixed obligations:
Indemnity: Limited partnership commitments (1) $ 40 $ 40 $ 0 $ 0 $ 0 Pension contribution (2) 16 16 0 0 0 Other commitments (3) 41 21 19 1 0 Operating leases – vehicles 14 4 8 2 0 Operating leases – real estate (4) 6 2 3 1 0 Operating leases – computers 4 3 1 0 0 Financing arrangements 2 1 1 0 0
Total fixed contractual obligations – Indemnity 123 87 32 4 0
Noncontrolling interest: Limited partnership commitments (1) 384 262 38 84 0
Total fixed contractual obligations – Exchange 384 262 38 84 0
Total fixed contractual obligations – Erie Insurance Group 507 349 70 88 0 Gross property and casualty loss and loss expense reserves – Exchange (5) 3,499 1,085 1,015 420 979 Life gross long-term liabilities (6) 4,441 170 357 417 3,497
Gross contractual obligations – Erie Insurance Group (7) $8,447 $1,604 $1,442 $925 $4,476
Gross contractual obligations net of estimated reinsurance recoverables are as follows:
Erie Insurance Group
Payments due by period
(in millions) 2017 and
Total 2012 2013-2014 2015-2016 thereafter
Gross contractual obligations – Erie Insurance Group (7) $8,447 $1,604 $1,442 $925 $4,476 Estimated reinsurance recoverables – property and casualty 151 8 13 10 120 Estimated reinsurance recoverables – life (8) 512 27 47 49 389
Net contractual obligations – Erie Insurance Group $7,784 $1,569 $1,382 $866 $3,967
(1) Limited partnership commitments will be funded as required for capital contributions at any time prior to the agreement expiration date. The
commitment amounts are presented using the expiration date as the factor by which to age when the amounts are due. At December 31, 2011,
Indemnity’s total commitment to fund limited partnerships that invest in private equity securities is $17 million, mezzanine debt of $11 million, and real estate activities $12 million. At December 31, 2011, the Exchange’s total commitment to fund limited partnerships that invest in private equity
securities is $162 million, mezzanine debt of $118 million, and real estate activities $104 million.
(2) The pension contribution for 2012 was estimated in accordance with the Pension Protection Act of 2006. Contributions anticipated in future years
are expected to be an amount at least equal to the IRS minimum required contribution in accordance with this Act.
(3) Other commitments include various agreements for service, including such things as computer software, telephones and maintenance.
(4) Operating leases – real estate are for 16 of our 24 field offices that are operated in the states in which the Property and Casualty Group does
business and two operating leases are for warehousing facilities leased from unaffiliated parties.
(5) Due to the sale of Indemnity’s property and casualty insurance subsidiaries to the Exchange on December 31, 2010, all property and casualty loss and loss expense reserves accrue to the interest of the subscribers (policyholders) of the Exchange, or noncontrolling interest, after December 31,
2010.
(6) Contractual obligations on gross long-term liabilities represent estimated benefit payments from insurance policies and annuity contracts including
claims currently payable. Actual obligations in any single year will vary based upon actual mortality, morbidity, lapse and withdrawal experience. The sum of these obligations exceeds the liability on the Consolidated Statements of Financial Position of $1.7 billion due to expected future
premiums and investment income that, along with invested assets backing the liabilities, will be used to fund these obligations.
(7) Gross contractual obligations do not include the obligations for our unfunded benefit plans, including the Supplemental Employee Retirement Plan
(SERP) for our executive and senior management. The recorded accumulated benefit obligation for this plan at December 31, 2011, is $7 million. We expect to have sufficient cash flows from operations to meet the future benefit payments as they become due.
(8) Reinsurance recoverables on life business includes estimated amounts from reinsurers on long-term liabilities that are subject to the credit
worthiness of the reinsurer.

60
Off-Balance Sheet Arrangements
Off-balance sheet arrangements include those with unconsolidated entities that may have a material current or future effect on our financial condition or results of operations, including material variable interests in unconsolidated entities that conduct certain activities. We have no material off-balance sheet obligations or guarantees, other than limited partnership investment commitments.
Financial Ratings
Our property and casualty insurers are rated by rating agencies that provide insurance consumers with meaningful information on the financial strength of insurance entities. Higher ratings generally indicate financial stability and a strong ability to pay claims. The ratings are generally based upon factors relevant to policyholders and are not directed toward return to investors. The insurers of the Property and Casualty Group are currently rated by AM Best Company as follows:
Erie Insurance Exchange A+ Erie Insurance Company A+ Erie Insurance Property and Casualty Company A+ Erie Insurance Company of New York A+ Flagship City Insurance Company A+ Erie Family Life Insurance Company A The outlook for all ratings is stable. According to AM Best, a “Superior” rating (A+), the second highest of their financial strength rating categories, is assigned to those companies that, in AM Best’s opinion, have achieved superior overall performance when compared to the standards established by AM Best and have a superior ability to meet their obligations to policyholders over the long term. Less than 10% of insurance groups are rated A+ or higher, and we are included in that group. By virtue of its affiliation with the Property and Casualty Group, EFL is typically rated one level lower, or an “Excellent” rating (A), than our property and casualty insurance companies by AM Best Company. The insurers of the Property and Casualty Group are also rated by Standard & Poor’s, but this rating is based solely on public information. Standard & Poor’s rates these insurers Api, “strong.” Financial strength ratings continue to be an important factor in evaluating the competitive position of insurance companies.
Regulatory Risk-Based Capital
The standard set by the National Association of Insurance Commissioners (NAIC) for measuring the solvency of insurance companies, referred to as Risk-Based Capital (RBC), is a method of measuring the minimum amount of capital appropriate for an insurance company to support its overall business operations in consideration of its size and risk profile. The RBC formula is used by state insurance regulators as an early warning tool to identify, for the purpose of initiating regulatory action, insurance companies that potentially are inadequately capitalized. In addition, the formula defines minimum capital standards that will supplement the current system of low fixed minimum capital and surplus requirements on a state-by-state basis. At December 31, 2011, the members of the Property and Casualty Group and EFL had RBC levels substantially in excess of levels that would require regulatory action.
Regulatory Restrictions on Surplus
The members of the Property and Casualty Group and EFL are subject to various regulatory restrictions that limit the maximum amount of dividends available to be paid without prior approval of insurance regulatory authorities. The Exchange’s property and casualty insurance subsidiaries have a maximum of $30 million available for such dividends in 2012 without prior approval of the Pennsylvania Insurance Commissioner for Pennsylvania-domiciled subsidiaries and the New York Superintendent of Insurance for the New York domiciled subsidiary. No dividends were paid from the property and casualty insurance subsidiaries in 2011, 2010 or 2009. The maximum dividend EFL could pay the Exchange in 2012 without prior approval is $33 million. No dividends were paid to Indemnity or the Exchange in 2011, 2010 or 2009. The Exchange is operated for the interest of its subscribers (policyholders) and any distributions it might declare would only be payable to them. The Exchange did not make any distributions to its subscribers (policyholders) in 2011, 2010 or 2009.

61
Enterprise Risk Management
We are exposed to many risks as a large property and casualty insurer with supplemental life insurance operations. The role of our Enterprise Risk Management (ERM) function is to ensure that all significant risks are clearly identified, understood, proactively managed and consistently monitored to achieve strategic objectives for all stakeholders of the Erie Insurance Group. As an insurance company, we are in the business of taking risks from our policyholders, managing these risks in a cost-effective manner and ensuring long term stability for policyholders as well as shareholders. Since risk is integral to our business, we strive to manage the multitude of risks we face in an optimal manner. Our risks can be broadly classified into insurance, investment and operational risks. These risks are a function of our business segments as well as the market and regulatory environment within which we operate. Since certain risks can occur simultaneously or be correlated with other risks, an event or a series of events has the potential to impact multiple areas of our business and materially affect our results of operations, financial position or liquidity. Therefore our ERM program takes a holistic view of risk and ensures implementation of risk responses to mitigate potential impacts across our entire group of companies. Our ERM process is founded on a governance framework that ensures oversight at multiple levels of our organization, including our Board of Directors and risk committees made up of senior management. Accountability to identify, manage and mitigate risk is embedded within all functions and areas of our business. We have defined risk tolerances to monitor and manage significant risks within acceptable levels. In addition to identifying, evaluating, prioritizing, monitoring and mitigating significant risks, our ERM process includes extreme event analyses and scenario testing. Dynamic Financial Analysis (DFA) and catastrophe modeling enable us to quantify risk within our property and casualty insurance operations and investment portfolio. Model output is used to quantify the potential variability of future performance and the sufficiency of capital levels given our defined tolerance for risk. These models provide insight into capital management, allocation of capital by product lines, catastrophe exposure management and reinsurance purchasing decisions. Additionally, ERM tools have been developed and modified to enhance our ability to assess project level risk and to provide senior management with pertinent risk information, enabling them to make better informed decisions.

62
TRANSACTIONS / AGREEMENTS BETWEEN INDEMNITY AND NONCONTROLLING INTEREST
(EXCHANGE)
Board Oversight
Our Board of Directors has a broad oversight responsibility over our intercompany relationships within and among the Property and Casualty Group. As a consequence, our Board of Directors may be required to make decisions or take actions that may not be solely in the interest of our shareholders, such as setting the management fee rate paid by the Exchange to Indemnity and ratifying any other significant intercompany activity.
Subscriber’s Agreement
Indemnity serves as attorney-in-fact for the policyholders at the Exchange, a reciprocal insurance exchange. Each applicant for insurance to a reciprocal insurance exchange signs a subscriber’s agreement that contains an appointment of an attorney-in-fact. Through the designation of attorney-in-fact, Indemnity is required to provide sales, underwriting and policy issuance services to the policyholders of the Exchange, as discussed previously. Pursuant to the subscriber’s agreement, Indemnity earns a management fee for these services calculated as a percentage of the direct premiums written by the Exchange and the other members of the Property and Casualty Group, which are assumed by the Exchange under an intercompany pooling arrangement.
Intercompany Agreements
Pooling Members of the Property and Casualty Group participate in an intercompany reinsurance pooling agreement. Under the pooling agreement, all insurance business of the Property and Casualty Group is pooled in the Exchange. The Erie Insurance Company and Erie Insurance Company of New York share in the underwriting results of the reinsurance pool through retrocession. Since 1995, the Board of Directors has set the allocation of the pooled underwriting results at 5.0% participation for Erie Insurance Company, 0.5% participation for Erie Insurance Company of New York, and 94.5% participation for the Exchange. Prior to and through December 31, 2010, the underwriting results retained by Erie Insurance Company and Erie Insurance Company of New York accrued to the Indemnity shareholder interest. Due to the sale of Indemnity’s property and casualty insurance subsidiaries to the Exchange on December 31, 2010, all property and casualty underwriting results for these companies accrue to the interest of the subscribers (policyholders) of the Exchange, or noncontrolling interest, after December 31, 2010.
Service agreements Indemnity makes certain payments on behalf of the Erie Insurance Group’s related entities. These amounts are reimbursed to Indemnity on a cost basis in accordance with service agreements between Indemnity and the individual entities within the Erie Insurance Group. These reimbursements have generally been settled quarterly; however, beginning in the fourth quarter of 2011, the reimbursements are settled monthly. Leased property The Exchange leases certain office space to Indemnity, including the home office and three field office facilities. Rents are determined considering returns on invested capital and building operating and overhead costs. Rental costs of shared facilities are allocated based upon square footage occupied.
Cost Allocation
The allocation of costs affects the financial condition of the Erie Insurance Group companies. Management’s role is to determine that allocations are consistently made in accordance with the subscriber’s agreements with the policyholders at the Exchange, intercompany service agreements and applicable insurance laws and regulations. Allocation of costs under these various agreements requires judgment and interpretation, and such allocations are performed using a consistent methodology, which is intended to adhere to the terms and intentions of the underlying agreements.

63
Intercompany Receivables of Indemnity
Indemnity Shareholder Interest
(in millions) 2011
Percent of Indemnity
total assets 2010
Percent of Indemnity
total assets 2009
Percent of Indemnity
total assets
Reinsurance recoverable from and ceded unearned premiums to the Exchange $ U 0.0% $ U 0.0% $ 902 33.8% Other receivables from the Exchange and affiliates (management fees, costs and reimbursements) 254 20.5 232 17.7 213 8.0 Note receivable from EFL 25 2.0 25 1.9 25 0.9
Total intercompany receivables $279 22.5% $257 19.6% $1,140 42.7%
Indemnity has significant receivables from the Exchange that result in a concentration of credit risk. In 2009, these receivables included the liability for losses and unearned premiums ceded to the Exchange under the intercompany pooling agreement and from management services performed by Indemnity for the Exchange. Prior to and through December 31, 2010, all property and casualty insurance underwriting receivables recorded by EIC, ENY and EPC accrued to the Indemnity shareholder interest. Due to the sale of Indemnity’s property and casualty insurance subsidiaries to the Exchange on December 31, 2010, all property and casualty underwriting receivables accrue to the interest of the subscribers (policyholders) of the Exchange, or noncontrolling interest, on and after December 31, 2010. At December 31, 2010 and thereafter, Indemnity’s receivables from the Exchange primarily include the management fee due for services performed by Indemnity for the Exchange under the subscriber’s agreement.
Credit risks related to the receivables from the Exchange are evaluated periodically by management. Prior to and through December 31, 2010, reinsurance contracts did not relieve Indemnity from its primary obligations to policyholders if the Exchange was unable to satisfy its obligation, and Indemnity collected its reinsurance recoverable amounts generally within 30 days of actual settlement of losses.
In addition to Indemnity’s receivable from the Exchange for management fees and costs Indemnity pays on behalf of the Exchange, Indemnity also pays certain costs for, and is reimbursed by, EFL. Since its inception, Indemnity has collected these amounts due from the Exchange and EFL in a timely manner, normally quarterly. Beginning in the fourth quarter of 2011, the receivable from the Exchange for management fees and costs Indemnity pays on behalf of the Exchange is settled monthly.
Surplus Notes
Indemnity holds a surplus note for $25 million from EFL that is payable on demand on or after December 31, 2018; however, no principal or interest payments may be made without prior approval of the Pennsylvania Insurance Commissioner. EFL paid interest to Indemnity on the surplus note of $2 million in both 2011 and 2010. The Exchange holds a surplus note for $20 million from EFL that is payable on demand on or after December 31, 2025; however, as stated above, no principal or interest payments may be made without prior approval of the Pennsylvania Insurance Commissioner. EFL paid interest to the Exchange on the surplus note of $1 million in both 2011 and 2010.
Capital Contribution
In June 2009, Indemnity made a $12 million capital contribution to EFL and the Exchange made a $43 million capital contribution to EFL to strengthen its surplus. This $55 million in capital contributions increased EFL’s investments and total shareholders’ equity.

64
ITEM 7A. QUANTITATIVE AND QUALITATIVE DISCLOSURES ABOUT MARKET RISK
Prior to and through December 31, 2010, the investment results from EIC, ENY and EPC accrued to the Indemnity shareholder interest. Due to the sale of Indemnity’s property and casualty insurance subsidiaries to the Exchange on December 31, 2010, the investment results for these companies accrue to the interest of the subscribers (policyholders) of the Exchange, or noncontrolling interest, after December 31, 2010.
Market Risk
Market risk is the risk of loss arising from adverse changes in market rates and prices, such as interest rates, as well as other relevant market rate or price changes. The volatility and liquidity in the markets in which the underlying assets are traded directly influence market risk. The following is a discussion of our primary risk exposures, including interest rate risk, investment credit risk, concentration risk, liquidity risk, equity price risk and how those exposures are currently managed as of December 31, 2011.
Interest Rate Risk
We invest primarily in fixed maturity investments, which comprised 68% of invested assets for Indemnity and 65% of invested assets for the Exchange at December 31, 2011. The value of the fixed maturity portfolio is subject to interest rate risk. As market interest rates decrease, the value of the portfolio goes up with the opposite holding true in rising interest rate environments. We do not hedge our exposure to interest rate risk since we have the capacity and intention to hold the fixed maturity positions until maturity. A common measure of the interest sensitivity of fixed maturity assets is modified duration, a calculation that utilizes maturity, coupon rate, yield and call terms to calculate an average age of the expected cash flows. The longer the duration, the more sensitive the asset is to market interest rate fluctuations. Duration is analyzed quarterly to ensure that it remains in the targeted range we established. A sensitivity analysis is used to measure the potential loss in future earnings, fair values or cash flows of market-sensitive instruments resulting from one or more selected hypothetical changes in interest rates and other market rates or prices over a selected period. In our sensitivity analysis model, a hypothetical change in market rates is selected that is expected to reflect reasonably possible changes in those rates. The following pro forma information is presented assuming a 100-basis point increase in interest rates at December 31 of each year and reflects the estimated effect on the fair value of our fixed maturity investment portfolio. We used the modified duration of our fixed maturity investment portfolio to model the pro forma effect of a change in interest rates at December 31, 2011 and 2010. Fixed maturities interest-rate sensitivity analysis
(dollars in millions) Erie Insurance Group
At December 31,
Indemnity 2011 2010
Fair value of fixed income portfolio $ 548 $ 264 Fair value assuming 100-basis point rise in interest rates $ 535 $ 255 Modified duration – Indemnity 2.84 3.93
Exchange Fair value of fixed income portfolio $7,292 $7,279 Fair value assuming 100-basis point rise in interest rates $6,964 $6,954 Modified duration – Exchange 4.89 4.87

65
While the fixed income portfolio is sensitive to interest rates, the future principal cash flows that will be received by contractual maturity date are presented below at December 31, 2011 and 2010. Actual cash flows may differ from those stated as a result of calls, prepayments or defaults.
Contractual repayments of principal by maturity date
Erie Insurance Group
(in millions)
December 31, 2011
Indemnity Exchange
Fixed maturities:
2012 $150 $ 511 2013 114 668 2014 89 530 2015 25 596 2016 20 617 Thereafter 124 3,890
Total (1) $522 $6,812
Fair value $548 $7,292
(1) These amounts exclude Indemnity’s $25 million surplus note due from EFL and the Exchange’s $20 million surplus note due
from EFL.
Erie Insurance Group
December 31, 2010 Indemnity Exchange
Fixed maturities:
2011 $ 64 $ 309 2012 22 553 2013 21 719 2014 18 564 2015 25 681 Thereafter 100 4,030
Total (1) $250 $6,856
Fair value $264 $7,279
(1) These amounts exclude Indemnity’s $25 million surplus note due from EFL and the Exchange’s $20 million surplus note due
from EFL.
Investment Credit Risk
Our objective is to earn competitive returns by investing in a diversified portfolio of securities. Our portfolios of fixed maturity securities, nonredeemable preferred stock, mortgage loans and, to a lesser extent, short-term investments are subject to credit risk. This risk is defined as the potential loss in fair value resulting from adverse changes in the borrower’s ability to repay the debt. We manage this risk by performing upfront underwriting analysis and ongoing reviews of credit quality by position and for the fixed maturity portfolio in total. We do not hedge the credit risk inherent in our fixed maturity investments. Generally, the fixed maturities in our portfolio are rated by external rating agencies. If not externally rated, we rate them internally on a basis consistent with that used by the rating agencies. We classify all fixed maturities as available-for-sale securities, allowing us to meet our liquidity needs and provide greater flexibility to appropriately respond to changes in market conditions.

66
The following table shows our fixed maturity investments by rating as of December 31, 2011:
(dollars in millions) Erie Insurance Group (1)
Amortized cost Fair value Percent of total
Indemnity AAA, AA, A $ 382 $ 394 72% BBB 153 154 28
Total investment grade 535 548 100
BB 0 0 0 B 0 0 0 CCC, CC, C 0 0 0
Total non-investment grade 0 0 0
Total – Indemnity $ 535 $ 548 100%
Exchange AAA, AA, A $3,808 $4,083 56% BBB 2,707 2,878 39
Total investment grade 6,515 6,961 95
BB 273 286 4 B 39 43 1 CCC, CC, C 2 2 0
Total non-investment grade 314 331 5
Total – Exchange $6,829 $7,292 100%
(1) Ratings are supplied by S&P, Moody’s, and Fitch. The table is based upon the lowest rating for each security.
Approximately 4% of Indemnity’s and 5% of the Exchange’s fixed income portfolios are invested in structured products. This includes mortgage-backed securities (MBS), collateralized debt and loan obligations (CDO and CLO), collateralized mortgage obligations (CMO) and asset-backed securities (ABS). The overall credit rating of the structured product portfolio is AA. Our municipal bond portfolio accounts for $221 million, or 40% of the total fixed maturity portfolio for Indemnity, and $1.4 billion, or 19% of the total fixed maturity portfolio for the Exchange. The overall credit rating of our municipal portfolio, without consideration of the underlying insurance, is AA. Our limited partnership investment portfolio is exposed to credit risk, as well as price risk. Price risk is defined as the potential loss in estimated fair value resulting from an adverse change in prices. Our investments are directly affected by the impact of changes in these risk factors on the underlying investments held by our fund managers, which could vary significantly from fund to fund. We manage these risks by performing up-front due diligence on our fund managers, ongoing monitoring, and through the construction of a diversified portfolio. Indemnity is also exposed to a concentration of credit risk with the Exchange. See the section, “Transactions / Agreements between Indemnity and Noncontrolling Interest (Exchange), Intercompany receivables of Indemnity” for further discussion of this risk.
Concentration Risk
While our portfolio is well diversified within each market sector, there is an inherent risk of concentration in a particular industry or sector. We continually monitor our level of exposure to individual issuers as well as our allocation to each industry and market sector against internally established policies. See the “Financial Condition” section of Item 7. “Management’s Discussion and Analysis of Financial Condition and Results of Operations” contained within this report for details of investment holdings by sector.
Liquidity Risk
Periods of volatility in the financial markets can create conditions where fixed maturity investments, despite being publicly traded, can become illiquid. However, we actively manage the maturity profile of our fixed maturity portfolio such that scheduled repayments of principal occur on a regular basis. Additionally, there is no ready market for our investments in limited partnerships which increases the risk that they may not be converted to cash on favorable terms and on a timely basis.

67
Equity Price Risk
Our portfolio of equity securities, which include common stock classified as trading securities and non-redeemable preferred stock classified as available-for-sale, are carried on the Consolidated Statements of Financial Position at estimated fair value. Equity securities are exposed to the risk of potential loss in estimated fair value resulting from an adverse change in prices (“price risk”). We do not hedge our exposure to price risk inherent in our equity investments. The majority of our equity security portfolio is invested in common stock. Our objective is to earn competitive relative returns by investing in a diverse portfolio of high-quality, liquid securities. Portfolio holdings are diversified across industries and among exchange-traded, small- to large-cap stocks. We measure the risk of our common stock portfolio by comparing its performance to benchmark returns such as the Standard & Poors (S&P) 500 Composite Index. Beta is a measure of a security’s systematic (non-diversifiable) risk, which is the percentage change in an individual security’s return for a 1% change in the return of the market. The average Beta for our common stock holdings was 1.01 for Indemnity and 1.04 for the Exchange. Based upon a hypothetical 20% reduction in the overall value of the stock market, the fair value of the common stock portfolio would decrease by approximately $5 million for Indemnity and $480 million for the Exchange.

68
ITEM 8. FINANCIAL STATEMENTS AND SUPPLEMENTARY DATA
Report of Independent Registered Public Accounting Firm
The Board of Directors and Shareholders of Erie Indemnity Company Erie, Pennsylvania We have audited the accompanying consolidated statements of financial position of Erie Indemnity Company as of December 31, 2011 and 2010, and the related consolidated statements of operations, shareholders' equity and noncontrolling interest, and cash flows for each of the three years in the period ended December 31, 2011. Our audits also included the financial statement schedules listed in the Index at 15 (a). These financial statements and schedules are the responsibility of the Company's management. Our responsibility is to express an opinion on these financial statements and schedules based on our audits. We conducted our audits in accordance with the standards of the Public Company Accounting Oversight Board (United States). Those standards require that we plan and perform the audit to obtain reasonable assurance about whether the financial statements are free of material misstatement. An audit includes examining, on a test basis, evidence supporting the amounts and disclosures in the financial statements. An audit also includes assessing the accounting principles used and significant estimates made by management, as well as evaluating the overall financial statement presentation. We believe that our audits provide a reasonable basis for our opinion. In our opinion, the financial statements referred to above present fairly, in all material respects, the consolidated financial position of Erie Indemnity Company at December 31, 2011 and 2010, and the consolidated results of its operations and its cash flows for each of the three years in the period ended December 31, 2011, in conformity with U.S. generally accepted accounting principles. Also, in our opinion, the related financial statement schedules, when considered in relation to the basic financial statements taken as a whole, present fairly in all material respects the information set forth therein. We also have audited, in accordance with the standards of the Public Company Accounting Oversight Board (United States), Erie Indemnity Company's internal control over financial reporting as of December 31, 2011, based on criteria established in Internal Control—Integrated Framework issued by the Committee of Sponsoring Organizations of the Treadway Commission and our report dated February 27, 2012 expressed an unqualified opinion thereon. /s/ Ernst & Young LLP Cleveland, Ohio February 27, 2012

69
ERIE INDEMNITY COMPANY
CONSOLIDATED STATEMENTS OF OPERATIONS
Years ended December 31, 2011, 2010 and 2009
(dollars in millions, except per share data)
2011 2010 2009
Revenues
Premiums earned $ 4,214 $ 3,987 $ 3,869
Net investment income 433 433 433
Net realized investment (losses) gains (4) 313 412
Net impairment losses recognized in earnings (2) (6) (126)
Equity in earnings (losses) of limited partnerships 149 128 (369)
Other income 34 35 36
Total revenues 4,824 4,890 4,255
Benefits and expenses
Insurance losses and loss expenses 3,444 2,900 2,728
Policy acquisition and underwriting expenses 1,022 969 1,003
Goodwill impairment � 22 �
Total benefits and expenses 4,466 3,891 3,731
Income from operations before income taxes
and noncontrolling interests 358 999 524
Provision for income taxes 90 339 78
Net income $ 268 $ 660 $ 446
Less: Net income attributable to noncontrolling
interest in consolidated entity - Exchange 99 498 338
Net income attributable to Indemnity $ 169 $ 162 $ 108
Earnings Per Share
Net income attributable to Indemnity per share
Class A common stock – basic $ 3.45 $ 3.18 $ 2.10
Class A common stock – diluted $ 3.08 $ 2.85 $ 1.89
Class B common stock – basic and diluted $522.47 $462.83 $312.45
Weighted average shares outstanding attributable to
Indemnity – Basic
Class A common stock 48,875,316 50,705,607 51,250,606
Class B common stock 2,546 2,546 2,549
Weighted average shares outstanding attributable to
Indemnity – Diluted
Class A common stock 55,057,437 56,884,894 57,428,999
Class B common stock 2,546 2,546 2,549
See accompanying notes to Consolidated Financial Statements. See Note 23, “Indemnity Supplemental Information,” for supplemental statements of operations information.

70
ERIE INDEMNITY COMPANY
CONSOLIDATED STATEMENTS OF FINANCIAL POSITION
At December 31, 2011 and 2010
(dollars in millions, except per share data) 2011 2010
Assets Investments – Indemnity Available-for-sale securities, at fair value: Fixed maturities (amortized cost of $535 and $257, respectively) $ 548 $ 264 Equity securities (cost of $24 and $20, respectively) 25 24 Trading securities, at fair value (cost of $23 and $21, respectively) 27 28 Limited partnerships (cost of $185 and $202, respectively) 208 216 Other invested assets 1 1
Investments – Exchange
Available-for-sale securities, at fair value:
Fixed maturities (amortized cost of $6,829 and $6,863, respectively) 7,292 7,279 Equity securities (cost of $531 and $503, respectively) 564 570 Trading securities, at fair value (cost of $2,021 and $1,773, respectively) 2,308 2,306 Limited partnerships (cost of $1,003 and $1,083, respectively) 1,082 1,108 Other invested assets 19 19
Total investments 12,074 11,815 Cash and cash equivalents (Exchange portion of $174 and $120, respectively) 185 430 Premiums receivable from policyholders – Exchange 976 942 Reinsurance recoverable – Exchange 166 201 Deferred income taxes – Indemnity 19 0 Deferred acquisition costs – Exchange 487 467 Other assets (Exchange portion of $322 and $357, respectively) 441 489
Total assets $14,348 $14,344
Liabilities and shareholders' equity
Liabilities
Indemnity liabilities Deferred income taxes 0 26 Other liabilities 455 382
Exchange liabilities Losses and loss expense reserves 3,499 3,584 Life policy and deposit contract reserves 1,671 1,603 Unearned premiums 2,178 2,082 Deferred income taxes 147 257 Other liabilities 105 76
Total liabilities 8,055 8,010
Indemnity's shareholders' equity Class A common stock, stated value $0.0292 per share; authorized 74,996,930 shares; issued 68,289,600 shares; 47,861,842 and 50,054,506 shares outstanding, respectively 2 2 Class B common stock, convertible at a rate of 2,400 Class A shares for one Class B share, stated value $70 per share; 2,546 shares authorized, issued and outstanding, respectively 0 0 Additional paid-in-capital 16 8 Accumulated other comprehensive loss (105) (53) Retained earnings 1,894 1,827
Total contributed capital and retained earnings 1,807 1,784 Treasury stock, at cost, 20,427,758 and 18,235,094 shares, respectively (1,026) (872)
Total Indemnity shareholders' equity 781 912
Noncontrolling interest in consolidated entity – Exchange 5,512 5,422
Total equity 6,293 6,334
Total liabilities, shareholders' equity and noncontrolling interest $14,348 $14,344
See accompanying notes to Consolidated Financial Statements. See Note 23, “Indemnity Supplemental Information,” for supplemental consolidating statements of financial position information.

71
ERIE INDEMNITY COMPANY
CONSOLIDATED STATEMENTS OF SHAREHOLDERS’ EQUITY
AND NONCONTROLLING INTEREST
Years ended December 31, 2011, 2010 and 2009
(dollars in millions, except per share data)
2011 2010 2009
Common stock Class A $ 2 $ 2 $ 2 Class B 0 0 0
Total common stock 2 2 2
Additional paid-in capital Balance, beginning of year 8 8 8
Realized gain on sale of life affiliate 8 � �
Balance, end of year 16 8 8
Accumulated other comprehensive income Balance, beginning of year (53) (43) (136)
Cumulative effect of change in accounting principle, net of tax (Note 2) � � (6)
Unrealized (losses) gains, net of tax (Note 19) (11) 9 75 Reclassification of unrealized gain on sale of P&C affiliated
subsidiaries, net of tax � (15) � Postretirement plans, net of tax (Note 19) (41) (4) 24
Balance, end of year (105) (53) (43)
Retained earnings Balance, beginning of year 1,827 1,749 1,729
Net income 169 162 108 Dividends declared – Class A ($2.0975, $1.955 and $1.83 per
share, respectively) (101) (99) (94) Dividends declared – Class B ($314.625, $293.25 and $274.50 per
share, respectively) (1) 0 0 Reclassification of unrealized gain on sale of P&C affiliated
subsidiaries, net of tax � 15 � Cumulative effect of change in accounting principle, net of tax
(Note 2) � � 6
Balance, end of year 1,894 1,827 1,749
Treasury stock Balance, beginning of year (872) (814) (811)
Net purchase of treasury stock (154) (58) (3)
Balance, end of year (1,026) (872) (814)
Total Indemnity shareholders' equity 781 912 902
Noncontrolling interest in consolidated entity – Exchange Balance, beginning of year 5,422 4,823 3,967
Comprehensive income 90 599 856
Balance, end of year 5,512 5,422 4,823
Total equity $6,293 $6,334 $5,725
See accompanying notes to Consolidated Financial Statements.

72
ERIE INDEMNITY COMPANY
CONSOLIDATED STATEMENTS OF CASH FLOWS
Years ended December 31, 2011, 2010 and 2009
(in millions)
2011 2010 2009
Cash flows from operating activities Premiums collected $ 4,276 $ 4,055 $ 3,964 Net investment income received 458 445 421 Limited partnership distributions 166 122 81 Service agreement fee received 33 34 35 Commissions and bonuses paid to agents (583) (532) (535) Losses paid (2,953) (2,398) (2,241) Loss expenses paid (439) (419) (405) Other underwriting and acquisition costs paid (531) (517) (552) Income taxes (paid) recovered (67) (69) 121
Net cash provided by operating activities 360 721 889
Cash flows from investing activities Purchase of investments:
Fixed maturities (1,801) (1,760) (1,938) Preferred stock (119) (179) (176) Common stock (1,742) (1,495) (1,450) Limited partnerships (209) (165) (174)
Sales/maturities of investments: Fixed maturity sales 631 562 510 Fixed maturity calls/maturities 950 1,009 734 Preferred stock 113 135 210 Common stock 1,652 1,376 1,394 Sale of and returns on limited partnerships 163 142 15
Purchase of property and equipment (11) (33) (14) Net (distributions) collections on agent loans (1) 3 (2) Net (distributions) collections on life policy loans (1) 0 1
Net cash used in investing activities (375) (405) (890)
Cash flows from financing activities Annuity and supplementary contract deposits and interest 95 111 183 Annuity and supplementary contract surrenders and withdrawals (81) (79) (129) Universal life deposits and interest 29 38 39 Universal life surrenders (16) (35) (39) Purchase of treasury stock (155) (57) (3) Dividends paid to shareholders (102) (98) (93) Decrease in collateral from securities lending 0 0 (285) Redemption of securities lending collateral 0 0 285
Net cash used in financing activities (230) (120) (42)
Net (decrease) increase in cash and cash equivalents (245) 196 (43) Cash and cash equivalents at beginning of year 430 234 277
Cash and cash equivalents at end of year $ 185 $ 430 $ 234
See accompanying notes to Consolidated Financial Statements. See Note 21, “Supplementary Data on Cash Flows,” and Note 23, “Indemnity Supplemental Information,” for supplemental cash flow information.

73
ERIE INDEMNITY COMPANY
NOTES TO CONSOLIDATED FINANCIAL STATEMENTS
Note 1. Nature of Operations
Erie Indemnity Company (“Indemnity”) is a publicly held Pennsylvania business corporation that has been the managing attorney-in-fact for the subscribers (policyholders) at the Erie Insurance Exchange (“Exchange”) since 1925. The Exchange is a subscriber owned, Pennsylvania-domiciled reciprocal insurer that writes property and casualty insurance. Indemnity’s primary function is to perform certain services for the Exchange relating to the sales, underwriting and issuance of policies on behalf of the Exchange. This is done in accordance with a subscriber’s agreement (a limited power of attorney) executed by each subscriber (policyholder), which appoints Indemnity as their common attorney-in-fact to transact business on their behalf and to manage the affairs of the Exchange. Pursuant to the subscriber’s agreement and for its services as attorney-in-fact, Indemnity earns a management fee calculated as a percentage of the direct premiums written by the Exchange and the other members of the Property and Casualty Group (defined below), which are assumed by the Exchange under an intercompany pooling arrangement. Indemnity has the power to direct the activities of the Exchange that most significantly impact the Exchange’s economic performance by acting as the common attorney-in-fact and decision maker for the subscribers (policyholders) at the Exchange. Through December 31, 2010, Indemnity also operated as a property and casualty insurer through its wholly owned subsidiaries, Erie Insurance Company (“EIC”), Erie Insurance Company of New York (“ENY”) and Erie Insurance Property and Casualty Company (“EPC”). EIC, ENY and EPC, together with the Exchange and its wholly owned subsidiary, Flagship City Insurance Company (“Flagship”), are collectively referred to as the “Property and Casualty Group”. The Property and Casualty Group operates in 11 Midwestern, Mid-Atlantic and Southeastern states and the District of Columbia and primarily writes private passenger auto (47%), homeowners (22%), commercial multi-peril (12%), commercial automobile (7%), and workers compensation (7%) lines of insurance based upon 2011 direct written premiums. On December 31, 2010, Indemnity sold all of the outstanding capital stock of its wholly owned property and casualty insurance subsidiaries to the Exchange. Erie Family Life Insurance Company (“EFL”) is an affiliated life insurance company that underwrites and sells individual and group life insurance policies and fixed annuities. On March 31, 2011, Indemnity sold its 21.6% ownership interest in EFL to the Exchange. There was no gain or loss resulting from this sale as Indemnity is the primary decision maker for the Exchange. All property and casualty and life insurance operations are now owned by the Exchange, and Indemnity functions solely as the management company. The consolidated financial statements of Erie Indemnity Company reflect the results of Indemnity and its variable interest entity, the Exchange, which we refer to collectively as the “Erie Insurance Group” (“we,” “us,” “our”). “Indemnity shareholder interest” refers to the interest in Erie Indemnity Company owned by the Class A and Class B shareholders. “Noncontrolling interest” refers to the interest in the Erie Insurance Exchange held for the subscribers (policyholders).
Note 2. Significant Accounting Policies
Retrospective adoption of new accounting principle On June 12, 2009, the Financial Accounting Standards Board (“FASB”) updated Accounting Standards Codification (“ASC”) 810, Consolidation, which amended the existing guidance for determining whether an enterprise is the primary beneficiary of a variable interest entity (“VIE”). As of January 1, 2010 Erie Indemnity Company adopted the new accounting principle on a retrospective basis since inception. The 2009 financial information within this report has previously been conformed to this consolidated presentation. This guidance changed the methodology for assessing whether an enterprise is the primary beneficiary of a VIE by requiring a qualitative analysis to determine if an enterprise’s variable interest gives it a controlling financial interest.

ERIE INDEMNITY COMPANY NOTES TO CONSOLIDATED FINANCIAL STATEMENTS
74
The qualitative analysis looks at the power to direct activities of the VIE that most significantly impact economic performance and the right to receive benefits (or obligation to absorb losses) from the VIE that could be significant. In accordance with this updated accounting guidance, Indemnity is deemed to be the primary beneficiary of the Exchange given the significance of the management fee to the Exchange and Indemnity’s power to direct the Exchange’s significant activities. Under the previously issued accounting guidance, Indemnity was not deemed the primary beneficiary of the Exchange and its financial position and operating results were not consolidated with Indemnity’s. Following adoption of the updated accounting guidance, as primary beneficiary of the Exchange, Erie Indemnity Company has consolidated Indemnity and the Exchange’s financial position and operating results. Furthermore, upon consolidation of the Exchange, 100% of the ownership of EFL resides within the consolidated entity and consequently EFL’s financial results are also consolidated. There was no cumulative effect to Indemnity’s shareholders' equity from consolidation of the Exchange and EFL. The noncontrolling interest in total equity represents the amount of the Exchange's subscribers' (policyholders’) equity. Basis of presentation The accompanying consolidated financial statements have been prepared in conformity with U.S. generally accepted accounting principles (“GAAP”) and include the accounts of Indemnity together with its affiliated companies in which Indemnity holds a majority voting or economic interest. The preparation of financial statements in conformity with GAAP requires us to make estimates and assumptions that affect the reported amounts of assets and liabilities and disclosure of contingent assets and liabilities at the date of the financial statements and the reported amounts of revenues and expenses during the reporting period. Actual results could differ from those estimates. Reclassifications Certain amounts previously reported in the 2010 and 2009 consolidated indirect method of cash flows in Note 21, “Supplementary Data on Cash Flows,” have been reclassified to conform to the current period’s presentation. These reclassifications had no impact on previously reported net cash provided by operating activities. Principles of consolidation We consolidate the Exchange as a variable interest entity for which Indemnity is the primary beneficiary. All intercompany accounts and transactions have been eliminated in consolidation. The required presentation of noncontrolling interests is reflected in the consolidated financial statements. Noncontrolling interests represent the ownership interests of the Exchange, all of which is held by parties other than Indemnity (i.e., the Exchange's subscribers (policyholders)). Noncontrolling interests also include the Exchange subscribers’ ownership interest in EFL. Presentation of assets and liabilities – While the assets of the Exchange are presented separately in the Consolidated Statements of Financial Position, the Exchange’s assets can only be used to satisfy the Exchange’s liabilities or for other unrestricted activities. ASC 810, Consolidation, does not require separate presentation of the Exchange’s assets; however, because the shareholders of Indemnity have no rights to the assets of the Exchange and, conversely, the Exchange has no rights to the assets of Indemnity, we have presented the invested assets of the Exchange separately on the Consolidated Statements of Financial Position along with the remaining consolidated assets reflecting the Exchange’s portion parenthetically. Liabilities are required under ASC 810, Consolidation, to be presented separately for the Exchange on the Consolidated Statements of Financial Position as the Exchange’s creditors do not have recourse to the general credit of Indemnity. Rights of shareholders of Indemnity and subscribers (policyholders) of the Exchange – The shareholders of Indemnity, through the management fee, have a controlling financial interest in the Exchange; however, they have no other rights to or obligations arising from assets and liabilities of the Exchange. The shareholders of Indemnity own its equity but have no rights or interest in the Exchange’s (noncontrolling interest) income or equity. The noncontrolling interest equity represents the Exchange’s equity held for the interest of its subscribers (policyholders), who have no rights or interest in the Indemnity shareholder interest income or equity. All intercompany assets, liabilities, revenues and expenses between Indemnity and the Exchange have been eliminated in the Consolidated Statements of Financial Position and Operations.
ERIE INDEMNITY COMPANY NOTES TO CONSOLIDATED FINANCIAL STATEMENTS
75
Adopted accounting pronouncements On April 1, 2009, we adopted new accounting guidance under FASB ASC 320, Investments — Debt and Equity
Securities. This guidance amended the other-than-temporary impairment (OTTI) model for debt securities and requires that credit-related losses and securities in an unrealized loss position that we intend to sell be recognized in earnings, with the remaining decline recognized in other comprehensive income. Additionally, this accounting guidance modified the presentation of OTTI in the statement of operations with the total OTTI presented along with an offset for the amount of OTTI recognized in other comprehensive income. Disclosures include further disaggregation of securities, methodology, inputs related to credit-related loss impairments and a rollforward of credit-related loss impairments. The adoption of this guidance required a cumulative effect adjustment to reclass previously recognized non-credit other-than-temporary impairments from retained earnings to other comprehensive income. The net impact of the cumulative effect adjustment increased retained earnings and decreased other comprehensive income by $6 million, net of tax. Disclosures regarding our impairment methodology are included in this note under the caption Investments. The remaining disclosures regarding credit and non-credit related impairments have been provided in Note 7. In January 2010, the FASB issued Accounting Standards Update (“ASU”) 2010-06, Improving Disclosures about Fair Value Measurements. This guidance updated the disclosures on FASB ASC 820, Fair Value Measurements and Disclosures. The additional disclosures include the amounts and reasons for significant transfers between the levels in the fair value hierarchy, the expansion of fair market disclosures by each class of assets, disclosure of the policy for recognition of level transfers, and disclosure of the valuation techniques used for all Level 2 and Level 3 assets. These disclosures were effective for periods beginning after December 15, 2009 and have been included in Note 6, “Fair Value.” An additional disclosure requirement to present purchases, sales, issuances, and settlements of Level 3 activity on a gross basis became effective with periods beginning after December 15, 2010. The additional disclosures required by this guidance have also been included in Note 6. Pending accounting pronouncements In October 2010, the FASB issued ASU 2010-26, Accounting for Costs Associated with Acquiring or Renewing Insurance Contracts. This guidance modifies the definition of the types of costs incurred by insurance entities that can be capitalized in the acquisition of new and renewal insurance contracts. The amendments in this guidance specify that the costs are limited to incremental direct costs that result directly from successful contract transactions and would not have been incurred by the insurance entity had the contract transactions not occurred. These costs must be directly related to underwriting, policy issuance and processing, medical and inspection reports and sales force contract selling. The amendments also specify that advertising costs are only included as deferred acquisition costs if the direct-response advertising criteria are met. ASU 2010-26 is effective for interim and annual reporting periods beginning after December 15, 2011 with either prospective or retrospective adoption permitted. We have elected to prospectively adopt this guidance, the impact of which is immaterial to our consolidated financial statements as this guidance has no impact on the Indemnity shareholder interest. In May 2011, the FASB issued ASU 2011-04, Fair Value Measurements. This guidance changes the description of the requirements in GAAP for measuring fair value and for disclosing information about fair value measurements and certain other changes to converge with the fair value guidance of the International Accounting Standards Board (“IASB”). The amendments in this guidance detail the requirements specific to measuring the fair value of an instrument classified in a reporting entity’s shareholders’ equity. The amendments also clarify that a reporting entity should disclose quantitative information about the observable inputs used in the fair value measurement categorized within Level 3 of the fair value hierarchy. ASU 2011-04 is effective for interim and annual periods beginning after December 15, 2011. We do not expect the adoption of this new guidance to have a material impact on our consolidated financial statements. In June 2011, the FASB issued ASU 2011-05, Comprehensive Income. This guidance eliminates the option to present components of other comprehensive income as part of the statement of changes in shareholders’ equity. The amendments in this guidance specify an entity has the option to present the total comprehensive income, the components of net income, and the components of other comprehensive income either in a single continuous statement of comprehensive income or in two separate but consecutive statements. The disclosures required remain the same. In both options, an entity is required to present each component of net income along with total net income, each component of other comprehensive income along with a total for other comprehensive income, and a total amount for comprehensive income. ASU 2011-05 is effective for interim and annual periods beginning after December 15, 2011. In December 2011, the FASB issued ASU 2011-12, Comprehensive Income – Deferral of The Effective Date for Amendments to the Presentation of Reclassification of Items Out of Accumulated Other
Comprehensive Income in Accounting Standards Update 2011-05. The amendments in this ASU supersede changes to

ERIE INDEMNITY COMPANY NOTES TO CONSOLIDATED FINANCIAL STATEMENTS
76
paragraphs in ASU 2011-05 that pertain to how, when and where reclassification adjustments are presented. We do not expect adoption of ASU 2011-05 and ASU 2011-12 to have a material impact on our consolidated financial statements. Investments Available-for-sale securities – Fixed maturity and preferred stock securities are classified as available-for-sale and are reported at fair value. Unrealized holding gains and losses, net of related tax effects, on fixed maturities and preferred stock are charged or credited directly to shareholders’ equity as accumulated other comprehensive income (loss). Realized gains and losses on sales of fixed maturity and preferred stock securities are recognized in income based upon the specific identification method. Interest and dividend income are recognized as earned. Fixed income and redeemable preferred stock (debt securities) are evaluated monthly for other-than-temporary impairment loss. For debt securities that have experienced a decline in fair value and we intend to sell or for which it is more likely than not we will be required to sell the security before recovery of its amortized cost, an other-than-temporary impairment is deemed to have occurred, and is recognized in earnings. Debt securities that have experienced a decline in fair value and that we do not intend to sell, and that we will not be required to sell before recovery, are evaluated to determine if the decline in fair value is other-than-temporary. Some factors considered in this evaluation include:
• the extent and duration to which fair value is less than cost; • historical operating performance and financial condition of the issuer; • short and long-term prospects of the issuer and its industry based upon analysts’ recommendations; • specific events that occurred affecting the issuer, including a ratings downgrade; • near term liquidity position of the issuer; and • compliance with financial covenants.
If a decline is deemed to be other-than-temporary, an assessment is made to determine the amount of the total impairment related to a credit loss and that related to all other factors. Consideration is given to all available information relevant to the collectability of the security in this determination. If the entire amortized cost basis of the security will not be recovered, a credit loss exists. Currently, we have the intent to sell all of our securities that have been determined to have a credit-related impairment. As a result, the entire amount of the impairment has been recognized in earnings. If we had securities with credit impairments that we did not intend to sell, the non-credit portion of the impairment would have been recorded in other comprehensive income. Impairment charges on non-redeemable preferred securities and hybrid securities with equity characteristics are included in earnings consistent with the treatment for equity securities. Trading securities – Our common stock securities are trading securities which are reported at fair value. Unrealized holding gains and losses on these securities are included in net realized gains (losses) in the Consolidated Statements of Operations. Realized gains and losses on sales of common stock are recognized in income based upon the specific identification method. Dividend income is recognized as earned. Limited partnerships – Limited partnerships include U.S. and foreign private equity, mezzanine debt, and real estate investments. The private equity limited partnerships invest primarily in small- to medium-sized companies. The general partners for our limited partnerships determine the market value of investments in the partnerships, including any other-than-temporary impairments of these individual investments. The primary basis for the valuation of limited partnership interests are financial statements prepared by the general partner. Because of the timing of the preparation and delivery of these financial statements, the use of the most recently available financial statements provided by the general partners result in a quarter delay in the inclusion of the limited partnership results in our Consolidated Statements of Operations. Due to this delay, these financial statements do not yet reflect the market conditions experienced in the fourth quarter of 2011. Nearly all of the underlying investments in our limited partnerships are valued using a source other than quoted prices in active markets. The fair value amounts for our private equity and mezzanine debt partnerships are based upon the financial statements of the general partners, who use multiple methods to estimate fair value including the market approach, income approach or the cost approach. The market approach uses prices and other pertinent information

ERIE INDEMNITY COMPANY NOTES TO CONSOLIDATED FINANCIAL STATEMENTS
77
from market-generated transactions involving identical or comparable assets or liabilities. Such valuation techniques often use market multiples derived from a set of comparables. The income approach uses valuation techniques to convert future cash flows or earnings to a single discounted present value amount. The measurement is based upon the value indicated by current market expectations on those future amounts. The cost approach is derived from the amount that is currently required to replace the service capacity of an asset. If information becomes available that would impair the cost of these partnerships, then the general partner would generally adjust to the net realizable value. For real estate limited partnerships, the general partners record these at fair value based upon an independent appraisal or internal estimates of fair value. We perform various procedures in review of the general partners’ valuations. While we generally rely on the general partners’ financial statements as the best available information to record our share of the partnership unrealized gains and losses resulting from valuation changes, we adjust our financial statements for impairments at the fund level as necessary. As there is a limited market for these investments, they have the greatest potential for market price variability.
Unrealized gains and losses for these investments are reflected in equity in earnings (losses) of limited partnerships in our Consolidated Statements of Operations in accordance with the equity method of accounting. Cash contributions made to and distributions received from the partnerships are recorded in the period in which the transaction occurs.
Cash and cash equivalents – Short-term investments, consisting of cash, money market accounts and other short-term, highly liquid investments with a maturity of three months or less at the date of purchase, are considered cash and cash equivalents.
Deferred acquisition costs Acquisition costs that vary with and relate to the production of insurance and investment-type contracts are deferred. Such costs consist principally of commissions, premium taxes and policy issuance expenses.
Property and casualty insurance – Deferred acquisition costs (“DAC”) for property and casualty insurance contracts, which is primarily composed of commissions and certain underwriting expenses, is amortized on a pro rata basis over the applicable policy term. We consider investment income in determining if a premium deficiency exists, and if so, it would first be recognized by charging any unamortized acquisition costs to expense to the extent required to eliminate the deficiency. If the premium deficiency would be greater than unamortized acquisition costs, a liability would be accrued for the excess deficiency. There was no reduction in costs deferred in any periods presented. The DAC profitability is analyzed annually to ensure recoverability.
Life insurance – DAC related to traditional life insurance products is amortized in proportion to premium revenues over the premium-paying period of related policies using assumptions about mortality, morbidity, lapse rates, expenses and future yield on related investments established when the policy was issued. Amortization is adjusted each period to reflect policy lapse or termination rates as compared to anticipated experience. DAC related to universal life products and deferred annuities is amortized over the estimated lives of the contracts in proportion to actual and expected future gross profits, investment, mortality and expense margins and surrender charges. Both historical and anticipated investment returns, including realized gains and losses, are considered in determining the amortization of DAC.
Estimated gross profits are adjusted monthly to reflect actual experience to date and/or for the unlocking of underlying key assumptions based upon experience studies. DAC is periodically reviewed for recoverability. For traditional life products, if the benefit reserves plus anticipated future premiums and interest earnings for a line of business are less than the current estimate of future benefits and expenses (including any unamortized DAC), a charge to income is recorded for additional DAC amortization or for increased benefit reserves. For universal life and deferred annuities, if the current present value of future expected gross profits is less than the unamortized DAC, a charge to income is recorded for additional DAC amortization.
Deferred taxes Deferred tax assets and liabilities are recorded for temporary differences between the tax basis of assets and liabilities and their reported amounts in the consolidated financial statements, using the statutory tax rates in effect for the year in which the differences are expected to reverse. The effect on deferred tax assets and liabilities of a change in tax rates is recognized in the results of operations in the period that includes the enactment date under the law. Valuation allowances on deferred tax assets are estimated based upon our assessment of the realizability of such amounts.

ERIE INDEMNITY COMPANY NOTES TO CONSOLIDATED FINANCIAL STATEMENTS
78
Property and casualty unpaid losses and loss expenses Unpaid losses and loss expenses include estimates for claims that have been reported and those that have been incurred but not reported, as well as estimates of all expenses associated with processing and settling these claims, less estimates of anticipated salvage and subrogation recoveries. Unpaid loss and loss expense reserves are set at full expected cost, except for workers compensation loss reserves, which have been discounted using an interest rate of 2.5%. Estimating the ultimate cost of future losses and loss expenses is an uncertain and complex process. This estimation process is based upon the assumption that past developments are an appropriate indicator of future events, and involves a variety of actuarial techniques that analyze experience, trends and other relevant factors. The uncertainties involved with the reserving process include internal factors, such as changes in claims handling procedures, as well as external factors, such as economic trends and changes in the concepts of legal liability and damage awards. Accordingly, final loss settlements may vary from the present estimates, particularly when those payments may not occur until well into the future. We regularly review the adequacy of our estimated loss and loss expense reserves by line of business. Adjustments to previously established reserves are reflected in the operating results of the period in which the adjustment is determined to be necessary. Such adjustments could possibly be significant, reflecting any variety of new and adverse or favorable trends. Life insurance reserves The liability for future benefits of life insurance contracts is the present value of such benefits less the present value of future net premiums. Life insurance and income-paying annuity future policy benefit reserves are computed primarily by the net level premium method with assumptions as to mortality, withdrawal, lapses and investment yields. Traditional life insurance products are subject to loss recognition testing. The adequacy of the related reserves is verified as part of loss recognition testing. Loss recognition is necessary when the sum of the reserve and the present value of projected policy cash flows is less than unamortized DAC. Deferred annuity future benefit reserves are established at accumulated account values without reduction for surrender charges. These account values are credited with varying interest rates determined at the discretion of EFL subject to certain minimums. Agent bonus estimates Agent bonuses are based upon an individual agency’s property and casualty underwriting profitability and also include a component for growth in agency property and casualty premiums if the agency’s underwriting profitability targets for our book of business are met. The estimate for agent bonuses, which are based upon the performance over 36 months, is modeled on a monthly basis using actual underwriting data by agency for the two prior years combined with the current year-to-date actual data. At December 31 of each year, we use actual data available and record an accrual based upon the expected payment amount. These costs are included in the policy acquisition and underwriting expenses in the Consolidated Statements of Operations. Recognition of premium revenues and losses Property and casualty insurance – Insurance premiums written are earned over the terms of the policies on a pro-rata basis. Unearned premiums represent that portion of premiums written which is applicable to the unexpired terms of policies in force. Losses and loss expenses are recorded as incurred.
Life insurance – Premiums on traditional life insurance products are recognized as revenue when due. Reserves for future policy benefits are established as premiums are earned. Premiums received for annuity and universal life products are reported as deposits and included in liabilities. For universal life products, revenue is recognized as amounts are assessed against the policyholder’s account for mortality coverage and contract expenses. The primary source of revenue on annuity deposits is derived from the interest earned by EFL, which is reflected in net investment income.
Reinsurance Property and casualty insurance – Property and casualty assumed and ceded reinsurance premiums are earned over the terms of the reinsurance contracts. Premiums ceded to other companies are reported as a reduction of premium income. Reinsurance contracts do not relieve the Property and Casualty Group from its obligations to policyholders. Life insurance – Reinsurance premiums, commissions and expense reimbursements on reinsurance ceded on life insurance policies are accounted for on a basis consistent with those used in accounting for the underlying reinsured policies. Expense reimbursements received in connection with new reinsurance ceded have been accounted for as a

ERIE INDEMNITY COMPANY NOTES TO CONSOLIDATED FINANCIAL STATEMENTS
79
reduction of the related policy acquisition costs. Amounts recoverable from reinsurers for future policy benefits are estimated in a manner consistent with the assumptions used for the underlying policy benefits. Amounts recoverable for incurred claims, future policy benefits and expense reimbursements are recorded as assets. Reinsurance contracts do not relieve EFL from its obligations to policyholders. Recognition of management fee revenue Indemnity earns management fees from the Exchange for providing sales, underwriting and policy issuance services. Pursuant to the subscriber’s agreements with the policyholders at the Exchange, Indemnity may retain up to 25% of all premiums written or assumed by the Exchange. Management fee revenue is calculated by multiplying the management fee rate by the direct premiums written by the Exchange and the other members of the Property and Casualty Group, which are assumed by the Exchange under an intercompany pooling arrangement. The Property and Casualty Group issues policies with annual terms only. Management fees are recorded as revenue upon policy issuance or renewal, as substantially all of the services required to be performed by us have been satisfied at that time. Certain activities are performed and related costs are incurred by us subsequent to policy issuance in connection with the services provided to the Exchange; however, these activities are inconsequential and perfunctory. Management fee revenue is eliminated upon consolidation. Recognition of service agreement revenue Included in service agreement revenue are service charges Indemnity collects from policyholders for providing multiple payment plans on policies written by the Property and Casualty Group. Service charges, which are flat dollar charges for each installment billed beyond the first installment, are recognized as revenue when bills are rendered to the policyholder. Service agreement revenue also includes late payment and policy reinstatement fees. Service agreement revenue is included in other income in the Consolidated Statements of Operations.
Note 3. Earnings Per Share
Basic earnings per share are calculated under the two-class method, which allocates earnings to each class of stock based upon its dividend rights. Class B shares are convertible into Class A shares at a conversion ratio of 2,400 to 1. See Note 18, “Capital Stock.” Class A diluted earnings per share are calculated under the if-converted method, which reflects the conversion of Class B shares and the effect of potentially dilutive outstanding employee stock-based awards and awards vested and not yet vested related to the outside directors’ stock compensation plan. Vested shares related to the outside directors’ compensation plan were included in the table below for the first time in 2010. The 2009 amounts have been updated to include these shares. This had no impact on previously reported diluted earnings per share. A reconciliation of the numerators and denominators used in the basic and diluted per-share computations is presented as follows for each class of Indemnity common stock:
Indemnity Shareholder Interest
(dollars in millions, For the years ended December 31,
except per share data) 2011 2010 2009
Allocated Allocated Allocated
net Weighted Per- net Weighted Per- net Weighted Per-
income shares share income shares share income shares share
(numerator) (denominator) amount (numerator) (denominator) amount (numerator) (denominator) amount
Class A – Basic EPS:
Income available to Class A stockholders $168 48,875,316 $ 3.45 $161 50,705,607 $ 3.18 $107 51,250,606 $ 2.10
Dilutive effect of stock awards 0 71,721 U 0 68,887 U 0 60,793 U
Assumed conversion of Class B shares 1 6,110,400 U 1 6,110,400 U 1 6,117,600 U
Class A – Diluted EPS:
Income available to Class A stockholders on Class A
equivalent shares $169 55,057,437 $ 3.08 $162 56,884,894 $ 2.85 $108 57,428,999 $ 1.89
Class B – Basic and diluted EPS:
Income available to Class B stockholders $ 1 2,546 $522.47 $ 1 2,546 $462.83 $ 1 2,549 $312.45

ERIE INDEMNITY COMPANY NOTES TO CONSOLIDATED FINANCIAL STATEMENTS
80
Note 4. Variable Interest Entity
Erie Insurance Exchange The Exchange is a reciprocal insurance exchange domiciled in Pennsylvania, for which Indemnity serves as attorney-in-fact. Indemnity holds a variable interest in the Exchange due to the absence of decision-making capabilities by the equity owners (subscribers/policyholders) of the Exchange and due to the significance of the management fee the Exchange pays to Indemnity as its decision maker. As a result, Indemnity is deemed to have a controlling financial interest in the Exchange and is considered to be its primary beneficiary. Consolidation of the Exchange’s financial results is required given the significance of the management fee to the Exchange and because Indemnity has the power to direct the activities of the Exchange that most significantly impact the Exchange’s economic performance. The Exchange’s anticipated economic performance is the product of its underwriting results combined with its investment results. The fees paid to Indemnity under the subscriber’s agreement impact the anticipated economic performance attributable to the Exchange’s results. Indemnity earns a management fee from the Exchange for the services it provides as attorney-in-fact. Indemnity’s management fee revenues are based upon all premiums written or assumed by the Exchange. Indemnity’s Board of Directors determines the management fee rate to be paid by the Exchange to Indemnity. This rate cannot exceed 25% of the direct and affiliated assumed written premiums of the Exchange, as defined by the subscriber’s agreement signed by each policyholder. Management fee revenues and management fee expenses are eliminated upon consolidation. The shareholders of Indemnity have no rights to the assets of the Exchange and no obligations arising from the liabilities of the Exchange. Indemnity has no obligation related to any underwriting and/or investment losses experienced by the Exchange. Indemnity would, however, be adversely impacted if the Exchange incurred significant underwriting and/or investment losses. If the surplus of the Exchange were to decline significantly from its current level, its financial strength ratings could be reduced and, as a consequence, the Exchange could find it more difficult to retain its existing business and attract new business. A decline in the business of the Exchange would have an adverse effect on the amount of the management fees Indemnity receives. In addition, a decline in the surplus of the Exchange from its current level may impact the management fee rate received by Indemnity. Indemnity also has an exposure to a concentration of credit risk related to the unsecured receivables due from the Exchange for its management fee. If any of these events occurred, Indemnity’s financial position, financial performance and/or cash flows could be adversely impacted. On December 31, 2010, Indemnity sold all of the outstanding capital stock of its wholly owned subsidiaries to the Exchange. On March 31, 2011, Indemnity sold its 21.6% ownership interest in EFL to the Exchange. Under this structure, all property and casualty and life insurance operations are owned by the Exchange, and Indemnity functions solely as the management company. There was no impact on the existing reinsurance pooling agreement between the Exchange and EIC or ENY as a result of the sales, nor was there any impact to the subscribers (policyholders) of the Exchange, the Exchange’s independent insurance agents, or Indemnity’s employees. Indemnity has not provided financial or other support to the Exchange for any of the reporting periods presented. At December 31, 2011, there are no explicit or implicit arrangements that would require Indemnity to provide future financial support to the Exchange. Indemnity is not liable if the Exchange was to be in violation of its debt covenants or was unable to meet its obligation for unfunded commitments to limited partnerships.
Note 5. Segment Information
Our reportable segments include management operations, property and casualty insurance operations, life insurance operations and investment operations. Accounting policies for segments are the same as those described in the summary of significant accounting policies (see Note 2, “Significant Accounting Policies”). Assets are not allocated to the segments, but rather, are reviewed in total for purposes of decision-making. No single customer or agent provides 10% or more of revenues. Our management operations segment consists of Indemnity serving as attorney-in-fact for the Exchange. Indemnity operates in this capacity solely for the Exchange. We evaluate profitability of our management operations segment principally on the gross margin from management operations. Indemnity earns a management fee from the Exchange for providing sales, underwriting and policy issuance services. Management fee revenue, which is eliminated in consolidation, is calculated as a percentage not to exceed 25% of all the direct premiums written by the Exchange and the other members of the Property and Casualty Group, which are assumed by the Exchange under an intercompany
ERIE INDEMNITY COMPANY NOTES TO CONSOLIDATED FINANCIAL STATEMENTS
81
pooling arrangement. The Property and Casualty Group issues policies with annual terms only. Management fees are recorded upon policy issuance or renewal, as substantially all of the services required to be performed by Indemnity have been satisfied at that time. Certain activities are performed and related costs are incurred by us subsequent to policy issuance in connection with the services provided to the Exchange; however, these activities are inconsequential and perfunctory. Although these management fee revenues and expenses are eliminated upon consolidation, the amount of the fee directly impacts the allocation of our consolidated net income between noncontrolling interest, which bears the management fee expense and represents the interests of the Exchange subscribers (policyholders), and Indemnity’s interest, which earns the management fee revenue and represents Indemnity shareholder interest in net income. Our property and casualty insurance operations segment includes personal and commercial lines. Personal lines consist primarily of personal auto and homeowners and are marketed to individuals. Commercial lines consist primarily of commercial multi-peril, commercial auto and workers compensation and are marketed to small- and medium-sized businesses. Our property and casualty policies are sold by independent agents. Our property and casualty insurance underwriting operations are conducted through the Exchange and its subsidiaries and include assumed voluntary reinsurance from nonaffiliated domestic and foreign sources, assumed involuntary and ceded reinsurance business. The Exchange exited the assumed voluntary reinsurance business effective December 31, 2003, and therefore unaffiliated reinsurance includes only run-off activity of the previously assumed voluntary reinsurance business. We evaluate profitability of the property and casualty insurance operations segment principally based upon net underwriting results represented by the combined ratio. Our life insurance operations segment includes traditional and universal life insurance products and fixed annuities marketed to individuals using the same independent agency force utilized by our property and casualty insurance operations. We evaluate profitability of the life insurance segment principally based upon segment net income, including investments, which for segment purposes are reflected in the investment operations segment. At the same time, we recognize that investment-related income is integral to the evaluation of the life insurance segment because of the long duration of life products. In 2011, investment activities on life insurance-related assets generated revenues of $109 million, resulting in EFL reporting income before income taxes of $50 million, before intercompany eliminations. In 2010, investment activities on life insurance-related assets generated revenues of $107 million, resulting in EFL reporting income before income taxes of $50 million, before intercompany eliminations. In 2009, investment activities on life insurance-related assets generated revenues of $63 million, resulting in EFL reporting income before income taxes of $10 million, before intercompany eliminations. The investment operations segment performance is evaluated based upon appreciation of assets, rate of return and overall return. Investment-related income for the life operations is included in the investment segment results.

ERIE INDEMNITY COMPANY NOTES TO CONSOLIDATED FINANCIAL STATEMENTS
82
The following tables summarize the components of the Consolidated Statements of Operations by reportable business segment:
Erie Insurance Group
For the year ended December 31, 2011
(in millions)
Management operations
Property and casualty
insurance operations
Life insurance operations
Investment operations Eliminations Consolidated
Premiums earned/life policy revenue $4,149 $ 67 $ (2) $4,214
Net investment income $444 (11) 433
Net realized investment losses (4) (4)
Net impairment losses recognized in earnings (2) (2)
Equity in earnings of limited partnerships 149 149
Management fee revenue $1,067 (1,067) U
Service agreement and other revenue 33 1 34
Total revenues 1,100 4,149 68 587 (1,080) 4,824
Cost of management operations 892 (892) U
Insurance losses and loss expenses 3,349 100 (5) 3,444
Policy acquisition and underwriting expenses 1,178 27 (183) 1,022
Total benefits and expenses 892 4,527 127 U (1,080) 4,466
Income (loss) before income taxes 208 (378) (59) 587 U 358
Provision for income taxes 73 (132) (21) 170 U 90
Net income (loss) $ 135 $ (246) $(38) $417 $ U $ 268
Erie Insurance Group
For the year ended December 31, 2010
(in millions)
Management operations
Property and casualty
insurance operations
Life insurance operations
Investment operations Eliminations Consolidated
Premiums earned/life policy revenue $3,925 $ 64 $ (2) $3,987
Net investment income $444 (11) 433
Net realized investment gains 313 313
Net impairment losses recognized in earnings (6) (6)
Equity in earnings of limited partnerships 128 128
Management fee revenue $1,009 (1,009) U
Service agreement and other revenue 34 1 35
Total revenues 1,043 3,925 65 879 (1,022) 4,890
Cost of management operations 841 (841) U
Insurance losses and loss expenses 2,815 90 (5) 2,900
Policy acquisition and underwriting expenses 1,113 32 (176) 969
Goodwill impairment 22 22
Total benefits and expenses 841 3,928 122 22 (1,022) 3,891
Income (loss) before income taxes 202 (3) (57) 857 U 999
Provision for income taxes 71 (1) (20) 289 U 339
Net income (loss) $ 131 $ (2) $(37) $568 $ U $ 660

ERIE INDEMNITY COMPANY NOTES TO CONSOLIDATED FINANCIAL STATEMENTS
83
Erie Insurance Group
For the year ended December 31, 2009
(in millions)
Management operations
Property and casualty
insurance operations
Life insurance operations
Investment operations Eliminations Consolidated
Premiums earned/life policy revenue $3,808 $ 63 $ (2) $3,869
Net investment income $ 444 (11) 433
Net realized investment gains 412 412
Net impairment losses recognized in earnings (126) (126)
Equity in losses of limited partnerships (369) (369)
Management fee revenue $ 965 (965) U
Service agreement and other revenue 35 1 36
Total revenues 1,000 3,808 64 361 (978) 4,255
Cost of management operations 813 (813) U
Insurance losses and loss expenses 2,644 89 (5) 2,728
Policy acquisition and underwriting expenses 1,135 28 (160) 1,003
Total benefits and expenses 813 3,779 117 U (978) 3,731
Income (loss) before income taxes 187 29 (53) 361 U 524
Provision for income taxes 60 10 (19) 27 U 78
Net income (loss) $ 127 $ 19 $(34) $ 334 $ U $ 446
See the “Results of the Erie Insurance Group’s Operations by Interest” table in Item 7. “Management’s Discussion and Analysis of Financial Condition and Results of Operations” for the composition of income attributable to Indemnity and income attributable to the noncontrolling interest (Exchange).
Note 6. Fair Value
The 2010 fair value information within this note has been conformed to this current presentation. Our available-for-sale and trading securities are recorded at fair value, which is the price that would be received to sell the asset in an orderly transaction between willing market participants as of the measurement date. Valuation techniques used to derive the fair value of our available-for-sale and trading securities are based upon observable and unobservable inputs. Observable inputs reflect market data obtained from independent sources. Unobservable inputs reflect our own assumptions regarding fair market value for these securities. Although the majority of our prices are obtained from third party sources, we also perform an internal pricing review for securities with low trading volumes in the current market conditions. Financial instruments are categorized based upon the following characteristics or inputs to the valuation techniques: Level 1: Quoted prices for identical instruments in active markets not subject to adjustments or discounts.
Level 2: Quoted prices for similar instruments in active markets; quoted prices for identical or similar instruments in
markets that are not active; and model-derived valuations whose inputs are observable or whose significant value drivers are observable.
Level 3: Instruments whose significant value drivers are unobservable and reflect management’s estimate of fair value
based upon assumptions used by market participants in an orderly transaction as of the valuation date.

ERIE INDEMNITY COMPANY NOTES TO CONSOLIDATED FINANCIAL STATEMENTS
84
The following table represents the fair value measurements on a recurring basis for our consolidated available-for-sale and trading securities by asset class and level of input at December 31, 2011:
Erie Insurance Group
December 31, 2011
Fair value measurements using:
(in millions) Total
Quoted prices in active markets for
identical assets Level 1
Significant observable
inputs Level 2
Significant unobservable
inputs Level 3
Indemnity
Available-for-sale securities:
States & political subdivisions $ 221 $ 0 $ 221 $ 0
Corporate debt securities 303 0 303 0
Commercial mortgage-backed securities (CMBS) 13 0 13 0
Collateralized debt obligations (CDO) 4 0 0 4
Other debt securities 7 0 7 0
Total fixed maturities 548 0 544 4
Nonredeemable preferred stock 25 10 15 0
Total available-for-sale securities 573 10 559 4
Trading securities:
Common stock 27 27 0 0
Total trading securities 27 27 0 0
Total – Indemnity $ 600 $ 37 $ 559 $ 4
Exchange
Available-for-sale securities:
U.S. government & agencies $ 17 $ 6 $ 11 $ 0
States & political subdivisions 1,379 0 1,375 4
Foreign government securities 15 0 15 0
Corporate debt securities 5,499 20 5,467 12
Residential mortgage-backed securities (RMBS) 189 0 189 0
Commercial mortgage-backed securities (CMBS) 66 0 66 0
Collateralized debt obligations (CDO) 65 0 36 29
Other debt securities 62 0 57 5
Total fixed maturities 7,292 26 7,216 50
Nonredeemable preferred stock 564 188 371 5
Total available-for-sale securities 7,856 214 7,587 55
Trading securities:
Common stock 2,308 2,296 0 12
Total trading securities 2,308 2,296 0 12
Total – Exchange $10,164 $2,510 $7,587 $67
Total – Erie Insurance Group $10,764 $2,547 $8,146 $71

ERIE INDEMNITY COMPANY NOTES TO CONSOLIDATED FINANCIAL STATEMENTS
85
Level 3 Assets – Quarterly Change:
Erie Insurance Group
(in millions)
Beginning balance at
September 30, 2011
Included in
earnings (1)
Included in other
comprehensive income Purchases Sales
Transfers in and (out)
of Level 3 (2)
Ending balance at
December 31, 2011
Indemnity Available-for-sale securities:
Collateralized debt obligations (CDO) $ 4 $ 0 $ 0 $0 $0 $0 $ 4
Total fixed maturities 4 0 0 0 0 0 4
Total available-for-sale securities 4 0 0 0 0 0 4
Trading securities:
Common stock 0 0 0 0 0 0 0
Total trading securities 0 0 0 0 0 0 0
Total Level 3 assets – Indemnity $ 4 $ 0 $ 0 $0 $0 $0 $ 4
Exchange
Available-for-sale securities:
States & political subdivisions $ 4 $ 0 $ 0 $0 $0 $0 $ 4
Corporate debt securities 12 0 0 0 0 0 12
Collateralized debt obligations (CDO) 29 0 0 0 0 0 29
Other debt securities 5 0 0 0 0 0 5
Total fixed maturities 50 0 0 0 0 0 50
Nonredeemable preferred stock 6 0 (1) 0 0 0 5
Total available-for-sale securities 56 0 (1) 0 0 0 55
Trading securities:
Common stock 13 (1) 0 0 0 0 12
Total trading securities 13 (1) 0 0 0 0 12
Total Level 3 assets – Exchange $69 $(1) $(1) $0 $0 $0 $67
Total Level 3 assets – Erie Insurance Group $73 $(1) $(1) $0 $0 $0 $71
(1) Includes losses as a result of other-than-temporary impairments and accrual of discount and amortization of premium. These amounts are
reported in the Consolidated Statements of Operations. There were no unrealized gains or losses included in earnings for the three months
ended December 31, 2011 on Level 3 securities.
(2) Transfers in and out of Level 3 are attributable to changes in the availability of market observable information for individual securities within the respective categories. Transfers in and out of levels are recognized at the start of the period.
There were no transfers between Levels 1 and 2 during the three months ended December 31, 2011.

ERIE INDEMNITY COMPANY NOTES TO CONSOLIDATED FINANCIAL STATEMENTS
86
Level 3 Assets – Year-to-Date Change:
Erie Insurance Group
(in millions)
Beginning balance at
December 31, 2010
Included in
earnings (1)
Included in other
comprehensive income Purchases Sales
Transfers in and (out)
of Level 3 (2)
Ending balance at
December 31, 2011
Indemnity Available-for-sale securities:
Collateralized debt obligations (CDO) $ 4 $0 $ 0 $0 $ 0 $0 $ 4
Total fixed maturities 4 0 0 0 0 0 4
Total available-for-sale securities 4 0 0 0 0 0 4
Trading securities:
Common stock 0 0 0 0 0 0 0
Total trading securities 0 0 0 0 0 0 0
Total Level 3 assets – Indemnity $ 4 $0 $ 0 $0 $ 0 $0 $ 4
Exchange
Available-for-sale securities:
States & political subdivisions $ 4 $0 $ 0 $0 $ 0 $0 $ 4
Corporate debt securities 11 0 0 1 0 0 12
Collateralized debt obligations (CDO) 30 0 (1) 0 0 0 29
Other debt securities 10 0 0 0 (5) 0 5
Total fixed maturities 55 0 (1) 1 (5) 0 50
Nonredeemable preferred stock 7 0 (2) 0 0 0 5
Total available-for-sale securities 62 0 (3) 1 (5) 0 55
Trading securities:
Common stock 12 0 0 0 0 0 12
Total trading securities 12 0 0 0 0 0 12
Total Level 3 assets – Exchange $74 $0 $(3) $1 $(5) $0 $67
Total Level 3 assets – Erie Insurance Group $78 $0 $(3) $1 $(5) $0 $71
(1) Includes losses as a result of other-than-temporary impairments and accrual of discount and amortization of premium. These amounts are
reported in the Consolidated Statements of Operations. There were no unrealized gains or losses included in earnings for the year ended
December 31, 2011 on Level 3 securities.
(2) Transfers in and out of Level 3 are attributable to changes in the availability of market observable information for individual securities within the respective categories. Transfers in and out of levels are recognized at the start of the period.
There were no transfers between Levels 1 and 2 during the year ended December 31, 2011.

ERIE INDEMNITY COMPANY NOTES TO CONSOLIDATED FINANCIAL STATEMENTS
87
The following table represents the fair value measurements on a recurring basis for our consolidated available-for-sale and trading securities by major category and level of input at December 31, 2010:
Erie Insurance Group
December 31, 2010
Fair value measurements using:
(in millions) Total
Quoted prices in active markets for
identical assets Level 1
Significant observable
inputs Level 2
Significant unobservable
inputs Level 3
Indemnity
Available-for-sale securities:
U.S. government & agencies $ 25 $ 25 $ 0 $ 0
States & political subdivisions 197 0 197 0
Corporate debt securities 38 0 38 0
Collateralized debt obligations (CDO) 4 0 0 4
Total fixed maturities 264 25 235 4
Nonredeemable preferred stock 24 11 13 0
Total available-for-sale securities 288 36 248 4
Trading securities:
Common stock 28 28 0 0
Total trading securities 28 28 0 0
Total – Indemnity $ 316 $ 64 $ 248 $ 4
Exchange
Available-for-sale securities:
U.S. government & agencies $ 87 $ 12 $ 75 $ 0
States & political subdivisions 1,471 0 1,467 4
Foreign government securities 21 0 21 0
Corporate debt securities 5,263 12 5,240 11
Residential mortgage-backed securities (RMBS) 224 0 224 0
Commercial mortgage-backed securities (CMBS) 86 0 86 0
Collateralized debt obligations (CDO) 70 0 40 30
Other debt securities 57 0 47 10
Total fixed maturities 7,279 24 7,200 55
Nonredeemable preferred stock 570 166 397 7
Total available-for-sale securities 7,849 190 7,597 62
Trading securities:
Common stock 2,306 2,294 0 12
Total trading securities 2,306 2,294 0 12
Total – Exchange $10,155 $2,484 $7,597 $74
Total – Erie Insurance Group $10,471 $2,548 $7,845 $78

ERIE INDEMNITY COMPANY NOTES TO CONSOLIDATED FINANCIAL STATEMENTS
88
Level 3 Assets – Quarterly Change:
Erie Insurance Group
(in millions)
Beginning balance at
September 30, 2010
Transfer(s) in and (out) (1)
Included in earnings (2)
Included in other comprehensive
income
Purchases, sales and
adjustments
Transfer(s) in and
(out) of Level 3 (3)
Ending balance at
December 31, 2010
Indemnity
Available-for-sale securities:
Corporate debt securities $ 2 $(2) $ 0 $0 $ 0 $ 0 $ 0
Collateralized debt obligations (CDO) 7 (4) 0 0 0 1 4
Total fixed maturities 9 (6) 0 0 0 1 4
Nonredeemable preferred stock 2 (1) 0 0 (1) 0 0
Total available-for-sale securities 11 (7) 0 0 (1) 1 4
Trading securities: Common stock 0 0 0 0 0 0 0
Total trading securities 0 0 0 0 0 0 0
Total Level 3 assets – Indemnity $11 $(7) $ 0 $0 $ (1) $ 1 $ 4
Exchange
Available-for-sale securities:
States & political subdivisions $ 0 $ 0 $ 0 $0 $ 0 $ 4 $ 4
Corporate debt securities 9 2 0 0 0 0 11
Collateralized debt obligations (CDO) 42 4 (1) 1 (16) 0 30
Other debt securities 5 0 0 0 0 5 10
Total fixed maturities 56 6 (1) 1 (16) 9 55
Nonredeemable preferred stock 5 1 0 1 0 0 7
Total available-for-sale securities 61 7 (1) 2 (16) 9 62
Trading securities:
Common stock 11 0 1 0 0 0 12
Total trading securities 11 0 1 0 0 0 12
Total Level 3 assets – Exchange $72 $ 7 $ 0 $2 $(16) $ 9 $74
Total Level 3 assets – Erie Insurance Group $83 $ 0 $ 0 $2 $(17) $10 $78
(1) Transfers in and out are attributable to the sale of Indemnity’s wholly owned property and casualty insurance subsidiaries Erie Insurance
Company, Erie Insurance Company of New York and Erie Insurance Property and Casualty Company, to the Exchange. Level 3 securities previously held by the Indemnity are shown as transfer (out) while transfers to the Exchange are shown as transfer in.
(2) Includes losses as a result of other-than-temporary impairments and accrual of discount and amortization of premium. These amounts are
reported in the Consolidated Statements of Operations. There were no unrealized gains or losses included in earnings for the three months
ended December 31, 2010 on Level 3 securities.
(3) Transfers in and out of Level 3 are attributable to changes in the availability of market observable information for individual securities within the respective categories. Transfers in and out of levels are recognized at the start of the period.
There were no significant transfers between Levels 1 and 2 during the three months ended December 31, 2010.

ERIE INDEMNITY COMPANY NOTES TO CONSOLIDATED FINANCIAL STATEMENTS
89
Level 3 Assets – Year-to-Date Change:
Erie Insurance Group
(in millions)
Beginning balance at
December 31, 2009
Transfer(s) in and (out) (1)
Included in earnings (2)
Included in other comprehensive
income
Purchases, sales and
adjustments
Transfer(s) in and
(out) of Level 3 (3)
Ending balance at
December 31, 2010
Indemnity
Available-for-sale securities:
Corporate debt securities $ 2 $(2) $ 0 $0 $ 0 $ 0 $ 0
Collateralized debt obligations (CDO) 8 (4) 0 0 0 0 4
Total fixed maturities 10 (6) 0 0 0 0 4
Nonredeemable preferred stock 1 (1) 0 0 0 0 0
Total available-for-sale securities 11 (7) 0 0 0 0 4
Trading securities: Common stock 0 0 0 0 0 0 0
Total trading securities 0 0 0 0 0 0 0
Total Level 3 assets – Indemnity $ 11 $(7) $ 0 $0 $ 0 $ 0 $ 4
Exchange
Available-for-sale securities:
States & political subdivisions $ 0 $ 0 $ 0 $0 $ 0 $ 4 $ 4
Corporate debt securities 17 2 0 0 0 (8) 11
Collateralized debt obligations (CDO) 49 4 (1) 5 (19) (8) 30
Other debt securities 5 0 0 0 0 5 10
Total fixed maturities 71 6 (1) 5 (19) (7) 55
Nonredeemable preferred stock 4 1 0 2 0 0 7
Total available-for-sale securities 75 7 (1) 7 (19) (7) 62
Trading securities:
Common stock 9 0 3 0 0 0 12
Total trading securities 9 0 3 0 0 0 12
Total Level 3 assets – Exchange $84 $ 7 $ 2 $7 $(19) $(7) $74
Total Level 3 assets – Erie Insurance Group $95 $ 0 $ 2 $7 $(19) $(7) $78
(1) Transfers in and out are attributable to the sale of Indemnity’s wholly owned property and casualty insurance subsidiaries Erie Insurance Company, Erie Insurance Company of New York and Erie Insurance Property and Casualty Company, to the Exchange. Level 3 securities
previously held by the Indemnity are shown as transfer (out) while transfers to the Exchange are shown as transfer in.
(2) Includes losses as a result of other-than-temporary impairments and accrual of discount and amortization of premium. These amounts are
reported in the Consolidated Statements of Operations. There were no unrealized gains or losses included in earnings for the year ended December 31, 2010 on Level 3 securities.
(3) Transfers in and out of Level 3 are attributable to changes in the availability of market observable information for individual securities
within the respective categories. Transfers in and out of levels are recognized at the end of the period.
There were no significant transfers between Levels 1 and 2 during the year ended December 31, 2010.

ERIE INDEMNITY COMPANY NOTES TO CONSOLIDATED FINANCIAL STATEMENTS
90
Estimates of fair values for our investment portfolio are obtained primarily from nationally recognized pricing services. Our Level 1 category includes those securities valued using an exchange traded price provided by the pricing services. The methodologies used by the pricing services that support a Level 2 classification of a financial instrument include multiple verifiable, observable inputs including benchmark yields, reported trades, broker/dealer quotes, issuer spreads, two-sided markets, benchmark securities, bids, offers and reference data. Pricing service valuations for Level 3 securities are based upon proprietary models and are used when observable inputs are not available in illiquid markets. In limited circumstances we adjust the price received from the pricing services when, in our judgment, a better reflection of fair value is available based upon corroborating information and our knowledge and monitoring of market conditions. At December 31, 2011, we adjusted one price received from our pricing services to reflect an alternate fair market value. This alternative fair value was based upon observable market data. The price difference between the pricing service and the observable market data was less than $0.1 million. We perform continuous reviews of the prices obtained from the pricing services. This includes evaluating the methodology and inputs used by the pricing service to ensure that we determine the proper level classification of the financial instrument. Price variances, including large periodic changes, are investigated and corroborated by market data. We have reviewed the pricing methodologies of our pricing service as well as other observable inputs, such as benchmark yields, reported trades, issuer spreads, two-sided markets, benchmark securities, bids, offers, reference data, and transaction volumes and believe that their prices adequately consider market activity in determining fair value. Our review process continues to evolve based upon accounting guidance and requirements. When prices from the pricing services are not available, values are determined by obtaining non-binding broker quotes and/or market comparables. When available, we obtain multiple quotes for the same security. The ultimate value for these securities is determined based upon our best estimate of fair value using corroborating market information. Our evaluation includes the consideration of benchmark yields, reported trades, issuer spreads, two-sided markets, benchmark securities, bids, offers and reference data. For certain structured securities in an illiquid market, there may be no prices available from a pricing service and no comparable market quotes available. In these situations, we value the security using an internally-developed, risk-adjusted discounted cash flow model.
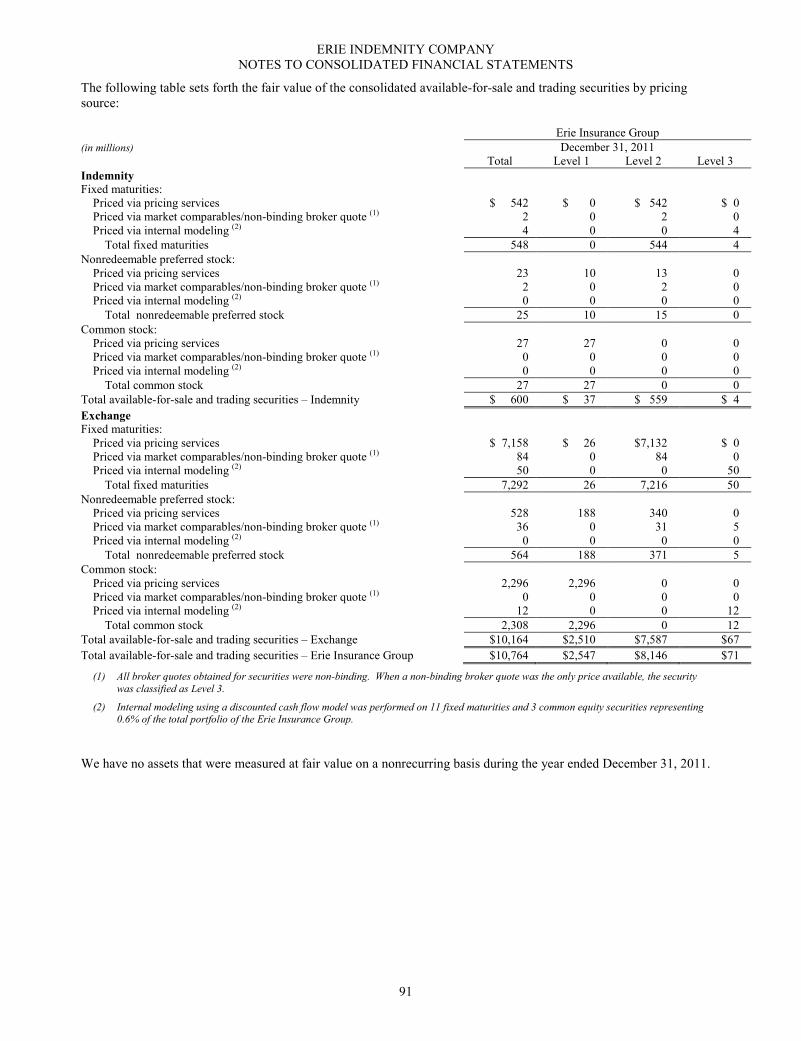
ERIE INDEMNITY COMPANY NOTES TO CONSOLIDATED FINANCIAL STATEMENTS
91
The following table sets forth the fair value of the consolidated available-for-sale and trading securities by pricing source: Erie Insurance Group
(in millions) December 31, 2011 Total Level 1 Level 2 Level 3
Indemnity Fixed maturities:
Priced via pricing services $ 542 $ 0 $ 542 $ 0 Priced via market comparables/non-binding broker quote (1) 2 0 2 0 Priced via internal modeling (2) 4 0 0 4
Total fixed maturities 548 0 544 4
Nonredeemable preferred stock: Priced via pricing services 23 10 13 0 Priced via market comparables/non-binding broker quote (1) 2 0 2 0 Priced via internal modeling (2) 0 0 0 0
Total nonredeemable preferred stock 25 10 15 0
Common stock: Priced via pricing services 27 27 0 0 Priced via market comparables/non-binding broker quote (1) 0 0 0 0 Priced via internal modeling (2) 0 0 0 0
Total common stock 27 27 0 0
Total available-for-sale and trading securities – Indemnity $ 600 $ 37 $ 559 $ 4
Exchange Fixed maturities:
Priced via pricing services $ 7,158 $ 26 $7,132 $ 0 Priced via market comparables/non-binding broker quote (1) 84 0 84 0 Priced via internal modeling (2) 50 0 0 50
Total fixed maturities 7,292 26 7,216 50
Nonredeemable preferred stock: Priced via pricing services 528 188 340 0 Priced via market comparables/non-binding broker quote (1) 36 0 31 5 Priced via internal modeling (2) 0 0 0 0
Total nonredeemable preferred stock 564 188 371 5
Common stock: Priced via pricing services 2,296 2,296 0 0 Priced via market comparables/non-binding broker quote (1) 0 0 0 0 Priced via internal modeling (2) 12 0 0 12
Total common stock 2,308 2,296 0 12
Total available-for-sale and trading securities – Exchange $10,164 $2,510 $7,587 $67
Total available-for-sale and trading securities – Erie Insurance Group $10,764 $2,547 $8,146 $71
(1) All broker quotes obtained for securities were non-binding. When a non-binding broker quote was the only price available, the security
was classified as Level 3.
(2) Internal modeling using a discounted cash flow model was performed on 11 fixed maturities and 3 common equity securities representing 0.6% of the total portfolio of the Erie Insurance Group.
We have no assets that were measured at fair value on a nonrecurring basis during the year ended December 31, 2011.
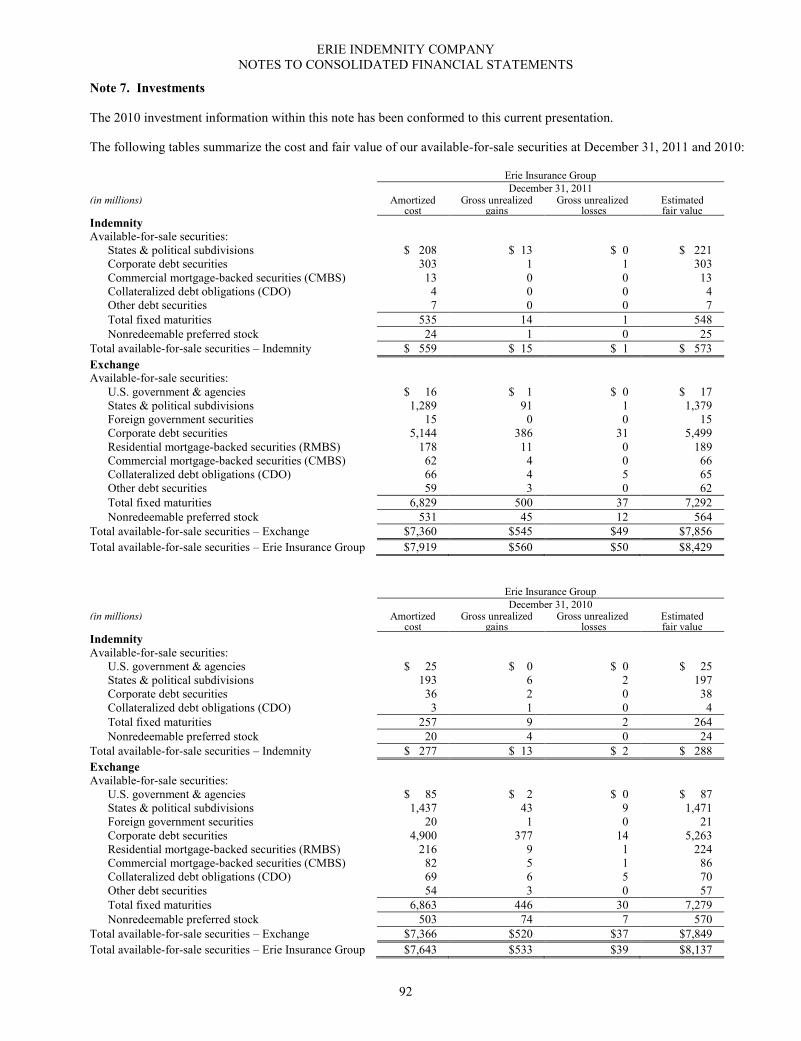
ERIE INDEMNITY COMPANY NOTES TO CONSOLIDATED FINANCIAL STATEMENTS
92
Note 7. Investments The 2010 investment information within this note has been conformed to this current presentation. The following tables summarize the cost and fair value of our available-for-sale securities at December 31, 2011 and 2010:
Erie Insurance Group
December 31, 2011 (in millions) Amortized Gross unrealized Gross unrealized Estimated cost gains losses fair value
Indemnity Available-for-sale securities:
States & political subdivisions $ 208 $ 13 $ 0 $ 221 Corporate debt securities 303 1 1 303 Commercial mortgage-backed securities (CMBS) 13 0 0 13 Collateralized debt obligations (CDO) 4 0 0 4 Other debt securities 7 0 0 7
Total fixed maturities 535 14 1 548
Nonredeemable preferred stock 24 1 0 25
Total available-for-sale securities – Indemnity $ 559 $ 15 $ 1 $ 573
Exchange Available-for-sale securities:
U.S. government & agencies $ 16 $ 1 $ 0 $ 17 States & political subdivisions 1,289 91 1 1,379 Foreign government securities 15 0 0 15 Corporate debt securities 5,144 386 31 5,499 Residential mortgage-backed securities (RMBS) 178 11 0 189 Commercial mortgage-backed securities (CMBS) 62 4 0 66 Collateralized debt obligations (CDO) 66 4 5 65 Other debt securities 59 3 0 62
Total fixed maturities 6,829 500 37 7,292
Nonredeemable preferred stock 531 45 12 564
Total available-for-sale securities – Exchange $7,360 $545 $49 $7,856
Total available-for-sale securities – Erie Insurance Group $7,919 $560 $50 $8,429
Erie Insurance Group
December 31, 2010 (in millions) Amortized Gross unrealized Gross unrealized Estimated cost gains losses fair value
Indemnity Available-for-sale securities:
U.S. government & agencies $ 25 $ 0 $ 0 $ 25 States & political subdivisions 193 6 2 197 Corporate debt securities 36 2 0 38 Collateralized debt obligations (CDO) 3 1 0 4
Total fixed maturities 257 9 2 264
Nonredeemable preferred stock 20 4 0 24
Total available-for-sale securities – Indemnity $ 277 $ 13 $ 2 $ 288
Exchange Available-for-sale securities:
U.S. government & agencies $ 85 $ 2 $ 0 $ 87 States & political subdivisions 1,437 43 9 1,471 Foreign government securities 20 1 0 21 Corporate debt securities 4,900 377 14 5,263 Residential mortgage-backed securities (RMBS) 216 9 1 224 Commercial mortgage-backed securities (CMBS) 82 5 1 86 Collateralized debt obligations (CDO) 69 6 5 70 Other debt securities 54 3 0 57
Total fixed maturities 6,863 446 30 7,279
Nonredeemable preferred stock 503 74 7 570
Total available-for-sale securities – Exchange $7,366 $520 $37 $7,849
Total available-for-sale securities – Erie Insurance Group $7,643 $533 $39 $8,137

ERIE INDEMNITY COMPANY NOTES TO CONSOLIDATED FINANCIAL STATEMENTS
93
The amortized cost and estimated fair value of fixed maturities at December 31, 2011, are shown below by remaining contractual term to maturity. Mortgage-backed securities are allocated based upon their stated maturity dates. Expected maturities may differ from contractual maturities because borrowers may have the right to call or prepay obligations with or without call or prepayment penalties.
Erie Insurance Group
(in millions) Amortized Estimated cost fair value
Indemnity Due in one year or less $ 152 $ 152 Due after one year through five years 253 256 Due after five years through ten years 47 52 Due after ten years 83 88
Total fixed maturities – Indemnity $ 535 $ 548
Exchange Due in one year or less $ 506 $ 513 Due after one year through five years 2,397 2,519 Due after five years through ten years 2,669 2,898 Due after ten years 1,257 1,362
Total fixed maturities – Exchange $6,829 $7,292
Total fixed maturities – Erie Insurance Group $7,364 $7,840
Available-for-sale securities in a gross unrealized loss position at December 31, 2011 are as follows. Data is provided by length of time for securities in a gross unrealized loss position.
Erie Insurance Group
December 31, 2011 (dollars in millions) Less than 12 months 12 months or longer Total
Fair Unrealized Fair Unrealized Fair Unrealized No. of Indemnity value losses value losses Value losses holdings
Available-for-sale securities: Corporate debt securities $220 $ 1 $ 0 $ 0 $220 $ 1 41 Commercial mortgage-backed securities (CMBS) 4 0 9 0 13 0 3
Other debt securities 5 0 2 0 7 0 2
Total fixed maturities – Indemnity 229 1 11 0 240 1 46
Nonredeemable preferred stock 4 0 3 0 7 0 3
Total available-for-sale securities – Indemnity $233 $ 1 $ 14 $ 0 $247 $ 1 49
Quality breakdown of fixed maturities: Investment grade $229 $ 1 $ 11 $ 0 $240 $ 1 46 Non-investment grade 0 0 0 0 0 0 0
Total fixed maturities – Indemnity $229 $ 1 $ 11 $ 0 $240 $ 1 46
Exchange Available-for-sale securities:
States & political subdivisions $ 7 $ 0 $ 6 $ 1 $ 13 $ 1 3 Corporate debt securities 635 27 50 4 685 31 108 Residential mortgage-backed securities (RMBS) 7 0 0 0 7 0 4 Commercial mortgage-backed securities (CMBS) 5 0 0 0 5 0 1
Collateralized debt obligations (CDO) 0 0 32 5 32 5 6
Other debt securities 9 0 0 0 9 0 2
Total fixed maturities – Exchange 663 27 88 10 751 37 124
Nonredeemable preferred stock 168 11 34 1 202 12 27
Total available-for-sale securities – Exchange $831 $38 $122 $11 $953 $49 151
Quality breakdown of fixed maturities: Investment grade $625 $26 $ 79 $ 9 $704 $35 109 Non-investment grade 38 1 9 1 47 2 15
Total fixed maturities – Exchange $663 $27 $ 88 $10 $751 $37 124

ERIE INDEMNITY COMPANY NOTES TO CONSOLIDATED FINANCIAL STATEMENTS
94
Available-for-sale securities in a gross unrealized loss position at December 31, 2010 are as follows. Data is provided by length of time for securities in a gross unrealized loss position.
Erie Insurance Group
December 31, 2010 (dollars in millions) Less than 12 months 12 months or longer Total
Fair Unrealized Fair Unrealized Fair Unrealized No. of
Indemnity value losses value losses Value losses holdings
Available-for-sale securities: U.S. government & agencies $ 25 $ 0 $ 0 $ 0 $ 25 $ 0 1 States & political subdivisions 39 2 1 0 40 2 20 Corporate debt securities 31 0 0 0 31 0 3
Total fixed maturities – Indemnity 95 2 1 0 96 2 24
Nonredeemable preferred stock 3 0 0 0 3 0 1
Total available-for-sale securities – Indemnity $ 98 $ 2 $ 1 $ 0 $ 99 $ 2 25
Quality breakdown of fixed maturities: Investment grade $ 95 $ 2 $ 1 $ 0 $96 $ 2 24 Non-investment grade 0 0 0 0 0 0 0
Total fixed maturities – Indemnity $ 95 $ 2 $ 1 $ 0 $ 96 $ 2 24
Exchange Available-for-sale securities:
U.S. government & agencies $ 22 $ 0 $ 0 $ 0 $ 22 $ 0 3 States & political subdivisions 299 8 5 1 304 9 59 Foreign government securities 10 0 0 0 10 0 1 Corporate debt securities 398 8 144 6 542 14 101 Residential mortgage-backed securities (RMBS) 6 0 7 1 13 1 4 Commercial mortgage-backed securities (CMBS) 0 0 12 1 12 1 2
Collateralized debt obligations (CDO) 1 0 33 5 34 5 6
Total fixed maturities – Exchange 736 16 201 14 937 30 176
Nonredeemable preferred stock 45 2 59 5 104 7 15
Total available-for-sale securities – Exchange $781 $18 $260 $19 $1,041 $37 191
Quality breakdown of fixed maturities: Investment grade $703 $16 $155 $11 $ 858 $27 154 Non-investment grade 33 0 46 3 79 3 22
Total fixed maturities – Exchange $736 $16 $201 $14 $ 937 $30 176
The above securities for Indemnity and the Exchange have been evaluated and determined to be temporary impairments for which we expect to recover our entire principal plus interest. The primary components of this analysis include a general review of market conditions and financial performance of the issuer along with the extent and duration at which fair value is less than cost. Any debt securities that we intend to sell or will more likely than not be required to sell before recovery are included in other-than-temporary impairments with the impairment charges recognized in earnings.

ERIE INDEMNITY COMPANY NOTES TO CONSOLIDATED FINANCIAL STATEMENTS
95
Investment income, net of expenses, was generated from the following portfolios:
Interest and dividend income are recognized as earned and recorded to net investment income. Indemnity net investment income decreased by $21 million in 2011 compared to 2010. The Exchange’s net investment income increased by $21 million in 2011 compared to 2010. These changes were primarily caused by the sale of the EIC, ENY and EPC from Indemnity to the Exchange on December 31, 2010.
Erie Insurance Group
(in millions) Years ended December 31,
2011 2010 2009
Indemnity
Fixed maturities $ 14 $ 33 $ 36 Equity securities 2 4 5 Cash equivalents and other 1 1 1
Total investment income 17 38 42 Less: investment expenses 1 1 0
Investment income, net of expenses – Indemnity $ 16 $ 37 $ 42
Exchange
Fixed maturities $364 $350 $343 Equity securities 86 72 68 Cash equivalents and other 0 2 4
Total investment income 450 424 415 Less: investment expenses 33 28 24
Investment income, net of expenses – Exchange $417 $396 $391
Investment income, net of expenses – Erie Insurance Group $433 $433 $433

ERIE INDEMNITY COMPANY NOTES TO CONSOLIDATED FINANCIAL STATEMENTS
96
In 2010, Indemnity sold its interest in nine limited partnerships and the Exchange sold its interest in eleven limited partnerships, which generated net realized losses. There were no sales of limited partnerships in 2011 or 2009. Realized gains (losses) on investments were as follows:
(in millions) Erie Insurance Group
Years ended December 31,
Indemnity 2011 2010 2009
Available-for-sale securities:
Fixed maturities:
Gross realized gains $ 2 $ 6 $ 5 Gross realized losses 0 (1) (4)
Net realized gains 2 5 1
Equity securities: Gross realized gains 3 1 8 Gross realized losses 0 0 (7)
Net realized gains 3 1 1
Trading securities: Common stock:
Gross realized gains 2 6 2 Gross realized losses (1) (1) (5) Valuation adjustments (3) 0 11
Net realized (losses) gains (2) 5 8
Limited partnerships: Gross realized gains 0 0 0 Gross realized losses 0 (12) 0
Net realized gains (losses) 0 (12) 0
Net realized investment gains (losses) – Indemnity $ 3 $ (1) $ 10
Exchange Available-for-sale securities:
Fixed maturities: Gross realized gains $ 77 $ 49 $ 22 Gross realized losses (29) (24) (37)
Net realized gains (losses) 48 25 (15)
Equity securities: Gross realized gains 28 14 39 Gross realized losses (1) (3) (26)
Net realized gains 27 11 13
Trading securities: Common stock:
Gross realized gains 271 205 143 Gross realized losses (106) (135) (203) Valuation adjustments (247) 254 464
Net realized (losses) gains (82) 324 404
Limited partnerships: Gross realized gains 0 0 0 Gross realized losses 0 (46) 0
Net realized losses 0 (46) 0
Net realized investment (losses) gains – Exchange $ (7) $314 $402
Net realized investment (losses) gains – Erie Insurance Group $ (4) $313 $412

ERIE INDEMNITY COMPANY NOTES TO CONSOLIDATED FINANCIAL STATEMENTS
97
The components of other-than-temporary impairments on investments are included below:
Erie Insurance Group
(in millions) Years ended December 31 2011 2010 2009
Indemnity Fixed maturities $ 0 $(1) $ (7) Equity securities 0 0 (5)
Total other-than-temporary impairments 0 (1) (12) Portion recognized in other comprehensive income 0 0 0
Net impairment losses recognized in earnings – Indemnity $ 0 $(1) $ (12)
Exchange Fixed maturities $ 0 $(4) $ (54) Equity securities (2) (1) (60)
Total other-than-temporary impairments (2) (5) (114) Portion recognized in other comprehensive income 0 0 0
Net impairment losses recognized in earnings – Exchange $(2) $(5) $(114)
Net impairment losses recognized in earnings – Erie Insurance Group $(2) $(6) $(126)
In considering if fixed maturity securities were credit-impaired, some of the factors considered include: potential for the default of interest and/or principal, level of subordination, collateral of the issue, compliance with financial covenants, credit ratings and industry conditions. We have the intent to sell all credit-impaired fixed maturity securities, therefore the entire amount of the impairment charges were included in earnings and no non-credit impairments were recognized in other comprehensive income. Prior to the second quarter of 2009, when new impairment guidance was issued for debt securities, the impairment policy for fixed maturities was consistent with that of equity securities. See also Note 2, “Significant Accounting Policies.” Limited partnerships Our limited partnership investments are recorded using the equity method of accounting. As these investments are generally reported on a one-quarter lag, our limited partnership results through December 31, 2011 are comprised of partnership financial results for the fourth quarter of 2010 and the first, second, and third quarters of 2011. Given the lag in reporting, our limited partnership results do not reflect the market conditions of the fourth quarter of 2011. Cash contributions made to and distributions received from the partnerships are recorded in the period in which the transaction occurs. We have provided summarized financial information in the following table for the years ended December 31, 2011 and 2010. Amounts provided in the table are presented using the latest available financial statements received from the partnerships. Limited partnership financial information has been presented based upon the investment percentage in the partnerships for the Erie Insurance Group consistent with how management evaluates the investments.

ERIE INDEMNITY COMPANY NOTES TO CONSOLIDATED FINANCIAL STATEMENTS
98
As these investments are generally reported on a one-quarter lag, our limited partnership results through December 31, 2011 include partnership financial results for the fourth quarter of 2010 and the first three quarters of 2011.
Erie Insurance Group
As of and for the year ended December 31, 2011
(dollars in millions)
Investment percentage in limited partnerships
Number of partnerships
Asset recorded
Income (loss) recognized
due to valuation
adjustments by the
partnerships
Income (1oss)
recorded
Indemnity Private equity: Less than 10% 26 $ 73 $ 2 $ 5 Greater than or equal to 10% but less than 50% 3 9 0 3 Greater than 50% 0 0 0 0
Total private equity 29 82 2 8 Mezzanine debt: Less than 10% 11 22 0 6 Greater than or equal to 10% but less than 50% 3 12 1 1 Greater than 50% 1 1 (1) 0
Total mezzanine debt 15 35 0 7 Real estate: Less than 10% 12 62 5 (1) Greater than or equal to 10% but less than 50% 3 18 1 0 Greater than 50% 3 11 3 1
Total real estate 18 91 9 0
Total limited partnerships – Indemnity 62 $ 208 $11 $15
Exchange Private equity: Less than 10% 41 $ 452 $13 $30 Greater than or equal to 10% but less than 50% 3 43 (1) 12 Greater than 50% 0 0 0 0
Total private equity 44 495 12 42 Mezzanine debt: Less than 10% 17 133 (9) 26 Greater than or equal to 10% but less than 50% 3 33 3 3 Greater than 50% 3 35 (2) 3
Total mezzanine debt 23 201 (8) 32 Real estate: Less than 10% 25 284 31 (1) Greater than or equal to 10% but less than 50% 5 59 3 0 Greater than 50% 3 43 2 10
Total real estate 33 386 36 9
Total limited partnerships – Exchange 100 $1,082 $40 $83
Total limited partnerships – Erie Insurance Group $1,290 $51 $98
Per the limited partner financial statements, total partnership assets were $54 billion and total partnership liabilities were $6 billion at December 31, 2011 (as recorded in the September 30, 2011 limited partnership financial statements). For the twelve month period comparable to that presented in the preceding table (fourth quarter of 2010 and first three quarters of 2011), total partnership valuation adjustment gains were $2 billion and total partnership net income was $3 billion.

ERIE INDEMNITY COMPANY NOTES TO CONSOLIDATED FINANCIAL STATEMENTS
99
As these investments are generally reported on a one-quarter lag, our limited partnership results through December 31, 2010 include partnership financial results for the fourth quarter of 2009 and the first three quarters of 2010.
Erie Insurance Group
As of and for the year ended December 31, 2010
(dollars in millions)
Investment percentage in limited partnerships
Number of partnerships
Asset recorded
Income (loss) recognized
due to valuation
adjustments by the
partnerships
Income (1oss)
recorded
Indemnity Private equity: Less than 10% 26 $ 78 $ 4 $ 7 Greater than or equal to 10% but less than 50% 3 8 3 0 Greater than 50% 0 0 0 0
Total private equity 29 86 7 7 Mezzanine debt: Less than 10% 11 30 4 3 Greater than or equal to 10% but less than 50% 3 15 2 (2) Greater than 50% 1 2 0 0
Total mezzanine debt 15 47 6 1 Real estate: Less than 10% 12 59 30 (31) Greater than or equal to 10% but less than 50% 4 14 10 (10) Greater than 50% 4 10 4 (3)
Total real estate 20 83 44 (44)
Total limited partnerships – Indemnity 64 $ 216 $ 57 $(36)
Exchange Private equity: Less than 10% 41 $ 517 $ 28 $ 40 Greater than or equal to 10% but less than 50% 3 38 10 0 Greater than 50% 0 0 0 (1)
Total private equity 44 555 38 39 Mezzanine debt: Less than 10% 14 142 12 13 Greater than or equal to 10% but less than 50% 3 41 2 (2) Greater than 50% 3 31 0 2
Total mezzanine debt 20 214 14 13 Real estate: Less than 10% 25 250 (11) 10 Greater than or equal to 10% but less than 50% 6 52 7 (7) Greater than 50% 4 37 15 (11)
Total real estate 35 339 11 (8)
Total limited partnerships – Exchange 99 $1,108 $ 63 $ 44
Total limited partnerships – Erie Insurance Group $1,324 $120 $ 8
Per the limited partner financial statements, total partnership assets were $58 billion and total partnership liabilities were $10 billion at December 31, 2010 (as recorded in the September 30, 2010 limited partnership financial statements). For the twelve month period comparable to that presented in the preceding table (fourth quarter of 2009 and first three quarters of 2010), total partnership valuation adjustment gains were $4 billion and total partnership net income was $3 billion. See also Note 20, “Commitments and Contingencies,” for investment commitments related to limited partnerships.

ERIE INDEMNITY COMPANY NOTES TO CONSOLIDATED FINANCIAL STATEMENTS
100
Securities lending program We previously participated in a program whereby marketable securities from our investment portfolio were lent to independent brokers or dealers based upon, among other things, their creditworthiness, in exchange for collateral initially equal to 102% of the value of the securities on loan and are thereafter maintained at a minimum of 100% of the fair value of the securities loaned. The program was terminated in 2009.
Note 8. Goodwill Impairment
Goodwill is reviewed for impairment at least annually or more frequently if events occur or circumstances change that would indicate that a triggering event has occurred. Goodwill impairment testing follows a two step process. In the first step, the fair value of a reporting unit is compared to its carrying value. If the carrying value of a reporting unit exceeds its fair value, the second step of the impairment test is performed for purposes of measuring the impairment. Prior to December 31, 2010, the Exchange had $22 million of goodwill attributable to its purchase of EFL stock in 2006. In the fourth quarter of 2010, the Exchange entered into an agreement to purchase Indemnity’s 21.6% ownership interest in EFL and a valuation of EFL was performed by an external independent third party in preparation for the sale, which occurred on March 31, 2011. The valuation resulted in a purchase price determination of 95% of book value. In response to the valuation and sale price, management concluded that the possibility for impairment existed and step two of the goodwill impairment test was completed to determine the impairment amount. Step two of the impairment test compared the value of new business for EFL to the current goodwill balance. The analysis determined that the value of EFL’s new business did not support the $22 million goodwill, and an impairment entry was made to write down the entire balance at December 31, 2010. The charge of $22 million decreased the net income attributable to the Exchange in 2010.
Note 9. Capitalized Software Development Costs
We capitalize computer software costs developed or obtained for internal use. Capitalized costs include internal and external labor and overhead, all of which are attributable to Indemnity. Capitalization ceases and amortization begins no later than the point at which a computer software project is complete and ready for its intended use. Capitalized software costs are amortized over the estimated useful life of the software. The following table outlines the total capitalized software development costs subject to amortization and the related amortization expense:
Indemnity Shareholder Interest
(in millions) Years ended December 31, 2011 2010 2009
Gross carrying amount $43 $32 $10 Accumulated amortization (5) (1) 0
Net carrying amount $38 $31 $10
Amortization expense $ 4 $ 1 $ 0
The following table outlines the estimated future amortization expense related to capitalized software development costs as of December 31, 2011:
(in millions) Indemnity Shareholder Interest
Year ending December 31,
Estimated amortization expense
2012 $6 2013 6 2014 6 2015 6 2016 6
We anticipate incurring additional costs related to our software development initiatives. These costs are unknown at this time and therefore are not considered in the table above.

ERIE INDEMNITY COMPANY NOTES TO CONSOLIDATED FINANCIAL STATEMENTS
101
Note 10. Bank Line of Credit
As of December 31, 2011, Indemnity has available a $100 million bank revolving line of credit that expires on November 3, 2016. There were no borrowings outstanding on the line of credit as of December 31, 2011. Bonds with a fair value of $112 million were pledged as collateral on the line at December 31, 2011. As of December 31, 2011, the Exchange has available a $300 million bank revolving line of credit that expires on October 28, 2016. There were no borrowings outstanding on the line of credit as of December 31, 2011. Bonds with a fair value of $333 million were pledged as collateral on the line at December 31, 2011. Securities pledged as collateral on both lines have no trading restrictions and are reported as available-for-sale fixed maturities in the Consolidated Statements of Financial Position as of December 31, 2011. The banks require compliance with certain covenants, which include minimum net worth and leverage ratios for Indemnity’s line of credit and statutory surplus and risk based capital ratios for Exchange’s line of credit. We are in compliance with all covenants at December 31, 2011.
Note 11. Income Taxes
The provision for income taxes consists of the following for the years ended December 31:
(in millions) Erie Insurance Group
2011 2010 2009
Indemnity Current income tax expense $ 85 $ 37 $56 Deferred income tax expense (benefit) 0 67 (7)
Total provision for income taxes – Indemnity 85 104 49
Exchange Current income tax expense (benefit) 110 (43) 7 Deferred income tax (benefit) expense (105) 278 22
Total provision for income taxes – Exchange 5 235 29
Total provision for income taxes – Erie Insurance Group $ 90 $339 $78
The deferred income tax benefit in 2011 was primarily driven by unrealized losses on common stock. The deferred income tax expense in 2010 was primarily driven by the sale of previously impaired investments and unrealized gains on common stock and limited partnerships. In addition, the deferred tax liability recorded for Indemnity’s investment in EFL increased by $18 million in 2010 as a result of a change in the tax rate used to calculate the liability. This deferred tax charge was required due to Indemnity’s decision to sell its 21.6% ownership interest in EFL, rather than receiving its share of EFL’s earnings in the form of future dividends which would have been eligible for an 80% dividends received deduction.

ERIE INDEMNITY COMPANY NOTES TO CONSOLIDATED FINANCIAL STATEMENTS
102
A reconciliation of the provision for income taxes, with amounts determined by applying the statutory federal income tax rates to pre-tax income, is as follows for the years ended December 31:
(in millions) Erie Insurance Group
2011 2010 2009
Indemnity Income tax at statutory rates $89 $ 93 $ 53 Tax-exempt interest (3) (3) (3) Dividends received deduction (1) (1) (1) Deferred tax valuation allowance 0 (2) 0 Erie Family Life (losses) earnings (1) (1) 15 0 Other, net 1 2 0
Provision for income taxes – Indemnity 85 104 49
Exchange Income tax at statutory rates 37 259 130 Tax-exempt interest (15) (16) (17) Dividends received deduction (13) (11) (11) Deferred tax valuation allowance 0 (4) (71) Goodwill impairments 0 8 0 Prior year adjustments (5) 0 0 Other, net 1 (1) (2)
Provision for income taxes – Exchange 5 235 29
Provision for income taxes – Erie Insurance Group $90 $339 $ 78
(1) In 2010 Indemnity’s tax rate on its share of EFL earnings was adjusted from 7% to 35% due to Indemnity’s decision to sell its 21.6%
ownership interest in EFL to the Exchange, which closed on March 31, 2011, rather than receiving its share of EFL’s earnings in the
form of future dividends, which would have been eligible for an 80% dividends received deduction.
Temporary differences and carry-forwards, which give rise to consolidated deferred tax assets and liabilities, are as follows for the years ended December 31:
(in millions) Erie Insurance Group
2011 2010
Indemnity Deferred tax assets:
Net allowance for service fees and premium cancellations $ 3 $ 3 Other employee benefits 9 8 Pension and other postretirement benefits 45 21 Write-downs of impaired securities 1 2 Capital loss carryover 0 7 Other 0 1
Total deferred tax assets 58 42
Deferred tax liabilities: Unrealized gains on investments 6 7 Equity interest in EFL 0 22 Limited partnerships 10 20 Depreciation 13 7 Prepaid expenses 7 5 Capitalized internally developed software 1 5 Other 2 2
Total deferred tax liabilities 39 68
Net deferred income tax asset (liability) – Indemnity $19 $(26)

ERIE INDEMNITY COMPANY NOTES TO CONSOLIDATED FINANCIAL STATEMENTS
103
(in millions)
Erie Insurance Group (continued)
2011 2010
Exchange Deferred tax assets:
Loss reserve discount $ 81 $ 83 Liability for future life and annuity policy benefits 12 13 Unearned premiums 165 156 Write-downs of impaired securities 29 42 Wash sales 6 8 Capital loss carryover 7 9 Other 14 8
Total deferred tax assets 314 319
Deferred tax liabilities: Deferred policy acquisition costs 159 153 Unrealized gains on investments 272 356 Limited partnerships 12 49 Net allowance for service fees and premium cancellations 3 3 Other 15 15
Total deferred tax liabilities 461 576
Net deferred tax liability – Exchange $(147) $(257)
Net deferred tax liability – Erie Insurance Group $(128) $(283)
Neither the Indemnity nor the Exchange had a valuation allowance recorded at December 31, 2011 or December 31, 2010. In 2010, Indemnity generated taxable losses of $38 million and the Exchange generated taxable losses of $175 million on the sale of limited partnerships. These partnerships were sold to recapture tax paid on prior period capital gains that were due to expire. The unrealized losses on these partnerships were previously recorded as a deferred tax asset. Indemnity and the Exchange received $13 million and $61 million, respectively, in tax on these transactions in 2011. We have one uncertain income tax position for which a current liability was recorded. As a related temporary tax difference was also recognized, there was no impact on our results of operations or financial position. We recognized interest related to our remaining uncertain tax position in income tax expense. Accrued estimated interest on our unrecognized tax benefit was $0.3 million and $0.2 million at December 31, 2011 and 2010, respectively. The IRS has examined tax filings through 2007 and is currently examining our federal income tax returns for 2008 and 2009. We currently estimate that our unrecognized tax benefits will not change significantly in the next 12 months. Indemnity is the attorney-in-fact for the subscribers (policyholders) at the Exchange, a reciprocal insurance exchange. In that capacity, Indemnity provides all services and facilities necessary to conduct the Exchange’s insurance business. Indemnity and the Exchange together constitute one insurance business. Indemnity is not subject to state corporation income or franchise taxes in states where the Exchange conducts its business, as a result of the Exchange’s remittance of premium taxes in those states.

ERIE INDEMNITY COMPANY NOTES TO CONSOLIDATED FINANCIAL STATEMENTS
104
Note 12. Deferred Policy Acquisition Costs
The following table summarizes the components of the Property and Casualty Group’s and EFL’s deferred policy acquisition costs assets for the years ended December 31:
(in millions) Erie Insurance Group
2011 2010
Property and Casualty Group Deferred policy acquisition costs asset at beginning of year $ 327 $ 313 Capitalized deferred policy acquisition costs 684 649 Amortized deferred policy acquisition costs (668) (635)
Deferred policy acquisition costs asset at end of year – Property and Casualty Group $ 343 $ 327
Erie Family Life Insurance Company Deferred policy acquisition costs asset at beginning of year $ 140 $ 154 Capitalized deferred policy acquisition costs 18 17 Amortized deferred policy acquisition costs (12) (16) Amortized shadow deferred policy acquisition costs (2) (15)
Deferred policy acquisition costs asset at end of year – EFL $ 144 $ 140
Deferred policy acquisition costs asset at end of year – Erie Insurance Group $ 487 $ 467
Note 13. Property and Casualty Unpaid Losses and Loss Expenses The following table provides a reconciliation of our property and casualty beginning and ending loss and loss expense reserve balances for the years ended December 31:
Property and Casualty Group
(in millions) 2011 2010 2009
Losses and loss expense reserves at January 1, – Gross $3,584 $3,598 $3,586 Less: reinsurance recoverable 188 200 187
Losses and loss expense reserves at January 1, – Net 3,396 3,398 3,399
Incurred losses and loss expenses related to:
Current accident year 3,616 3,053 2,732 Prior accident years (272) (244) (93)
Total incurred losses and loss expenses 3,344 2,809 2,639
Paid losses and loss expenses related to:
Current accident year 2,360 1,855 1,608 Prior accident years 1,032 956 1,032
Total paid losses and loss expenses 3,392 2,811 2,640
Losses and loss expense reserves at December 31, – Net 3,348 3,396 3,398 Add: reinsurance recoverable 151 188 200
Losses and loss expense reserves at December 31, – Gross $3,499 $3,584 $3,598
Loss reserves are set at full expected cost, except for workers compensation loss reserves which have been discounted using an interest rate of 2.5% for all periods presented. This discounting reduced unpaid losses and loss expenses by $84 million, $127 million and $136 million at December 31, 2011, 2010 and 2009, respectively. The reserves for losses and loss expenses are reported net of receivables for salvage and subrogation which totaled $145 million, $141 million and $133 million at December 31, 2011, 2010 and 2009, respectively.

ERIE INDEMNITY COMPANY NOTES TO CONSOLIDATED FINANCIAL STATEMENTS
105
Favorable development on prior accident year direct loss reserves in 2011 was primarily the result of improvements in severity trends in our personal auto, workers compensation, commercial multi-peril and homeowners lines of business combined with the closing of several large claims. In 2010, the favorable development on prior accident year direct loss reserves was primarily the result of improvements in severity trends in the commercial multi-peril, personal auto and workers compensation lines of business, combined with the closing of several large claims. In 2009, the favorable development was primarily the result of the closing of several large claims, changes in our mortality assumptions, and a change in the payout patterns used in the calculation to discount reserves in our workers compensation line of business. The 2009 favorable development was offset somewhat by adverse development in our personal auto line of business as a result of the use of gender specific tables in our mortality rate assumption and the outcome of certain court decisions related to our commercial multi-peril line of business. Note 14. Life Policy and Deposit Contract Reserves
The following table provides the components of our life policy and deposit contract liability balances for the years ended December 31:
(in millions) Erie Family Life Insurance Company
2011 2010 2009
Deferred annuities $1,144 $1,117 $1,076 Ordinary/traditional life 282 254 229 Universal life 228 214 211 Other 17 18 24
Life policy and deposit contract reserves $1,671 $1,603 $1,540
The reinsurance credit related to life policy and deposit contract reserves was $108 million, $95 million and $82 million at December 31, 2011, 2010, and 2009 respectively, and is presented in other assets in the Consolidated Statements of Financial Position.
Note 15. Reinsurance
Members of the Property and Casualty Group participate in an intercompany reinsurance pooling agreement. Under the pooling agreement, all insurance business of the Property and Casualty Group is pooled in the Exchange. EIC and ENY share in the underwriting results of the reinsurance pool through retrocession. Since 1995, the Board of Directors has set the allocation of the pooled underwriting results at 5.0% participation for EIC, 0.5% participation for ENY and 94.5% participation for the Exchange. The purpose of the pooling agreement is to spread the risks of the members of the Property and Casualty Group collectively across the different lines of business they underwrite and geographic regions in which each operates. This agreement may be terminated by any party as of the end of any calendar year by providing not less than 90 days advance written notice. Intercompany pooling accounts are settled in cash within 30 days after the end of each quarterly accounting period. On December 31, 2010, Indemnity sold all of the outstanding capital stock of its wholly owned subsidiaries, EIC and ENY, to the Exchange. Under this structure, all property and casualty insurance operations are owned by the Exchange, and Indemnity functions solely as the management company. There was no impact on the existing reinsurance pooling agreement between the Exchange and EIC or ENY as a result of the sale. Reinsurance contracts do not relieve the Property and Casualty Group or EFL from their primary obligations to policyholders. A contingent liability exists with respect to reinsurance recoverables in the event reinsurers are unable to meet their obligations under the reinsurance agreements. The Property and Casualty Group maintains several property catastrophe reinsurance treaties with nonaffiliated reinsurers to mitigate future potential catastrophe loss exposures. During 2011, a first treaty provided coverage of up to 90% of a loss of $500 million in excess of the Property and Casualty Group’s loss retention of $350 million per occurrence, and a second treaty provided coverage of up to 90% of a loss of $25 million in excess of $850 million. These treaties were renewed for 2012, with the first property catastrophe reinsurance treaty providing coverage of up to 90% of a loss of $500 million in excess of the Property and Casualty Group’s loss retention of $350 million per occurrence, and the second treaty providing coverage of up to 70% of a loss of $275 million in excess of $850 million. In addition, a third property catastrophe reinsurance treaty was entered into with a nonaffiliated reinsurer providing

ERIE INDEMNITY COMPANY NOTES TO CONSOLIDATED FINANCIAL STATEMENTS
106
coverage of up to 70% of a loss of $25 million in excess of $1.125 billion. The treaties exclude losses from acts of terrorism. There have been no losses subject to these treaties. EFL maintains several reinsurance treaties with nonaffiliated life reinsurance companies in order to reduce claims volatility. EFL had direct life insurance in force totaling $42 billion and $40 billion at December 31, 2011 and 2010, respectively. Of these amounts, EFL ceded $23 billion and $22 billion of life insurance in force at December 31, 2011 and 2010, respectively. At December 31, 2011 and 2010, the largest amount of in force life insurance ceded to one reinsurer totaled $11 billion. The following tables summarize the direct insurance and reinsurance for our property and casualty and life insurance activities, respectively, for the years ended December 31:
(in millions)
Erie Insurance Group
Property and casualty insurance: 2011 2010 2009
Premiums written: Direct $4,271 $4,035 $3,861 Assumed 21 19 30 Ceded (37) (35) (30)
Premiums written, net 4,255 4,019 3,861
Premiums earned: Direct 4,164 3,939 3,806 Assumed 21 20 42 Ceded (36) (34) (40)
Premiums earned, net 4,149 3,925 3,808
Insurance losses and loss expenses: Direct 3,311 2,834 2,655 Assumed 11 (15) 12 Ceded 22 (9) (28)
Insurance losses and loss expenses, net $3,344 $2,810 $2,639
Life insurance: Premiums earned:
Direct $ 108 $ 104 $ 100 Ceded (43) (42) (39)
Premiums earned, net 65 62 61
Insurance losses and loss expenses: Direct 120 102 114 Ceded (20) (12) (25)
Insurance losses and loss expenses, net $ 100 $ 90 $ 89
Total: Premiums earned:
Property and casualty $4,149 $3,925 $3,808 Life 65 62 61
Premiums earned, net 4,214 3,987 3,869
Insurance losses and loss expenses: Property and casualty 3,344 2,810 2,639 Life 100 90 89
Insurance losses and loss expenses, net $3,444 $2,900 $2,728

ERIE INDEMNITY COMPANY NOTES TO CONSOLIDATED FINANCIAL STATEMENTS
107
Note 16. Postretirement Benefits Pension and retiree health benefit plans Our pension plans consist of a noncontributory defined benefit pension plan covering substantially all employees and an unfunded supplemental employee retirement plan (“SERP”) for certain members of executive and senior management of the Erie Insurance Group. The pension plans provide benefits to covered individuals satisfying certain age and service requirements. The defined benefit pension plan and SERP each provide benefits through a final average earnings formula. We previously provided retiree health benefits in the form of medical and pharmacy health plans for eligible retired employees and eligible dependents. In 2006, the retiree health benefit plan was curtailed by an amendment that restricted eligibility to those who attained age 60 and 15 years of service on or before July 1, 2010. The liabilities for the plans described in this note are presented in total for all employees of the Erie Insurance Group. The gross liability for postretirement benefits is presented in the Consolidated Statements of Financial Position as part of other liabilities. Approximately 57% of postretirement benefit expenses are reimbursed to Indemnity from the Exchange and EFL. Our affiliated entities are charged an allocated portion of net periodic benefit costs under the benefit plans. For our funded pension plan, amounts are settled in cash throughout the year for affiliated entities’ share of net periodic benefit costs. For our unfunded plans, we pay the obligations when due. Amounts are settled in cash between affiliates when there is a payout under the unfunded plans. The following tables set forth the assumptions used to determine benefit obligations and net periodic benefit cost at the periods ended December 31:
Erie Insurance Group
Assumptions used to determine benefit obligations: 2011 2010 2009
Employee pension plan: Discount rate 4.99% 5.69% 6.11% Expected return on plan assets 8.00 8.00 8.25 Rate of compensation increase (1) 4.15 4.15 4.15
SERP: Discount rate (2) 4.99/4.49 5.69/5.19 6.11/5.00 Rate of compensation increase 6.00 6.00 6.00
Assumptions used to determine net periodic benefit cost: Employee pension plan:
Discount rate 5.69% 6.11% 6.06% Expected return on plan assets 8.00 8.00 8.25 Rate of compensation increase (1) 4.15 4.15 4.15
SERP: Discount rate (2) 5.69/5.19 6.11/5.00 6.06/5.00 Rate of compensation increase 6.00 6.00 6.00
(1) Rate of compensation increase is age-graded. An equivalent single compensation increase rate of 4.15% in 2011, 2010 and 2009 would
produce similar results.
(2) Pre-retirement/post-retirement.
The two economic assumptions that have the most impact on the postretirement benefit expense are the discount rate and the long-term rate of return on plan assets. The discount rate assumption used to determine the benefit obligation for 2011 was 4.99% and was based upon a yield curve developed from corporate bond yield information. The construction of these yield curves is based upon yields of corporate bonds rated Aa quality. Target yields are developed from bonds at various maturity points and a curve is fitted to those targets. Spot rates (zero coupon bond yields) are developed from the yield curve and used to discount benefit payment amounts associated with each future year. The present value of plan benefits is calculated by applying the spot/discount rates to projected benefit cash flows. A single discount rate is then developed to produce the same present value. This represents the suggested discount rate. The same methodology was employed to develop the 5.69% discount rate used to determine the benefit obligation for 2010. For 2009, the discount rate assumption used to determine the benefit obligation was based upon a bond-matching study that compared projected pension plan benefit flows to the cash flows from a comparable
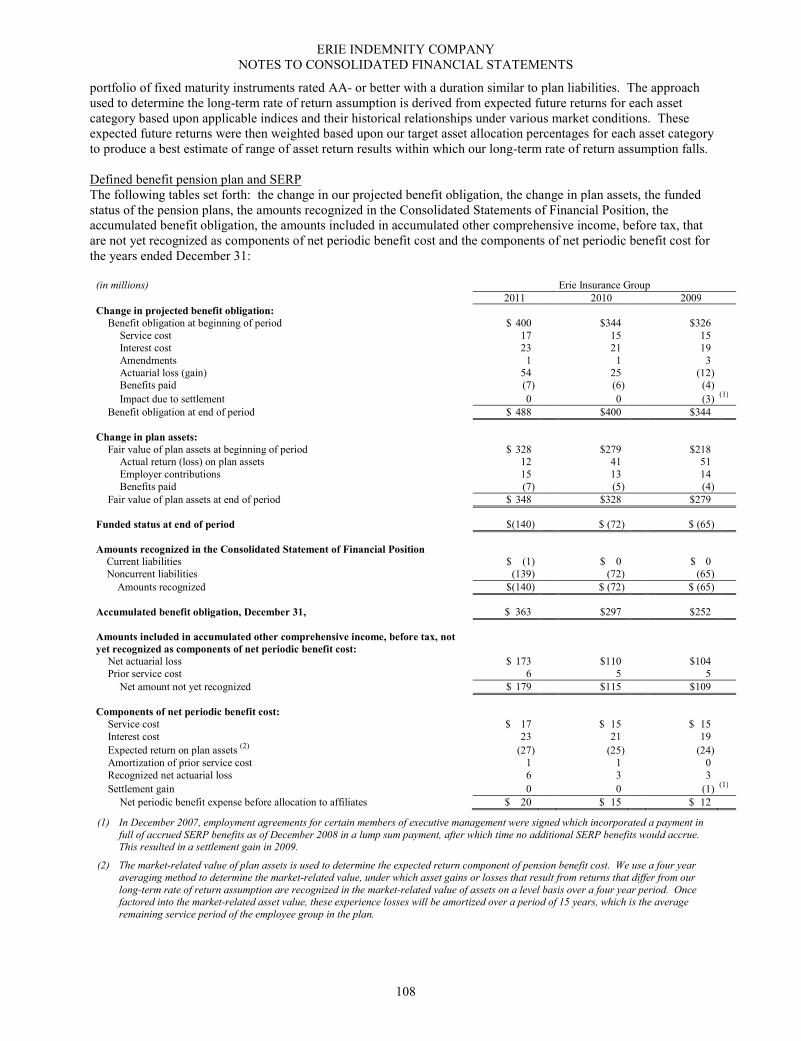
ERIE INDEMNITY COMPANY NOTES TO CONSOLIDATED FINANCIAL STATEMENTS
108
portfolio of fixed maturity instruments rated AA- or better with a duration similar to plan liabilities. The approach used to determine the long-term rate of return assumption is derived from expected future returns for each asset category based upon applicable indices and their historical relationships under various market conditions. These expected future returns were then weighted based upon our target asset allocation percentages for each asset category to produce a best estimate of range of asset return results within which our long-term rate of return assumption falls. Defined benefit pension plan and SERP The following tables set forth: the change in our projected benefit obligation, the change in plan assets, the funded status of the pension plans, the amounts recognized in the Consolidated Statements of Financial Position, the accumulated benefit obligation, the amounts included in accumulated other comprehensive income, before tax, that are not yet recognized as components of net periodic benefit cost and the components of net periodic benefit cost for the years ended December 31: (in millions) Erie Insurance Group
2011 2010 2009
Change in projected benefit obligation:
Benefit obligation at beginning of period $ 400 $344 $326 Service cost 17 15 15 Interest cost 23 21 19 Amendments 1 1 3 Actuarial loss (gain) 54 25 (12) Benefits paid (7) (6) (4)
Impact due to settlement 0
0
(3) (1)
Benefit obligation at end of period $ 488 $400 $344
Change in plan assets:
Fair value of plan assets at beginning of period $ 328 $279 $218 Actual return (loss) on plan assets 12 41 51 Employer contributions 15 13 14 Benefits paid (7) (5) (4)
Fair value of plan assets at end of period $ 348 $328 $279
Funded status at end of period $(140) $ (72) $ (65)
Amounts recognized in the Consolidated Statement of Financial Position
Current liabilities $ (1) $ 0 $ 0
Noncurrent liabilities (139) (72) (65)
Amounts recognized $(140) $ (72) $ (65)
Accumulated benefit obligation, December 31, $ 363 $297 $252
Amounts included in accumulated other comprehensive income, before tax, not
yet recognized as components of net periodic benefit cost:
Net actuarial loss $ 173 $110 $104 Prior service cost 6 5 5
Net amount not yet recognized $ 179 $115 $109
Components of net periodic benefit cost:
Service cost $ 17 $ 15 $ 15 Interest cost 23 21 19
Expected return on plan assets (2)
(27) (25) (24) Amortization of prior service cost 1 1 0 Recognized net actuarial loss 6 3 3
Settlement gain 0 0
(1)
(1)
Net periodic benefit expense before allocation to affiliates $ 20 $ 15 $ 12
(1) In December 2007, employment agreements for certain members of executive management were signed which incorporated a payment in
full of accrued SERP benefits as of December 2008 in a lump sum payment, after which time no additional SERP benefits would accrue. This resulted in a settlement gain in 2009.
(2) The market-related value of plan assets is used to determine the expected return component of pension benefit cost. We use a four year
averaging method to determine the market-related value, under which asset gains or losses that result from returns that differ from our
long-term rate of return assumption are recognized in the market-related value of assets on a level basis over a four year period. Once factored into the market-related asset value, these experience losses will be amortized over a period of 15 years, which is the average
remaining service period of the employee group in the plan.

ERIE INDEMNITY COMPANY NOTES TO CONSOLIDATED FINANCIAL STATEMENTS
109
The 2011 net actuarial loss was primarily due to the change in the discount rate assumption used to measure the future benefit obligations to 4.99% in 2011 from 5.69% in 2010. The 2010 net actuarial loss was primarily due to the change in the discount rate assumption used to measure the future benefit obligations to 5.69% in 2010 from 6.11% in 2009. The cumulative net actuarial loss was offset in 2009 by an actuarial gain resulting from actual investment returns that were greater than expected. Also contributing to this gain were assumption changes made based upon actual experience, such as the decrease in the assumed rate of compensation increase. Recognition of this loss is being deferred over the subsequent four year period. Amounts recognized in other comprehensive income for our pension plans were as follows for the years ended December 31:
(in millions)
Erie Insurance Group
Amounts recognized in other comprehensive income
for pension plans: 2011 2010
Amortization of net actuarial loss $ (6) $(4)
Amortization of prior service cost (1) 0
Net actuarial loss arising during the year 69 9
Amendments 1 (1) 1 (2)
Total recognized in other comprehensive income $63 $ 6
(1) The charges recognized as amendments were the result of factoring in the prior service cost for seven new plan participants in 2011.
(2) The charges recognized as amendments were the result of factoring in the prior service cost for four new plan participants in 2010.
The estimated net actuarial loss and prior service cost for the pension plans that will be amortized from accumulated
other comprehensive income into net periodic benefit cost during 2012 are $11 million and $1 million, respectively.
The following table sets forth amounts of benefits expected to be paid over the next 10 years from our pension and
other postretirement plans as of December 31:
(in millions) Erie Insurance Group
Year ending December 31,
Expected future
cash flows
2012 $ 9 2013 10 2014 11 2015 13 2016 15
2017 - 2021 110
The following table provides information for the defined benefit pension plans with an accumulated benefit obligation in excess of plan assets as of December 31:
(in millions)
Erie Insurance Group
Information for pension plans with an accumulated
benefit obligation in excess of plan assets: 2011 2010
Projected benefit obligation $488 $10 Accumulated benefit obligation 363 5 Fair value of plan assets 348 0
At December 31, 2011 the defined benefit pension plan and the SERP had an accumulated benefit obligation in excess of plan assets. At December 31, 2010 only the SERP had an accumulated benefit obligation in excess of plan assets.

ERIE INDEMNITY COMPANY NOTES TO CONSOLIDATED FINANCIAL STATEMENTS
110
Our current policy is generally to contribute an amount equal to the greater of the IRS minimum required contribution
or the target normal cost for the year plus interest to the date the contribution is made. A $16 million contribution
was made to the plan in January of 2012.
The employee pension plan utilizes a return seeking and a liability asset matching allocation strategy. It is based
upon the understanding that 1) equity investments are expected to outperform debt investments over the long-term, 2)
the potential volatility of short-term returns from equities is acceptable in exchange for the larger expected long-term
returns, and 3) a portfolio structured across investment styles and markets (both domestic and foreign) reduces
volatility. As a result, the employee pension plan’s investment portfolio utilizes a broadly diversified asset allocation
across domestic and foreign equity and debt markets. The investment portfolio is composed of commingled pools
that are dedicated exclusively to the management of employee benefit plan assets. Our target asset allocation percentage was 60% equity securities and 40% fixed income securities for 2011, 2010 and 2009. The target and actual asset allocation for the portfolio is as follows for the years ended December 31:
Erie Insurance Group
Target asset
allocation
Actual asset
allocation
Actual asset
allocation
2010-2011 2011 2010
Return seeking assets:
U.S. equity index (1) 17% 17% 17%
U.S. large capitalization core equity (2) 16 16 16
International risk-controlled equity (3) 15 15 15
U.S. small capitalization core equity (4) 8 8 8
International small capitalization risk-controlled equity (5) 2 2 2
Emerging markets equity (6) 2 2 2
Total return seeking assets 60% 60% 60%
Liability matching assets:
Long duration fixed income (7) 16% 16% 16%
Broad market fixed income (8) 15 15 15
Long duration corporate fixed income (9) 8 8 8
Institutional money market fund 1 1 1
Total liability matching assets 40% 40% 40%
Total plan assets 100% 100% 100%
(1) Comprises equity index funds not actively managed that track the S&P 500.
(2) Includes equity securities that seek to achieve excess returns relative to the S&P 500 while maintaining portfolio risk characteristics
similar to the index. (3) Seeks long-term capital growth with an emphasis on controlling return volatility relative to an international market index.
(4) Includes equity securities that seek to achieve excess returns relative to the Russell 2000 Index while maintaining portfolio risk
characteristics similar to the index. (5) Seeks to provide excess returns relative to an international small cap index, while maintaining regional weights similar to the index.
(6) Seeks long-term capital growth in securities of companies that have their principal business activities in countries in the Morgan Stanley
Capital International Emerging Markets Free Index. (7) Seeks to generate returns that exceed the Barclays Capital U.S. Long Government/Credit Bond Index through investment-grade fixed
income securities.
(8) Seeks to generate returns that exceed the Barclays Capital U.S. Aggregate Bond Index through investment-grade fixed income securities.
(9) Seeks to generate returns that exceed the Barclays Capital U.S. Long Corporate A or Better Index investing in U.S. corporate bonds
with an emphasis on long duration bonds rated A or better.

ERIE INDEMNITY COMPANY NOTES TO CONSOLIDATED FINANCIAL STATEMENTS
111
The following tables represent the fair value measurements for the pension plan assets by major category and level of input:
Erie Insurance Group
At December 31, 2011
Fair value measurements of plan assets using:
(in millions)
Total
Quoted prices in active markets for
identical assets Level 1
Significant observable
inputs Level 2
Significant unobservable
inputs Level 3
Return seeking assets: U.S. equity index (1) $ 58 $0 $ 58 $0 U.S. large capitalization core equity (2) 54 0 54 0 International risk-controlled equity (3) 53 0 53 0 U.S. small capitalization core equity (4) 28 0 28 0 International small capitalization risk-controlled equity (5) 8 0 8 0 Emerging markets equity (6) 7 0 7 0
Liability matching assets: Long duration fixed income (7)
55 0 55 0 Broad market fixed income (8) 53 0 53 0 Long duration corporate fixed income (9) 30 0 30 0
Institutional money market fund 2 2 0 0
Total $348 $2 $346 $0
Erie Insurance Group
At December 31, 2010
Fair value measurements of plan assets using:
(in millions)
Total
Quoted prices in active markets for
identical assets Level 1
Significant observable
inputs Level 2
Significant unobservable
inputs Level 3
Return seeking assets: U.S. equity index (1) $ 55 $0 $ 55 $0 U.S. large capitalization core equity (2) 51 0 51 0 International risk-controlled equity (3) 50 0 50 0 U.S. small capitalization core equity (4) 26 0 26 0 International small capitalization risk-controlled equity (5) 8 0 8 0 Emerging markets equity (6) 7 0 7 0
Liability matching assets: Long duration fixed income (7)
51 0 51 0 Broad market fixed income (8) 49 0 49 0 Long duration corporate fixed income (9) 28 0 28 0
Institutional money market fund 3 3 0 0
Total $328 $3 $325 $0
(1) Comprises equity index funds not actively managed that track the S&P 500.
(2) Includes equity securities that seek to achieve excess returns relative to the S&P 500 while maintaining portfolio risk characteristics similar to the index.
(3) Seeks long-term capital growth with an emphasis on controlling return volatility relative to an international market index.
(4) Includes equity securities that seek to achieve excess returns relative to the Russell 2000 Index while maintaining portfolio risk characteristics similar to the index.
(5) Seeks to provide excess returns relative to an international small cap index, while maintaining regional weights similar to the index.
(6) Seeks long-term capital growth in securities of companies that have their principal business activities in countries in the Morgan Stanley Capital International Emerging Markets Free Index.
(7) Seeks to generate returns that exceed the Barclays Capital U.S. Long Government/Credit Bond Index through investment-grade fixed
income securities. (8) Seeks to generate returns that exceed the Barclays Capital U.S. Aggregate Bond Index through investment-grade fixed income
securities.
(9) Seeks to generate returns that exceed the Barclays Capital U.S. Long Corporate A or Better Index investing in U.S. corporate bonds with an emphasis on long duration bonds rated A or better.

ERIE INDEMNITY COMPANY NOTES TO CONSOLIDATED FINANCIAL STATEMENTS
112
Estimates of fair values of the pension plan assets are obtained primarily from our trustee and custodian of our pension plan. Our Level 1 category includes a money market fund that is a mutual fund for which the fair value is determined using an exchange traded price provided by the trustee and custodian. Our Level 2 category includes commingled pools. Estimates of fair values for securities held by our commingled pools are obtained primarily from the trustee and custodian. The methodologies used by the trustee and custodian that support a financial instrument Level 2 classification include multiple verifiable, observable inputs including benchmark yields, reported trades, broker/dealer quotes, issuers spreads, two-sided markets, benchmark securities, bids, offers and reference data. There were no Level 3 investments during 2011 or 2010. Retiree health benefit plan The retiree health benefit plan was terminated in 2006. We continue to provide retiree health benefits only to employees who met certain age and service requirements on or before July 1, 2010. The accumulated benefit obligation and net periodic benefit cost of this plan were not material to our consolidated financial statements. At December 31, 2011 and 2010, the projected benefit obligation associated with these benefits was $6 million and $7 million, respectively. This plan is funded only as claims are incurred. Periodic benefit costs for the Erie Insurance Group were $0.2 million in 2011 and $0.3 million in both 2010 and 2009. Employee savings plan All full-time and regular part-time employees are eligible to participate in a traditional qualified 401(k) or a Roth 401(k) savings plan. We match 100% of the participant contributions up to 3% of compensation and 50% of participant contributions over 3% and up to 5% of compensation. Matching contributions paid to the plan were $9 million in 2011 and 2010, and $8 million in 2009. Employees are permitted to invest the employer-matching contributions in our Class A common stock. Employees, other than executive and senior officers, may sell the shares at any time without restriction; sales by executive and senior officers are subject to restrictions imposed by our insider trading policies and the federal securities laws. The plan acquires shares in the open market necessary to meet the obligations of the plan. Plan participants held 0.2 million of our Class A shares at December 31, 2011 and 2010. Liabilities for the 401(k) plan are presented in the Consolidated Statements of Financial Position with other liabilities.
Note 17. Incentive Plans and Deferred Compensation We have separate annual and long-term incentive plans for our executive and senior vice presidents. We also make available deferred compensation plans for executive and senior management and outside directors. Annual incentive plan Our annual incentive plan is a bonus plan that pays cash to our executive and senior vice presidents annually. The awards under the annual incentive plan are based on attainment of corporate and individual performance measures established at the beginning of each year. These measures, which can include various financial measures, are established by the Executive Compensation and Development Committee of our Board of Directors, and are then approved by the Board of Directors. A funding qualifier was introduced into the plan in 2009. The Executive Compensation and Development Committee of our Board of Directors determined that the plan should first consider the Indemnity’s financial results before a payout could be made to participants of the plan. The funding qualifier is based upon Indemnity’s operating income. If the funding qualifier is met, each member of executive and senior management becomes eligible for incentive compensation based upon specific performance measures. The corporate performance measures considered in the plan primarily included the Property and Casualty Group’s direct written premium and statutory combined ratio in 2010 and also included the reported policy retention ratio in 2011. The cost of the plan is charged to operations as the compensation is earned over the performance period of one year. The after-tax compensation cost charged to operations related to the annual incentive plan bonus for the Erie Insurance Group was $2 million, $3 million and $2 million for 2011, 2010 and 2009 respectively.
Long-term incentive plan Our long-term incentive plan (“LTIP”) is a performance based incentive plan designed to reward executive and senior vice presidents who can have a significant impact on our long-term performance. The LTIP award is based upon the level of achievement of objective measures of performance over a three-year period as compared to a peer group of property and casualty companies selected by our Executive Compensation and Development Committee of our Board of Directors. The 2011, 2010 and 2009 awards were based upon the reported

ERIE INDEMNITY COMPANY NOTES TO CONSOLIDATED FINANCIAL STATEMENTS
113
combined ratio, growth in direct written premiums and total return on invested assets as defined by the Erie Insurance Group. These performance measures are compared to the same performance measures of a peer group of companies. Because the award is based upon a comparison to results of a peer group over a three-year period, the award accrual is based upon estimates of probable results for the remaining performance period. This estimate is subject to variability if our results or the results of the peer group are substantially different than the results we project. The Executive Compensation and Development Committee determines the form of the distribution to be granted at the beginning of each performance period. The 2009-2011 performance period is closed and distributions will be made in the form of cash later in 2012 once peer group financial information becomes available. The Executive Compensation and Development Committee agreed to also distribute awards under the 2010-2012 performance period in cash, while the 2011-2013 performance period will be paid in shares of Indemnity’s Class A common stock. If the Executive Compensation and Development Committee determines that awards will be paid in restricted performance shares, then shares of our Class A common stock will be purchased on the open market and distributed to the plan participants when the award is paid. We do not issue new shares of common stock to plan participants. Accordingly, the disclosure requirements of Item 201(d) of Regulation S-K are not applicable. The performance shares awarded through the LTIP are considered vested at the end of each applicable performance period. The maximum number of shares which may be earned under the plan by any single participant during any one performance period is limited to 250,000 shares. The aggregate number of Class A common stock that may be issued pursuant to awards granted under the LTIP is 1.0 million shares. With respect to an award of performance units, the maximum dollar amount which may be earned under the plan by any single participant during any one performance period is $3 million. A liability is recorded and compensation expense is recognized ratably over the performance period. At December 31, 2011, the plan awards for the 2009-2011 performance period were fully earned in accordance with the LTIP. The awards for this performance period will be calculated upon receipt of the final financial information for the peer group. The estimated plan award based upon the peer group information as of September 30, 2011 is $5 million. At December 31, 2010, the awards for the 2008-2010 performance period were fully vested in accordance with the LTIP. The average share price on the date the shares were paid to participants for the 2008-2010 performance period was $73.97. The plan award of $5 million was paid in July 2011. At December 31, 2009, the awards for the 2007-2009 performance period were fully vested in accordance with the LTIP. The average share price on the date the shares were paid to participants for the 2007-2009 performance period was $44.48. The plan award of $2 million was paid in July 2010. Earned amounts are allocated to related entities and settled in cash once the payout is made. The after-tax compensation cost charged to operations related to these restricted stock awards for the Erie Insurance Group was $6 million in 2011, $4 million in 2010, and $2 million in 2009. Deferred compensation plans Our deferred compensation plans are arrangements for our executive and senior vice presidents and outside directors. The deferred compensation plan for our executive and senior vice presidents allows participants to elect to defer receipt of a portion of their base salary and/or annual incentive plan award until a later date. Employer matching contributions that cannot be credited to our tax-qualified 401(k) plan, because they exceed the annual contribution or compensation limits of that plan, are also credited to the accounts of participants who elected to participate in the deferred compensation plan for the year by deferring receipt of some portion of their base salary. The deferred compensation plan for our outside directors allows participants to defer receipt of a portion of their director and meeting fees until a later date. Employees or outside directors participating in the respective plans select hypothetical investment funds for their deferrals which are credited with the hypothetical returns generated.

ERIE INDEMNITY COMPANY NOTES TO CONSOLIDATED FINANCIAL STATEMENTS
114
The awards, payments, deferrals and liabilities under the annual incentive plan, long-term incentive plan and deferred compensation plans for officers and outside directors were as follows for the years ended December 31:
(in millions) Erie Insurance Group
2011 2010 2009
Awards, employer match and hypothetical earnings by plan: Long-term incentive plan awards $ 9 $ 7 $ 4 Annual incentive plan awards 3 4 3 Deferred compensation plans, employer match and hypothetical earnings 1 2 1
Total plan awards and earnings 13 13 8
Total plan awards paid (10) (6) (8)
Compensation deferred under the plans 0 1 1
Distributions from the deferred compensation plans (1) (1) (1)
Gross incentive plan and deferred compensation liabilities at end of period $ 24 $22 $15
Stock compensation plan for outside directors We have a stock compensation plan for our outside directors to further align the interests of directors with shareholders by providing for a portion of annual compensation for the directors’ services in shares of our Class A common stock. Each director vests in the grant 25% every three months over the course of a year. Dividends paid by us are reinvested into each director’s account as additional share credits which vest immediately. Upon leaving board service, directors are paid shares of our Class A common stock equal to the number of share credits in their deferred stock account. Our practice is to purchase the shares that will be paid to the directors on the open market. We do not issue new shares of common stock to directors. Accordingly, the disclosure requirements of Item 201(d) of Regulation S-K are not applicable. The annual charge related to the stock compensation plan for our directors totaled $1 million in 2011, $2 million in 2010, and $0.4 million in 2009.
Note 18. Capital Stock
Class A and B common stock We have two classes of common stock: Class A which has a dividend preference and Class B which has voting power and a conversion right. Each share of Class A common stock outstanding at the time of the declaration of any dividend upon shares of Class B common stock shall be entitled to a dividend payable at the same time, at the same record date, and in an amount at least equal to 2/3 of 1.0% of any dividend declared on each share of Class B common stock. We may declare and pay a dividend in respect to Class A common stock without any requirement that any dividend be declared and paid in respect to Class B common stock. Sole shareholder voting power is vested in Class B common stock except insofar as any applicable law shall permit Class A common shareholders to vote as a class in regards to any changes in the rights, preferences and privileges attaching to Class A common stock. Holders of Class B shares may, at their option, convert their shares into Class A shares at the rate of 2,400 Class A shares per Class B share. In 2009, five shares of Class B common stock were converted into 12,000 shares of Class A common stock. There were no conversions of Class B shares to Class A shares in 2011 or 2010. There is no provision for conversion of Class A shares to Class B shares, and, Class B shares surrendered for conversion cannot be reissued.
Stock repurchases A stock repurchase program was authorized for our outstanding Class A nonvoting common stock beginning January 1, 2004. Treasury shares are recorded in the Consolidated Statements of Financial Position at total cost based upon trade date. Shares repurchased under this program totaled 2.2 million at a total cost of $155 million during 2011, and 1.1 million shares at a total cost of $57 million during 2010. In October 2011, our Board of Directors approved a continuation of the current stock repurchase program for a total of $150 million, with no time limitation. We had approximately $138 million of repurchase authority remaining under this program at December 31, 2011. In July 2011, we also repurchased 64,095 shares of our outstanding Class A nonvoting common stock outside of our publicly announced share repurchase program at a total cost of $4.8 million. Of this amount, 57,695 shares were purchased for $4.3 million, or $73.72 per share, in conjunction with our long-term incentive plan, and 6,400 shares were purchased for $0.5 million, or $73.74 per share, for the vesting of stock-based awards for executive management. These shares were delivered to plan participants and executive management, respectively, in July 2011.

ERIE INDEMNITY COMPANY NOTES TO CONSOLIDATED FINANCIAL STATEMENTS
115
In 2010, we repurchased 44,206 shares of our outstanding Class A nonvoting common stock outside of our publicly announced share repurchase program at a total cost of $2 million. Of this amount, 39,406 shares were purchased in June 2010 for $1.8 million, or $45.92 per share, in conjunction with our long-term incentive plan, and 4,800 shares were purchased in July 2010 for $0.2 million, or $48.75 per share, for the vesting of stock-based awards for executive management. These shares were delivered to plan participants and executive management, respectively, in July 2010.
Note 19. Comprehensive Income
The components of the change in comprehensive (loss) income are as follows for the periods ended December 31:
(in millions) Erie Insurance Group
Change in other comprehensive (loss) income: 2011 2010 2009
Indemnity:
Cumulative effect of accounting changes, net of tax $ - $ - $ (6) Unrealized (loss) gain on securities:
Gross unrealized holding (losses) gains on investments arising during period (11) 18 105 Unrealized gains transferred to the noncontrolling interest (1) - (23) - Reclassification adjustment for gross (gains) losses included in net income (5) (5) 10
Unrealized holding (losses) gains on investments (16) (10) 115 Income tax benefit (expense) related to unrealized (losses) gains 5 4 (40)
Net unrealized holding (losses) gains on investments arising during year (11) (6) 75 Postretirement plans:
Amortization of prior service cost 1 0 0 Amortization of actuarial loss 6 4 3 Net actuarial (loss) gain during year (69) (9) 38 Losses due to plan changes during year (1) (1) (3) Curtailment/settlement loss arising during year 0 0 (1)
Postretirement benefits, gross (63) (6) 37 Income tax benefit (expense) related to postretirement benefits 22 2 (13)
Postretirement plans, net (41) (4) 24
Change in other comprehensive (loss) income, net of tax – Indemnity (52) (10) 93
Change in other comprehensive (loss) income, net of tax – Exchange (9) 101 423
Change in other comprehensive (loss) income, net of tax – Erie Insurance Group $(61) $ 91 $516
(1) This represents unrealized gains moved from Indemnity shareholder interest to the noncontrolling interest as a result of the December 31, 2010 sale of the P&C subsidiaries.
The components of accumulated other comprehensive (loss) income, net of tax, are as follows for the periods ended December 31:
(in millions) Erie Insurance Group
Accumulated other comprehensive (loss) income: 2011 2010 2009
Indemnity: Accumulated net appreciation of investments $ 11 $ 22 $ 28 Accumulated net losses associated with post-retirement benefits (116) (75) (71)
Accumulated other comprehensive loss – Indemnity (105) (53) (43)
Exchange: Accumulated other comprehensive income – Exchange $ 287 $277 $176
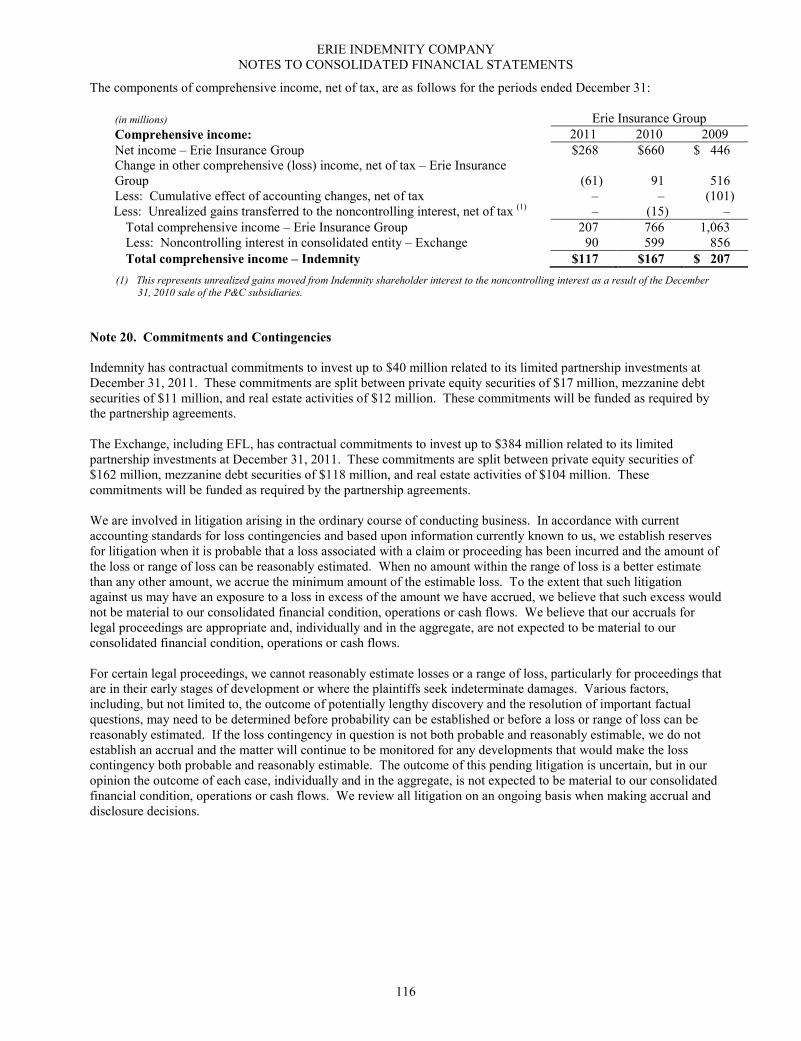
ERIE INDEMNITY COMPANY NOTES TO CONSOLIDATED FINANCIAL STATEMENTS
116
The components of comprehensive income, net of tax, are as follows for the periods ended December 31:
(in millions) Erie Insurance Group
Comprehensive income: 2011 2010 2009
Net income – Erie Insurance Group $268 $660 $ 446 Change in other comprehensive (loss) income, net of tax – Erie Insurance Group (61) 91 516 Less: Cumulative effect of accounting changes, net of tax – – (101) Less: Unrealized gains transferred to the noncontrolling interest, net of tax (1) – (15) –
Total comprehensive income – Erie Insurance Group 207 766 1,063 Less: Noncontrolling interest in consolidated entity – Exchange 90 599 856
Total comprehensive income – Indemnity $117 $167 $ 207
(1) This represents unrealized gains moved from Indemnity shareholder interest to the noncontrolling interest as a result of the December
31, 2010 sale of the P&C subsidiaries.
Note 20. Commitments and Contingencies
Indemnity has contractual commitments to invest up to $40 million related to its limited partnership investments at December 31, 2011. These commitments are split between private equity securities of $17 million, mezzanine debt securities of $11 million, and real estate activities of $12 million. These commitments will be funded as required by the partnership agreements. The Exchange, including EFL, has contractual commitments to invest up to $384 million related to its limited partnership investments at December 31, 2011. These commitments are split between private equity securities of $162 million, mezzanine debt securities of $118 million, and real estate activities of $104 million. These commitments will be funded as required by the partnership agreements. We are involved in litigation arising in the ordinary course of conducting business. In accordance with current accounting standards for loss contingencies and based upon information currently known to us, we establish reserves for litigation when it is probable that a loss associated with a claim or proceeding has been incurred and the amount of the loss or range of loss can be reasonably estimated. When no amount within the range of loss is a better estimate than any other amount, we accrue the minimum amount of the estimable loss. To the extent that such litigation against us may have an exposure to a loss in excess of the amount we have accrued, we believe that such excess would not be material to our consolidated financial condition, operations or cash flows. We believe that our accruals for legal proceedings are appropriate and, individually and in the aggregate, are not expected to be material to our consolidated financial condition, operations or cash flows. For certain legal proceedings, we cannot reasonably estimate losses or a range of loss, particularly for proceedings that are in their early stages of development or where the plaintiffs seek indeterminate damages. Various factors, including, but not limited to, the outcome of potentially lengthy discovery and the resolution of important factual questions, may need to be determined before probability can be established or before a loss or range of loss can be reasonably estimated. If the loss contingency in question is not both probable and reasonably estimable, we do not establish an accrual and the matter will continue to be monitored for any developments that would make the loss contingency both probable and reasonably estimable. The outcome of this pending litigation is uncertain, but in our opinion the outcome of each case, individually and in the aggregate, is not expected to be material to our consolidated financial condition, operations or cash flows. We review all litigation on an ongoing basis when making accrual and disclosure decisions.
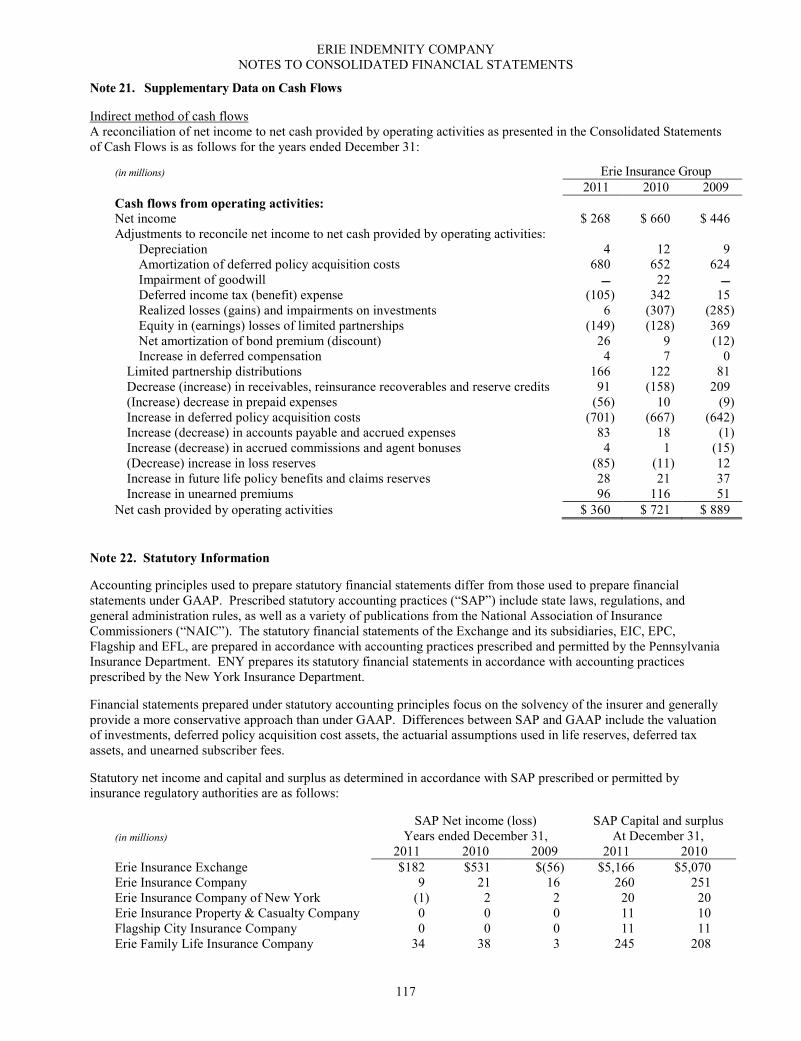
ERIE INDEMNITY COMPANY NOTES TO CONSOLIDATED FINANCIAL STATEMENTS
117
Note 21. Supplementary Data on Cash Flows Indirect method of cash flows A reconciliation of net income to net cash provided by operating activities as presented in the Consolidated Statements of Cash Flows is as follows for the years ended December 31:
(in millions) Erie Insurance Group
2011 2010 2009
Cash flows from operating activities:
Net income $ 268 $ 660 $ 446 Adjustments to reconcile net income to net cash provided by operating activities:
Depreciation 4 12 9 Amortization of deferred policy acquisition costs 680 652 624 Impairment of goodwill � 22 � Deferred income tax (benefit) expense (105) 342 15 Realized losses (gains) and impairments on investments 6 (307) (285) Equity in (earnings) losses of limited partnerships (149) (128) 369 Net amortization of bond premium (discount) 26 9 (12) Increase in deferred compensation 4 7 0
Limited partnership distributions 166 122 81 Decrease (increase) in receivables, reinsurance recoverables and reserve credits 91 (158) 209 (Increase) decrease in prepaid expenses (56) 10 (9) Increase in deferred policy acquisition costs (701) (667) (642) Increase (decrease) in accounts payable and accrued expenses 83 18 (1) Increase (decrease) in accrued commissions and agent bonuses 4 1 (15) (Decrease) increase in loss reserves (85) (11) 12 Increase in future life policy benefits and claims reserves 28 21 37 Increase in unearned premiums 96 116 51
Net cash provided by operating activities $ 360 $ 721 $ 889
Note 22. Statutory Information
Accounting principles used to prepare statutory financial statements differ from those used to prepare financial statements under GAAP. Prescribed statutory accounting practices (“SAP”) include state laws, regulations, and general administration rules, as well as a variety of publications from the National Association of Insurance Commissioners (“NAIC”). The statutory financial statements of the Exchange and its subsidiaries, EIC, EPC, Flagship and EFL, are prepared in accordance with accounting practices prescribed and permitted by the Pennsylvania Insurance Department. ENY prepares its statutory financial statements in accordance with accounting practices prescribed by the New York Insurance Department.
Financial statements prepared under statutory accounting principles focus on the solvency of the insurer and generally provide a more conservative approach than under GAAP. Differences between SAP and GAAP include the valuation of investments, deferred policy acquisition cost assets, the actuarial assumptions used in life reserves, deferred tax assets, and unearned subscriber fees.
Statutory net income and capital and surplus as determined in accordance with SAP prescribed or permitted by insurance regulatory authorities are as follows:
SAP Net income (loss) SAP Capital and surplus
(in millions) Years ended December 31, At December 31,
2011 2010 2009 2011 2010
Erie Insurance Exchange $182 $531 $(56) $5,166 $5,070 Erie Insurance Company 9 21 16 260 251 Erie Insurance Company of New York (1) 2 2 20 20 Erie Insurance Property & Casualty Company 0 0 0 11 10 Flagship City Insurance Company 0 0 0 11 11 Erie Family Life Insurance Company 34 38 3 245 208
ERIE INDEMNITY COMPANY NOTES TO CONSOLIDATED FINANCIAL STATEMENTS
118
The minimum statutory capital and surplus requirements under Pennsylvania and New York law for the Exchange’s property and casualty insurance subsidiaries amounts to $12 million. The Exchange’s subsidiaries’ total statutory capital and surplus significantly exceed these minimum requirements, totaling $302 million at December 31, 2011. The risk-based capital levels of all members of the Property and Casualty Group and EFL significantly exceed the minimum requirements. Cash and securities with a carrying value of $14 million were deposited by the property and casualty and life entities with regulatory authorities under statutory requirements at December 31, 2011. As prescribed by the Insurance Department of the Commonwealth of Pennsylvania, the Exchange records unearned subscriber fees (fees to the attorney-in-fact) as deductions from unearned premium reserve and charges current operations on a pro-rata basis over the periods covered by the policies. The Pennsylvania-domiciled members of the Property and Casualty Group discount workers compensation loss reserves on a non-tabular basis as prescribed by the Insurance Department of the Commonwealth of Pennsylvania. The Exchange’s NAIC prepared statutory surplus, excluding the impact of the Pennsylvania prescribed practices, would have been $4.7 billion at December 31, 2011. EIC’s NAIC prepared statutory surplus, excluding the impact of the Pennsylvania prescribed practices, would have been $256 million at December 31, 2011. EPC and Flagship record the discounting of workers compensation loss reserves on a direct basis, however, after application of the intercompany pooling arrangement, there is no impact on their financial statements. The amount of dividends that can be paid to the Exchange without the prior approval of the Pennsylvania Insurance Commissioner by EIC, EPC and Flagship, the Exchange’s Pennsylvania-domiciled property and casualty insurance subsidiaries, is limited to not more than the greater of: (a) 10% of statutory surplus as reported in the last annual statement, or (b) net income as reported in the last annual statement. The amount of dividends that EIC's New York-domiciled property and casualty subsidiary, ENY, can pay without the prior approval of the New York Superintendent of Insurance is limited to the lesser of: (a) 10% of statutory surplus as reported in the last annual statement, or (b) 100% of adjusted net investment income during such period. In 2012, the maximum dividend payout that the Exchange could receive from its property and casualty insurance subsidiaries would be $30 million. No dividends were paid by these property and casualty insurance subsidiaries in 2011, 2010 or 2009. The amount of dividends that can be paid to the Exchange without the prior approval of the Pennsylvania Insurance Commissioner by EFL, a Pennsylvania-domiciled life insurer, is limited by statute to the greater of: (a) 10% of statutory surplus as shown in the last annual statement on file with the commissioner, or (b) net income as reported in the last annual statement, but shall not include pro-rata distribution of any class of the insurer's own securities. Accordingly, the maximum dividend payout that the Exchange could receive in 2012 without prior Pennsylvania Commissioner approval is $34 million. There were no dividends paid to either the Exchange or Indemnity in 2011, 2010 or 2009.

ERIE INDEMNITY COMPANY NOTES TO CONSOLIDATED FINANCIAL STATEMENTS
119
Note 23. Indemnity Supplemental Information
Erie Insurance Group
Consolidating Statement of Financial Position
December 31, 2011
(in millions) Indemnity Exchange Reclassifications Erie
shareholder noncontrolling and Insurance
Assets interest interest eliminations Group
Investments Available-for-sale securities, at fair value:
Fixed maturities $ 548 $ 7,292 $ U $ 7,840 Equity securities 25 564 U 589
Trading securities, at fair value 27 2,308 U 2,335 Limited partnerships 208 1,082 U 1,290 Other invested assets 1 19 U 20
Total investments 809 11,265 U 12,074 Cash and cash equivalents 11 174 U 185 Premiums receivable from policyholders
U 976 U 976 Reinsurance recoverable
U 166 U 166 Deferred income taxes 19 U U 19 Deferred acquisition costs
U 487 U 487 Other assets 119 322 U 441 Receivables from the Exchange and other affiliates 254 U (254) U Note receivable from EFL 25 U (25) U
Total assets $1,237 $13,390 $(279) $14,348
Liabilities Losses and loss expense reserves $ U $ 3,499 $ U $ 3,499 Life policy and deposit contract reserves U 1,671 U 1,671 Unearned premiums U 2,178 U 2,178 Deferred income taxes U 147 U 147 Other liabilities 456 383 (279) 560
Total liabilities 456 7,878 (279) 8,055
Shareholders’ equity and noncontrolling interest Total Indemnity shareholders’ equity 781 U U 781 Noncontrolling interest in consolidated entity – Exchange U 5,512 U 5,512
Total equity 781 5,512 U 6,293
Total liabilities, shareholders' equity and noncontrolling interest $1,237 $13,390 $(279) $14,348

ERIE INDEMNITY COMPANY NOTES TO CONSOLIDATED FINANCIAL STATEMENTS
120
Erie Insurance Group
Consolidating Statement of Financial Position
December 31, 2010
(in millions) Indemnity Exchange Reclassifications Erie
shareholder noncontrolling and Insurance
Assets interest interest eliminations Group
Investments Available-for-sale securities, at fair value:
Fixed maturities $ 264 $ 7,279 $ U $ 7,543 Equity securities 24 570 U 594
Trading securities, at fair value 28 2,306 U 2,334 Limited partnerships 216 1,108 U 1,324 Other invested assets 1 19 U 20
Total investments 533 11,282 U 11,815 Cash and cash equivalents 310 120 U 430 Premiums receivable from policyholders
U 942 U 942 Reinsurance recoverable
U 201 U 201 Deferred acquisition costs
U 467 U 467 Other assets 132 357 U 489 Receivables from the Exchange and other affiliates 232 U (232) U Note receivable from EFL 25 U (25) U Equity in EFL (1) 80 U (80) U
Total assets $1,312 $13,369 $(337) $14,344
Liabilities Losses and loss expense reserves $ U $ 3,584 $ U $ 3,584 Life policy and deposit contract reserves U 1,603 U 1,603 Unearned premiums U 2,082 U 2,082 Deferred income taxes 26 257 U 283 Other liabilities 374 341 (257) 458
Total liabilities 400 7,867 (257) 8,010
Shareholders’ equity and noncontrolling interest Total Indemnity shareholders’ equity 912 U U 912 Noncontrolling interest in consolidated entity – Exchange U 5,502 (80) 5,422
Total equity 912 5,502 (80) 6,334
Total liabilities, shareholders' equity and noncontrolling interest $1,312 $13,369 $(337) $14,344
(1) On March 31, 2011, Indemnity sold its 21.6% ownership interest in EFL to the Exchange.
Receivables from the Exchange and EFL and concentrations of credit risk Financial instruments could potentially expose Indemnity to concentrations of credit risk, including unsecured receivables from the Exchange. A majority of Indemnity’s revenue and receivables are from the Exchange and affiliates. See also Note 4, “Variable Interest Entity.” Management fees and expense allocation amounts due from the Exchange were $251 million and $229 million at December 31, 2011 and 2010, respectively. The receivable from EFL for expense allocations totaled $3 million at December 31, 2011 and 2010. Indemnity is due $25 million from EFL in the form of a surplus note that was issued in 2003. The note may be repaid only out of unassigned surplus of EFL. Both principal and interest payments are subject to prior approval by the Pennsylvania Insurance Commissioner. The note bears an annual interest rate of 6.7% and will be payable on demand on or after December 31, 2018, with interest scheduled to be paid semi-annually, subject to prior approval by the Pennsylvania Insurance Commissioner. EFL paid annual interest to Indemnity of $2 million in both 2011 and 2010.

ERIE INDEMNITY COMPANY NOTES TO CONSOLIDATED FINANCIAL STATEMENTS
121
Indemnity Shareholder Interest
Income attributable to
Indemnity shareholder interest
(in millions) Years ended December 31, Percent 2011 2010 2009
Management operations: Management fee revenue, net 100.0% $1,067 $1,009 $ 965 Service agreement revenue 100.0% 33 34 35
Total revenue from management operations 1,100 1,043 1,000 Cost of management operations 100.0% 892 841 813
Income from management operations before taxes 208 202 187
Property and casualty insurance operations: (2) Net premiums earned 5.5% (2) U 216 209 Losses and loss expenses 5.5% (2) U 155 145 Policy acquisition and underwriting expenses 5.5% (2) U 61 63
Income from property and casualty insurance
operations before taxes U 0 1
Life insurance operations: (1) Total revenue 21.6% (3) 10 37 27 Total benefits and expenses 21.6% (3) 7 26 25
Income from life insurance operations before taxes 3 11 2
Investment operations: Net investment income (2) 16 37 42 Net realized gains (losses) on investments (2) 3 (1) 10
Net impairment losses recognized in earnings (2) 0 (1) (12) Equity in earnings (losses) of limited partnerships 26 21 (76)
Income (loss) from investment operations before taxes (2) 45 56 (36)
Income from operations before income taxes 256 269 154 Provision for income taxes 87 107 46
Net income $ 169 $ 162 $ 108
(1) Earnings on life insurance related invested assets are integral to the evaluation of the life insurance operations because of the long
duration of life products. On that basis, for presentation purposes, the life insurance operations in the table above include life insurance related investment results. However, the life insurance investment results are included in the investment operations segment discussion in
Note 5, “Segment Information”.
(2) Prior to and through December 31, 2010, the underwriting results retained by EIC and ENY and the investment results of EIC, ENY and
EPC accrued to the Indemnity shareholder interest. Due to the sale of Indemnity’s property and casualty insurance subsidiaries to the Exchange on December 31, 2010, all property and casualty underwriting results and all investment results for these companies accrue to
the interest of the subscribers (policyholders) of the Exchange, or noncontrolling interest, after December 31, 2010.
(3) Prior to and through March 31, 2011, Indemnity retained a 21.6% ownership interest in EFL, which accrued to the Indemnity
shareholder interest, and the Exchange retained a 78.4% ownership interest in EFL, which accrued to the interest of the subscribers (policyholders) of the Exchange, or noncontrolling interest. Due to the sale of Indemnity’s 21.6% ownership interest in EFL to the
Exchange on March 31, 2011, 100% of EFL’s life insurance results accrue to the interest of the subscribers (policyholders) of the
Exchange, or noncontrolling interest, after March 31, 2011.
Expense allocations All claims handling services for the Exchange are performed by Indemnity employees who are entirely dedicated to claims related activities. All costs associated with these employees are reimbursed to Indemnity from the Exchange’s revenues in accordance with the subscriber’s agreement. Indemnity is reimbursed by EFL from its revenues for all costs associated with employees who perform life insurance related operating activities for EFL in accordance with its service agreement with Indemnity. Cash settlements for payments on the account of the Exchange totaled $325 million, $293 million and $282 million in 2011, 2010 and 2009, respectively, and $28 million, $27 million and $32 million in 2011, 2010 and 2009, respectively, for EFL. These reimbursements have generally been settled quarterly; however, beginning in the fourth quarter of 2011, the reimbursements are settled on a monthly basis. Common overhead expenses included in the expenses paid by Indemnity are allocated based upon appropriate utilization statistics (employee count, square footage, vehicle count, project hours, etc.) specifically measured to accomplish proportional allocations. Executive compensation is allocated based upon each executive’s primary responsibilities (management services, property and casualty claims operations, EFL operations and investment operations). We believe the methods used to allocate common overhead expenses among the affiliated entities are reasonable.

ERIE INDEMNITY COMPANY NOTES TO CONSOLIDATED FINANCIAL STATEMENTS
122
Office leases Indemnity leases certain office space from the Exchange, including the home office and three field office facilities. Rent expenses under these leases totaled $6 million in 2011, 2010 and 2009. Indemnity also has a lease commitment with EFL for a branch office until 2018. Annual rentals paid to EFL under this lease totaled $0.4 million in 2011 and 2010 and $0.3 million in 2009. Direct method of cash flows Indemnity’s components of direct cash flows as included in the Consolidated Statements of Cash Flows are as follows for the years ended December 31:
(in millions) Indemnity Shareholder Interest
Direct method of cash flows
2011 2010 2009
Management fee received $1,053 $ 947 $ 912 Service agreement fee received 33 34 35 Premiums collected (1) U 220 214 Net investment income received (1) 22 45 45 Limited partnership distributions 22 21 13 (Decrease) increase in reimbursements collected from affiliates (9) (15) 3 Commissions and bonuses paid to agents (583) (532) (535) Salaries and wages paid (124) (106) (110) Pension contribution and employee benefits paid (36) (33) (32) Losses paid (1) U (132) (123) Loss expenses paid (1) U (23) (22) Other underwriting and acquisition costs paid (1) U (53) (54) General operating expenses paid (127) (119) (104) Income taxes paid (82) (61) (62)
Net cash provided by operating activities 169 193 180 Net cash (used in) provided by investing activities (211) 196 (69) Net cash used in financing activities (257) (155) (96)
Net (decrease) increase in cash and cash equivalents (299) 234 15 Cash and cash equivalents at beginning of year 310 76 61
Cash and cash equivalents at end of year $ 11 $ 310 $ 76
(1) Prior to and through December 31, 2010, the underwriting results retained by EIC and ENY and the investment results of EIC, ENY
and EPC accrued to the Indemnity shareholder interest. Due to the sale of Indemnity’s property and casualty insurance subsidiaries to the Exchange on December 31, 2010, all property and casualty underwriting results and all investment results for these companies
accrue to the interest of the subscribers (policyholders) of the Exchange, or noncontrolling interest, after December 31, 2010.

ERIE INDEMNITY COMPANY NOTES TO CONSOLIDATED FINANCIAL STATEMENTS
123
Note 24. Quarterly Results of Operations (unaudited)
Erie Insurance Group
Year ended December 31, 2011
(in millions, except per share data)
First quarter
Second quarter
Third quarter
Fourth quarter Year
Revenues $ 1,365 $ 1,245 $ 796 $1,418 $4,824 Benefits and expenses 953 1,419 1,101 993 4,466
Income (loss) from operations before income taxes and noncontrolling interest 412 (174) (305) 425 358
Net income (loss) 274 (107) (180) 281 268 Less: Net income (loss) attributable to noncontrolling
interest in consolidated entity � Exchange 230 (159) (227) 255 99
Net income attributable to Indemnity $ 44 $ 52 $ 47 $ 26 $ 169
Earnings per share (1)
Net income attributable to Indemnity per share Class A common stock � basic $ 0.88 $ 1.05 $ 0.97 $ 0.55 $ 3.45
Class A common stock � diluted $ 0.78 $ 0.94 $ 0.87 $ 0.49 $ 3.08
Class B common stock � basic and diluted $126.48 $158.33 $146.67 $81.76 $522.47
(1) The cumulative sum of quarterly basic and diluted net income per share amounts may not equal total basic and diluted net income per share for the year due to differences in weighted average shares and equivalent shares outstanding for each of the periods presented.
Erie Insurance Group
Year ended December 31, 2010
(in millions, except per share data)
First quarter
Second quarter
Third quarter
Fourth quarter Year
Revenues $ 1,216 $ 916 $ 1,357 $1,401 $ 4,890 Benefits and expenses 988 967 952 984 3,891
Income (loss) from operations before income taxes and noncontrolling interest 228 (51) 405 417 999
Net income (loss) 162 (31) 275 254 660 Less: Net income (loss) attributable to noncontrolling
interest in consolidated entity � Exchange 115 (80) 221 242 498
Net income attributable to Indemnity $ 47 $ 49 $ 54 $ 12 $ 162
Earnings per share (1)
Net income attributable to Indemnity per share
Class A common stock � basic $ 0.92 $ 0.96 $ 1.05 $ 0.25 $ 3.18
Class A common stock � diluted $ 0.82 $ 0.86 $ 0.94 $ 0.22 $ 2.85
Class B common stock � basic and diluted $132.83 $138.21 $150.87 $40.93 $462.83
(1) The cumulative sum of quarterly basic and diluted net income per share amounts may not equal total basic and diluted net income per share for the year due to differences in weighted average shares and equivalent shares outstanding for each of the periods presented.
Note 25. Subsequent Events We have evaluated for recognized and nonrecognized subsequent events through the date of financial statement issuance. No items were identified in this period subsequent to the financial statement date that required adjustment or disclosure.

124
Report of Independent Registered Public Accounting Firm
The Board of Directors and Shareholders of Erie Indemnity Company Erie, Pennsylvania We have audited Erie Indemnity Company’s internal control over financial reporting as of December 31, 2011, based on criteria established in Internal Control—Integrated Framework issued by the Committee of Sponsoring Organizations of the Treadway Commission (the COSO criteria). Erie Indemnity Company’s management is responsible for maintaining effective internal control over financial reporting, and for its assessment of the effectiveness of internal control over financial reporting included in the accompanying Management’s Report on Internal Control over Financial Reporting. Our responsibility is to express an opinion on the Company’s internal control over financial reporting based on our audit. We conducted our audit in accordance with the standards of the Public Company Accounting Oversight Board (United States). Those standards require that we plan and perform the audit to obtain reasonable assurance about whether effective internal control over financial reporting was maintained in all material respects. Our audit included obtaining an understanding of internal control over financial reporting, assessing the risk that a material weakness exists, testing and evaluating the design and operating effectiveness of internal control based on the assessed risk, and performing such other procedures as we considered necessary in the circumstances. We believe that our audit provides a reasonable basis for our opinion. A company’s internal control over financial reporting is a process designed to provide reasonable assurance regarding the reliability of financial reporting and the preparation of financial statements for external purposes in accordance with generally accepted accounting principles. A company’s internal control over financial reporting includes those policies and procedures that (1) pertain to the maintenance of records that, in reasonable detail, accurately and fairly reflect the transactions and dispositions of the assets of the company; (2) provide reasonable assurance that transactions are recorded as necessary to permit preparation of financial statements in accordance with generally accepted accounting principles, and that receipts and expenditures of the company are being made only in accordance with authorizations of management and directors of the company; and (3) provide reasonable assurance regarding prevention or timely detection of unauthorized acquisition, use or disposition of the company’s assets that could have a material effect on the financial statements. Because of its inherent limitations, internal control over financial reporting may not prevent or detect misstatements. Also, projections of any evaluation of effectiveness to future periods are subject to the risk that controls may become inadequate because of changes in conditions, or that the degree of compliance with the policies or procedures may deteriorate. In our opinion, Erie Indemnity Company has maintained, in all material respects, effective internal control over financial reporting as of December 31, 2011, based on the COSO criteria.
We also have audited, in accordance with the standards of the Public Company Accounting Oversight Board (United States), the consolidated statements of financial position of Erie Indemnity Company as of December 31, 2011 and 2010, and the related consolidated statements of operations, shareholders’ equity and noncontrolling interest, and cash flows for each of the three years in the period ended December 31, 2011 of Erie Indemnity Company and our report dated February 27, 2012 expressed an unqualified opinion thereon. /s/ Ernst & Young LLP Cleveland, Ohio February 27, 2012

125
ITEM 9. CHANGES IN AND DISAGREEMENTS WITH ACCOUNTANTS ON ACCOUNTING AND
FINANCIAL DISCLOSURE
None.
ITEM 9A. CONTROLS AND PROCEDURES
Evaluation of Disclosure Controls and Procedures We maintain disclosure controls and procedures designed to ensure that information required to be disclosed in our reports filed under the Securities Exchange Act of 1934, as amended, is recorded, processed, summarized and reported within the time periods specified in the Securities and Exchange Commission rules and forms, and that such information is accumulated and communicated to management, including our Chief Executive Officer and Chief Financial Officer, as appropriate, to allow for timely decisions regarding required disclosures. As required by the Securities and Exchange Commission Rule 13a-15(e), we carried out an evaluation, under the supervision and with the participation of management, including our Chief Executive Officer and Chief Financial Officer, of the effectiveness of the design and operation of our disclosure controls and procedures as of December 31, 2011. Based upon the foregoing, our Chief Executive Officer and Chief Financial Officer concluded that our disclosure controls and procedures were effective. Changes in Internal Control over Financial Reporting There has been no change in our internal controls over financial reporting during our most recent fiscal quarter that has materially affected, or is reasonably likely to materially affect our internal controls over financial reporting. Our process for evaluating controls and procedures is continuous and encompasses constant improvement of the design and effectiveness of established controls and procedures. Management’s Report on Internal Control over Financial Reporting Management is responsible for establishing and maintaining adequate internal control over financial reporting of Erie Indemnity Company, as such term is defined in the Exchange Act Rules 13a-15(f). Under the supervision and with the participation of our management, including our Chief Executive Officer and Chief Financial Officer, we conducted an evaluation of the effectiveness of the Erie Indemnity Company’s internal control over financial reporting based upon the framework in Internal Control-Integrated Framework issued by the Committee of Sponsoring Organizations of the Treadway Commission. Based upon our evaluation under the framework in Internal Control-Integrated Framework, management has concluded that Erie Indemnity Company’s internal control over financial reporting was effective as of December 31, 2011. /s/ Terrence W. Cavanaugh /s/ Marcia A. Dall /s/ Gregory J. Gutting Terrence W. Cavanaugh Marcia A. Dall Gregory J. Gutting President and Executive Vice President and Senior Vice President and Chief Executive Officer Chief Financial Officer Controller February 27, 2012 February 27, 2012 February 27, 2012 Our independent auditors have issued an attestation report on management’s assessment of our internal control over financial reporting. This report appears on page 124.
ITEM 9B. OTHER INFORMATION
There was no additional information in the fourth quarter of 2011 that has not already been filed in a Form 8-K.

126
PART III
ITEM 10. DIRECTORS, EXECUTIVE OFFICERS AND CORPORATE GOVERNANCE
The information with respect to our outside directors, audit committee, and audit committee financial experts and Section 16(a) beneficial ownership reporting compliance, is incorporated by reference to the information statement on Form 14(C) to be filed with the Securities and Exchange Commission no later than 120 days after December 31, 2011. We have adopted a code of conduct that applies to all of our outside directors, officers (including our chief executive officer, chief financial officer, chief accounting officer and any person performing similar functions) and employees. We previously filed a copy of this Code of Conduct as Exhibit 14 to the Registrant’s 2003 Form 10-K Annual Report as filed with the SEC on March 8, 2004. We have also made the Code of Conduct available on our website at http://www.erieinsurance.com.
Executive Officers of the Registrant
Age as of Principal Occupation for Past Five Years Name 12/31/11 and Positions with Erie Insurance Group President & Chief Executive Officer: Terrence W. Cavanaugh 58 President and Chief Executive Officer of Erie Indemnity
Company since July 29, 2008; Senior Vice President, Chubb & Son/Federal Insurance, for more than five years prior thereto; Chief Operating Officer, Chubb Surety, for more than five years prior thereto; Director, Erie Indemnity Company, EFL, EIC, Flagship, ENY and EPC.
Executive Vice Presidents: Marcia A. Dall 48 Executive Vice President and Chief Financial Officer since
March 30, 2009; Chief Financial Officer – Healthcare, Cigna Corporation, January 2008 through March 2009; Chief Financial Officer – International & U.S. Mortgage Insurance, Genworth Financial, September 2006 through January 2008; Chief Financial Officer – International & U.S. Mortgage Insurance, GE Mortgage Insurance, August 2002 through September 2006; General Electric, various positions for more than five years prior thereto; Director, EFL, EIC, Flagship, ENY and EPC.
George D. Dufala 40 Executive Vice President – Services since September 1, 2010;
Senior Vice President, Erie Family Life Insurance Company, October 2008 through August 2010; Senior Vice President, Customer Service, January 2005 through September 2008.
John F. Kearns 52 Executive Vice President – Sales & Marketing since September
1, 2010; Senior Vice President, Commercial Lines Division, February 2007 through August 2010; Sabbatical, February 2005 through January 2007; President – Financial & Professional Services, St. Paul Travelers, November 2000 through January 2005.
James J. Tanous 64 Executive Vice President, Secretary and General Counsel since
April 30, 2007; Partner and Chairman of Jaeckle Fleischmann & Mugel, LLP (law firm headquartered in Buffalo, NY) for more than five years prior thereto; Director, EFL, EIC, Flagship, ENY and EPC.

127
Age as of Principal Occupation for Past Five Years Name 12/31/11 and Positions with Erie Insurance Group Executive Vice Presidents (continued): Michael S. Zavasky 59 Executive Vice President–Insurance Operations since March 7,
2008; Senior Vice President–Strategy Management, January 2006 through March 2008; Senior Vice President–Commercial Lines Underwriting, June 2001 through January 2006; Director, EFL, EIC, Flagship, ENY and EPC.
Senior Vice President: Douglas F. Ziegler 61 Senior Vice President, Treasurer and Chief Investment Officer,
since 1993; Director, EFL, EIC, Flagship, ENY, and EPC. As discussed in our 8-K filing with the Securities and Exchange Commission on October 4, 2011, Douglas F. Ziegler has retired effective December 31, 2011.
ITEM 11. EXECUTIVE COMPENSATION
The information required by this item with respect to executive compensation is incorporated by reference to the information statement on Form 14(C) to be filed with the Securities and Exchange Commission no later than 120 days after December 31, 2011.
ITEM 12. SECURITY OWNERSHIP OF CERTAIN BENEFICIAL OWNERS AND MANAGEMENT
AND RELATED STOCKHOLDER MATTERS
The information with respect to security ownership of certain beneficial owners and management and securities authorized for issuance under equity compensation plans, is incorporated by reference to the information statement on Form 14(C) to be filed with the Securities and Exchange Commission no later than 120 days after December 31, 2011.
ITEM 13. CERTAIN RELATIONSHIPS AND RELATED TRANSACTIONS, AND DIRECTOR
INDEPENDENCE
Information with respect to certain relationships with our outside directors is incorporated by reference to the information statement on Form 14(C) to be filed with the Securities and Exchange Commission no later than 120 days after December 31, 2011.
ITEM 14. PRINCIPAL ACCOUNTANT FEES AND SERVICES
The information required by this item is incorporated by reference to the information statement on Form 14(C) to be filed with the Securities and Exchange Commission no later than 120 days after December 31, 2011.
128
PART IV
ITEM 15. EXHIBITS AND FINANCIAL STATEMENT SCHEDULES (a) The following documents are filed as part of this report:
1. Consolidated Financial Statements Included in Item 8 “Financial Statements and Supplementary Data” contained in this report. Erie Indemnity Company:
• Report of Independent Registered Public Accounting Firm on the Effectiveness of Internal Control over Financial Reporting
• Report of Independent Registered Public Accounting Firm on the Consolidated Financial Statements
• Consolidated Statements of Operations for the three years ended December 31, 2011, 2010 and 2009
• Consolidated Statements of Financial Position as of December 31, 2011 and 2010
• Consolidated Statements of Shareholders' Equity and Noncontrolling Interest for the three years ended December 31, 2011, 2010 and 2009
• Consolidated Statements of Cash Flows for the three years ended December 31, 2011, 2010 and 2009
• Notes to Consolidated Financial Statements
2. Financial Statement Schedules Page
Erie Indemnity Company: Schedule I. Summary of Investments – Other than Investments in Related Parties…. 130
Schedule III. Supplementary Insurance Information ............................................................ 131
Schedule IV. Reinsurance ..................................................................................................... 132
Schedule VI. Supplemental Information Concerning Property-Casualty Insurance Operations ....................................................................................... 133
All other schedules have been omitted since they are not required, not applicable or the information is included in the financial statements or notes thereto.
3. Exhibit Index ………………………………………………………………………………….. 134

129
SIGNATURES Pursuant to the requirements of Section 13 or 15(d) of the Securities Exchange Act of 1934, the Registrant has duly caused this report to be signed on its behalf by the undersigned, thereunto duly authorized. February 27, 2012 ERIE INDEMNITY COMPANY (Registrant) By: /s/ Terrence W. Cavanaugh
Terrence W. Cavanaugh, President and CEO (Principal Executive Officer)
Pursuant to the requirements of the Securities Exchange Act of 1934, this report has been signed below by the following persons on behalf of the Registrant and in the capacities and on the date indicated. February 27, 2012 /s/ Terrence W. Cavanaugh
Terrence W. Cavanaugh, President and CEO (Principal Executive Officer)
/s/ Marcia A. Dall
Marcia A. Dall, Executive Vice President & CFO (Principal Financial Officer)
/s/ Gregory J. Gutting
Gregory J. Gutting, Senior Vice President & Controller (Principal Accounting Officer)
Board of Directors: /s/ J. Ralph Borneman, Jr. /s/ Lucian L. Morrison J. Ralph Borneman, Jr. Lucian L. Morrison /s/ Terrence W. Cavanaugh /s/ Thomas W. Palmer Terrence W. Cavanaugh Thomas W. Palmer /s/ Jonathan Hirt Hagen /s/ Martin P. Sheffield Jonathan Hirt Hagen Martin P. Sheffield /s/ Susan Hirt Hagen /s/ Richard L. Stover Susan Hirt Hagen Richard L. Stover /s/ Thomas B. Hagen /s/ Elizabeth A. Vorsheck Thomas B. Hagen Elizabeth A. Vorsheck /s/ C. Scott Hartz /s/ Robert C. Wilburn C. Scott Hartz Robert C. Wilburn /s/ Claude C. Lilly, III Claude C. Lilly, III

Active States
Home Office, Erie Branch Office
Field Offices
annual MEEtInG OF sHarEHOlDErsThe Annual Meeting of Shareholders will be held on April 17, 2012, at 9:30 a.m., EDT, at our Home Office in Erie, Pa.
InDEPEnDEnt rEGIstErED PuBlIC aCCOuntInG FIrMErnst & Young, LLP 1300 Huntington Building 925 Euclid Avenue Cleveland, OH 44115
OnlInE InFOrMatIOnFinancial statement filings—specifically Erie Indemnity’s information statement and the annual report—are available online at www.erieindemnityinfostatement.com. Additional financial and Shareholder information, as well as press releases, Code of Conduct and general news about the Company may be accessed at www.erieinsurance.com.
COrPOratE HEaDquartErs/ HOME OFFICE100 Erie Insurance Place Erie, PA 16530 814.870.2000
stOCk lIstInGThe Erie Indemnity Company’s Class A nonvoting common stock is traded on The NASDAQ Stock Market,SM LLC, under the symbol “ERIE.”
stOCk transFEr InFOrMatIOnAmerican Stock Transfer and Trust Company, LLC 6201 15th Avenue Brooklyn, NY 11219 800.937.5449
FIElD OFFICEsEast RegionHagerstown, Md.Silver Spring, Md.Rochester, N.Y.Charlotte, N.C.Raleigh, N.C.Allentown, Pa.Erie, Pa.Harrisburg, Pa.Johnstown, Pa.Murrysville, Pa.Philadelphia, Pa.Pittsburgh, Pa.Richmond, va.Roanoke, va.Waynesboro, va.
West RegionPeoria, Ill.Fort Wayne, Ind.Indianapolis, Ind.Canton, OhioColumbus, OhioKnoxville, Tenn.Nashville, Tenn.Parkersburg, W.va. Waukesha, Wis.
COrPOratE InFOrMatIOn FOr ErIE InDEMnItY COMPanY

GF405 3/12 © 2012 Erie Indemnity Company
Member • Erie Insurance Group
Home Office • 100 Erie Insurance Place • Erie, Pennsylvania 16530 814.870.2000 • www.erieinsurance.com • An Equal Opportunity Employer